Zip Codes with the Highest Percentage of Population Employed in Computer, Engineering & Science in Huntsville, TX
RELATED REPORTS & OPTIONS
Computer, Engineering & Science
Huntsville
Compare Zip Codes
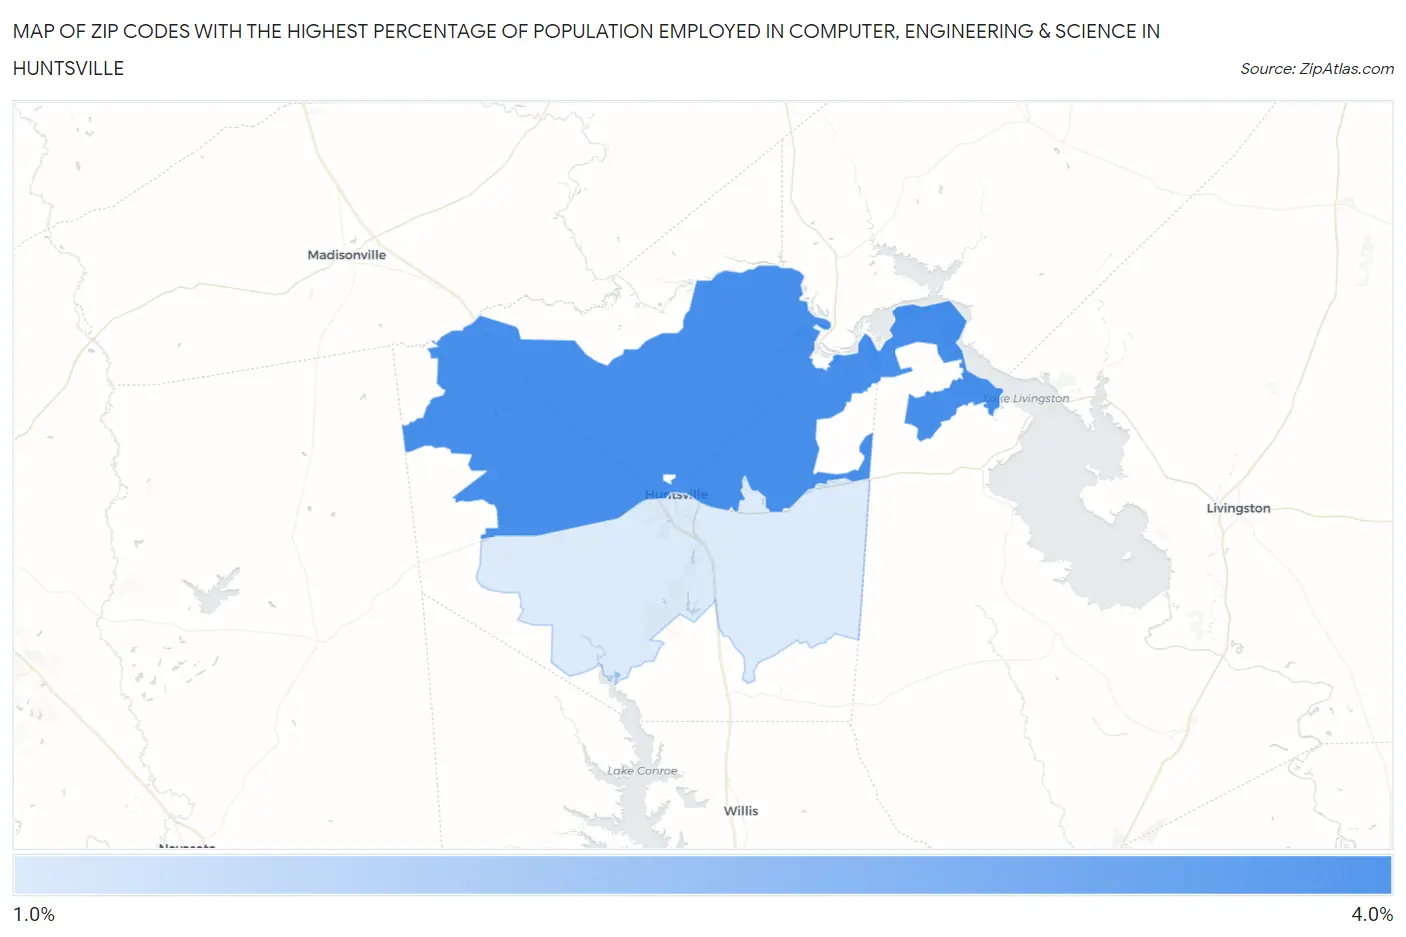
Map of Zip Codes with the Highest Percentage of Population Employed in Computer, Engineering & Science in Huntsville
1.7%
3.2%
Zip Codes with the Highest Percentage of Population Employed in Computer, Engineering & Science in Huntsville, TX
| Zip Code | % Employed | vs State | vs National | |
| 1. | 77320 | 3.2% | 6.5%(-3.29)#889 | 6.8%(-3.55)#17,334 |
| 2. | 77340 | 1.7% | 6.5%(-4.76)#1,245 | 6.8%(-5.03)#22,795 |
1
Common Questions
What are the Top Zip Codes with the Highest Percentage of Population Employed in Computer, Engineering & Science in Huntsville, TX?
Top Zip Codes with the Highest Percentage of Population Employed in Computer, Engineering & Science in Huntsville, TX are:
What zip code has the Highest Percentage of Population Employed in Computer, Engineering & Science in Huntsville, TX?
77320 has the Highest Percentage of Population Employed in Computer, Engineering & Science in Huntsville, TX with 3.2%.
What is the Percentage of Population Employed in Computer, Engineering & Science in Huntsville, TX?
Percentage of Population Employed in Computer, Engineering & Science in Huntsville is 1.8%.
What is the Percentage of Population Employed in Computer, Engineering & Science in Texas?
Percentage of Population Employed in Computer, Engineering & Science in Texas is 6.5%.
What is the Percentage of Population Employed in Computer, Engineering & Science in the United States?
Percentage of Population Employed in Computer, Engineering & Science in the United States is 6.8%.