Wells Branch, TX Map & Demographics
Wells Branch Map
Wells Branch Overview
$42,335
PER CAPITA INCOME
$82,471
AVG FAMILY INCOME
$59,992
AVG HOUSEHOLD INCOME
10.5%
WAGE / INCOME GAP [ % ]
89.5¢/ $1
WAGE / INCOME GAP [ $ ]
$8,371
FAMILY INCOME DEFICIT
0.45
INEQUALITY / GINI INDEX
13,941
TOTAL POPULATION
7,362
MALE POPULATION
6,579
FEMALE POPULATION
111.90
MALES / 100 FEMALES
89.36
FEMALES / 100 MALES
34.9
MEDIAN AGE
2.7
AVG FAMILY SIZE
2.0
AVG HOUSEHOLD SIZE
8,749
LABOR FORCE [ PEOPLE ]
76.2%
PERCENT IN LABOR FORCE
1.2%
UNEMPLOYMENT RATE
Income in Wells Branch
Income Overview in Wells Branch
Per Capita Income in Wells Branch is $42,335, while median incomes of families and households are $82,471 and $59,992 respectively.
| Characteristic | Number | Measure |
| Per Capita Income | 13,941 | $42,335 |
| Median Family Income | 3,429 | $82,471 |
| Mean Family Income | 3,429 | $105,811 |
| Median Household Income | 6,989 | $59,992 |
| Mean Household Income | 6,989 | $83,666 |
| Income Deficit | 3,429 | $8,371 |
| Wage / Income Gap (%) | 13,941 | 10.53% |
| Wage / Income Gap ($) | 13,941 | 89.47¢ per $1 |
| Gini / Inequality Index | 13,941 | 0.45 |
Earnings by Sex in Wells Branch
Average Earnings in Wells Branch are $46,067, $47,886 for men and $42,842 for women, a difference of 10.5%.
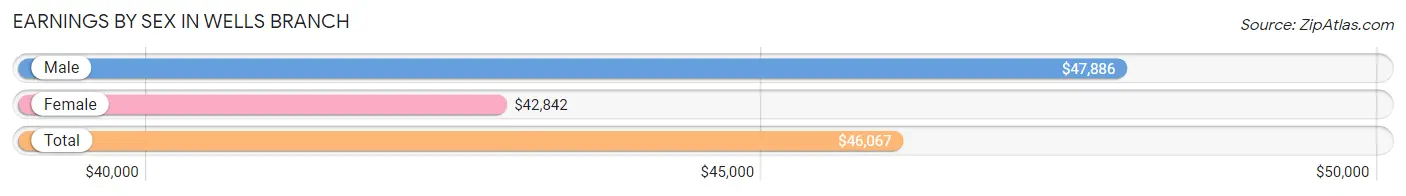
| Sex | Number | Average Earnings |
| Male | 5,319 (58.6%) | $47,886 |
| Female | 3,759 (41.4%) | $42,842 |
| Total | 9,078 (100.0%) | $46,067 |
Earnings by Sex by Income Bracket in Wells Branch
The most common earnings brackets in Wells Branch are $100,000+ for men (1,017 | 19.1%) and $75,000 to $99,999 for women (373 | 9.9%).
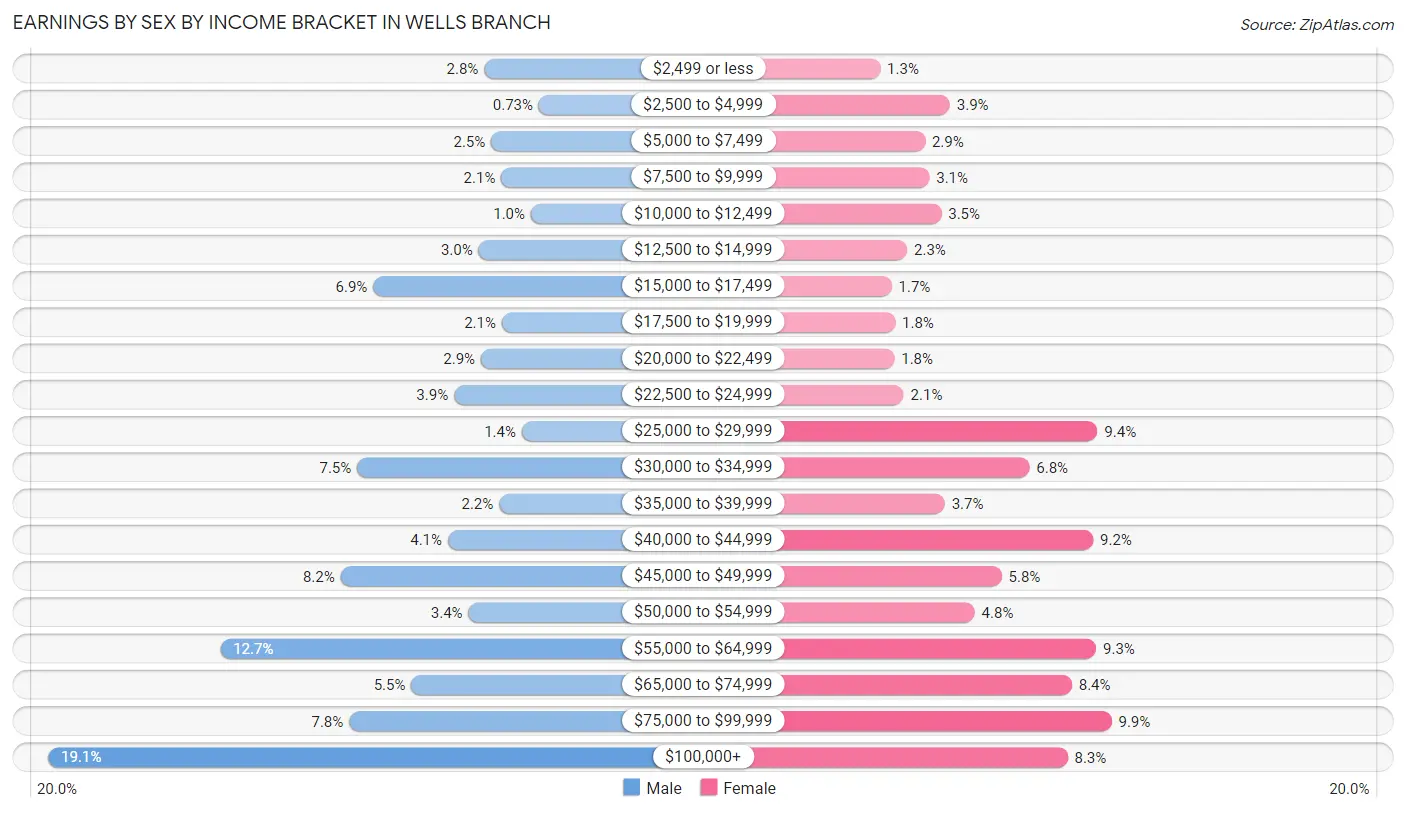
| Income | Male | Female |
| $2,499 or less | 148 (2.8%) | 47 (1.3%) |
| $2,500 to $4,999 | 39 (0.7%) | 145 (3.9%) |
| $5,000 to $7,499 | 134 (2.5%) | 110 (2.9%) |
| $7,500 to $9,999 | 114 (2.1%) | 116 (3.1%) |
| $10,000 to $12,499 | 55 (1.0%) | 133 (3.5%) |
| $12,500 to $14,999 | 159 (3.0%) | 85 (2.3%) |
| $15,000 to $17,499 | 369 (6.9%) | 63 (1.7%) |
| $17,500 to $19,999 | 113 (2.1%) | 68 (1.8%) |
| $20,000 to $22,499 | 154 (2.9%) | 67 (1.8%) |
| $22,500 to $24,999 | 208 (3.9%) | 80 (2.1%) |
| $25,000 to $29,999 | 73 (1.4%) | 353 (9.4%) |
| $30,000 to $34,999 | 401 (7.5%) | 257 (6.8%) |
| $35,000 to $39,999 | 118 (2.2%) | 138 (3.7%) |
| $40,000 to $44,999 | 220 (4.1%) | 347 (9.2%) |
| $45,000 to $49,999 | 434 (8.2%) | 218 (5.8%) |
| $50,000 to $54,999 | 179 (3.4%) | 180 (4.8%) |
| $55,000 to $64,999 | 674 (12.7%) | 351 (9.3%) |
| $65,000 to $74,999 | 293 (5.5%) | 317 (8.4%) |
| $75,000 to $99,999 | 417 (7.8%) | 373 (9.9%) |
| $100,000+ | 1,017 (19.1%) | 311 (8.3%) |
| Total | 5,319 (100.0%) | 3,759 (100.0%) |
Earnings by Sex by Educational Attainment in Wells Branch
Average earnings in Wells Branch are $52,940 for men and $46,091 for women, a difference of 12.9%. Men with an educational attainment of graduate degree enjoy the highest average annual earnings of $80,500, while those with high school diploma education earn the least with $23,597. Women with an educational attainment of graduate degree earn the most with the average annual earnings of $67,579, while those with less than high school education have the smallest earnings of $26,433.
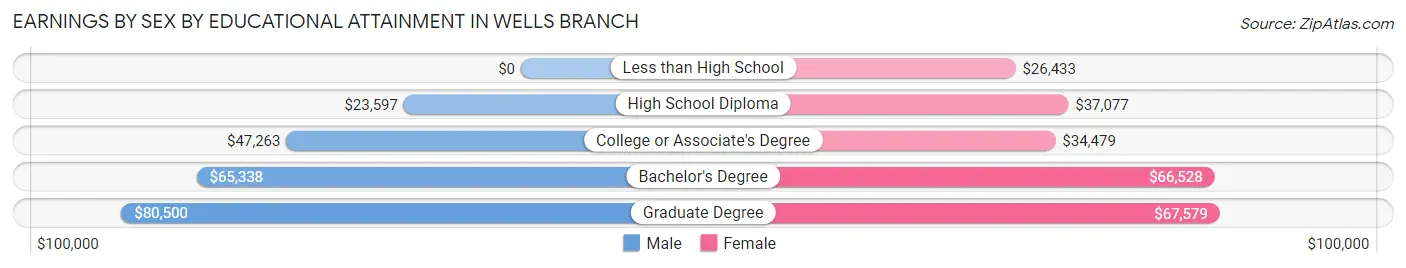
| Educational Attainment | Male Income | Female Income |
| Less than High School | - | - |
| High School Diploma | $23,597 | $37,077 |
| College or Associate's Degree | $47,263 | $34,479 |
| Bachelor's Degree | $65,338 | $66,528 |
| Graduate Degree | $80,500 | $67,579 |
| Total | $52,940 | $46,091 |
Family Income in Wells Branch
Family Income Brackets in Wells Branch
According to the Wells Branch family income data, there are 641 families falling into the $50,000 to $74,999 income range, which is the most common income bracket and makes up 18.7% of all families. Conversely, the less than $10,000 income bracket is the least frequent group with only 103 families (3.0%) belonging to this category.
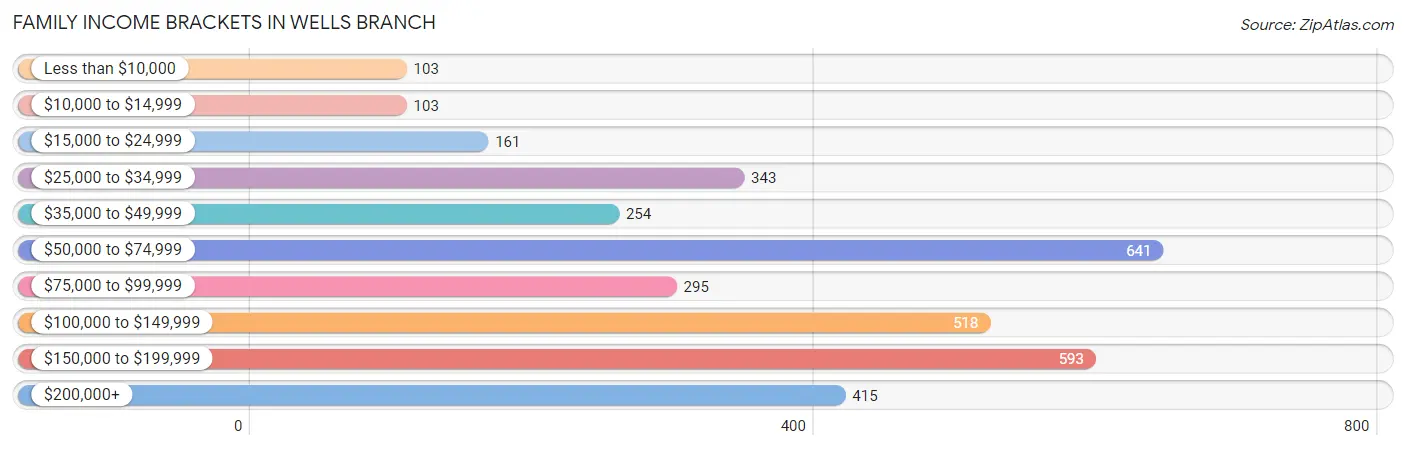
| Income Bracket | # Families | % Families |
| Less than $10,000 | 103 | 3.0% |
| $10,000 to $14,999 | 103 | 3.0% |
| $15,000 to $24,999 | 161 | 4.7% |
| $25,000 to $34,999 | 343 | 10.0% |
| $35,000 to $49,999 | 254 | 7.4% |
| $50,000 to $74,999 | 641 | 18.7% |
| $75,000 to $99,999 | 295 | 8.6% |
| $100,000 to $149,999 | 518 | 15.1% |
| $150,000 to $199,999 | 593 | 17.3% |
| $200,000+ | 415 | 12.1% |
Family Income by Famaliy Size in Wells Branch
3-person families (884 | 25.8%) account for the highest median family income in Wells Branch with $112,227 per family, while 2-person families (1,812 | 52.8%) have the highest median income of $39,688 per family member.
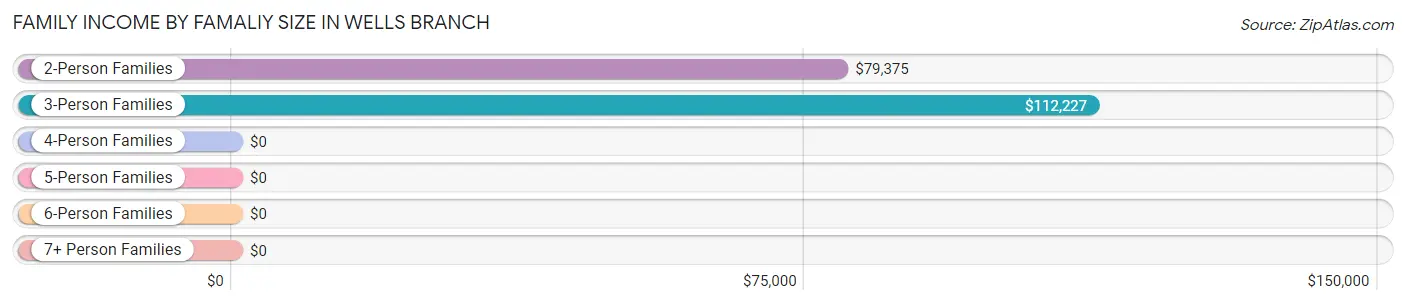
| Income Bracket | # Families | Median Income |
| 2-Person Families | 1,812 (52.8%) | $79,375 |
| 3-Person Families | 884 (25.8%) | $112,227 |
| 4-Person Families | 448 (13.1%) | $0 |
| 5-Person Families | 223 (6.5%) | $0 |
| 6-Person Families | 45 (1.3%) | $0 |
| 7+ Person Families | 17 (0.5%) | $0 |
| Total | 3,429 (100.0%) | $82,471 |
Family Income by Number of Earners in Wells Branch
The median family income in Wells Branch is $82,471, with families comprising 3+ earners (149) having the highest median family income of $230,268, while families with no earners (228) have the lowest median family income of $51,280, accounting for 4.3% and 6.7% of families, respectively.
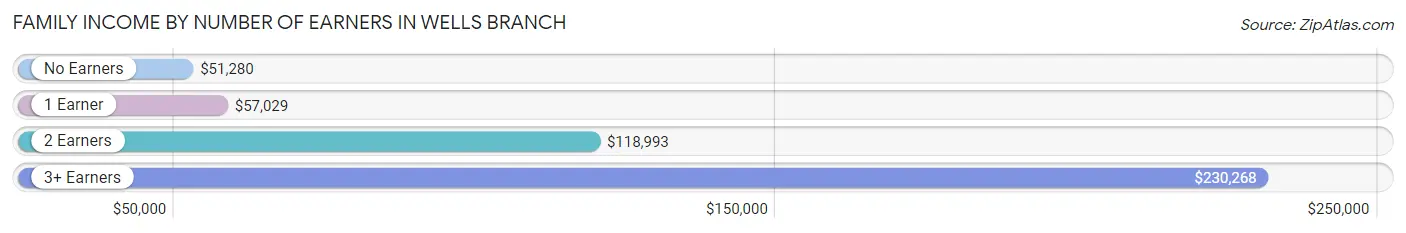
| Number of Earners | # Families | Median Income |
| No Earners | 228 (6.7%) | $51,280 |
| 1 Earner | 1,413 (41.2%) | $57,029 |
| 2 Earners | 1,639 (47.8%) | $118,993 |
| 3+ Earners | 149 (4.3%) | $230,268 |
| Total | 3,429 (100.0%) | $82,471 |
Household Income in Wells Branch
Household Income Brackets in Wells Branch
With 1,607 households falling in the category, the $50,000 to $74,999 income range is the most frequent in Wells Branch, accounting for 23.0% of all households. In contrast, only 175 households (2.5%) fall into the $10,000 to $14,999 income bracket, making it the least populous group.
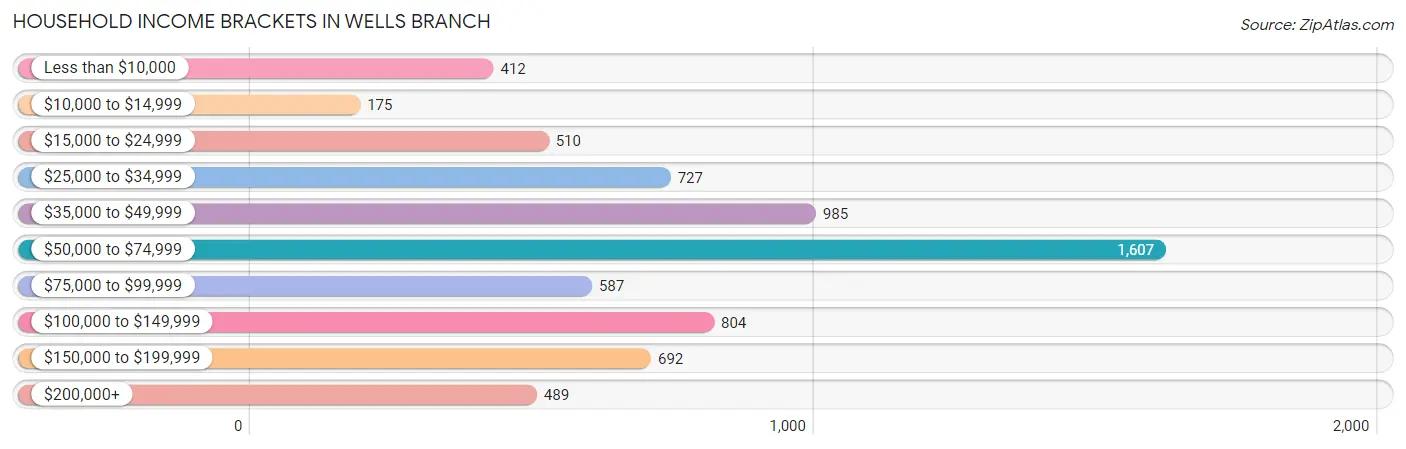
| Income Bracket | # Households | % Households |
| Less than $10,000 | 412 | 5.9% |
| $10,000 to $14,999 | 175 | 2.5% |
| $15,000 to $24,999 | 510 | 7.3% |
| $25,000 to $34,999 | 727 | 10.4% |
| $35,000 to $49,999 | 985 | 14.1% |
| $50,000 to $74,999 | 1,607 | 23.0% |
| $75,000 to $99,999 | 587 | 8.4% |
| $100,000 to $149,999 | 804 | 11.5% |
| $150,000 to $199,999 | 692 | 9.9% |
| $200,000+ | 489 | 7.0% |
Household Income by Householder Age in Wells Branch
The median household income in Wells Branch is $59,992, with the highest median household income of $67,538 found in the 25 to 44 years age bracket for the primary householder. A total of 3,844 households (55.0%) fall into this category. Meanwhile, the 15 to 24 years age bracket for the primary householder has the lowest median household income of $36,161, with 447 households (6.4%) in this group.
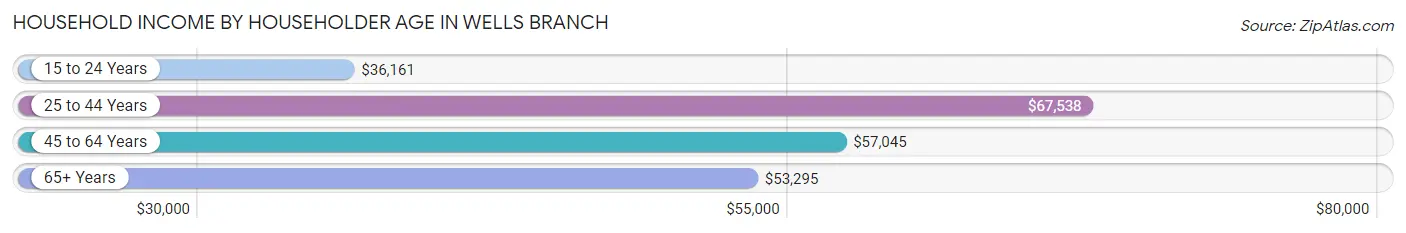
| Income Bracket | # Households | Median Income |
| 15 to 24 Years | 447 (6.4%) | $36,161 |
| 25 to 44 Years | 3,844 (55.0%) | $67,538 |
| 45 to 64 Years | 1,850 (26.5%) | $57,045 |
| 65+ Years | 848 (12.1%) | $53,295 |
| Total | 6,989 (100.0%) | $59,992 |
Poverty in Wells Branch
Income Below Poverty by Sex and Age in Wells Branch
With 19.1% poverty level for males and 17.5% for females among the residents of Wells Branch, 12 to 14 year old males and 12 to 14 year old females are the most vulnerable to poverty, with 160 males (79.2%) and 70 females (43.2%) in their respective age groups living below the poverty level.
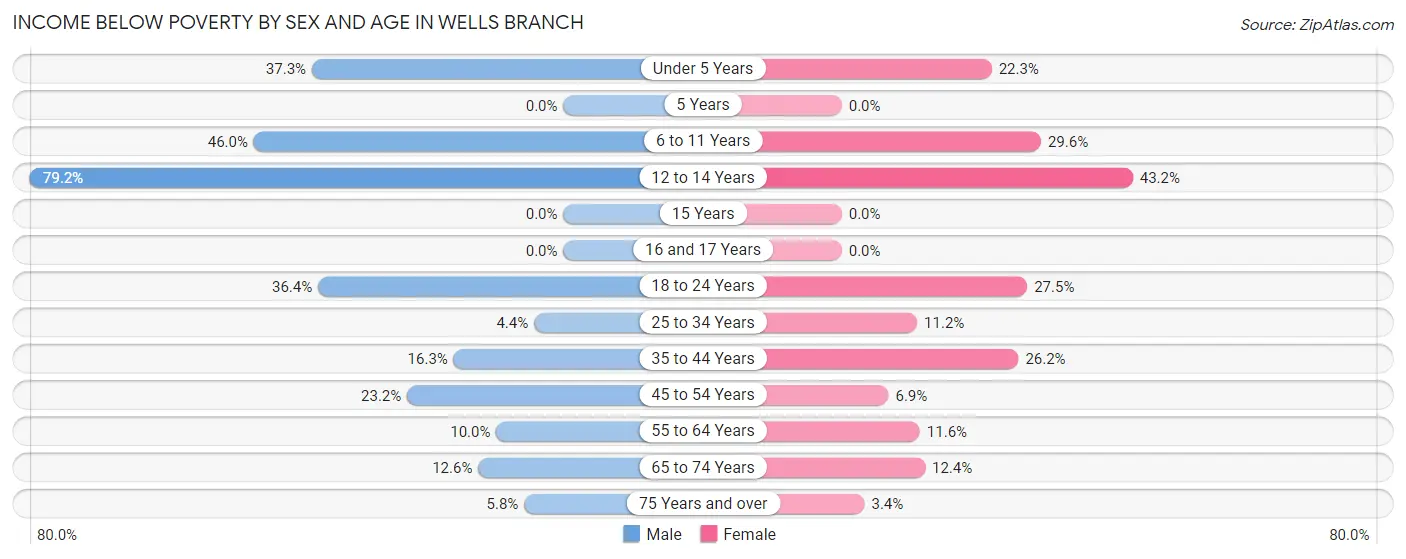
| Age Bracket | Male | Female |
| Under 5 Years | 171 (37.3%) | 148 (22.3%) |
| 5 Years | 0 (0.0%) | 0 (0.0%) |
| 6 to 11 Years | 199 (46.0%) | 92 (29.6%) |
| 12 to 14 Years | 160 (79.2%) | 70 (43.2%) |
| 15 Years | 0 (0.0%) | 0 (0.0%) |
| 16 and 17 Years | 0 (0.0%) | 0 (0.0%) |
| 18 to 24 Years | 161 (36.4%) | 184 (27.5%) |
| 25 to 34 Years | 73 (4.3%) | 184 (11.2%) |
| 35 to 44 Years | 292 (16.3%) | 310 (26.2%) |
| 45 to 54 Years | 232 (23.2%) | 53 (6.9%) |
| 55 to 64 Years | 47 (10.0%) | 50 (11.6%) |
| 65 to 74 Years | 56 (12.6%) | 56 (12.4%) |
| 75 Years and over | 11 (5.8%) | 7 (3.4%) |
| Total | 1,402 (19.1%) | 1,154 (17.5%) |
Income Above Poverty by Sex and Age in Wells Branch
According to the poverty statistics in Wells Branch, males aged 5 years and females aged 5 years are the age groups that are most secure financially, with 100.0% of males and 100.0% of females in these age groups living above the poverty line.
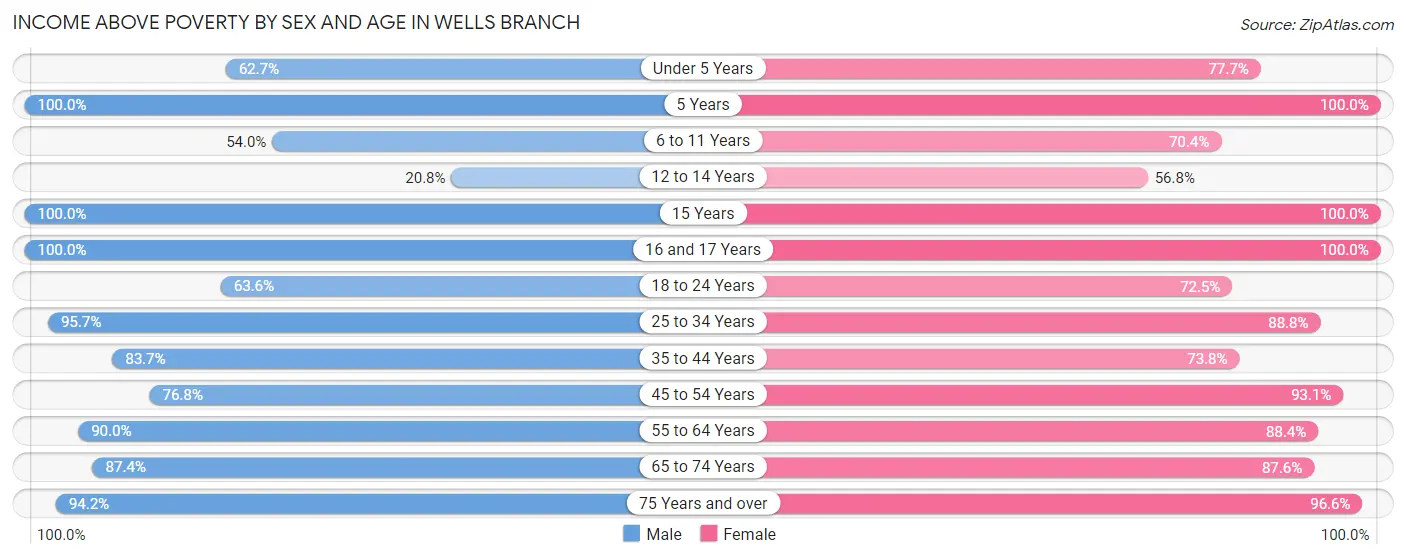
| Age Bracket | Male | Female |
| Under 5 Years | 287 (62.7%) | 517 (77.7%) |
| 5 Years | 83 (100.0%) | 49 (100.0%) |
| 6 to 11 Years | 234 (54.0%) | 219 (70.4%) |
| 12 to 14 Years | 42 (20.8%) | 92 (56.8%) |
| 15 Years | 56 (100.0%) | 16 (100.0%) |
| 16 and 17 Years | 90 (100.0%) | 27 (100.0%) |
| 18 to 24 Years | 281 (63.6%) | 484 (72.5%) |
| 25 to 34 Years | 1,604 (95.7%) | 1,460 (88.8%) |
| 35 to 44 Years | 1,500 (83.7%) | 872 (73.8%) |
| 45 to 54 Years | 768 (76.8%) | 711 (93.1%) |
| 55 to 64 Years | 425 (90.0%) | 381 (88.4%) |
| 65 to 74 Years | 387 (87.4%) | 397 (87.6%) |
| 75 Years and over | 178 (94.2%) | 200 (96.6%) |
| Total | 5,935 (80.9%) | 5,425 (82.5%) |
Income Below Poverty Among Married-Couple Families in Wells Branch
The poverty statistics for married-couple families in Wells Branch show that 12.8% or 330 of the total 2,579 families live below the poverty line. Families with 3 or 4 children have the highest poverty rate of 54.3%, comprising of 101 families. On the other hand, families with 5 or more children have the lowest poverty rate of 0.0%, which includes 0 families.
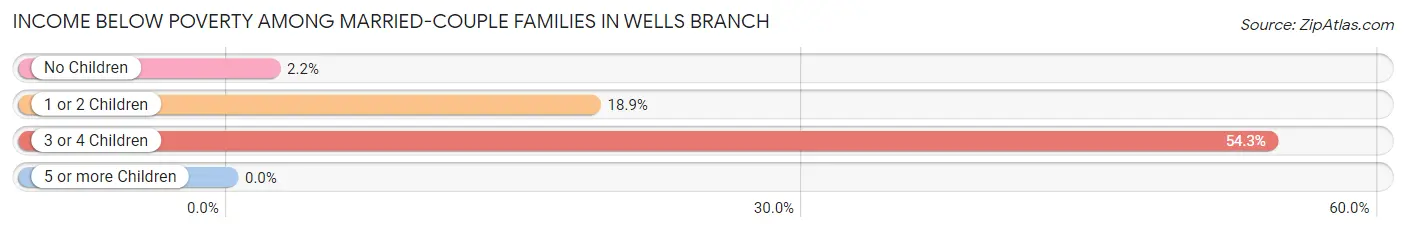
| Children | Above Poverty | Below Poverty |
| No Children | 1,291 (97.8%) | 29 (2.2%) |
| 1 or 2 Children | 856 (81.1%) | 200 (18.9%) |
| 3 or 4 Children | 85 (45.7%) | 101 (54.3%) |
| 5 or more Children | 17 (100.0%) | 0 (0.0%) |
| Total | 2,249 (87.2%) | 330 (12.8%) |
Income Below Poverty Among Single-Parent Households in Wells Branch
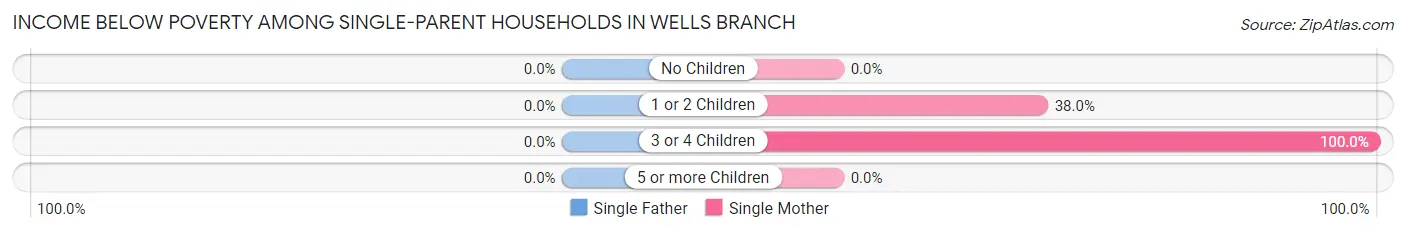
| Children | Single Father | Single Mother |
| No Children | 0 (0.0%) | 0 (0.0%) |
| 1 or 2 Children | 0 (0.0%) | 141 (38.0%) |
| 3 or 4 Children | 0 (0.0%) | 25 (100.0%) |
| 5 or more Children | 0 (0.0%) | 0 (0.0%) |
| Total | 0 (0.0%) | 166 (29.6%) |
Income Below Poverty Among Married-Couple vs Single-Parent Households in Wells Branch
The poverty data for Wells Branch shows that 330 of the married-couple family households (12.8%) and 166 of the single-parent households (19.5%) are living below the poverty level. Within the married-couple family households, those with 3 or 4 children have the highest poverty rate, with 101 households (54.3%) falling below the poverty line. Among the single-parent households, those with 3 or 4 children have the highest poverty rate, with 25 household (100.0%) living below poverty.
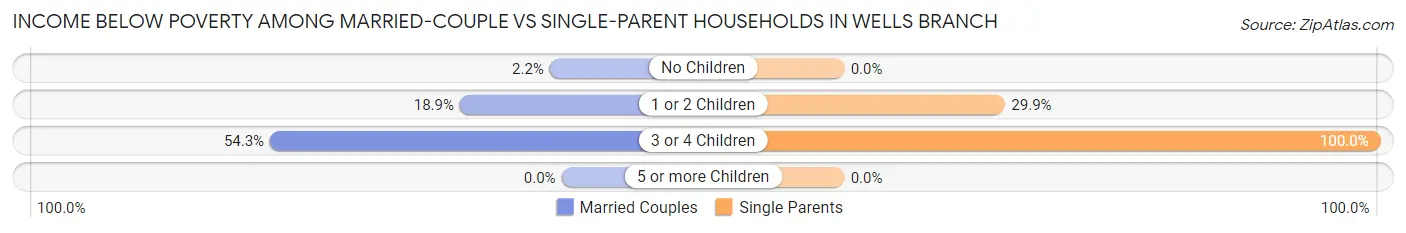
| Children | Married-Couple Families | Single-Parent Households |
| No Children | 29 (2.2%) | 0 (0.0%) |
| 1 or 2 Children | 200 (18.9%) | 141 (29.9%) |
| 3 or 4 Children | 101 (54.3%) | 25 (100.0%) |
| 5 or more Children | 0 (0.0%) | 0 (0.0%) |
| Total | 330 (12.8%) | 166 (19.5%) |
Race in Wells Branch
The most populous races in Wells Branch are White / Caucasian (7,576 | 54.3%), Hispanic or Latino (4,247 | 30.5%), and Black / African American (2,201 | 15.8%).
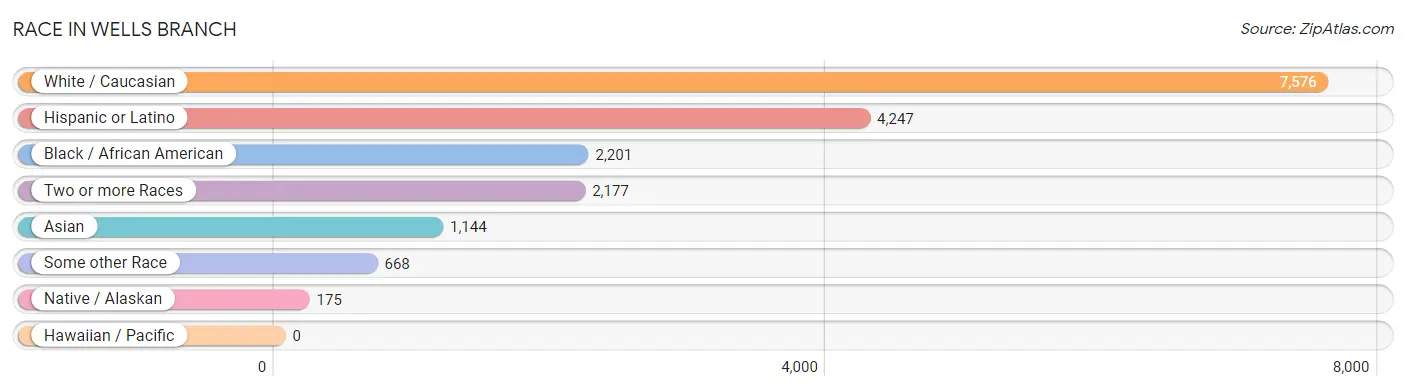
| Race | # Population | % Population |
| Asian | 1,144 | 8.2% |
| Black / African American | 2,201 | 15.8% |
| Hawaiian / Pacific | 0 | 0.0% |
| Hispanic or Latino | 4,247 | 30.5% |
| Native / Alaskan | 175 | 1.3% |
| White / Caucasian | 7,576 | 54.3% |
| Two or more Races | 2,177 | 15.6% |
| Some other Race | 668 | 4.8% |
| Total | 13,941 | 100.0% |
Ancestry in Wells Branch
The most populous ancestries reported in Wells Branch are Mexican (2,357 | 16.9%), German (1,357 | 9.7%), English (880 | 6.3%), Irish (659 | 4.7%), and Italian (574 | 4.1%), together accounting for 41.8% of all Wells Branch residents.
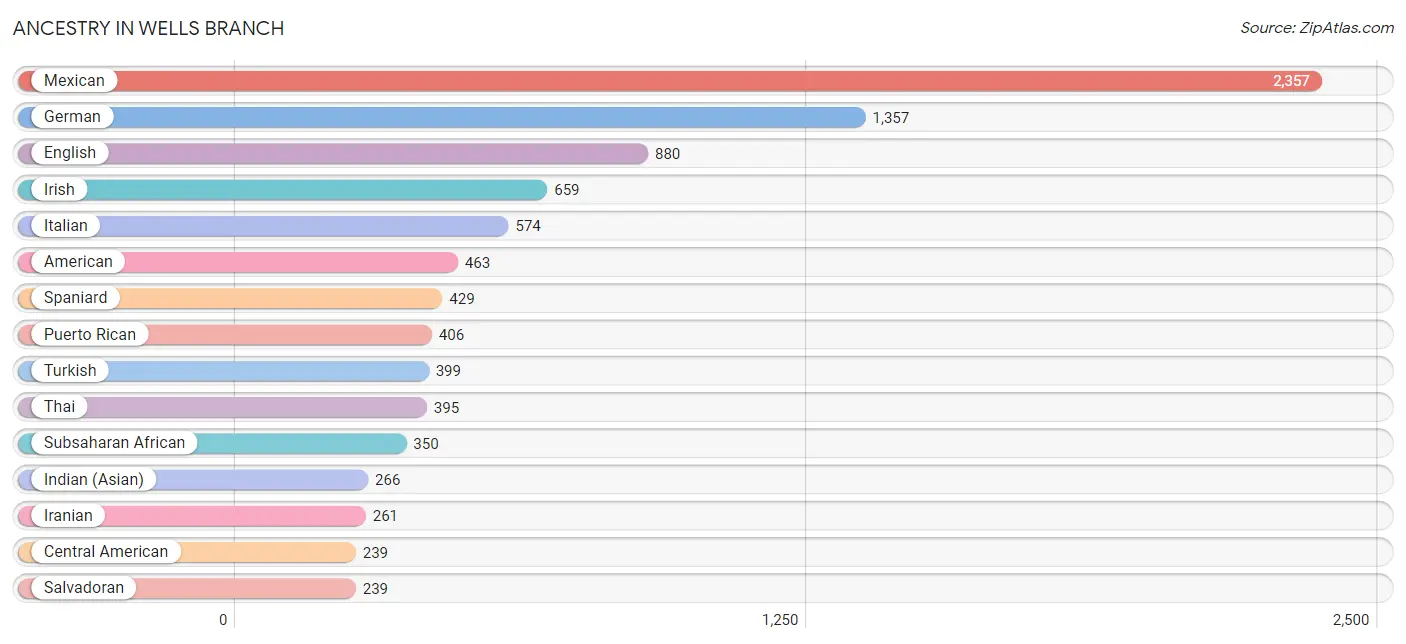
| Ancestry | # Population | % Population |
| Afghan | 93 | 0.7% |
| African | 190 | 1.4% |
| American | 463 | 3.3% |
| Apache | 77 | 0.5% |
| Arab | 178 | 1.3% |
| Armenian | 11 | 0.1% |
| Belgian | 33 | 0.2% |
| Bhutanese | 110 | 0.8% |
| Blackfeet | 7 | 0.1% |
| British | 187 | 1.3% |
| Burmese | 65 | 0.5% |
| Cajun | 27 | 0.2% |
| Canadian | 154 | 1.1% |
| Central American | 239 | 1.7% |
| Cherokee | 14 | 0.1% |
| Chickasaw | 22 | 0.2% |
| Colombian | 70 | 0.5% |
| Creek | 33 | 0.2% |
| Cuban | 36 | 0.3% |
| Czech | 75 | 0.5% |
| Dominican | 10 | 0.1% |
| Dutch | 95 | 0.7% |
| Dutch West Indian | 17 | 0.1% |
| Eastern European | 5 | 0.0% |
| English | 880 | 6.3% |
| Ethiopian | 133 | 0.9% |
| European | 154 | 1.1% |
| Filipino | 13 | 0.1% |
| Finnish | 54 | 0.4% |
| French | 180 | 1.3% |
| French Canadian | 15 | 0.1% |
| German | 1,357 | 9.7% |
| Greek | 62 | 0.4% |
| Hungarian | 9 | 0.1% |
| Indian (Asian) | 266 | 1.9% |
| Iranian | 261 | 1.9% |
| Irish | 659 | 4.7% |
| Israeli | 16 | 0.1% |
| Italian | 574 | 4.1% |
| Korean | 86 | 0.6% |
| Lebanese | 80 | 0.6% |
| Lithuanian | 15 | 0.1% |
| Macedonian | 36 | 0.3% |
| Mexican | 2,357 | 16.9% |
| Mexican American Indian | 84 | 0.6% |
| Moroccan | 52 | 0.4% |
| Navajo | 48 | 0.3% |
| Northern European | 21 | 0.2% |
| Norwegian | 49 | 0.4% |
| Polish | 179 | 1.3% |
| Portuguese | 109 | 0.8% |
| Pueblo | 40 | 0.3% |
| Puerto Rican | 406 | 2.9% |
| Romanian | 39 | 0.3% |
| Russian | 151 | 1.1% |
| Salvadoran | 239 | 1.7% |
| Scandinavian | 27 | 0.2% |
| Scotch-Irish | 81 | 0.6% |
| Scottish | 180 | 1.3% |
| Slavic | 43 | 0.3% |
| Slovene | 49 | 0.4% |
| South American | 194 | 1.4% |
| Spaniard | 429 | 3.1% |
| Spanish | 218 | 1.6% |
| Sri Lankan | 172 | 1.2% |
| Subsaharan African | 350 | 2.5% |
| Swedish | 61 | 0.4% |
| Swiss | 7 | 0.1% |
| Thai | 395 | 2.8% |
| Turkish | 399 | 2.9% |
| Venezuelan | 124 | 0.9% |
| Welsh | 128 | 0.9% | View All 72 Rows |
Immigrants in Wells Branch
The most numerous immigrant groups reported in Wells Branch came from Asia (1,428 | 10.2%), Latin America (990 | 7.1%), Central America (836 | 6.0%), South Central Asia (801 | 5.8%), and Mexico (699 | 5.0%), together accounting for 34.1% of all Wells Branch residents.
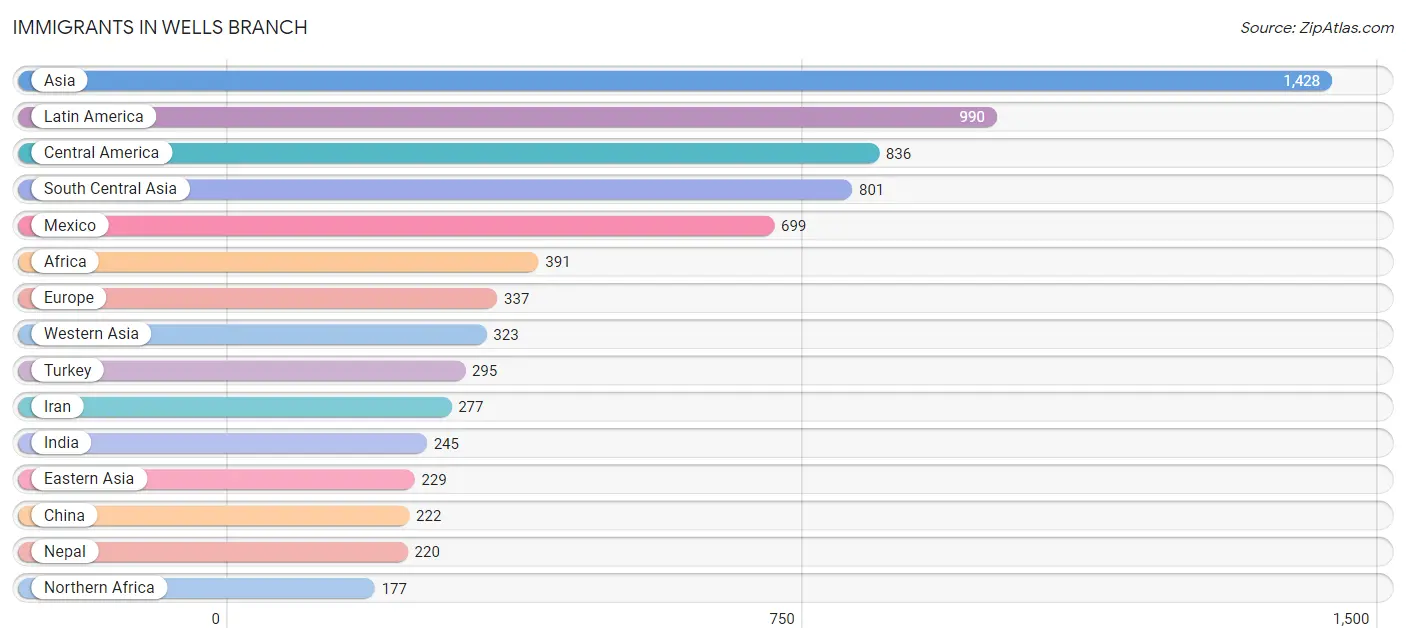
| Immigration Origin | # Population | % Population |
| Afghanistan | 59 | 0.4% |
| Africa | 391 | 2.8% |
| Albania | 104 | 0.7% |
| Asia | 1,428 | 10.2% |
| Belgium | 14 | 0.1% |
| Cameroon | 82 | 0.6% |
| Canada | 18 | 0.1% |
| Caribbean | 30 | 0.2% |
| Central America | 836 | 6.0% |
| China | 222 | 1.6% |
| Cuba | 30 | 0.2% |
| Eastern Africa | 132 | 0.9% |
| Eastern Asia | 229 | 1.6% |
| Eastern Europe | 143 | 1.0% |
| El Salvador | 137 | 1.0% |
| Eritrea | 54 | 0.4% |
| Ethiopia | 64 | 0.5% |
| Europe | 337 | 2.4% |
| Germany | 64 | 0.5% |
| India | 245 | 1.8% |
| Iran | 277 | 2.0% |
| Korea | 7 | 0.1% |
| Latin America | 990 | 7.1% |
| Lebanon | 22 | 0.2% |
| Mexico | 699 | 5.0% |
| Middle Africa | 82 | 0.6% |
| Morocco | 144 | 1.0% |
| Nepal | 220 | 1.6% |
| Northern Africa | 177 | 1.3% |
| Philippines | 10 | 0.1% |
| Portugal | 99 | 0.7% |
| Romania | 39 | 0.3% |
| South America | 124 | 0.9% |
| South Central Asia | 801 | 5.8% |
| South Eastern Asia | 75 | 0.5% |
| Southern Europe | 99 | 0.7% |
| Switzerland | 17 | 0.1% |
| Turkey | 295 | 2.1% |
| Venezuela | 124 | 0.9% |
| Vietnam | 65 | 0.5% |
| Western Asia | 323 | 2.3% |
| Western Europe | 95 | 0.7% | View All 42 Rows |
Sex and Age in Wells Branch
Sex and Age in Wells Branch
The most populous age groups in Wells Branch are 35 to 39 Years (1,156 | 15.7%) for men and 30 to 34 Years (855 | 13.0%) for women.
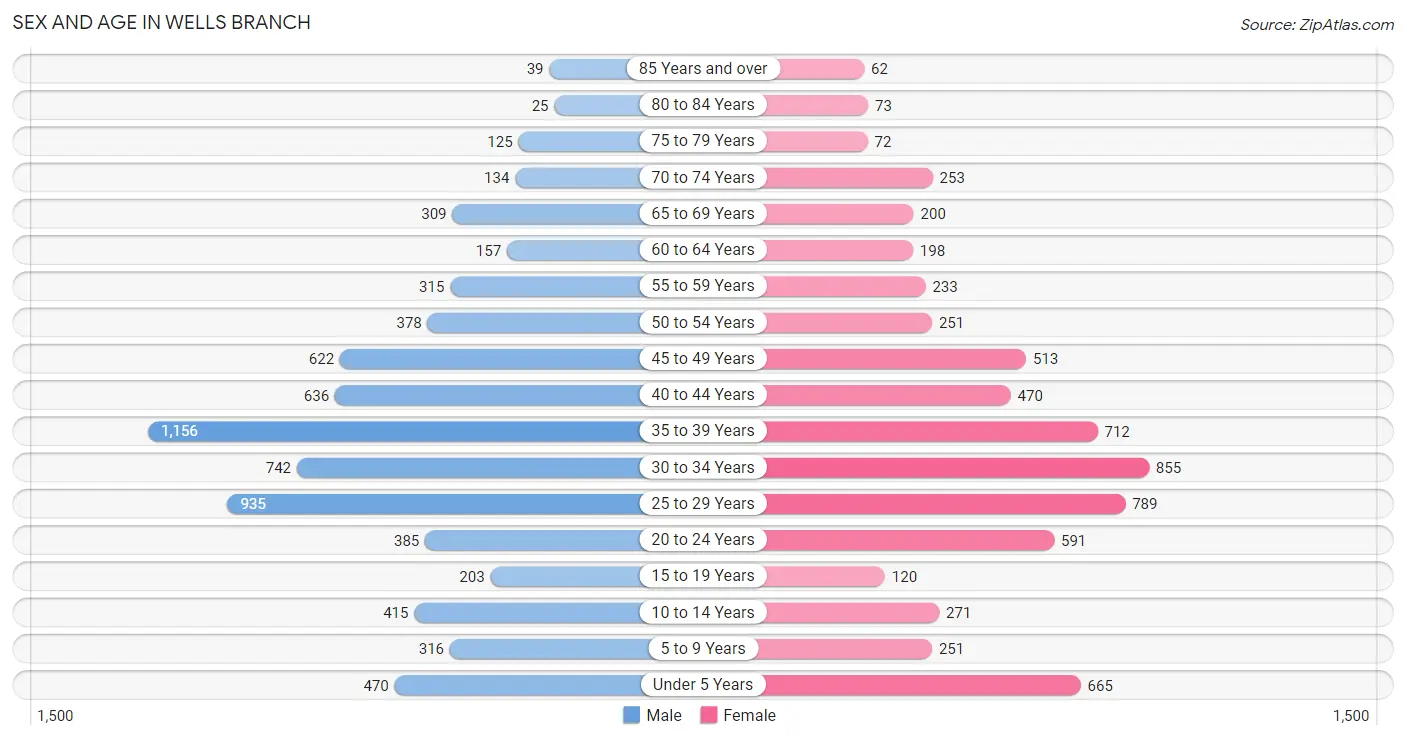
| Age Bracket | Male | Female |
| Under 5 Years | 470 (6.4%) | 665 (10.1%) |
| 5 to 9 Years | 316 (4.3%) | 251 (3.8%) |
| 10 to 14 Years | 415 (5.6%) | 271 (4.1%) |
| 15 to 19 Years | 203 (2.8%) | 120 (1.8%) |
| 20 to 24 Years | 385 (5.2%) | 591 (9.0%) |
| 25 to 29 Years | 935 (12.7%) | 789 (12.0%) |
| 30 to 34 Years | 742 (10.1%) | 855 (13.0%) |
| 35 to 39 Years | 1,156 (15.7%) | 712 (10.8%) |
| 40 to 44 Years | 636 (8.6%) | 470 (7.1%) |
| 45 to 49 Years | 622 (8.5%) | 513 (7.8%) |
| 50 to 54 Years | 378 (5.1%) | 251 (3.8%) |
| 55 to 59 Years | 315 (4.3%) | 233 (3.5%) |
| 60 to 64 Years | 157 (2.1%) | 198 (3.0%) |
| 65 to 69 Years | 309 (4.2%) | 200 (3.0%) |
| 70 to 74 Years | 134 (1.8%) | 253 (3.8%) |
| 75 to 79 Years | 125 (1.7%) | 72 (1.1%) |
| 80 to 84 Years | 25 (0.3%) | 73 (1.1%) |
| 85 Years and over | 39 (0.5%) | 62 (0.9%) |
| Total | 7,362 (100.0%) | 6,579 (100.0%) |
Families and Households in Wells Branch
Median Family Size in Wells Branch
The median family size in Wells Branch is 2.74 persons per family, with married-couple families (2,579 | 75.2%) accounting for the largest median family size of 2.82 persons per family. On the other hand, single male/father families (290 | 8.5%) represent the smallest median family size with 2.35 persons per family.
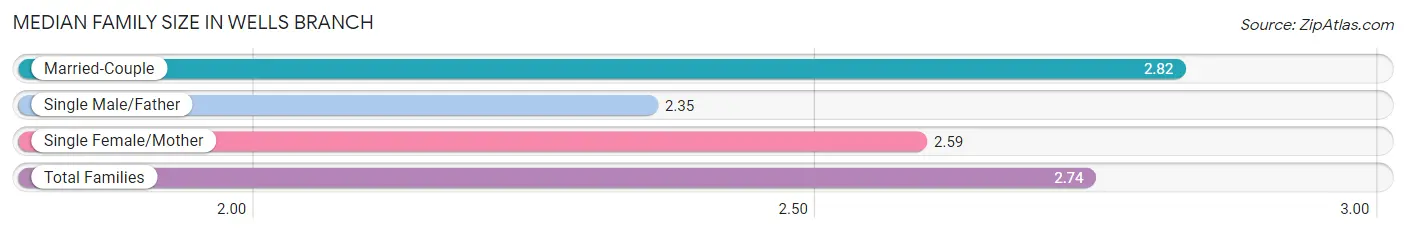
| Family Type | # Families | Family Size |
| Married-Couple | 2,579 (75.2%) | 2.82 |
| Single Male/Father | 290 (8.5%) | 2.35 |
| Single Female/Mother | 560 (16.3%) | 2.59 |
| Total Families | 3,429 (100.0%) | 2.74 |
Median Household Size in Wells Branch
The median household size in Wells Branch is 1.99 persons per household, with single female/mother households (560 | 8.0%) accounting for the largest median household size of 2.99 persons per household. non-family households (3,560 | 50.9%) represent the smallest median household size with 1.19 persons per household.
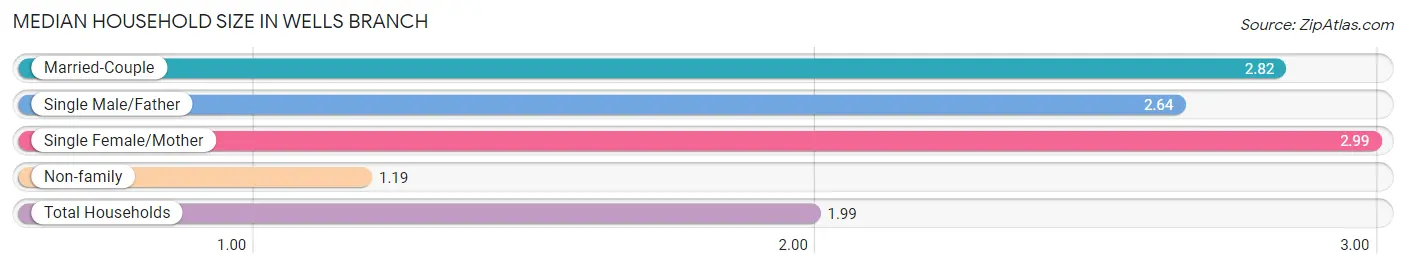
| Household Type | # Households | Household Size |
| Married-Couple | 2,579 (36.9%) | 2.82 |
| Single Male/Father | 290 (4.2%) | 2.64 |
| Single Female/Mother | 560 (8.0%) | 2.99 |
| Non-family | 3,560 (50.9%) | 1.19 |
| Total Households | 6,989 (100.0%) | 1.99 |
Household Size by Marriage Status in Wells Branch
Out of a total of 6,989 households in Wells Branch, 3,429 (49.1%) are family households, while 3,560 (50.9%) are nonfamily households. The most numerous type of family households are 2-person households, comprising 1,622, and the most common type of nonfamily households are 1-person households, comprising 3,022.
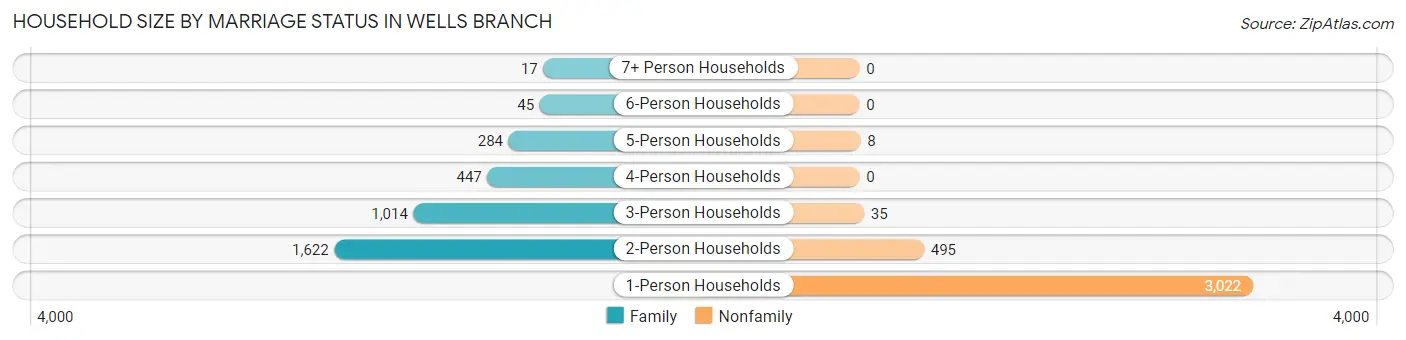
| Household Size | Family Households | Nonfamily Households |
| 1-Person Households | - | 3,022 (43.2%) |
| 2-Person Households | 1,622 (23.2%) | 495 (7.1%) |
| 3-Person Households | 1,014 (14.5%) | 35 (0.5%) |
| 4-Person Households | 447 (6.4%) | 0 (0.0%) |
| 5-Person Households | 284 (4.1%) | 8 (0.1%) |
| 6-Person Households | 45 (0.6%) | 0 (0.0%) |
| 7+ Person Households | 17 (0.2%) | 0 (0.0%) |
| Total | 3,429 (49.1%) | 3,560 (50.9%) |
Female Fertility in Wells Branch
Fertility by Age in Wells Branch
Average fertility rate in Wells Branch is 104.0 births per 1,000 women. Women in the age bracket of 20 to 34 years have the highest fertility rate with 149.0 births per 1,000 women. Women in the age bracket of 20 to 34 years acount for 78.3% of all women with births.
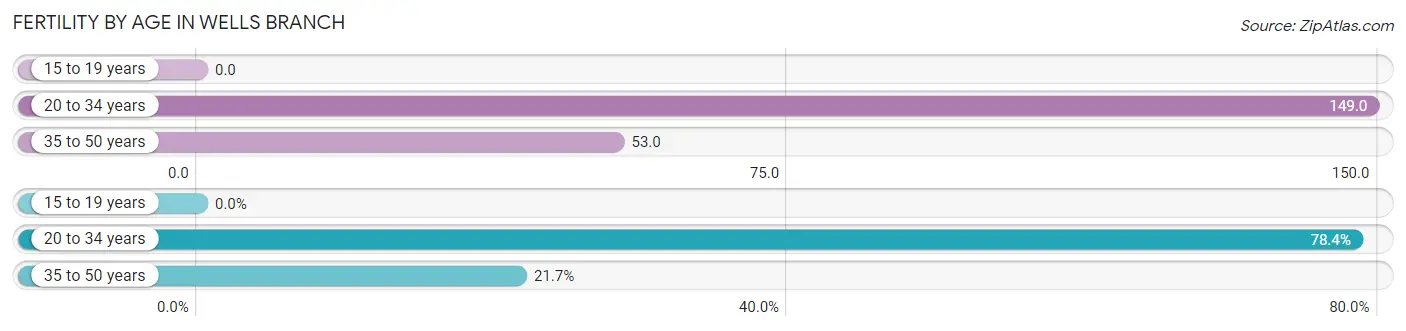
| Age Bracket | Women with Births | Births / 1,000 Women |
| 15 to 19 years | 0 (0.0%) | 0.0 |
| 20 to 34 years | 333 (78.3%) | 149.0 |
| 35 to 50 years | 92 (21.6%) | 53.0 |
| Total | 425 (100.0%) | 104.0 |
Fertility by Age by Marriage Status in Wells Branch
67.5% of women with births (425) in Wells Branch are married. The highest percentage of unmarried women with births falls into 35 to 50 years age bracket with 57.6% of them unmarried at the time of birth, while the lowest percentage of unmarried women with births belong to 20 to 34 years age bracket with 25.5% of them unmarried.
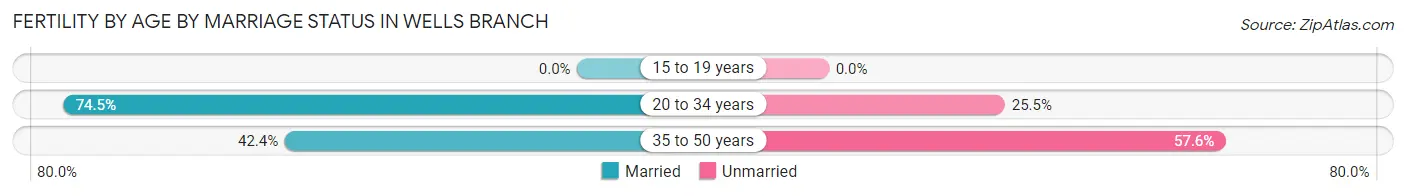
| Age Bracket | Married | Unmarried |
| 15 to 19 years | 0 (0.0%) | 0 (0.0%) |
| 20 to 34 years | 248 (74.5%) | 85 (25.5%) |
| 35 to 50 years | 39 (42.4%) | 53 (57.6%) |
| Total | 287 (67.5%) | 138 (32.5%) |
Fertility by Education in Wells Branch
Average fertility rate in Wells Branch is 104.0 births per 1,000 women. Women with the education attainment of bachelor's degree have the highest fertility rate of 151.0 births per 1,000 women, while women with the education attainment of high school diploma have the lowest fertility at 47.0 births per 1,000 women. Women with the education attainment of bachelor's degree represent 47.8% of all women with births.
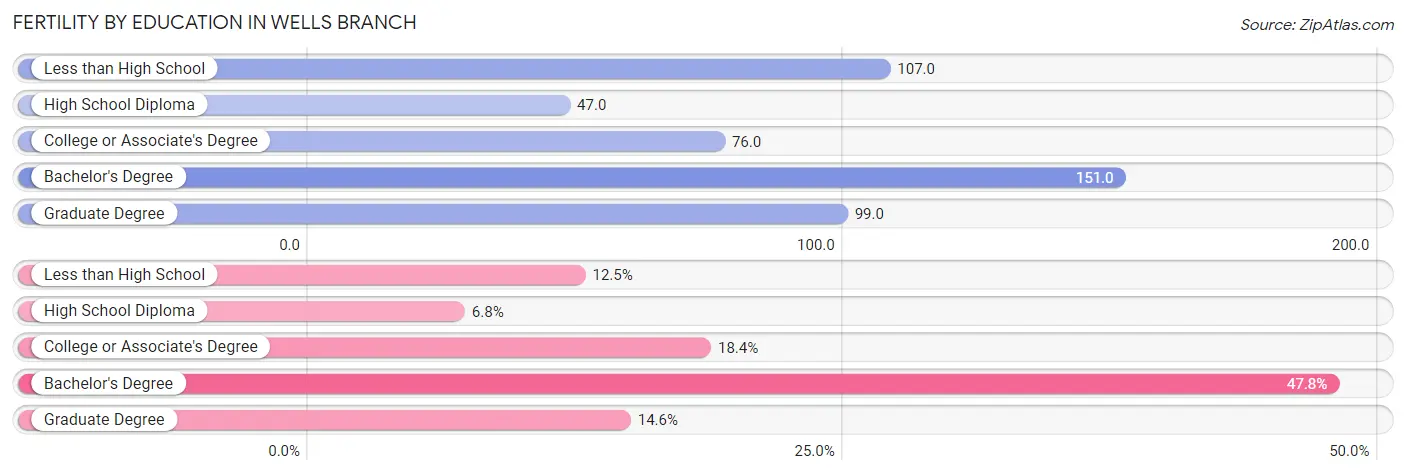
| Educational Attainment | Women with Births | Births / 1,000 Women |
| Less than High School | 53 (12.5%) | 107.0 |
| High School Diploma | 29 (6.8%) | 47.0 |
| College or Associate's Degree | 78 (18.3%) | 76.0 |
| Bachelor's Degree | 203 (47.8%) | 151.0 |
| Graduate Degree | 62 (14.6%) | 99.0 |
| Total | 425 (100.0%) | 104.0 |
Fertility by Education by Marriage Status in Wells Branch
32.5% of women with births in Wells Branch are unmarried. Women with the educational attainment of bachelor's degree are most likely to be married with 100.0% of them married at childbirth, while women with the educational attainment of less than high school are least likely to be married with 100.0% of them unmarried at childbirth.
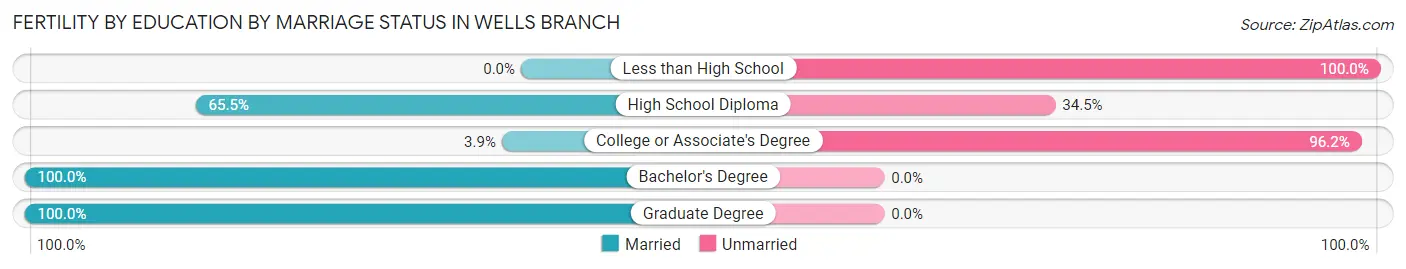
| Educational Attainment | Married | Unmarried |
| Less than High School | 0 (0.0%) | 53 (100.0%) |
| High School Diploma | 19 (65.5%) | 10 (34.5%) |
| College or Associate's Degree | 3 (3.8%) | 75 (96.2%) |
| Bachelor's Degree | 203 (100.0%) | 0 (0.0%) |
| Graduate Degree | 62 (100.0%) | 0 (0.0%) |
| Total | 287 (67.5%) | 138 (32.5%) |
Employment Characteristics in Wells Branch
Employment by Class of Employer in Wells Branch
Among the 8,439 employed individuals in Wells Branch, private company employees (6,120 | 72.5%), local government employees (649 | 7.7%), and self-employed (not incorporated) (582 | 6.9%) make up the most common classes of employment.
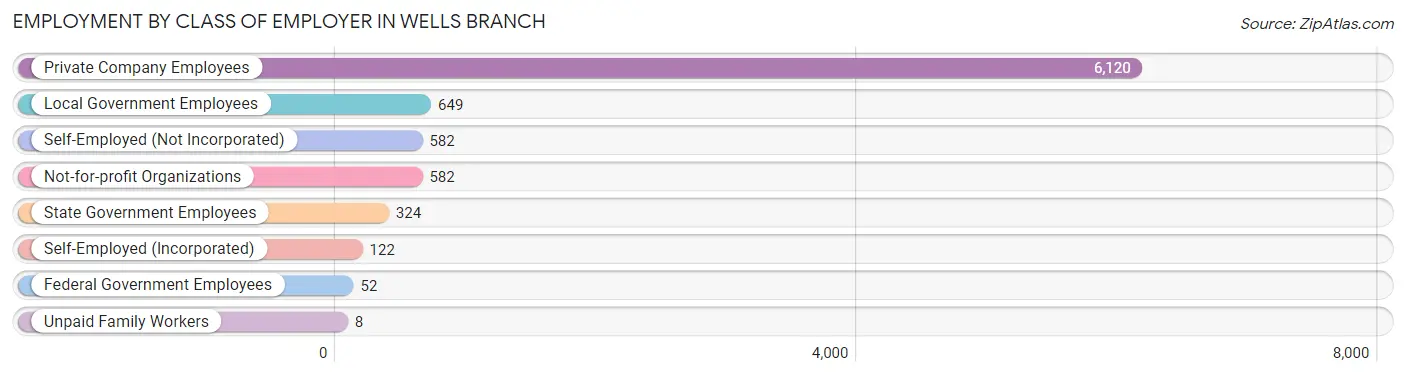
| Employer Class | # Employees | % Employees |
| Private Company Employees | 6,120 | 72.5% |
| Self-Employed (Incorporated) | 122 | 1.5% |
| Self-Employed (Not Incorporated) | 582 | 6.9% |
| Not-for-profit Organizations | 582 | 6.9% |
| Local Government Employees | 649 | 7.7% |
| State Government Employees | 324 | 3.8% |
| Federal Government Employees | 52 | 0.6% |
| Unpaid Family Workers | 8 | 0.1% |
| Total | 8,439 | 100.0% |
Employment Status by Age in Wells Branch
According to the labor force statistics for Wells Branch, out of the total population over 16 years of age (11,481), 76.2% or 8,749 individuals are in the labor force, with 1.2% or 105 of them unemployed. The age group with the highest labor force participation rate is 25 to 29 years, with 88.5% or 1,526 individuals in the labor force. Within the labor force, the 75 years and over age range has the highest percentage of unemployed individuals, with 66.7% or 28 of them being unemployed.
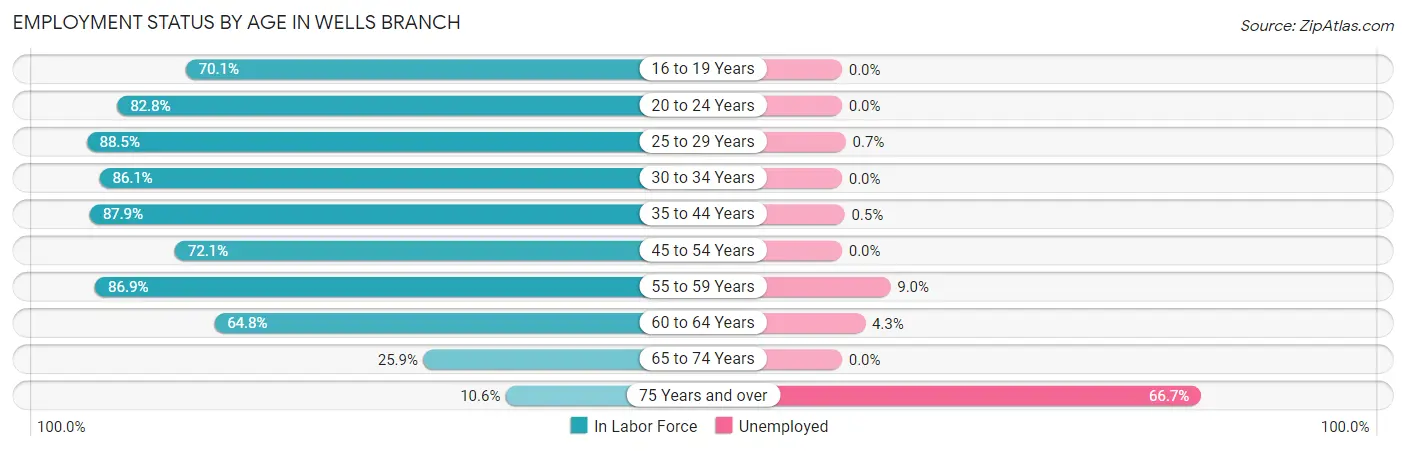
| Age Bracket | In Labor Force | Unemployed |
| 16 to 19 Years | 176 (70.1%) | 0 (0.0%) |
| 20 to 24 Years | 808 (82.8%) | 0 (0.0%) |
| 25 to 29 Years | 1,526 (88.5%) | 11 (0.7%) |
| 30 to 34 Years | 1,375 (86.1%) | 0 (0.0%) |
| 35 to 44 Years | 2,614 (87.9%) | 13 (0.5%) |
| 45 to 54 Years | 1,272 (72.1%) | 0 (0.0%) |
| 55 to 59 Years | 476 (86.9%) | 43 (9.0%) |
| 60 to 64 Years | 230 (64.8%) | 10 (4.3%) |
| 65 to 74 Years | 232 (25.9%) | 0 (0.0%) |
| 75 Years and over | 42 (10.6%) | 28 (66.7%) |
| Total | 8,749 (76.2%) | 105 (1.2%) |
Employment Status by Educational Attainment in Wells Branch
According to labor force statistics for Wells Branch, 83.6% of individuals (7,492) out of the total population between 25 and 64 years of age (8,962) are in the labor force, with 1.0% or 75 of them being unemployed. The group with the highest labor force participation rate are those with the educational attainment of bachelor's degree or higher, with 90.7% or 3,840 individuals in the labor force. Within the labor force, individuals with high school diploma education have the highest percentage of unemployment, with 1.6% or 24 of them being unemployed.
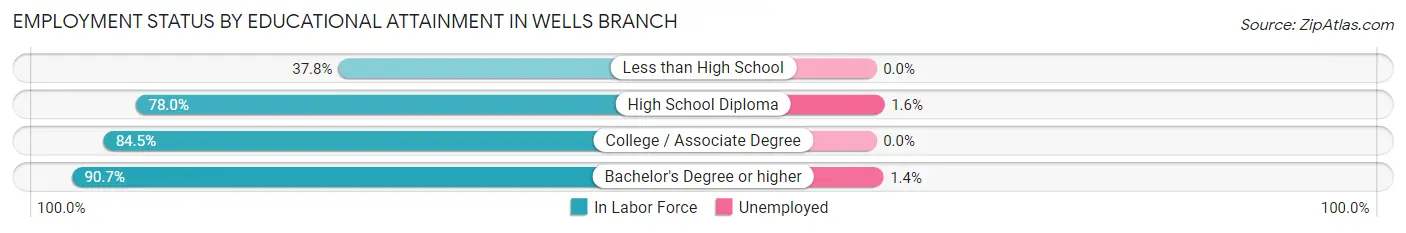
| Educational Attainment | In Labor Force | Unemployed |
| Less than High School | 174 (37.8%) | 0 (0.0%) |
| High School Diploma | 1,519 (78.0%) | 31 (1.6%) |
| College / Associate Degree | 1,961 (84.5%) | 0 (0.0%) |
| Bachelor's Degree or higher | 3,840 (90.7%) | 59 (1.4%) |
| Total | 7,492 (83.6%) | 90 (1.0%) |
Employment Occupations by Sex in Wells Branch
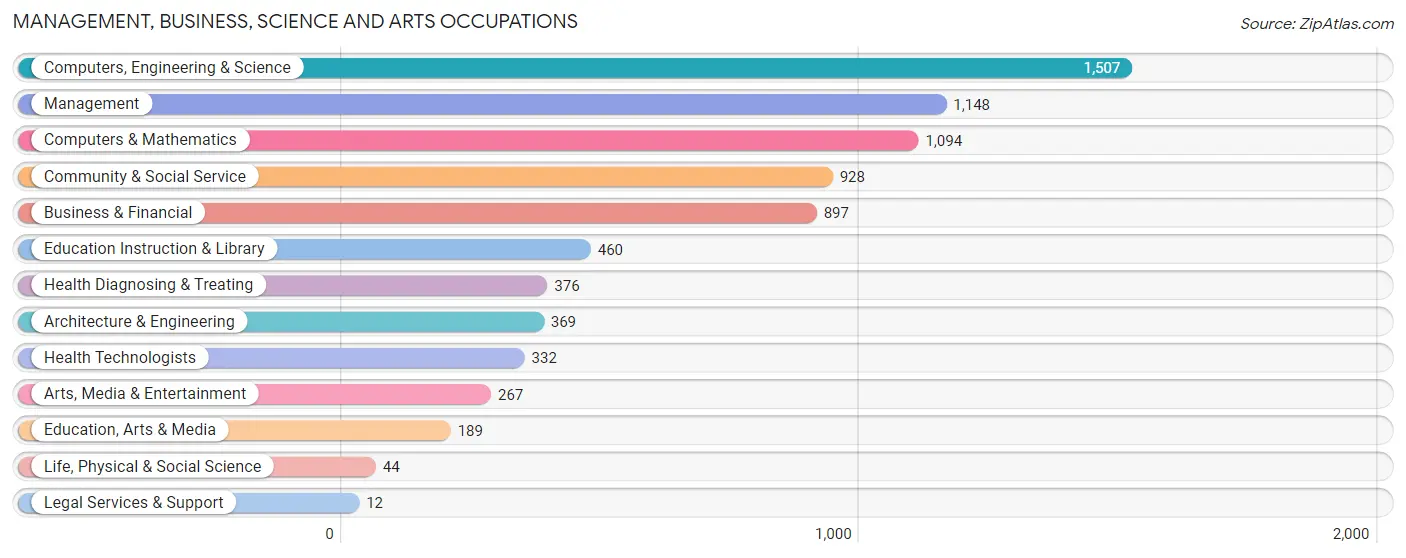
Management, Business, Science and Arts Occupations
The most common Management, Business, Science and Arts occupations in Wells Branch are Computers, Engineering & Science (1,507 | 17.4%), Management (1,148 | 13.3%), Computers & Mathematics (1,094 | 12.7%), Community & Social Service (928 | 10.7%), and Business & Financial (897 | 10.4%).
Management, Business, Science and Arts Occupations by Sex
Within the Management, Business, Science and Arts occupations in Wells Branch, the most male-oriented occupations are Life, Physical & Social Science (100.0%), Computers & Mathematics (83.9%), and Computers, Engineering & Science (82.9%), while the most female-oriented occupations are Legal Services & Support (100.0%), Health Technologists (100.0%), and Health Diagnosing & Treating (92.8%).
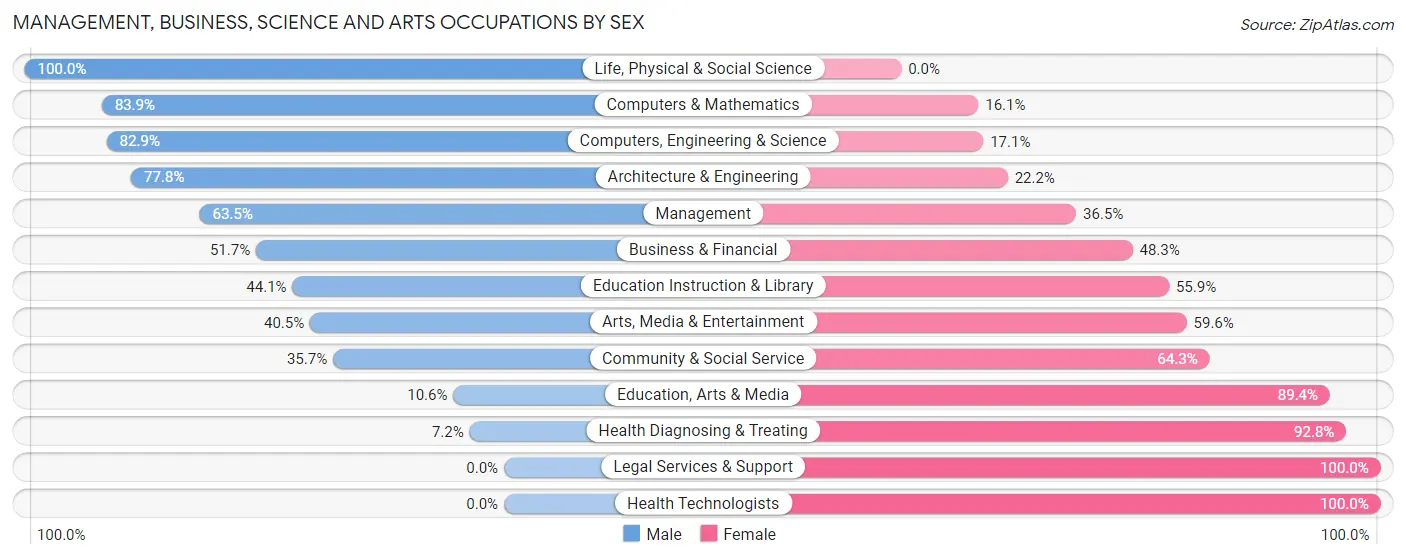
| Occupation | Male | Female |
| Management | 729 (63.5%) | 419 (36.5%) |
| Business & Financial | 464 (51.7%) | 433 (48.3%) |
| Computers, Engineering & Science | 1,249 (82.9%) | 258 (17.1%) |
| Computers & Mathematics | 918 (83.9%) | 176 (16.1%) |
| Architecture & Engineering | 287 (77.8%) | 82 (22.2%) |
| Life, Physical & Social Science | 44 (100.0%) | 0 (0.0%) |
| Community & Social Service | 331 (35.7%) | 597 (64.3%) |
| Education, Arts & Media | 20 (10.6%) | 169 (89.4%) |
| Legal Services & Support | 0 (0.0%) | 12 (100.0%) |
| Education Instruction & Library | 203 (44.1%) | 257 (55.9%) |
| Arts, Media & Entertainment | 108 (40.5%) | 159 (59.6%) |
| Health Diagnosing & Treating | 27 (7.2%) | 349 (92.8%) |
| Health Technologists | 0 (0.0%) | 332 (100.0%) |
| Total (Category) | 2,800 (57.7%) | 2,056 (42.3%) |
| Total (Overall) | 5,085 (58.8%) | 3,562 (41.2%) |
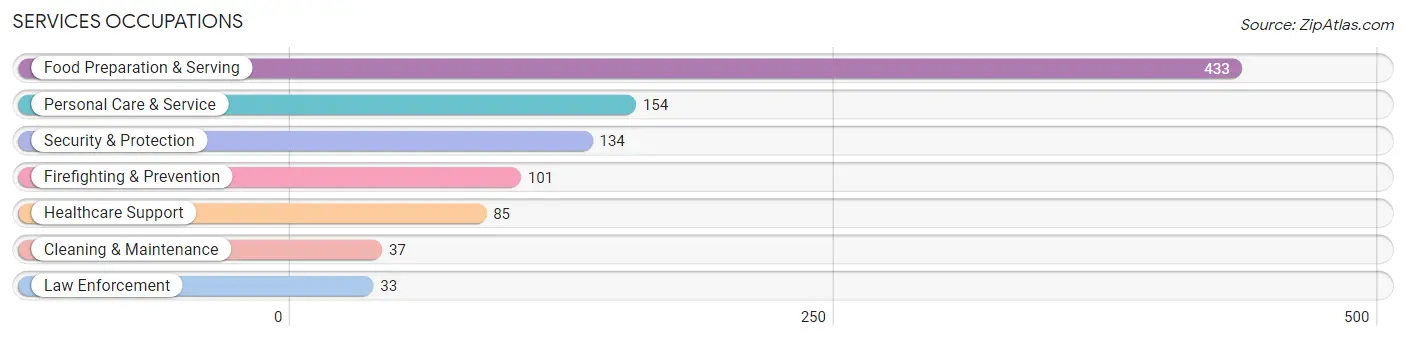
Services Occupations
The most common Services occupations in Wells Branch are Food Preparation & Serving (433 | 5.0%), Personal Care & Service (154 | 1.8%), Security & Protection (134 | 1.5%), Firefighting & Prevention (101 | 1.2%), and Healthcare Support (85 | 1.0%).
Services Occupations by Sex
Within the Services occupations in Wells Branch, the most male-oriented occupations are Security & Protection (100.0%), Firefighting & Prevention (100.0%), and Law Enforcement (100.0%), while the most female-oriented occupations are Healthcare Support (100.0%), Personal Care & Service (77.9%), and Food Preparation & Serving (53.3%).
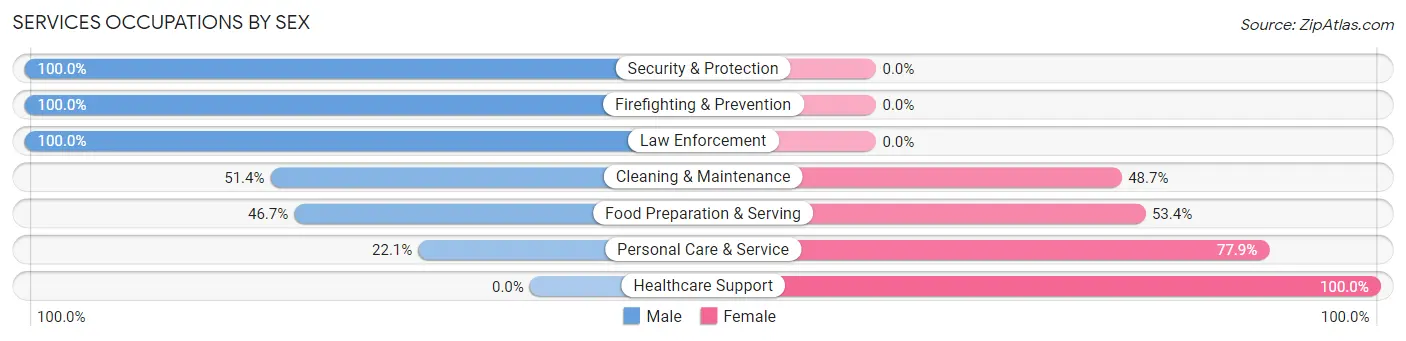
| Occupation | Male | Female |
| Healthcare Support | 0 (0.0%) | 85 (100.0%) |
| Security & Protection | 134 (100.0%) | 0 (0.0%) |
| Firefighting & Prevention | 101 (100.0%) | 0 (0.0%) |
| Law Enforcement | 33 (100.0%) | 0 (0.0%) |
| Food Preparation & Serving | 202 (46.7%) | 231 (53.3%) |
| Cleaning & Maintenance | 19 (51.3%) | 18 (48.6%) |
| Personal Care & Service | 34 (22.1%) | 120 (77.9%) |
| Total (Category) | 389 (46.1%) | 454 (53.9%) |
| Total (Overall) | 5,085 (58.8%) | 3,562 (41.2%) |
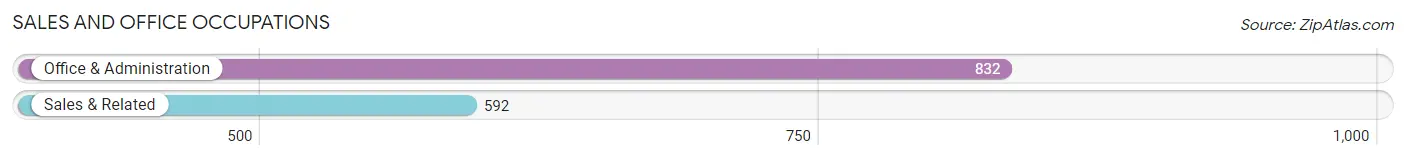
Sales and Office Occupations
The most common Sales and Office occupations in Wells Branch are Office & Administration (832 | 9.6%), and Sales & Related (592 | 6.9%).
Sales and Office Occupations by Sex
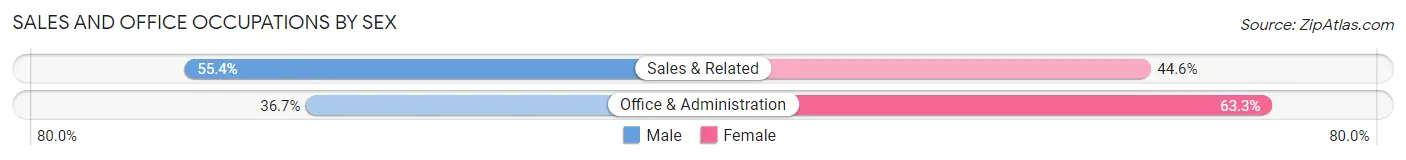
| Occupation | Male | Female |
| Sales & Related | 328 (55.4%) | 264 (44.6%) |
| Office & Administration | 305 (36.7%) | 527 (63.3%) |
| Total (Category) | 633 (44.5%) | 791 (55.5%) |
| Total (Overall) | 5,085 (58.8%) | 3,562 (41.2%) |
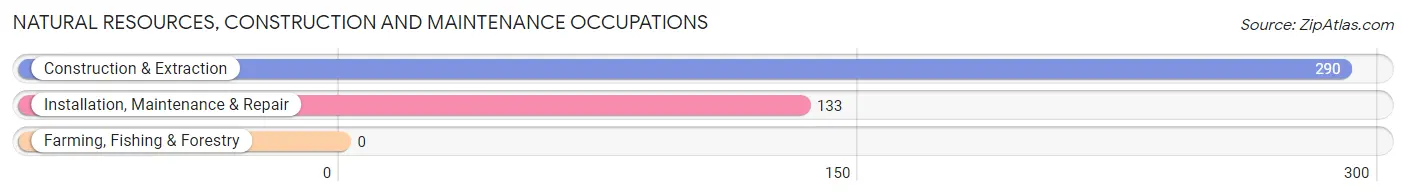
Natural Resources, Construction and Maintenance Occupations
The most common Natural Resources, Construction and Maintenance occupations in Wells Branch are Construction & Extraction (290 | 3.4%), and Installation, Maintenance & Repair (133 | 1.5%).
Natural Resources, Construction and Maintenance Occupations by Sex
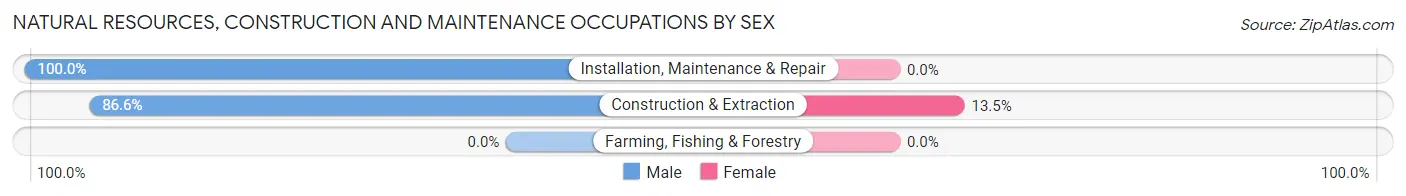
| Occupation | Male | Female |
| Farming, Fishing & Forestry | 0 (0.0%) | 0 (0.0%) |
| Construction & Extraction | 251 (86.6%) | 39 (13.5%) |
| Installation, Maintenance & Repair | 133 (100.0%) | 0 (0.0%) |
| Total (Category) | 384 (90.8%) | 39 (9.2%) |
| Total (Overall) | 5,085 (58.8%) | 3,562 (41.2%) |
Production, Transportation and Moving Occupations
The most common Production, Transportation and Moving occupations in Wells Branch are Material Moving (586 | 6.8%), Production (318 | 3.7%), and Transportation (197 | 2.3%).
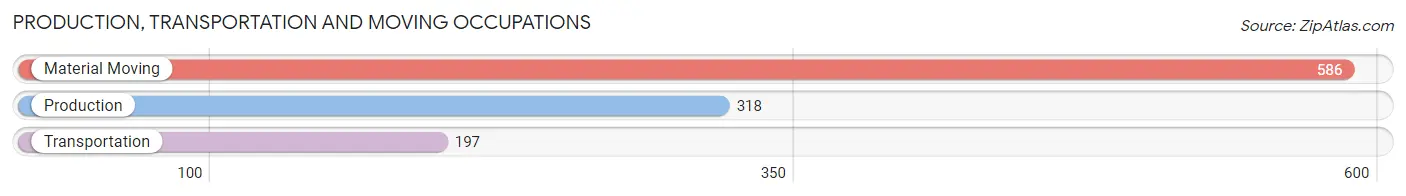
Production, Transportation and Moving Occupations by Sex
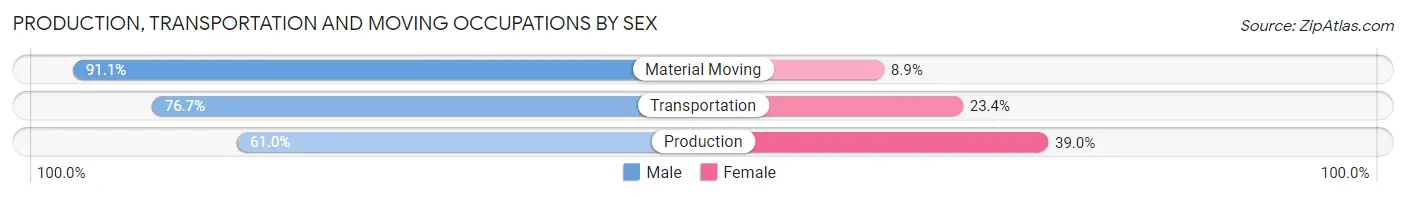
| Occupation | Male | Female |
| Production | 194 (61.0%) | 124 (39.0%) |
| Transportation | 151 (76.6%) | 46 (23.4%) |
| Material Moving | 534 (91.1%) | 52 (8.9%) |
| Total (Category) | 879 (79.8%) | 222 (20.2%) |
| Total (Overall) | 5,085 (58.8%) | 3,562 (41.2%) |
Employment Industries by Sex in Wells Branch
Employment Industries in Wells Branch
The major employment industries in Wells Branch include Retail Trade (1,051 | 12.1%), Professional & Scientific (1,028 | 11.9%), Manufacturing (914 | 10.6%), Accommodation & Food Services (756 | 8.7%), and Educational Services (746 | 8.6%).
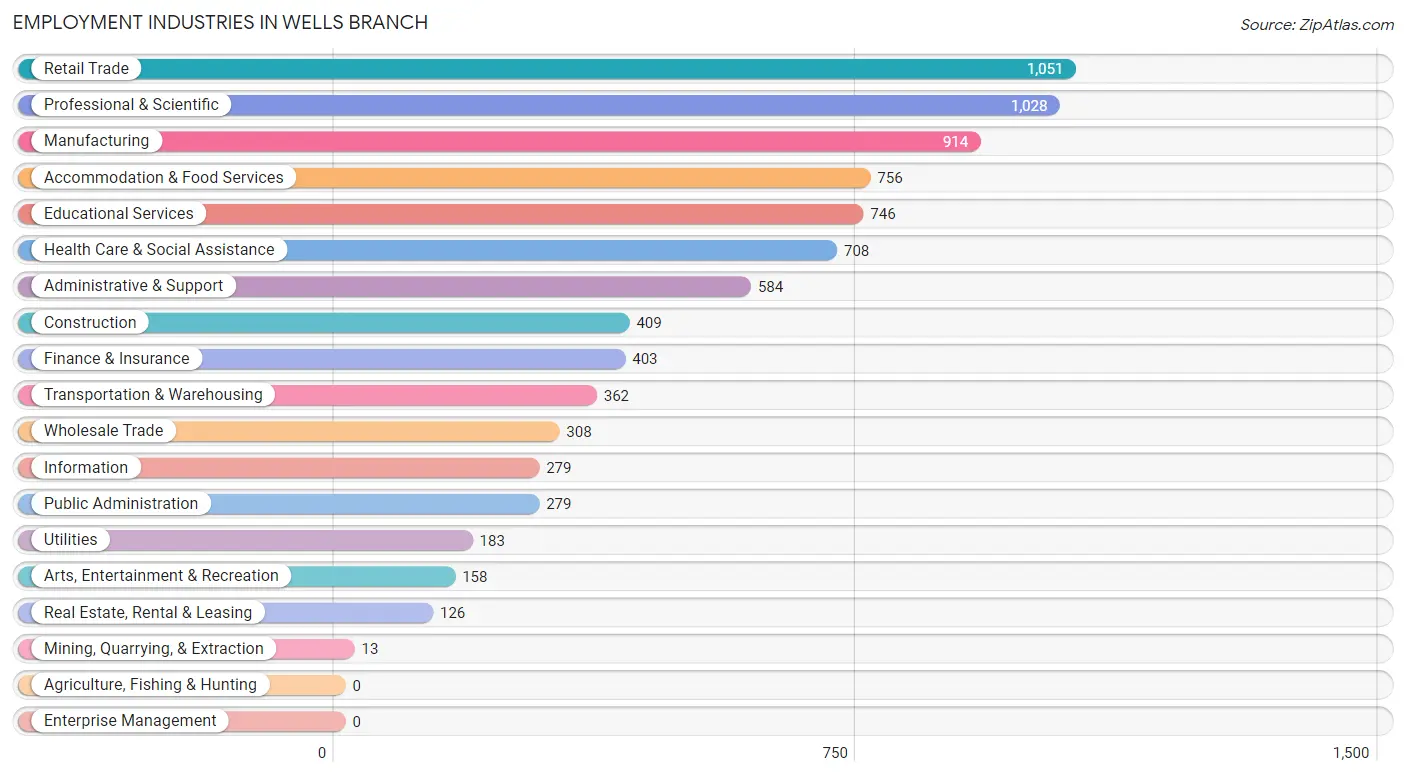
Employment Industries by Sex in Wells Branch
The Wells Branch industries that see more men than women are Mining, Quarrying, & Extraction (100.0%), Utilities (100.0%), and Wholesale Trade (90.3%), whereas the industries that tend to have a higher number of women are Health Care & Social Assistance (81.8%), Finance & Insurance (56.1%), and Real Estate, Rental & Leasing (54.0%).
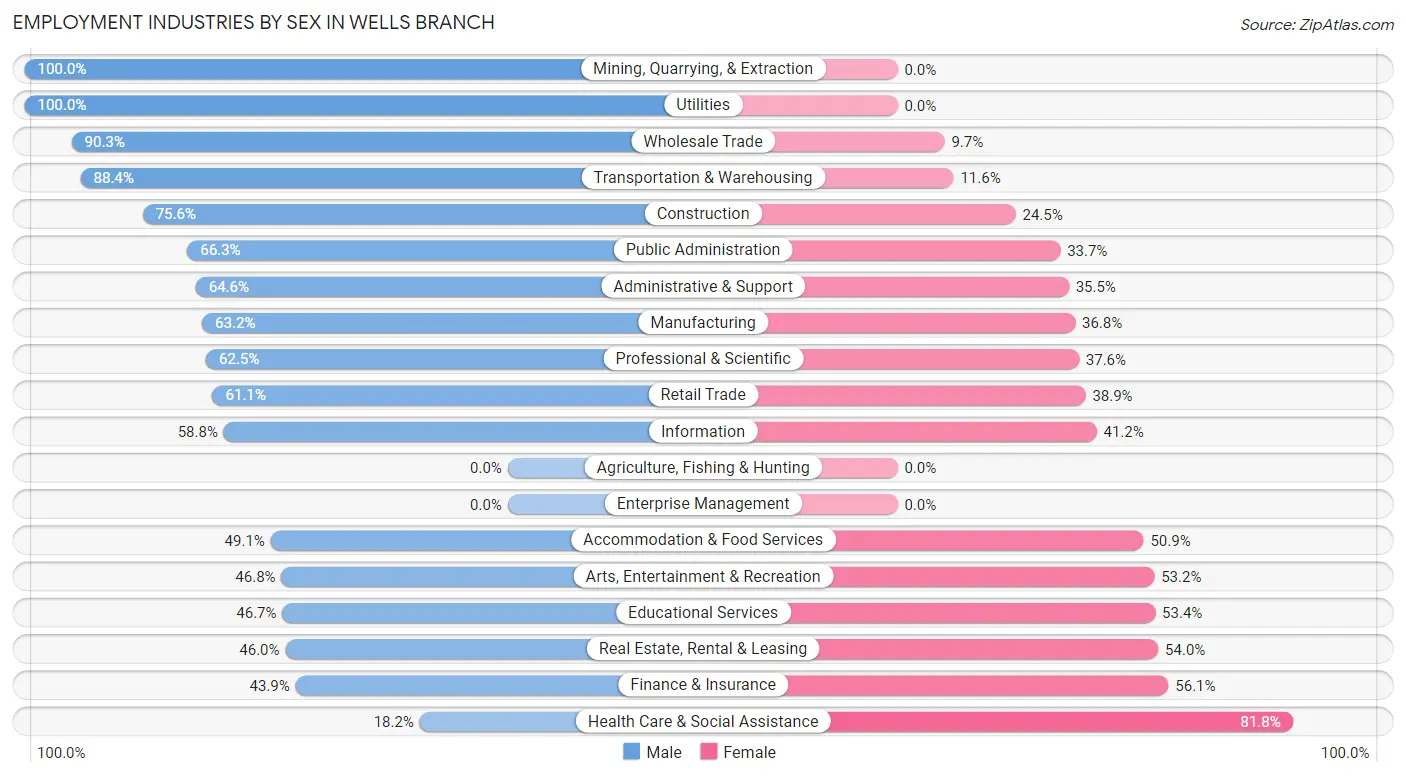
| Industry | Male | Female |
| Agriculture, Fishing & Hunting | 0 (0.0%) | 0 (0.0%) |
| Mining, Quarrying, & Extraction | 13 (100.0%) | 0 (0.0%) |
| Construction | 309 (75.5%) | 100 (24.4%) |
| Manufacturing | 578 (63.2%) | 336 (36.8%) |
| Wholesale Trade | 278 (90.3%) | 30 (9.7%) |
| Retail Trade | 642 (61.1%) | 409 (38.9%) |
| Transportation & Warehousing | 320 (88.4%) | 42 (11.6%) |
| Utilities | 183 (100.0%) | 0 (0.0%) |
| Information | 164 (58.8%) | 115 (41.2%) |
| Finance & Insurance | 177 (43.9%) | 226 (56.1%) |
| Real Estate, Rental & Leasing | 58 (46.0%) | 68 (54.0%) |
| Professional & Scientific | 642 (62.5%) | 386 (37.6%) |
| Enterprise Management | 0 (0.0%) | 0 (0.0%) |
| Administrative & Support | 377 (64.5%) | 207 (35.4%) |
| Educational Services | 348 (46.7%) | 398 (53.3%) |
| Health Care & Social Assistance | 129 (18.2%) | 579 (81.8%) |
| Arts, Entertainment & Recreation | 74 (46.8%) | 84 (53.2%) |
| Accommodation & Food Services | 371 (49.1%) | 385 (50.9%) |
| Public Administration | 185 (66.3%) | 94 (33.7%) |
| Total | 5,085 (58.8%) | 3,562 (41.2%) |
Education in Wells Branch
School Enrollment in Wells Branch
The most common levels of schooling among the 2,667 students in Wells Branch are college / undergraduate (776 | 29.1%), middle school (608 | 22.8%), and elementary school (390 | 14.6%).
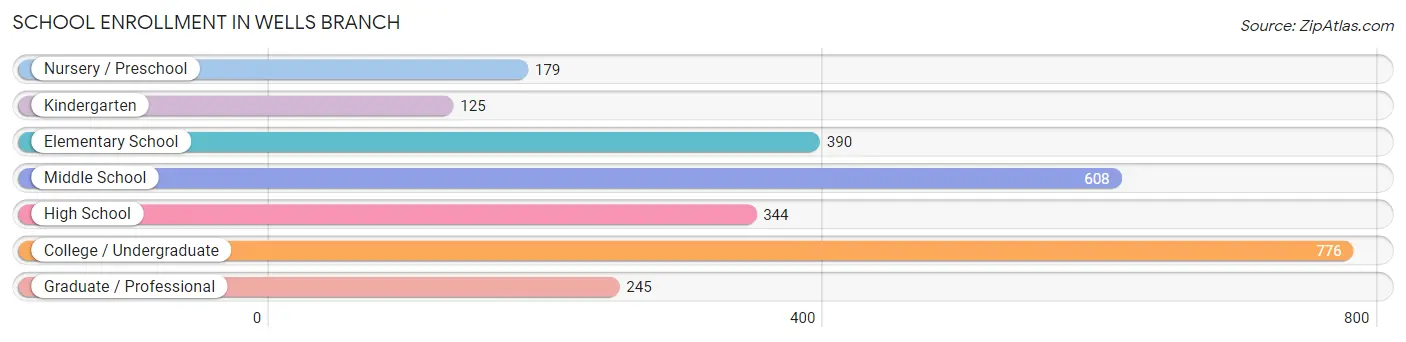
| School Level | # Students | % Students |
| Nursery / Preschool | 179 | 6.7% |
| Kindergarten | 125 | 4.7% |
| Elementary School | 390 | 14.6% |
| Middle School | 608 | 22.8% |
| High School | 344 | 12.9% |
| College / Undergraduate | 776 | 29.1% |
| Graduate / Professional | 245 | 9.2% |
| Total | 2,667 | 100.0% |
School Enrollment by Age by Funding Source in Wells Branch
Out of a total of 2,667 students who are enrolled in schools in Wells Branch, 488 (18.3%) attend a private institution, while the remaining 2,179 (81.7%) are enrolled in public schools. The age group of 25 to 34 year olds has the highest likelihood of being enrolled in private schools, with 120 (25.5% in the age bracket) enrolled. Conversely, the age group of 18 to 19 year olds has the lowest likelihood of being enrolled in a private school, with 117 (100.0% in the age bracket) attending a public institution.
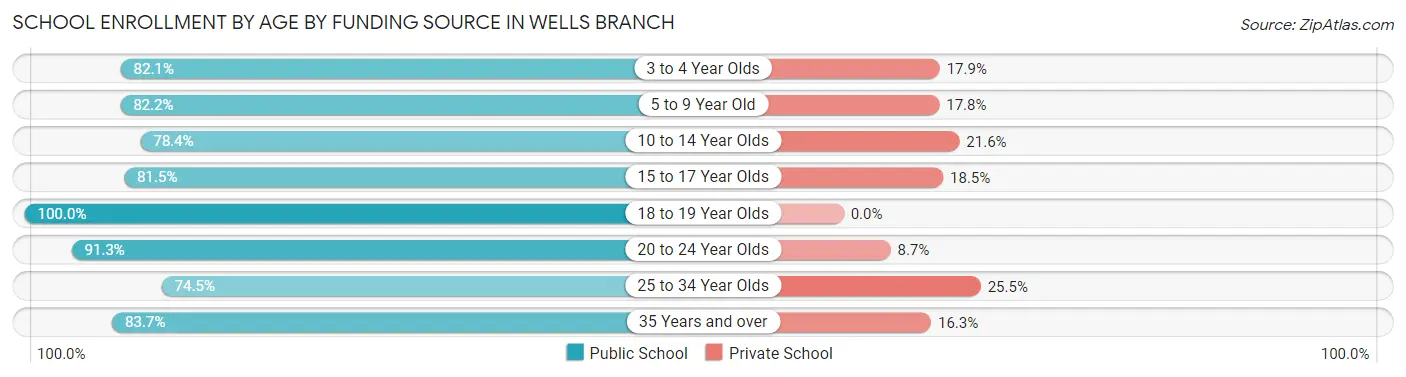
| Age Bracket | Public School | Private School |
| 3 to 4 Year Olds | 101 (82.1%) | 22 (17.9%) |
| 5 to 9 Year Old | 466 (82.2%) | 101 (17.8%) |
| 10 to 14 Year Olds | 524 (78.4%) | 144 (21.6%) |
| 15 to 17 Year Olds | 154 (81.5%) | 35 (18.5%) |
| 18 to 19 Year Olds | 117 (100.0%) | 0 (0.0%) |
| 20 to 24 Year Olds | 251 (91.3%) | 24 (8.7%) |
| 25 to 34 Year Olds | 350 (74.5%) | 120 (25.5%) |
| 35 Years and over | 216 (83.7%) | 42 (16.3%) |
| Total | 2,179 (81.7%) | 488 (18.3%) |
Educational Attainment by Field of Study in Wells Branch
Business (1,065 | 21.2%), engineering (524 | 10.4%), computers & mathematics (431 | 8.6%), arts & humanities (384 | 7.6%), and literature & languages (355 | 7.1%) are the most common fields of study among 5,026 individuals in Wells Branch who have obtained a bachelor's degree or higher.
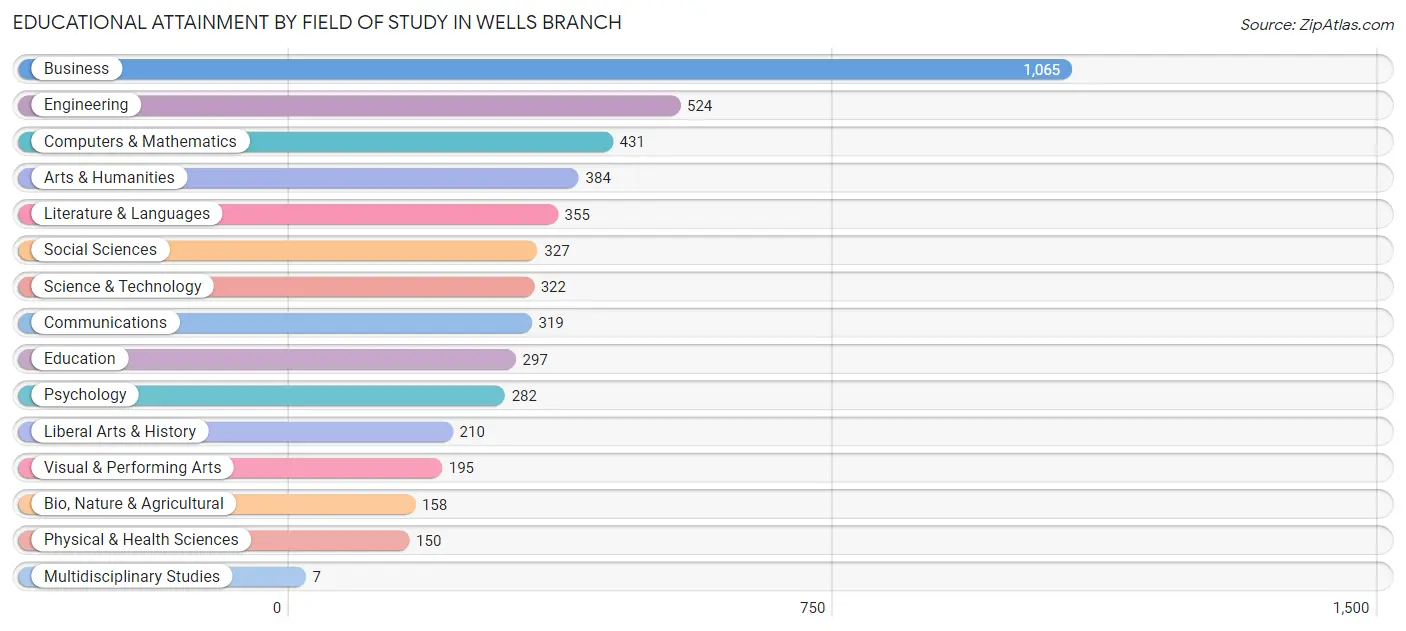
| Field of Study | # Graduates | % Graduates |
| Computers & Mathematics | 431 | 8.6% |
| Bio, Nature & Agricultural | 158 | 3.1% |
| Physical & Health Sciences | 150 | 3.0% |
| Psychology | 282 | 5.6% |
| Social Sciences | 327 | 6.5% |
| Engineering | 524 | 10.4% |
| Multidisciplinary Studies | 7 | 0.1% |
| Science & Technology | 322 | 6.4% |
| Business | 1,065 | 21.2% |
| Education | 297 | 5.9% |
| Literature & Languages | 355 | 7.1% |
| Liberal Arts & History | 210 | 4.2% |
| Visual & Performing Arts | 195 | 3.9% |
| Communications | 319 | 6.4% |
| Arts & Humanities | 384 | 7.6% |
| Total | 5,026 | 100.0% |
Transportation & Commute in Wells Branch
Vehicle Availability by Sex in Wells Branch
The most prevalent vehicle ownership categories in Wells Branch are males with 2 vehicles (2,512, accounting for 50.9%) and females with 2 vehicles (1,577, making up 71.7%).
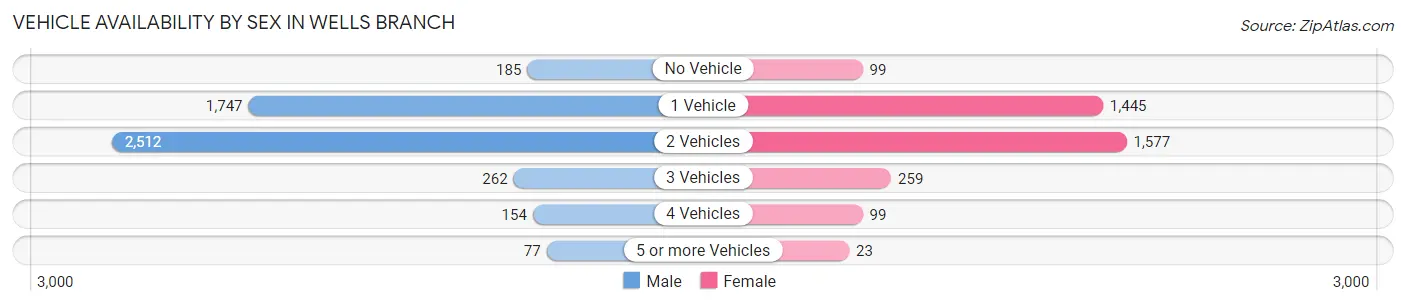
| Vehicles Available | Male | Female |
| No Vehicle | 185 (3.7%) | 99 (2.8%) |
| 1 Vehicle | 1,747 (35.4%) | 1,445 (41.3%) |
| 2 Vehicles | 2,512 (50.9%) | 1,577 (45.0%) |
| 3 Vehicles | 262 (5.3%) | 259 (7.4%) |
| 4 Vehicles | 154 (3.1%) | 99 (2.8%) |
| 5 or more Vehicles | 77 (1.6%) | 23 (0.7%) |
| Total | 4,937 (100.0%) | 3,502 (100.0%) |
Commute Time in Wells Branch
The most frequently occuring commute durations in Wells Branch are 15 to 19 minutes (1,462 commuters, 21.4%), 20 to 24 minutes (1,282 commuters, 18.8%), and 10 to 14 minutes (1,087 commuters, 15.9%).
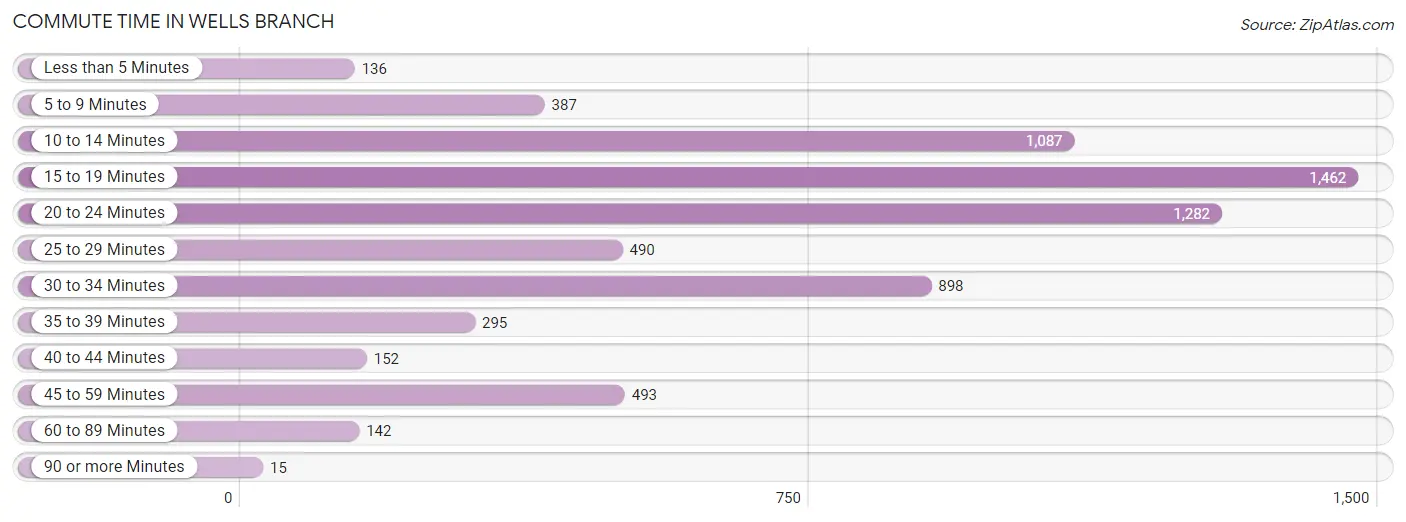
| Commute Time | # Commuters | % Commuters |
| Less than 5 Minutes | 136 | 2.0% |
| 5 to 9 Minutes | 387 | 5.7% |
| 10 to 14 Minutes | 1,087 | 15.9% |
| 15 to 19 Minutes | 1,462 | 21.4% |
| 20 to 24 Minutes | 1,282 | 18.8% |
| 25 to 29 Minutes | 490 | 7.2% |
| 30 to 34 Minutes | 898 | 13.1% |
| 35 to 39 Minutes | 295 | 4.3% |
| 40 to 44 Minutes | 152 | 2.2% |
| 45 to 59 Minutes | 493 | 7.2% |
| 60 to 89 Minutes | 142 | 2.1% |
| 90 or more Minutes | 15 | 0.2% |
Commute Time by Sex in Wells Branch
The most common commute times in Wells Branch are 20 to 24 minutes (903 commuters, 22.8%) for males and 15 to 19 minutes (704 commuters, 24.5%) for females.
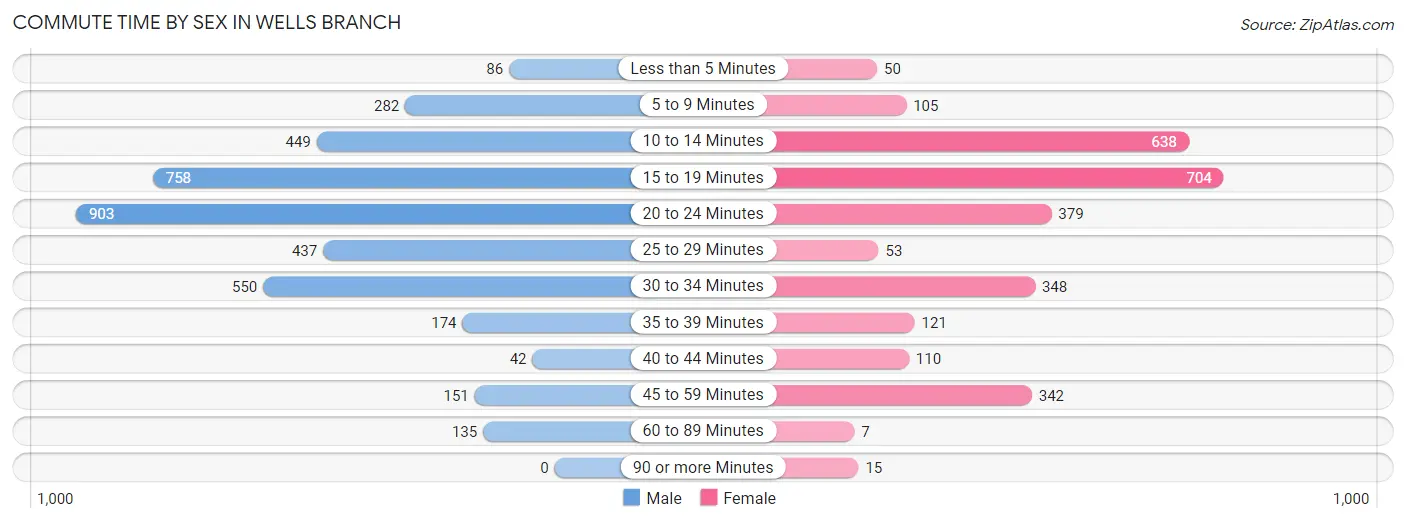
| Commute Time | Male | Female |
| Less than 5 Minutes | 86 (2.2%) | 50 (1.7%) |
| 5 to 9 Minutes | 282 (7.1%) | 105 (3.7%) |
| 10 to 14 Minutes | 449 (11.3%) | 638 (22.2%) |
| 15 to 19 Minutes | 758 (19.1%) | 704 (24.5%) |
| 20 to 24 Minutes | 903 (22.8%) | 379 (13.2%) |
| 25 to 29 Minutes | 437 (11.0%) | 53 (1.8%) |
| 30 to 34 Minutes | 550 (13.9%) | 348 (12.1%) |
| 35 to 39 Minutes | 174 (4.4%) | 121 (4.2%) |
| 40 to 44 Minutes | 42 (1.1%) | 110 (3.8%) |
| 45 to 59 Minutes | 151 (3.8%) | 342 (11.9%) |
| 60 to 89 Minutes | 135 (3.4%) | 7 (0.2%) |
| 90 or more Minutes | 0 (0.0%) | 15 (0.5%) |
Time of Departure to Work by Sex in Wells Branch
The most frequent times of departure to work in Wells Branch are 7:00 AM to 7:29 AM (896, 22.6%) for males and 7:00 AM to 7:29 AM (658, 22.9%) for females.
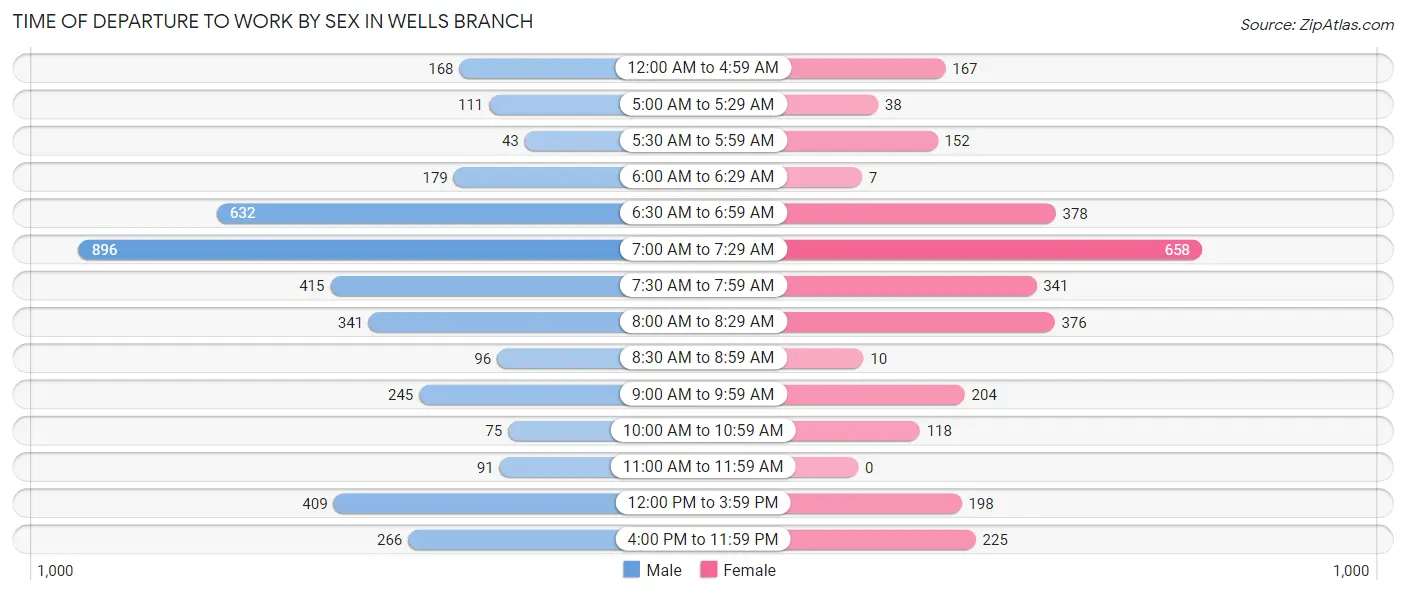
| Time of Departure | Male | Female |
| 12:00 AM to 4:59 AM | 168 (4.2%) | 167 (5.8%) |
| 5:00 AM to 5:29 AM | 111 (2.8%) | 38 (1.3%) |
| 5:30 AM to 5:59 AM | 43 (1.1%) | 152 (5.3%) |
| 6:00 AM to 6:29 AM | 179 (4.5%) | 7 (0.2%) |
| 6:30 AM to 6:59 AM | 632 (15.9%) | 378 (13.2%) |
| 7:00 AM to 7:29 AM | 896 (22.6%) | 658 (22.9%) |
| 7:30 AM to 7:59 AM | 415 (10.5%) | 341 (11.9%) |
| 8:00 AM to 8:29 AM | 341 (8.6%) | 376 (13.1%) |
| 8:30 AM to 8:59 AM | 96 (2.4%) | 10 (0.4%) |
| 9:00 AM to 9:59 AM | 245 (6.2%) | 204 (7.1%) |
| 10:00 AM to 10:59 AM | 75 (1.9%) | 118 (4.1%) |
| 11:00 AM to 11:59 AM | 91 (2.3%) | 0 (0.0%) |
| 12:00 PM to 3:59 PM | 409 (10.3%) | 198 (6.9%) |
| 4:00 PM to 11:59 PM | 266 (6.7%) | 225 (7.8%) |
| Total | 3,967 (100.0%) | 2,872 (100.0%) |
Housing Occupancy in Wells Branch
Occupancy by Ownership in Wells Branch
Of the total 6,989 dwellings in Wells Branch, owner-occupied units account for 1,965 (28.1%), while renter-occupied units make up 5,024 (71.9%).
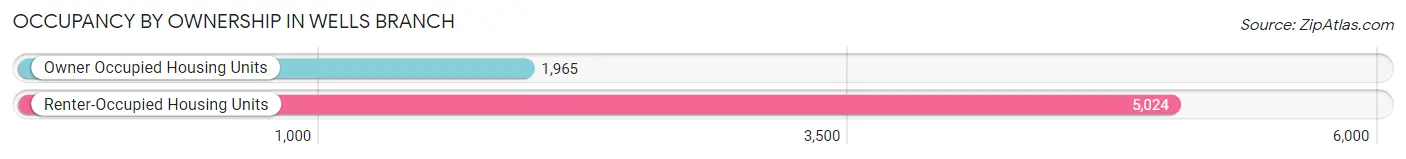
| Occupancy | # Housing Units | % Housing Units |
| Owner Occupied Housing Units | 1,965 | 28.1% |
| Renter-Occupied Housing Units | 5,024 | 71.9% |
| Total Occupied Housing Units | 6,989 | 100.0% |
Occupancy by Household Size in Wells Branch
| Household Size | # Housing Units | % Housing Units |
| 1-Person Household | 3,022 | 43.2% |
| 2-Person Household | 2,117 | 30.3% |
| 3-Person Household | 1,049 | 15.0% |
| 4+ Person Household | 801 | 11.5% |
| Total Housing Units | 6,989 | 100.0% |
Occupancy by Ownership by Household Size in Wells Branch
| Household Size | Owner-occupied | Renter-occupied |
| 1-Person Household | 427 (14.1%) | 2,595 (85.9%) |
| 2-Person Household | 709 (33.5%) | 1,408 (66.5%) |
| 3-Person Household | 547 (52.1%) | 502 (47.9%) |
| 4+ Person Household | 282 (35.2%) | 519 (64.8%) |
| Total Housing Units | 1,965 (28.1%) | 5,024 (71.9%) |
Occupancy by Educational Attainment in Wells Branch
| Household Size | Owner-occupied | Renter-occupied |
| Less than High School | 0 (0.0%) | 207 (100.0%) |
| High School Diploma | 140 (8.8%) | 1,452 (91.2%) |
| College/Associate Degree | 388 (19.6%) | 1,597 (80.4%) |
| Bachelor's Degree or higher | 1,437 (44.8%) | 1,768 (55.2%) |
Occupancy by Age of Householder in Wells Branch
| Age Bracket | # Households | % Households |
| Under 35 Years | 2,377 | 34.0% |
| 35 to 44 Years | 1,914 | 27.4% |
| 45 to 54 Years | 1,189 | 17.0% |
| 55 to 64 Years | 661 | 9.5% |
| 65 to 74 Years | 567 | 8.1% |
| 75 to 84 Years | 211 | 3.0% |
| 85 Years and Over | 70 | 1.0% |
| Total | 6,989 | 100.0% |
Housing Finances in Wells Branch
Median Income by Occupancy in Wells Branch
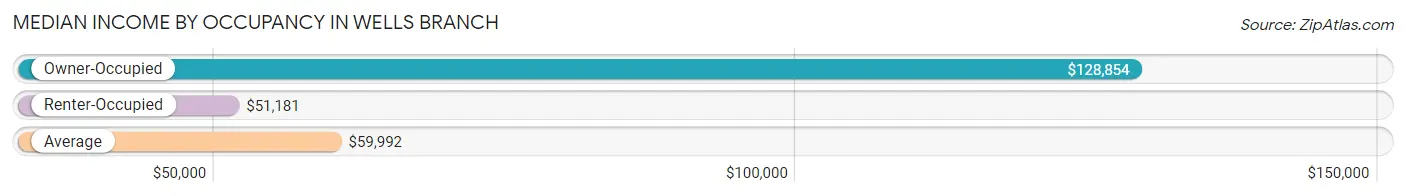
| Occupancy Type | # Households | Median Income |
| Owner-Occupied | 1,965 (28.1%) | $128,854 |
| Renter-Occupied | 5,024 (71.9%) | $51,181 |
| Average | 6,989 (100.0%) | $59,992 |
Occupancy by Householder Income Bracket in Wells Branch
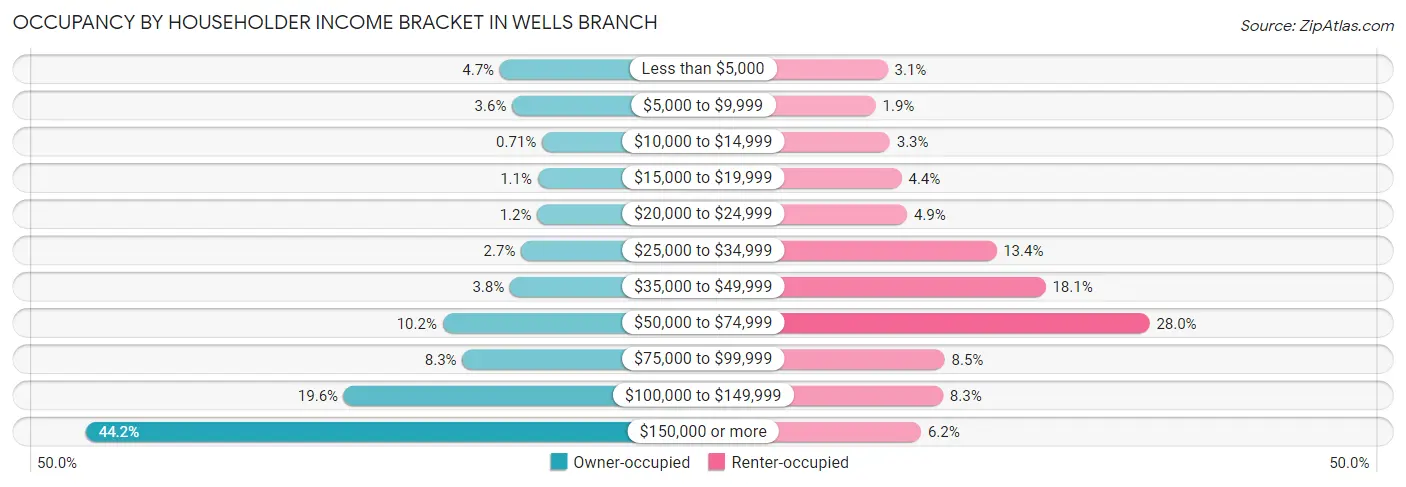
| Income Bracket | Owner-occupied | Renter-occupied |
| Less than $5,000 | 93 (4.7%) | 153 (3.0%) |
| $5,000 to $9,999 | 70 (3.6%) | 96 (1.9%) |
| $10,000 to $14,999 | 14 (0.7%) | 164 (3.3%) |
| $15,000 to $19,999 | 22 (1.1%) | 220 (4.4%) |
| $20,000 to $24,999 | 23 (1.2%) | 246 (4.9%) |
| $25,000 to $34,999 | 53 (2.7%) | 673 (13.4%) |
| $35,000 to $49,999 | 74 (3.8%) | 909 (18.1%) |
| $50,000 to $74,999 | 200 (10.2%) | 1,406 (28.0%) |
| $75,000 to $99,999 | 163 (8.3%) | 426 (8.5%) |
| $100,000 to $149,999 | 385 (19.6%) | 418 (8.3%) |
| $150,000 or more | 868 (44.2%) | 313 (6.2%) |
| Total | 1,965 (100.0%) | 5,024 (100.0%) |
Monthly Housing Cost Tiers in Wells Branch
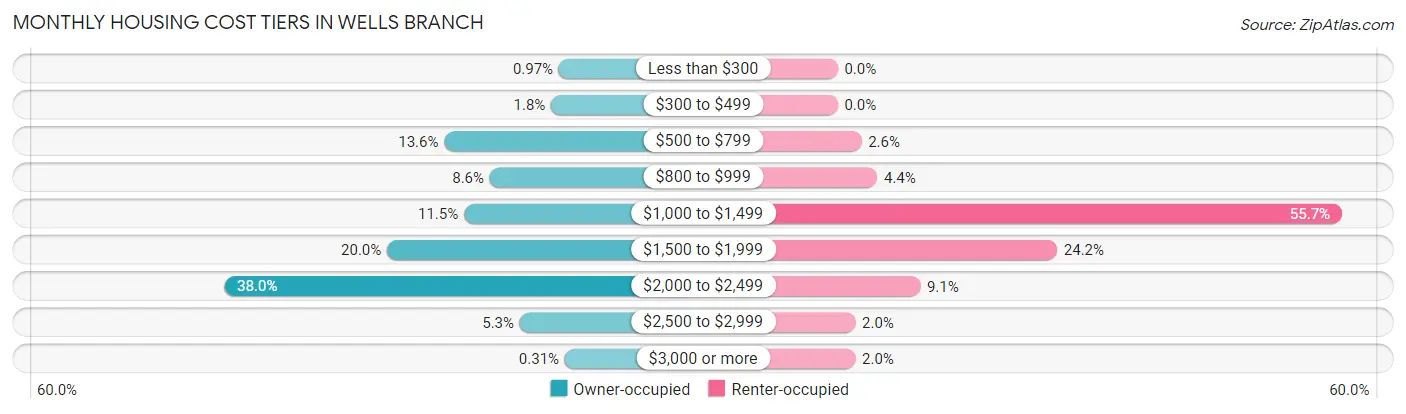
| Monthly Cost | Owner-occupied | Renter-occupied |
| Less than $300 | 19 (1.0%) | 0 (0.0%) |
| $300 to $499 | 36 (1.8%) | 0 (0.0%) |
| $500 to $799 | 268 (13.6%) | 132 (2.6%) |
| $800 to $999 | 169 (8.6%) | 220 (4.4%) |
| $1,000 to $1,499 | 225 (11.5%) | 2,800 (55.7%) |
| $1,500 to $1,999 | 392 (20.0%) | 1,218 (24.2%) |
| $2,000 to $2,499 | 746 (38.0%) | 458 (9.1%) |
| $2,500 to $2,999 | 104 (5.3%) | 98 (1.9%) |
| $3,000 or more | 6 (0.3%) | 98 (1.9%) |
| Total | 1,965 (100.0%) | 5,024 (100.0%) |
Physical Housing Characteristics in Wells Branch
Housing Structures in Wells Branch
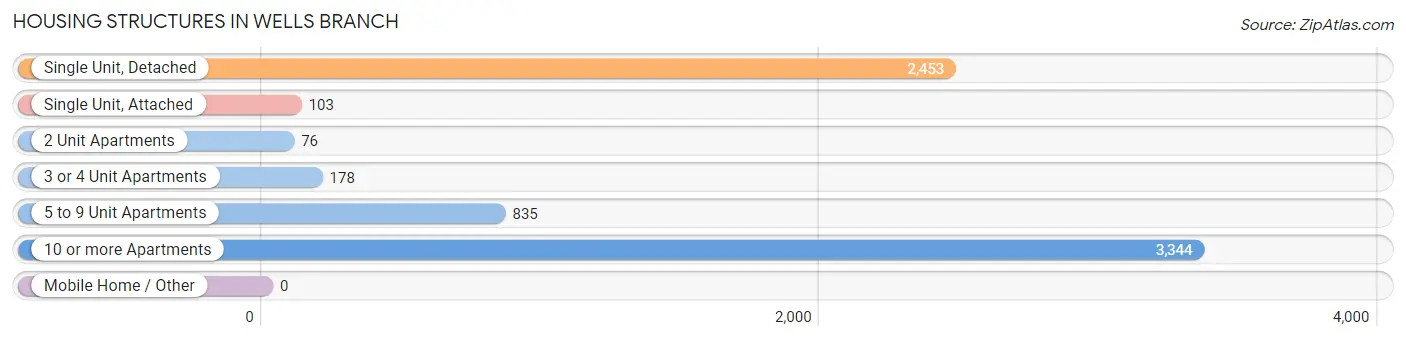
| Structure Type | # Housing Units | % Housing Units |
| Single Unit, Detached | 2,453 | 35.1% |
| Single Unit, Attached | 103 | 1.5% |
| 2 Unit Apartments | 76 | 1.1% |
| 3 or 4 Unit Apartments | 178 | 2.5% |
| 5 to 9 Unit Apartments | 835 | 11.9% |
| 10 or more Apartments | 3,344 | 47.8% |
| Mobile Home / Other | 0 | 0.0% |
| Total | 6,989 | 100.0% |
Housing Structures by Occupancy in Wells Branch
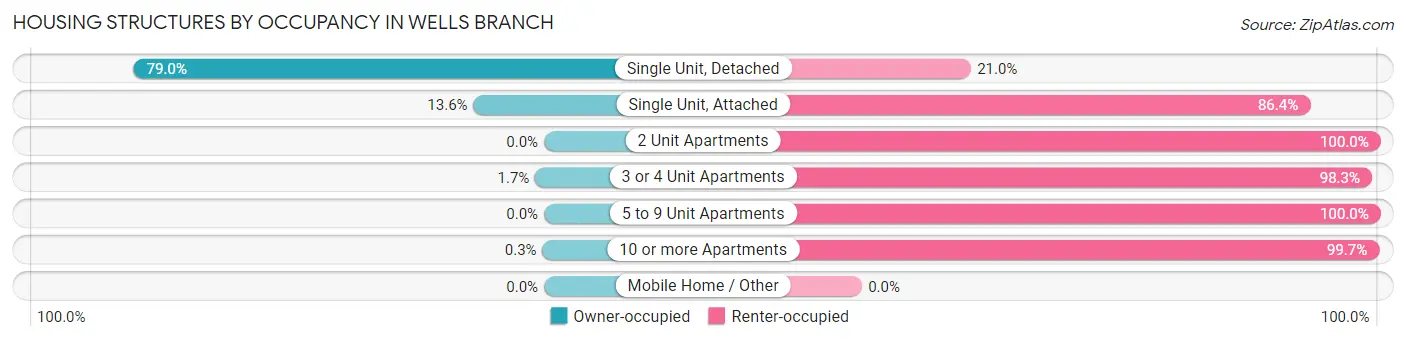
| Structure Type | Owner-occupied | Renter-occupied |
| Single Unit, Detached | 1,938 (79.0%) | 515 (21.0%) |
| Single Unit, Attached | 14 (13.6%) | 89 (86.4%) |
| 2 Unit Apartments | 0 (0.0%) | 76 (100.0%) |
| 3 or 4 Unit Apartments | 3 (1.7%) | 175 (98.3%) |
| 5 to 9 Unit Apartments | 0 (0.0%) | 835 (100.0%) |
| 10 or more Apartments | 10 (0.3%) | 3,334 (99.7%) |
| Mobile Home / Other | 0 (0.0%) | 0 (0.0%) |
| Total | 1,965 (28.1%) | 5,024 (71.9%) |
Housing Structures by Number of Rooms in Wells Branch
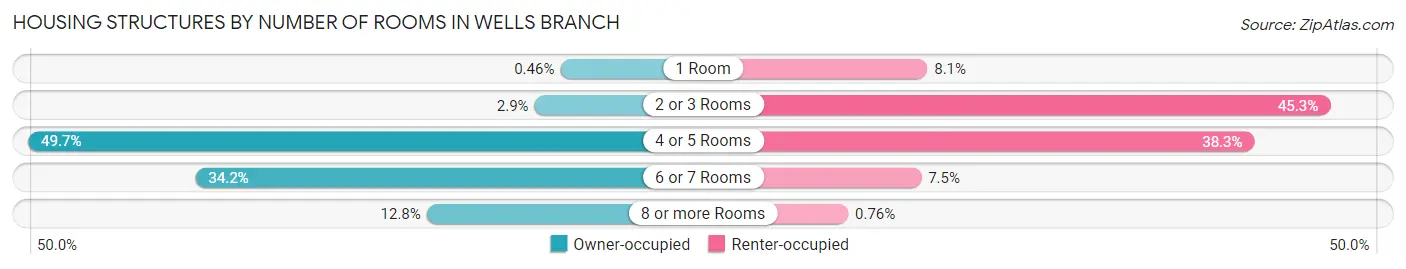
| Number of Rooms | Owner-occupied | Renter-occupied |
| 1 Room | 9 (0.5%) | 406 (8.1%) |
| 2 or 3 Rooms | 56 (2.9%) | 2,277 (45.3%) |
| 4 or 5 Rooms | 976 (49.7%) | 1,925 (38.3%) |
| 6 or 7 Rooms | 672 (34.2%) | 378 (7.5%) |
| 8 or more Rooms | 252 (12.8%) | 38 (0.8%) |
| Total | 1,965 (100.0%) | 5,024 (100.0%) |
Housing Structure by Heating Type in Wells Branch
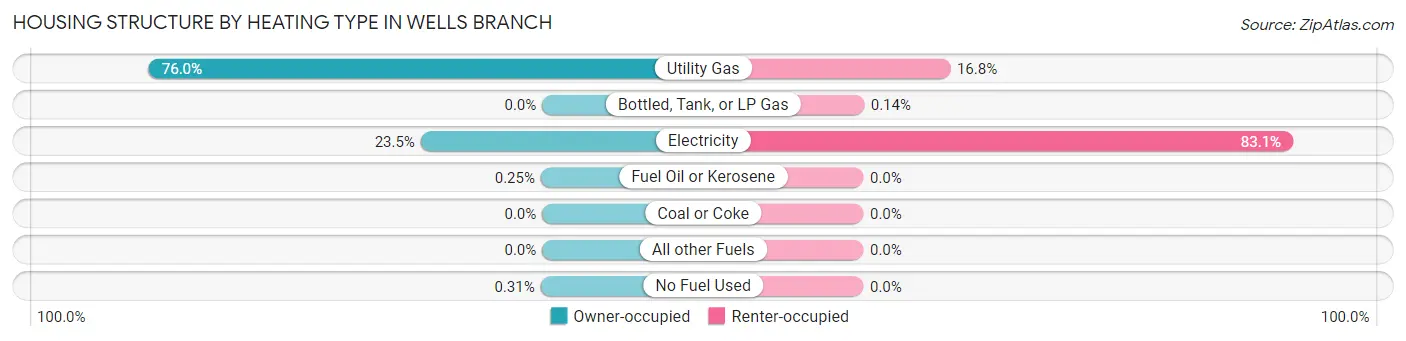
| Heating Type | Owner-occupied | Renter-occupied |
| Utility Gas | 1,493 (76.0%) | 844 (16.8%) |
| Bottled, Tank, or LP Gas | 0 (0.0%) | 7 (0.1%) |
| Electricity | 461 (23.5%) | 4,173 (83.1%) |
| Fuel Oil or Kerosene | 5 (0.3%) | 0 (0.0%) |
| Coal or Coke | 0 (0.0%) | 0 (0.0%) |
| All other Fuels | 0 (0.0%) | 0 (0.0%) |
| No Fuel Used | 6 (0.3%) | 0 (0.0%) |
| Total | 1,965 (100.0%) | 5,024 (100.0%) |
Household Vehicle Usage in Wells Branch
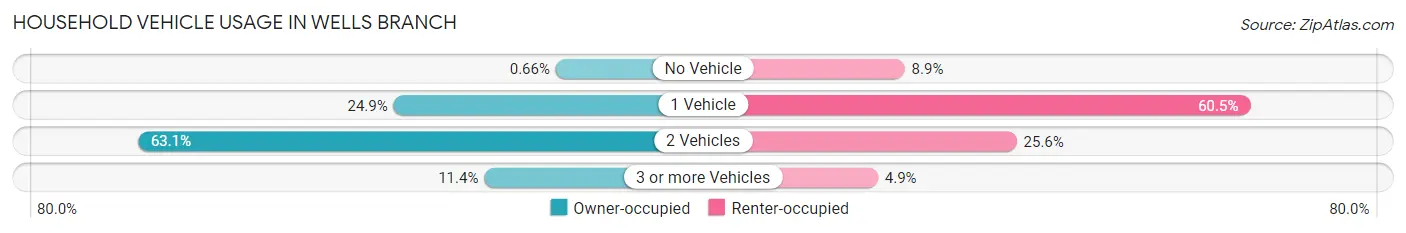
| Vehicles per Household | Owner-occupied | Renter-occupied |
| No Vehicle | 13 (0.7%) | 448 (8.9%) |
| 1 Vehicle | 489 (24.9%) | 3,041 (60.5%) |
| 2 Vehicles | 1,240 (63.1%) | 1,288 (25.6%) |
| 3 or more Vehicles | 223 (11.4%) | 247 (4.9%) |
| Total | 1,965 (100.0%) | 5,024 (100.0%) |
Real Estate & Mortgages in Wells Branch
Real Estate and Mortgage Overview in Wells Branch
| Characteristic | Without Mortgage | With Mortgage |
| Housing Units | 446 | 1,519 |
| Median Property Value | $336,000 | $338,300 |
| Median Household Income | $106,477 | $720 |
| Monthly Housing Costs | $761 | $6 |
| Real Estate Taxes | $4,820 | $34 |
Property Value by Mortgage Status in Wells Branch
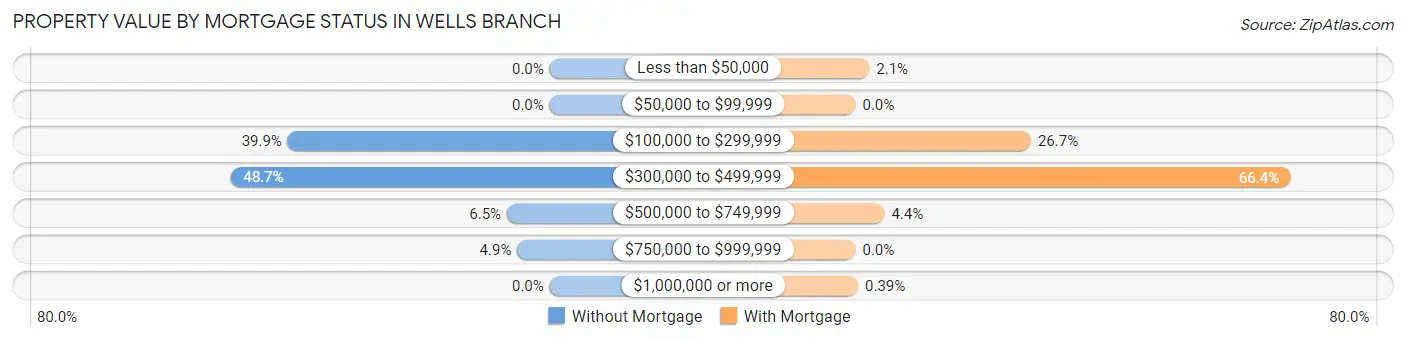
| Property Value | Without Mortgage | With Mortgage |
| Less than $50,000 | 0 (0.0%) | 32 (2.1%) |
| $50,000 to $99,999 | 0 (0.0%) | 0 (0.0%) |
| $100,000 to $299,999 | 178 (39.9%) | 406 (26.7%) |
| $300,000 to $499,999 | 217 (48.6%) | 1,008 (66.4%) |
| $500,000 to $749,999 | 29 (6.5%) | 67 (4.4%) |
| $750,000 to $999,999 | 22 (4.9%) | 0 (0.0%) |
| $1,000,000 or more | 0 (0.0%) | 6 (0.4%) |
| Total | 446 (100.0%) | 1,519 (100.0%) |
Household Income by Mortgage Status in Wells Branch
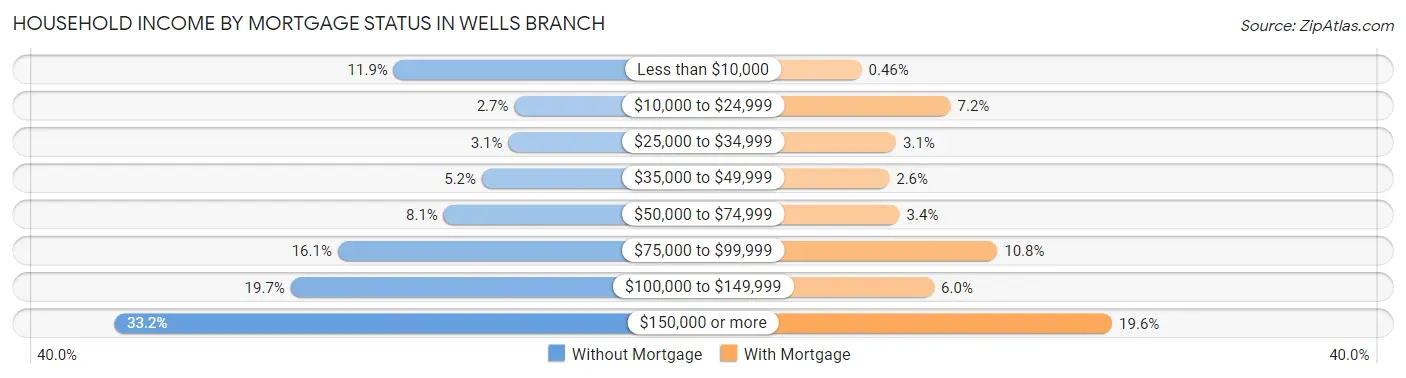
| Household Income | Without Mortgage | With Mortgage |
| Less than $10,000 | 53 (11.9%) | 7 (0.5%) |
| $10,000 to $24,999 | 12 (2.7%) | 110 (7.2%) |
| $25,000 to $34,999 | 14 (3.1%) | 47 (3.1%) |
| $35,000 to $49,999 | 23 (5.2%) | 39 (2.6%) |
| $50,000 to $74,999 | 36 (8.1%) | 51 (3.4%) |
| $75,000 to $99,999 | 72 (16.1%) | 164 (10.8%) |
| $100,000 to $149,999 | 88 (19.7%) | 91 (6.0%) |
| $150,000 or more | 148 (33.2%) | 297 (19.6%) |
| Total | 446 (100.0%) | 1,519 (100.0%) |
Property Value to Household Income Ratio in Wells Branch
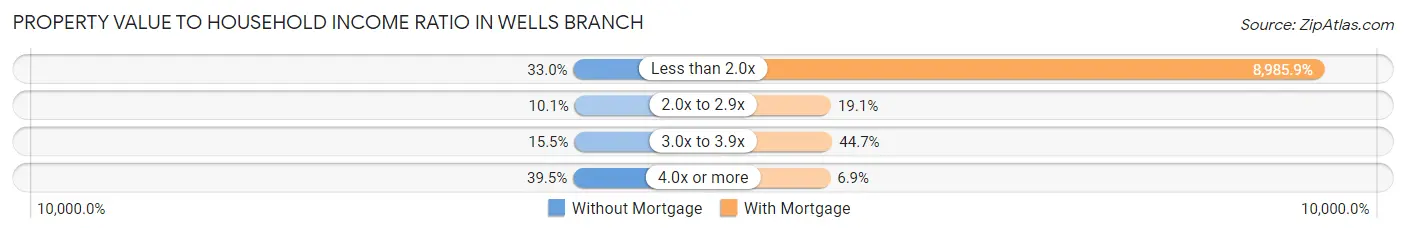
| Value-to-Income Ratio | Without Mortgage | With Mortgage |
| Less than 2.0x | 147 (33.0%) | 136,495 (8,985.9%) |
| 2.0x to 2.9x | 45 (10.1%) | 290 (19.1%) |
| 3.0x to 3.9x | 69 (15.5%) | 679 (44.7%) |
| 4.0x or more | 176 (39.5%) | 105 (6.9%) |
| Total | 446 (100.0%) | 1,519 (100.0%) |
Real Estate Taxes by Mortgage Status in Wells Branch
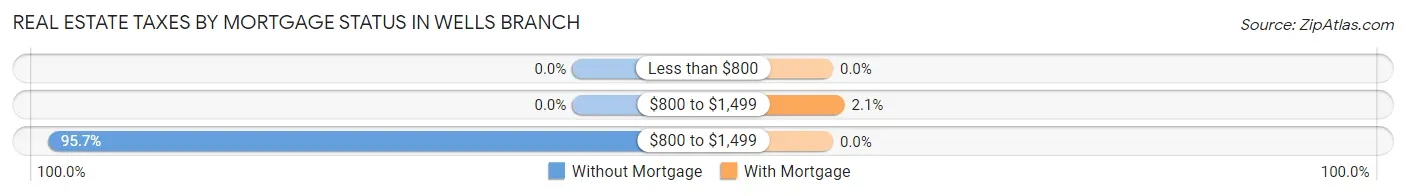
| Property Taxes | Without Mortgage | With Mortgage |
| Less than $800 | 0 (0.0%) | 0 (0.0%) |
| $800 to $1,499 | 0 (0.0%) | 32 (2.1%) |
| $800 to $1,499 | 427 (95.7%) | 0 (0.0%) |
| Total | 446 (100.0%) | 1,519 (100.0%) |
Health & Disability in Wells Branch
Health Insurance Coverage by Age in Wells Branch
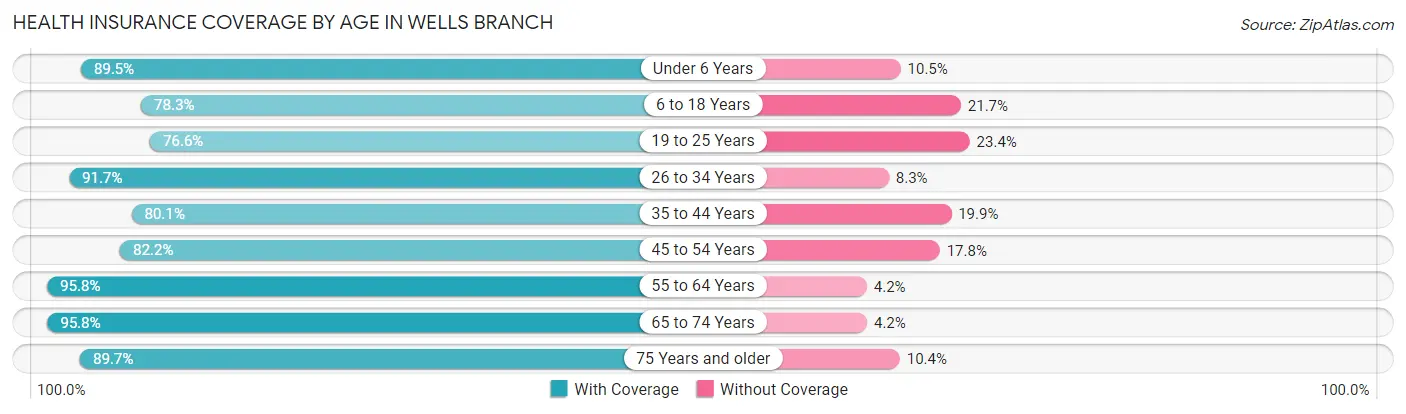
| Age Bracket | With Coverage | Without Coverage |
| Under 6 Years | 1,134 (89.5%) | 133 (10.5%) |
| 6 to 18 Years | 1,037 (78.3%) | 288 (21.7%) |
| 19 to 25 Years | 1,114 (76.6%) | 340 (23.4%) |
| 26 to 34 Years | 2,716 (91.7%) | 246 (8.3%) |
| 35 to 44 Years | 2,381 (80.1%) | 593 (19.9%) |
| 45 to 54 Years | 1,450 (82.2%) | 314 (17.8%) |
| 55 to 64 Years | 865 (95.8%) | 38 (4.2%) |
| 65 to 74 Years | 858 (95.8%) | 38 (4.2%) |
| 75 Years and older | 355 (89.6%) | 41 (10.3%) |
| Total | 11,910 (85.4%) | 2,031 (14.6%) |
Health Insurance Coverage by Citizenship Status in Wells Branch
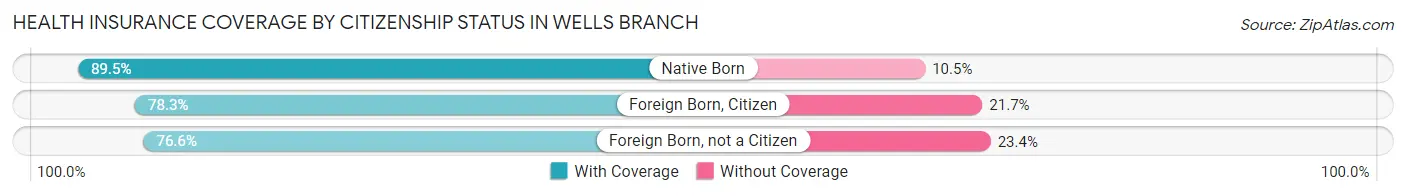
| Citizenship Status | With Coverage | Without Coverage |
| Native Born | 1,134 (89.5%) | 133 (10.5%) |
| Foreign Born, Citizen | 1,037 (78.3%) | 288 (21.7%) |
| Foreign Born, not a Citizen | 1,114 (76.6%) | 340 (23.4%) |
Health Insurance Coverage by Household Income in Wells Branch
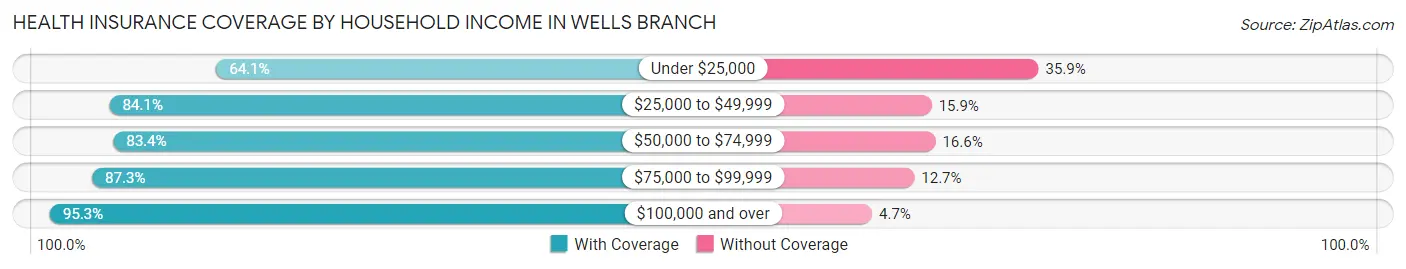
| Household Income | With Coverage | Without Coverage |
| Under $25,000 | 1,272 (64.1%) | 713 (35.9%) |
| $25,000 to $49,999 | 2,490 (84.1%) | 471 (15.9%) |
| $50,000 to $74,999 | 2,338 (83.4%) | 466 (16.6%) |
| $75,000 to $99,999 | 973 (87.3%) | 141 (12.7%) |
| $100,000 and over | 4,828 (95.3%) | 240 (4.7%) |
Public vs Private Health Insurance Coverage by Age in Wells Branch
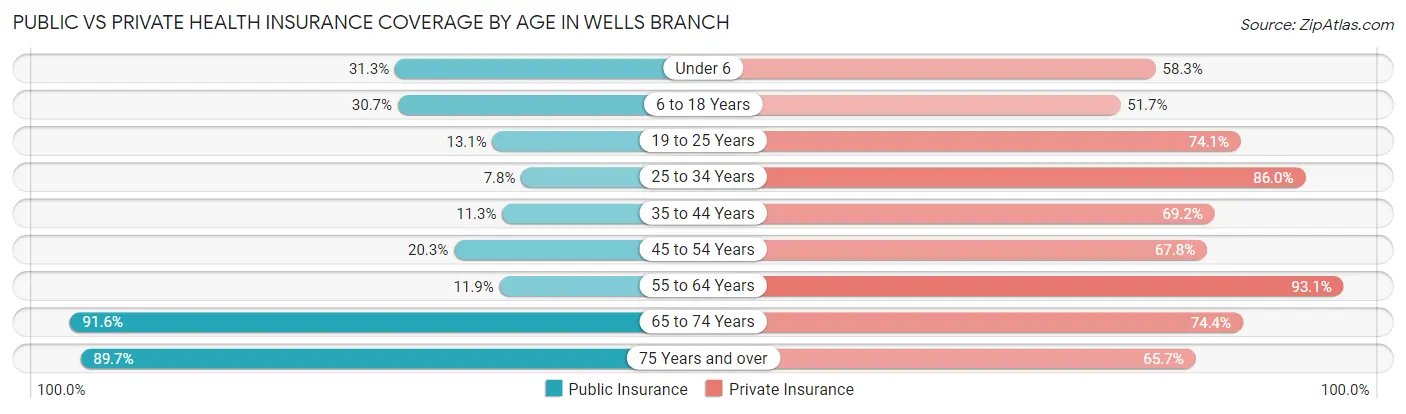
| Age Bracket | Public Insurance | Private Insurance |
| Under 6 | 396 (31.2%) | 738 (58.3%) |
| 6 to 18 Years | 407 (30.7%) | 685 (51.7%) |
| 19 to 25 Years | 191 (13.1%) | 1,077 (74.1%) |
| 25 to 34 Years | 231 (7.8%) | 2,548 (86.0%) |
| 35 to 44 Years | 337 (11.3%) | 2,058 (69.2%) |
| 45 to 54 Years | 358 (20.3%) | 1,196 (67.8%) |
| 55 to 64 Years | 107 (11.8%) | 841 (93.1%) |
| 65 to 74 Years | 821 (91.6%) | 667 (74.4%) |
| 75 Years and over | 355 (89.6%) | 260 (65.7%) |
| Total | 3,203 (23.0%) | 10,070 (72.2%) |
Disability Status by Sex by Age in Wells Branch
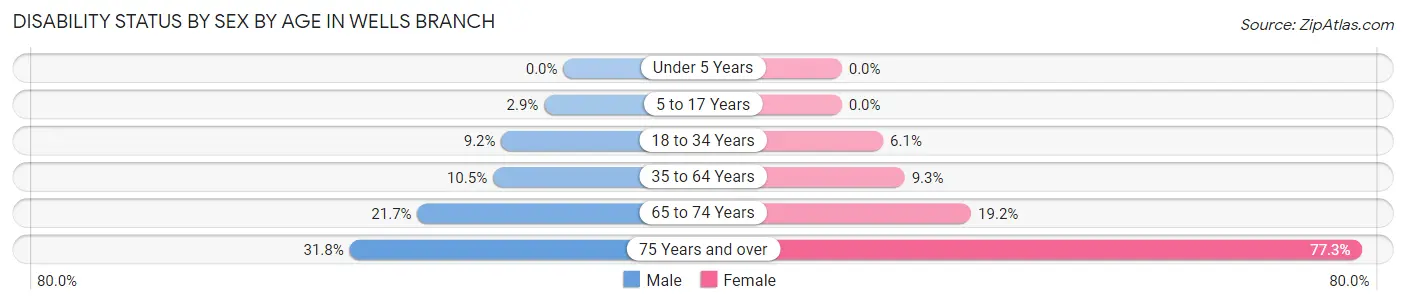
| Age Bracket | Male | Female |
| Under 5 Years | 0 (0.0%) | 0 (0.0%) |
| 5 to 17 Years | 25 (2.9%) | 0 (0.0%) |
| 18 to 34 Years | 195 (9.2%) | 142 (6.1%) |
| 35 to 64 Years | 341 (10.4%) | 222 (9.3%) |
| 65 to 74 Years | 96 (21.7%) | 87 (19.2%) |
| 75 Years and over | 60 (31.8%) | 160 (77.3%) |
Disability Class by Sex by Age in Wells Branch
Disability Class: Hearing Difficulty
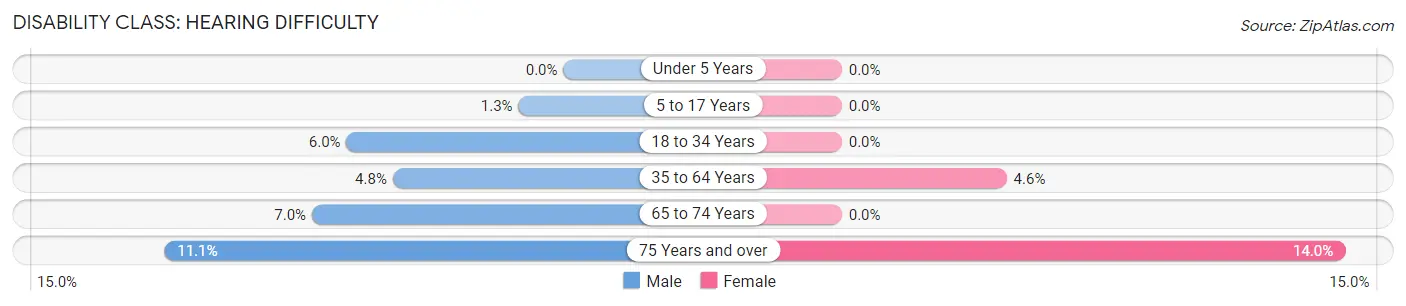
| Age Bracket | Male | Female |
| Under 5 Years | 0 (0.0%) | 0 (0.0%) |
| 5 to 17 Years | 11 (1.3%) | 0 (0.0%) |
| 18 to 34 Years | 128 (6.0%) | 0 (0.0%) |
| 35 to 64 Years | 155 (4.8%) | 109 (4.6%) |
| 65 to 74 Years | 31 (7.0%) | 0 (0.0%) |
| 75 Years and over | 21 (11.1%) | 29 (14.0%) |
Disability Class: Vision Difficulty
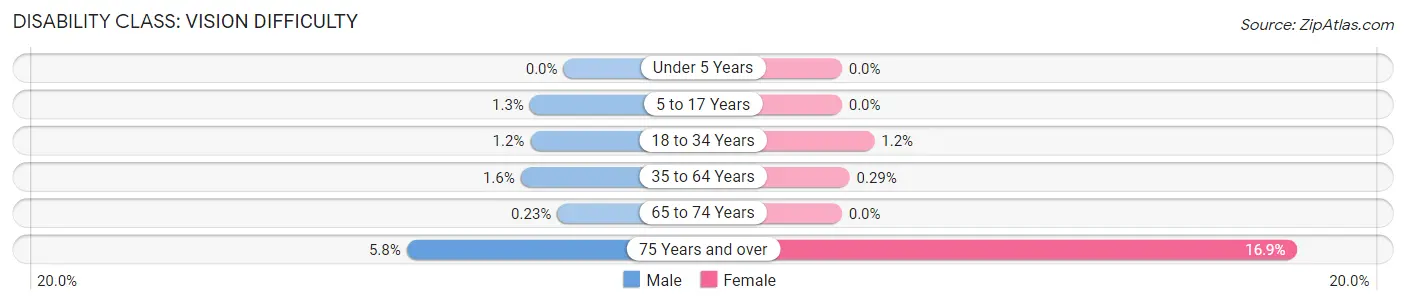
| Age Bracket | Male | Female |
| Under 5 Years | 0 (0.0%) | 0 (0.0%) |
| 5 to 17 Years | 11 (1.3%) | 0 (0.0%) |
| 18 to 34 Years | 26 (1.2%) | 28 (1.2%) |
| 35 to 64 Years | 52 (1.6%) | 7 (0.3%) |
| 65 to 74 Years | 1 (0.2%) | 0 (0.0%) |
| 75 Years and over | 11 (5.8%) | 35 (16.9%) |
Disability Class: Cognitive Difficulty
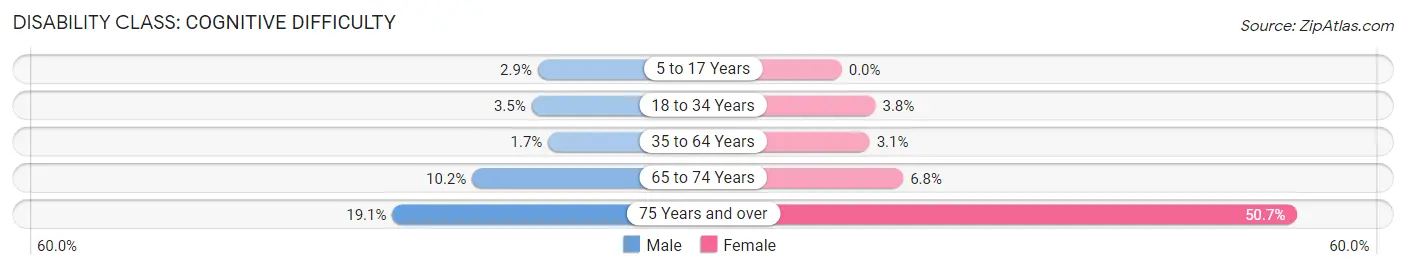
| Age Bracket | Male | Female |
| 5 to 17 Years | 25 (2.9%) | 0 (0.0%) |
| 18 to 34 Years | 75 (3.5%) | 87 (3.8%) |
| 35 to 64 Years | 55 (1.7%) | 74 (3.1%) |
| 65 to 74 Years | 45 (10.2%) | 31 (6.8%) |
| 75 Years and over | 36 (19.1%) | 105 (50.7%) |
Disability Class: Ambulatory Difficulty
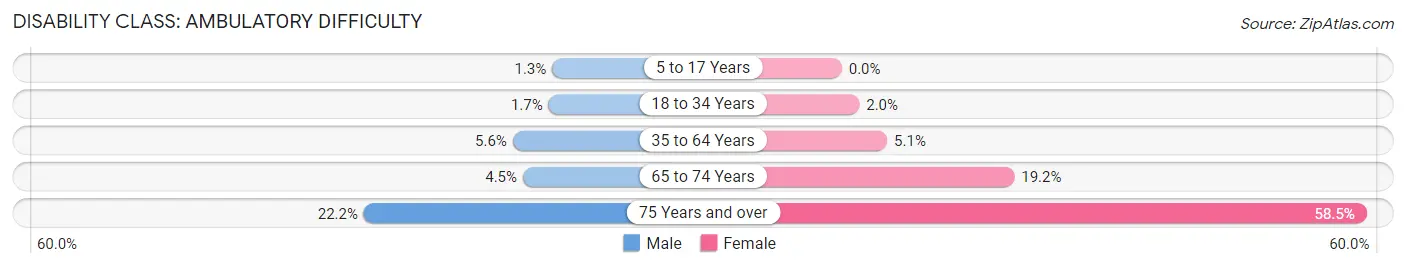
| Age Bracket | Male | Female |
| 5 to 17 Years | 11 (1.3%) | 0 (0.0%) |
| 18 to 34 Years | 35 (1.7%) | 45 (1.9%) |
| 35 to 64 Years | 184 (5.6%) | 120 (5.1%) |
| 65 to 74 Years | 20 (4.5%) | 87 (19.2%) |
| 75 Years and over | 42 (22.2%) | 121 (58.5%) |
Disability Class: Self-Care Difficulty
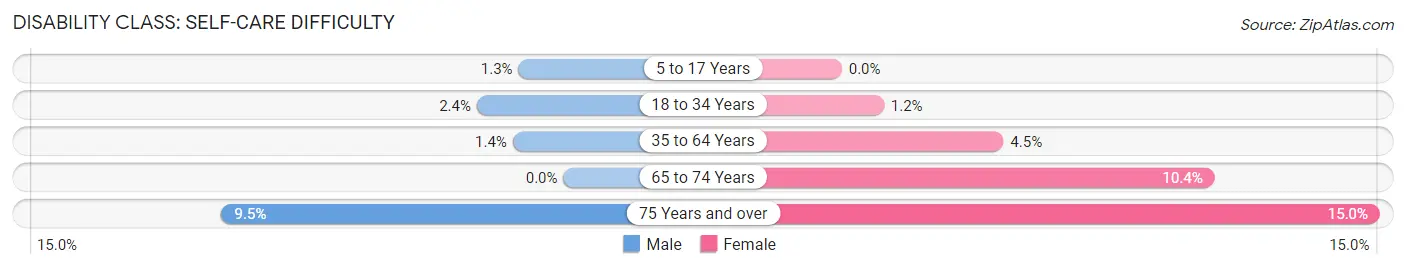
| Age Bracket | Male | Female |
| 5 to 17 Years | 11 (1.3%) | 0 (0.0%) |
| 18 to 34 Years | 51 (2.4%) | 27 (1.2%) |
| 35 to 64 Years | 46 (1.4%) | 107 (4.5%) |
| 65 to 74 Years | 0 (0.0%) | 47 (10.4%) |
| 75 Years and over | 18 (9.5%) | 31 (15.0%) |
Technology Access in Wells Branch
Computing Device Access in Wells Branch
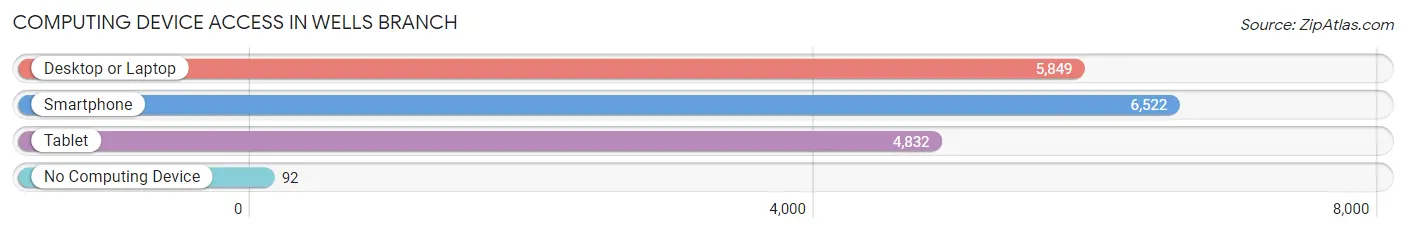
| Device Type | # Households | % Households |
| Desktop or Laptop | 5,849 | 83.7% |
| Smartphone | 6,522 | 93.3% |
| Tablet | 4,832 | 69.1% |
| No Computing Device | 92 | 1.3% |
| Total | 6,989 | 100.0% |
Internet Access in Wells Branch
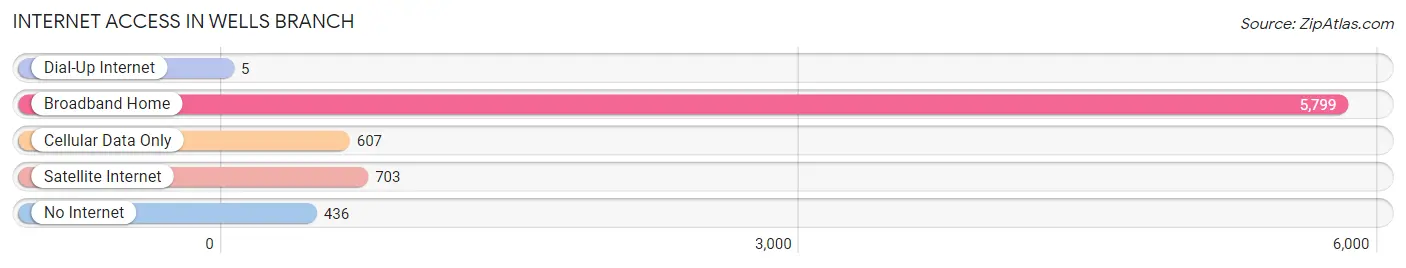
| Internet Type | # Households | % Households |
| Dial-Up Internet | 5 | 0.1% |
| Broadband Home | 5,799 | 83.0% |
| Cellular Data Only | 607 | 8.7% |
| Satellite Internet | 703 | 10.1% |
| No Internet | 436 | 6.2% |
| Total | 6,989 | 100.0% |
Wells Branch Summary
Wells Branch is a small city located in Travis County, Texas, United States. It is situated about 15 miles north of downtown Austin and is part of the Austin–Round Rock–San Marcos metropolitan area. The city was founded in the late 1970s and has since grown to a population of over 8,000 people.
History
The area that is now Wells Branch was originally inhabited by the Tonkawa tribe of Native Americans. The first European settlers arrived in the area in the early 1800s, and the area was officially established as Wells Branch in 1876. The city was named after the Wells family, who were among the first settlers in the area.
The city was initially a small farming community, but it began to grow in the late 1970s when the Austin-Round Rock-San Marcos metropolitan area began to expand. The city was officially incorporated in 1979, and the population has grown steadily since then.
Geography
Wells Branch is located in Travis County, Texas, about 15 miles north of downtown Austin. The city is situated on the western edge of the Balcones Escarpment, a geological formation that runs through central Texas. The city is bordered by the cities of Pflugerville to the north, Round Rock to the east, and Austin to the south and west.
The city has a total area of 4.3 square miles, all of which is land. The terrain is mostly flat, with some rolling hills in the northern part of the city. The climate is humid subtropical, with hot summers and mild winters.
Economy
The economy of Wells Branch is largely based on the service industry. The city is home to a number of businesses, including restaurants, retail stores, and professional services. The city is also home to several technology companies, including Dell, IBM, and Oracle.
The city is also home to several educational institutions, including Austin Community College and the University of Texas at Austin.
Demographics
As of the 2010 census, the population of Wells Branch was 8,092. The racial makeup of the city was 73.3% White, 11.2% African American, 0.7% Native American, 5.2% Asian, 0.1% Pacific Islander, 6.2% from other races, and 3.3% from two or more races. Hispanic or Latino of any race were 18.2% of the population.
The median household income in Wells Branch was $63,945, and the median family income was $71,945. The per capita income was $27,945. About 8.3% of families and 10.2% of the population were below the poverty line, including 14.2% of those under age 18 and 6.2% of those age 65 or over.
Wells Branch is served by the Pflugerville Independent School District. The city is home to Wells Branch Elementary School, Wells Branch Middle School, and Pflugerville High School.
Common Questions
What is Per Capita Income in Wells Branch?
Per Capita income in Wells Branch is $42,335.
What is the Median Family Income in Wells Branch?
Median Family Income in Wells Branch is $82,471.
What is the Median Household income in Wells Branch?
Median Household Income in Wells Branch is $59,992.
What is Income or Wage Gap in Wells Branch?
Income or Wage Gap in Wells Branch is 10.5%.
Women in Wells Branch earn 89.5 cents for every dollar earned by a man.
What is Family Income Deficit in Wells Branch?
Family Income Deficit in Wells Branch is $8,371.
Families that are below poverty line in Wells Branch earn $8,371 less on average than the poverty threshold level.
What is Inequality or Gini Index in Wells Branch?
Inequality or Gini Index in Wells Branch is 0.45.
What is the Total Population of Wells Branch?
Total Population of Wells Branch is 13,941.
What is the Total Male Population of Wells Branch?
Total Male Population of Wells Branch is 7,362.
What is the Total Female Population of Wells Branch?
Total Female Population of Wells Branch is 6,579.
What is the Ratio of Males per 100 Females in Wells Branch?
There are 111.90 Males per 100 Females in Wells Branch.
What is the Ratio of Females per 100 Males in Wells Branch?
There are 89.36 Females per 100 Males in Wells Branch.
What is the Median Population Age in Wells Branch?
Median Population Age in Wells Branch is 34.9 Years.
What is the Average Family Size in Wells Branch
Average Family Size in Wells Branch is 2.7 People.
What is the Average Household Size in Wells Branch
Average Household Size in Wells Branch is 2.0 People.
How Large is the Labor Force in Wells Branch?
There are 8,749 People in the Labor Forcein in Wells Branch.
What is the Percentage of People in the Labor Force in Wells Branch?
76.2% of People are in the Labor Force in Wells Branch.
What is the Unemployment Rate in Wells Branch?
Unemployment Rate in Wells Branch is 1.2%.