Zip Codes with the Highest Percentage of Population Employed in Computer, Engineering & Science in San Antonio, TX
RELATED REPORTS & OPTIONS
Computer, Engineering & Science
San Antonio
Compare Zip Codes
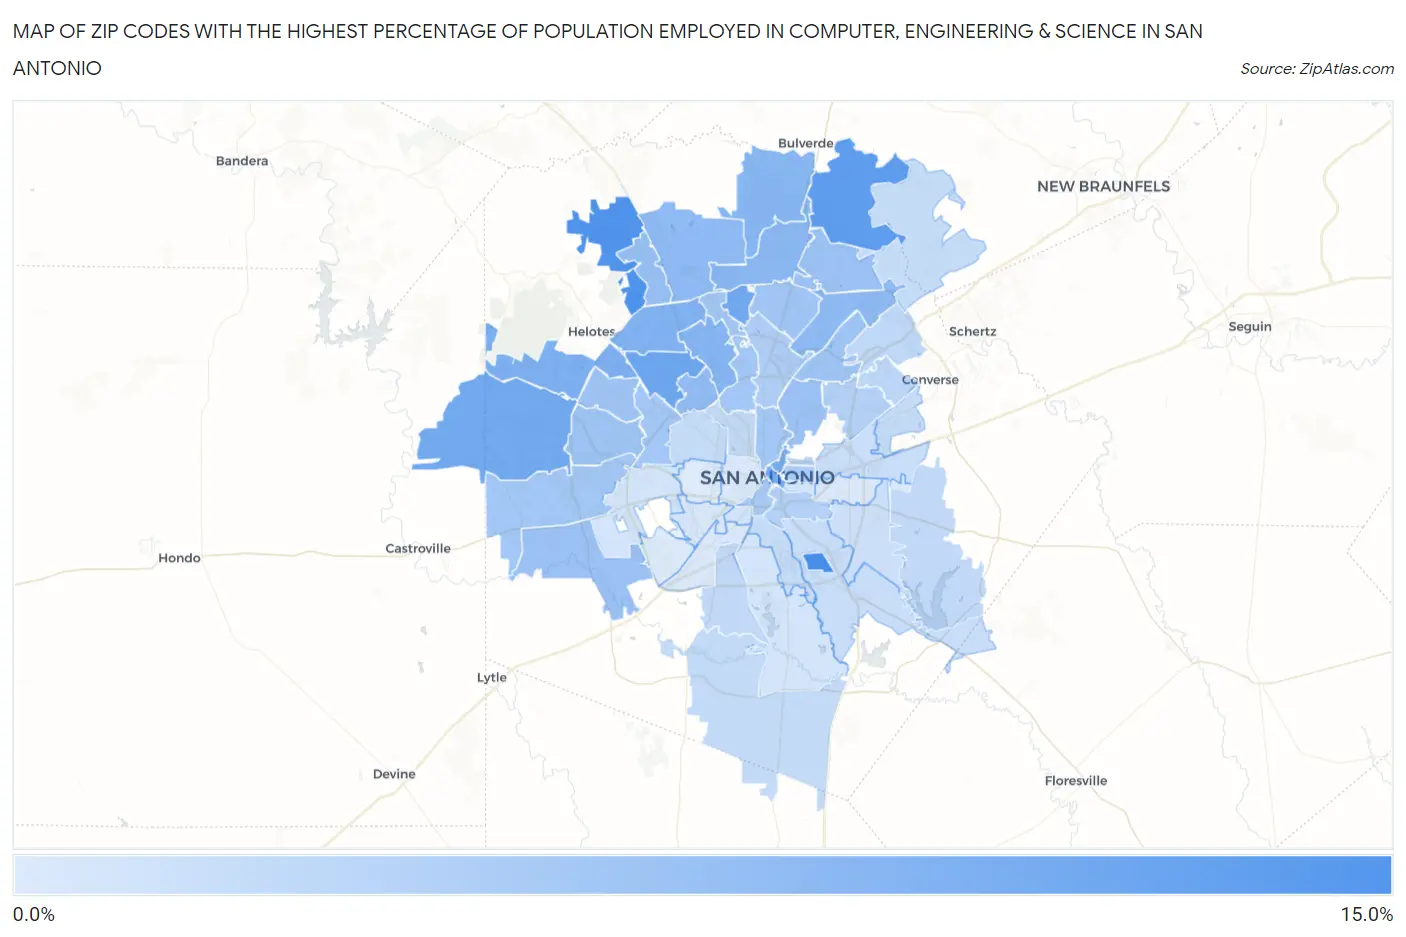
Map of Zip Codes with the Highest Percentage of Population Employed in Computer, Engineering & Science in San Antonio
0.81%
14.4%
Zip Codes with the Highest Percentage of Population Employed in Computer, Engineering & Science in San Antonio, TX
| Zip Code | % Employed | vs State | vs National | |
| 1. | 78235 | 14.4% | 6.5%(+7.87)#76 | 6.8%(+7.60)#1,251 |
| 2. | 78255 | 13.8% | 6.5%(+7.27)#90 | 6.8%(+7.00)#1,413 |
| 3. | 78261 | 12.2% | 6.5%(+5.75)#116 | 6.8%(+5.48)#1,923 |
| 4. | 78240 | 10.6% | 6.5%(+4.12)#167 | 6.8%(+3.86)#2,786 |
| 5. | 78253 | 10.3% | 6.5%(+3.77)#176 | 6.8%(+3.50)#3,018 |
| 6. | 78248 | 10.2% | 6.5%(+3.68)#178 | 6.8%(+3.41)#3,088 |
| 7. | 78205 | 10.0% | 6.5%(+3.51)#184 | 6.8%(+3.25)#3,205 |
| 8. | 78215 | 9.4% | 6.5%(+2.92)#207 | 6.8%(+2.65)#3,672 |
| 9. | 78254 | 9.2% | 6.5%(+2.72)#212 | 6.8%(+2.45)#3,845 |
| 10. | 78249 | 8.9% | 6.5%(+2.42)#227 | 6.8%(+2.15)#4,160 |
| 11. | 78230 | 8.5% | 6.5%(+2.00)#246 | 6.8%(+1.74)#4,600 |
| 12. | 78260 | 8.3% | 6.5%(+1.77)#261 | 6.8%(+1.51)#4,913 |
| 13. | 78258 | 8.1% | 6.5%(+1.61)#276 | 6.8%(+1.35)#5,107 |
| 14. | 78257 | 7.8% | 6.5%(+1.26)#297 | 6.8%(+0.994)#5,609 |
| 15. | 78247 | 7.7% | 6.5%(+1.16)#305 | 6.8%(+0.896)#5,738 |
| 16. | 78229 | 7.4% | 6.5%(+0.894)#328 | 6.8%(+0.629)#6,182 |
| 17. | 78256 | 6.8% | 6.5%(+0.345)#370 | 6.8%(+0.080)#7,077 |
| 18. | 78252 | 6.5% | 6.5%(-0.007)#411 | 6.8%(-0.271)#7,751 |
| 19. | 78259 | 6.5% | 6.5%(-0.041)#412 | 6.8%(-0.306)#7,822 |
| 20. | 78209 | 6.5% | 6.5%(-0.045)#413 | 6.8%(-0.309)#7,827 |
| 21. | 78217 | 6.2% | 6.5%(-0.254)#434 | 6.8%(-0.519)#8,243 |
| 22. | 78251 | 6.2% | 6.5%(-0.274)#437 | 6.8%(-0.538)#8,277 |
| 23. | 78250 | 6.1% | 6.5%(-0.432)#451 | 6.8%(-0.696)#8,667 |
| 24. | 78232 | 5.9% | 6.5%(-0.554)#467 | 6.8%(-0.818)#8,966 |
| 25. | 78212 | 5.9% | 6.5%(-0.584)#470 | 6.8%(-0.848)#9,029 |
| 26. | 78245 | 5.9% | 6.5%(-0.631)#473 | 6.8%(-0.895)#9,146 |
| 27. | 78213 | 5.8% | 6.5%(-0.700)#478 | 6.8%(-0.964)#9,299 |
| 28. | 78238 | 5.8% | 6.5%(-0.733)#484 | 6.8%(-0.997)#9,373 |
| 29. | 78231 | 5.8% | 6.5%(-0.746)#487 | 6.8%(-1.01)#9,414 |
| 30. | 78204 | 5.5% | 6.5%(-0.983)#521 | 6.8%(-1.25)#10,022 |
| 31. | 78202 | 4.9% | 6.5%(-1.57)#591 | 6.8%(-1.83)#11,562 |
| 32. | 78216 | 4.8% | 6.5%(-1.73)#611 | 6.8%(-2.00)#12,023 |
| 33. | 78210 | 4.4% | 6.5%(-2.11)#670 | 6.8%(-2.38)#13,210 |
| 34. | 78218 | 4.3% | 6.5%(-2.15)#678 | 6.8%(-2.42)#13,343 |
| 35. | 78208 | 3.9% | 6.5%(-2.58)#742 | 6.8%(-2.84)#14,743 |
| 36. | 78239 | 3.6% | 6.5%(-2.89)#804 | 6.8%(-3.15)#15,840 |
| 37. | 78233 | 3.3% | 6.5%(-3.19)#868 | 6.8%(-3.45)#16,963 |
| 38. | 78263 | 3.3% | 6.5%(-3.24)#880 | 6.8%(-3.50)#17,155 |
| 39. | 78224 | 3.2% | 6.5%(-3.25)#884 | 6.8%(-3.52)#17,236 |
| 40. | 78264 | 3.1% | 6.5%(-3.45)#924 | 6.8%(-3.71)#17,915 |
| 41. | 78201 | 2.9% | 6.5%(-3.56)#946 | 6.8%(-3.82)#18,309 |
| 42. | 78214 | 2.9% | 6.5%(-3.64)#957 | 6.8%(-3.90)#18,635 |
| 43. | 78266 | 2.9% | 6.5%(-3.65)#960 | 6.8%(-3.91)#18,672 |
| 44. | 78244 | 2.8% | 6.5%(-3.66)#962 | 6.8%(-3.93)#18,728 |
| 45. | 78228 | 2.8% | 6.5%(-3.70)#973 | 6.8%(-3.96)#18,864 |
| 46. | 78219 | 2.6% | 6.5%(-3.87)#1,012 | 6.8%(-4.14)#19,528 |
| 47. | 78223 | 2.6% | 6.5%(-3.87)#1,014 | 6.8%(-4.14)#19,538 |
| 48. | 78222 | 2.3% | 6.5%(-4.22)#1,102 | 6.8%(-4.48)#20,805 |
| 49. | 78225 | 1.8% | 6.5%(-4.70)#1,230 | 6.8%(-4.96)#22,582 |
| 50. | 78227 | 1.7% | 6.5%(-4.84)#1,261 | 6.8%(-5.10)#23,064 |
| 51. | 78221 | 1.6% | 6.5%(-4.85)#1,265 | 6.8%(-5.12)#23,114 |
| 52. | 78203 | 1.5% | 6.5%(-4.97)#1,293 | 6.8%(-5.23)#23,495 |
| 53. | 78226 | 1.2% | 6.5%(-5.30)#1,365 | 6.8%(-5.57)#24,501 |
| 54. | 78211 | 1.0% | 6.5%(-5.49)#1,415 | 6.8%(-5.75)#25,007 |
| 55. | 78207 | 0.98% | 6.5%(-5.52)#1,424 | 6.8%(-5.79)#25,114 |
| 56. | 78220 | 0.92% | 6.5%(-5.58)#1,433 | 6.8%(-5.85)#25,263 |
| 57. | 78237 | 0.84% | 6.5%(-5.66)#1,451 | 6.8%(-5.92)#25,467 |
| 58. | 78242 | 0.81% | 6.5%(-5.69)#1,455 | 6.8%(-5.95)#25,548 |
1
Common Questions
What are the Top 10 Zip Codes with the Highest Percentage of Population Employed in Computer, Engineering & Science in San Antonio, TX?
Top 10 Zip Codes with the Highest Percentage of Population Employed in Computer, Engineering & Science in San Antonio, TX are:
What zip code has the Highest Percentage of Population Employed in Computer, Engineering & Science in San Antonio, TX?
78235 has the Highest Percentage of Population Employed in Computer, Engineering & Science in San Antonio, TX with 14.4%.
What is the Percentage of Population Employed in Computer, Engineering & Science in San Antonio, TX?
Percentage of Population Employed in Computer, Engineering & Science in San Antonio is 5.3%.
What is the Percentage of Population Employed in Computer, Engineering & Science in Texas?
Percentage of Population Employed in Computer, Engineering & Science in Texas is 6.5%.
What is the Percentage of Population Employed in Computer, Engineering & Science in the United States?
Percentage of Population Employed in Computer, Engineering & Science in the United States is 6.8%.