Zip Codes with the Highest Percentage of Population Employed in Computer, Engineering & Science in Henderson, TX
RELATED REPORTS & OPTIONS
Computer, Engineering & Science
Henderson
Compare Zip Codes
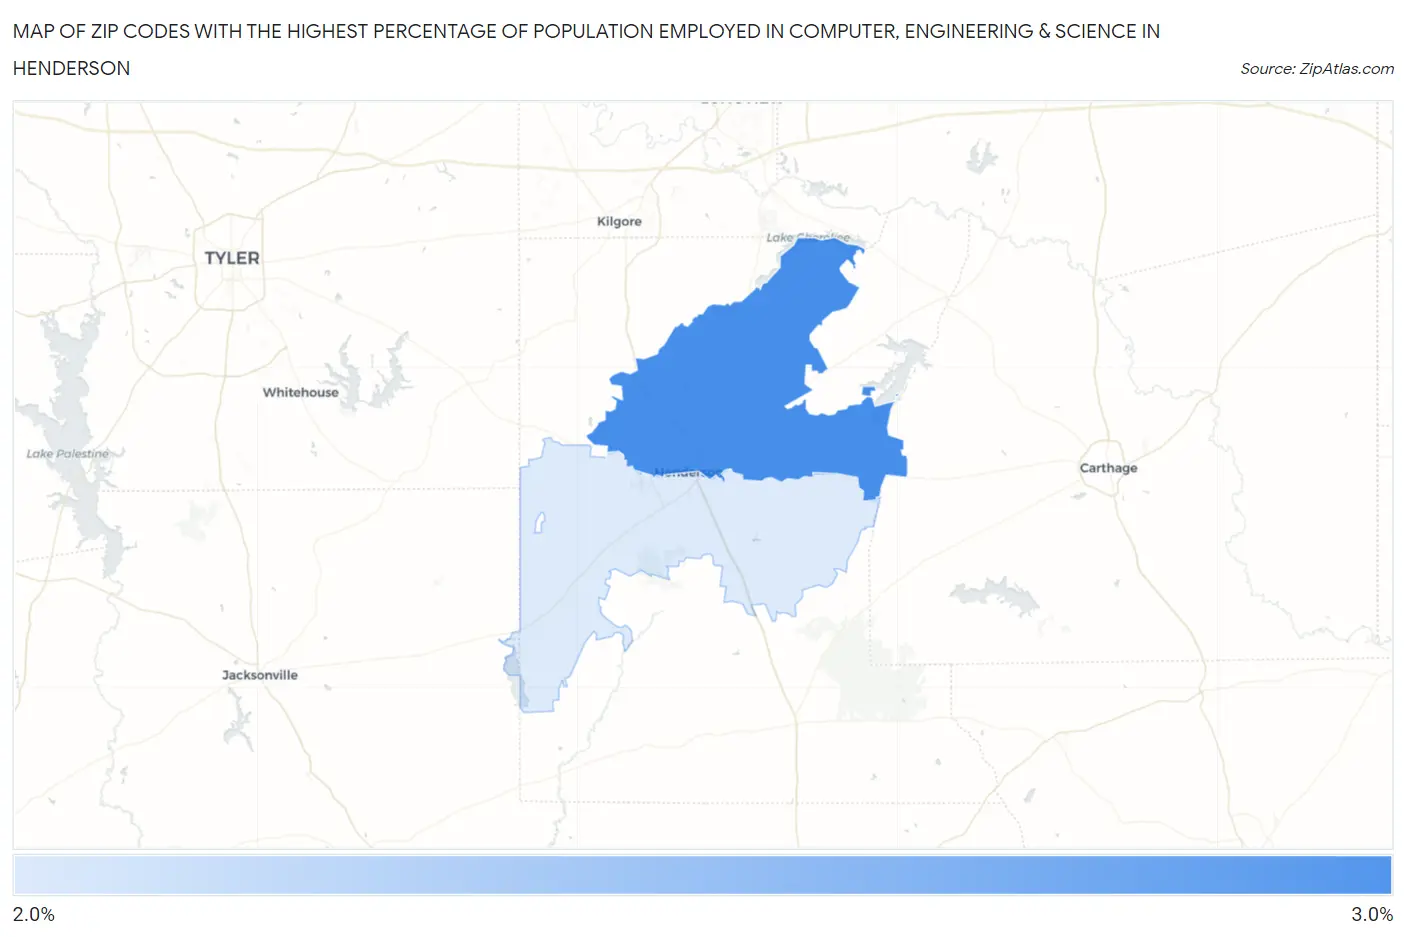
Map of Zip Codes with the Highest Percentage of Population Employed in Computer, Engineering & Science in Henderson
2.2%
3.0%
Zip Codes with the Highest Percentage of Population Employed in Computer, Engineering & Science in Henderson, TX
| Zip Code | % Employed | vs State | vs National | |
| 1. | 75652 | 3.0% | 6.5%(-3.52)#942 | 6.8%(-3.78)#18,174 |
| 2. | 75654 | 2.2% | 6.5%(-4.31)#1,125 | 6.8%(-4.57)#21,125 |
1
Common Questions
What are the Top Zip Codes with the Highest Percentage of Population Employed in Computer, Engineering & Science in Henderson, TX?
Top Zip Codes with the Highest Percentage of Population Employed in Computer, Engineering & Science in Henderson, TX are:
What zip code has the Highest Percentage of Population Employed in Computer, Engineering & Science in Henderson, TX?
75652 has the Highest Percentage of Population Employed in Computer, Engineering & Science in Henderson, TX with 3.0%.
What is the Percentage of Population Employed in Computer, Engineering & Science in Henderson, TX?
Percentage of Population Employed in Computer, Engineering & Science in Henderson is 2.0%.
What is the Percentage of Population Employed in Computer, Engineering & Science in Texas?
Percentage of Population Employed in Computer, Engineering & Science in Texas is 6.5%.
What is the Percentage of Population Employed in Computer, Engineering & Science in the United States?
Percentage of Population Employed in Computer, Engineering & Science in the United States is 6.8%.