Zip Codes with the Highest Percentage of Population Employed in Computer, Engineering & Science in Mcallen, TX
RELATED REPORTS & OPTIONS
Computer, Engineering & Science
Mcallen
Compare Zip Codes
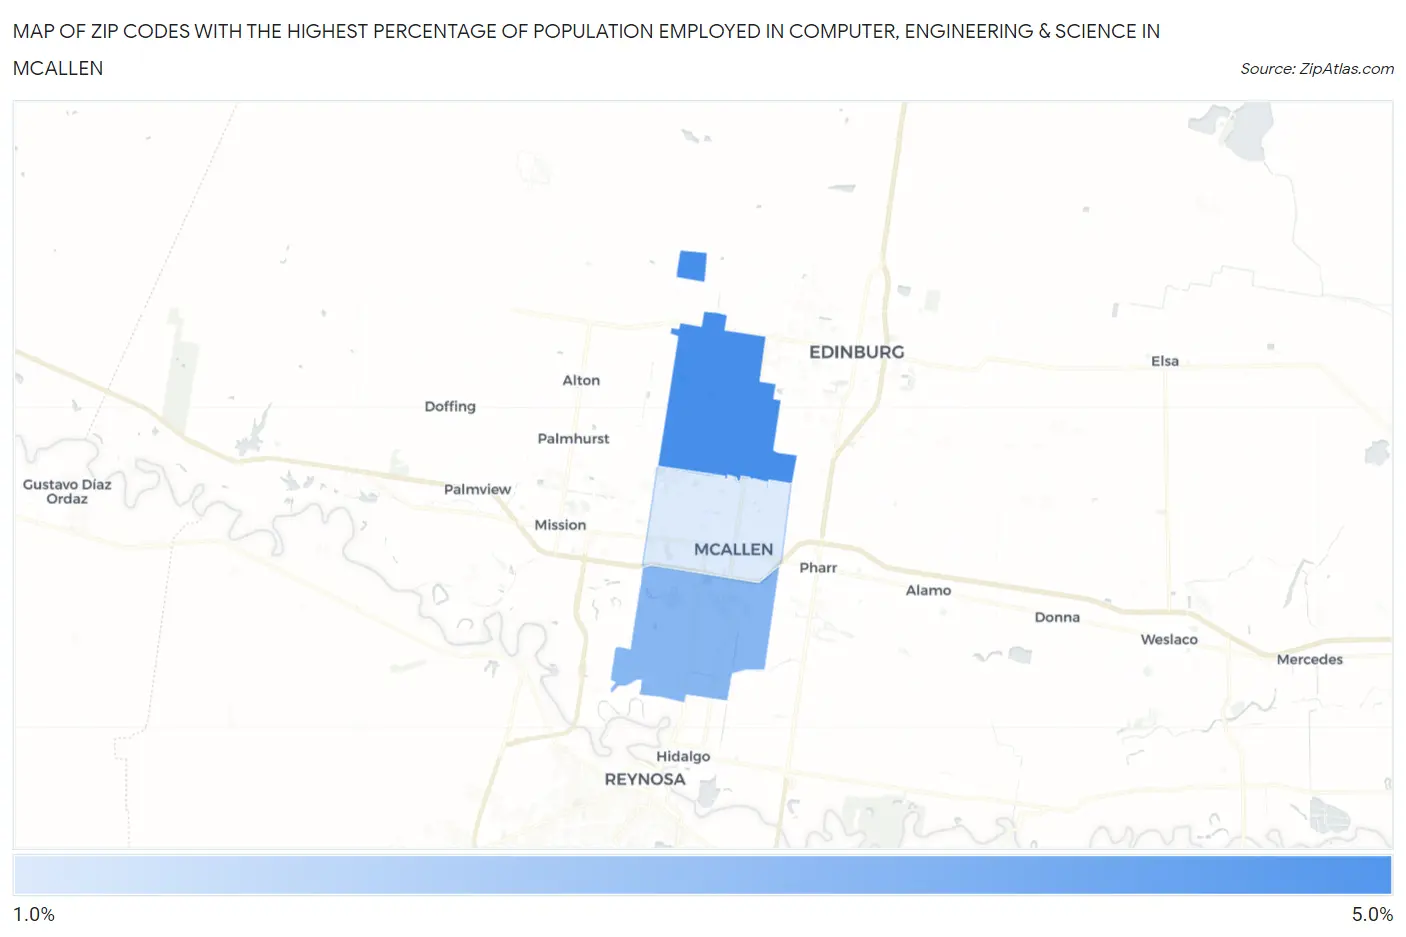
Map of Zip Codes with the Highest Percentage of Population Employed in Computer, Engineering & Science in Mcallen
1.5%
4.2%
Zip Codes with the Highest Percentage of Population Employed in Computer, Engineering & Science in Mcallen, TX
| Zip Code | % Employed | vs State | vs National | |
| 1. | 78504 | 4.2% | 6.5%(-2.27)#700 | 6.8%(-2.53)#13,737 |
| 2. | 78503 | 3.1% | 6.5%(-3.43)#921 | 6.8%(-3.70)#17,868 |
| 3. | 78501 | 1.5% | 6.5%(-5.00)#1,297 | 6.8%(-5.26)#23,605 |
1
Common Questions
What are the Top Zip Codes with the Highest Percentage of Population Employed in Computer, Engineering & Science in Mcallen, TX?
Top Zip Codes with the Highest Percentage of Population Employed in Computer, Engineering & Science in Mcallen, TX are:
What zip code has the Highest Percentage of Population Employed in Computer, Engineering & Science in Mcallen, TX?
78504 has the Highest Percentage of Population Employed in Computer, Engineering & Science in Mcallen, TX with 4.2%.
What is the Percentage of Population Employed in Computer, Engineering & Science in Mcallen, TX?
Percentage of Population Employed in Computer, Engineering & Science in Mcallen is 2.7%.
What is the Percentage of Population Employed in Computer, Engineering & Science in Texas?
Percentage of Population Employed in Computer, Engineering & Science in Texas is 6.5%.
What is the Percentage of Population Employed in Computer, Engineering & Science in the United States?
Percentage of Population Employed in Computer, Engineering & Science in the United States is 6.8%.