Volente, TX Map & Demographics
Volente Map
Volente Overview
$87,569
PER CAPITA INCOME
$197,813
AVG FAMILY INCOME
$132,500
AVG HOUSEHOLD INCOME
58.0%
WAGE / INCOME GAP [ % ]
42.0¢/ $1
WAGE / INCOME GAP [ $ ]
$14,821
FAMILY INCOME DEFICIT
0.54
INEQUALITY / GINI INDEX
779
TOTAL POPULATION
393
MALE POPULATION
386
FEMALE POPULATION
101.81
MALES / 100 FEMALES
98.22
FEMALES / 100 MALES
46.3
MEDIAN AGE
3.0
AVG FAMILY SIZE
2.4
AVG HOUSEHOLD SIZE
379
LABOR FORCE [ PEOPLE ]
61.0%
PERCENT IN LABOR FORCE
6.6%
UNEMPLOYMENT RATE
Income in Volente
Income Overview in Volente
Per Capita Income in Volente is $87,569, while median incomes of families and households are $197,813 and $132,500 respectively.
| Characteristic | Number | Measure |
| Per Capita Income | 779 | $87,569 |
| Median Family Income | 225 | $197,813 |
| Mean Family Income | 225 | $263,299 |
| Median Household Income | 320 | $132,500 |
| Mean Household Income | 320 | $212,839 |
| Income Deficit | 225 | $14,821 |
| Wage / Income Gap (%) | 779 | 58.04% |
| Wage / Income Gap ($) | 779 | 41.96¢ per $1 |
| Gini / Inequality Index | 779 | 0.54 |
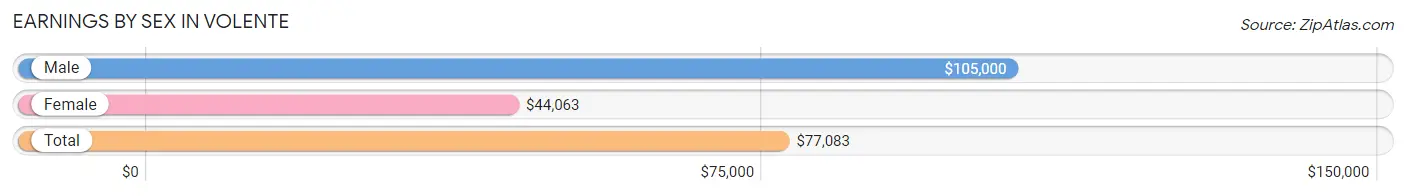
Earnings by Sex in Volente
Average Earnings in Volente are $77,083, $105,000 for men and $44,063 for women, a difference of 58.0%.
| Sex | Number | Average Earnings |
| Male | 228 (57.9%) | $105,000 |
| Female | 166 (42.1%) | $44,063 |
| Total | 394 (100.0%) | $77,083 |
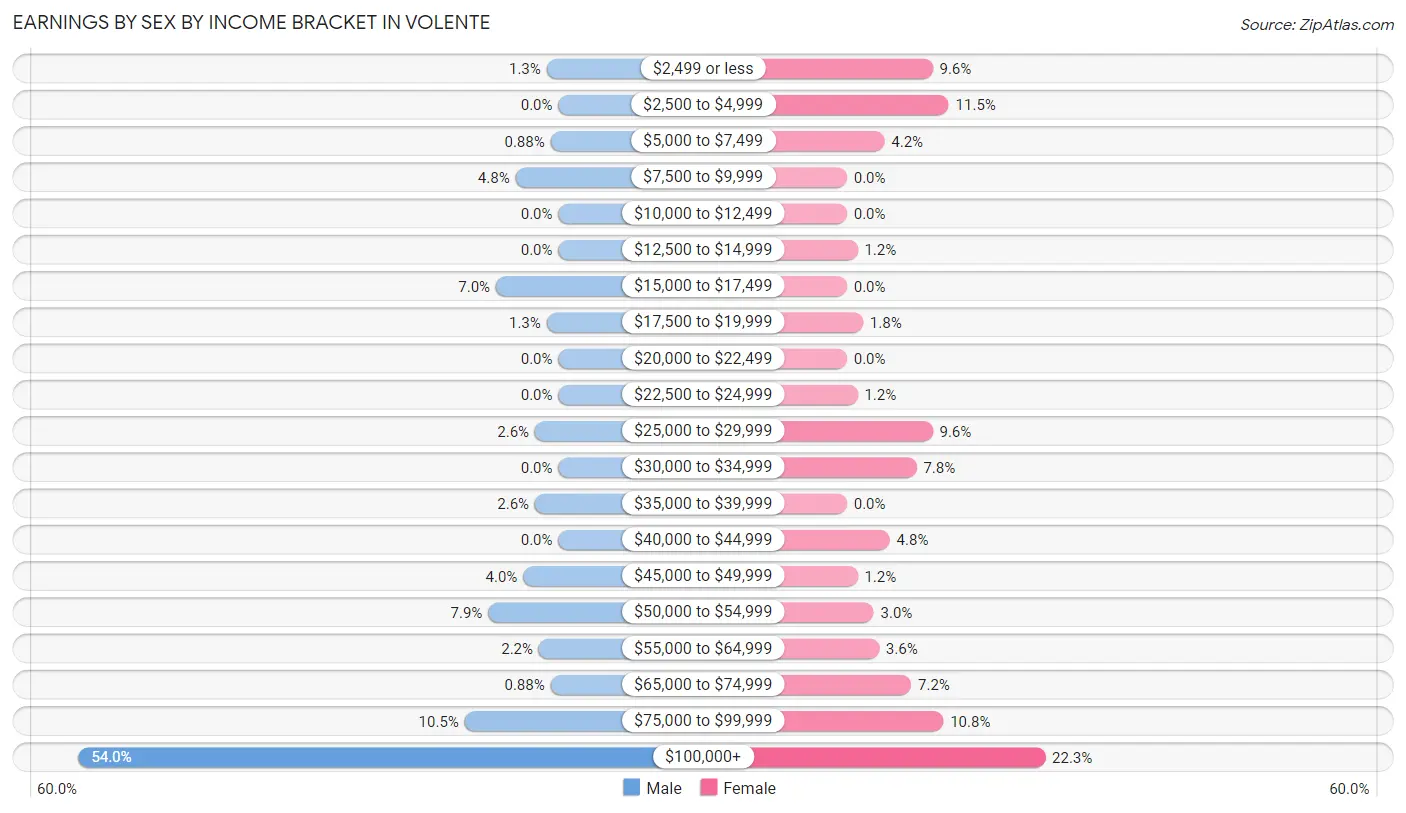
Earnings by Sex by Income Bracket in Volente
The most common earnings brackets in Volente are $100,000+ for men (123 | 53.9%) and $100,000+ for women (37 | 22.3%).
| Income | Male | Female |
| $2,499 or less | 3 (1.3%) | 16 (9.6%) |
| $2,500 to $4,999 | 0 (0.0%) | 19 (11.5%) |
| $5,000 to $7,499 | 2 (0.9%) | 7 (4.2%) |
| $7,500 to $9,999 | 11 (4.8%) | 0 (0.0%) |
| $10,000 to $12,499 | 0 (0.0%) | 0 (0.0%) |
| $12,500 to $14,999 | 0 (0.0%) | 2 (1.2%) |
| $15,000 to $17,499 | 16 (7.0%) | 0 (0.0%) |
| $17,500 to $19,999 | 3 (1.3%) | 3 (1.8%) |
| $20,000 to $22,499 | 0 (0.0%) | 0 (0.0%) |
| $22,500 to $24,999 | 0 (0.0%) | 2 (1.2%) |
| $25,000 to $29,999 | 6 (2.6%) | 16 (9.6%) |
| $30,000 to $34,999 | 0 (0.0%) | 13 (7.8%) |
| $35,000 to $39,999 | 6 (2.6%) | 0 (0.0%) |
| $40,000 to $44,999 | 0 (0.0%) | 8 (4.8%) |
| $45,000 to $49,999 | 9 (4.0%) | 2 (1.2%) |
| $50,000 to $54,999 | 18 (7.9%) | 5 (3.0%) |
| $55,000 to $64,999 | 5 (2.2%) | 6 (3.6%) |
| $65,000 to $74,999 | 2 (0.9%) | 12 (7.2%) |
| $75,000 to $99,999 | 24 (10.5%) | 18 (10.8%) |
| $100,000+ | 123 (53.9%) | 37 (22.3%) |
| Total | 228 (100.0%) | 166 (100.0%) |
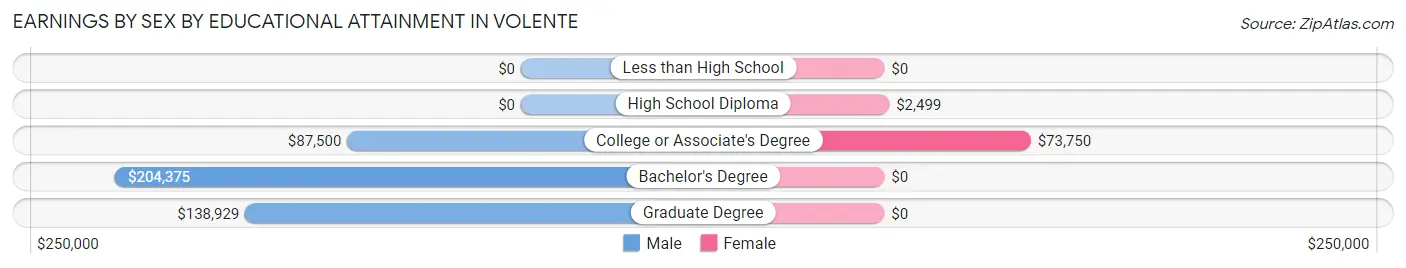
Earnings by Sex by Educational Attainment in Volente
Average earnings in Volente are $124,000 for men and $61,875 for women, a difference of 50.1%. Men with an educational attainment of bachelor's degree enjoy the highest average annual earnings of $204,375, while those with college or associate's degree education earn the least with $87,500. Women with an educational attainment of college or associate's degree earn the most with the average annual earnings of $73,750, while those with high school diploma education have the smallest earnings of $2,499.
| Educational Attainment | Male Income | Female Income |
| Less than High School | - | - |
| High School Diploma | - | - |
| College or Associate's Degree | $87,500 | $73,750 |
| Bachelor's Degree | $204,375 | $0 |
| Graduate Degree | $138,929 | $0 |
| Total | $124,000 | $61,875 |
Family Income in Volente
Family Income Brackets in Volente
According to the Volente family income data, there are 109 families falling into the $200,000+ income range, which is the most common income bracket and makes up 48.4% of all families. Conversely, the $25,000 to $34,999 income bracket is the least frequent group with only 2 families (0.9%) belonging to this category.
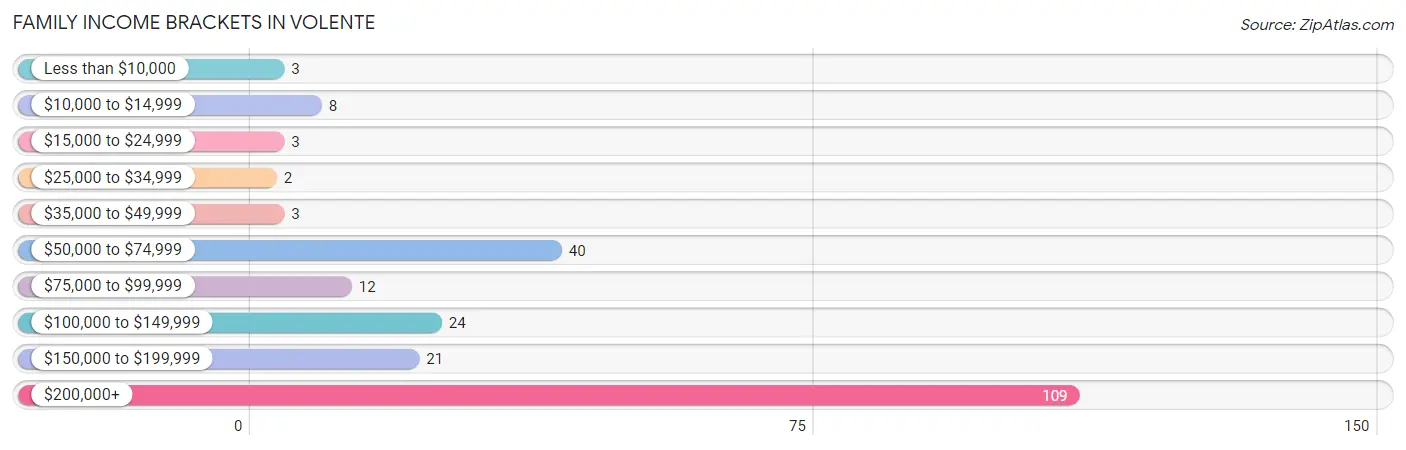
| Income Bracket | # Families | % Families |
| Less than $10,000 | 3 | 1.3% |
| $10,000 to $14,999 | 8 | 3.6% |
| $15,000 to $24,999 | 3 | 1.3% |
| $25,000 to $34,999 | 2 | 0.9% |
| $35,000 to $49,999 | 3 | 1.3% |
| $50,000 to $74,999 | 40 | 17.8% |
| $75,000 to $99,999 | 12 | 5.3% |
| $100,000 to $149,999 | 24 | 10.7% |
| $150,000 to $199,999 | 21 | 9.3% |
| $200,000+ | 109 | 48.4% |
Family Income by Famaliy Size in Volente
4-person families (60 | 26.7%) account for the highest median family income in Volente with $211,667 per family, while 2-person families (92 | 40.9%) have the highest median income of $74,584 per family member.
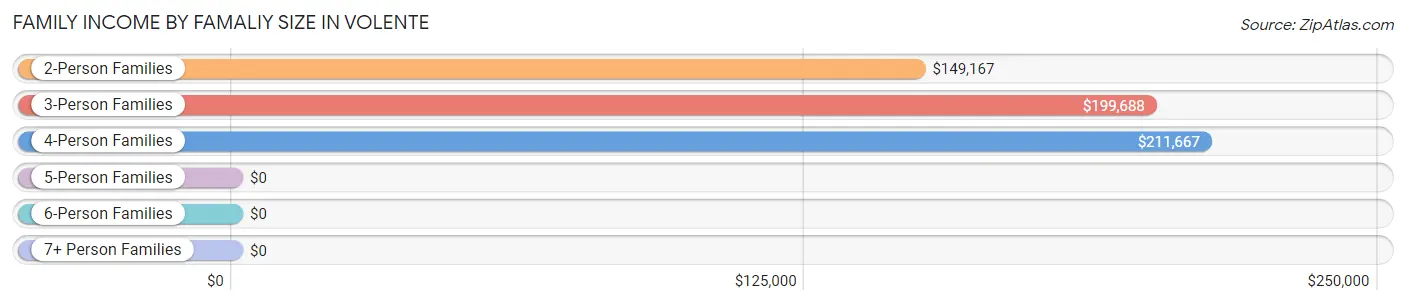
| Income Bracket | # Families | Median Income |
| 2-Person Families | 92 (40.9%) | $149,167 |
| 3-Person Families | 61 (27.1%) | $199,688 |
| 4-Person Families | 60 (26.7%) | $211,667 |
| 5-Person Families | 6 (2.7%) | $0 |
| 6-Person Families | 0 (0.0%) | $0 |
| 7+ Person Families | 6 (2.7%) | $0 |
| Total | 225 (100.0%) | $197,813 |
Family Income by Number of Earners in Volente
The median family income in Volente is $197,813, with families comprising 2 earners (74) having the highest median family income of $250,001, while families with 1 earner (97) have the lowest median family income of $86,094, accounting for 32.9% and 43.1% of families, respectively.
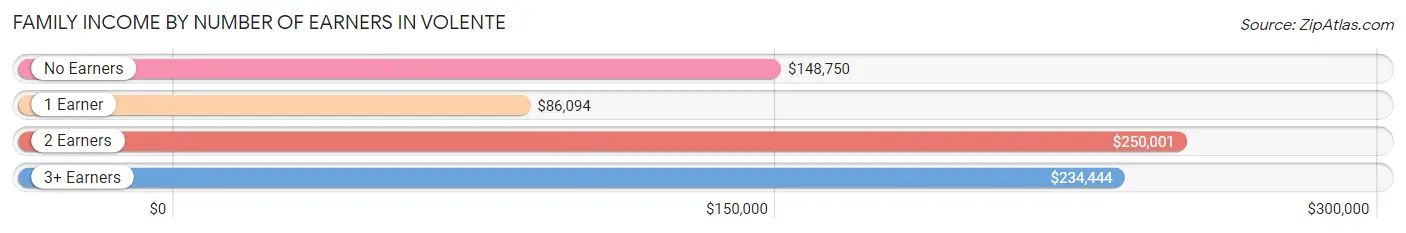
| Number of Earners | # Families | Median Income |
| No Earners | 24 (10.7%) | $148,750 |
| 1 Earner | 97 (43.1%) | $86,094 |
| 2 Earners | 74 (32.9%) | $250,001 |
| 3+ Earners | 30 (13.3%) | $234,444 |
| Total | 225 (100.0%) | $197,813 |
Household Income in Volente
Household Income Brackets in Volente
With 123 households falling in the category, the $200,000+ income range is the most frequent in Volente, accounting for 38.4% of all households. In contrast, only 3 households (0.9%) fall into the $15,000 to $24,999 income bracket, making it the least populous group.
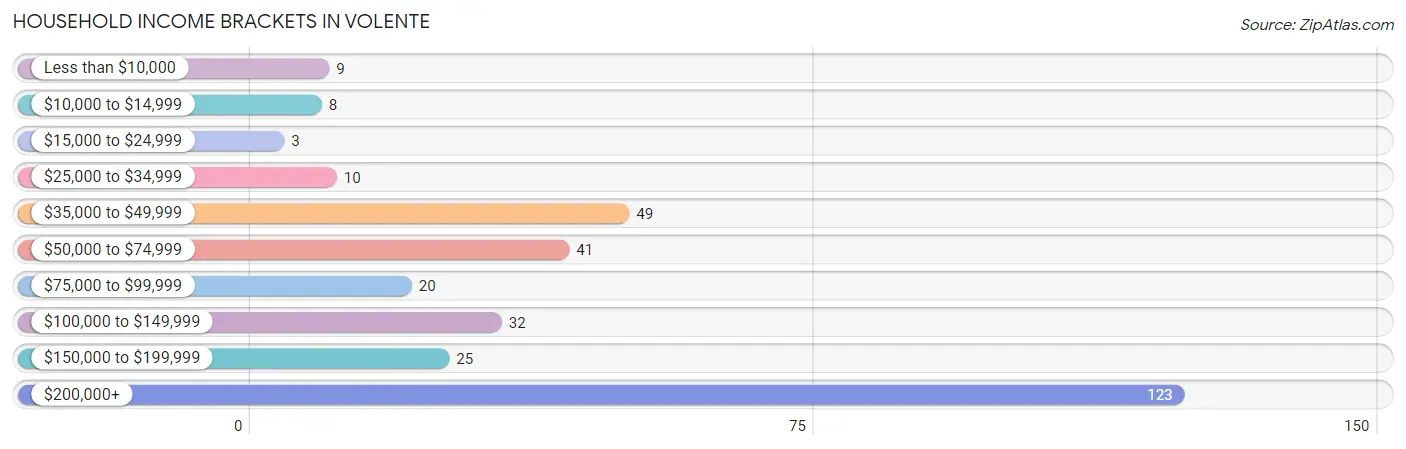
| Income Bracket | # Households | % Households |
| Less than $10,000 | 9 | 2.8% |
| $10,000 to $14,999 | 8 | 2.5% |
| $15,000 to $24,999 | 3 | 0.9% |
| $25,000 to $34,999 | 10 | 3.1% |
| $35,000 to $49,999 | 49 | 15.3% |
| $50,000 to $74,999 | 41 | 12.8% |
| $75,000 to $99,999 | 20 | 6.3% |
| $100,000 to $149,999 | 32 | 10.0% |
| $150,000 to $199,999 | 25 | 7.8% |
| $200,000+ | 123 | 38.4% |
Household Income by Householder Age in Volente
The median household income in Volente is $132,500, with the highest median household income of $199,844 found in the 45 to 64 years age bracket for the primary householder. A total of 155 households (48.4%) fall into this category. Meanwhile, the 15 to 24 years age bracket for the primary householder has the lowest median household income of $0, with 3 households (0.9%) in this group.
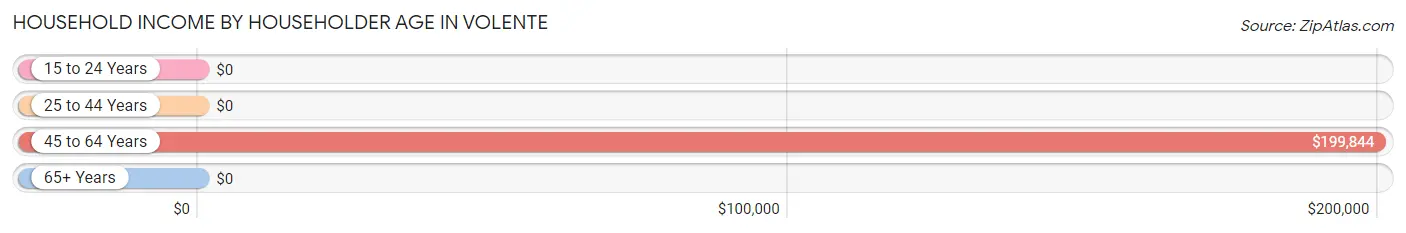
| Income Bracket | # Households | Median Income |
| 15 to 24 Years | 3 (0.9%) | $0 |
| 25 to 44 Years | 86 (26.9%) | $0 |
| 45 to 64 Years | 155 (48.4%) | $199,844 |
| 65+ Years | 76 (23.7%) | $0 |
| Total | 320 (100.0%) | $132,500 |
Poverty in Volente
Income Below Poverty by Sex and Age in Volente
With 6.9% poverty level for males and 7.8% for females among the residents of Volente, 25 to 34 year old males and 5 year old females are the most vulnerable to poverty, with 9 males (31.0%) and 8 females (100.0%) in their respective age groups living below the poverty level.
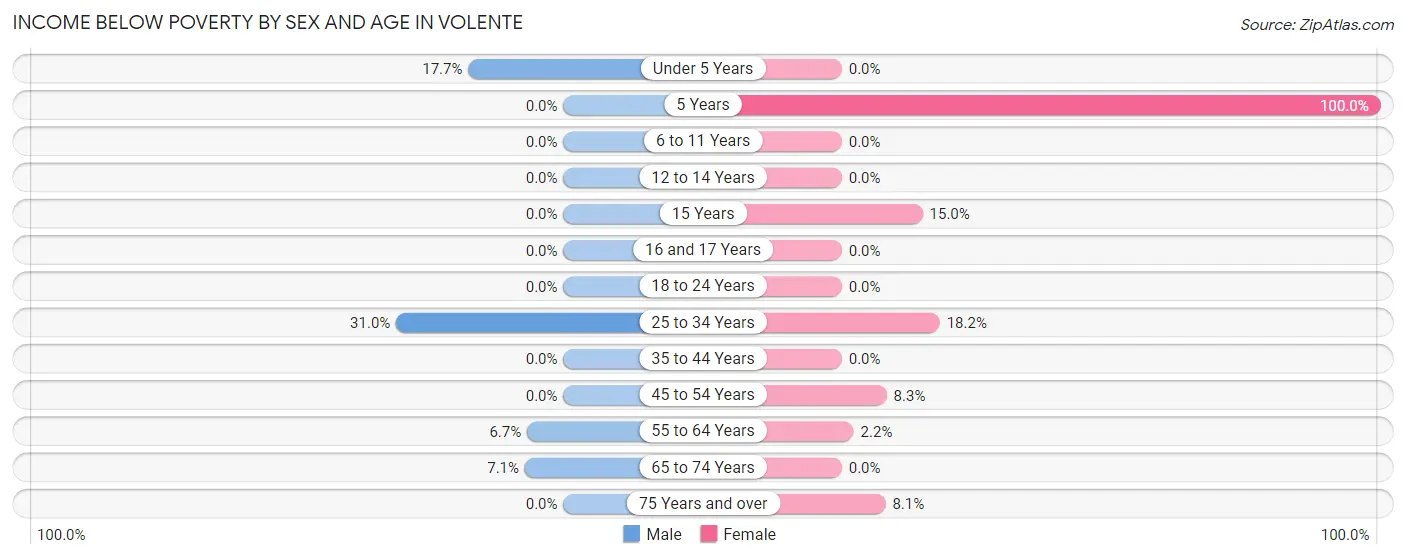
| Age Bracket | Male | Female |
| Under 5 Years | 9 (17.6%) | 0 (0.0%) |
| 5 Years | 0 (0.0%) | 8 (100.0%) |
| 6 to 11 Years | 0 (0.0%) | 0 (0.0%) |
| 12 to 14 Years | 0 (0.0%) | 0 (0.0%) |
| 15 Years | 0 (0.0%) | 3 (15.0%) |
| 16 and 17 Years | 0 (0.0%) | 0 (0.0%) |
| 18 to 24 Years | 0 (0.0%) | 0 (0.0%) |
| 25 to 34 Years | 9 (31.0%) | 8 (18.2%) |
| 35 to 44 Years | 0 (0.0%) | 0 (0.0%) |
| 45 to 54 Years | 0 (0.0%) | 6 (8.3%) |
| 55 to 64 Years | 6 (6.7%) | 2 (2.2%) |
| 65 to 74 Years | 3 (7.1%) | 0 (0.0%) |
| 75 Years and over | 0 (0.0%) | 3 (8.1%) |
| Total | 27 (6.9%) | 30 (7.8%) |
Income Above Poverty by Sex and Age in Volente
According to the poverty statistics in Volente, males aged 5 years and females aged under 5 years are the age groups that are most secure financially, with 100.0% of males and 100.0% of females in these age groups living above the poverty line.
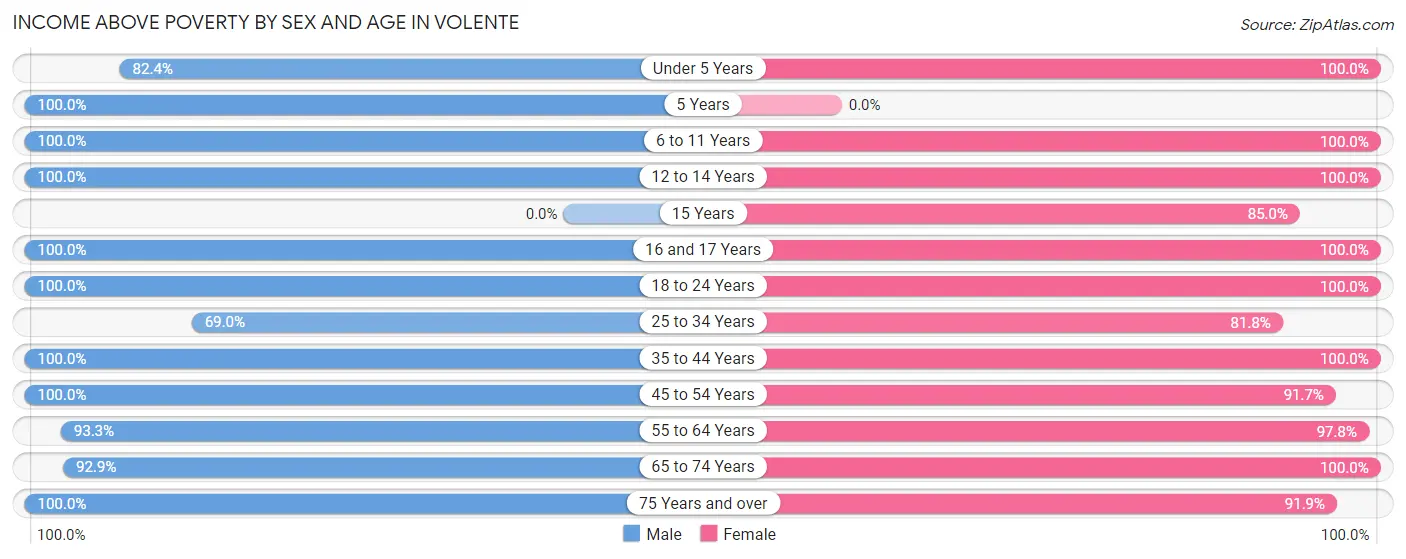
| Age Bracket | Male | Female |
| Under 5 Years | 42 (82.4%) | 7 (100.0%) |
| 5 Years | 3 (100.0%) | 0 (0.0%) |
| 6 to 11 Years | 27 (100.0%) | 16 (100.0%) |
| 12 to 14 Years | 9 (100.0%) | 17 (100.0%) |
| 15 Years | 0 (0.0%) | 17 (85.0%) |
| 16 and 17 Years | 6 (100.0%) | 12 (100.0%) |
| 18 to 24 Years | 36 (100.0%) | 18 (100.0%) |
| 25 to 34 Years | 20 (69.0%) | 36 (81.8%) |
| 35 to 44 Years | 50 (100.0%) | 27 (100.0%) |
| 45 to 54 Years | 39 (100.0%) | 66 (91.7%) |
| 55 to 64 Years | 83 (93.3%) | 89 (97.8%) |
| 65 to 74 Years | 39 (92.9%) | 17 (100.0%) |
| 75 Years and over | 12 (100.0%) | 34 (91.9%) |
| Total | 366 (93.1%) | 356 (92.2%) |
Income Below Poverty Among Married-Couple Families in Volente
The poverty statistics for married-couple families in Volente show that 7.3% or 14 of the total 191 families live below the poverty line. Families with 1 or 2 children have the highest poverty rate of 13.1%, comprising of 11 families. On the other hand, families with 3 or 4 children have the lowest poverty rate of 0.0%, which includes 0 families.
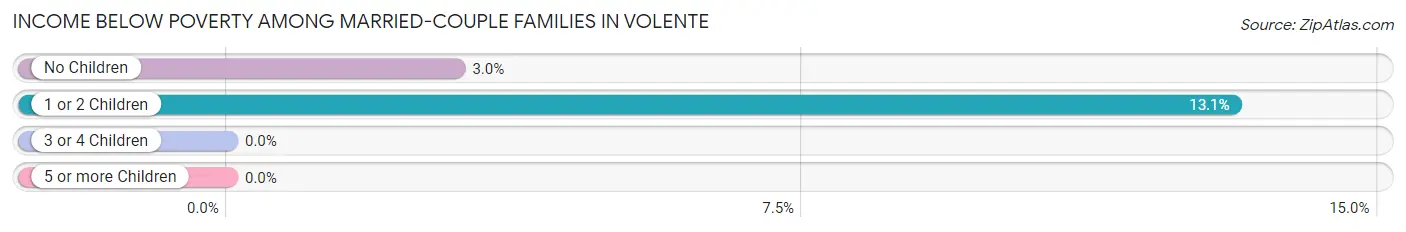
| Children | Above Poverty | Below Poverty |
| No Children | 98 (97.0%) | 3 (3.0%) |
| 1 or 2 Children | 73 (86.9%) | 11 (13.1%) |
| 3 or 4 Children | 6 (100.0%) | 0 (0.0%) |
| 5 or more Children | 0 (0.0%) | 0 (0.0%) |
| Total | 177 (92.7%) | 14 (7.3%) |
Income Below Poverty Among Single-Parent Households in Volente
| Children | Single Father | Single Mother |
| No Children | 0 (0.0%) | 0 (0.0%) |
| 1 or 2 Children | 0 (0.0%) | 0 (0.0%) |
| 3 or 4 Children | 0 (0.0%) | 0 (0.0%) |
| 5 or more Children | 0 (0.0%) | 0 (0.0%) |
| Total | 0 (0.0%) | 0 (0.0%) |
Income Below Poverty Among Married-Couple vs Single-Parent Households in Volente
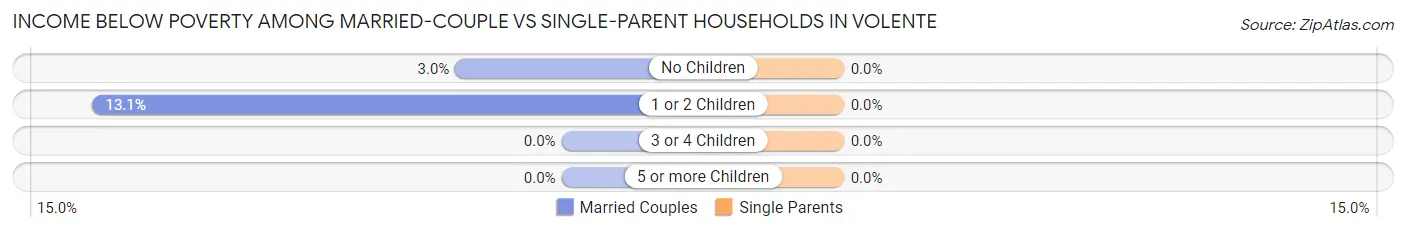
| Children | Married-Couple Families | Single-Parent Households |
| No Children | 3 (3.0%) | 0 (0.0%) |
| 1 or 2 Children | 11 (13.1%) | 0 (0.0%) |
| 3 or 4 Children | 0 (0.0%) | 0 (0.0%) |
| 5 or more Children | 0 (0.0%) | 0 (0.0%) |
| Total | 14 (7.3%) | 0 (0.0%) |
Race in Volente
The most populous races in Volente are White / Caucasian (592 | 76.0%), Hispanic or Latino (118 | 15.1%), and Two or more Races (95 | 12.2%).
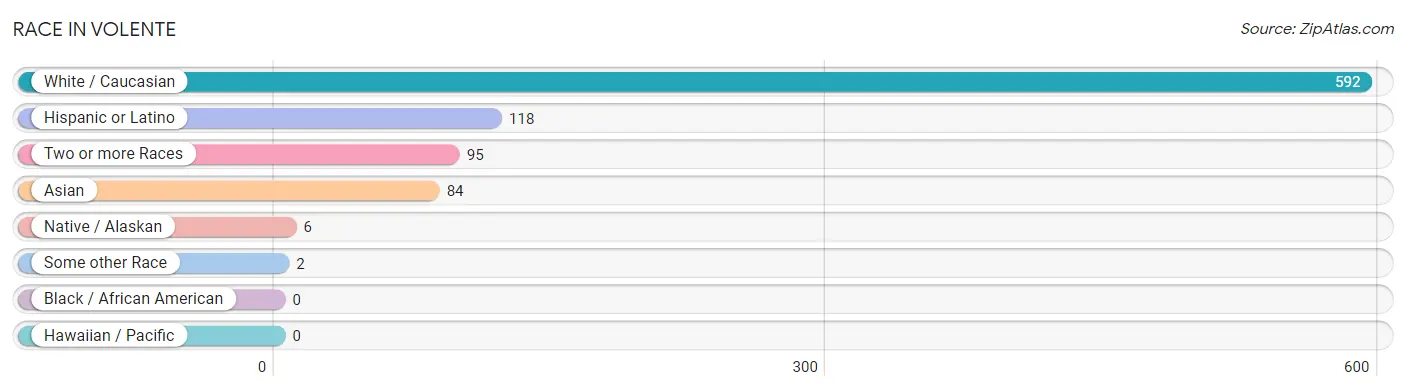
| Race | # Population | % Population |
| Asian | 84 | 10.8% |
| Black / African American | 0 | 0.0% |
| Hawaiian / Pacific | 0 | 0.0% |
| Hispanic or Latino | 118 | 15.1% |
| Native / Alaskan | 6 | 0.8% |
| White / Caucasian | 592 | 76.0% |
| Two or more Races | 95 | 12.2% |
| Some other Race | 2 | 0.3% |
| Total | 779 | 100.0% |
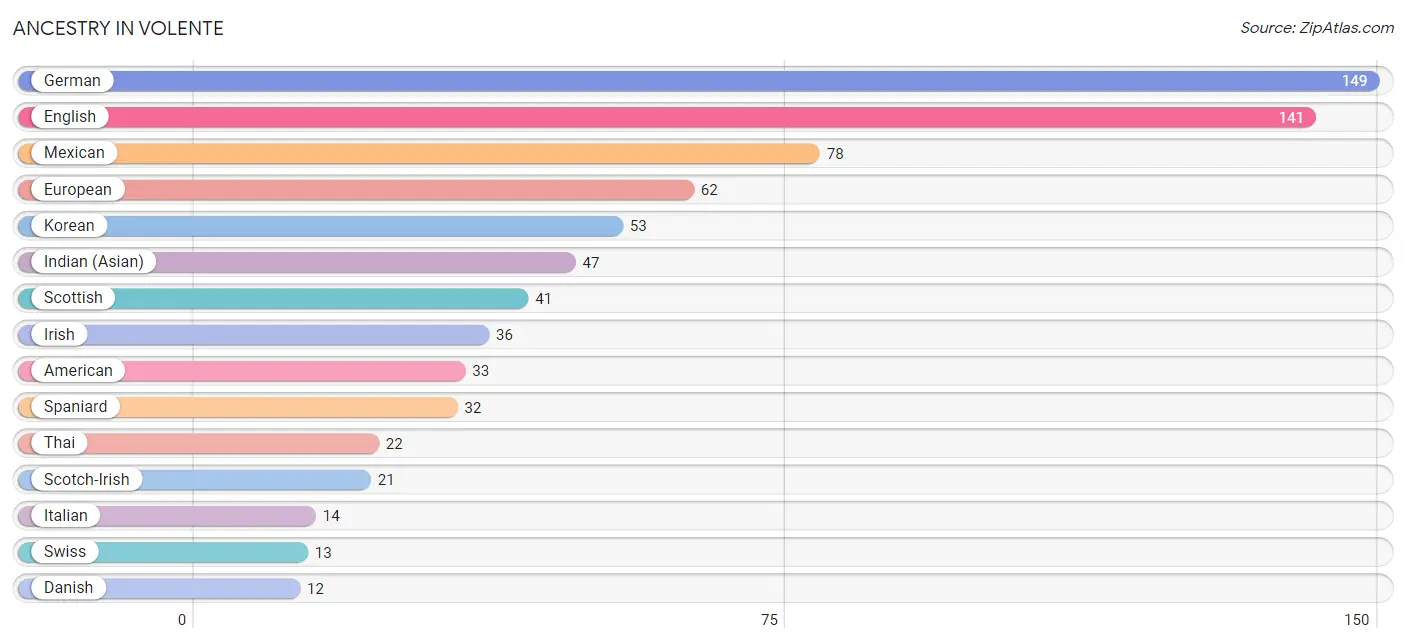
Ancestry in Volente
The most populous ancestries reported in Volente are German (149 | 19.1%), English (141 | 18.1%), Mexican (78 | 10.0%), European (62 | 8.0%), and Korean (53 | 6.8%), together accounting for 62.0% of all Volente residents.
| Ancestry | # Population | % Population |
| American | 33 | 4.2% |
| British | 2 | 0.3% |
| Burmese | 2 | 0.3% |
| Central American Indian | 1 | 0.1% |
| Chinese | 3 | 0.4% |
| Czech | 6 | 0.8% |
| Czechoslovakian | 2 | 0.3% |
| Danish | 12 | 1.5% |
| Dominican | 4 | 0.5% |
| Dutch | 4 | 0.5% |
| Eastern European | 2 | 0.3% |
| English | 141 | 18.1% |
| European | 62 | 8.0% |
| French | 7 | 0.9% |
| German | 149 | 19.1% |
| Indian (Asian) | 47 | 6.0% |
| Iranian | 3 | 0.4% |
| Irish | 36 | 4.6% |
| Italian | 14 | 1.8% |
| Korean | 53 | 6.8% |
| Mexican | 78 | 10.0% |
| Norwegian | 6 | 0.8% |
| Polish | 4 | 0.5% |
| Scandinavian | 7 | 0.9% |
| Scotch-Irish | 21 | 2.7% |
| Scottish | 41 | 5.3% |
| South American | 4 | 0.5% |
| Spaniard | 32 | 4.1% |
| Sri Lankan | 5 | 0.6% |
| Swedish | 2 | 0.3% |
| Swiss | 13 | 1.7% |
| Thai | 22 | 2.8% |
| Ukrainian | 4 | 0.5% |
| Venezuelan | 4 | 0.5% |
| Welsh | 2 | 0.3% | View All 35 Rows |
Immigrants in Volente
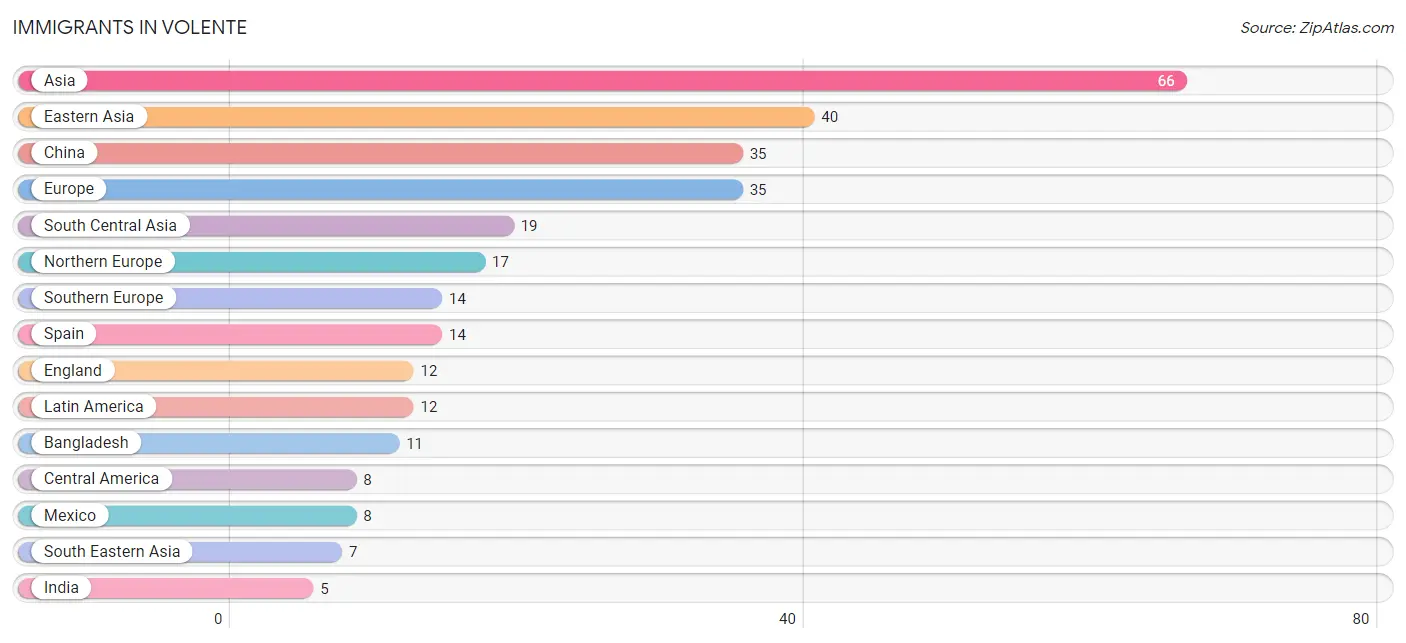
The most numerous immigrant groups reported in Volente came from Asia (66 | 8.5%), Eastern Asia (40 | 5.1%), China (35 | 4.5%), Europe (35 | 4.5%), and South Central Asia (19 | 2.4%), together accounting for 25.0% of all Volente residents.
| Immigration Origin | # Population | % Population |
| Asia | 66 | 8.5% |
| Bangladesh | 11 | 1.4% |
| Canada | 2 | 0.3% |
| Central America | 8 | 1.0% |
| China | 35 | 4.5% |
| Eastern Asia | 40 | 5.1% |
| Eastern Europe | 4 | 0.5% |
| England | 12 | 1.5% |
| Europe | 35 | 4.5% |
| India | 5 | 0.6% |
| Iran | 3 | 0.4% |
| Korea | 5 | 0.6% |
| Latin America | 12 | 1.5% |
| Mexico | 8 | 1.0% |
| Northern Europe | 17 | 2.2% |
| Philippines | 2 | 0.3% |
| South America | 4 | 0.5% |
| South Central Asia | 19 | 2.4% |
| South Eastern Asia | 7 | 0.9% |
| Southern Europe | 14 | 1.8% |
| Spain | 14 | 1.8% |
| Ukraine | 4 | 0.5% |
| Venezuela | 4 | 0.5% |
| Vietnam | 5 | 0.6% | View All 24 Rows |
Sex and Age in Volente
Sex and Age in Volente
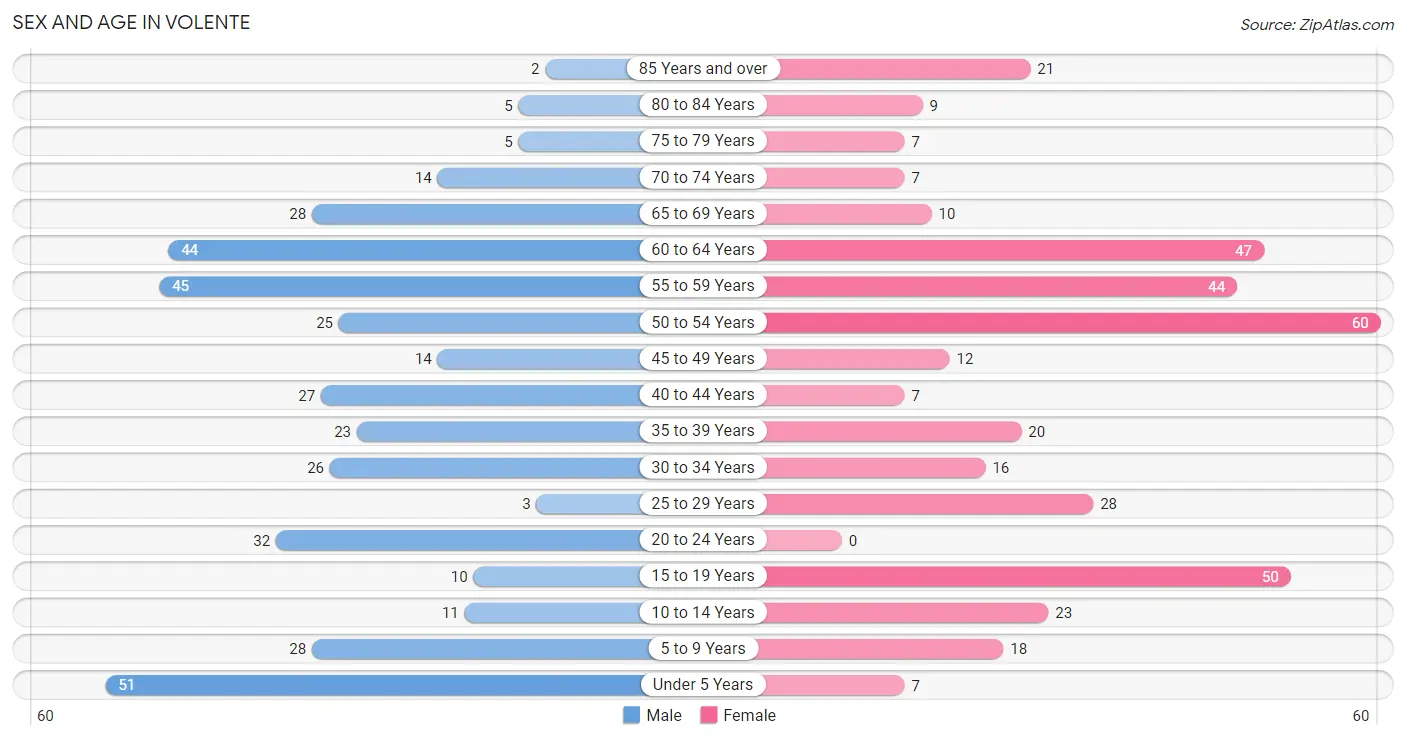
The most populous age groups in Volente are Under 5 Years (51 | 13.0%) for men and 50 to 54 Years (60 | 15.5%) for women.
| Age Bracket | Male | Female |
| Under 5 Years | 51 (13.0%) | 7 (1.8%) |
| 5 to 9 Years | 28 (7.1%) | 18 (4.7%) |
| 10 to 14 Years | 11 (2.8%) | 23 (6.0%) |
| 15 to 19 Years | 10 (2.5%) | 50 (13.0%) |
| 20 to 24 Years | 32 (8.1%) | 0 (0.0%) |
| 25 to 29 Years | 3 (0.8%) | 28 (7.2%) |
| 30 to 34 Years | 26 (6.6%) | 16 (4.2%) |
| 35 to 39 Years | 23 (5.9%) | 20 (5.2%) |
| 40 to 44 Years | 27 (6.9%) | 7 (1.8%) |
| 45 to 49 Years | 14 (3.6%) | 12 (3.1%) |
| 50 to 54 Years | 25 (6.4%) | 60 (15.5%) |
| 55 to 59 Years | 45 (11.5%) | 44 (11.4%) |
| 60 to 64 Years | 44 (11.2%) | 47 (12.2%) |
| 65 to 69 Years | 28 (7.1%) | 10 (2.6%) |
| 70 to 74 Years | 14 (3.6%) | 7 (1.8%) |
| 75 to 79 Years | 5 (1.3%) | 7 (1.8%) |
| 80 to 84 Years | 5 (1.3%) | 9 (2.3%) |
| 85 Years and over | 2 (0.5%) | 21 (5.4%) |
| Total | 393 (100.0%) | 386 (100.0%) |
Families and Households in Volente
Median Family Size in Volente
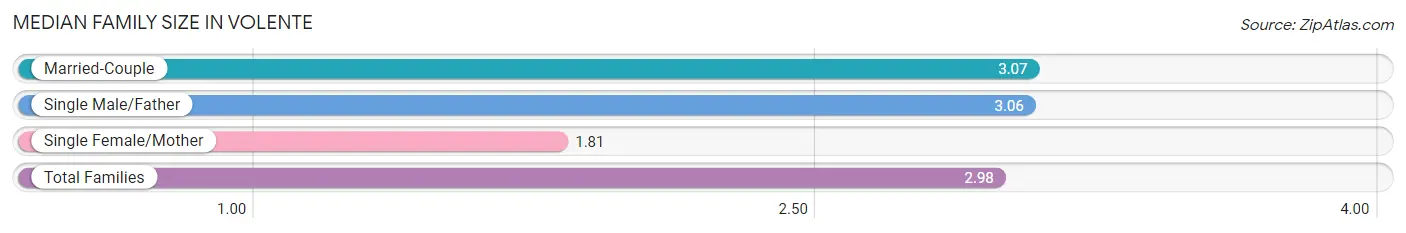
The median family size in Volente is 2.98 persons per family, with married-couple families (191 | 84.9%) accounting for the largest median family size of 3.07 persons per family. On the other hand, single female/mother families (16 | 7.1%) represent the smallest median family size with 1.81 persons per family.
| Family Type | # Families | Family Size |
| Married-Couple | 191 (84.9%) | 3.07 |
| Single Male/Father | 18 (8.0%) | 3.06 |
| Single Female/Mother | 16 (7.1%) | 1.81 |
| Total Families | 225 (100.0%) | 2.98 |
Median Household Size in Volente
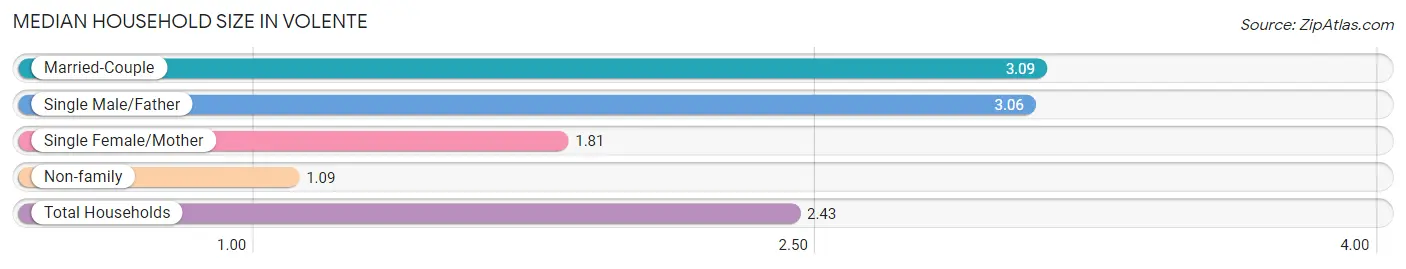
The median household size in Volente is 2.43 persons per household, with married-couple households (191 | 59.7%) accounting for the largest median household size of 3.09 persons per household. non-family households (95 | 29.7%) represent the smallest median household size with 1.09 persons per household.
| Household Type | # Households | Household Size |
| Married-Couple | 191 (59.7%) | 3.09 |
| Single Male/Father | 18 (5.6%) | 3.06 |
| Single Female/Mother | 16 (5.0%) | 1.81 |
| Non-family | 95 (29.7%) | 1.09 |
| Total Households | 320 (100.0%) | 2.43 |
Household Size by Marriage Status in Volente
Out of a total of 320 households in Volente, 225 (70.3%) are family households, while 95 (29.7%) are nonfamily households. The most numerous type of family households are 2-person households, comprising 86, and the most common type of nonfamily households are 1-person households, comprising 87.
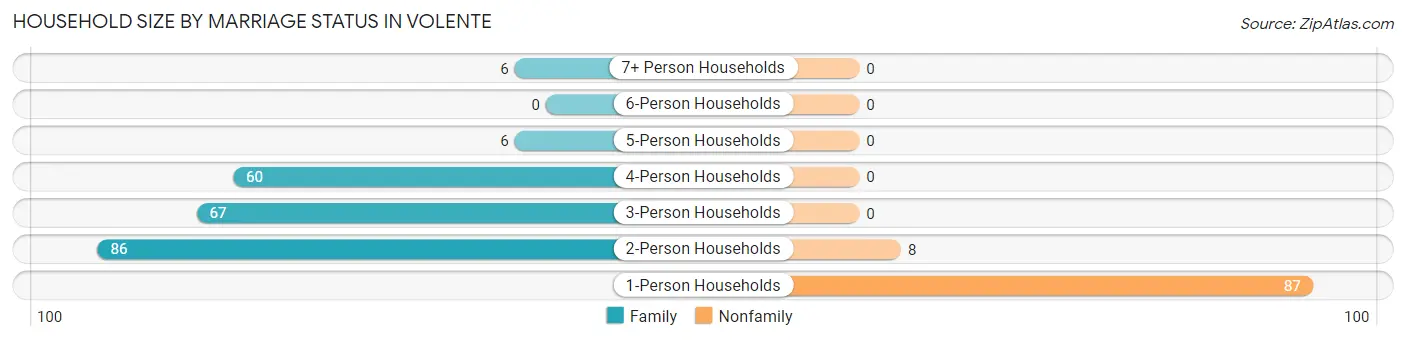
| Household Size | Family Households | Nonfamily Households |
| 1-Person Households | - | 87 (27.2%) |
| 2-Person Households | 86 (26.9%) | 8 (2.5%) |
| 3-Person Households | 67 (20.9%) | 0 (0.0%) |
| 4-Person Households | 60 (18.8%) | 0 (0.0%) |
| 5-Person Households | 6 (1.9%) | 0 (0.0%) |
| 6-Person Households | 0 (0.0%) | 0 (0.0%) |
| 7+ Person Households | 6 (1.9%) | 0 (0.0%) |
| Total | 225 (70.3%) | 95 (29.7%) |
Female Fertility in Volente
Fertility by Age in Volente
Average fertility rate in Volente is 73.0 births per 1,000 women. Women in the age bracket of 20 to 34 years have the highest fertility rate with 250.0 births per 1,000 women. Women in the age bracket of 20 to 34 years acount for 100.0% of all women with births.
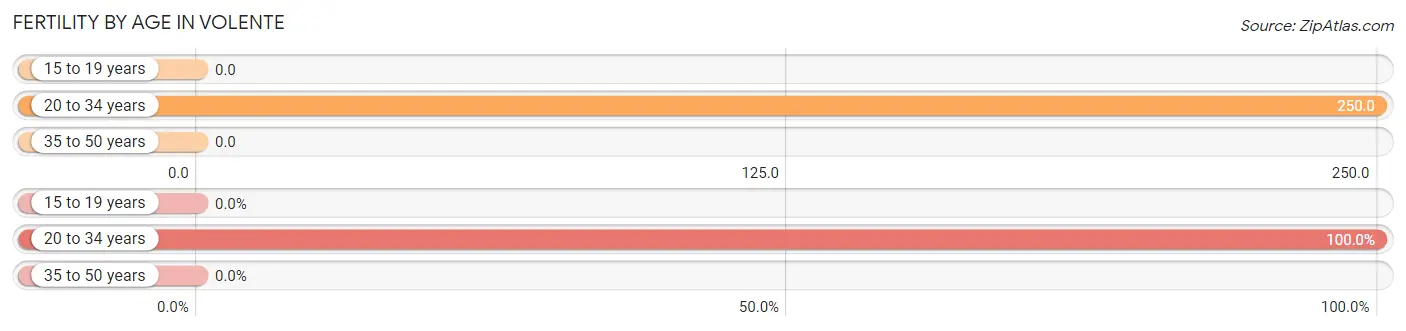
| Age Bracket | Women with Births | Births / 1,000 Women |
| 15 to 19 years | 0 (0.0%) | 0.0 |
| 20 to 34 years | 11 (100.0%) | 250.0 |
| 35 to 50 years | 0 (0.0%) | 0.0 |
| Total | 11 (100.0%) | 73.0 |
Fertility by Age by Marriage Status in Volente
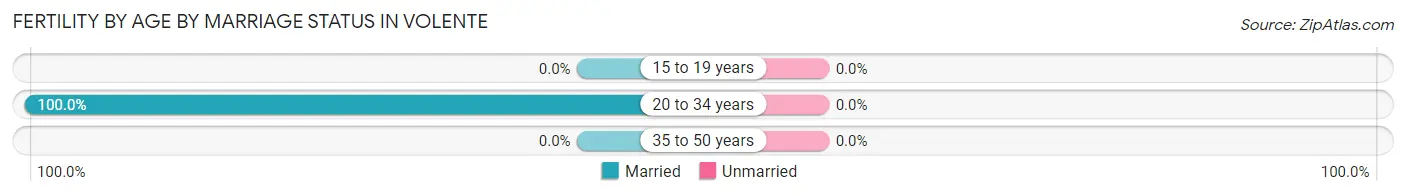
| Age Bracket | Married | Unmarried |
| 15 to 19 years | 0 (0.0%) | 0 (0.0%) |
| 20 to 34 years | 11 (100.0%) | 0 (0.0%) |
| 35 to 50 years | 0 (0.0%) | 0 (0.0%) |
| Total | 11 (100.0%) | 0 (0.0%) |
Fertility by Education in Volente
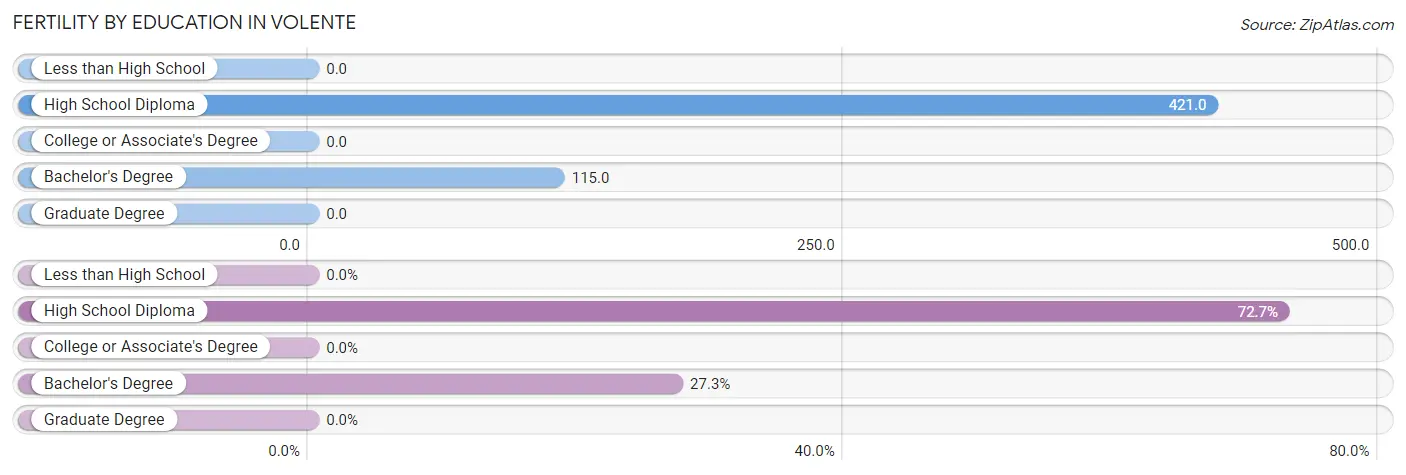
| Educational Attainment | Women with Births | Births / 1,000 Women |
| Less than High School | 0 (0.0%) | 0.0 |
| High School Diploma | 8 (72.7%) | 421.0 |
| College or Associate's Degree | 0 (0.0%) | 0.0 |
| Bachelor's Degree | 3 (27.3%) | 115.0 |
| Graduate Degree | 0 (0.0%) | 0.0 |
| Total | 11 (100.0%) | 73.0 |
Fertility by Education by Marriage Status in Volente
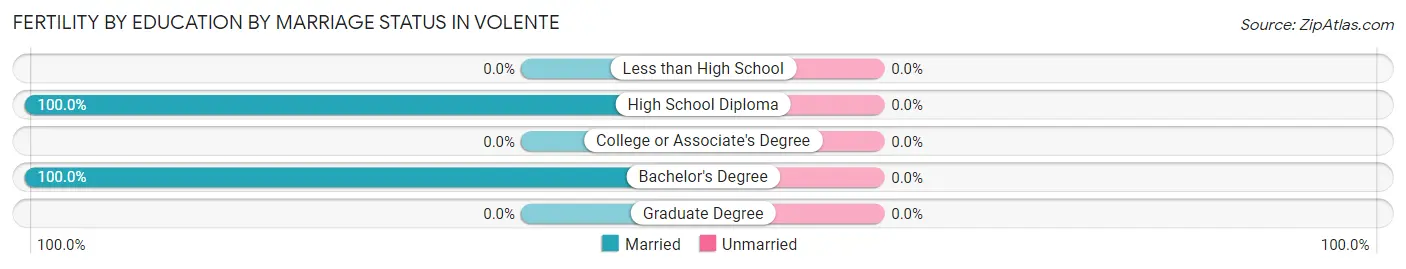
| Educational Attainment | Married | Unmarried |
| Less than High School | 0 (0.0%) | 0 (0.0%) |
| High School Diploma | 8 (100.0%) | 0 (0.0%) |
| College or Associate's Degree | 0 (0.0%) | 0 (0.0%) |
| Bachelor's Degree | 3 (100.0%) | 0 (0.0%) |
| Graduate Degree | 0 (0.0%) | 0 (0.0%) |
| Total | 11 (100.0%) | 0 (0.0%) |
Employment Characteristics in Volente
Employment by Class of Employer in Volente
Among the 354 employed individuals in Volente, private company employees (238 | 67.2%), self-employed (incorporated) (45 | 12.7%), and not-for-profit organizations (42 | 11.9%) make up the most common classes of employment.
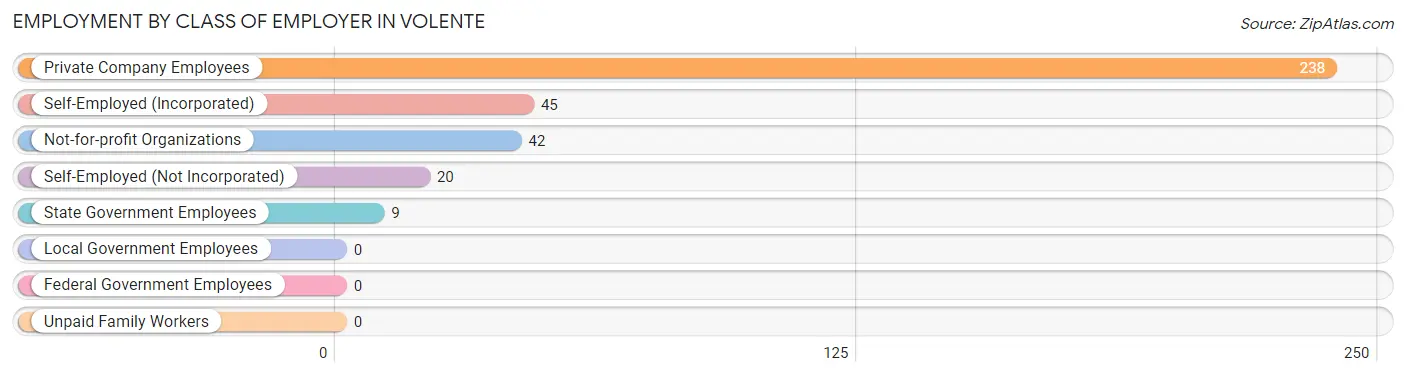
| Employer Class | # Employees | % Employees |
| Private Company Employees | 238 | 67.2% |
| Self-Employed (Incorporated) | 45 | 12.7% |
| Self-Employed (Not Incorporated) | 20 | 5.7% |
| Not-for-profit Organizations | 42 | 11.9% |
| Local Government Employees | 0 | 0.0% |
| State Government Employees | 9 | 2.5% |
| Federal Government Employees | 0 | 0.0% |
| Unpaid Family Workers | 0 | 0.0% |
| Total | 354 | 100.0% |
Employment Status by Age in Volente
According to the labor force statistics for Volente, out of the total population over 16 years of age (621), 61.0% or 379 individuals are in the labor force, with 6.6% or 25 of them unemployed. The age group with the highest labor force participation rate is 30 to 34 years, with 92.9% or 39 individuals in the labor force. Within the labor force, the 55 to 59 years age range has the highest percentage of unemployed individuals, with 23.1% or 15 of them being unemployed.
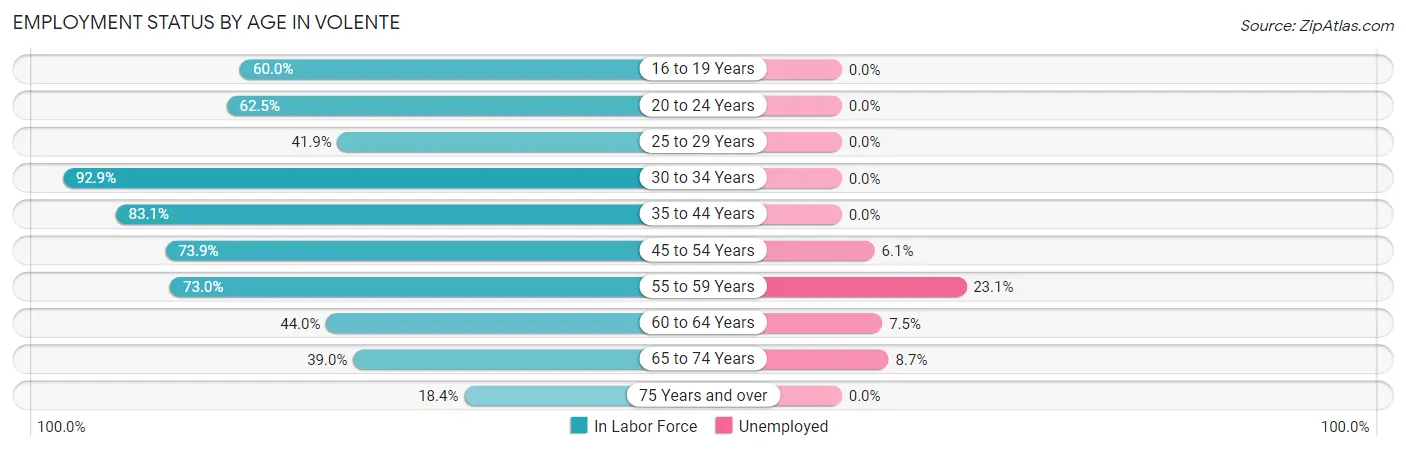
| Age Bracket | In Labor Force | Unemployed |
| 16 to 19 Years | 24 (60.0%) | 0 (0.0%) |
| 20 to 24 Years | 20 (62.5%) | 0 (0.0%) |
| 25 to 29 Years | 13 (41.9%) | 0 (0.0%) |
| 30 to 34 Years | 39 (92.9%) | 0 (0.0%) |
| 35 to 44 Years | 64 (83.1%) | 0 (0.0%) |
| 45 to 54 Years | 82 (73.9%) | 5 (6.1%) |
| 55 to 59 Years | 65 (73.0%) | 15 (23.1%) |
| 60 to 64 Years | 40 (44.0%) | 3 (7.5%) |
| 65 to 74 Years | 23 (39.0%) | 2 (8.7%) |
| 75 Years and over | 9 (18.4%) | 0 (0.0%) |
| Total | 379 (61.0%) | 25 (6.6%) |
Employment Status by Educational Attainment in Volente
According to labor force statistics for Volente, 68.7% of individuals (303) out of the total population between 25 and 64 years of age (441) are in the labor force, with 7.6% or 23 of them being unemployed. The group with the highest labor force participation rate are those with the educational attainment of college / associate degree, with 74.1% or 86 individuals in the labor force. Within the labor force, individuals with bachelor's degree or higher education have the highest percentage of unemployment, with 9.5% or 17 of them being unemployed.
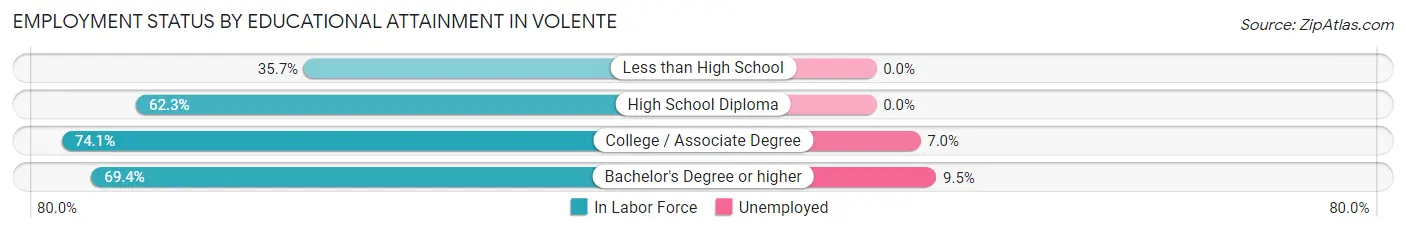
| Educational Attainment | In Labor Force | Unemployed |
| Less than High School | 5 (35.7%) | 0 (0.0%) |
| High School Diploma | 33 (62.3%) | 0 (0.0%) |
| College / Associate Degree | 86 (74.1%) | 8 (7.0%) |
| Bachelor's Degree or higher | 179 (69.4%) | 25 (9.5%) |
| Total | 303 (68.7%) | 34 (7.6%) |
Employment Occupations by Sex in Volente
Management, Business, Science and Arts Occupations
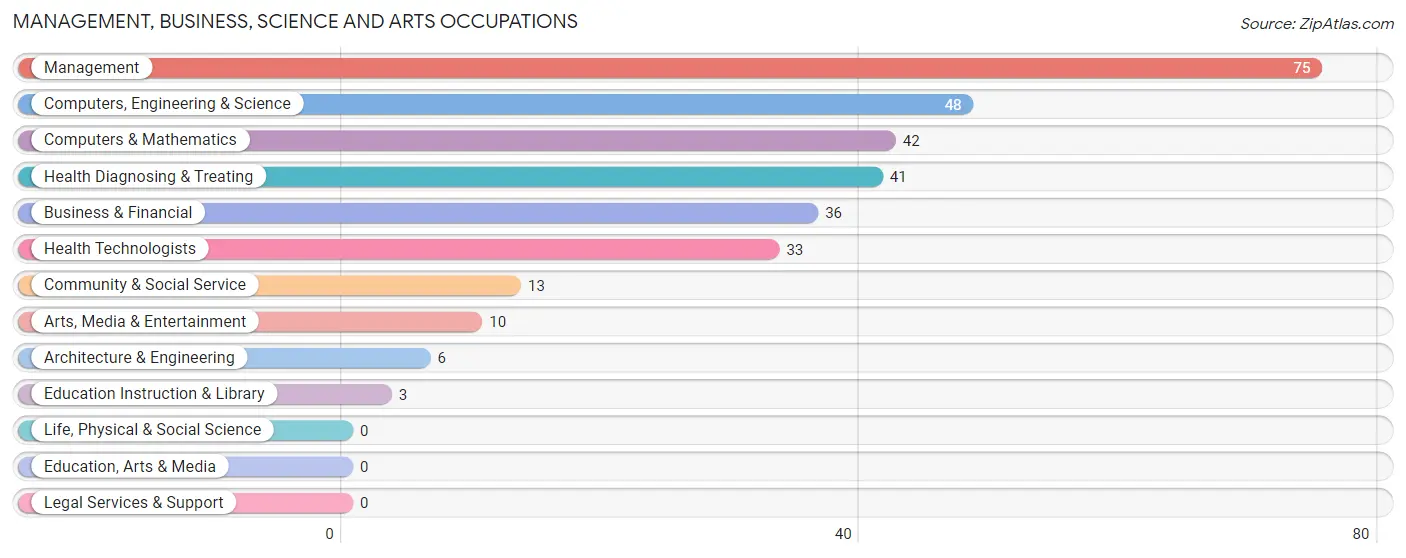
The most common Management, Business, Science and Arts occupations in Volente are Management (75 | 21.2%), Computers, Engineering & Science (48 | 13.6%), Computers & Mathematics (42 | 11.9%), Health Diagnosing & Treating (41 | 11.6%), and Business & Financial (36 | 10.2%).
Management, Business, Science and Arts Occupations by Sex
Within the Management, Business, Science and Arts occupations in Volente, the most male-oriented occupations are Architecture & Engineering (100.0%), Computers, Engineering & Science (95.8%), and Computers & Mathematics (95.2%), while the most female-oriented occupations are Education Instruction & Library (100.0%), Health Technologists (66.7%), and Health Diagnosing & Treating (53.7%).
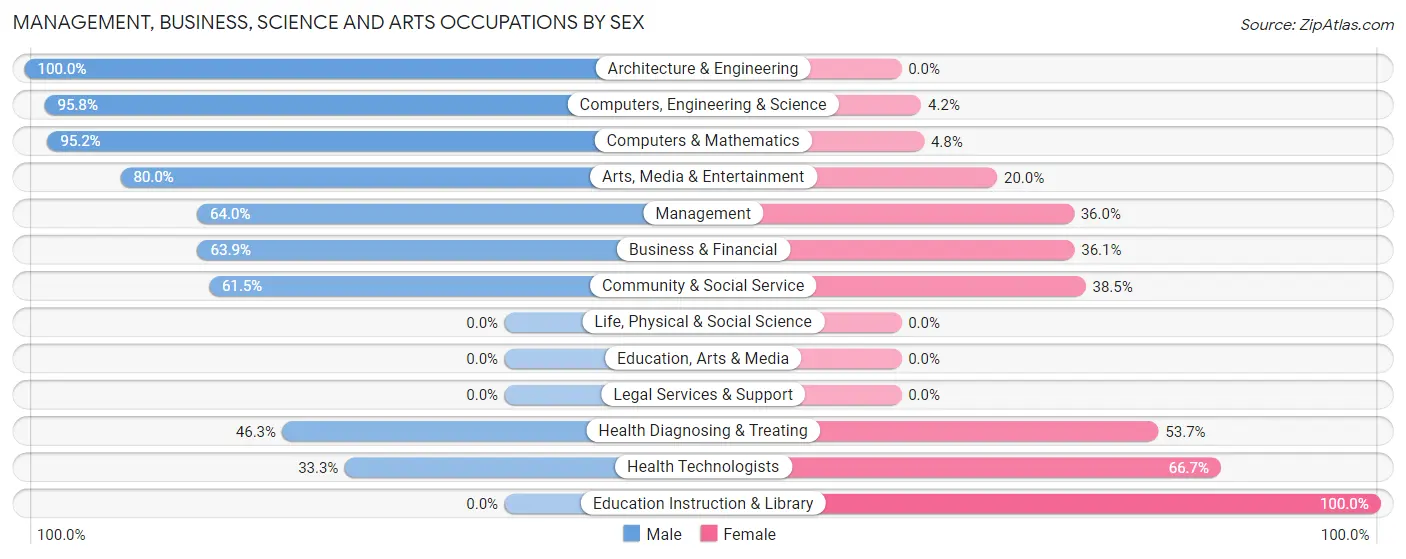
| Occupation | Male | Female |
| Management | 48 (64.0%) | 27 (36.0%) |
| Business & Financial | 23 (63.9%) | 13 (36.1%) |
| Computers, Engineering & Science | 46 (95.8%) | 2 (4.2%) |
| Computers & Mathematics | 40 (95.2%) | 2 (4.8%) |
| Architecture & Engineering | 6 (100.0%) | 0 (0.0%) |
| Life, Physical & Social Science | 0 (0.0%) | 0 (0.0%) |
| Community & Social Service | 8 (61.5%) | 5 (38.5%) |
| Education, Arts & Media | 0 (0.0%) | 0 (0.0%) |
| Legal Services & Support | 0 (0.0%) | 0 (0.0%) |
| Education Instruction & Library | 0 (0.0%) | 3 (100.0%) |
| Arts, Media & Entertainment | 8 (80.0%) | 2 (20.0%) |
| Health Diagnosing & Treating | 19 (46.3%) | 22 (53.7%) |
| Health Technologists | 11 (33.3%) | 22 (66.7%) |
| Total (Category) | 144 (67.6%) | 69 (32.4%) |
| Total (Overall) | 214 (60.5%) | 140 (39.6%) |
Services Occupations
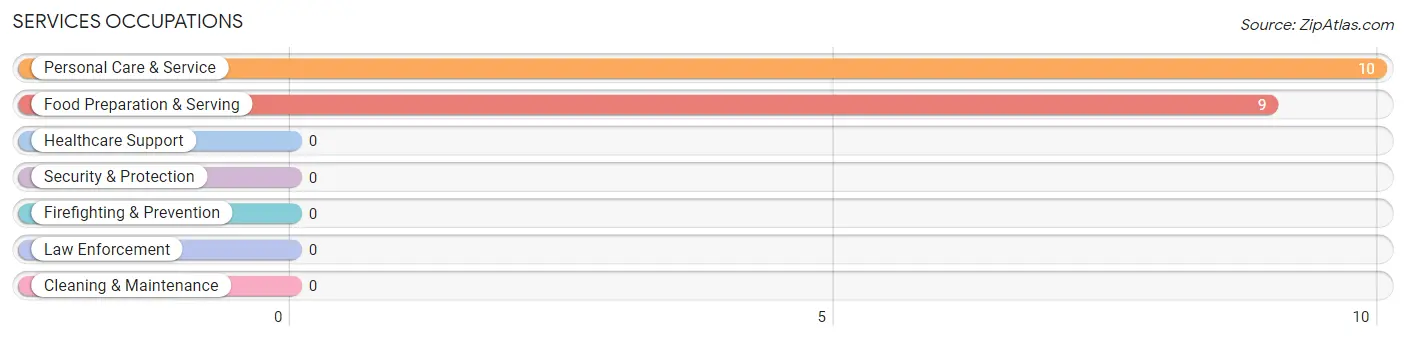
The most common Services occupations in Volente are Personal Care & Service (10 | 2.8%), and Food Preparation & Serving (9 | 2.5%).
Services Occupations by Sex
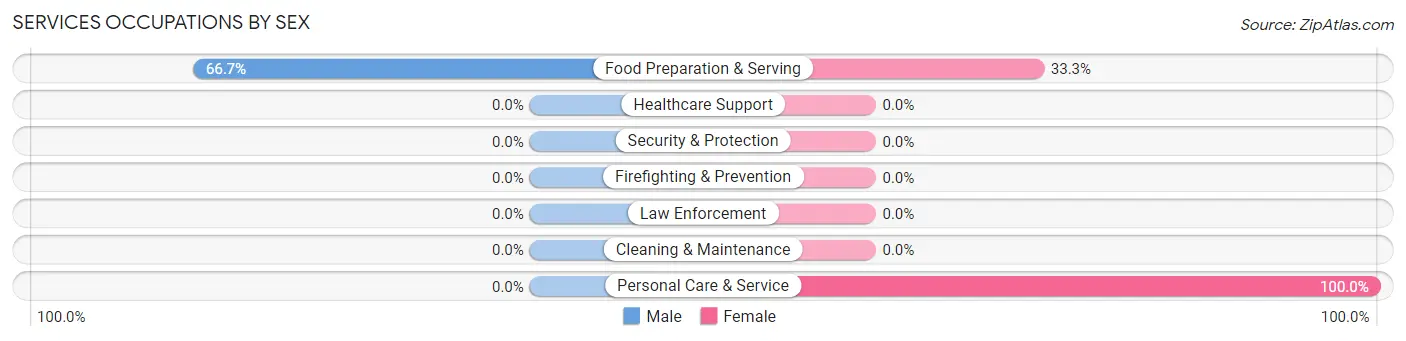
| Occupation | Male | Female |
| Healthcare Support | 0 (0.0%) | 0 (0.0%) |
| Security & Protection | 0 (0.0%) | 0 (0.0%) |
| Firefighting & Prevention | 0 (0.0%) | 0 (0.0%) |
| Law Enforcement | 0 (0.0%) | 0 (0.0%) |
| Food Preparation & Serving | 6 (66.7%) | 3 (33.3%) |
| Cleaning & Maintenance | 0 (0.0%) | 0 (0.0%) |
| Personal Care & Service | 0 (0.0%) | 10 (100.0%) |
| Total (Category) | 6 (31.6%) | 13 (68.4%) |
| Total (Overall) | 214 (60.5%) | 140 (39.6%) |
Sales and Office Occupations
The most common Sales and Office occupations in Volente are Sales & Related (43 | 12.1%), and Office & Administration (37 | 10.4%).
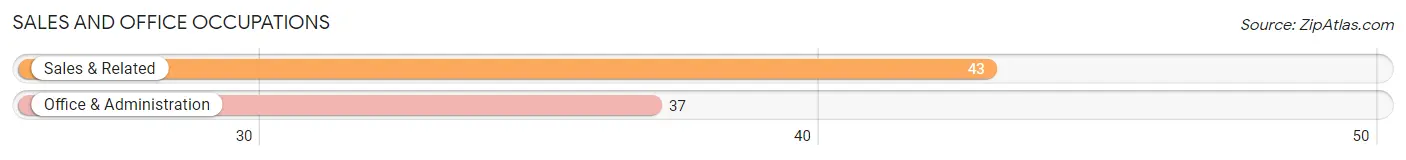
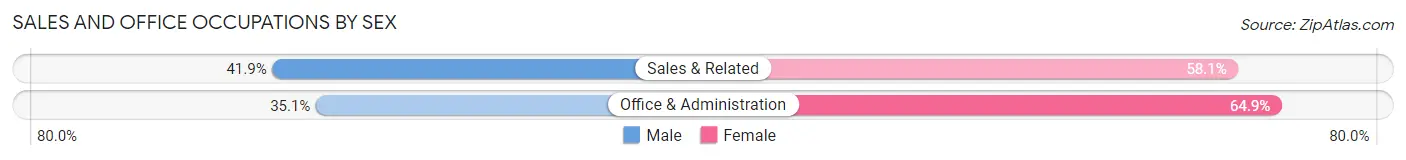
Sales and Office Occupations by Sex
| Occupation | Male | Female |
| Sales & Related | 18 (41.9%) | 25 (58.1%) |
| Office & Administration | 13 (35.1%) | 24 (64.9%) |
| Total (Category) | 31 (38.8%) | 49 (61.3%) |
| Total (Overall) | 214 (60.5%) | 140 (39.6%) |
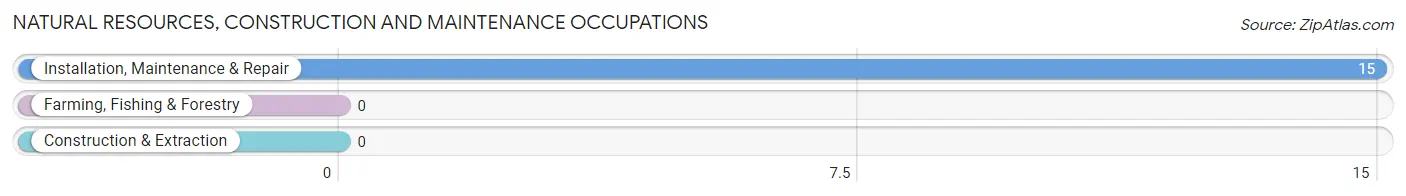
Natural Resources, Construction and Maintenance Occupations
The most common Natural Resources, Construction and Maintenance occupations in Volente are , and Installation, Maintenance & Repair (15 | 4.2%).
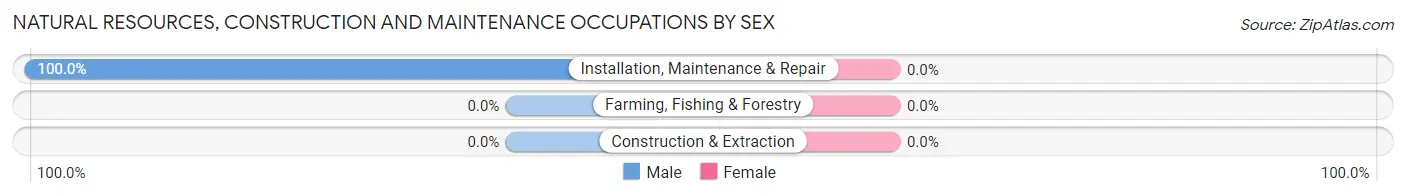
Natural Resources, Construction and Maintenance Occupations by Sex
| Occupation | Male | Female |
| Farming, Fishing & Forestry | 0 (0.0%) | 0 (0.0%) |
| Construction & Extraction | 0 (0.0%) | 0 (0.0%) |
| Installation, Maintenance & Repair | 15 (100.0%) | 0 (0.0%) |
| Total (Category) | 15 (100.0%) | 0 (0.0%) |
| Total (Overall) | 214 (60.5%) | 140 (39.6%) |
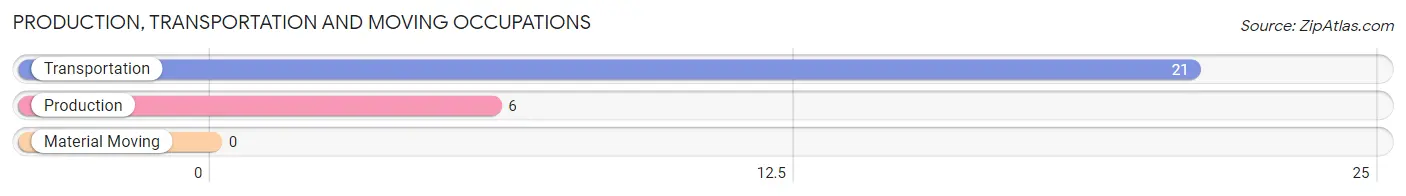
Production, Transportation and Moving Occupations
The most common Production, Transportation and Moving occupations in Volente are Transportation (21 | 5.9%), and Production (6 | 1.7%).
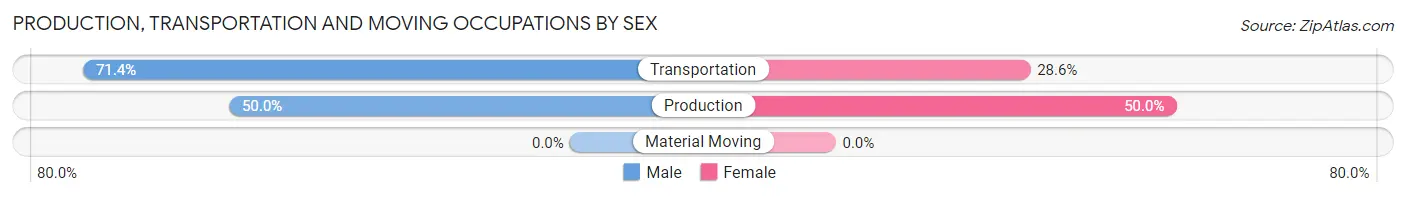
Production, Transportation and Moving Occupations by Sex
| Occupation | Male | Female |
| Production | 3 (50.0%) | 3 (50.0%) |
| Transportation | 15 (71.4%) | 6 (28.6%) |
| Material Moving | 0 (0.0%) | 0 (0.0%) |
| Total (Category) | 18 (66.7%) | 9 (33.3%) |
| Total (Overall) | 214 (60.5%) | 140 (39.6%) |
Employment Industries by Sex in Volente
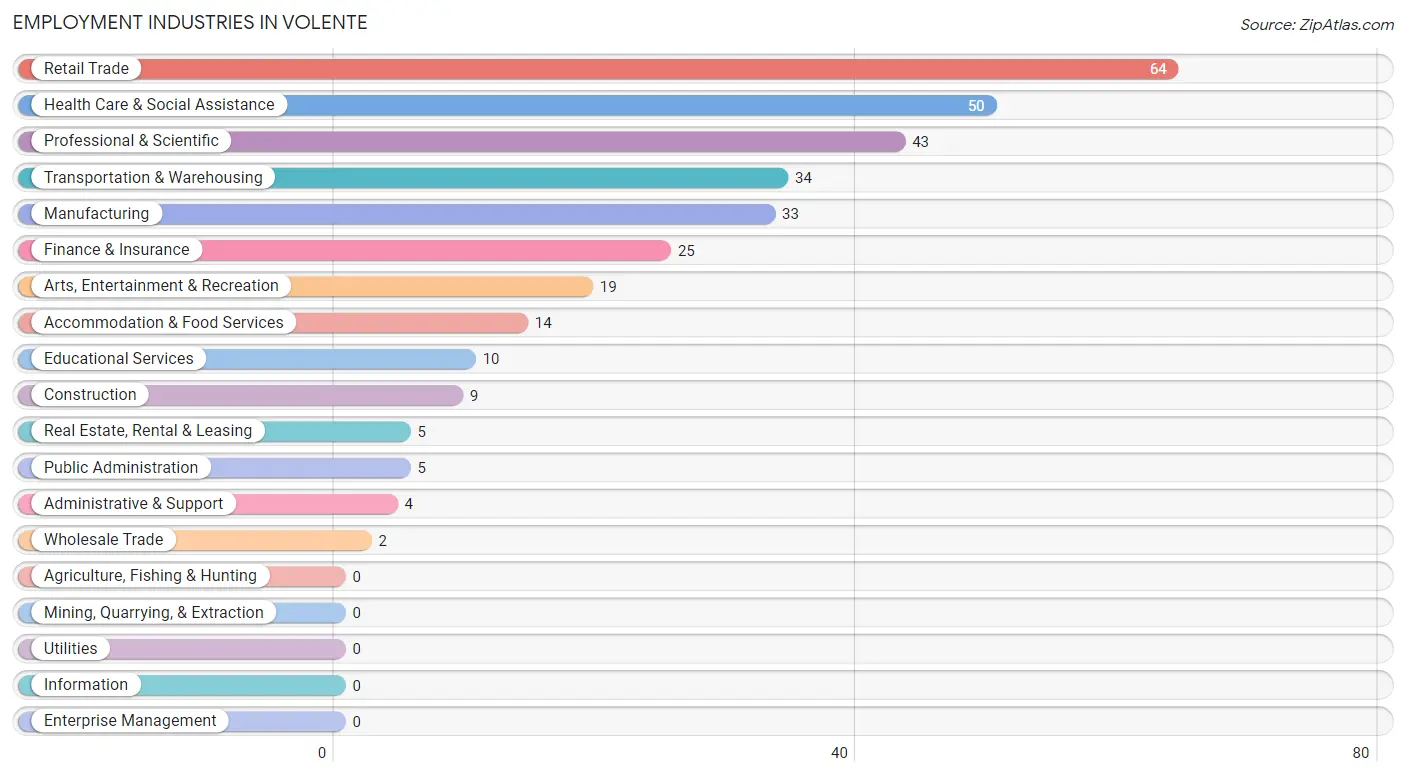
Employment Industries in Volente
The major employment industries in Volente include Retail Trade (64 | 18.1%), Health Care & Social Assistance (50 | 14.1%), Professional & Scientific (43 | 12.1%), Transportation & Warehousing (34 | 9.6%), and Manufacturing (33 | 9.3%).
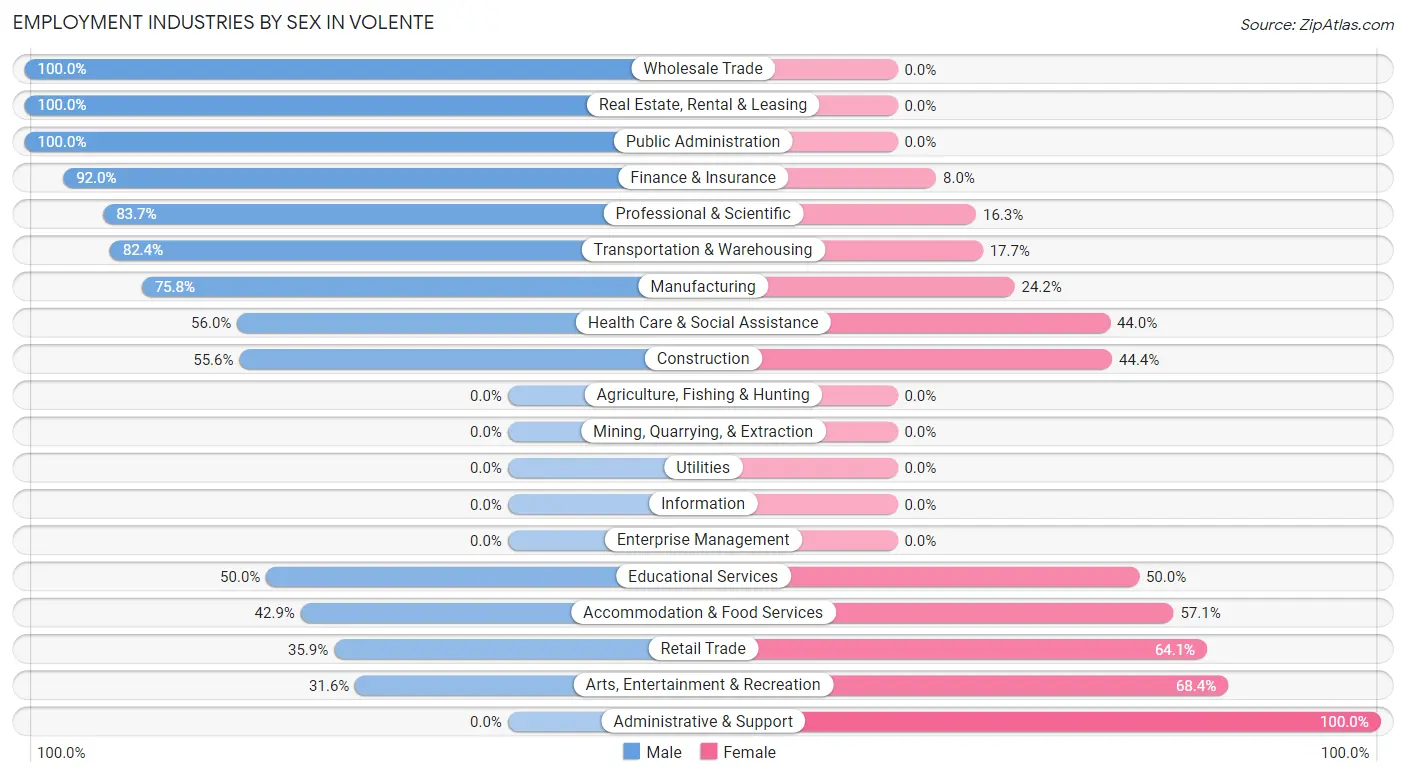
Employment Industries by Sex in Volente
The Volente industries that see more men than women are Wholesale Trade (100.0%), Real Estate, Rental & Leasing (100.0%), and Public Administration (100.0%), whereas the industries that tend to have a higher number of women are Administrative & Support (100.0%), Arts, Entertainment & Recreation (68.4%), and Retail Trade (64.1%).
| Industry | Male | Female |
| Agriculture, Fishing & Hunting | 0 (0.0%) | 0 (0.0%) |
| Mining, Quarrying, & Extraction | 0 (0.0%) | 0 (0.0%) |
| Construction | 5 (55.6%) | 4 (44.4%) |
| Manufacturing | 25 (75.8%) | 8 (24.2%) |
| Wholesale Trade | 2 (100.0%) | 0 (0.0%) |
| Retail Trade | 23 (35.9%) | 41 (64.1%) |
| Transportation & Warehousing | 28 (82.4%) | 6 (17.6%) |
| Utilities | 0 (0.0%) | 0 (0.0%) |
| Information | 0 (0.0%) | 0 (0.0%) |
| Finance & Insurance | 23 (92.0%) | 2 (8.0%) |
| Real Estate, Rental & Leasing | 5 (100.0%) | 0 (0.0%) |
| Professional & Scientific | 36 (83.7%) | 7 (16.3%) |
| Enterprise Management | 0 (0.0%) | 0 (0.0%) |
| Administrative & Support | 0 (0.0%) | 4 (100.0%) |
| Educational Services | 5 (50.0%) | 5 (50.0%) |
| Health Care & Social Assistance | 28 (56.0%) | 22 (44.0%) |
| Arts, Entertainment & Recreation | 6 (31.6%) | 13 (68.4%) |
| Accommodation & Food Services | 6 (42.9%) | 8 (57.1%) |
| Public Administration | 5 (100.0%) | 0 (0.0%) |
| Total | 214 (60.5%) | 140 (39.6%) |
Education in Volente
School Enrollment in Volente
The most common levels of schooling among the 153 students in Volente are high school (60 | 39.2%), elementary school (34 | 22.2%), and middle school (28 | 18.3%).
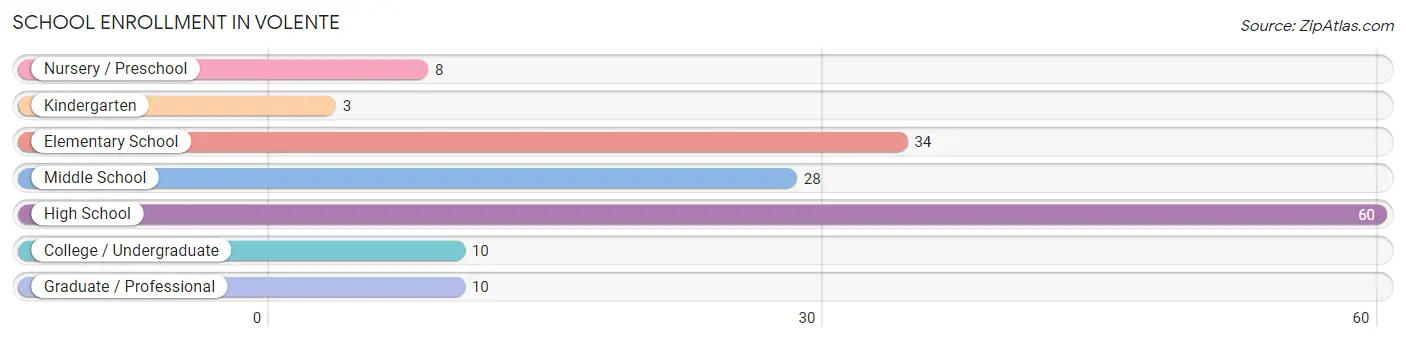
| School Level | # Students | % Students |
| Nursery / Preschool | 8 | 5.2% |
| Kindergarten | 3 | 2.0% |
| Elementary School | 34 | 22.2% |
| Middle School | 28 | 18.3% |
| High School | 60 | 39.2% |
| College / Undergraduate | 10 | 6.5% |
| Graduate / Professional | 10 | 6.5% |
| Total | 153 | 100.0% |
School Enrollment by Age by Funding Source in Volente
Out of a total of 153 students who are enrolled in schools in Volente, 11 (7.2%) attend a private institution, while the remaining 142 (92.8%) are enrolled in public schools. The age group of 3 to 4 year olds has the highest likelihood of being enrolled in private schools, with 5 (62.5% in the age bracket) enrolled. Conversely, the age group of 10 to 14 year olds has the lowest likelihood of being enrolled in a private school, with 34 (100.0% in the age bracket) attending a public institution.
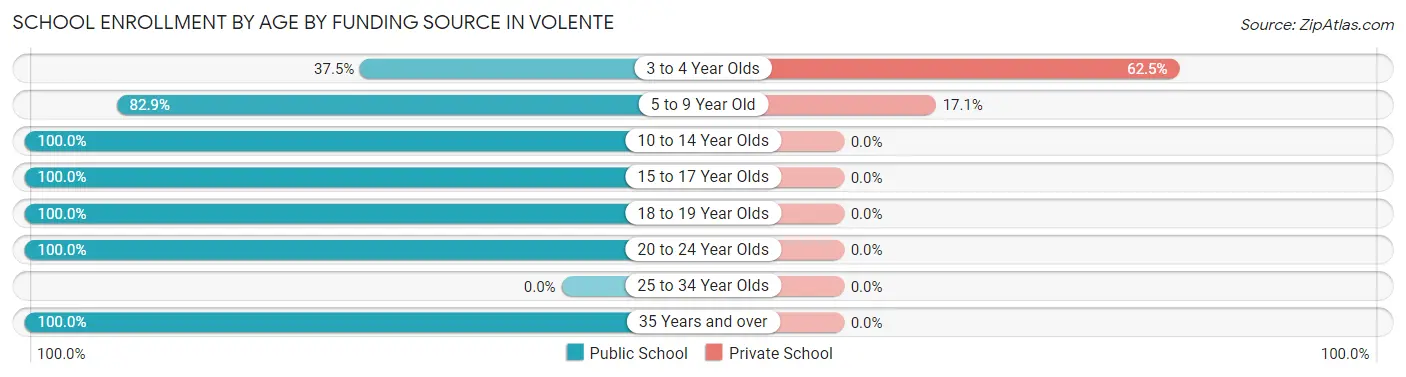
| Age Bracket | Public School | Private School |
| 3 to 4 Year Olds | 3 (37.5%) | 5 (62.5%) |
| 5 to 9 Year Old | 29 (82.9%) | 6 (17.1%) |
| 10 to 14 Year Olds | 34 (100.0%) | 0 (0.0%) |
| 15 to 17 Year Olds | 38 (100.0%) | 0 (0.0%) |
| 18 to 19 Year Olds | 18 (100.0%) | 0 (0.0%) |
| 20 to 24 Year Olds | 10 (100.0%) | 0 (0.0%) |
| 25 to 34 Year Olds | 0 (0.0%) | 0 (0.0%) |
| 35 Years and over | 10 (100.0%) | 0 (0.0%) |
| Total | 142 (92.8%) | 11 (7.2%) |
Educational Attainment by Field of Study in Volente
Business (119 | 37.3%), engineering (38 | 11.9%), education (36 | 11.3%), computers & mathematics (27 | 8.5%), and physical & health sciences (19 | 6.0%) are the most common fields of study among 319 individuals in Volente who have obtained a bachelor's degree or higher.
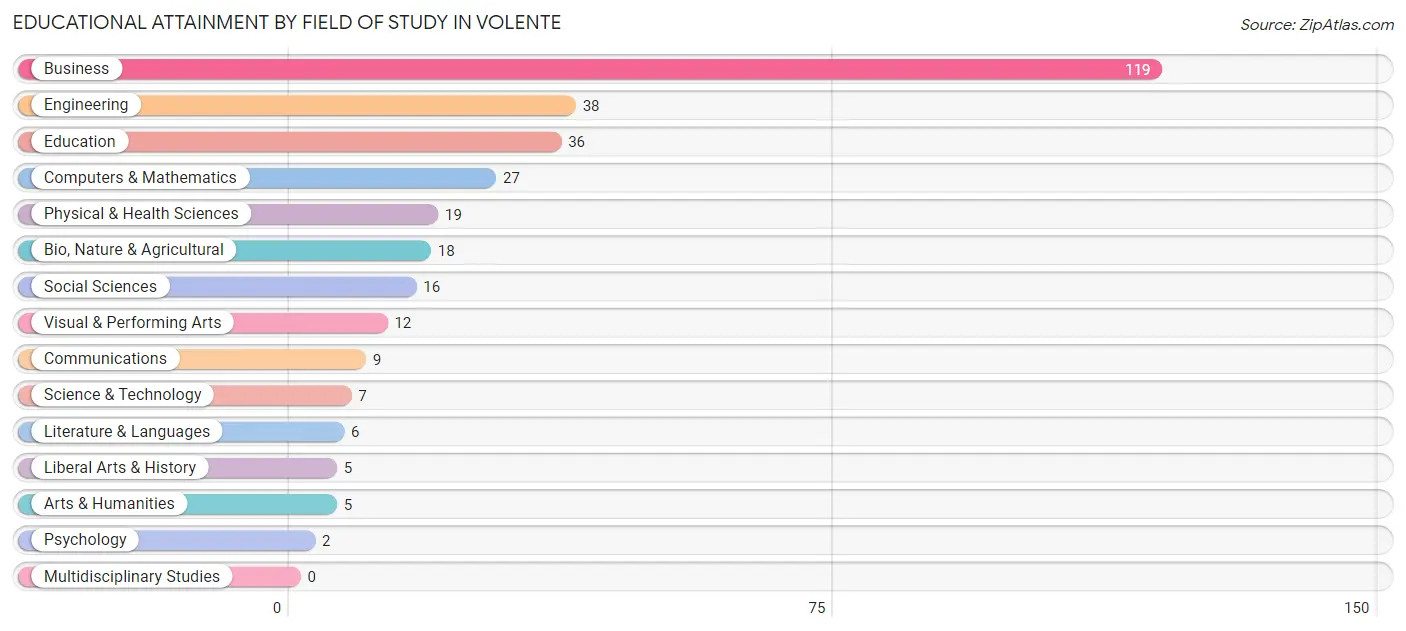
| Field of Study | # Graduates | % Graduates |
| Computers & Mathematics | 27 | 8.5% |
| Bio, Nature & Agricultural | 18 | 5.6% |
| Physical & Health Sciences | 19 | 6.0% |
| Psychology | 2 | 0.6% |
| Social Sciences | 16 | 5.0% |
| Engineering | 38 | 11.9% |
| Multidisciplinary Studies | 0 | 0.0% |
| Science & Technology | 7 | 2.2% |
| Business | 119 | 37.3% |
| Education | 36 | 11.3% |
| Literature & Languages | 6 | 1.9% |
| Liberal Arts & History | 5 | 1.6% |
| Visual & Performing Arts | 12 | 3.8% |
| Communications | 9 | 2.8% |
| Arts & Humanities | 5 | 1.6% |
| Total | 319 | 100.0% |
Transportation & Commute in Volente
Vehicle Availability by Sex in Volente
The most prevalent vehicle ownership categories in Volente are males with 2 vehicles (74, accounting for 34.6%) and females with 2 vehicles (25, making up 52.9%).
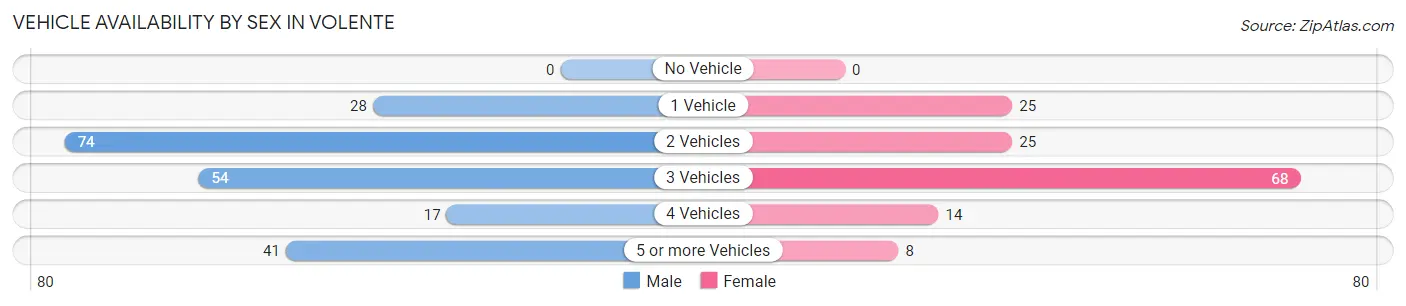
| Vehicles Available | Male | Female |
| No Vehicle | 0 (0.0%) | 0 (0.0%) |
| 1 Vehicle | 28 (13.1%) | 25 (17.9%) |
| 2 Vehicles | 74 (34.6%) | 25 (17.9%) |
| 3 Vehicles | 54 (25.2%) | 68 (48.6%) |
| 4 Vehicles | 17 (7.9%) | 14 (10.0%) |
| 5 or more Vehicles | 41 (19.2%) | 8 (5.7%) |
| Total | 214 (100.0%) | 140 (100.0%) |
Commute Time in Volente
The most frequently occuring commute durations in Volente are 30 to 34 minutes (63 commuters, 22.8%), 45 to 59 minutes (55 commuters, 19.9%), and 40 to 44 minutes (42 commuters, 15.2%).
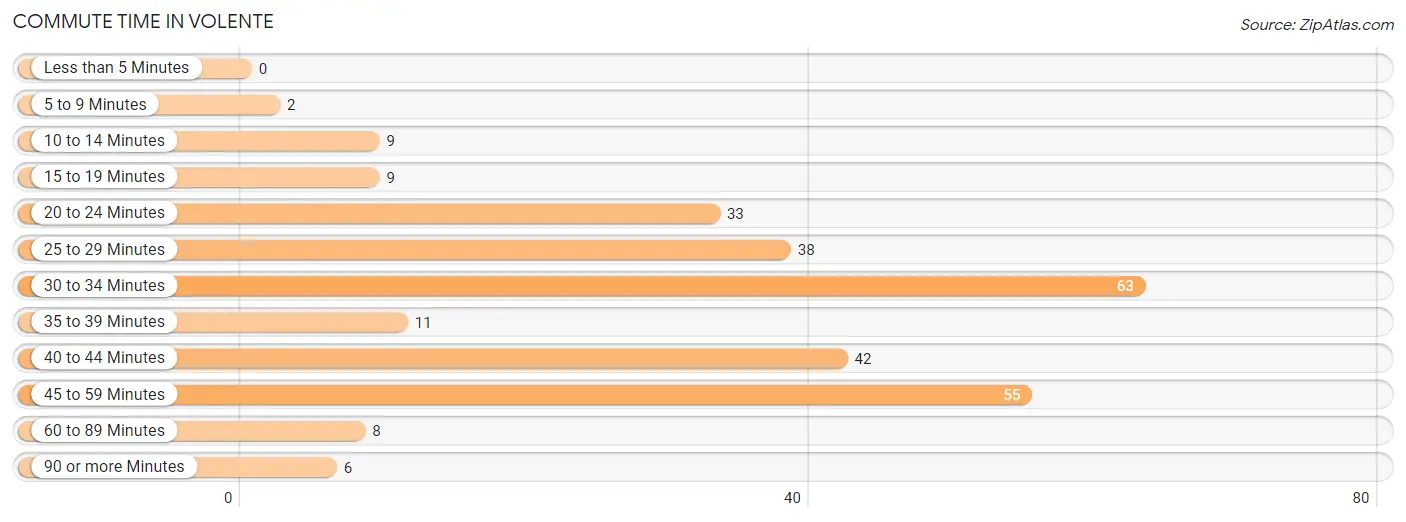
| Commute Time | # Commuters | % Commuters |
| Less than 5 Minutes | 0 | 0.0% |
| 5 to 9 Minutes | 2 | 0.7% |
| 10 to 14 Minutes | 9 | 3.3% |
| 15 to 19 Minutes | 9 | 3.3% |
| 20 to 24 Minutes | 33 | 12.0% |
| 25 to 29 Minutes | 38 | 13.8% |
| 30 to 34 Minutes | 63 | 22.8% |
| 35 to 39 Minutes | 11 | 4.0% |
| 40 to 44 Minutes | 42 | 15.2% |
| 45 to 59 Minutes | 55 | 19.9% |
| 60 to 89 Minutes | 8 | 2.9% |
| 90 or more Minutes | 6 | 2.2% |
Commute Time by Sex in Volente
The most common commute times in Volente are 45 to 59 minutes (33 commuters, 22.5%) for males and 20 to 24 minutes (33 commuters, 25.6%) for females.
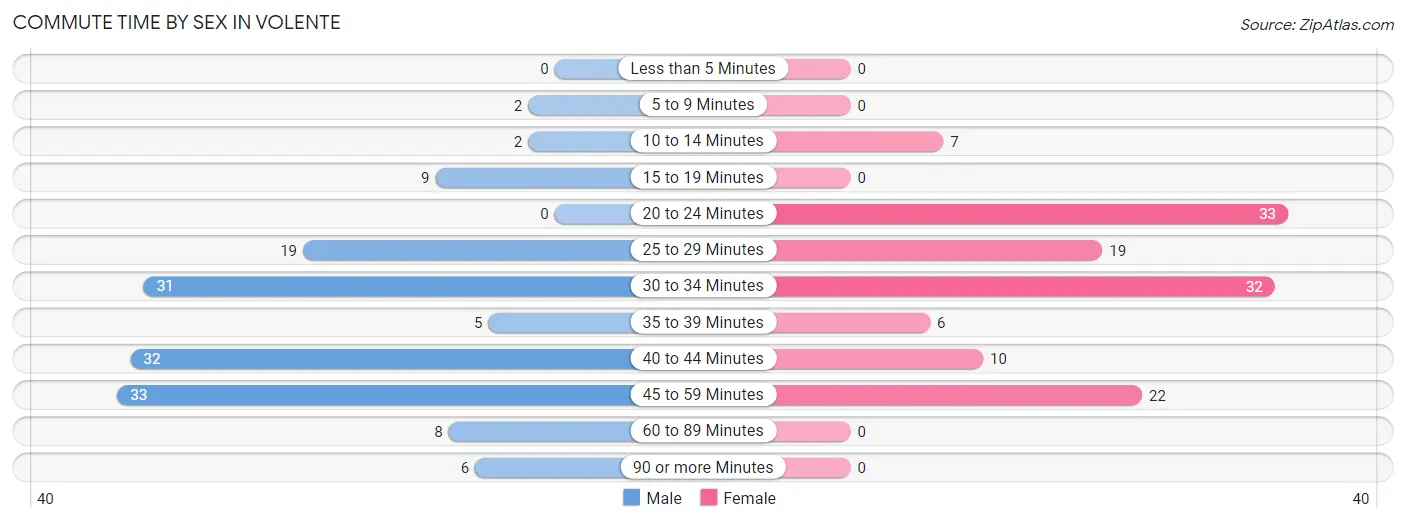
| Commute Time | Male | Female |
| Less than 5 Minutes | 0 (0.0%) | 0 (0.0%) |
| 5 to 9 Minutes | 2 (1.4%) | 0 (0.0%) |
| 10 to 14 Minutes | 2 (1.4%) | 7 (5.4%) |
| 15 to 19 Minutes | 9 (6.1%) | 0 (0.0%) |
| 20 to 24 Minutes | 0 (0.0%) | 33 (25.6%) |
| 25 to 29 Minutes | 19 (12.9%) | 19 (14.7%) |
| 30 to 34 Minutes | 31 (21.1%) | 32 (24.8%) |
| 35 to 39 Minutes | 5 (3.4%) | 6 (4.6%) |
| 40 to 44 Minutes | 32 (21.8%) | 10 (7.7%) |
| 45 to 59 Minutes | 33 (22.5%) | 22 (17.1%) |
| 60 to 89 Minutes | 8 (5.4%) | 0 (0.0%) |
| 90 or more Minutes | 6 (4.1%) | 0 (0.0%) |
Time of Departure to Work by Sex in Volente
The most frequent times of departure to work in Volente are 7:00 AM to 7:29 AM (32, 21.8%) for males and 7:00 AM to 7:29 AM (27, 20.9%) for females.
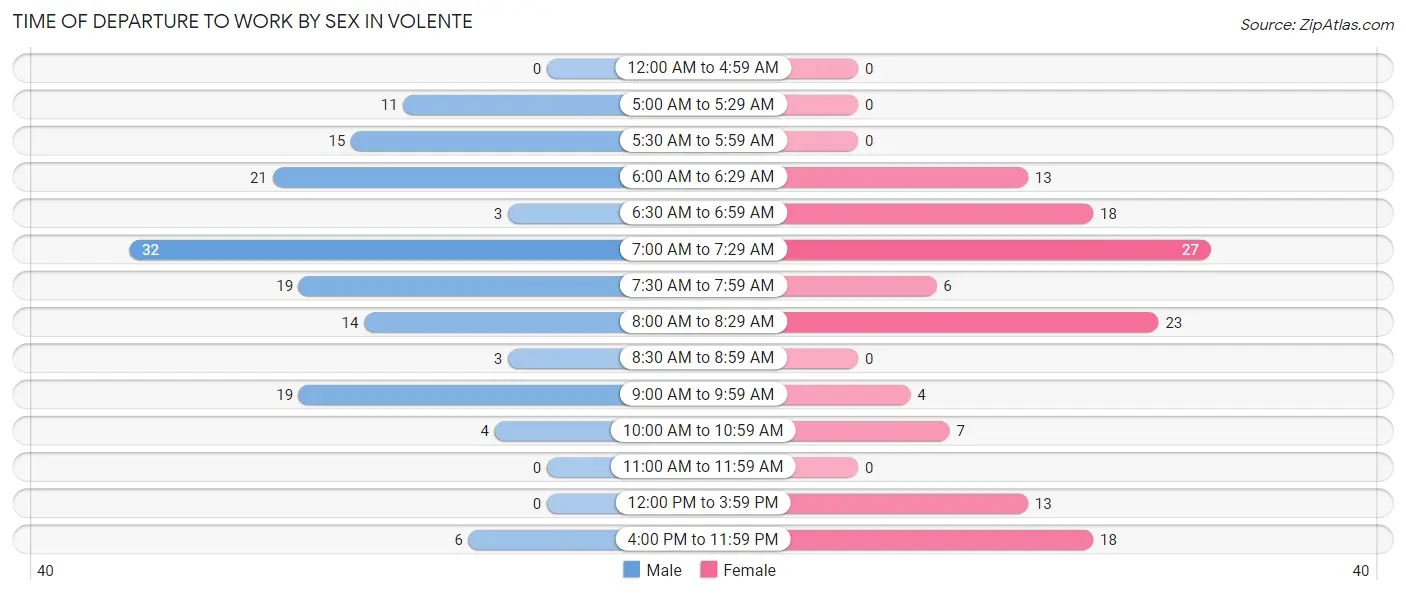
| Time of Departure | Male | Female |
| 12:00 AM to 4:59 AM | 0 (0.0%) | 0 (0.0%) |
| 5:00 AM to 5:29 AM | 11 (7.5%) | 0 (0.0%) |
| 5:30 AM to 5:59 AM | 15 (10.2%) | 0 (0.0%) |
| 6:00 AM to 6:29 AM | 21 (14.3%) | 13 (10.1%) |
| 6:30 AM to 6:59 AM | 3 (2.0%) | 18 (14.0%) |
| 7:00 AM to 7:29 AM | 32 (21.8%) | 27 (20.9%) |
| 7:30 AM to 7:59 AM | 19 (12.9%) | 6 (4.6%) |
| 8:00 AM to 8:29 AM | 14 (9.5%) | 23 (17.8%) |
| 8:30 AM to 8:59 AM | 3 (2.0%) | 0 (0.0%) |
| 9:00 AM to 9:59 AM | 19 (12.9%) | 4 (3.1%) |
| 10:00 AM to 10:59 AM | 4 (2.7%) | 7 (5.4%) |
| 11:00 AM to 11:59 AM | 0 (0.0%) | 0 (0.0%) |
| 12:00 PM to 3:59 PM | 0 (0.0%) | 13 (10.1%) |
| 4:00 PM to 11:59 PM | 6 (4.1%) | 18 (14.0%) |
| Total | 147 (100.0%) | 129 (100.0%) |
Housing Occupancy in Volente
Occupancy by Ownership in Volente
Of the total 320 dwellings in Volente, owner-occupied units account for 257 (80.3%), while renter-occupied units make up 63 (19.7%).
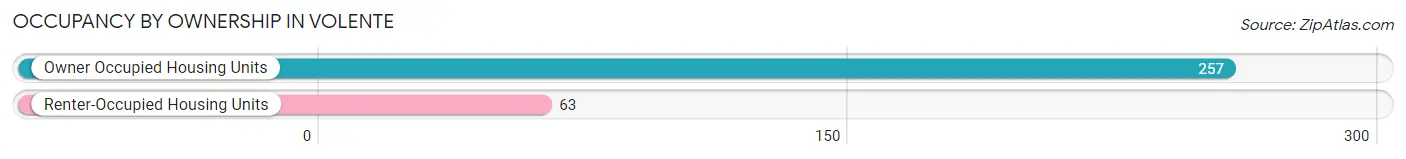
| Occupancy | # Housing Units | % Housing Units |
| Owner Occupied Housing Units | 257 | 80.3% |
| Renter-Occupied Housing Units | 63 | 19.7% |
| Total Occupied Housing Units | 320 | 100.0% |
Occupancy by Household Size in Volente
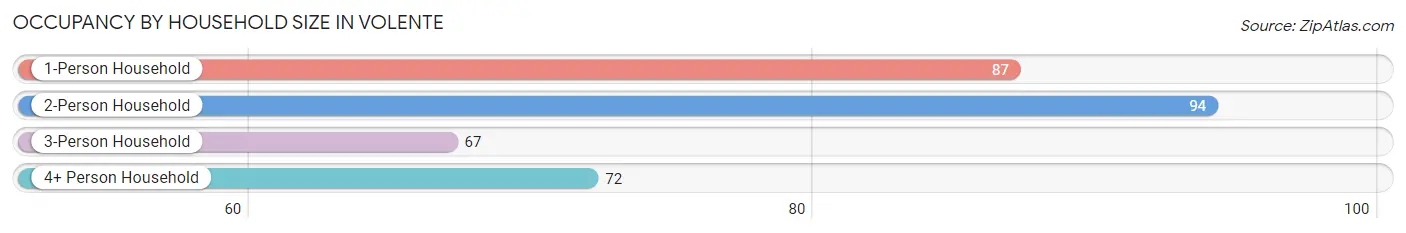
| Household Size | # Housing Units | % Housing Units |
| 1-Person Household | 87 | 27.2% |
| 2-Person Household | 94 | 29.4% |
| 3-Person Household | 67 | 20.9% |
| 4+ Person Household | 72 | 22.5% |
| Total Housing Units | 320 | 100.0% |
Occupancy by Ownership by Household Size in Volente
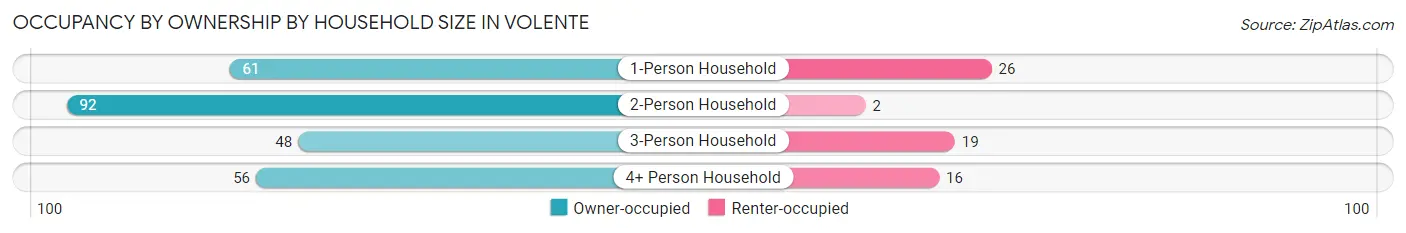
| Household Size | Owner-occupied | Renter-occupied |
| 1-Person Household | 61 (70.1%) | 26 (29.9%) |
| 2-Person Household | 92 (97.9%) | 2 (2.1%) |
| 3-Person Household | 48 (71.6%) | 19 (28.4%) |
| 4+ Person Household | 56 (77.8%) | 16 (22.2%) |
| Total Housing Units | 257 (80.3%) | 63 (19.7%) |
Occupancy by Educational Attainment in Volente
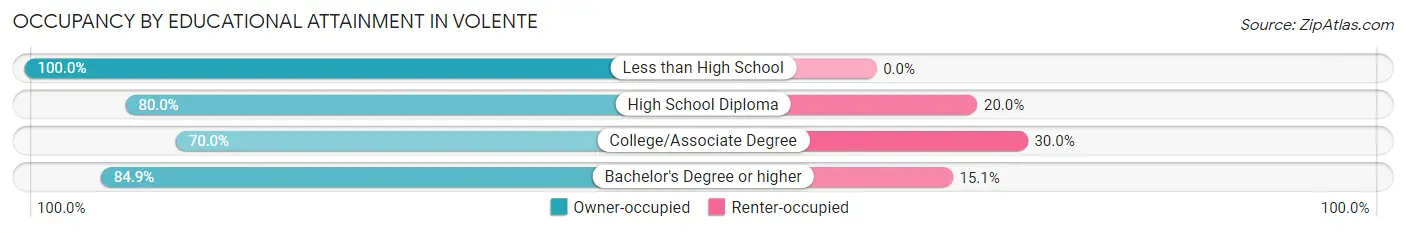
| Household Size | Owner-occupied | Renter-occupied |
| Less than High School | 5 (100.0%) | 0 (0.0%) |
| High School Diploma | 32 (80.0%) | 8 (20.0%) |
| College/Associate Degree | 63 (70.0%) | 27 (30.0%) |
| Bachelor's Degree or higher | 157 (84.9%) | 28 (15.1%) |
Occupancy by Age of Householder in Volente
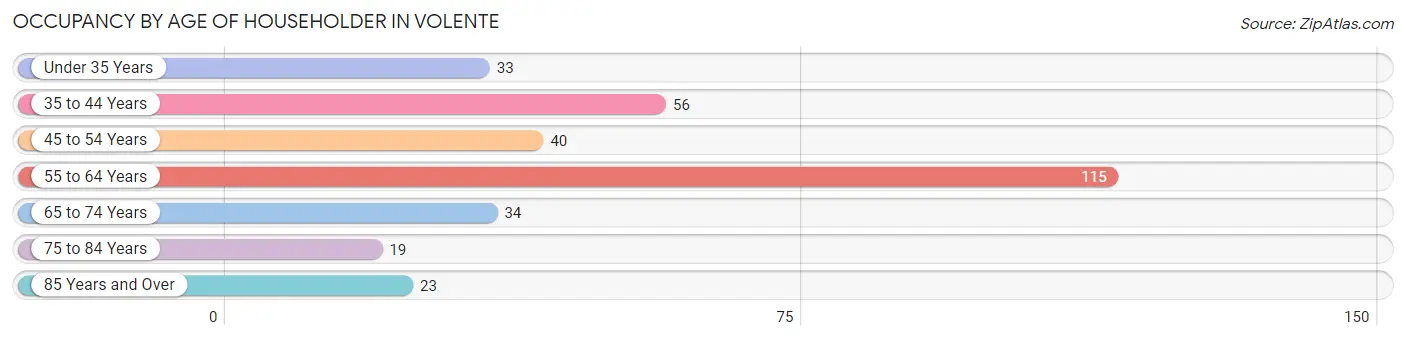
| Age Bracket | # Households | % Households |
| Under 35 Years | 33 | 10.3% |
| 35 to 44 Years | 56 | 17.5% |
| 45 to 54 Years | 40 | 12.5% |
| 55 to 64 Years | 115 | 35.9% |
| 65 to 74 Years | 34 | 10.6% |
| 75 to 84 Years | 19 | 5.9% |
| 85 Years and Over | 23 | 7.2% |
| Total | 320 | 100.0% |
Housing Finances in Volente
Median Income by Occupancy in Volente
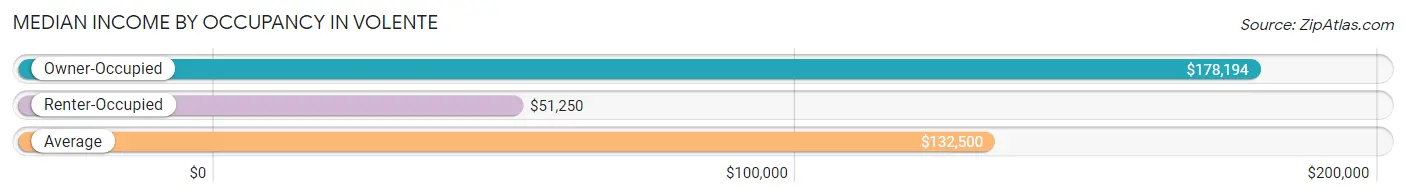
| Occupancy Type | # Households | Median Income |
| Owner-Occupied | 257 (80.3%) | $178,194 |
| Renter-Occupied | 63 (19.7%) | $51,250 |
| Average | 320 (100.0%) | $132,500 |
Occupancy by Householder Income Bracket in Volente
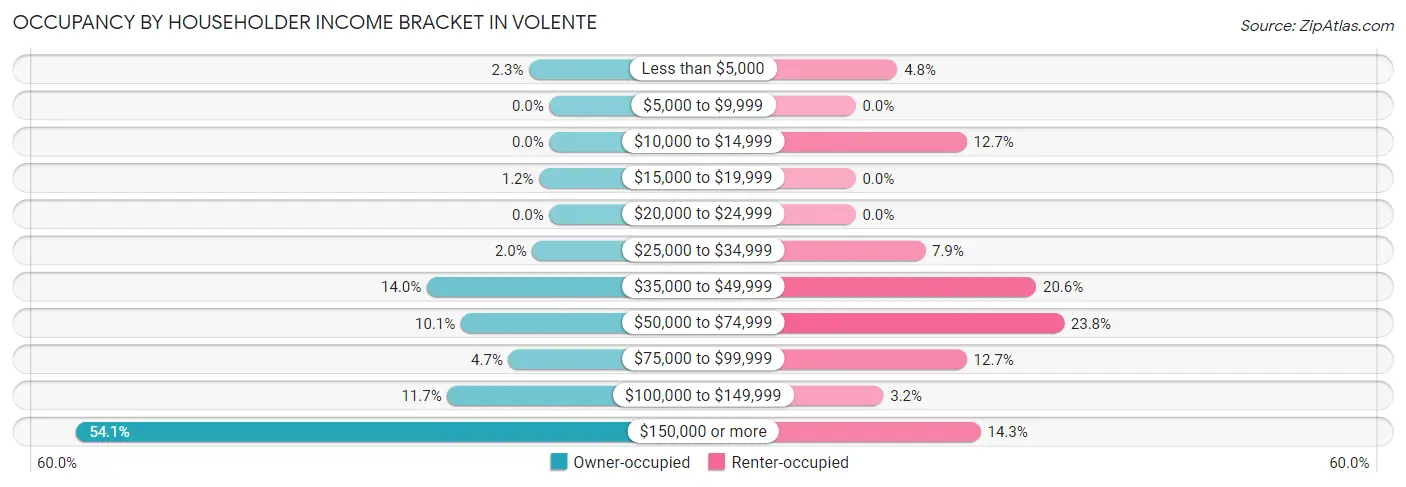
| Income Bracket | Owner-occupied | Renter-occupied |
| Less than $5,000 | 6 (2.3%) | 3 (4.8%) |
| $5,000 to $9,999 | 0 (0.0%) | 0 (0.0%) |
| $10,000 to $14,999 | 0 (0.0%) | 8 (12.7%) |
| $15,000 to $19,999 | 3 (1.2%) | 0 (0.0%) |
| $20,000 to $24,999 | 0 (0.0%) | 0 (0.0%) |
| $25,000 to $34,999 | 5 (1.9%) | 5 (7.9%) |
| $35,000 to $49,999 | 36 (14.0%) | 13 (20.6%) |
| $50,000 to $74,999 | 26 (10.1%) | 15 (23.8%) |
| $75,000 to $99,999 | 12 (4.7%) | 8 (12.7%) |
| $100,000 to $149,999 | 30 (11.7%) | 2 (3.2%) |
| $150,000 or more | 139 (54.1%) | 9 (14.3%) |
| Total | 257 (100.0%) | 63 (100.0%) |
Monthly Housing Cost Tiers in Volente
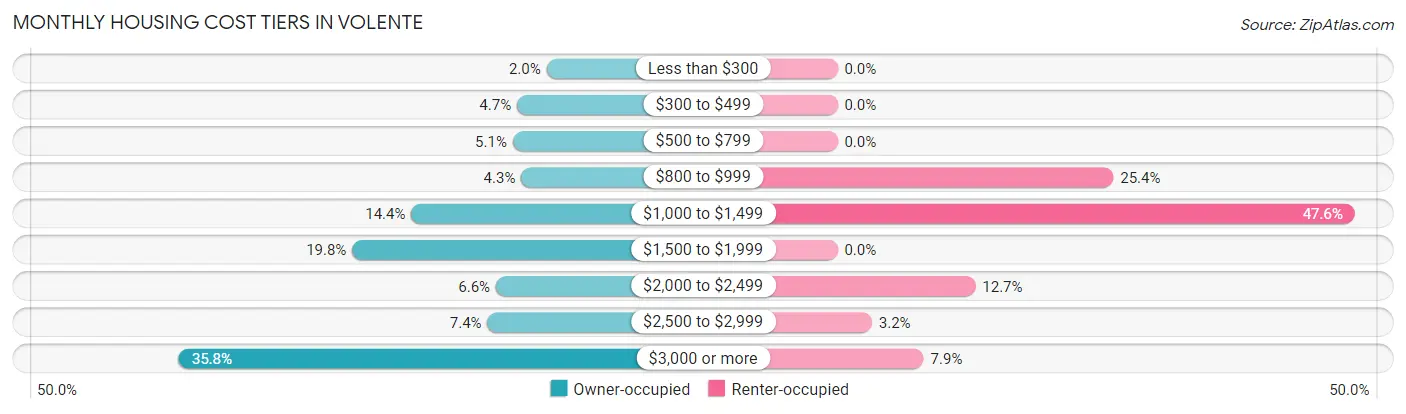
| Monthly Cost | Owner-occupied | Renter-occupied |
| Less than $300 | 5 (1.9%) | 0 (0.0%) |
| $300 to $499 | 12 (4.7%) | 0 (0.0%) |
| $500 to $799 | 13 (5.1%) | 0 (0.0%) |
| $800 to $999 | 11 (4.3%) | 16 (25.4%) |
| $1,000 to $1,499 | 37 (14.4%) | 30 (47.6%) |
| $1,500 to $1,999 | 51 (19.8%) | 0 (0.0%) |
| $2,000 to $2,499 | 17 (6.6%) | 8 (12.7%) |
| $2,500 to $2,999 | 19 (7.4%) | 2 (3.2%) |
| $3,000 or more | 92 (35.8%) | 5 (7.9%) |
| Total | 257 (100.0%) | 63 (100.0%) |
Physical Housing Characteristics in Volente
Housing Structures in Volente
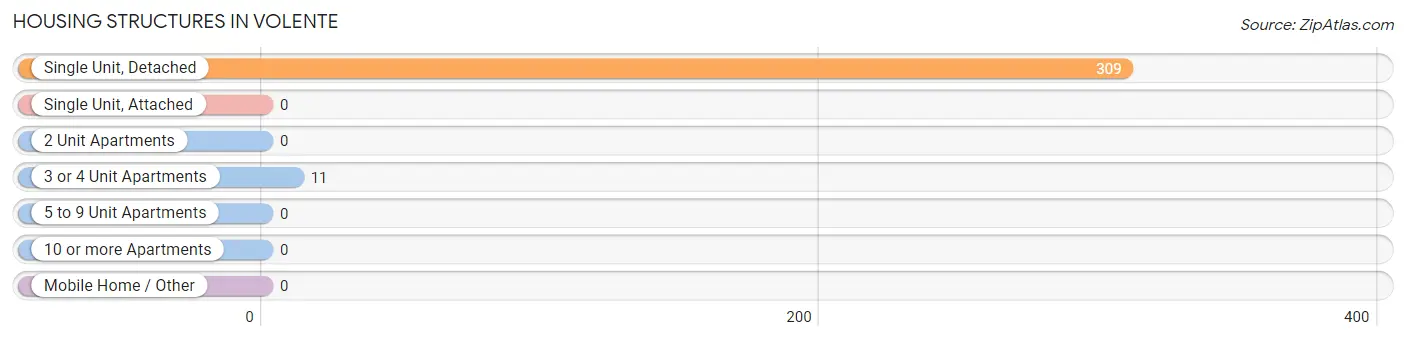
| Structure Type | # Housing Units | % Housing Units |
| Single Unit, Detached | 309 | 96.6% |
| Single Unit, Attached | 0 | 0.0% |
| 2 Unit Apartments | 0 | 0.0% |
| 3 or 4 Unit Apartments | 11 | 3.4% |
| 5 to 9 Unit Apartments | 0 | 0.0% |
| 10 or more Apartments | 0 | 0.0% |
| Mobile Home / Other | 0 | 0.0% |
| Total | 320 | 100.0% |
Housing Structures by Occupancy in Volente
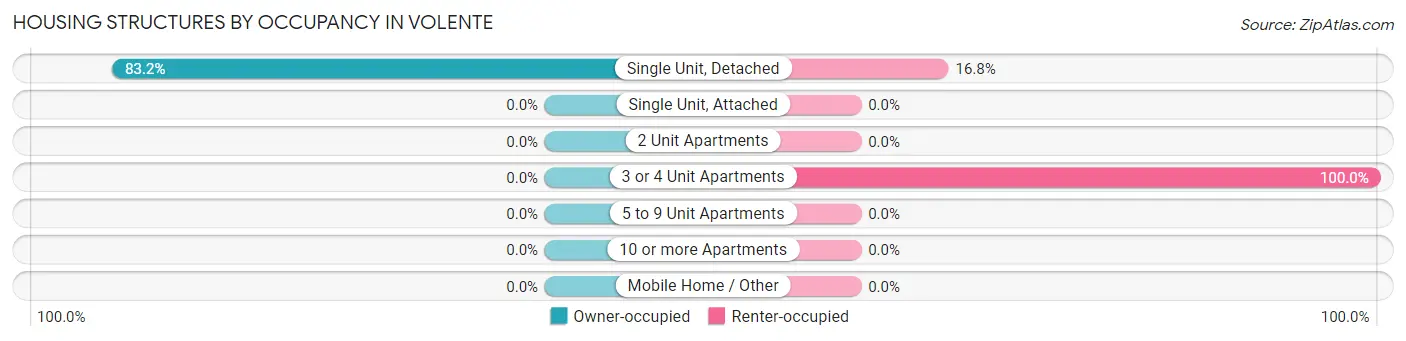
| Structure Type | Owner-occupied | Renter-occupied |
| Single Unit, Detached | 257 (83.2%) | 52 (16.8%) |
| Single Unit, Attached | 0 (0.0%) | 0 (0.0%) |
| 2 Unit Apartments | 0 (0.0%) | 0 (0.0%) |
| 3 or 4 Unit Apartments | 0 (0.0%) | 11 (100.0%) |
| 5 to 9 Unit Apartments | 0 (0.0%) | 0 (0.0%) |
| 10 or more Apartments | 0 (0.0%) | 0 (0.0%) |
| Mobile Home / Other | 0 (0.0%) | 0 (0.0%) |
| Total | 257 (80.3%) | 63 (19.7%) |
Housing Structures by Number of Rooms in Volente
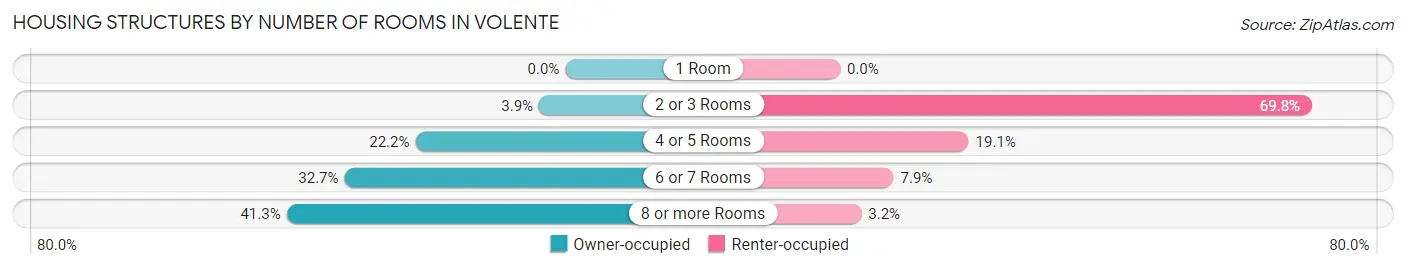
| Number of Rooms | Owner-occupied | Renter-occupied |
| 1 Room | 0 (0.0%) | 0 (0.0%) |
| 2 or 3 Rooms | 10 (3.9%) | 44 (69.8%) |
| 4 or 5 Rooms | 57 (22.2%) | 12 (19.1%) |
| 6 or 7 Rooms | 84 (32.7%) | 5 (7.9%) |
| 8 or more Rooms | 106 (41.2%) | 2 (3.2%) |
| Total | 257 (100.0%) | 63 (100.0%) |
Housing Structure by Heating Type in Volente
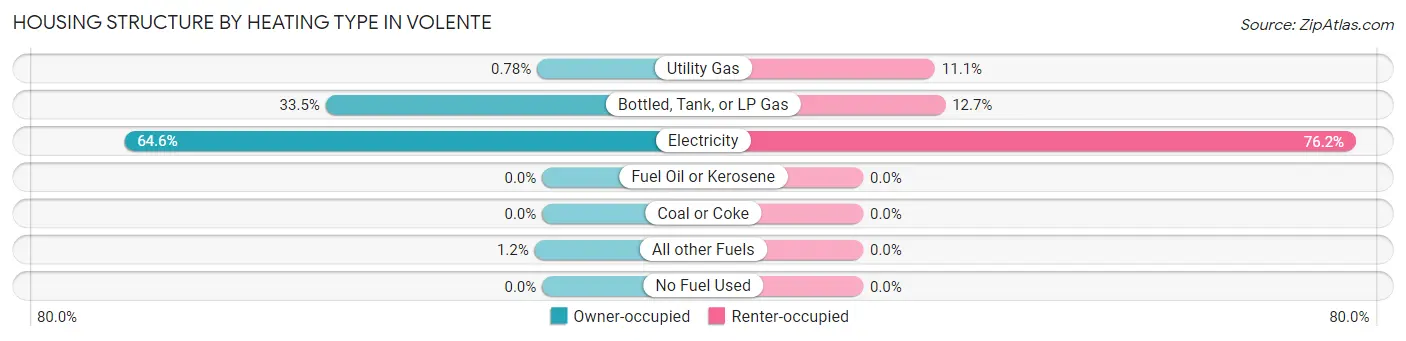
| Heating Type | Owner-occupied | Renter-occupied |
| Utility Gas | 2 (0.8%) | 7 (11.1%) |
| Bottled, Tank, or LP Gas | 86 (33.5%) | 8 (12.7%) |
| Electricity | 166 (64.6%) | 48 (76.2%) |
| Fuel Oil or Kerosene | 0 (0.0%) | 0 (0.0%) |
| Coal or Coke | 0 (0.0%) | 0 (0.0%) |
| All other Fuels | 3 (1.2%) | 0 (0.0%) |
| No Fuel Used | 0 (0.0%) | 0 (0.0%) |
| Total | 257 (100.0%) | 63 (100.0%) |
Household Vehicle Usage in Volente
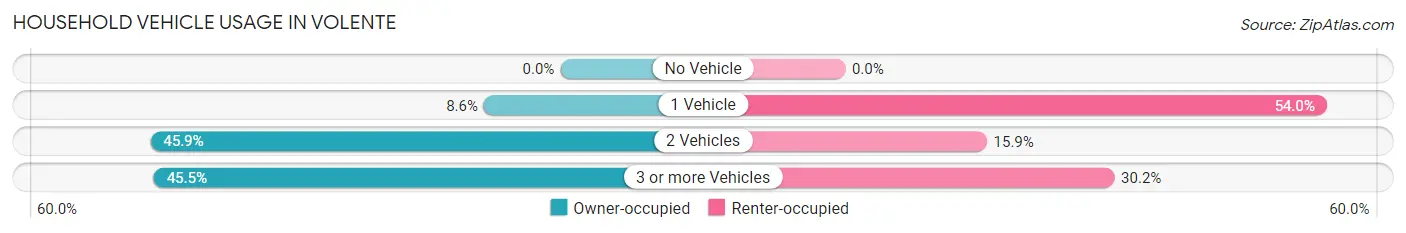
| Vehicles per Household | Owner-occupied | Renter-occupied |
| No Vehicle | 0 (0.0%) | 0 (0.0%) |
| 1 Vehicle | 22 (8.6%) | 34 (54.0%) |
| 2 Vehicles | 118 (45.9%) | 10 (15.9%) |
| 3 or more Vehicles | 117 (45.5%) | 19 (30.2%) |
| Total | 257 (100.0%) | 63 (100.0%) |
Real Estate & Mortgages in Volente
Real Estate and Mortgage Overview in Volente
| Characteristic | Without Mortgage | With Mortgage |
| Housing Units | 157 | 100 |
| Median Property Value | $1,091,100 | $923,900 |
| Median Household Income | $107,031 | $68 |
| Monthly Housing Costs | $1,501 | $81 |
| Real Estate Taxes | $10,001 | $0 |
Property Value by Mortgage Status in Volente
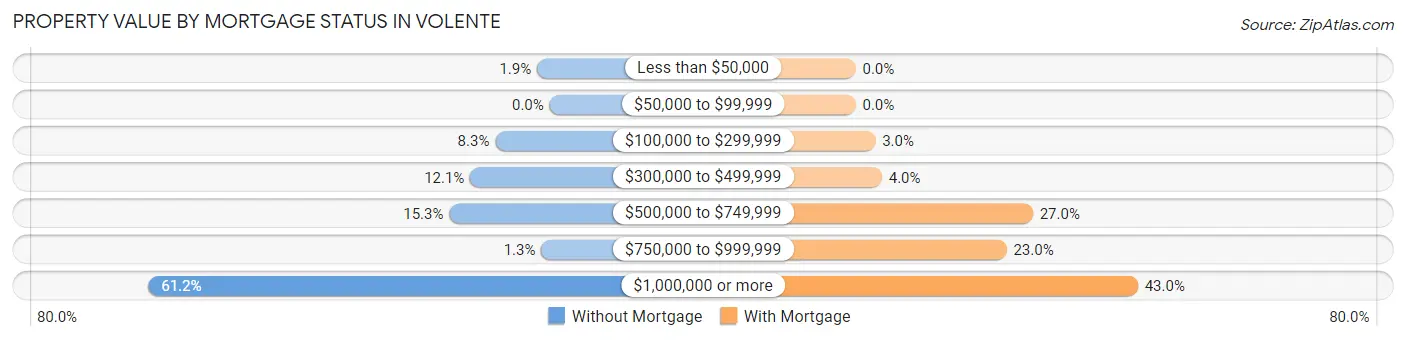
| Property Value | Without Mortgage | With Mortgage |
| Less than $50,000 | 3 (1.9%) | 0 (0.0%) |
| $50,000 to $99,999 | 0 (0.0%) | 0 (0.0%) |
| $100,000 to $299,999 | 13 (8.3%) | 3 (3.0%) |
| $300,000 to $499,999 | 19 (12.1%) | 4 (4.0%) |
| $500,000 to $749,999 | 24 (15.3%) | 27 (27.0%) |
| $750,000 to $999,999 | 2 (1.3%) | 23 (23.0%) |
| $1,000,000 or more | 96 (61.2%) | 43 (43.0%) |
| Total | 157 (100.0%) | 100 (100.0%) |
Household Income by Mortgage Status in Volente
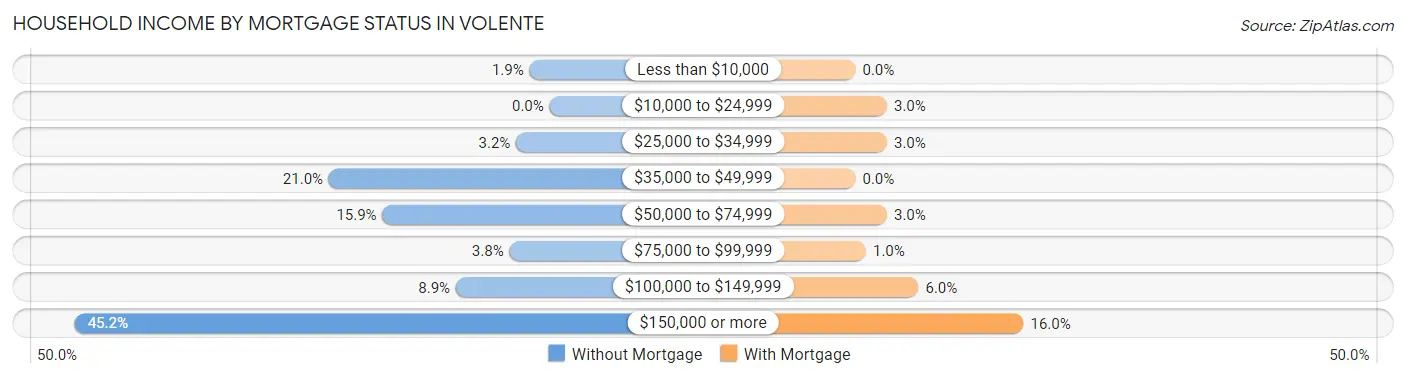
| Household Income | Without Mortgage | With Mortgage |
| Less than $10,000 | 3 (1.9%) | 0 (0.0%) |
| $10,000 to $24,999 | 0 (0.0%) | 3 (3.0%) |
| $25,000 to $34,999 | 5 (3.2%) | 3 (3.0%) |
| $35,000 to $49,999 | 33 (21.0%) | 0 (0.0%) |
| $50,000 to $74,999 | 25 (15.9%) | 3 (3.0%) |
| $75,000 to $99,999 | 6 (3.8%) | 1 (1.0%) |
| $100,000 to $149,999 | 14 (8.9%) | 6 (6.0%) |
| $150,000 or more | 71 (45.2%) | 16 (16.0%) |
| Total | 157 (100.0%) | 100 (100.0%) |
Property Value to Household Income Ratio in Volente
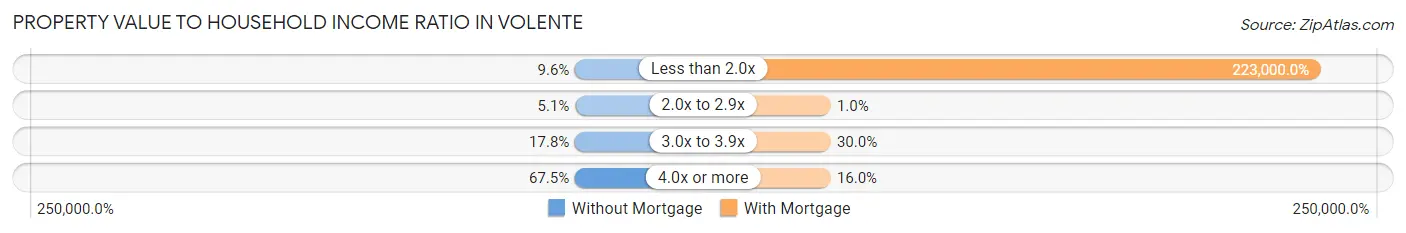
| Value-to-Income Ratio | Without Mortgage | With Mortgage |
| Less than 2.0x | 15 (9.6%) | 223,000 (223,000.0%) |
| 2.0x to 2.9x | 8 (5.1%) | 1 (1.0%) |
| 3.0x to 3.9x | 28 (17.8%) | 30 (30.0%) |
| 4.0x or more | 106 (67.5%) | 16 (16.0%) |
| Total | 157 (100.0%) | 100 (100.0%) |
Real Estate Taxes by Mortgage Status in Volente
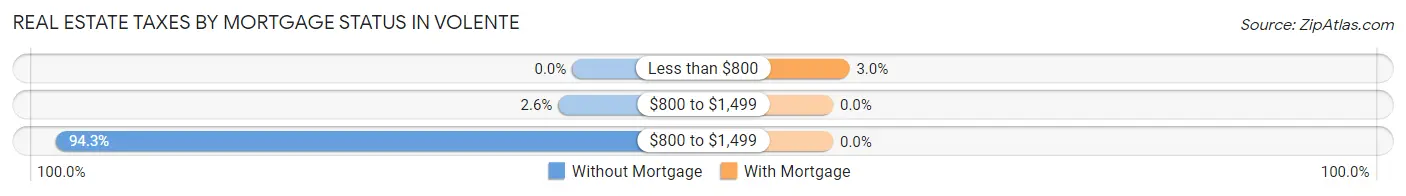
| Property Taxes | Without Mortgage | With Mortgage |
| Less than $800 | 0 (0.0%) | 3 (3.0%) |
| $800 to $1,499 | 4 (2.5%) | 0 (0.0%) |
| $800 to $1,499 | 148 (94.3%) | 0 (0.0%) |
| Total | 157 (100.0%) | 100 (100.0%) |
Health & Disability in Volente
Health Insurance Coverage by Age in Volente
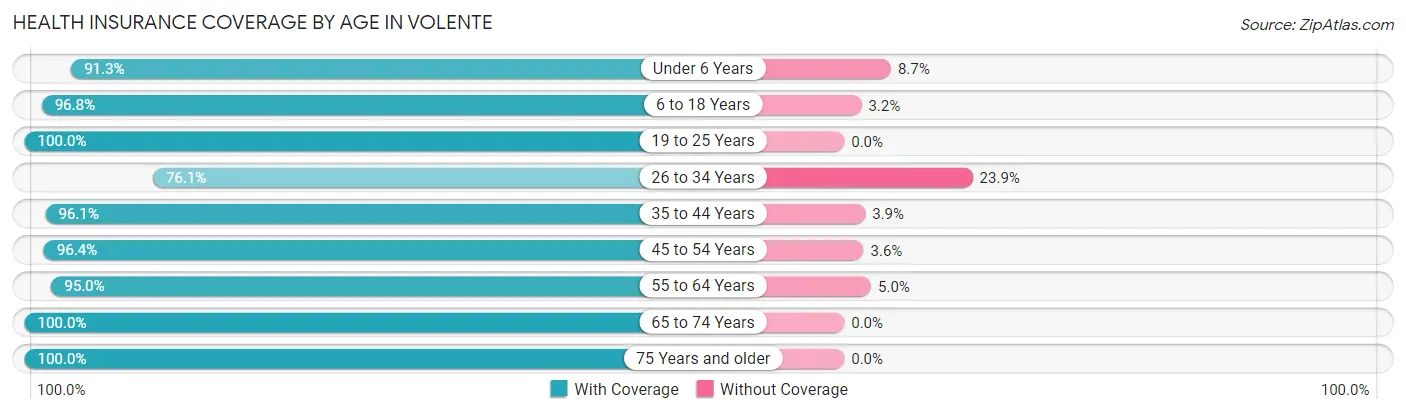
| Age Bracket | With Coverage | Without Coverage |
| Under 6 Years | 63 (91.3%) | 6 (8.7%) |
| 6 to 18 Years | 121 (96.8%) | 4 (3.2%) |
| 19 to 25 Years | 38 (100.0%) | 0 (0.0%) |
| 26 to 34 Years | 54 (76.1%) | 17 (23.9%) |
| 35 to 44 Years | 74 (96.1%) | 3 (3.9%) |
| 45 to 54 Years | 107 (96.4%) | 4 (3.6%) |
| 55 to 64 Years | 171 (95.0%) | 9 (5.0%) |
| 65 to 74 Years | 59 (100.0%) | 0 (0.0%) |
| 75 Years and older | 49 (100.0%) | 0 (0.0%) |
| Total | 736 (94.5%) | 43 (5.5%) |
Health Insurance Coverage by Citizenship Status in Volente
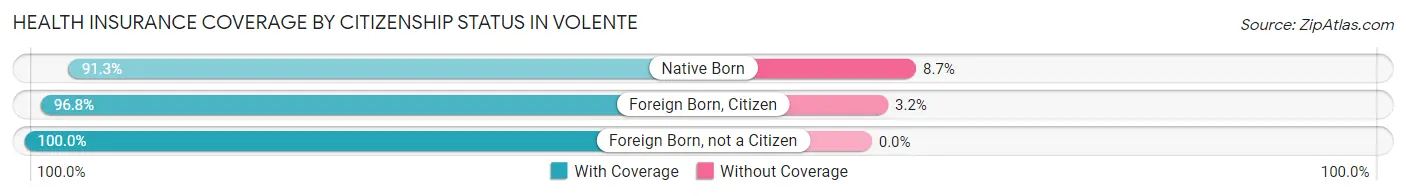
| Citizenship Status | With Coverage | Without Coverage |
| Native Born | 63 (91.3%) | 6 (8.7%) |
| Foreign Born, Citizen | 121 (96.8%) | 4 (3.2%) |
| Foreign Born, not a Citizen | 38 (100.0%) | 0 (0.0%) |
Health Insurance Coverage by Household Income in Volente
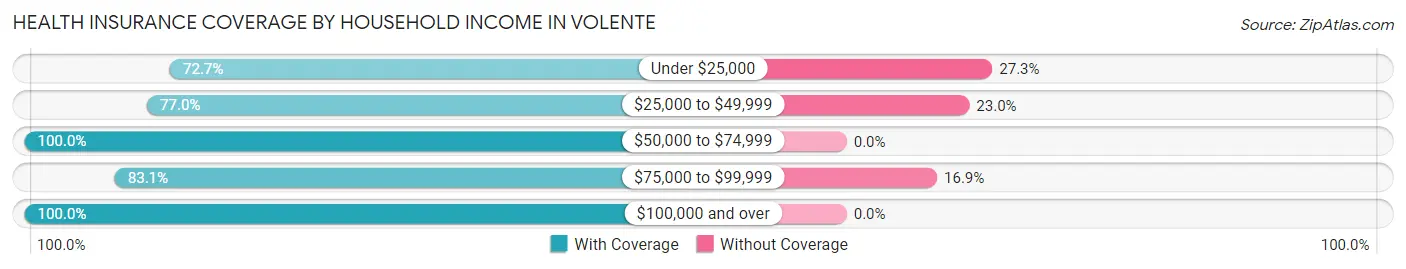
| Household Income | With Coverage | Without Coverage |
| Under $25,000 | 40 (72.7%) | 15 (27.3%) |
| $25,000 to $49,999 | 57 (77.0%) | 17 (23.0%) |
| $50,000 to $74,999 | 93 (100.0%) | 0 (0.0%) |
| $75,000 to $99,999 | 54 (83.1%) | 11 (16.9%) |
| $100,000 and over | 492 (100.0%) | 0 (0.0%) |
Public vs Private Health Insurance Coverage by Age in Volente
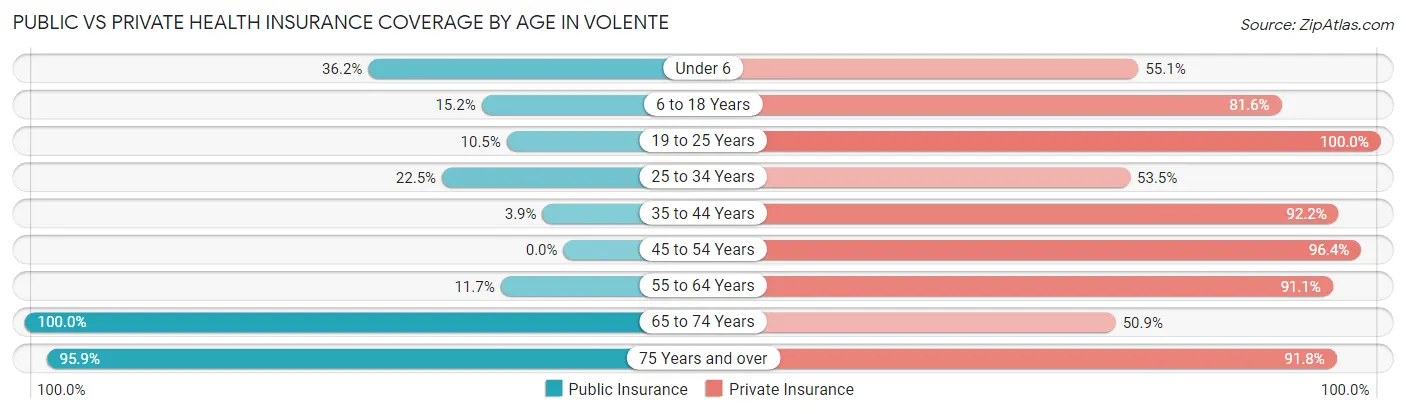
| Age Bracket | Public Insurance | Private Insurance |
| Under 6 | 25 (36.2%) | 38 (55.1%) |
| 6 to 18 Years | 19 (15.2%) | 102 (81.6%) |
| 19 to 25 Years | 4 (10.5%) | 38 (100.0%) |
| 25 to 34 Years | 16 (22.5%) | 38 (53.5%) |
| 35 to 44 Years | 3 (3.9%) | 71 (92.2%) |
| 45 to 54 Years | 0 (0.0%) | 107 (96.4%) |
| 55 to 64 Years | 21 (11.7%) | 164 (91.1%) |
| 65 to 74 Years | 59 (100.0%) | 30 (50.8%) |
| 75 Years and over | 47 (95.9%) | 45 (91.8%) |
| Total | 194 (24.9%) | 633 (81.3%) |
Disability Status by Sex by Age in Volente
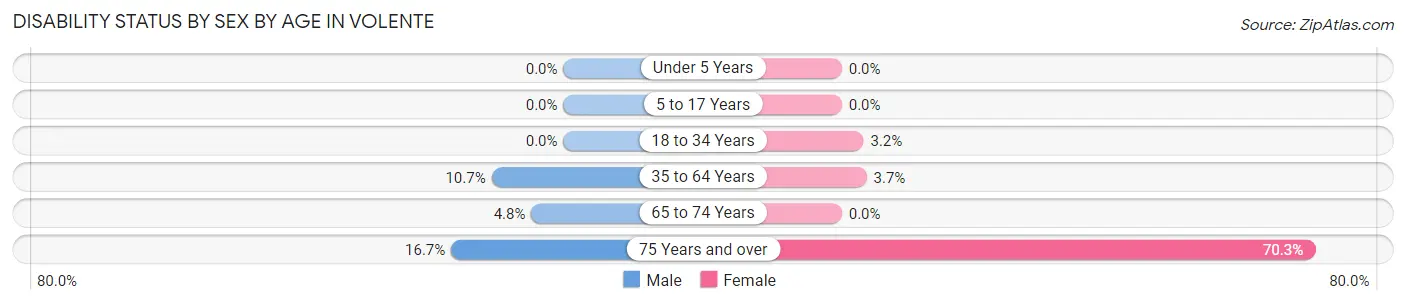
| Age Bracket | Male | Female |
| Under 5 Years | 0 (0.0%) | 0 (0.0%) |
| 5 to 17 Years | 0 (0.0%) | 0 (0.0%) |
| 18 to 34 Years | 0 (0.0%) | 2 (3.2%) |
| 35 to 64 Years | 19 (10.7%) | 7 (3.7%) |
| 65 to 74 Years | 2 (4.8%) | 0 (0.0%) |
| 75 Years and over | 2 (16.7%) | 26 (70.3%) |
Disability Class by Sex by Age in Volente
Disability Class: Hearing Difficulty
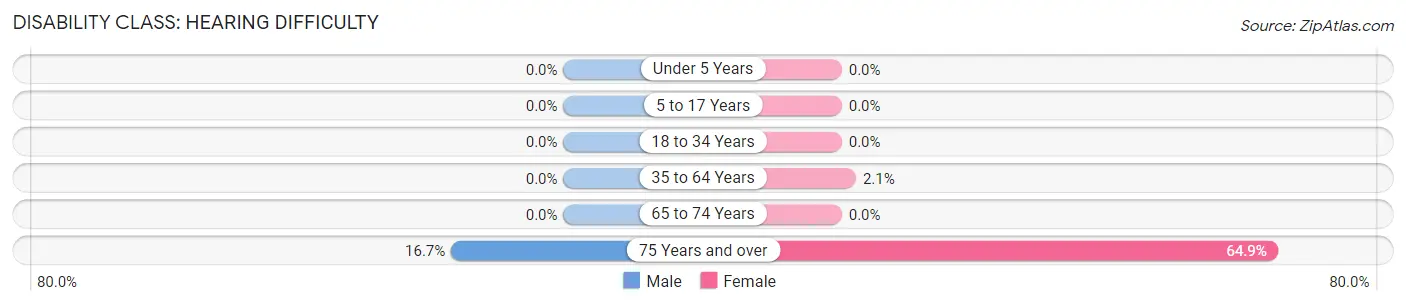
| Age Bracket | Male | Female |
| Under 5 Years | 0 (0.0%) | 0 (0.0%) |
| 5 to 17 Years | 0 (0.0%) | 0 (0.0%) |
| 18 to 34 Years | 0 (0.0%) | 0 (0.0%) |
| 35 to 64 Years | 0 (0.0%) | 4 (2.1%) |
| 65 to 74 Years | 0 (0.0%) | 0 (0.0%) |
| 75 Years and over | 2 (16.7%) | 24 (64.9%) |
Disability Class: Vision Difficulty
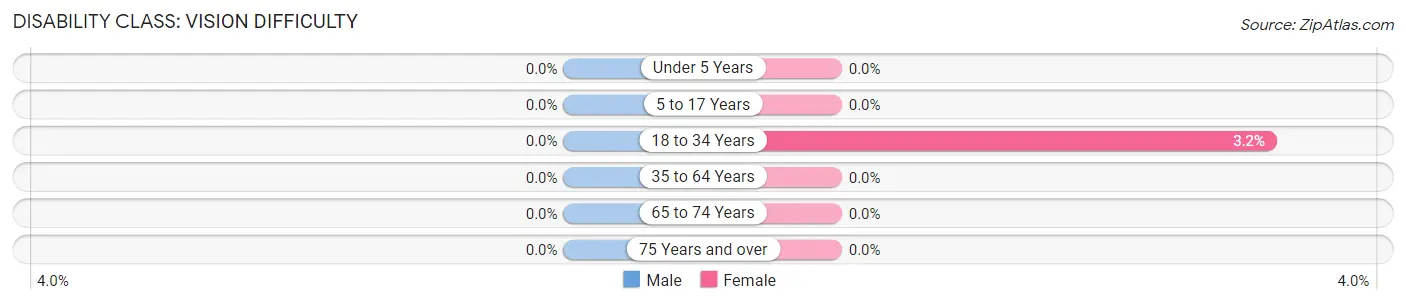
| Age Bracket | Male | Female |
| Under 5 Years | 0 (0.0%) | 0 (0.0%) |
| 5 to 17 Years | 0 (0.0%) | 0 (0.0%) |
| 18 to 34 Years | 0 (0.0%) | 2 (3.2%) |
| 35 to 64 Years | 0 (0.0%) | 0 (0.0%) |
| 65 to 74 Years | 0 (0.0%) | 0 (0.0%) |
| 75 Years and over | 0 (0.0%) | 0 (0.0%) |
Disability Class: Cognitive Difficulty
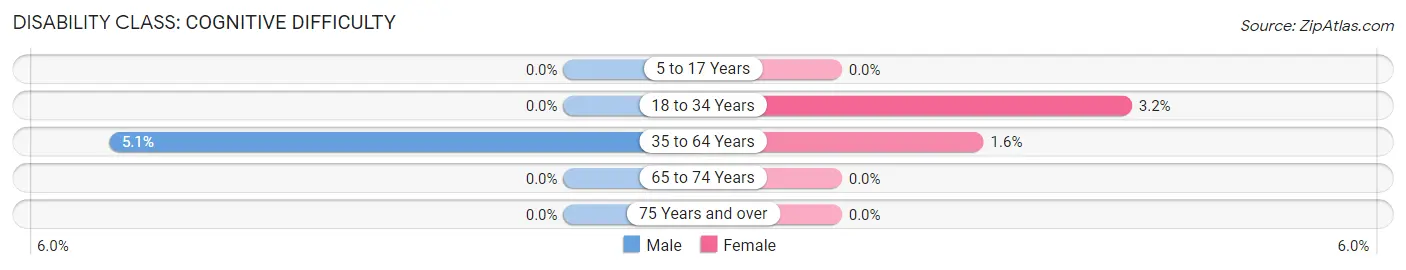
| Age Bracket | Male | Female |
| 5 to 17 Years | 0 (0.0%) | 0 (0.0%) |
| 18 to 34 Years | 0 (0.0%) | 2 (3.2%) |
| 35 to 64 Years | 9 (5.1%) | 3 (1.6%) |
| 65 to 74 Years | 0 (0.0%) | 0 (0.0%) |
| 75 Years and over | 0 (0.0%) | 0 (0.0%) |
Disability Class: Ambulatory Difficulty
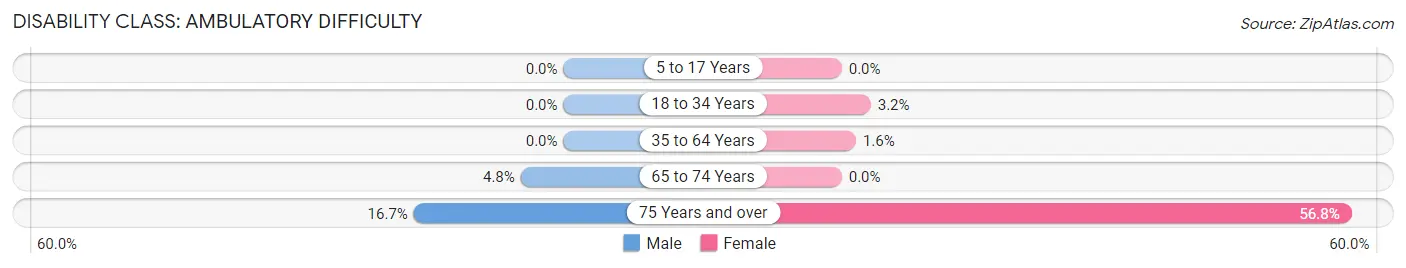
| Age Bracket | Male | Female |
| 5 to 17 Years | 0 (0.0%) | 0 (0.0%) |
| 18 to 34 Years | 0 (0.0%) | 2 (3.2%) |
| 35 to 64 Years | 0 (0.0%) | 3 (1.6%) |
| 65 to 74 Years | 2 (4.8%) | 0 (0.0%) |
| 75 Years and over | 2 (16.7%) | 21 (56.8%) |
Disability Class: Self-Care Difficulty
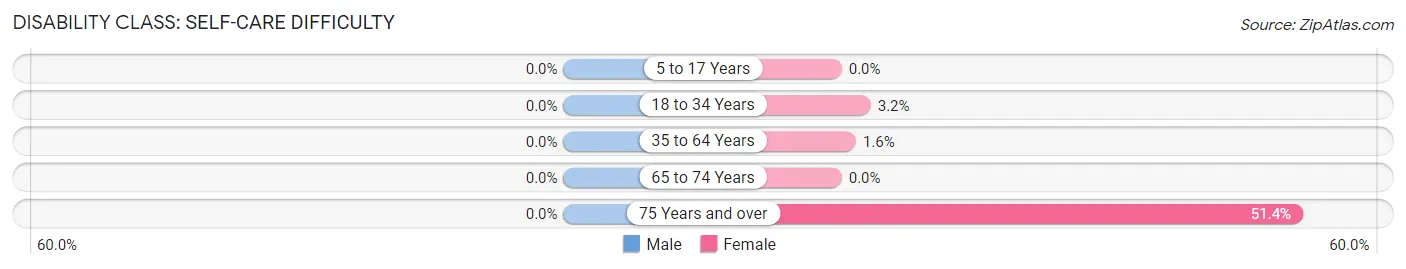
| Age Bracket | Male | Female |
| 5 to 17 Years | 0 (0.0%) | 0 (0.0%) |
| 18 to 34 Years | 0 (0.0%) | 2 (3.2%) |
| 35 to 64 Years | 0 (0.0%) | 3 (1.6%) |
| 65 to 74 Years | 0 (0.0%) | 0 (0.0%) |
| 75 Years and over | 0 (0.0%) | 19 (51.3%) |
Technology Access in Volente
Computing Device Access in Volente
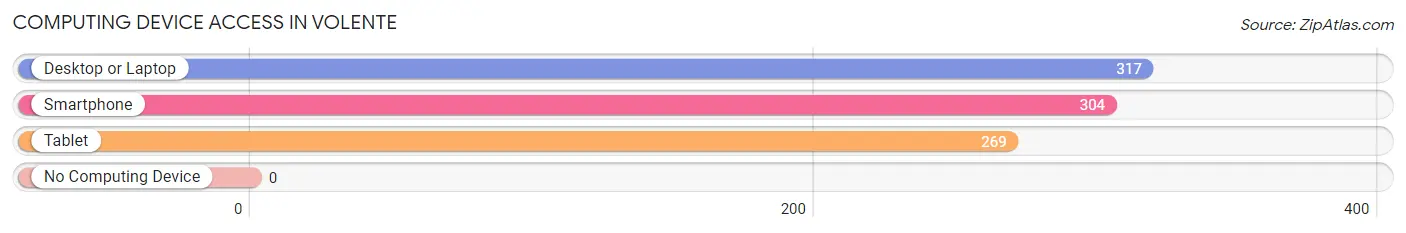
| Device Type | # Households | % Households |
| Desktop or Laptop | 317 | 99.1% |
| Smartphone | 304 | 95.0% |
| Tablet | 269 | 84.1% |
| No Computing Device | 0 | 0.0% |
| Total | 320 | 100.0% |
Internet Access in Volente
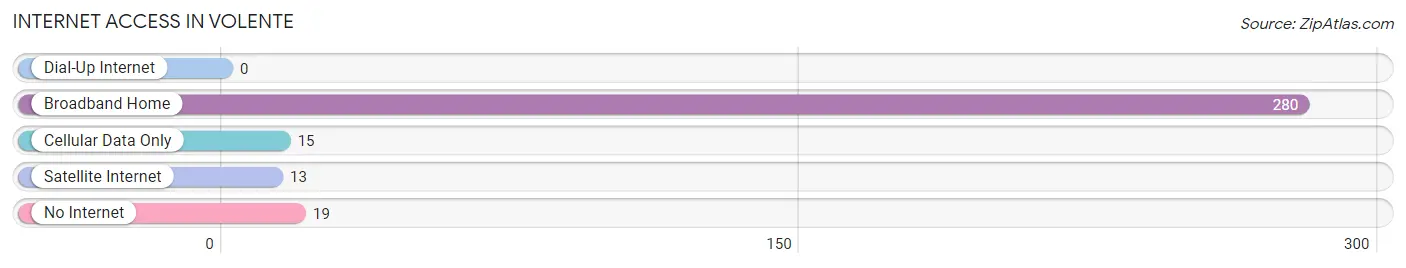
| Internet Type | # Households | % Households |
| Dial-Up Internet | 0 | 0.0% |
| Broadband Home | 280 | 87.5% |
| Cellular Data Only | 15 | 4.7% |
| Satellite Internet | 13 | 4.1% |
| No Internet | 19 | 5.9% |
| Total | 320 | 100.0% |
Volente Summary
Volente, Texas is a small unincorporated community located in Travis County, Texas. It is situated on the western edge of the Austin metropolitan area, approximately 20 miles northwest of downtown Austin. The population of Volente was estimated to be 1,072 in 2019.
History
Volente was first settled in the late 1800s by German immigrants. The town was originally known as “Volente Station” and was a stop on the Austin and Northwestern Railroad. The town was officially incorporated in 1891 and was named after the Volente family, who were prominent landowners in the area.
In the early 1900s, Volente was a thriving agricultural community. The town was home to several cotton gins, a general store, a blacksmith shop, and a post office. The town also had a school, which was built in 1910 and served the community until it closed in the 1950s.
In the late 1950s, the town began to decline as many of its residents moved away in search of better economic opportunities. The town’s population decreased from a peak of around 500 in the 1950s to just over 100 in the 2000s.
Geography
Volente is located in western Travis County, approximately 20 miles northwest of downtown Austin. The town is situated on the western edge of the Austin metropolitan area and is bordered by Lake Travis to the north and the Balcones Canyonlands National Wildlife Refuge to the south.
The terrain around Volente is mostly flat with some rolling hills. The town is located at an elevation of approximately 800 feet above sea level. The climate in Volente is generally mild, with temperatures ranging from the mid-50s in the winter to the mid-90s in the summer.
Economy
The economy of Volente is largely based on tourism and recreation. The town is home to several popular attractions, including the Volente Beach Water Park, the Volente Boat Club, and the Volente Hills Golf Course.
The town is also home to several small businesses, including restaurants, retail stores, and service providers. The town is also home to a number of small farms and ranches, which produce a variety of crops and livestock.
Demographics
As of 2019, the population of Volente was estimated to be 1,072. The racial makeup of the town was 94.2% White, 1.7% Hispanic or Latino, 1.3% African American, 0.7% Asian, and 2.1% other.
The median household income in Volente was $63,750 in 2019, which is higher than the median household income for Travis County ($60,890) and the state of Texas ($56,565). The median home value in Volente was $310,000 in 2019, which is higher than the median home value for Travis County ($269,000) and the state of Texas ($170,000).
Conclusion
Volente, Texas is a small unincorporated community located in Travis County, Texas. It is situated on the western edge of the Austin metropolitan area, approximately 20 miles northwest of downtown Austin. The town was first settled in the late 1800s by German immigrants and was officially incorporated in 1891. The economy of Volente is largely based on tourism and recreation, and the town is home to several popular attractions. The population of Volente was estimated to be 1,072 in 2019, and the median household income was $63,750 in 2019.
Common Questions
What is Per Capita Income in Volente?
Per Capita income in Volente is $87,569.
What is the Median Family Income in Volente?
Median Family Income in Volente is $197,813.
What is the Median Household income in Volente?
Median Household Income in Volente is $132,500.
What is Income or Wage Gap in Volente?
Income or Wage Gap in Volente is 58.0%.
Women in Volente earn 42.0 cents for every dollar earned by a man.
What is Family Income Deficit in Volente?
Family Income Deficit in Volente is $14,821.
Families that are below poverty line in Volente earn $14,821 less on average than the poverty threshold level.
What is Inequality or Gini Index in Volente?
Inequality or Gini Index in Volente is 0.54.
What is the Total Population of Volente?
Total Population of Volente is 779.
What is the Total Male Population of Volente?
Total Male Population of Volente is 393.
What is the Total Female Population of Volente?
Total Female Population of Volente is 386.
What is the Ratio of Males per 100 Females in Volente?
There are 101.81 Males per 100 Females in Volente.
What is the Ratio of Females per 100 Males in Volente?
There are 98.22 Females per 100 Males in Volente.
What is the Median Population Age in Volente?
Median Population Age in Volente is 46.3 Years.
What is the Average Family Size in Volente
Average Family Size in Volente is 3.0 People.
What is the Average Household Size in Volente
Average Household Size in Volente is 2.4 People.
How Large is the Labor Force in Volente?
There are 379 People in the Labor Forcein in Volente.
What is the Percentage of People in the Labor Force in Volente?
61.0% of People are in the Labor Force in Volente.
What is the Unemployment Rate in Volente?
Unemployment Rate in Volente is 6.6%.