Chinese vs Immigrants from Hungary Married-Couple Family Poverty
COMPARE
Chinese
Immigrants from Hungary
Married-Couple Family Poverty
Married-Couple Family Poverty Comparison
Chinese
Immigrants from Hungary
3.6%
MARRIED-COUPLE FAMILY POVERTY
100.0/ 100
METRIC RATING
2nd/ 347
METRIC RANK
4.9%
MARRIED-COUPLE FAMILY POVERTY
88.7/ 100
METRIC RATING
136th/ 347
METRIC RANK
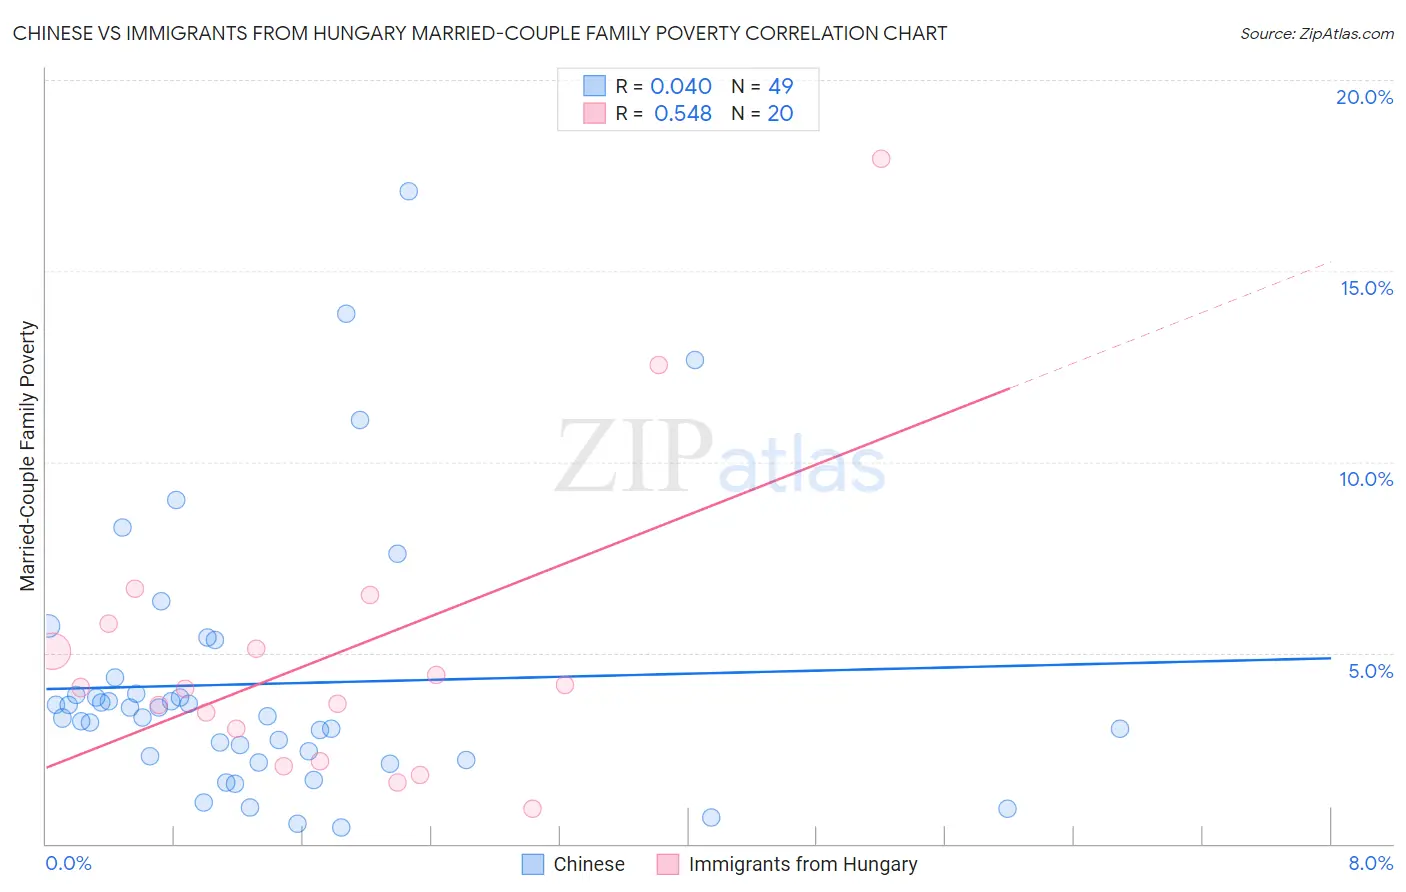
Chinese vs Immigrants from Hungary Married-Couple Family Poverty Correlation Chart
The statistical analysis conducted on geographies consisting of 64,670,469 people shows no correlation between the proportion of Chinese and poverty level among married-couple families in the United States with a correlation coefficient (R) of 0.040 and weighted average of 3.6%. Similarly, the statistical analysis conducted on geographies consisting of 194,814,844 people shows a substantial positive correlation between the proportion of Immigrants from Hungary and poverty level among married-couple families in the United States with a correlation coefficient (R) of 0.548 and weighted average of 4.9%, a difference of 34.5%.
Married-Couple Family Poverty Correlation Summary
| Measurement | Chinese | Immigrants from Hungary |
| Minimum | 0.44% | 0.92% |
| Maximum | 17.1% | 17.9% |
| Range | 16.7% | 17.0% |
| Mean | 4.2% | 4.9% |
| Median | 3.3% | 4.1% |
| Interquartile 25% (IQ1) | 2.2% | 2.6% |
| Interquartile 75% (IQ3) | 4.1% | 5.4% |
| Interquartile Range (IQR) | 1.9% | 2.9% |
| Standard Deviation (Sample) | 3.4% | 4.0% |
| Standard Deviation (Population) | 3.4% | 3.9% |
Similar Demographics by Married-Couple Family Poverty
Demographics Similar to Chinese by Married-Couple Family Poverty
In terms of married-couple family poverty, the demographic groups most similar to Chinese are Immigrants from India (3.6%, a difference of 0.18%), Norwegian (3.7%, a difference of 1.9%), Slovene (3.8%, a difference of 5.6%), Swedish (3.9%, a difference of 5.7%), and Luxembourger (3.9%, a difference of 6.4%).
| Demographics | Rating | Rank | Married-Couple Family Poverty |
| Immigrants | India | 100.0 /100 | #1 | Exceptional 3.6% |
| Chinese | 100.0 /100 | #2 | Exceptional 3.6% |
| Norwegians | 100.0 /100 | #3 | Exceptional 3.7% |
| Slovenes | 100.0 /100 | #4 | Exceptional 3.8% |
| Swedes | 100.0 /100 | #5 | Exceptional 3.9% |
| Luxembourgers | 100.0 /100 | #6 | Exceptional 3.9% |
| Latvians | 100.0 /100 | #7 | Exceptional 3.9% |
| Thais | 100.0 /100 | #8 | Exceptional 3.9% |
| Croatians | 100.0 /100 | #9 | Exceptional 3.9% |
| Carpatho Rusyns | 100.0 /100 | #10 | Exceptional 3.9% |
| Lithuanians | 100.0 /100 | #11 | Exceptional 4.0% |
| Bulgarians | 100.0 /100 | #12 | Exceptional 4.0% |
| Czechs | 100.0 /100 | #13 | Exceptional 4.0% |
| Slovaks | 100.0 /100 | #14 | Exceptional 4.0% |
| Poles | 100.0 /100 | #15 | Exceptional 4.0% |
Demographics Similar to Immigrants from Hungary by Married-Couple Family Poverty
In terms of married-couple family poverty, the demographic groups most similar to Immigrants from Hungary are Assyrian/Chaldean/Syriac (4.9%, a difference of 0.22%), Samoan (4.9%, a difference of 0.50%), Immigrants from Kenya (4.9%, a difference of 0.51%), Puget Sound Salish (4.9%, a difference of 0.58%), and Immigrants from Eastern Europe (4.9%, a difference of 0.59%).
| Demographics | Rating | Rank | Married-Couple Family Poverty |
| Immigrants | Pakistan | 90.7 /100 | #129 | Exceptional 4.9% |
| Soviet Union | 90.7 /100 | #130 | Exceptional 4.9% |
| Immigrants | Eastern Europe | 90.5 /100 | #131 | Exceptional 4.9% |
| Puget Sound Salish | 90.4 /100 | #132 | Exceptional 4.9% |
| Immigrants | Kenya | 90.2 /100 | #133 | Exceptional 4.9% |
| Samoans | 90.2 /100 | #134 | Exceptional 4.9% |
| Assyrians/Chaldeans/Syriacs | 89.4 /100 | #135 | Excellent 4.9% |
| Immigrants | Hungary | 88.7 /100 | #136 | Excellent 4.9% |
| Guamanians/Chamorros | 86.5 /100 | #137 | Excellent 4.9% |
| Chileans | 86.0 /100 | #138 | Excellent 4.9% |
| German Russians | 85.1 /100 | #139 | Excellent 5.0% |
| Immigrants | Portugal | 84.8 /100 | #140 | Excellent 5.0% |
| Immigrants | Brazil | 84.6 /100 | #141 | Excellent 5.0% |
| Immigrants | China | 84.6 /100 | #142 | Excellent 5.0% |
| Immigrants | Egypt | 83.4 /100 | #143 | Excellent 5.0% |