Zip Codes with the Highest Percentage of Population Employed in Architecture & Engineering in Tulsa, OK

RELATED REPORTS & OPTIONS

Architecture & Engineering
Population
Families and Households
Female Fertility
Female Fertility (Unmarried)
Race (Community Size)
Race (Percentage)
Ancestry (Community Size)
AfghanAfricanAleutAmericanApacheArabArapahoArgentineanArmenianAustralianAustrianBahamianBangladeshiBasqueBelgianBelizeanBhutaneseBlackfeetBolivianBrazilianBritishBulgarianBurmeseCajunCanadianCelticCentral AmericanCentral American IndianCherokeeCheyenneChickasawChileanChippewaChoctawColombianComancheCosta RicanCreekCroatianCubanCzechCzechoslovakianDanishDelawareDominicanDutchDutch West IndianEastern EuropeanEcuadorianEgyptianEnglishEstonianEthiopianEuropeanFilipinoFinnishFrenchFrench American IndianFrench CanadianGermanGerman RussianGhanaianGreekGuamanian / ChamorroGuatemalanHaitianHonduranHungarianIcelanderIndian (Asian)IndonesianInupiatIranianIraqiIrishIroquoisIsraeliItalianJamaicanJapaneseJordanianKenyanKiowaKoreanLaotianLatvianLebaneseLiberianLithuanianLumbeeLuxembourgerMalaysianMexicanMexican American IndianMoroccanNative HawaiianNavajoNicaraguanNigerianNorthern EuropeanNorwegianOsageOttawaPakistaniPalestinianPanamanianPennsylvania GermanPeruvianPimaPolishPortuguesePotawatomiPuebloPuerto RicanRomanianRussianSalvadoranSamoanScandinavianScotch-IrishScottishSeminoleSiouxSlavicSlovakSloveneSouth AmericanSouth American IndianSpaniardSpanishSpanish AmericanSri LankanSubsaharan AfricanSudaneseSwedishSwissSyrianThaiTlingit-HaidaTrinidadian and TobagonianTurkishUgandanUkrainianUruguayanVenezuelanVietnameseWelshWest IndianYugoslavian
Ancestry (Percentage)
AfghanAfricanAleutAmericanApacheArabArapahoArgentineanArmenianAustralianAustrianBahamianBangladeshiBasqueBelgianBelizeanBhutaneseBlackfeetBolivianBrazilianBritishBulgarianBurmeseCajunCanadianCelticCentral AmericanCentral American IndianCherokeeCheyenneChickasawChileanChippewaChoctawColombianComancheCosta RicanCreekCroatianCubanCzechCzechoslovakianDanishDelawareDominicanDutchDutch West IndianEastern EuropeanEcuadorianEgyptianEnglishEstonianEthiopianEuropeanFilipinoFinnishFrenchFrench American IndianFrench CanadianGermanGerman RussianGhanaianGreekGuamanian / ChamorroGuatemalanHaitianHonduranHungarianIcelanderIndian (Asian)IndonesianInupiatIranianIraqiIrishIroquoisIsraeliItalianJamaicanJapaneseJordanianKenyanKiowaKoreanLaotianLatvianLebaneseLiberianLithuanianLumbeeLuxembourgerMalaysianMexicanMexican American IndianMoroccanNative HawaiianNavajoNicaraguanNigerianNorthern EuropeanNorwegianOsageOttawaPakistaniPalestinianPanamanianPennsylvania GermanPeruvianPimaPolishPortuguesePotawatomiPuebloPuerto RicanRomanianRussianSalvadoranSamoanScandinavianScotch-IrishScottishSeminoleSiouxSlavicSlovakSloveneSouth AmericanSouth American IndianSpaniardSpanishSpanish AmericanSri LankanSubsaharan AfricanSudaneseSwedishSwissSyrianThaiTlingit-HaidaTrinidadian and TobagonianTurkishUgandanUkrainianUruguayanVenezuelanVietnameseWelshWest IndianYugoslavian
Immigrant Origin (Total)
AfghanistanAfricaArgentinaAsiaAustraliaAustriaBahamasBangladeshBelgiumBelizeBoliviaBrazilBurma / MyanmarCameroonCanadaCaribbeanCentral AmericaChileChinaColombiaCosta RicaCubaDenmarkDominican RepublicEastern AfricaEastern AsiaEastern EuropeEcuadorEgyptEl SalvadorEnglandEritreaEthiopiaEuropeFranceGermanyGhanaGreeceGuatemalaHaitiHondurasHong KongIndiaIndonesiaIranIraqIrelandIsraelItalyJamaicaJapanJordanKazakhstanKenyaKoreaKuwaitLaosLatin AmericaLatviaLebanonLiberiaMalaysiaMexicoMicronesiaMiddle AfricaMoroccoNepalNetherlandsNicaraguaNigeriaNorthern AfricaNorthern EuropeNorwayOceaniaPakistanPanamaPeruPhilippinesPolandPortugalRomaniaRussiaSaudi ArabiaScotlandSouth AfricaSouth AmericaSouth Central AsiaSouth Eastern AsiaSouthern EuropeSpainSwedenSyriaTaiwanThailandTrinidad and TobagoTurkeyUgandaUkraineUruguayVenezuelaVietnamWestern AfricaWestern AsiaWestern EuropeZaireZimbabwe
Immigrant Origin (Percentage)
AfghanistanAfricaArgentinaAsiaAustraliaAustriaBahamasBangladeshBelgiumBelizeBoliviaBrazilBurma / MyanmarCameroonCanadaCaribbeanCentral AmericaChileChinaColombiaCosta RicaCubaDenmarkDominican RepublicEastern AfricaEastern AsiaEastern EuropeEcuadorEgyptEl SalvadorEnglandEritreaEthiopiaEuropeFranceGermanyGhanaGreeceGuatemalaHaitiHondurasHong KongIndiaIndonesiaIranIraqIrelandIsraelItalyJamaicaJapanJordanKazakhstanKenyaKoreaKuwaitLaosLatin AmericaLatviaLebanonLiberiaMalaysiaMexicoMicronesiaMiddle AfricaMoroccoNepalNetherlandsNicaraguaNigeriaNorthern AfricaNorthern EuropeNorwayOceaniaPakistanPanamaPeruPhilippinesPolandPortugalRomaniaRussiaSaudi ArabiaScotlandSouth AfricaSouth AmericaSouth Central AsiaSouth Eastern AsiaSouthern EuropeSpainSwedenSyriaTaiwanThailandTrinidad and TobagoTurkeyUgandaUkraineUruguayVenezuelaVietnamWestern AfricaWestern AsiaWestern EuropeZaireZimbabwe
Income
Income (Families)
Income (Households)
Poverty
Poverty (Families)
Unemployment
Employment Occupations
Employment Industries
Employer Class
Commute Time
Commute Means
School Enrollment
Education by Degree Field
Occupancy
Finances
Physical Characteristics
Tulsa
Compare Zip Codes
Comparison Subject

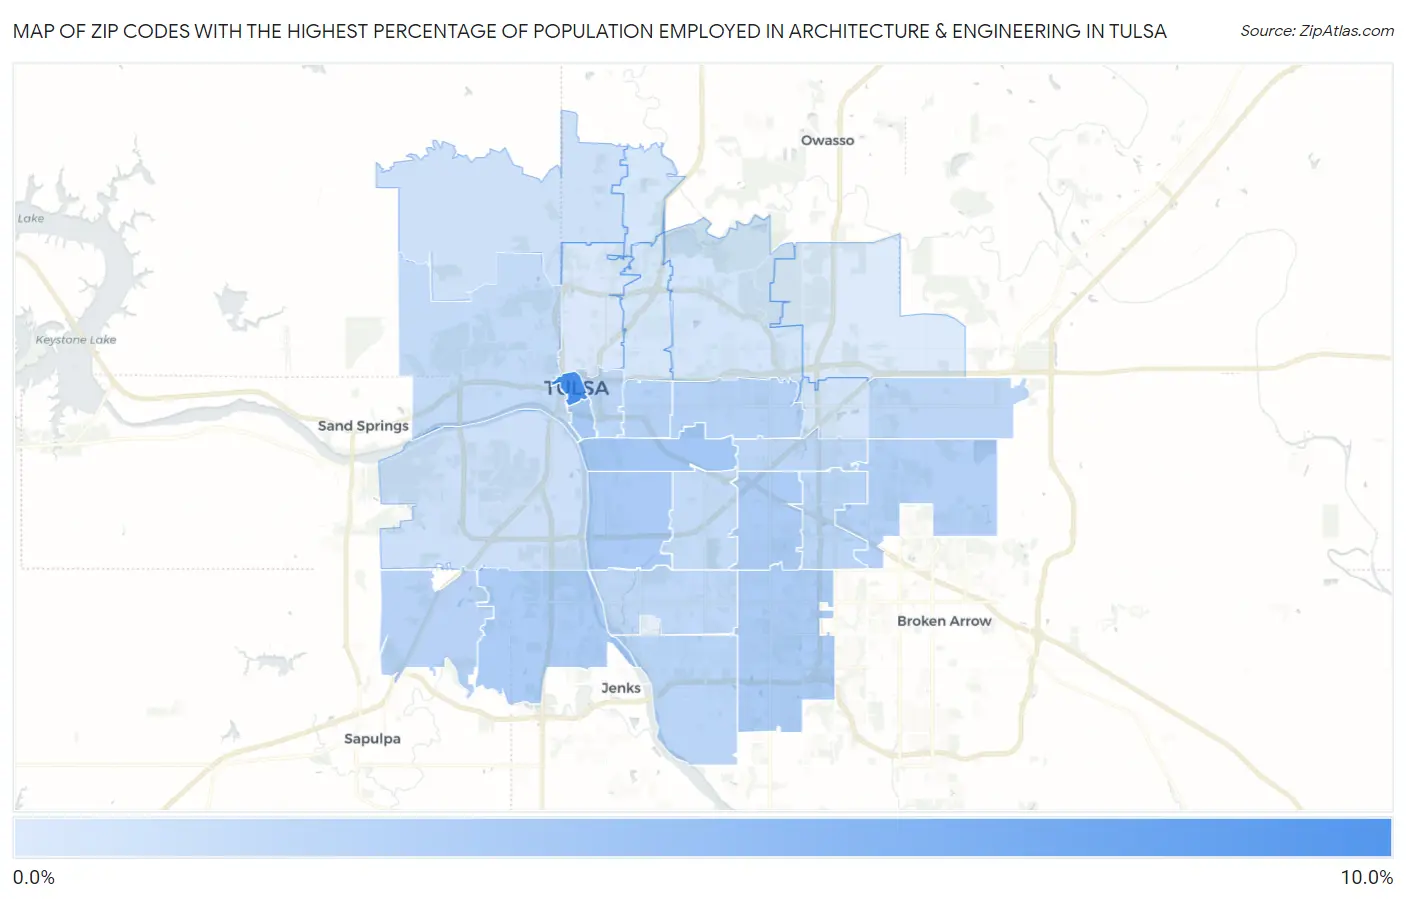
Map of Zip Codes with the Highest Percentage of Population Employed in Architecture & Engineering in Tulsa

0.0%
10.0%
Zip Codes with the Highest Percentage of Population Employed in Architecture & Engineering in Tulsa Map

Zip Codes with the Highest Percentage of Population Employed in Architecture & Engineering in Tulsa, OK

Zip Code % Employed vs State vs National
1.741038.9%1.8%(+7.07)#102.1%(+6.75)#433
2.741143.4%1.8%(+1.53)#552.1%(+1.22)#4,027
3.741193.2%1.8%(+1.32)#632.1%(+1.01)#4,587
4.741053.0%1.8%(+1.21)#642.1%(+0.899)#4,897
5.741322.9%1.8%(+1.10)#682.1%(+0.793)#5,267
6.741452.9%1.8%(+1.09)#702.1%(+0.776)#5,337
7.741332.9%1.8%(+1.07)#732.1%(+0.759)#5,389
8.741342.5%1.8%(+0.652)#1042.1%(+0.341)#7,040
9.741122.4%1.8%(+0.523)#1112.1%(+0.212)#7,664
10.741042.3%1.8%(+0.462)#1152.1%(+0.151)#7,938
11.741312.2%1.8%(+0.338)#1252.1%(+0.027)#8,623
12.741372.1%1.8%(+0.291)#1292.1%(-0.020)#8,871
13.741462.1%1.8%(+0.264)#1322.1%(-0.047)#9,027
14.741202.0%1.8%(+0.159)#1442.1%(-0.152)#9,623
15.741081.9%1.8%(+0.080)#1542.1%(-0.231)#10,119
16.741291.9%1.8%(+0.055)#1572.1%(-0.256)#10,294
17.741361.8%1.8%(-0.066)#1662.1%(-0.377)#10,992
18.741351.6%1.8%(-0.227)#1842.1%(-0.538)#12,113
19.741271.6%1.8%(-0.268)#1892.1%(-0.579)#12,369
20.741071.1%1.8%(-0.745)#2522.1%(-1.06)#15,903
21.741260.93%1.8%(-0.911)#2812.1%(-1.22)#17,155
22.741150.67%1.8%(-1.16)#3312.1%(-1.48)#19,077
23.741280.62%1.8%(-1.22)#3452.1%(-1.53)#19,516
24.741100.51%1.8%(-1.33)#3592.1%(-1.64)#20,188
25.741300.51%1.8%(-1.33)#3602.1%(-1.64)#20,193
26.741060.31%1.8%(-1.53)#3992.1%(-1.84)#21,493
27.741160.12%1.8%(-1.71)#4162.1%(-2.03)#22,325

Common Questions

What are the Top 10 Zip Codes with the Highest Percentage of Population Employed in Architecture & Engineering in Tulsa, OK?
Top 10 Zip Codes with the Highest Percentage of Population Employed in Architecture & Engineering in Tulsa, OK are:
#1
8.9%
#2
3.4%
#3
3.2%
#4
3.0%
#5
2.9%
#6
2.9%
#7
2.9%
#8
2.5%
#9
2.4%
#10
2.3%
What zip code has the Highest Percentage of Population Employed in Architecture & Engineering in Tulsa, OK?
74103 has the Highest Percentage of Population Employed in Architecture & Engineering in Tulsa, OK with 8.9%.
What is the Percentage of Population Employed in Architecture & Engineering in Tulsa, OK?
Percentage of Population Employed in Architecture & Engineering in Tulsa is 2.1%.
What is the Percentage of Population Employed in Architecture & Engineering in Oklahoma?
Percentage of Population Employed in Architecture & Engineering in Oklahoma is 1.8%.
What is the Percentage of Population Employed in Architecture & Engineering in the United States?
Percentage of Population Employed in Architecture & Engineering in the United States is 2.1%.