Arpelar, OK Map & Demographics
Arpelar Map
Arpelar Overview
$40,176
PER CAPITA INCOME
$57,250
AVG FAMILY INCOME
$54,500
AVG HOUSEHOLD INCOME
20.8%
WAGE / INCOME GAP [ % ]
79.2¢/ $1
WAGE / INCOME GAP [ $ ]
0.56
INEQUALITY / GINI INDEX
315
TOTAL POPULATION
146
MALE POPULATION
169
FEMALE POPULATION
86.39
MALES / 100 FEMALES
115.75
FEMALES / 100 MALES
45.8
MEDIAN AGE
2.6
AVG FAMILY SIZE
2.4
AVG HOUSEHOLD SIZE
149
LABOR FORCE [ PEOPLE ]
56.7%
PERCENT IN LABOR FORCE
Income in Arpelar
Income Overview in Arpelar
Per Capita Income in Arpelar is $40,176, while median incomes of families and households are $57,250 and $54,500 respectively.
| Characteristic | Number | Measure |
| Per Capita Income | 315 | $40,176 |
| Median Family Income | 105 | $57,250 |
| Mean Family Income | 105 | $110,933 |
| Median Household Income | 130 | $54,500 |
| Mean Household Income | 130 | $98,229 |
| Income Deficit | 105 | $0 |
| Wage / Income Gap (%) | 315 | 20.83% |
| Wage / Income Gap ($) | 315 | 79.17¢ per $1 |
| Gini / Inequality Index | 315 | 0.56 |
Earnings by Sex in Arpelar
Average Earnings in Arpelar are $35,156, $37,500 for men and $29,688 for women, a difference of 20.8%.
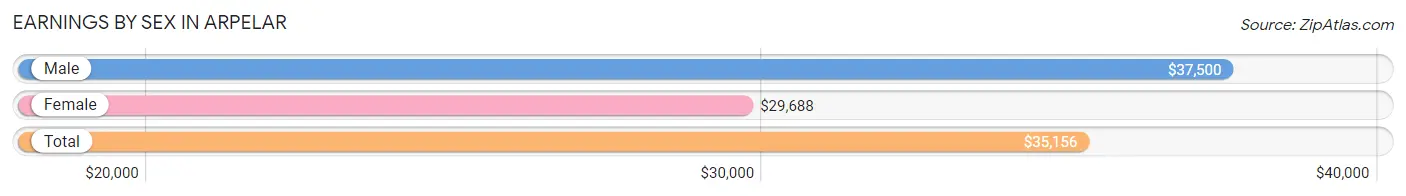
| Sex | Number | Average Earnings |
| Male | 82 (52.2%) | $37,500 |
| Female | 75 (47.8%) | $29,688 |
| Total | 157 (100.0%) | $35,156 |
Earnings by Sex by Income Bracket in Arpelar
The most common earnings brackets in Arpelar are $75,000 to $99,999 for men (12 | 14.6%) and $25,000 to $29,999 for women (9 | 12.0%).
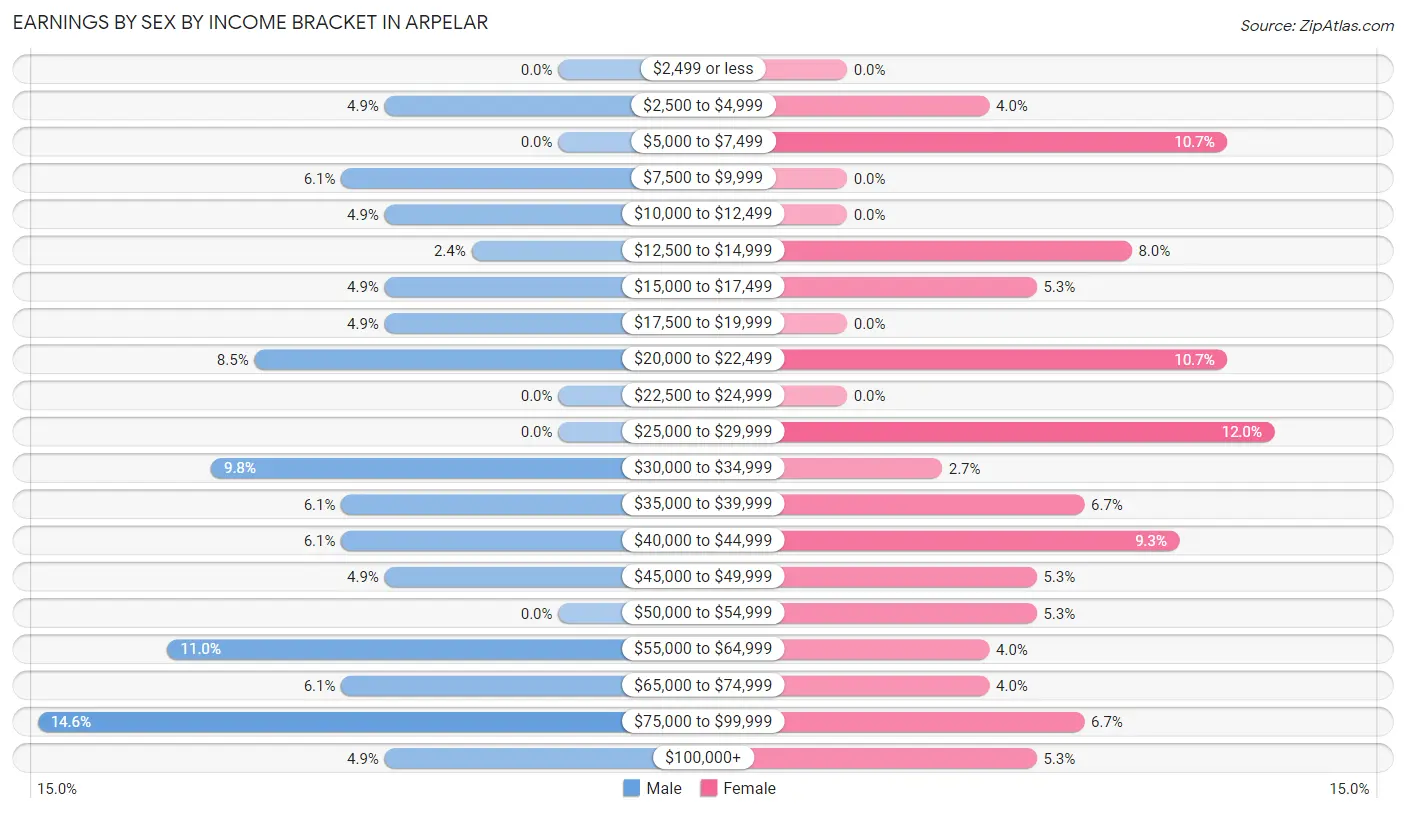
| Income | Male | Female |
| $2,499 or less | 0 (0.0%) | 0 (0.0%) |
| $2,500 to $4,999 | 4 (4.9%) | 3 (4.0%) |
| $5,000 to $7,499 | 0 (0.0%) | 8 (10.7%) |
| $7,500 to $9,999 | 5 (6.1%) | 0 (0.0%) |
| $10,000 to $12,499 | 4 (4.9%) | 0 (0.0%) |
| $12,500 to $14,999 | 2 (2.4%) | 6 (8.0%) |
| $15,000 to $17,499 | 4 (4.9%) | 4 (5.3%) |
| $17,500 to $19,999 | 4 (4.9%) | 0 (0.0%) |
| $20,000 to $22,499 | 7 (8.5%) | 8 (10.7%) |
| $22,500 to $24,999 | 0 (0.0%) | 0 (0.0%) |
| $25,000 to $29,999 | 0 (0.0%) | 9 (12.0%) |
| $30,000 to $34,999 | 8 (9.8%) | 2 (2.7%) |
| $35,000 to $39,999 | 5 (6.1%) | 5 (6.7%) |
| $40,000 to $44,999 | 5 (6.1%) | 7 (9.3%) |
| $45,000 to $49,999 | 4 (4.9%) | 4 (5.3%) |
| $50,000 to $54,999 | 0 (0.0%) | 4 (5.3%) |
| $55,000 to $64,999 | 9 (11.0%) | 3 (4.0%) |
| $65,000 to $74,999 | 5 (6.1%) | 3 (4.0%) |
| $75,000 to $99,999 | 12 (14.6%) | 5 (6.7%) |
| $100,000+ | 4 (4.9%) | 4 (5.3%) |
| Total | 82 (100.0%) | 75 (100.0%) |
Earnings by Sex by Educational Attainment in Arpelar
Average earnings in Arpelar are $37,500 for men and $29,688 for women, a difference of 20.8%. Men with an educational attainment of high school diploma enjoy the highest average annual earnings of $51,250, while those with college or associate's degree education earn the least with $40,000. Women with an educational attainment of college or associate's degree earn the most with the average annual earnings of $28,125, while those with college or associate's degree education have the smallest earnings of $28,125.
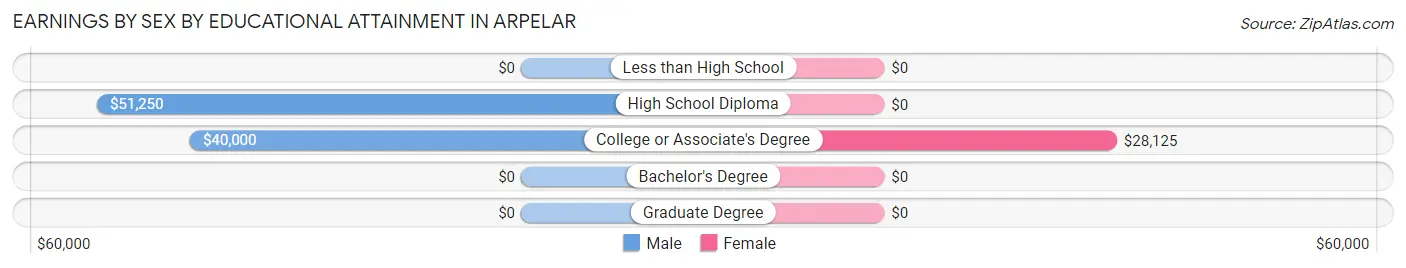
| Educational Attainment | Male Income | Female Income |
| Less than High School | - | - |
| High School Diploma | $51,250 | $0 |
| College or Associate's Degree | $40,000 | $28,125 |
| Bachelor's Degree | - | - |
| Graduate Degree | - | - |
| Total | $37,500 | $29,688 |
Family Income in Arpelar
Family Income Brackets in Arpelar
According to the Arpelar family income data, there are 21 families falling into the $75,000 to $99,999 income range, which is the most common income bracket and makes up 20.0% of all families.
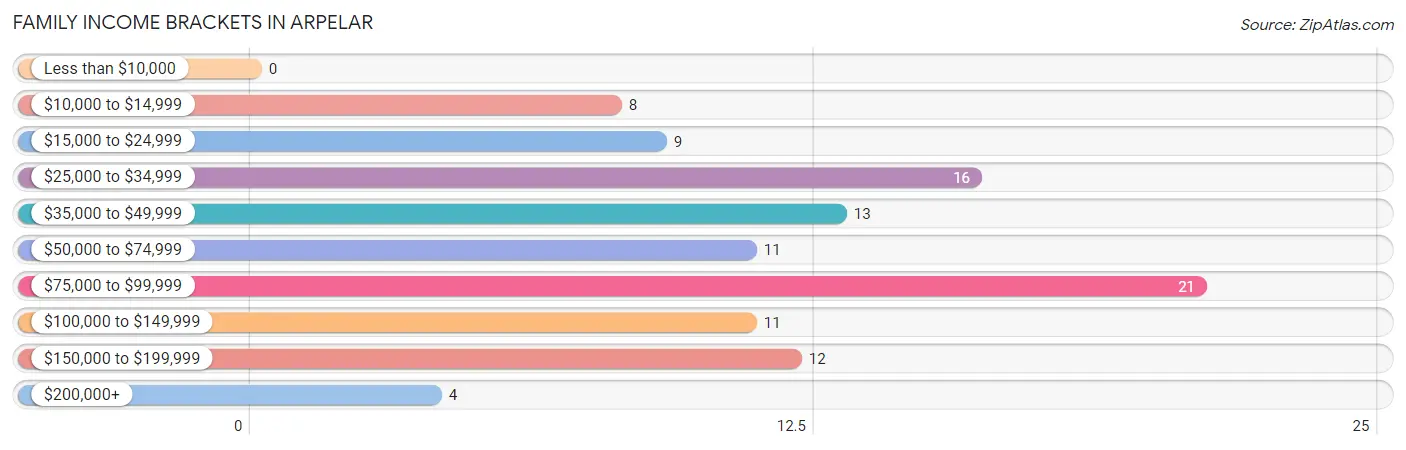
| Income Bracket | # Families | % Families |
| Less than $10,000 | 0 | 0.0% |
| $10,000 to $14,999 | 8 | 7.6% |
| $15,000 to $24,999 | 9 | 8.6% |
| $25,000 to $34,999 | 16 | 15.2% |
| $35,000 to $49,999 | 13 | 12.4% |
| $50,000 to $74,999 | 11 | 10.5% |
| $75,000 to $99,999 | 21 | 20.0% |
| $100,000 to $149,999 | 11 | 10.5% |
| $150,000 to $199,999 | 12 | 11.4% |
| $200,000+ | 4 | 3.8% |
Family Income by Famaliy Size in Arpelar
3-person families (25 | 23.8%) account for the highest median family income in Arpelar with $93,036 per family, while 3-person families (25 | 23.8%) have the highest median income of $31,012 per family member.
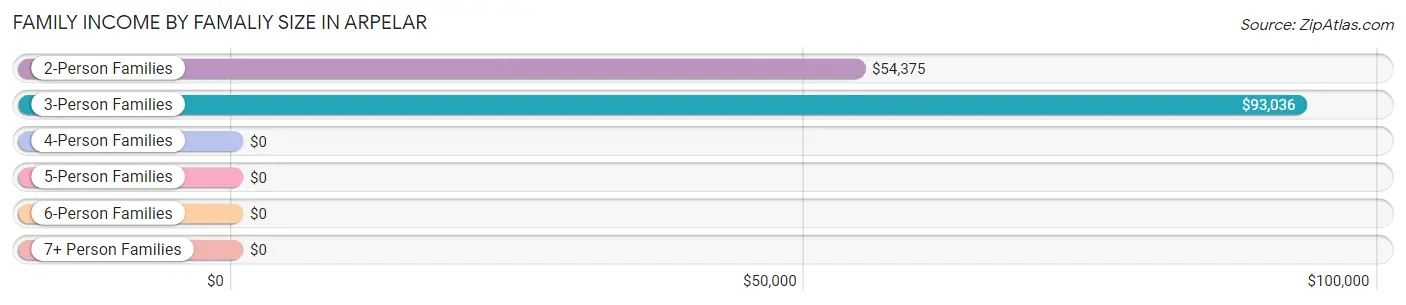
| Income Bracket | # Families | Median Income |
| 2-Person Families | 67 (63.8%) | $54,375 |
| 3-Person Families | 25 (23.8%) | $93,036 |
| 4-Person Families | 11 (10.5%) | $0 |
| 5-Person Families | 0 (0.0%) | $0 |
| 6-Person Families | 2 (1.9%) | $0 |
| 7+ Person Families | 0 (0.0%) | $0 |
| Total | 105 (100.0%) | $57,250 |
Family Income by Number of Earners in Arpelar
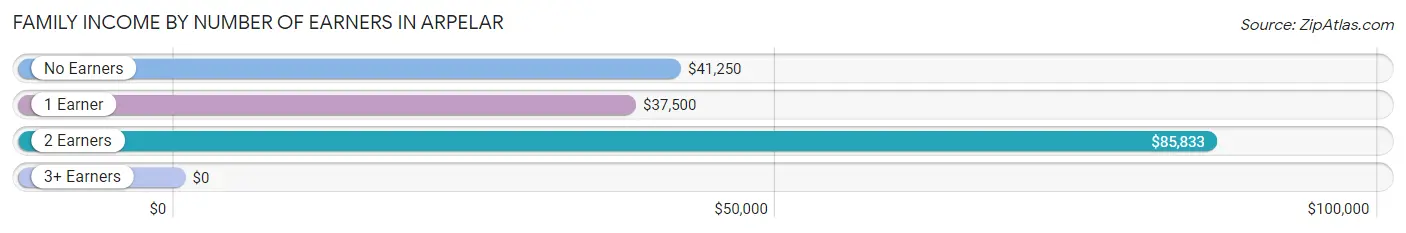
| Number of Earners | # Families | Median Income |
| No Earners | 18 (17.1%) | $41,250 |
| 1 Earner | 50 (47.6%) | $37,500 |
| 2 Earners | 30 (28.6%) | $85,833 |
| 3+ Earners | 7 (6.7%) | $0 |
| Total | 105 (100.0%) | $57,250 |
Household Income in Arpelar
Household Income Brackets in Arpelar
With 28 households falling in the category, the $75,000 to $99,999 income range is the most frequent in Arpelar, accounting for 21.5% of all households.
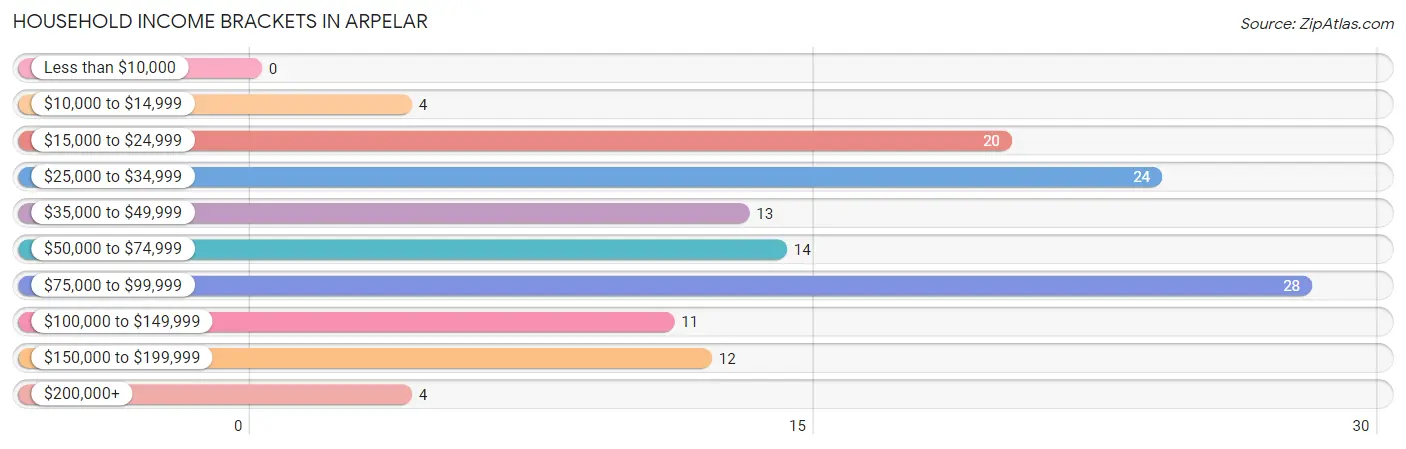
| Income Bracket | # Households | % Households |
| Less than $10,000 | 0 | 0.0% |
| $10,000 to $14,999 | 4 | 3.1% |
| $15,000 to $24,999 | 20 | 15.4% |
| $25,000 to $34,999 | 24 | 18.5% |
| $35,000 to $49,999 | 13 | 10.0% |
| $50,000 to $74,999 | 14 | 10.8% |
| $75,000 to $99,999 | 28 | 21.5% |
| $100,000 to $149,999 | 11 | 8.5% |
| $150,000 to $199,999 | 12 | 9.2% |
| $200,000+ | 4 | 3.1% |
Household Income by Householder Age in Arpelar
The median household income in Arpelar is $54,500, with the highest median household income of $75,938 found in the 25 to 44 years age bracket for the primary householder. A total of 29 households (22.3%) fall into this category. Meanwhile, the 15 to 24 years age bracket for the primary householder has the lowest median household income of $0, with 3 households (2.3%) in this group.
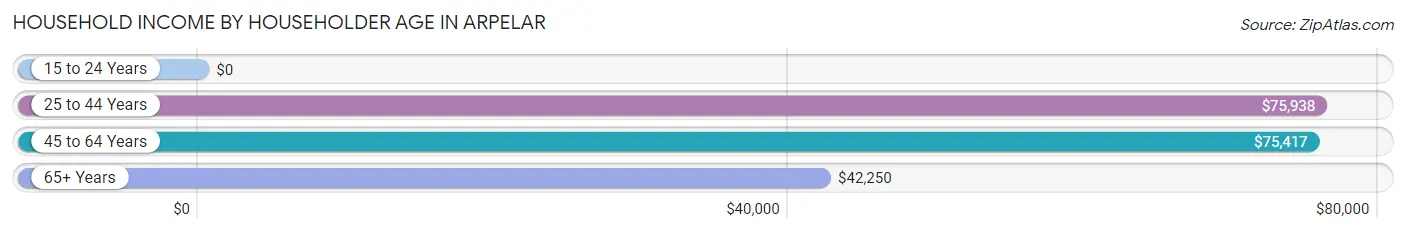
| Income Bracket | # Households | Median Income |
| 15 to 24 Years | 3 (2.3%) | $0 |
| 25 to 44 Years | 29 (22.3%) | $75,938 |
| 45 to 64 Years | 57 (43.9%) | $75,417 |
| 65+ Years | 41 (31.5%) | $42,250 |
| Total | 130 (100.0%) | $54,500 |
Poverty in Arpelar
Income Below Poverty by Sex and Age in Arpelar
With 14.4% poverty level for males and 19.5% for females among the residents of Arpelar, 12 to 14 year old males and under 5 year old females are the most vulnerable to poverty, with 5 males (100.0%) and 5 females (62.5%) in their respective age groups living below the poverty level.
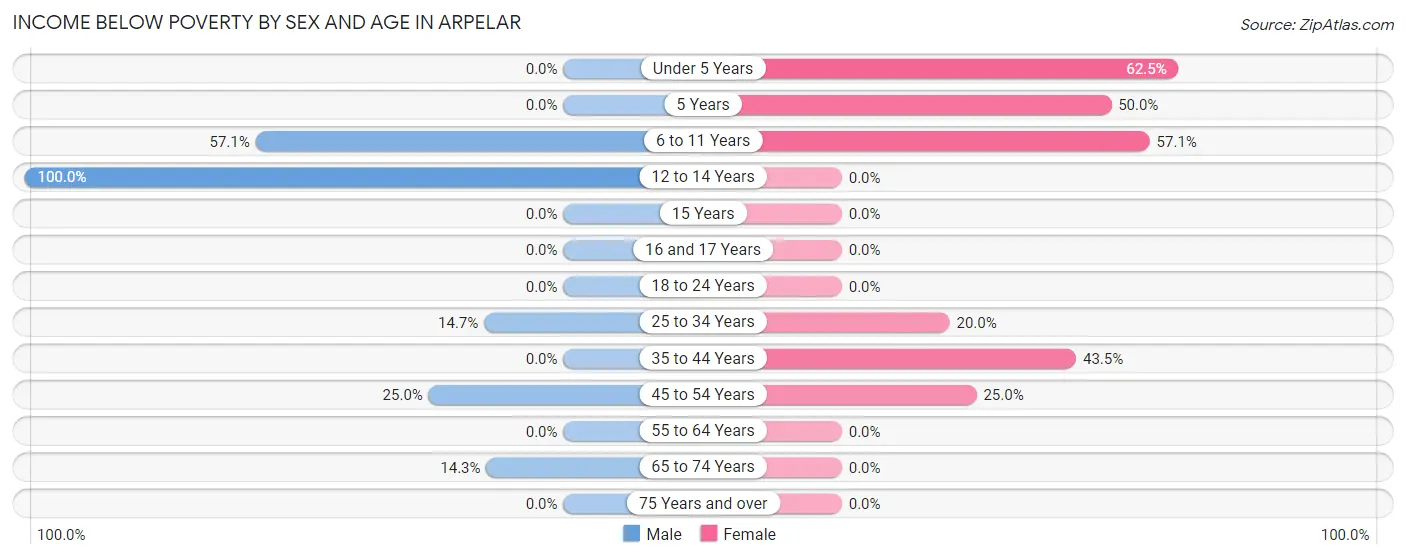
| Age Bracket | Male | Female |
| Under 5 Years | 0 (0.0%) | 5 (62.5%) |
| 5 Years | 0 (0.0%) | 5 (50.0%) |
| 6 to 11 Years | 4 (57.1%) | 4 (57.1%) |
| 12 to 14 Years | 5 (100.0%) | 0 (0.0%) |
| 15 Years | 0 (0.0%) | 0 (0.0%) |
| 16 and 17 Years | 0 (0.0%) | 0 (0.0%) |
| 18 to 24 Years | 0 (0.0%) | 0 (0.0%) |
| 25 to 34 Years | 5 (14.7%) | 4 (20.0%) |
| 35 to 44 Years | 0 (0.0%) | 10 (43.5%) |
| 45 to 54 Years | 4 (25.0%) | 5 (25.0%) |
| 55 to 64 Years | 0 (0.0%) | 0 (0.0%) |
| 65 to 74 Years | 3 (14.3%) | 0 (0.0%) |
| 75 Years and over | 0 (0.0%) | 0 (0.0%) |
| Total | 21 (14.4%) | 33 (19.5%) |
Income Above Poverty by Sex and Age in Arpelar
According to the poverty statistics in Arpelar, males aged under 5 years and females aged 12 to 14 years are the age groups that are most secure financially, with 100.0% of males and 100.0% of females in these age groups living above the poverty line.
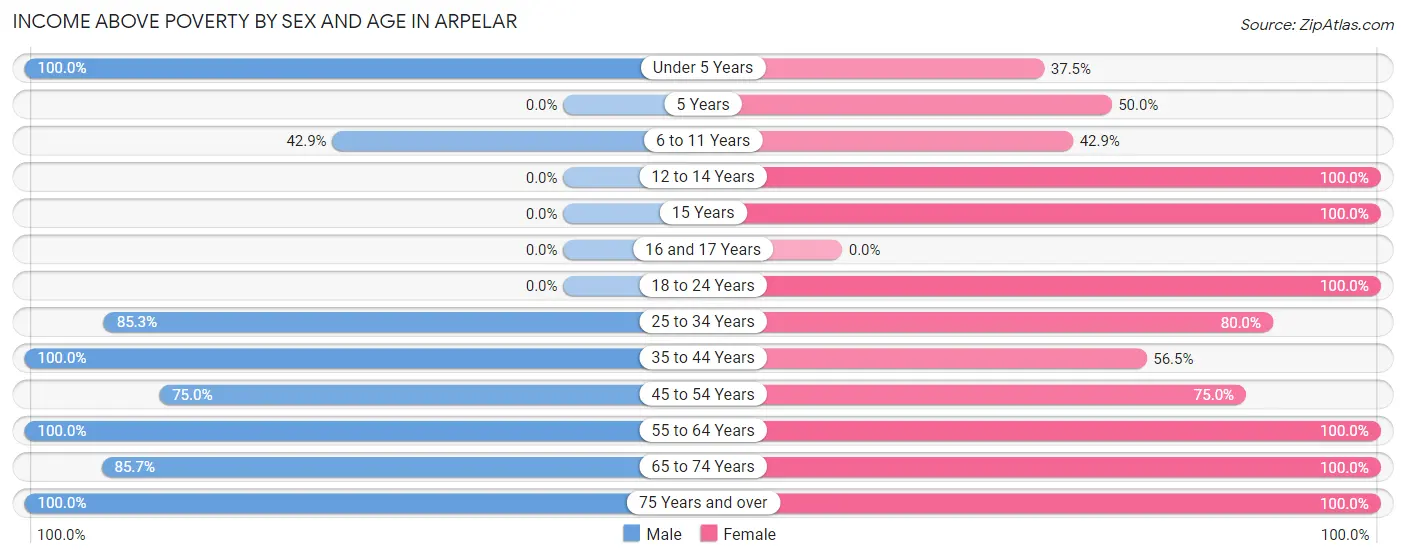
| Age Bracket | Male | Female |
| Under 5 Years | 6 (100.0%) | 3 (37.5%) |
| 5 Years | 0 (0.0%) | 5 (50.0%) |
| 6 to 11 Years | 3 (42.9%) | 3 (42.9%) |
| 12 to 14 Years | 0 (0.0%) | 2 (100.0%) |
| 15 Years | 0 (0.0%) | 7 (100.0%) |
| 16 and 17 Years | 0 (0.0%) | 0 (0.0%) |
| 18 to 24 Years | 0 (0.0%) | 3 (100.0%) |
| 25 to 34 Years | 29 (85.3%) | 16 (80.0%) |
| 35 to 44 Years | 21 (100.0%) | 13 (56.5%) |
| 45 to 54 Years | 12 (75.0%) | 15 (75.0%) |
| 55 to 64 Years | 23 (100.0%) | 31 (100.0%) |
| 65 to 74 Years | 18 (85.7%) | 21 (100.0%) |
| 75 Years and over | 13 (100.0%) | 17 (100.0%) |
| Total | 125 (85.6%) | 136 (80.5%) |
Income Below Poverty Among Married-Couple Families in Arpelar
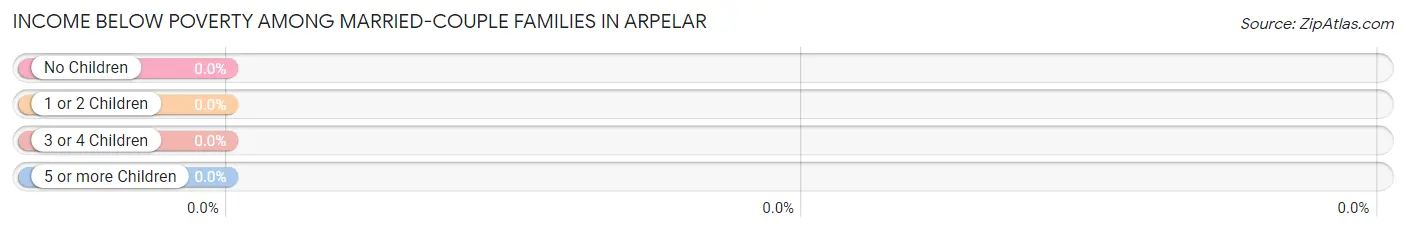
| Children | Above Poverty | Below Poverty |
| No Children | 64 (100.0%) | 0 (0.0%) |
| 1 or 2 Children | 11 (100.0%) | 0 (0.0%) |
| 3 or 4 Children | 2 (100.0%) | 0 (0.0%) |
| 5 or more Children | 0 (0.0%) | 0 (0.0%) |
| Total | 77 (100.0%) | 0 (0.0%) |
Income Below Poverty Among Single-Parent Households in Arpelar
According to the poverty data in Arpelar, 100.0% or 4 single-father households and 33.3% or 8 single-mother households are living below the poverty line. Among single-father households, those with 1 or 2 children have the highest poverty rate, with 4 households (100.0%) experiencing poverty. Likewise, among single-mother households, those with 3 or 4 children have the highest poverty rate, with 4 households (100.0%) falling below the poverty line.
| Children | Single Father | Single Mother |
| No Children | 0 (0.0%) | 0 (0.0%) |
| 1 or 2 Children | 4 (100.0%) | 4 (50.0%) |
| 3 or 4 Children | 0 (0.0%) | 4 (100.0%) |
| 5 or more Children | 0 (0.0%) | 0 (0.0%) |
| Total | 4 (100.0%) | 8 (33.3%) |
Income Below Poverty Among Married-Couple vs Single-Parent Households in Arpelar
| Children | Married-Couple Families | Single-Parent Households |
| No Children | 0 (0.0%) | 0 (0.0%) |
| 1 or 2 Children | 0 (0.0%) | 8 (66.7%) |
| 3 or 4 Children | 0 (0.0%) | 4 (100.0%) |
| 5 or more Children | 0 (0.0%) | 0 (0.0%) |
| Total | 0 (0.0%) | 12 (42.9%) |
Race in Arpelar
The most populous races in Arpelar are White / Caucasian (224 | 71.1%), Two or more Races (60 | 19.1%), and Native / Alaskan (25 | 7.9%).
| Race | # Population | % Population |
| Asian | 6 | 1.9% |
| Black / African American | 0 | 0.0% |
| Hawaiian / Pacific | 0 | 0.0% |
| Hispanic or Latino | 20 | 6.4% |
| Native / Alaskan | 25 | 7.9% |
| White / Caucasian | 224 | 71.1% |
| Two or more Races | 60 | 19.1% |
| Some other Race | 0 | 0.0% |
| Total | 315 | 100.0% |
Ancestry in Arpelar
The most populous ancestries reported in Arpelar are Choctaw (50 | 15.9%), English (37 | 11.7%), Irish (31 | 9.8%), American (28 | 8.9%), and Mexican (20 | 6.4%), together accounting for 52.7% of all Arpelar residents.
| Ancestry | # Population | % Population |
| American | 28 | 8.9% |
| British | 12 | 3.8% |
| Cherokee | 8 | 2.5% |
| Chickasaw | 9 | 2.9% |
| Choctaw | 50 | 15.9% |
| Dutch West Indian | 4 | 1.3% |
| English | 37 | 11.7% |
| French | 9 | 2.9% |
| German | 2 | 0.6% |
| Hungarian | 4 | 1.3% |
| Irish | 31 | 9.8% |
| Italian | 8 | 2.5% |
| Lithuanian | 2 | 0.6% |
| Mexican | 20 | 6.4% |
| Polish | 6 | 1.9% |
| Scottish | 19 | 6.0% |
| Sri Lankan | 13 | 4.1% |
| Thai | 3 | 0.9% | View All 18 Rows |
Immigrants in Arpelar
The most numerous immigrant groups reported in Arpelar came from Asia (6 | 1.9%), South Eastern Asia (6 | 1.9%), Vietnam (6 | 1.9%), Central America (4 | 1.3%), and Latin America (4 | 1.3%), together accounting for 8.2% of all Arpelar residents.
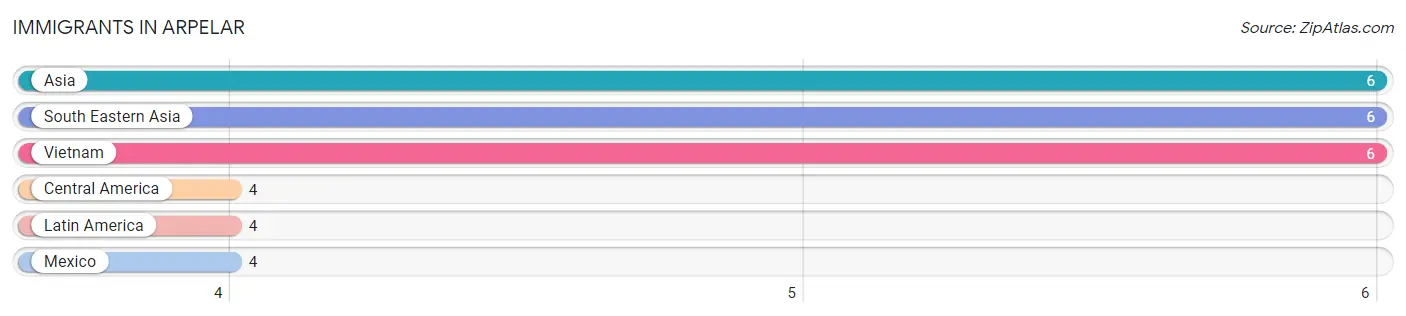
| Immigration Origin | # Population | % Population |
| Asia | 6 | 1.9% |
| Central America | 4 | 1.3% |
| Latin America | 4 | 1.3% |
| Mexico | 4 | 1.3% |
| South Eastern Asia | 6 | 1.9% |
| Vietnam | 6 | 1.9% | View All 6 Rows |
Sex and Age in Arpelar
Sex and Age in Arpelar
The most populous age groups in Arpelar are 25 to 29 Years (18 | 12.3%) for men and 60 to 64 Years (21 | 12.4%) for women.
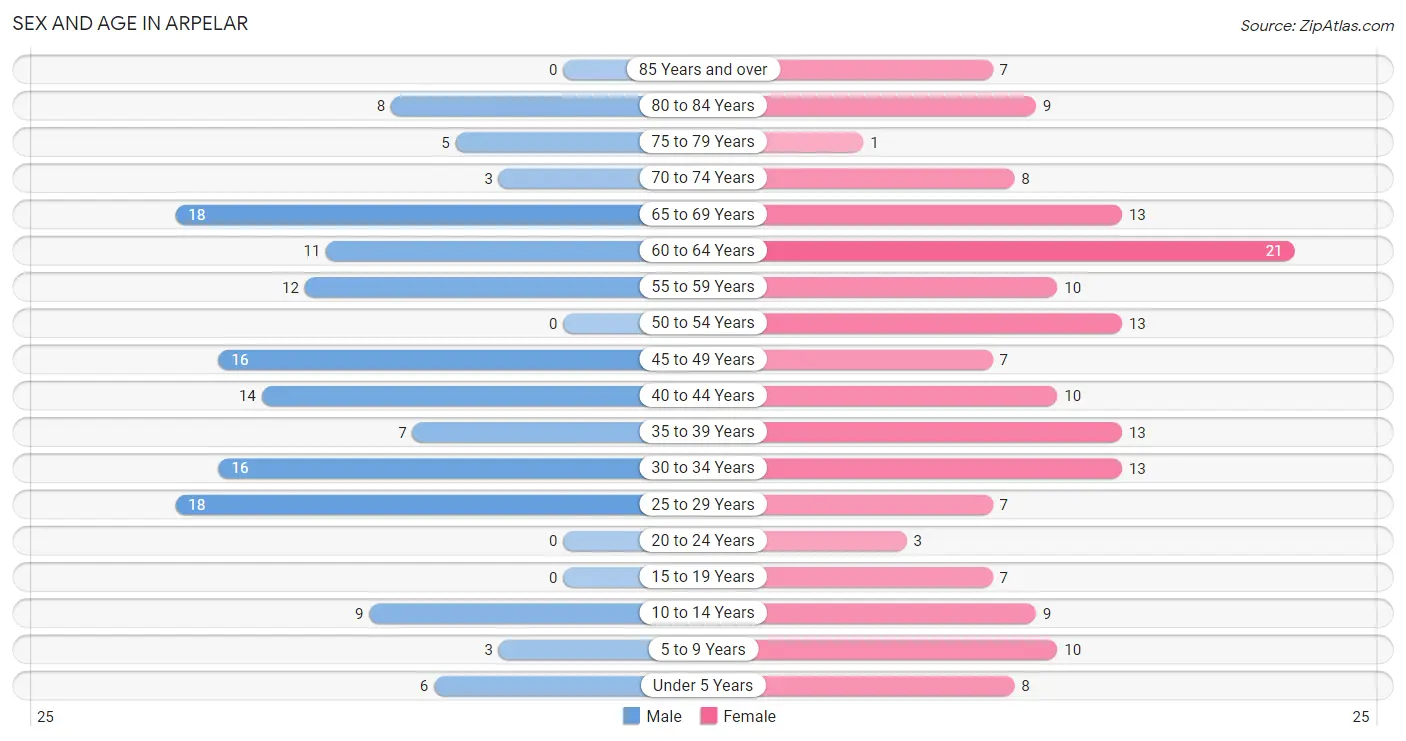
| Age Bracket | Male | Female |
| Under 5 Years | 6 (4.1%) | 8 (4.7%) |
| 5 to 9 Years | 3 (2.1%) | 10 (5.9%) |
| 10 to 14 Years | 9 (6.2%) | 9 (5.3%) |
| 15 to 19 Years | 0 (0.0%) | 7 (4.1%) |
| 20 to 24 Years | 0 (0.0%) | 3 (1.8%) |
| 25 to 29 Years | 18 (12.3%) | 7 (4.1%) |
| 30 to 34 Years | 16 (11.0%) | 13 (7.7%) |
| 35 to 39 Years | 7 (4.8%) | 13 (7.7%) |
| 40 to 44 Years | 14 (9.6%) | 10 (5.9%) |
| 45 to 49 Years | 16 (11.0%) | 7 (4.1%) |
| 50 to 54 Years | 0 (0.0%) | 13 (7.7%) |
| 55 to 59 Years | 12 (8.2%) | 10 (5.9%) |
| 60 to 64 Years | 11 (7.5%) | 21 (12.4%) |
| 65 to 69 Years | 18 (12.3%) | 13 (7.7%) |
| 70 to 74 Years | 3 (2.1%) | 8 (4.7%) |
| 75 to 79 Years | 5 (3.4%) | 1 (0.6%) |
| 80 to 84 Years | 8 (5.5%) | 9 (5.3%) |
| 85 Years and over | 0 (0.0%) | 7 (4.1%) |
| Total | 146 (100.0%) | 169 (100.0%) |
Families and Households in Arpelar
Median Family Size in Arpelar
The median family size in Arpelar is 2.57 persons per family, with married-couple families (77 | 73.3%) accounting for the largest median family size of 2.61 persons per family. On the other hand, single male/father families (4 | 3.8%) represent the smallest median family size with 2.25 persons per family.
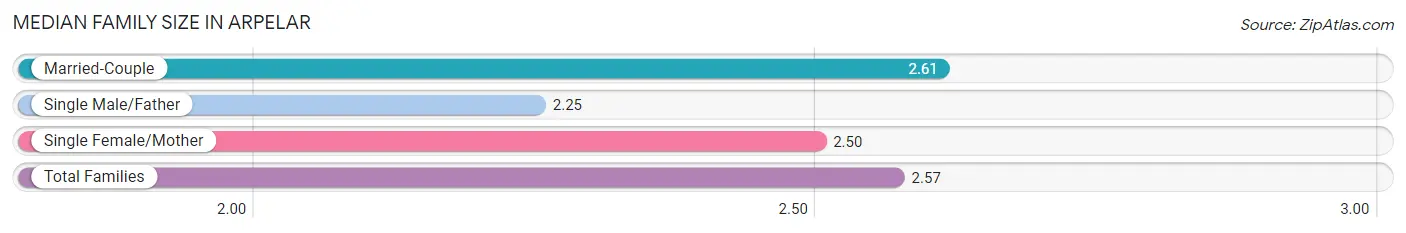
| Family Type | # Families | Family Size |
| Married-Couple | 77 (73.3%) | 2.61 |
| Single Male/Father | 4 (3.8%) | 2.25 |
| Single Female/Mother | 24 (22.9%) | 2.50 |
| Total Families | 105 (100.0%) | 2.57 |
Median Household Size in Arpelar
The median household size in Arpelar is 2.42 persons per household, with single female/mother households (24 | 18.5%) accounting for the largest median household size of 2.71 persons per household. non-family households (25 | 19.2%) represent the smallest median household size with 1.60 persons per household.
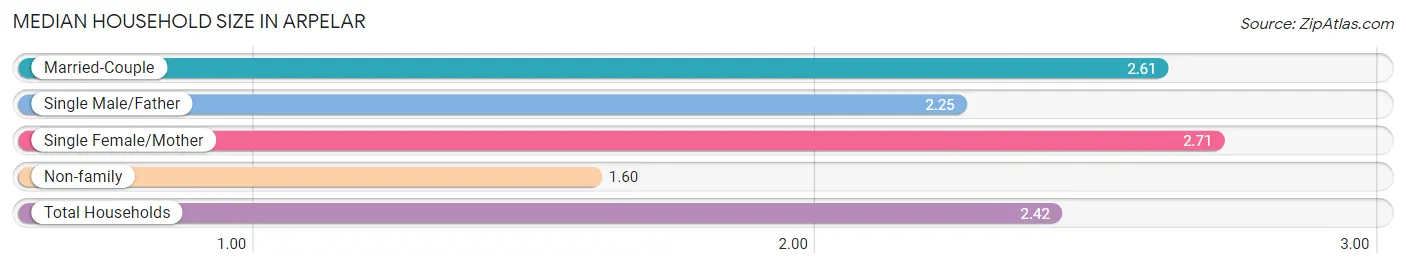
| Household Type | # Households | Household Size |
| Married-Couple | 77 (59.2%) | 2.61 |
| Single Male/Father | 4 (3.1%) | 2.25 |
| Single Female/Mother | 24 (18.5%) | 2.71 |
| Non-family | 25 (19.2%) | 1.60 |
| Total Households | 130 (100.0%) | 2.42 |
Household Size by Marriage Status in Arpelar
Out of a total of 130 households in Arpelar, 105 (80.8%) are family households, while 25 (19.2%) are nonfamily households. The most numerous type of family households are 2-person households, comprising 63, and the most common type of nonfamily households are 1-person households, comprising 14.
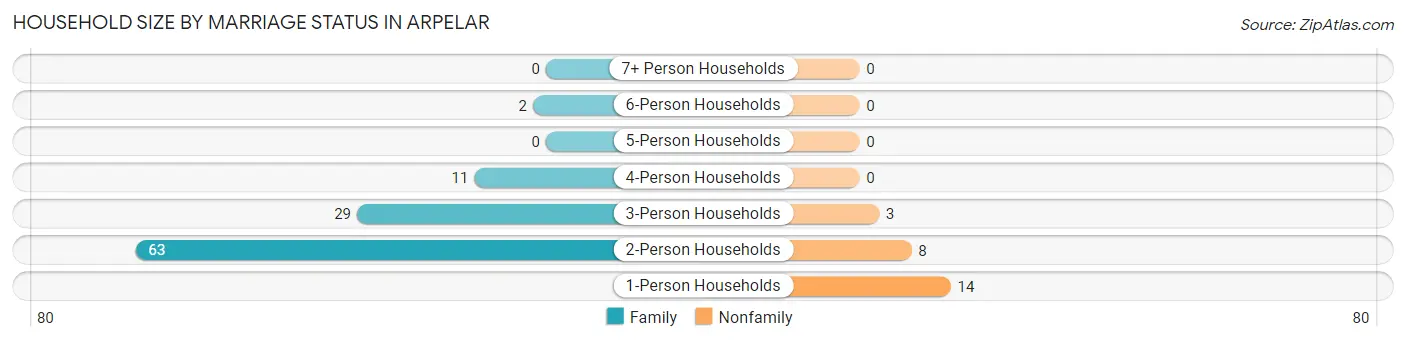
| Household Size | Family Households | Nonfamily Households |
| 1-Person Households | - | 14 (10.8%) |
| 2-Person Households | 63 (48.5%) | 8 (6.1%) |
| 3-Person Households | 29 (22.3%) | 3 (2.3%) |
| 4-Person Households | 11 (8.5%) | 0 (0.0%) |
| 5-Person Households | 0 (0.0%) | 0 (0.0%) |
| 6-Person Households | 2 (1.5%) | 0 (0.0%) |
| 7+ Person Households | 0 (0.0%) | 0 (0.0%) |
| Total | 105 (80.8%) | 25 (19.2%) |
Female Fertility in Arpelar
Fertility by Age in Arpelar
Average fertility rate in Arpelar is 33.0 births per 1,000 women. Women in the age bracket of 20 to 34 years have the highest fertility rate with 87.0 births per 1,000 women. Women in the age bracket of 20 to 34 years acount for 100.0% of all women with births.
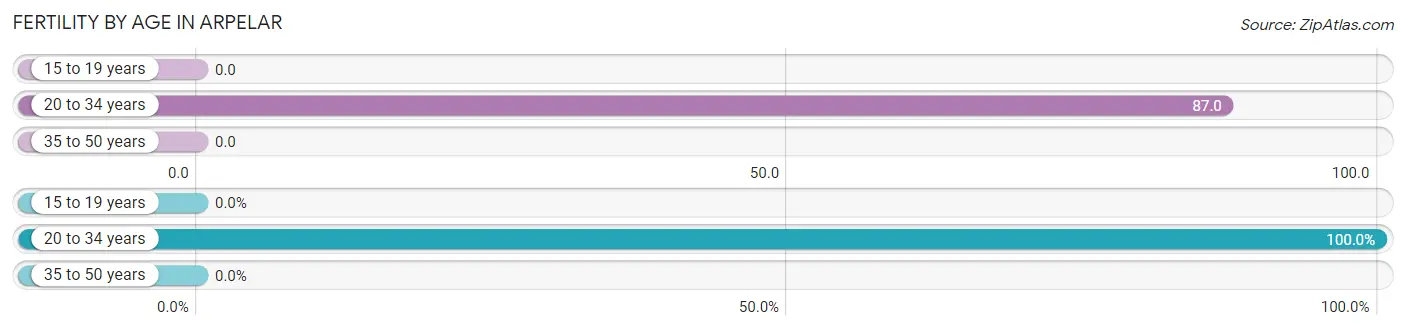
| Age Bracket | Women with Births | Births / 1,000 Women |
| 15 to 19 years | 0 (0.0%) | 0.0 |
| 20 to 34 years | 2 (100.0%) | 87.0 |
| 35 to 50 years | 0 (0.0%) | 0.0 |
| Total | 2 (100.0%) | 33.0 |
Fertility by Age by Marriage Status in Arpelar
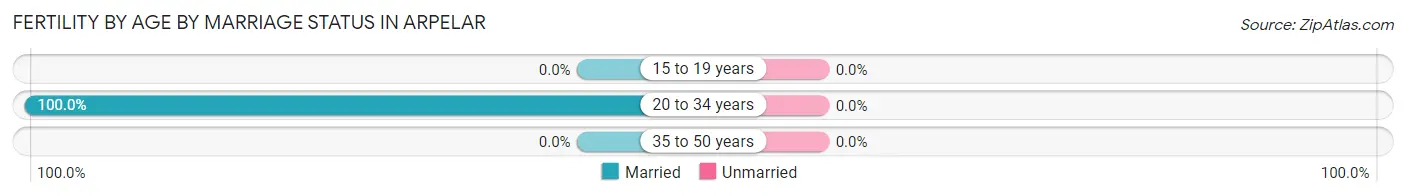
| Age Bracket | Married | Unmarried |
| 15 to 19 years | 0 (0.0%) | 0 (0.0%) |
| 20 to 34 years | 2 (100.0%) | 0 (0.0%) |
| 35 to 50 years | 0 (0.0%) | 0 (0.0%) |
| Total | 2 (100.0%) | 0 (0.0%) |
Fertility by Education in Arpelar
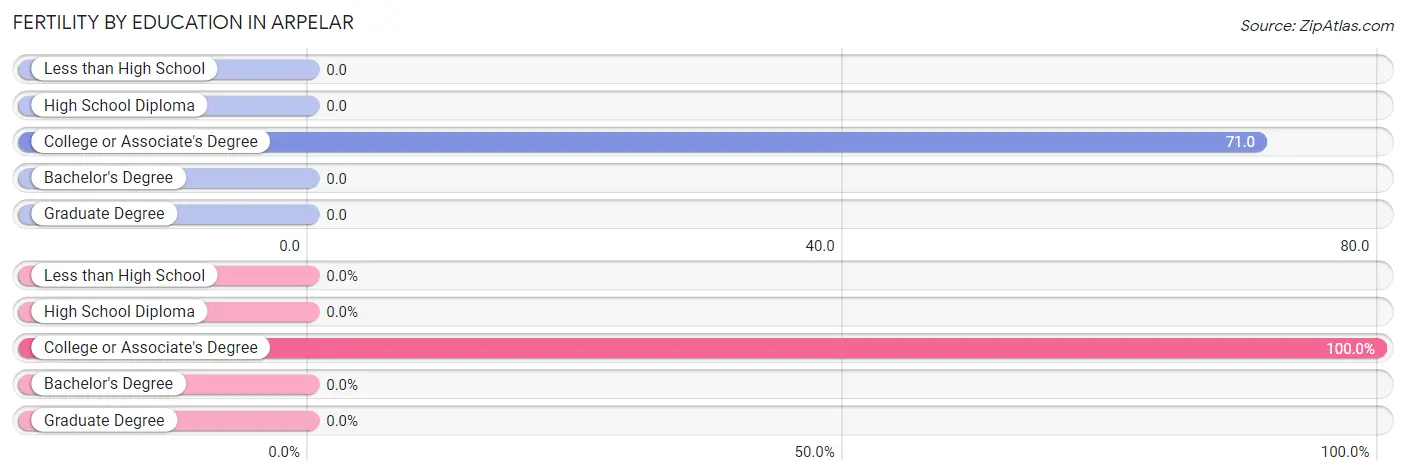
| Educational Attainment | Women with Births | Births / 1,000 Women |
| Less than High School | 0 (0.0%) | 0.0 |
| High School Diploma | 0 (0.0%) | 0.0 |
| College or Associate's Degree | 2 (100.0%) | 71.0 |
| Bachelor's Degree | 0 (0.0%) | 0.0 |
| Graduate Degree | 0 (0.0%) | 0.0 |
| Total | 2 (100.0%) | 33.0 |
Fertility by Education by Marriage Status in Arpelar
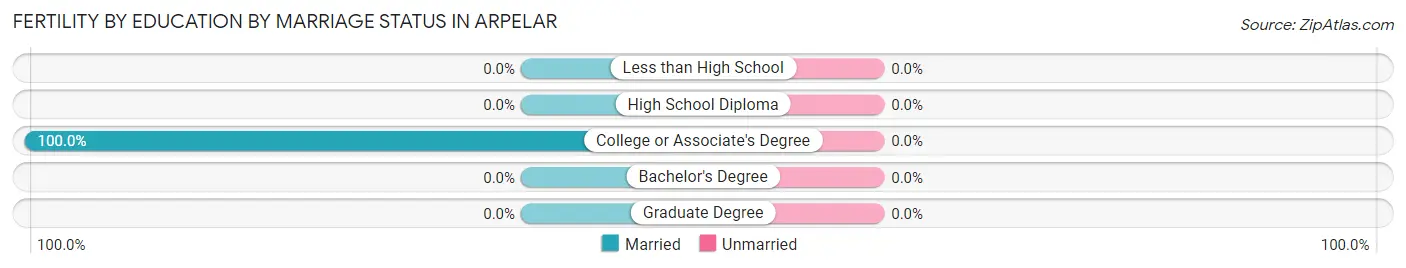
| Educational Attainment | Married | Unmarried |
| Less than High School | 0 (0.0%) | 0 (0.0%) |
| High School Diploma | 0 (0.0%) | 0 (0.0%) |
| College or Associate's Degree | 2 (100.0%) | 0 (0.0%) |
| Bachelor's Degree | 0 (0.0%) | 0 (0.0%) |
| Graduate Degree | 0 (0.0%) | 0 (0.0%) |
| Total | 2 (100.0%) | 0 (0.0%) |
Employment Characteristics in Arpelar
Employment by Class of Employer in Arpelar
Among the 149 employed individuals in Arpelar, private company employees (80 | 53.7%), not-for-profit organizations (18 | 12.1%), and federal government employees (17 | 11.4%) make up the most common classes of employment.
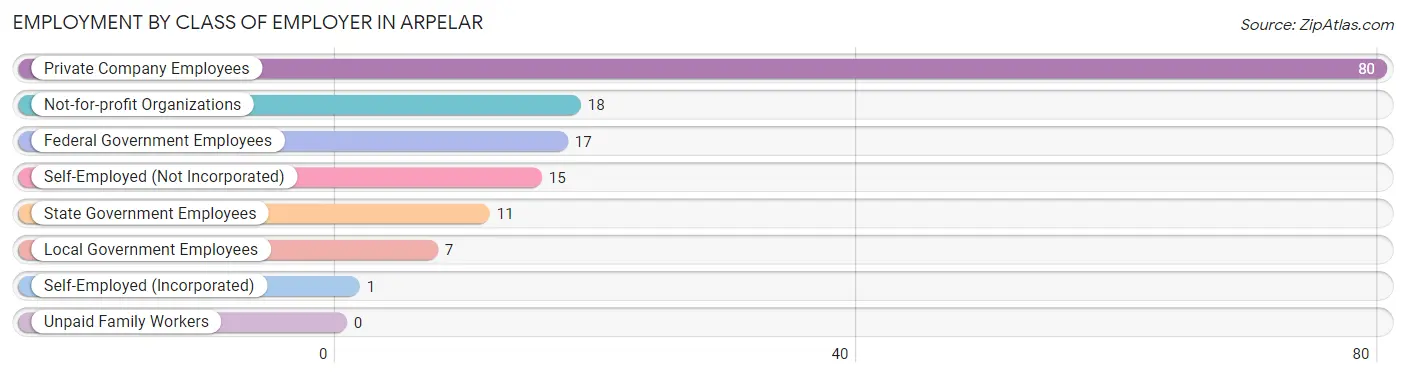
| Employer Class | # Employees | % Employees |
| Private Company Employees | 80 | 53.7% |
| Self-Employed (Incorporated) | 1 | 0.7% |
| Self-Employed (Not Incorporated) | 15 | 10.1% |
| Not-for-profit Organizations | 18 | 12.1% |
| Local Government Employees | 7 | 4.7% |
| State Government Employees | 11 | 7.4% |
| Federal Government Employees | 17 | 11.4% |
| Unpaid Family Workers | 0 | 0.0% |
| Total | 149 | 100.0% |
Employment Status by Age in Arpelar
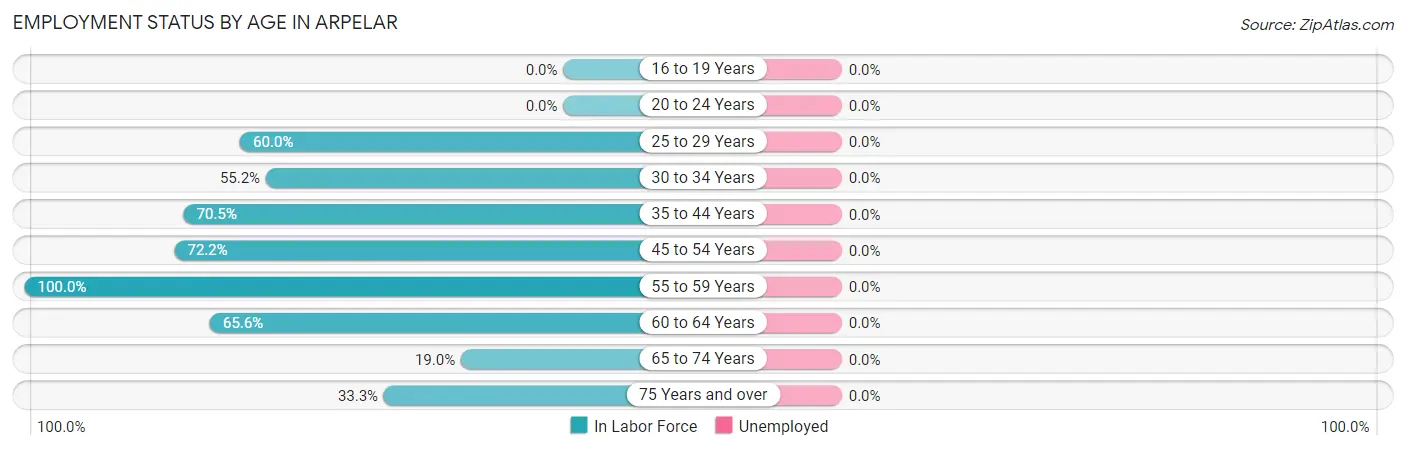
| Age Bracket | In Labor Force | Unemployed |
| 16 to 19 Years | 0 (0.0%) | 0 (0.0%) |
| 20 to 24 Years | 0 (0.0%) | 0 (0.0%) |
| 25 to 29 Years | 15 (60.0%) | 0 (0.0%) |
| 30 to 34 Years | 16 (55.2%) | 0 (0.0%) |
| 35 to 44 Years | 31 (70.5%) | 0 (0.0%) |
| 45 to 54 Years | 26 (72.2%) | 0 (0.0%) |
| 55 to 59 Years | 22 (100.0%) | 0 (0.0%) |
| 60 to 64 Years | 21 (65.6%) | 0 (0.0%) |
| 65 to 74 Years | 8 (19.0%) | 0 (0.0%) |
| 75 Years and over | 10 (33.3%) | 0 (0.0%) |
| Total | 149 (56.7%) | 0 (0.0%) |
Employment Status by Educational Attainment in Arpelar
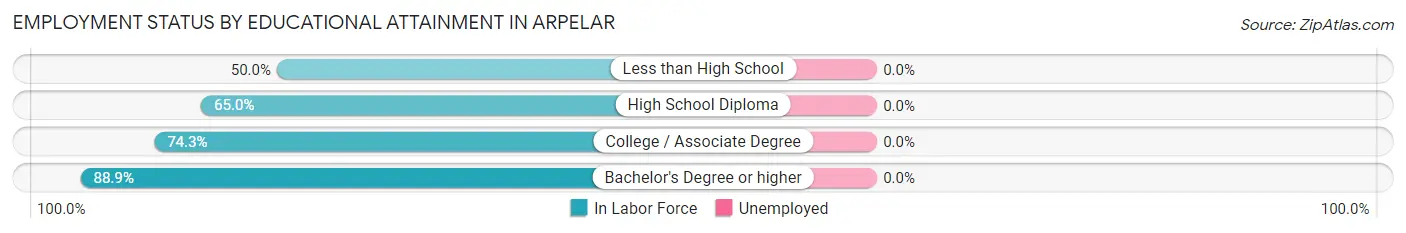
| Educational Attainment | In Labor Force | Unemployed |
| Less than High School | 8 (50.0%) | 0 (0.0%) |
| High School Diploma | 52 (65.0%) | 0 (0.0%) |
| College / Associate Degree | 55 (74.3%) | 0 (0.0%) |
| Bachelor's Degree or higher | 16 (88.9%) | 0 (0.0%) |
| Total | 131 (69.7%) | 0 (0.0%) |
Employment Occupations by Sex in Arpelar
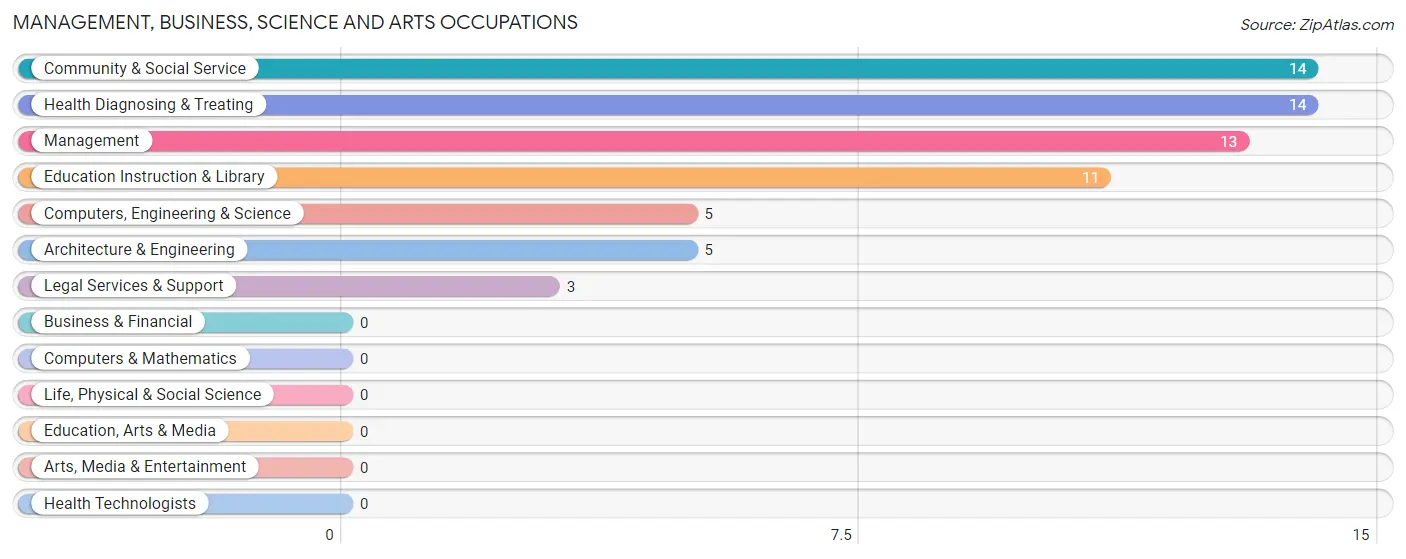
Management, Business, Science and Arts Occupations
The most common Management, Business, Science and Arts occupations in Arpelar are Community & Social Service (14 | 9.7%), Health Diagnosing & Treating (14 | 9.7%), Management (13 | 9.0%), Education Instruction & Library (11 | 7.6%), and Computers, Engineering & Science (5 | 3.5%).
Management, Business, Science and Arts Occupations by Sex
Within the Management, Business, Science and Arts occupations in Arpelar, the most male-oriented occupations are Computers, Engineering & Science (100.0%), Architecture & Engineering (100.0%), and Management (69.2%), while the most female-oriented occupations are Community & Social Service (100.0%), Legal Services & Support (100.0%), and Education Instruction & Library (100.0%).
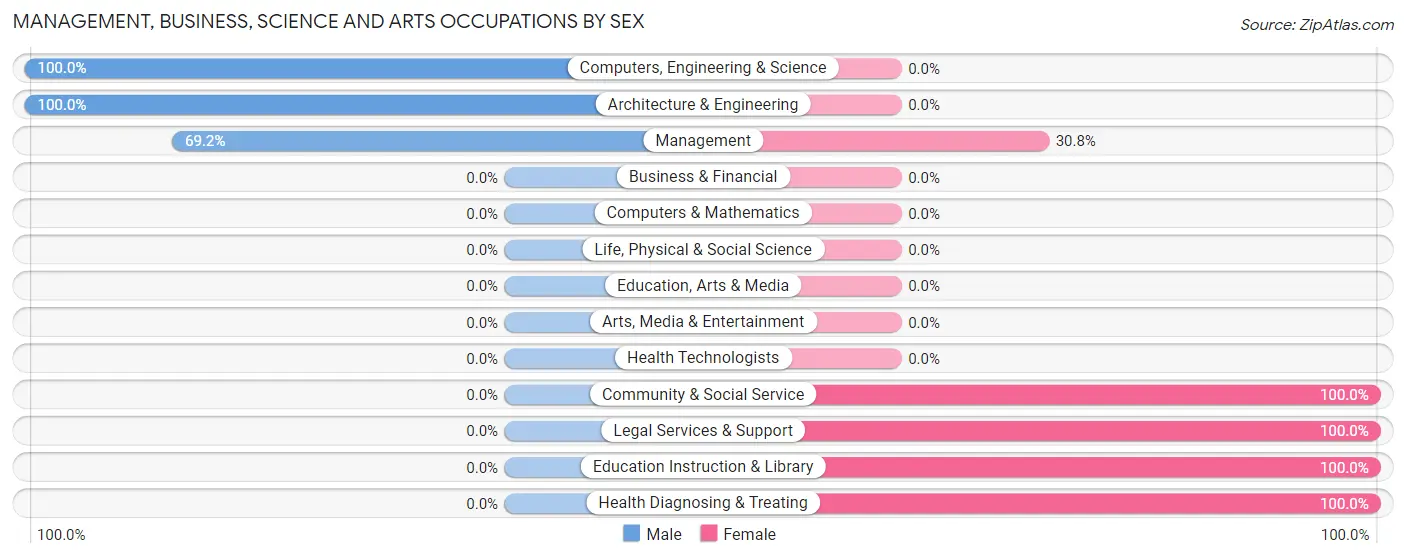
| Occupation | Male | Female |
| Management | 9 (69.2%) | 4 (30.8%) |
| Business & Financial | 0 (0.0%) | 0 (0.0%) |
| Computers, Engineering & Science | 5 (100.0%) | 0 (0.0%) |
| Computers & Mathematics | 0 (0.0%) | 0 (0.0%) |
| Architecture & Engineering | 5 (100.0%) | 0 (0.0%) |
| Life, Physical & Social Science | 0 (0.0%) | 0 (0.0%) |
| Community & Social Service | 0 (0.0%) | 14 (100.0%) |
| Education, Arts & Media | 0 (0.0%) | 0 (0.0%) |
| Legal Services & Support | 0 (0.0%) | 3 (100.0%) |
| Education Instruction & Library | 0 (0.0%) | 11 (100.0%) |
| Arts, Media & Entertainment | 0 (0.0%) | 0 (0.0%) |
| Health Diagnosing & Treating | 0 (0.0%) | 14 (100.0%) |
| Health Technologists | 0 (0.0%) | 0 (0.0%) |
| Total (Category) | 14 (30.4%) | 32 (69.6%) |
| Total (Overall) | 74 (51.0%) | 71 (49.0%) |
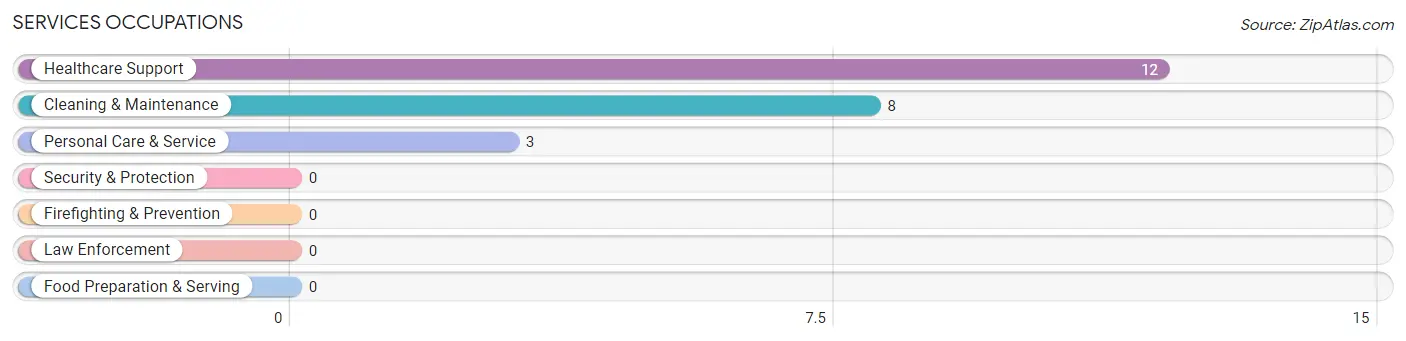
Services Occupations
The most common Services occupations in Arpelar are Healthcare Support (12 | 8.3%), Cleaning & Maintenance (8 | 5.5%), and Personal Care & Service (3 | 2.1%).
Services Occupations by Sex
Within the Services occupations in Arpelar, the most male-oriented occupations are Personal Care & Service (100.0%), Cleaning & Maintenance (50.0%), and Healthcare Support (25.0%), while the most female-oriented occupations are Healthcare Support (75.0%), and Cleaning & Maintenance (50.0%).
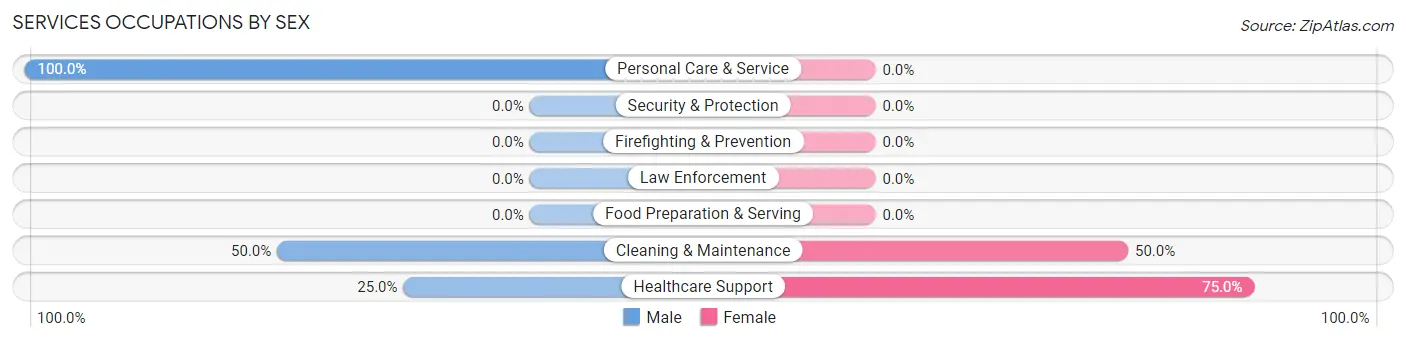
| Occupation | Male | Female |
| Healthcare Support | 3 (25.0%) | 9 (75.0%) |
| Security & Protection | 0 (0.0%) | 0 (0.0%) |
| Firefighting & Prevention | 0 (0.0%) | 0 (0.0%) |
| Law Enforcement | 0 (0.0%) | 0 (0.0%) |
| Food Preparation & Serving | 0 (0.0%) | 0 (0.0%) |
| Cleaning & Maintenance | 4 (50.0%) | 4 (50.0%) |
| Personal Care & Service | 3 (100.0%) | 0 (0.0%) |
| Total (Category) | 10 (43.5%) | 13 (56.5%) |
| Total (Overall) | 74 (51.0%) | 71 (49.0%) |
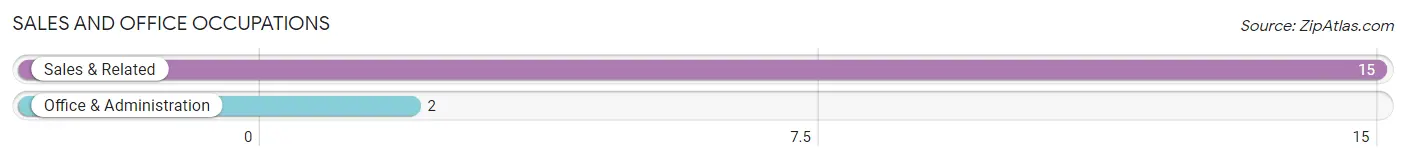
Sales and Office Occupations
The most common Sales and Office occupations in Arpelar are Sales & Related (15 | 10.3%), and Office & Administration (2 | 1.4%).
Sales and Office Occupations by Sex

| Occupation | Male | Female |
| Sales & Related | 3 (20.0%) | 12 (80.0%) |
| Office & Administration | 2 (100.0%) | 0 (0.0%) |
| Total (Category) | 5 (29.4%) | 12 (70.6%) |
| Total (Overall) | 74 (51.0%) | 71 (49.0%) |
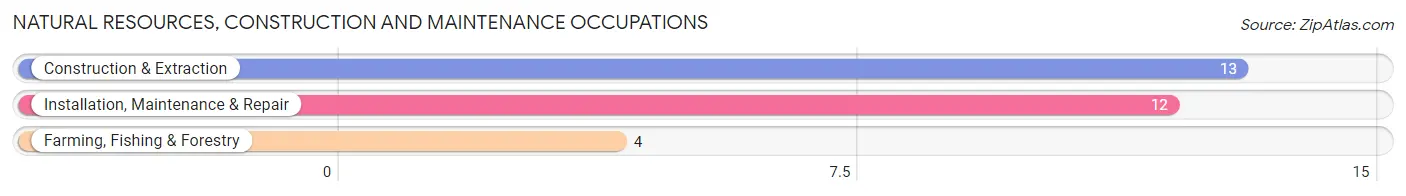
Natural Resources, Construction and Maintenance Occupations
The most common Natural Resources, Construction and Maintenance occupations in Arpelar are Construction & Extraction (13 | 9.0%), Installation, Maintenance & Repair (12 | 8.3%), and Farming, Fishing & Forestry (4 | 2.8%).
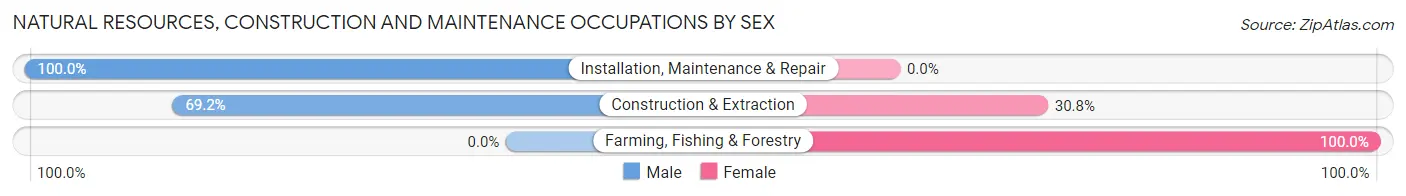
Natural Resources, Construction and Maintenance Occupations by Sex
| Occupation | Male | Female |
| Farming, Fishing & Forestry | 0 (0.0%) | 4 (100.0%) |
| Construction & Extraction | 9 (69.2%) | 4 (30.8%) |
| Installation, Maintenance & Repair | 12 (100.0%) | 0 (0.0%) |
| Total (Category) | 21 (72.4%) | 8 (27.6%) |
| Total (Overall) | 74 (51.0%) | 71 (49.0%) |
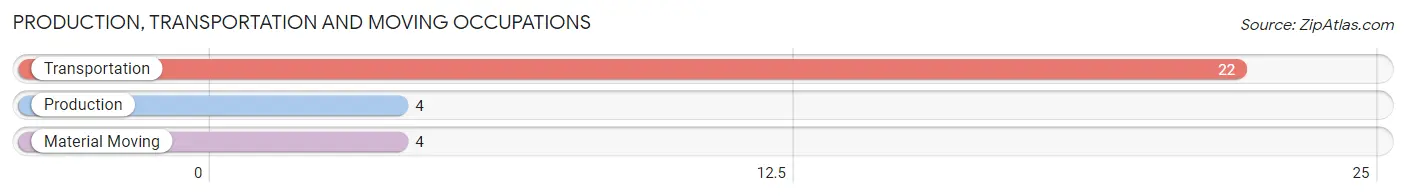
Production, Transportation and Moving Occupations
The most common Production, Transportation and Moving occupations in Arpelar are Transportation (22 | 15.2%), Production (4 | 2.8%), and Material Moving (4 | 2.8%).
Production, Transportation and Moving Occupations by Sex
| Occupation | Male | Female |
| Production | 4 (100.0%) | 0 (0.0%) |
| Transportation | 20 (90.9%) | 2 (9.1%) |
| Material Moving | 0 (0.0%) | 4 (100.0%) |
| Total (Category) | 24 (80.0%) | 6 (20.0%) |
| Total (Overall) | 74 (51.0%) | 71 (49.0%) |
Employment Industries by Sex in Arpelar
Employment Industries in Arpelar
The major employment industries in Arpelar include Health Care & Social Assistance (30 | 20.7%), Construction (25 | 17.2%), Retail Trade (21 | 14.5%), Manufacturing (18 | 12.4%), and Transportation & Warehousing (16 | 11.0%).
Employment Industries by Sex in Arpelar
The Arpelar industries that see more men than women are Construction (100.0%), Administrative & Support (100.0%), and Transportation & Warehousing (87.5%), whereas the industries that tend to have a higher number of women are Agriculture, Fishing & Hunting (100.0%), Utilities (100.0%), and Professional & Scientific (100.0%).
| Industry | Male | Female |
| Agriculture, Fishing & Hunting | 0 (0.0%) | 4 (100.0%) |
| Mining, Quarrying, & Extraction | 0 (0.0%) | 0 (0.0%) |
| Construction | 25 (100.0%) | 0 (0.0%) |
| Manufacturing | 14 (77.8%) | 4 (22.2%) |
| Wholesale Trade | 0 (0.0%) | 0 (0.0%) |
| Retail Trade | 5 (23.8%) | 16 (76.2%) |
| Transportation & Warehousing | 14 (87.5%) | 2 (12.5%) |
| Utilities | 0 (0.0%) | 4 (100.0%) |
| Information | 0 (0.0%) | 0 (0.0%) |
| Finance & Insurance | 0 (0.0%) | 0 (0.0%) |
| Real Estate, Rental & Leasing | 0 (0.0%) | 0 (0.0%) |
| Professional & Scientific | 0 (0.0%) | 3 (100.0%) |
| Enterprise Management | 0 (0.0%) | 0 (0.0%) |
| Administrative & Support | 4 (100.0%) | 0 (0.0%) |
| Educational Services | 0 (0.0%) | 7 (100.0%) |
| Health Care & Social Assistance | 3 (10.0%) | 27 (90.0%) |
| Arts, Entertainment & Recreation | 0 (0.0%) | 0 (0.0%) |
| Accommodation & Food Services | 0 (0.0%) | 4 (100.0%) |
| Public Administration | 0 (0.0%) | 0 (0.0%) |
| Total | 74 (51.0%) | 71 (49.0%) |
Education in Arpelar
School Enrollment in Arpelar
The most common levels of schooling among the 46 students in Arpelar are middle school (12 | 26.1%), high school (9 | 19.6%), and kindergarten (8 | 17.4%).
| School Level | # Students | % Students |
| Nursery / Preschool | 5 | 10.9% |
| Kindergarten | 8 | 17.4% |
| Elementary School | 4 | 8.7% |
| Middle School | 12 | 26.1% |
| High School | 9 | 19.6% |
| College / Undergraduate | 8 | 17.4% |
| Graduate / Professional | 0 | 0.0% |
| Total | 46 | 100.0% |
School Enrollment by Age by Funding Source in Arpelar
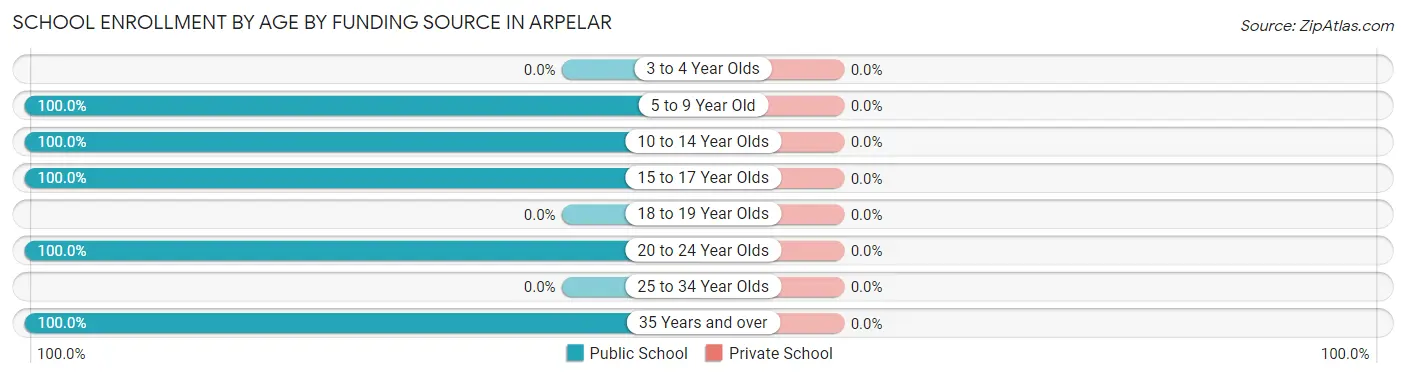
| Age Bracket | Public School | Private School |
| 3 to 4 Year Olds | 0 (0.0%) | 0 (0.0%) |
| 5 to 9 Year Old | 13 (100.0%) | 0 (0.0%) |
| 10 to 14 Year Olds | 18 (100.0%) | 0 (0.0%) |
| 15 to 17 Year Olds | 7 (100.0%) | 0 (0.0%) |
| 18 to 19 Year Olds | 0 (0.0%) | 0 (0.0%) |
| 20 to 24 Year Olds | 3 (100.0%) | 0 (0.0%) |
| 25 to 34 Year Olds | 0 (0.0%) | 0 (0.0%) |
| 35 Years and over | 5 (100.0%) | 0 (0.0%) |
| Total | 46 (100.0%) | 0 (0.0%) |
Educational Attainment by Field of Study in Arpelar
Education (13 | 37.1%), science & technology (8 | 22.9%), business (7 | 20.0%), arts & humanities (4 | 11.4%), and computers & mathematics (2 | 5.7%) are the most common fields of study among 35 individuals in Arpelar who have obtained a bachelor's degree or higher.
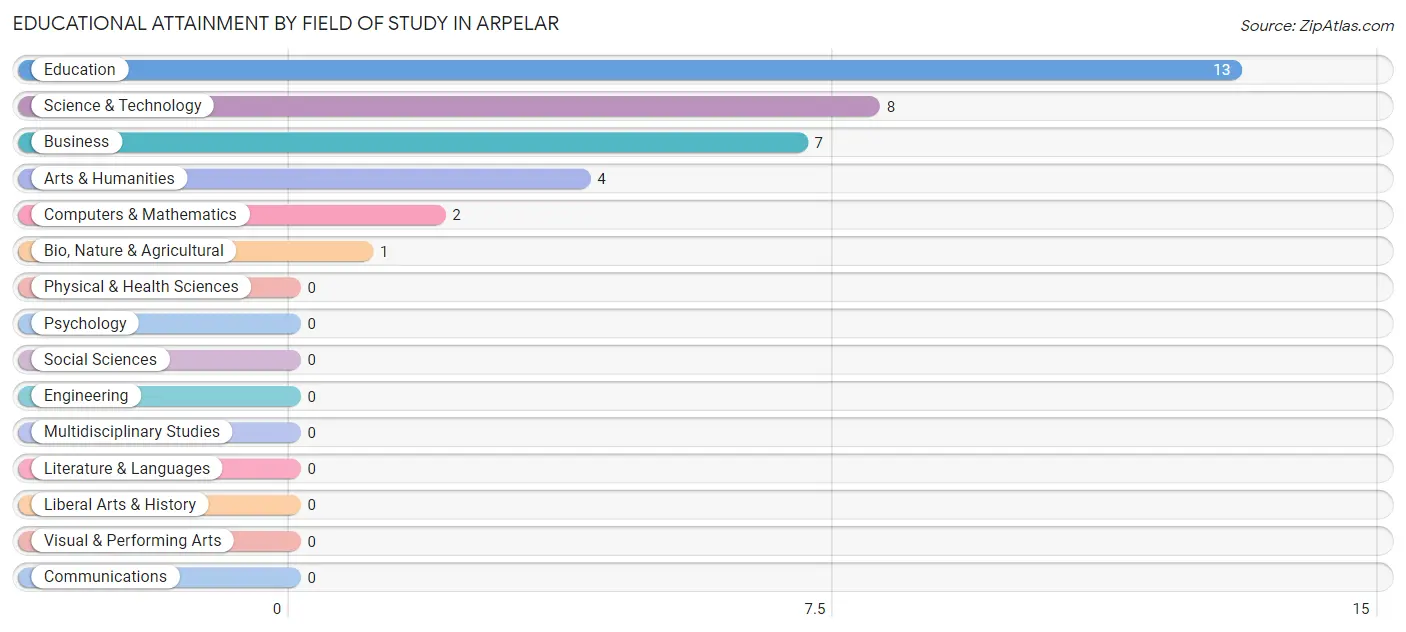
| Field of Study | # Graduates | % Graduates |
| Computers & Mathematics | 2 | 5.7% |
| Bio, Nature & Agricultural | 1 | 2.9% |
| Physical & Health Sciences | 0 | 0.0% |
| Psychology | 0 | 0.0% |
| Social Sciences | 0 | 0.0% |
| Engineering | 0 | 0.0% |
| Multidisciplinary Studies | 0 | 0.0% |
| Science & Technology | 8 | 22.9% |
| Business | 7 | 20.0% |
| Education | 13 | 37.1% |
| Literature & Languages | 0 | 0.0% |
| Liberal Arts & History | 0 | 0.0% |
| Visual & Performing Arts | 0 | 0.0% |
| Communications | 0 | 0.0% |
| Arts & Humanities | 4 | 11.4% |
| Total | 35 | 100.0% |
Transportation & Commute in Arpelar
Vehicle Availability by Sex in Arpelar
The most prevalent vehicle ownership categories in Arpelar are males with 2 vehicles (25, accounting for 33.8%) and females with 2 vehicles (14, making up 33.3%).
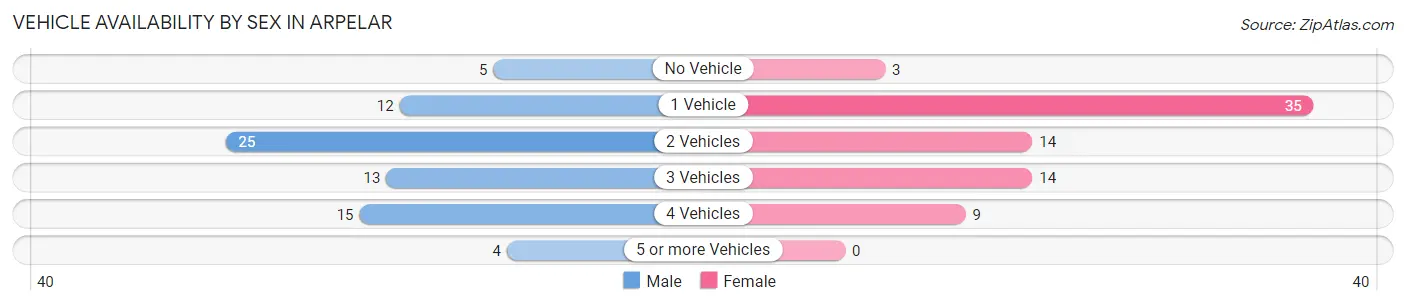
| Vehicles Available | Male | Female |
| No Vehicle | 5 (6.8%) | 3 (4.0%) |
| 1 Vehicle | 12 (16.2%) | 35 (46.7%) |
| 2 Vehicles | 25 (33.8%) | 14 (18.7%) |
| 3 Vehicles | 13 (17.6%) | 14 (18.7%) |
| 4 Vehicles | 15 (20.3%) | 9 (12.0%) |
| 5 or more Vehicles | 4 (5.4%) | 0 (0.0%) |
| Total | 74 (100.0%) | 75 (100.0%) |
Commute Time in Arpelar
The most frequently occuring commute durations in Arpelar are 20 to 24 minutes (48 commuters, 36.1%), 15 to 19 minutes (40 commuters, 30.1%), and 30 to 34 minutes (16 commuters, 12.0%).
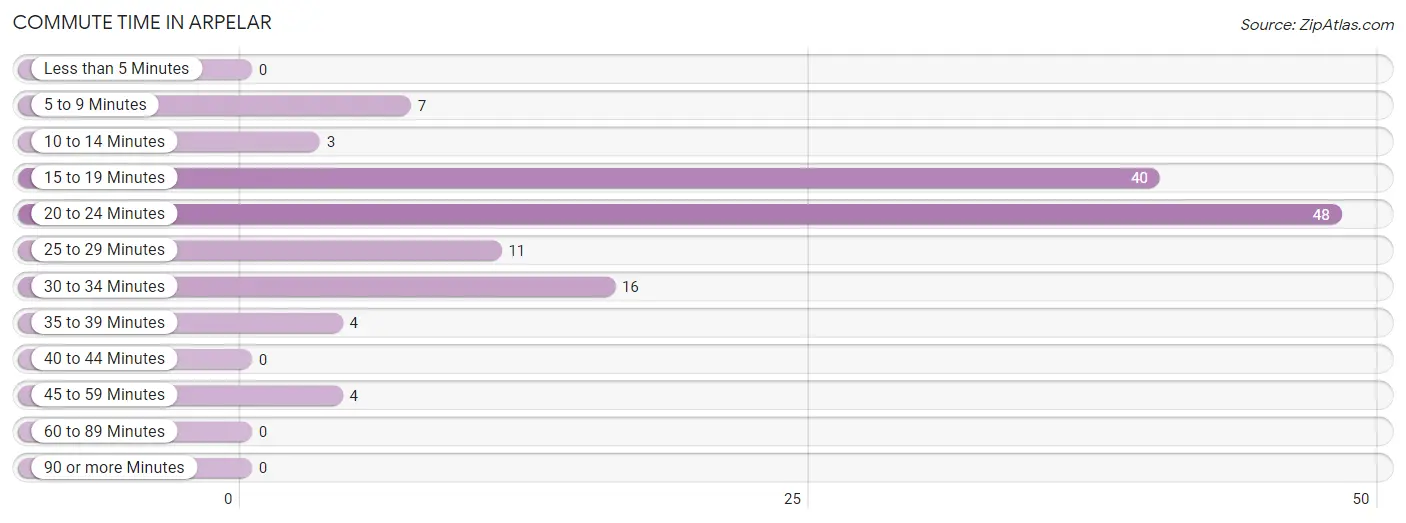
| Commute Time | # Commuters | % Commuters |
| Less than 5 Minutes | 0 | 0.0% |
| 5 to 9 Minutes | 7 | 5.3% |
| 10 to 14 Minutes | 3 | 2.3% |
| 15 to 19 Minutes | 40 | 30.1% |
| 20 to 24 Minutes | 48 | 36.1% |
| 25 to 29 Minutes | 11 | 8.3% |
| 30 to 34 Minutes | 16 | 12.0% |
| 35 to 39 Minutes | 4 | 3.0% |
| 40 to 44 Minutes | 0 | 0.0% |
| 45 to 59 Minutes | 4 | 3.0% |
| 60 to 89 Minutes | 0 | 0.0% |
| 90 or more Minutes | 0 | 0.0% |
Commute Time by Sex in Arpelar
The most common commute times in Arpelar are 15 to 19 minutes (21 commuters, 33.9%) for males and 20 to 24 minutes (27 commuters, 38.0%) for females.
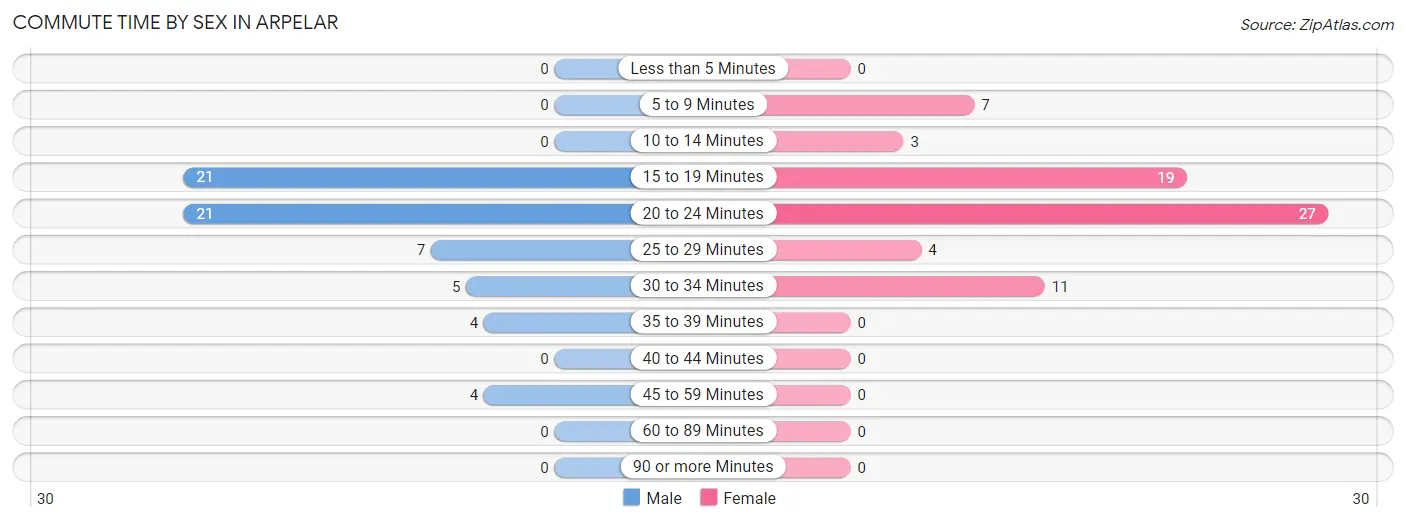
| Commute Time | Male | Female |
| Less than 5 Minutes | 0 (0.0%) | 0 (0.0%) |
| 5 to 9 Minutes | 0 (0.0%) | 7 (9.9%) |
| 10 to 14 Minutes | 0 (0.0%) | 3 (4.2%) |
| 15 to 19 Minutes | 21 (33.9%) | 19 (26.8%) |
| 20 to 24 Minutes | 21 (33.9%) | 27 (38.0%) |
| 25 to 29 Minutes | 7 (11.3%) | 4 (5.6%) |
| 30 to 34 Minutes | 5 (8.1%) | 11 (15.5%) |
| 35 to 39 Minutes | 4 (6.5%) | 0 (0.0%) |
| 40 to 44 Minutes | 0 (0.0%) | 0 (0.0%) |
| 45 to 59 Minutes | 4 (6.5%) | 0 (0.0%) |
| 60 to 89 Minutes | 0 (0.0%) | 0 (0.0%) |
| 90 or more Minutes | 0 (0.0%) | 0 (0.0%) |
Time of Departure to Work by Sex in Arpelar
The most frequent times of departure to work in Arpelar are 6:00 AM to 6:29 AM (12, 19.4%) for males and 7:30 AM to 7:59 AM (25, 35.2%) for females.
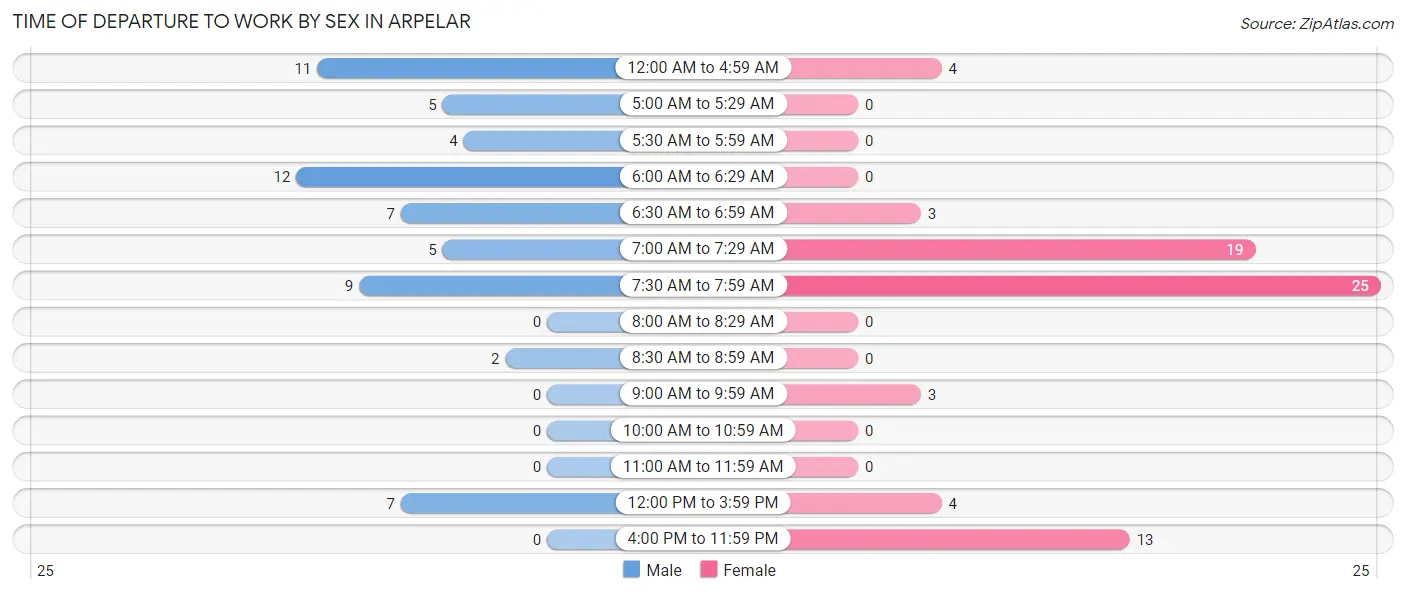
| Time of Departure | Male | Female |
| 12:00 AM to 4:59 AM | 11 (17.7%) | 4 (5.6%) |
| 5:00 AM to 5:29 AM | 5 (8.1%) | 0 (0.0%) |
| 5:30 AM to 5:59 AM | 4 (6.5%) | 0 (0.0%) |
| 6:00 AM to 6:29 AM | 12 (19.4%) | 0 (0.0%) |
| 6:30 AM to 6:59 AM | 7 (11.3%) | 3 (4.2%) |
| 7:00 AM to 7:29 AM | 5 (8.1%) | 19 (26.8%) |
| 7:30 AM to 7:59 AM | 9 (14.5%) | 25 (35.2%) |
| 8:00 AM to 8:29 AM | 0 (0.0%) | 0 (0.0%) |
| 8:30 AM to 8:59 AM | 2 (3.2%) | 0 (0.0%) |
| 9:00 AM to 9:59 AM | 0 (0.0%) | 3 (4.2%) |
| 10:00 AM to 10:59 AM | 0 (0.0%) | 0 (0.0%) |
| 11:00 AM to 11:59 AM | 0 (0.0%) | 0 (0.0%) |
| 12:00 PM to 3:59 PM | 7 (11.3%) | 4 (5.6%) |
| 4:00 PM to 11:59 PM | 0 (0.0%) | 13 (18.3%) |
| Total | 62 (100.0%) | 71 (100.0%) |
Housing Occupancy in Arpelar
Occupancy by Ownership in Arpelar
Of the total 130 dwellings in Arpelar, owner-occupied units account for 109 (83.9%), while renter-occupied units make up 21 (16.2%).
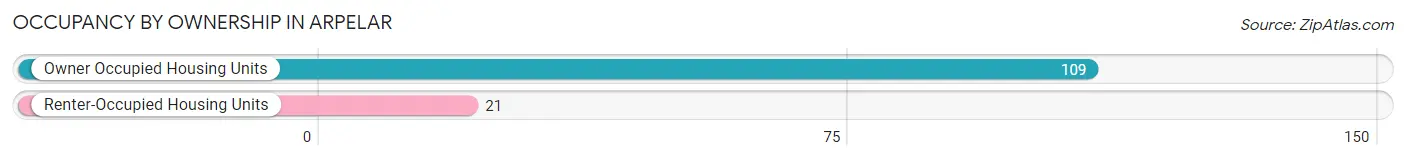
| Occupancy | # Housing Units | % Housing Units |
| Owner Occupied Housing Units | 109 | 83.9% |
| Renter-Occupied Housing Units | 21 | 16.2% |
| Total Occupied Housing Units | 130 | 100.0% |
Occupancy by Household Size in Arpelar
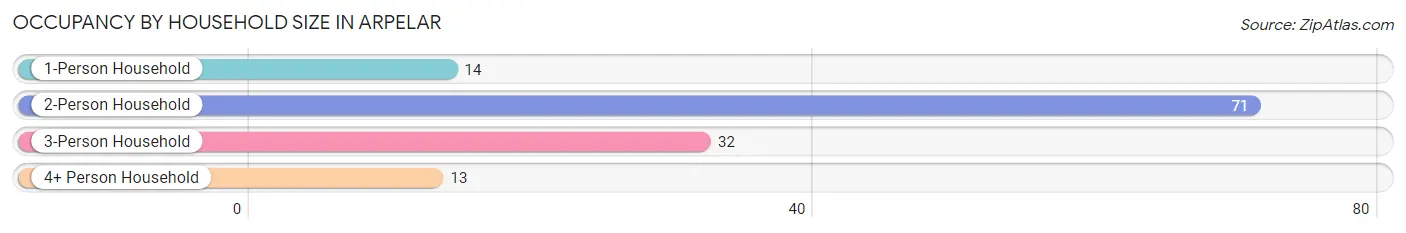
| Household Size | # Housing Units | % Housing Units |
| 1-Person Household | 14 | 10.8% |
| 2-Person Household | 71 | 54.6% |
| 3-Person Household | 32 | 24.6% |
| 4+ Person Household | 13 | 10.0% |
| Total Housing Units | 130 | 100.0% |
Occupancy by Ownership by Household Size in Arpelar
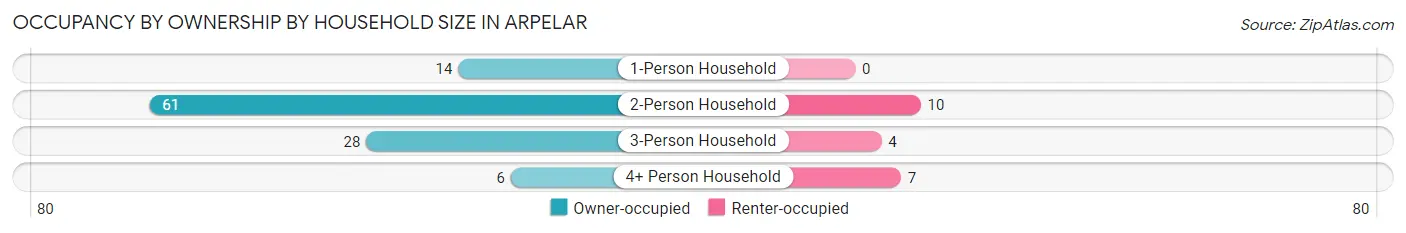
| Household Size | Owner-occupied | Renter-occupied |
| 1-Person Household | 14 (100.0%) | 0 (0.0%) |
| 2-Person Household | 61 (85.9%) | 10 (14.1%) |
| 3-Person Household | 28 (87.5%) | 4 (12.5%) |
| 4+ Person Household | 6 (46.2%) | 7 (53.8%) |
| Total Housing Units | 109 (83.9%) | 21 (16.2%) |
Occupancy by Educational Attainment in Arpelar
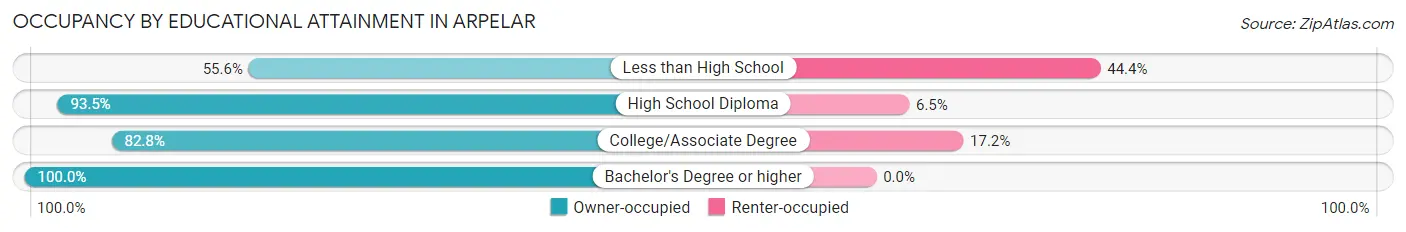
| Household Size | Owner-occupied | Renter-occupied |
| Less than High School | 10 (55.6%) | 8 (44.4%) |
| High School Diploma | 43 (93.5%) | 3 (6.5%) |
| College/Associate Degree | 48 (82.8%) | 10 (17.2%) |
| Bachelor's Degree or higher | 8 (100.0%) | 0 (0.0%) |
Occupancy by Age of Householder in Arpelar
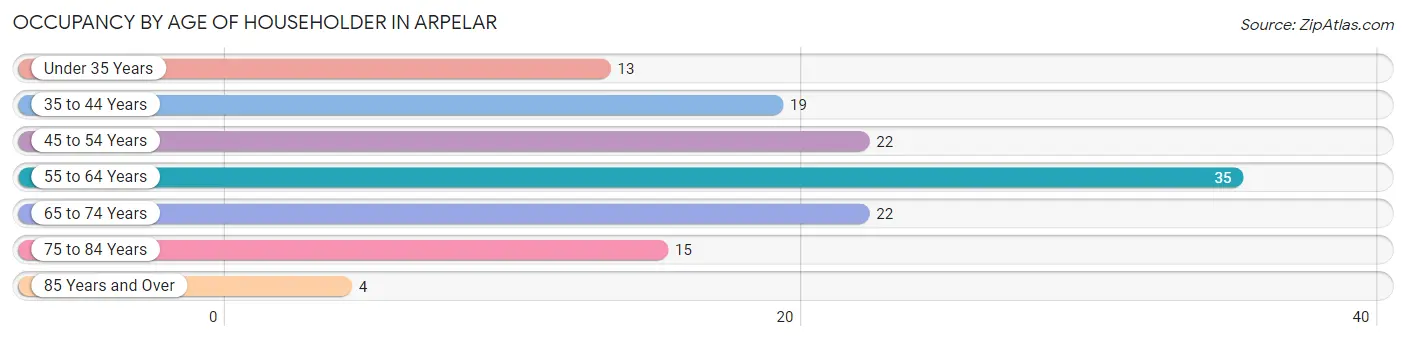
| Age Bracket | # Households | % Households |
| Under 35 Years | 13 | 10.0% |
| 35 to 44 Years | 19 | 14.6% |
| 45 to 54 Years | 22 | 16.9% |
| 55 to 64 Years | 35 | 26.9% |
| 65 to 74 Years | 22 | 16.9% |
| 75 to 84 Years | 15 | 11.5% |
| 85 Years and Over | 4 | 3.1% |
| Total | 130 | 100.0% |
Housing Finances in Arpelar
Median Income by Occupancy in Arpelar
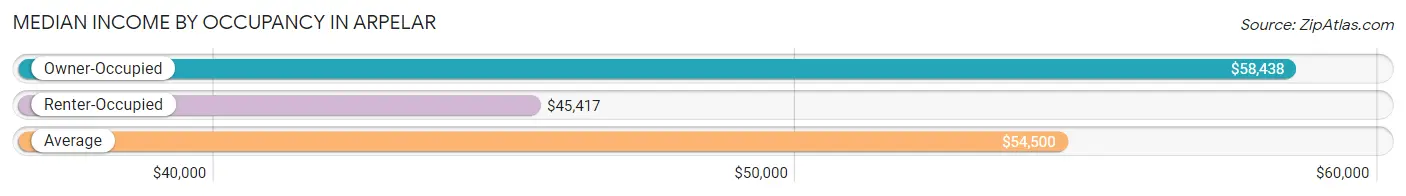
| Occupancy Type | # Households | Median Income |
| Owner-Occupied | 109 (83.9%) | $58,438 |
| Renter-Occupied | 21 (16.2%) | $45,417 |
| Average | 130 (100.0%) | $54,500 |
Occupancy by Householder Income Bracket in Arpelar
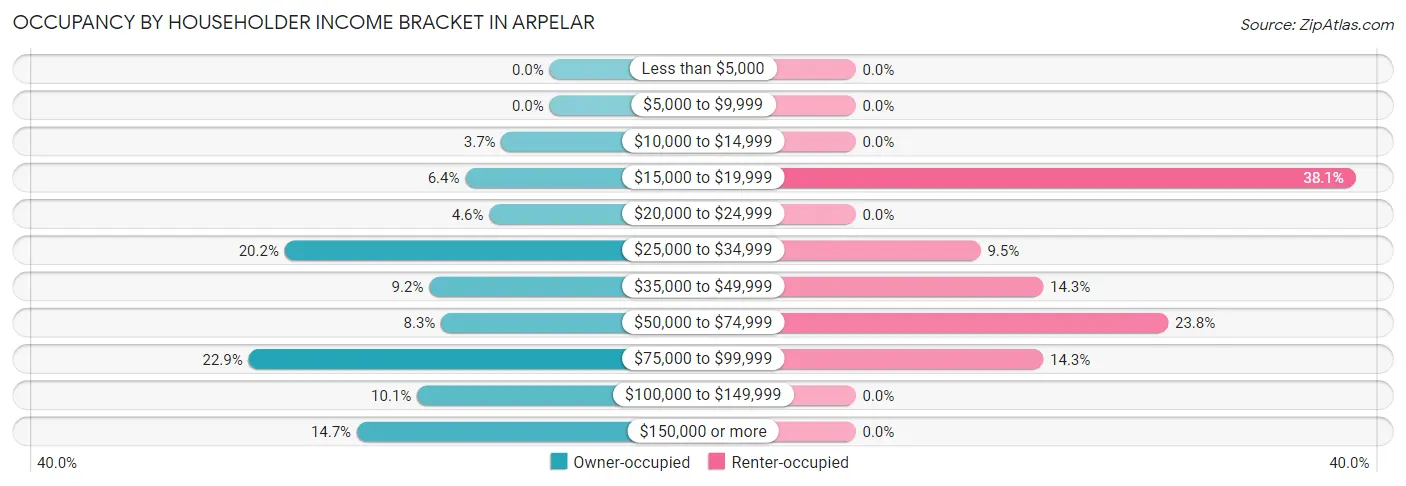
| Income Bracket | Owner-occupied | Renter-occupied |
| Less than $5,000 | 0 (0.0%) | 0 (0.0%) |
| $5,000 to $9,999 | 0 (0.0%) | 0 (0.0%) |
| $10,000 to $14,999 | 4 (3.7%) | 0 (0.0%) |
| $15,000 to $19,999 | 7 (6.4%) | 8 (38.1%) |
| $20,000 to $24,999 | 5 (4.6%) | 0 (0.0%) |
| $25,000 to $34,999 | 22 (20.2%) | 2 (9.5%) |
| $35,000 to $49,999 | 10 (9.2%) | 3 (14.3%) |
| $50,000 to $74,999 | 9 (8.3%) | 5 (23.8%) |
| $75,000 to $99,999 | 25 (22.9%) | 3 (14.3%) |
| $100,000 to $149,999 | 11 (10.1%) | 0 (0.0%) |
| $150,000 or more | 16 (14.7%) | 0 (0.0%) |
| Total | 109 (100.0%) | 21 (100.0%) |
Monthly Housing Cost Tiers in Arpelar
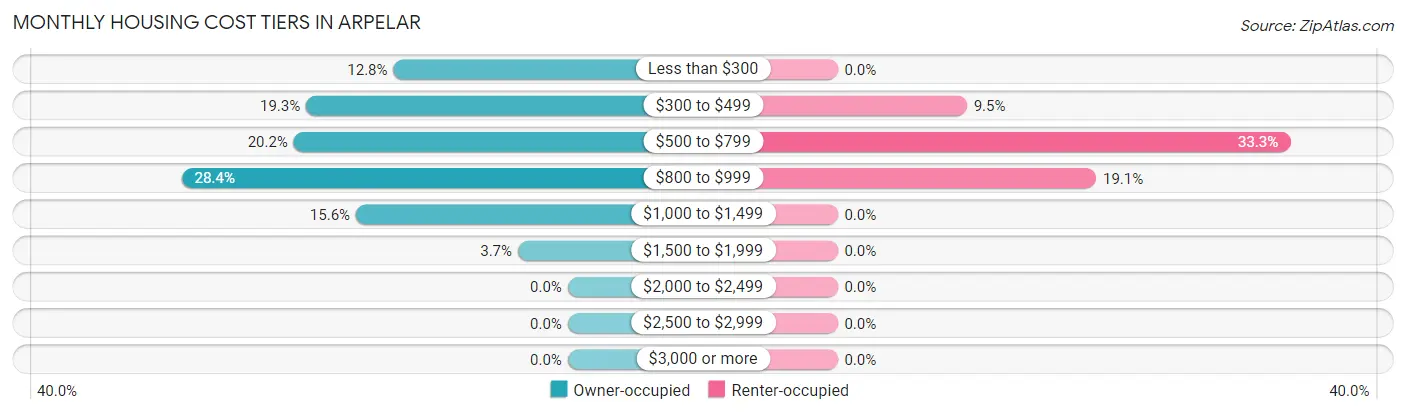
| Monthly Cost | Owner-occupied | Renter-occupied |
| Less than $300 | 14 (12.8%) | 0 (0.0%) |
| $300 to $499 | 21 (19.3%) | 2 (9.5%) |
| $500 to $799 | 22 (20.2%) | 7 (33.3%) |
| $800 to $999 | 31 (28.4%) | 4 (19.1%) |
| $1,000 to $1,499 | 17 (15.6%) | 0 (0.0%) |
| $1,500 to $1,999 | 4 (3.7%) | 0 (0.0%) |
| $2,000 to $2,499 | 0 (0.0%) | 0 (0.0%) |
| $2,500 to $2,999 | 0 (0.0%) | 0 (0.0%) |
| $3,000 or more | 0 (0.0%) | 0 (0.0%) |
| Total | 109 (100.0%) | 21 (100.0%) |
Physical Housing Characteristics in Arpelar
Housing Structures in Arpelar
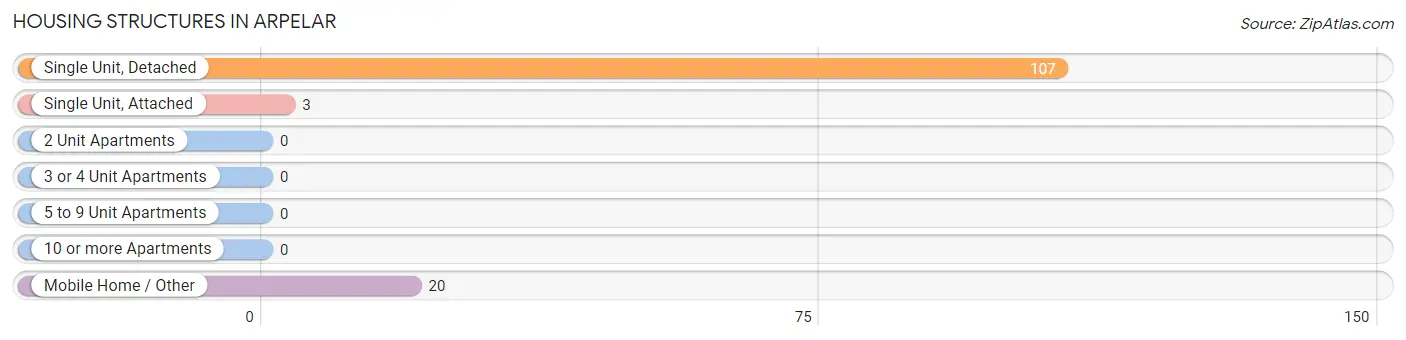
| Structure Type | # Housing Units | % Housing Units |
| Single Unit, Detached | 107 | 82.3% |
| Single Unit, Attached | 3 | 2.3% |
| 2 Unit Apartments | 0 | 0.0% |
| 3 or 4 Unit Apartments | 0 | 0.0% |
| 5 to 9 Unit Apartments | 0 | 0.0% |
| 10 or more Apartments | 0 | 0.0% |
| Mobile Home / Other | 20 | 15.4% |
| Total | 130 | 100.0% |
Housing Structures by Occupancy in Arpelar
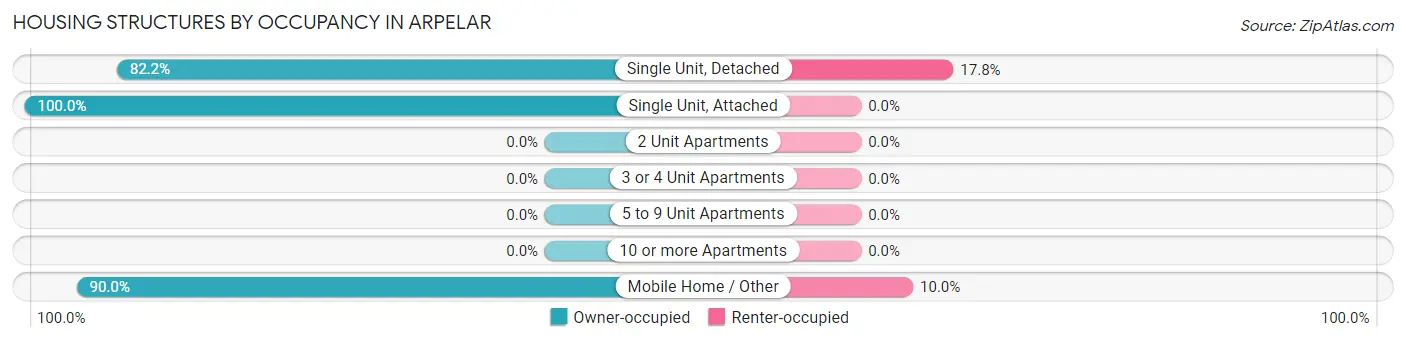
| Structure Type | Owner-occupied | Renter-occupied |
| Single Unit, Detached | 88 (82.2%) | 19 (17.8%) |
| Single Unit, Attached | 3 (100.0%) | 0 (0.0%) |
| 2 Unit Apartments | 0 (0.0%) | 0 (0.0%) |
| 3 or 4 Unit Apartments | 0 (0.0%) | 0 (0.0%) |
| 5 to 9 Unit Apartments | 0 (0.0%) | 0 (0.0%) |
| 10 or more Apartments | 0 (0.0%) | 0 (0.0%) |
| Mobile Home / Other | 18 (90.0%) | 2 (10.0%) |
| Total | 109 (83.9%) | 21 (16.2%) |
Housing Structures by Number of Rooms in Arpelar
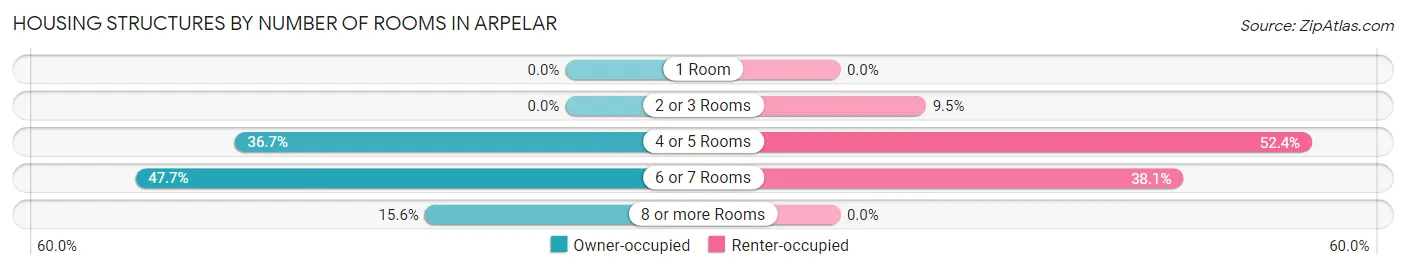
| Number of Rooms | Owner-occupied | Renter-occupied |
| 1 Room | 0 (0.0%) | 0 (0.0%) |
| 2 or 3 Rooms | 0 (0.0%) | 2 (9.5%) |
| 4 or 5 Rooms | 40 (36.7%) | 11 (52.4%) |
| 6 or 7 Rooms | 52 (47.7%) | 8 (38.1%) |
| 8 or more Rooms | 17 (15.6%) | 0 (0.0%) |
| Total | 109 (100.0%) | 21 (100.0%) |
Housing Structure by Heating Type in Arpelar
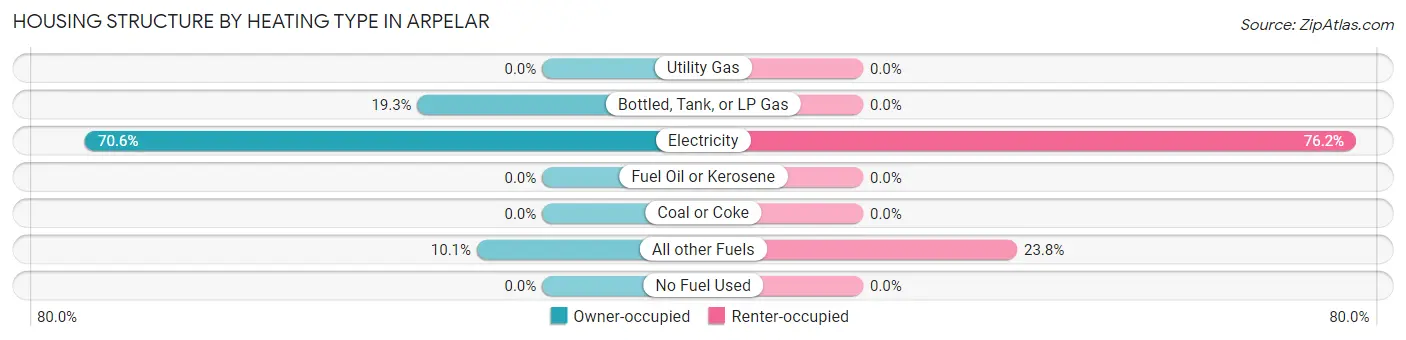
| Heating Type | Owner-occupied | Renter-occupied |
| Utility Gas | 0 (0.0%) | 0 (0.0%) |
| Bottled, Tank, or LP Gas | 21 (19.3%) | 0 (0.0%) |
| Electricity | 77 (70.6%) | 16 (76.2%) |
| Fuel Oil or Kerosene | 0 (0.0%) | 0 (0.0%) |
| Coal or Coke | 0 (0.0%) | 0 (0.0%) |
| All other Fuels | 11 (10.1%) | 5 (23.8%) |
| No Fuel Used | 0 (0.0%) | 0 (0.0%) |
| Total | 109 (100.0%) | 21 (100.0%) |
Household Vehicle Usage in Arpelar
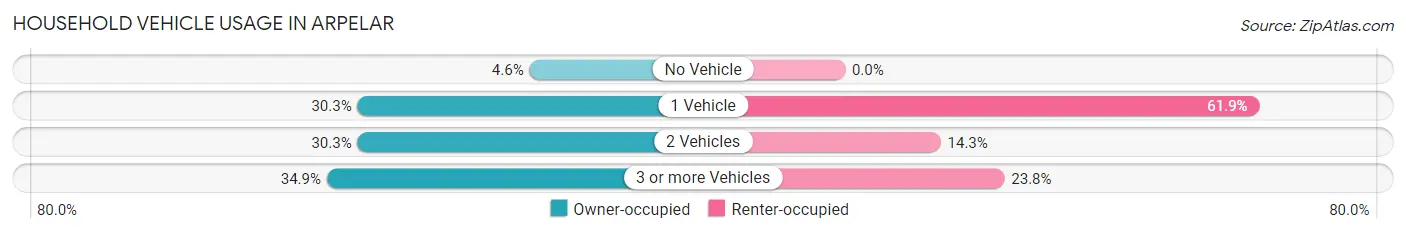
| Vehicles per Household | Owner-occupied | Renter-occupied |
| No Vehicle | 5 (4.6%) | 0 (0.0%) |
| 1 Vehicle | 33 (30.3%) | 13 (61.9%) |
| 2 Vehicles | 33 (30.3%) | 3 (14.3%) |
| 3 or more Vehicles | 38 (34.9%) | 5 (23.8%) |
| Total | 109 (100.0%) | 21 (100.0%) |
Real Estate & Mortgages in Arpelar
Real Estate and Mortgage Overview in Arpelar
| Characteristic | Without Mortgage | With Mortgage |
| Housing Units | 57 | 52 |
| Median Property Value | $104,200 | $129,200 |
| Median Household Income | $33,393 | $11 |
| Monthly Housing Costs | $407 | $0 |
| Real Estate Taxes | $514 | $3 |
Property Value by Mortgage Status in Arpelar
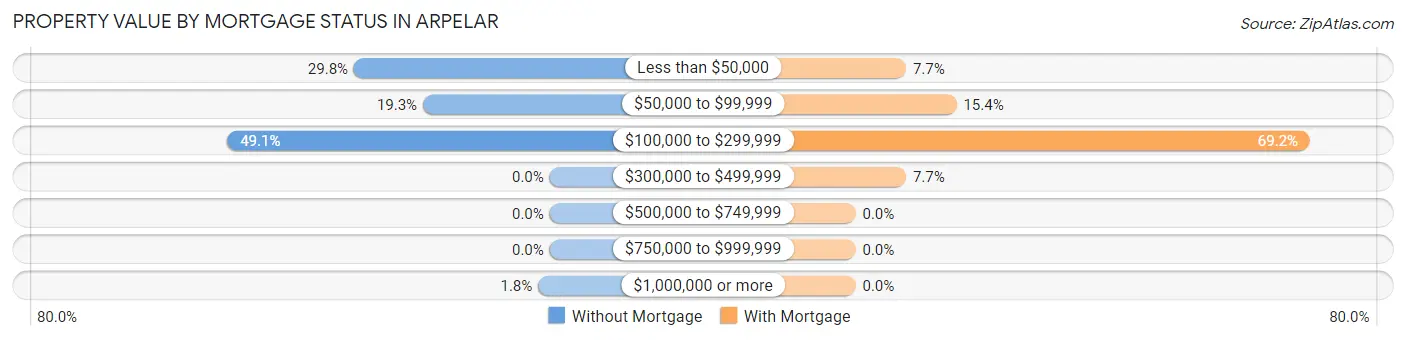
| Property Value | Without Mortgage | With Mortgage |
| Less than $50,000 | 17 (29.8%) | 4 (7.7%) |
| $50,000 to $99,999 | 11 (19.3%) | 8 (15.4%) |
| $100,000 to $299,999 | 28 (49.1%) | 36 (69.2%) |
| $300,000 to $499,999 | 0 (0.0%) | 4 (7.7%) |
| $500,000 to $749,999 | 0 (0.0%) | 0 (0.0%) |
| $750,000 to $999,999 | 0 (0.0%) | 0 (0.0%) |
| $1,000,000 or more | 1 (1.8%) | 0 (0.0%) |
| Total | 57 (100.0%) | 52 (100.0%) |
Household Income by Mortgage Status in Arpelar
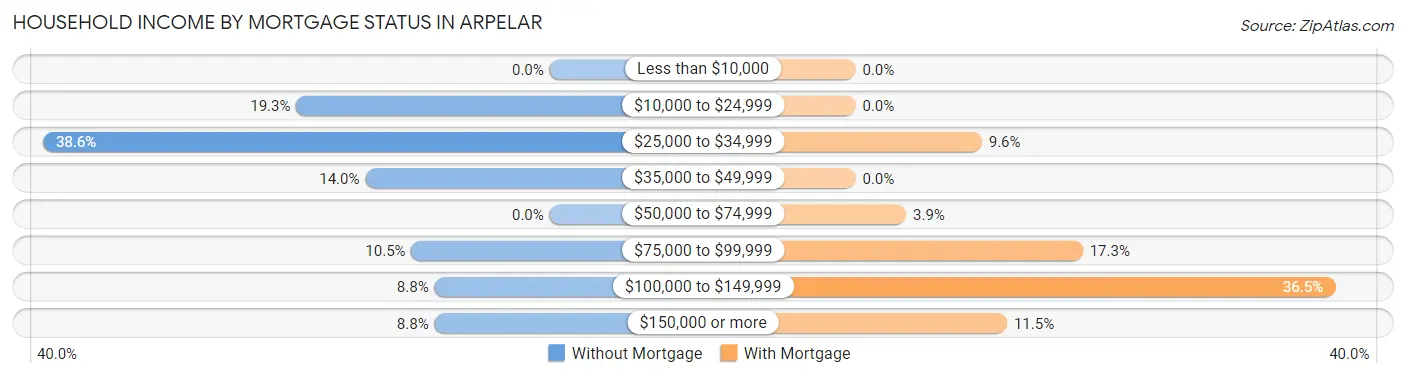
| Household Income | Without Mortgage | With Mortgage |
| Less than $10,000 | 0 (0.0%) | 0 (0.0%) |
| $10,000 to $24,999 | 11 (19.3%) | 0 (0.0%) |
| $25,000 to $34,999 | 22 (38.6%) | 5 (9.6%) |
| $35,000 to $49,999 | 8 (14.0%) | 0 (0.0%) |
| $50,000 to $74,999 | 0 (0.0%) | 2 (3.8%) |
| $75,000 to $99,999 | 6 (10.5%) | 9 (17.3%) |
| $100,000 to $149,999 | 5 (8.8%) | 19 (36.5%) |
| $150,000 or more | 5 (8.8%) | 6 (11.5%) |
| Total | 57 (100.0%) | 52 (100.0%) |
Property Value to Household Income Ratio in Arpelar
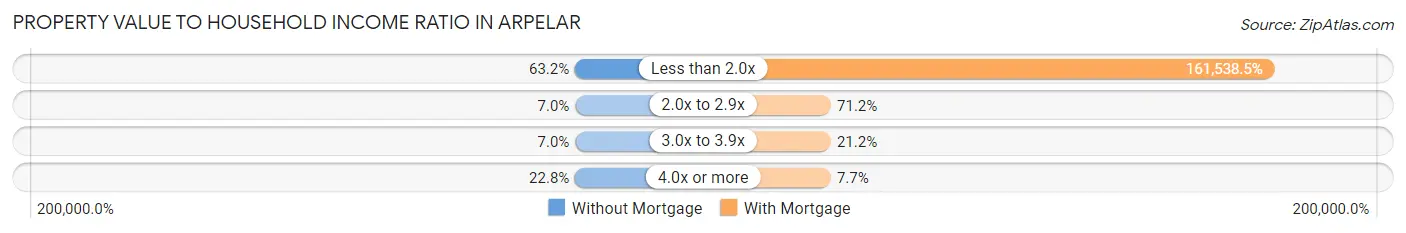
| Value-to-Income Ratio | Without Mortgage | With Mortgage |
| Less than 2.0x | 36 (63.2%) | 84,000 (161,538.5%) |
| 2.0x to 2.9x | 4 (7.0%) | 37 (71.2%) |
| 3.0x to 3.9x | 4 (7.0%) | 11 (21.1%) |
| 4.0x or more | 13 (22.8%) | 4 (7.7%) |
| Total | 57 (100.0%) | 52 (100.0%) |
Real Estate Taxes by Mortgage Status in Arpelar
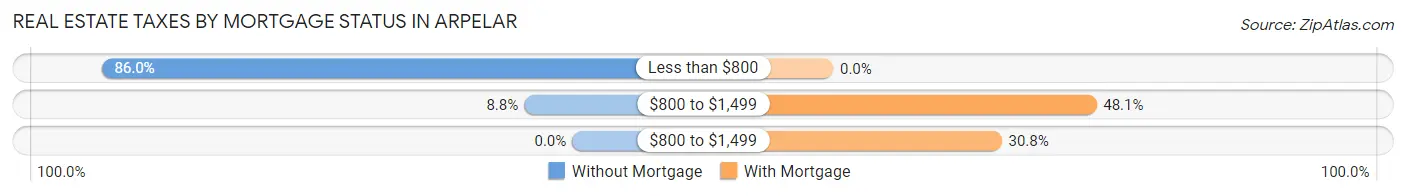
| Property Taxes | Without Mortgage | With Mortgage |
| Less than $800 | 49 (86.0%) | 0 (0.0%) |
| $800 to $1,499 | 5 (8.8%) | 25 (48.1%) |
| $800 to $1,499 | 0 (0.0%) | 16 (30.8%) |
| Total | 57 (100.0%) | 52 (100.0%) |
Health & Disability in Arpelar
Health Insurance Coverage by Age in Arpelar
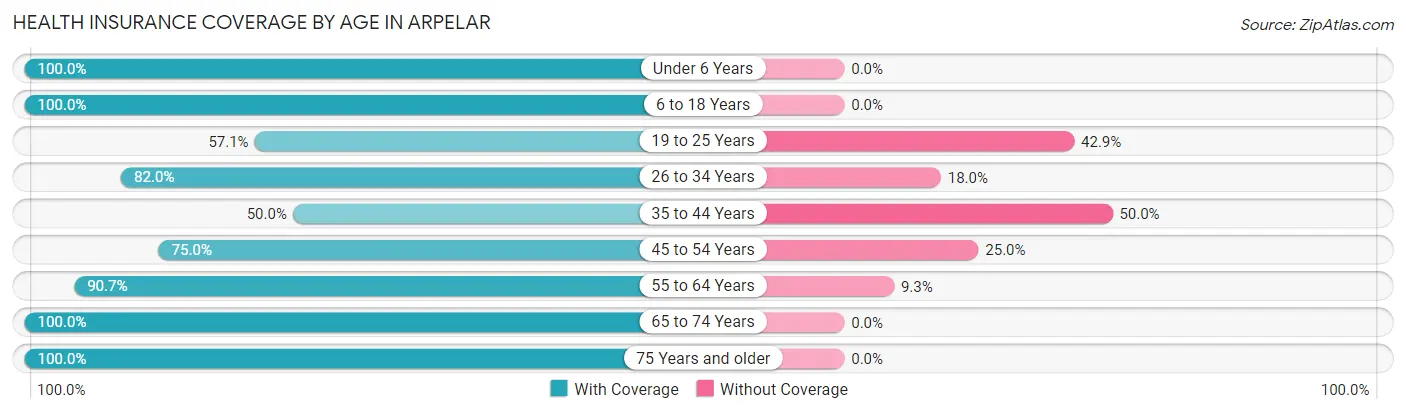
| Age Bracket | With Coverage | Without Coverage |
| Under 6 Years | 24 (100.0%) | 0 (0.0%) |
| 6 to 18 Years | 28 (100.0%) | 0 (0.0%) |
| 19 to 25 Years | 4 (57.1%) | 3 (42.9%) |
| 26 to 34 Years | 41 (82.0%) | 9 (18.0%) |
| 35 to 44 Years | 20 (50.0%) | 20 (50.0%) |
| 45 to 54 Years | 27 (75.0%) | 9 (25.0%) |
| 55 to 64 Years | 49 (90.7%) | 5 (9.3%) |
| 65 to 74 Years | 42 (100.0%) | 0 (0.0%) |
| 75 Years and older | 30 (100.0%) | 0 (0.0%) |
| Total | 265 (85.2%) | 46 (14.8%) |
Health Insurance Coverage by Citizenship Status in Arpelar
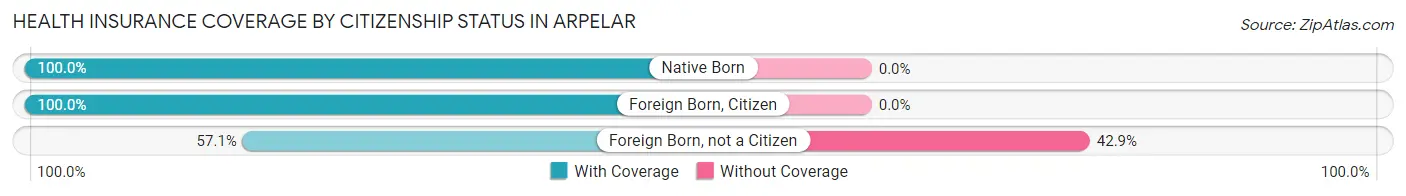
| Citizenship Status | With Coverage | Without Coverage |
| Native Born | 24 (100.0%) | 0 (0.0%) |
| Foreign Born, Citizen | 28 (100.0%) | 0 (0.0%) |
| Foreign Born, not a Citizen | 4 (57.1%) | 3 (42.9%) |
Health Insurance Coverage by Household Income in Arpelar
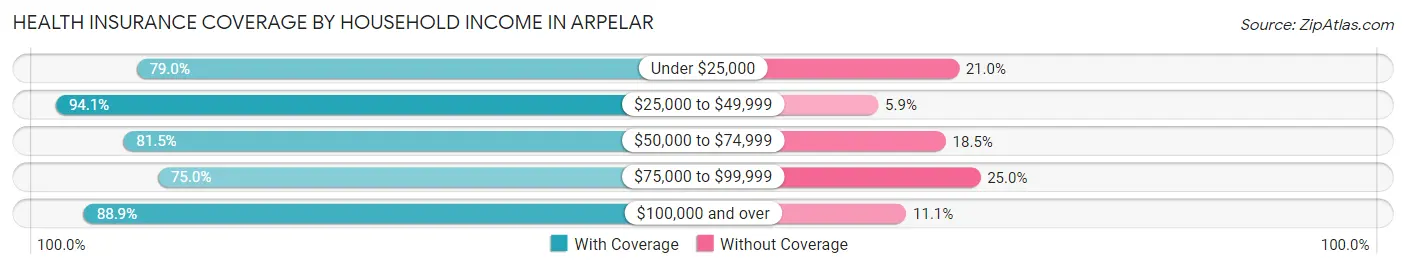
| Household Income | With Coverage | Without Coverage |
| Under $25,000 | 49 (79.0%) | 13 (21.0%) |
| $25,000 to $49,999 | 80 (94.1%) | 5 (5.9%) |
| $50,000 to $74,999 | 22 (81.5%) | 5 (18.5%) |
| $75,000 to $99,999 | 42 (75.0%) | 14 (25.0%) |
| $100,000 and over | 72 (88.9%) | 9 (11.1%) |
Public vs Private Health Insurance Coverage by Age in Arpelar
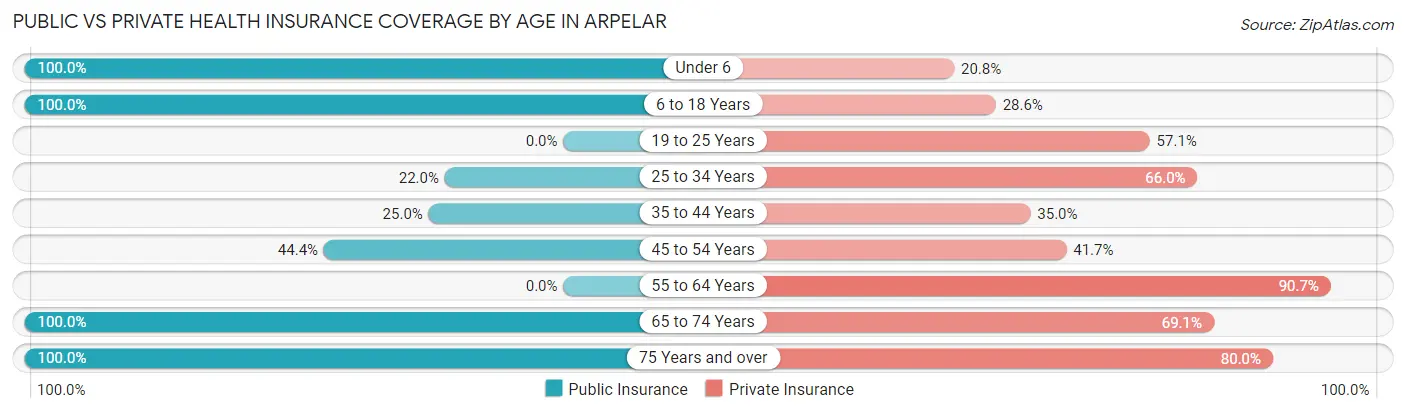
| Age Bracket | Public Insurance | Private Insurance |
| Under 6 | 24 (100.0%) | 5 (20.8%) |
| 6 to 18 Years | 28 (100.0%) | 8 (28.6%) |
| 19 to 25 Years | 0 (0.0%) | 4 (57.1%) |
| 25 to 34 Years | 11 (22.0%) | 33 (66.0%) |
| 35 to 44 Years | 10 (25.0%) | 14 (35.0%) |
| 45 to 54 Years | 16 (44.4%) | 15 (41.7%) |
| 55 to 64 Years | 0 (0.0%) | 49 (90.7%) |
| 65 to 74 Years | 42 (100.0%) | 29 (69.1%) |
| 75 Years and over | 30 (100.0%) | 24 (80.0%) |
| Total | 161 (51.8%) | 181 (58.2%) |
Disability Status by Sex by Age in Arpelar
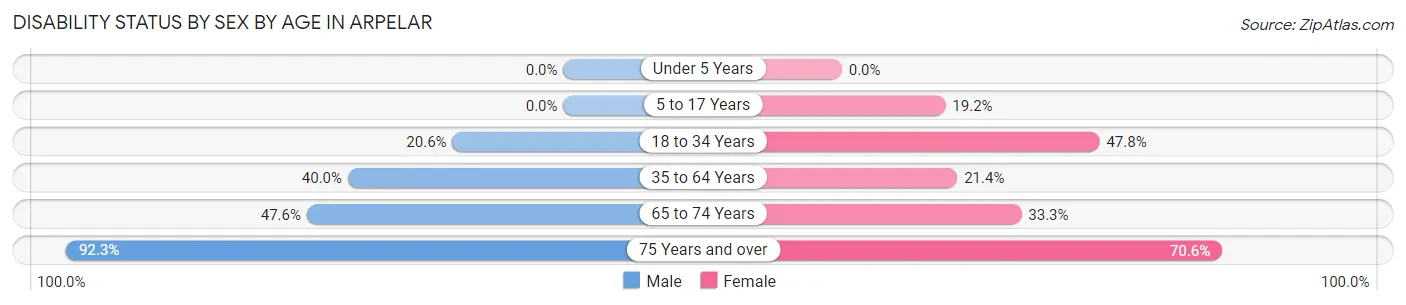
| Age Bracket | Male | Female |
| Under 5 Years | 0 (0.0%) | 0 (0.0%) |
| 5 to 17 Years | 0 (0.0%) | 5 (19.2%) |
| 18 to 34 Years | 7 (20.6%) | 11 (47.8%) |
| 35 to 64 Years | 24 (40.0%) | 15 (21.4%) |
| 65 to 74 Years | 10 (47.6%) | 7 (33.3%) |
| 75 Years and over | 12 (92.3%) | 12 (70.6%) |
Disability Class by Sex by Age in Arpelar
Disability Class: Hearing Difficulty
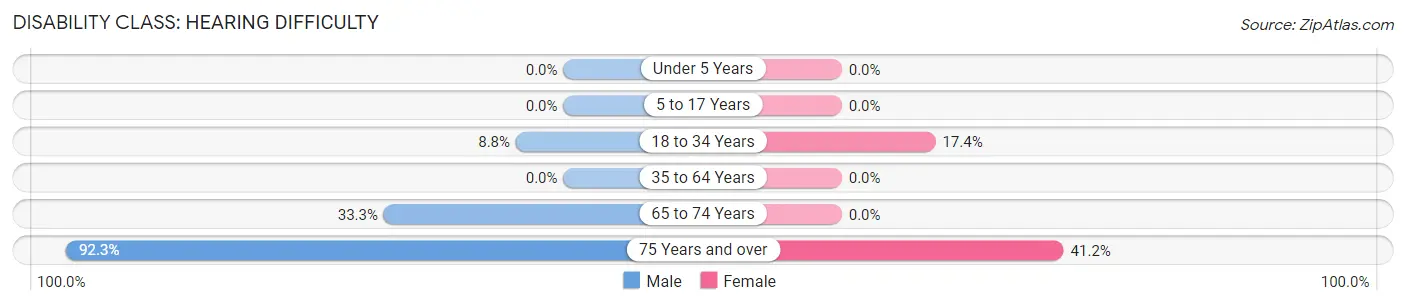
| Age Bracket | Male | Female |
| Under 5 Years | 0 (0.0%) | 0 (0.0%) |
| 5 to 17 Years | 0 (0.0%) | 0 (0.0%) |
| 18 to 34 Years | 3 (8.8%) | 4 (17.4%) |
| 35 to 64 Years | 0 (0.0%) | 0 (0.0%) |
| 65 to 74 Years | 7 (33.3%) | 0 (0.0%) |
| 75 Years and over | 12 (92.3%) | 7 (41.2%) |
Disability Class: Vision Difficulty
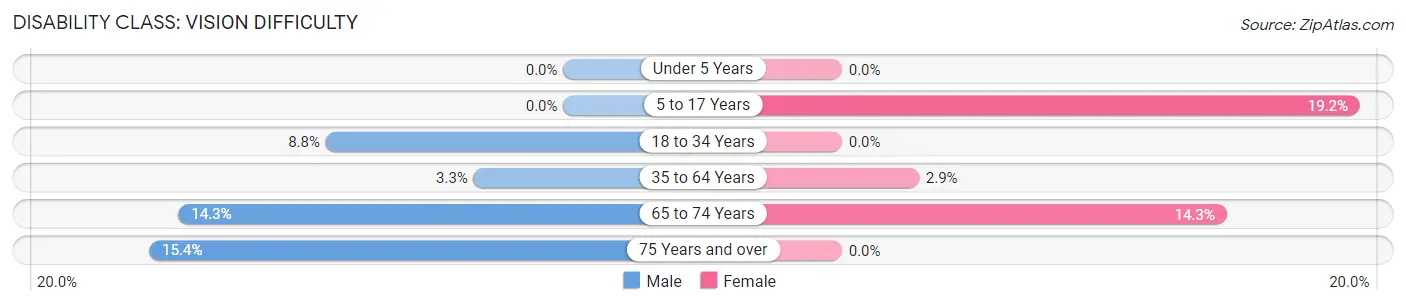
| Age Bracket | Male | Female |
| Under 5 Years | 0 (0.0%) | 0 (0.0%) |
| 5 to 17 Years | 0 (0.0%) | 5 (19.2%) |
| 18 to 34 Years | 3 (8.8%) | 0 (0.0%) |
| 35 to 64 Years | 2 (3.3%) | 2 (2.9%) |
| 65 to 74 Years | 3 (14.3%) | 3 (14.3%) |
| 75 Years and over | 2 (15.4%) | 0 (0.0%) |
Disability Class: Cognitive Difficulty
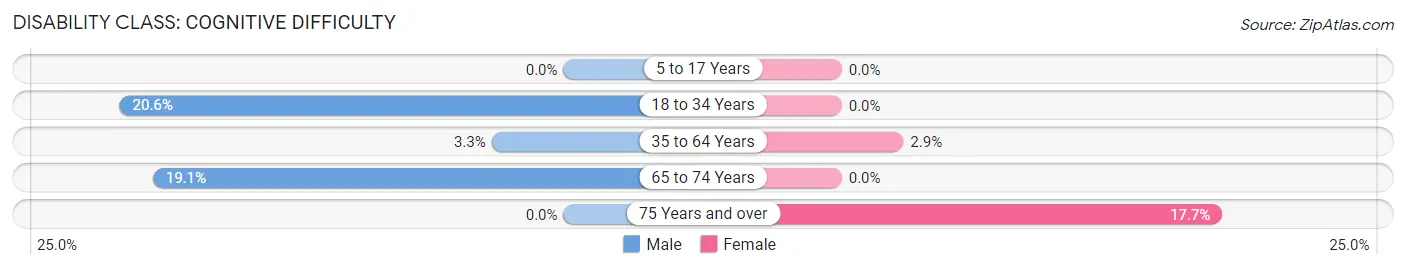
| Age Bracket | Male | Female |
| 5 to 17 Years | 0 (0.0%) | 0 (0.0%) |
| 18 to 34 Years | 7 (20.6%) | 0 (0.0%) |
| 35 to 64 Years | 2 (3.3%) | 2 (2.9%) |
| 65 to 74 Years | 4 (19.1%) | 0 (0.0%) |
| 75 Years and over | 0 (0.0%) | 3 (17.6%) |
Disability Class: Ambulatory Difficulty
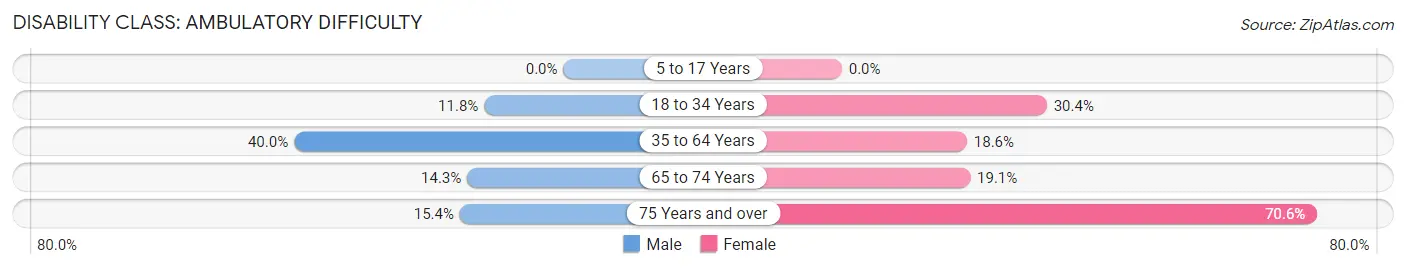
| Age Bracket | Male | Female |
| 5 to 17 Years | 0 (0.0%) | 0 (0.0%) |
| 18 to 34 Years | 4 (11.8%) | 7 (30.4%) |
| 35 to 64 Years | 24 (40.0%) | 13 (18.6%) |
| 65 to 74 Years | 3 (14.3%) | 4 (19.1%) |
| 75 Years and over | 2 (15.4%) | 12 (70.6%) |
Disability Class: Self-Care Difficulty
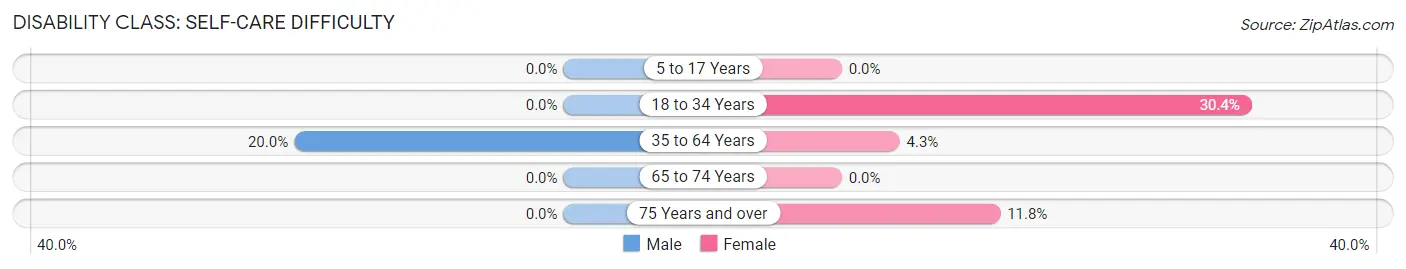
| Age Bracket | Male | Female |
| 5 to 17 Years | 0 (0.0%) | 0 (0.0%) |
| 18 to 34 Years | 0 (0.0%) | 7 (30.4%) |
| 35 to 64 Years | 12 (20.0%) | 3 (4.3%) |
| 65 to 74 Years | 0 (0.0%) | 0 (0.0%) |
| 75 Years and over | 0 (0.0%) | 2 (11.8%) |
Technology Access in Arpelar
Computing Device Access in Arpelar
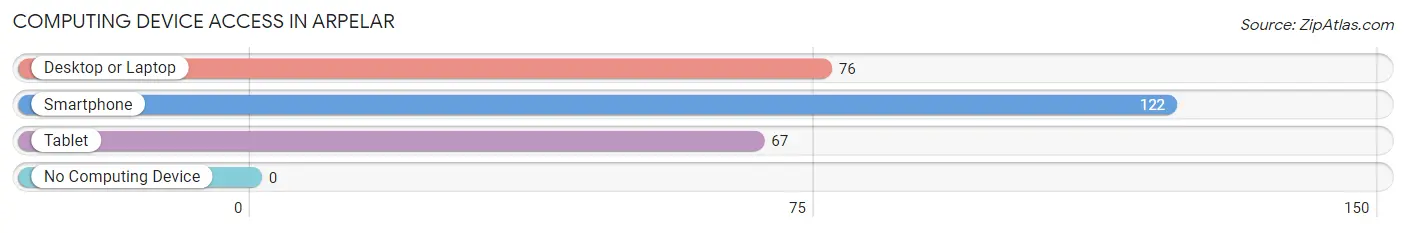
| Device Type | # Households | % Households |
| Desktop or Laptop | 76 | 58.5% |
| Smartphone | 122 | 93.9% |
| Tablet | 67 | 51.5% |
| No Computing Device | 0 | 0.0% |
| Total | 130 | 100.0% |
Internet Access in Arpelar
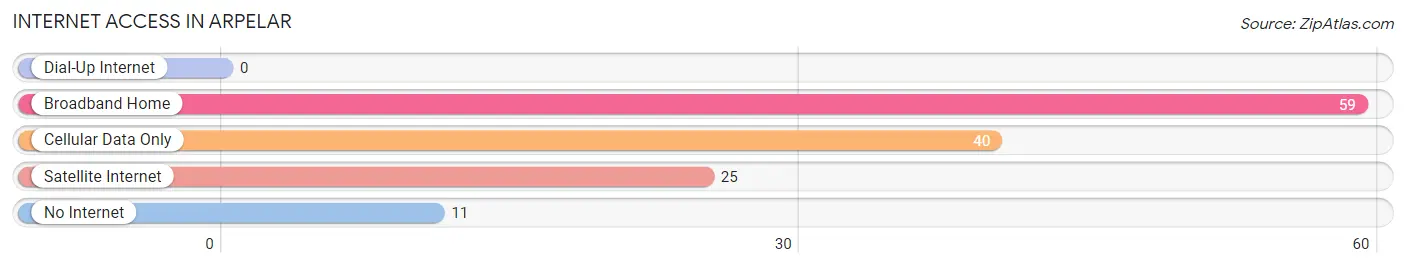
| Internet Type | # Households | % Households |
| Dial-Up Internet | 0 | 0.0% |
| Broadband Home | 59 | 45.4% |
| Cellular Data Only | 40 | 30.8% |
| Satellite Internet | 25 | 19.2% |
| No Internet | 11 | 8.5% |
| Total | 130 | 100.0% |
Arpelar Summary
History
Arpelar is a small town located in the state of Oklahoma. It was founded in 1891 by a group of settlers from Arkansas who were looking for a new home. The town was named after the first settler, John Arpelar, who was a farmer and rancher.
The town grew slowly but steadily over the years, and by the early 1900s, it had become a thriving community. The town was home to a variety of businesses, including a general store, a blacksmith, a livery stable, and a hotel.
In the 1920s, the town experienced a period of growth and prosperity. The population increased from around 500 to over 1,000, and the town was home to several new businesses, including a bank, a movie theater, and a newspaper.
The Great Depression hit Arpelar hard, and the population declined to around 500 by 1940. The town was able to recover, however, and by 1950, the population had grown to over 1,000 again.
The town continued to grow throughout the 1950s and 1960s, and by 1970, the population had reached 1,500. The town was home to several new businesses, including a grocery store, a hardware store, and a restaurant.
In the 1980s, the town experienced a period of decline. The population decreased to around 1,000, and many of the businesses closed.
In the 1990s, the town began to experience a period of revitalization. The population increased to around 1,500, and several new businesses opened, including a gas station, a pharmacy, and a convenience store.
Geography
Arpelar is located in the southeastern part of Oklahoma, in the foothills of the Ozark Mountains. The town is situated on the banks of the Arkansas River, and is surrounded by rolling hills and forests.
The climate in Arpelar is mild and humid, with hot summers and mild winters. The average temperature in the summer is around 80 degrees Fahrenheit, and the average temperature in the winter is around 40 degrees Fahrenheit.
The town is located near several major highways, including Interstate 40, US Highway 59, and US Highway 412. The nearest major cities are Tulsa, Oklahoma City, and Fort Smith, Arkansas.
Economy
The economy of Arpelar is largely based on agriculture and tourism. The town is home to several farms, which produce a variety of crops, including corn, soybeans, wheat, and hay.
The town is also home to several tourist attractions, including the Ozark National Forest, the Arkansas River, and the Ozark Mountains. The town is also home to several restaurants, hotels, and other businesses that cater to tourists.
Demographics
As of the 2010 census, the population of Arpelar was 1,541. The racial makeup of the town was 94.3% White, 0.7% African American, 0.3% Native American, 0.2% Asian, 0.1% Pacific Islander, and 4.4% from other races.
The median household income in Arpelar was $35,938, and the median family income was $41,250. The per capita income was $17,845. About 11.3% of the population was below the poverty line.
Common Questions
What is Per Capita Income in Arpelar?
Per Capita income in Arpelar is $40,176.
What is the Median Family Income in Arpelar?
Median Family Income in Arpelar is $57,250.
What is the Median Household income in Arpelar?
Median Household Income in Arpelar is $54,500.
What is Income or Wage Gap in Arpelar?
Income or Wage Gap in Arpelar is 20.8%.
Women in Arpelar earn 79.2 cents for every dollar earned by a man.
What is Inequality or Gini Index in Arpelar?
Inequality or Gini Index in Arpelar is 0.56.
What is the Total Population of Arpelar?
Total Population of Arpelar is 315.
What is the Total Male Population of Arpelar?
Total Male Population of Arpelar is 146.
What is the Total Female Population of Arpelar?
Total Female Population of Arpelar is 169.
What is the Ratio of Males per 100 Females in Arpelar?
There are 86.39 Males per 100 Females in Arpelar.
What is the Ratio of Females per 100 Males in Arpelar?
There are 115.75 Females per 100 Males in Arpelar.
What is the Median Population Age in Arpelar?
Median Population Age in Arpelar is 45.8 Years.
What is the Average Family Size in Arpelar
Average Family Size in Arpelar is 2.6 People.
What is the Average Household Size in Arpelar
Average Household Size in Arpelar is 2.4 People.
How Large is the Labor Force in Arpelar?
There are 149 People in the Labor Forcein in Arpelar.
What is the Percentage of People in the Labor Force in Arpelar?
56.7% of People are in the Labor Force in Arpelar.