Perry, OK Map & Demographics
Perry Map
Perry Overview
$29,817
PER CAPITA INCOME
$74,821
AVG FAMILY INCOME
$61,410
AVG HOUSEHOLD INCOME
29.5%
WAGE / INCOME GAP [ % ]
70.5¢/ $1
WAGE / INCOME GAP [ $ ]
$16,899
FAMILY INCOME DEFICIT
0.41
INEQUALITY / GINI INDEX
4,526
TOTAL POPULATION
2,325
MALE POPULATION
2,201
FEMALE POPULATION
105.63
MALES / 100 FEMALES
94.67
FEMALES / 100 MALES
34.4
MEDIAN AGE
3.5
AVG FAMILY SIZE
2.8
AVG HOUSEHOLD SIZE
2,050
LABOR FORCE [ PEOPLE ]
60.5%
PERCENT IN LABOR FORCE
2.7%
UNEMPLOYMENT RATE
Perry Zip Codes
Perry Area Codes
Income in Perry
Income Overview in Perry
Per Capita Income in Perry is $29,817, while median incomes of families and households are $74,821 and $61,410 respectively.
| Characteristic | Number | Measure |
| Per Capita Income | 4,526 | $29,817 |
| Median Family Income | 1,047 | $74,821 |
| Mean Family Income | 1,047 | $91,676 |
| Median Household Income | 1,593 | $61,410 |
| Mean Household Income | 1,593 | $76,867 |
| Income Deficit | 1,047 | $16,899 |
| Wage / Income Gap (%) | 4,526 | 29.52% |
| Wage / Income Gap ($) | 4,526 | 70.48¢ per $1 |
| Gini / Inequality Index | 4,526 | 0.41 |
Earnings by Sex in Perry
Average Earnings in Perry are $41,903, $49,657 for men and $35,000 for women, a difference of 29.5%.
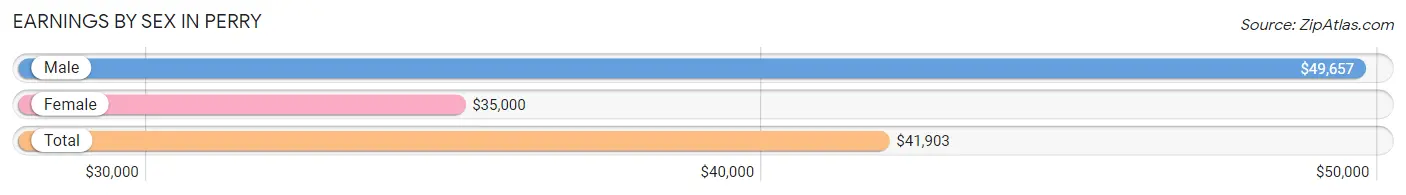
| Sex | Number | Average Earnings |
| Male | 1,156 (55.1%) | $49,657 |
| Female | 940 (44.9%) | $35,000 |
| Total | 2,096 (100.0%) | $41,903 |
Earnings by Sex by Income Bracket in Perry
The most common earnings brackets in Perry are $100,000+ for men (172 | 14.9%) and $45,000 to $49,999 for women (138 | 14.7%).
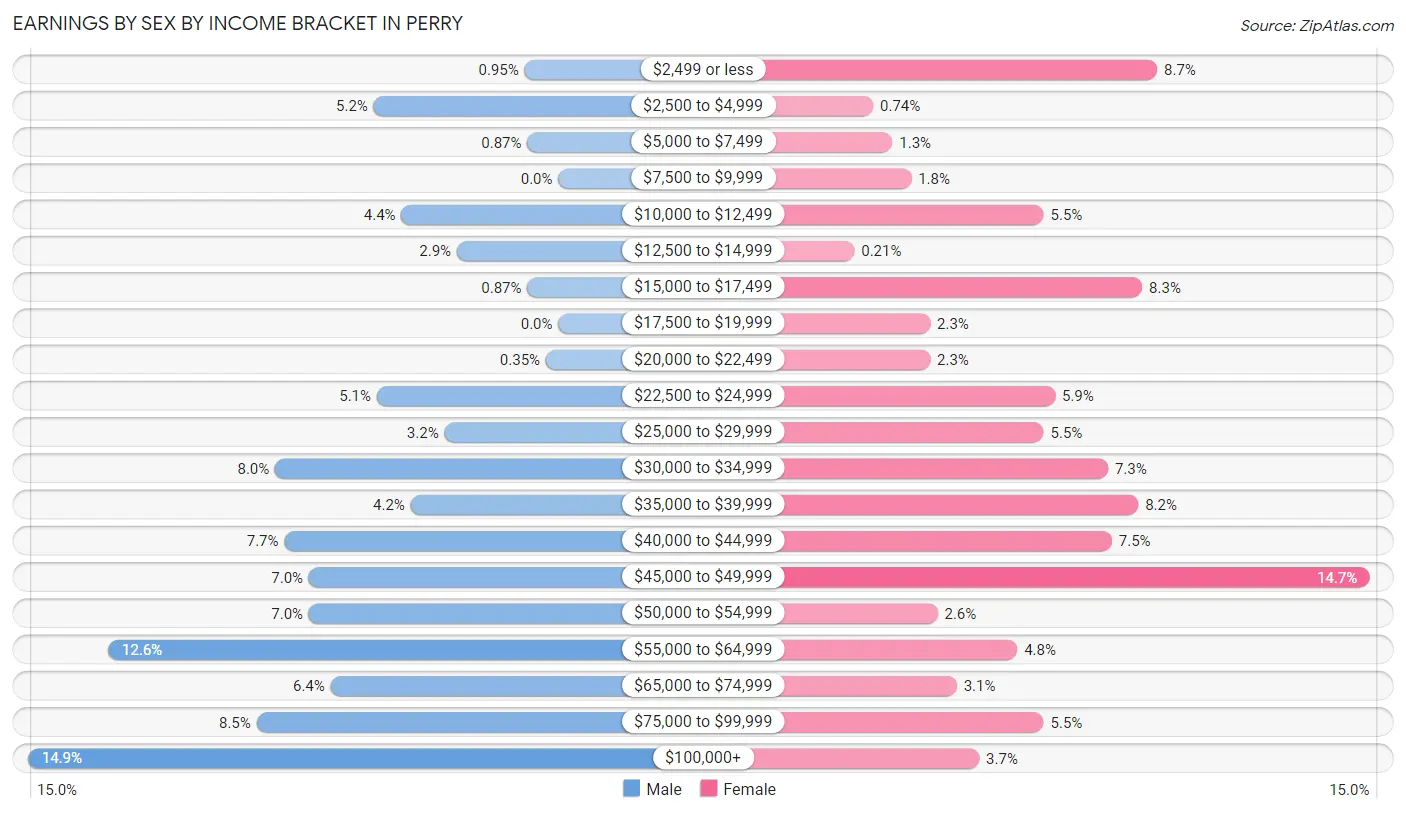
| Income | Male | Female |
| $2,499 or less | 11 (0.9%) | 82 (8.7%) |
| $2,500 to $4,999 | 60 (5.2%) | 7 (0.7%) |
| $5,000 to $7,499 | 10 (0.9%) | 12 (1.3%) |
| $7,500 to $9,999 | 0 (0.0%) | 17 (1.8%) |
| $10,000 to $12,499 | 51 (4.4%) | 52 (5.5%) |
| $12,500 to $14,999 | 33 (2.9%) | 2 (0.2%) |
| $15,000 to $17,499 | 10 (0.9%) | 78 (8.3%) |
| $17,500 to $19,999 | 0 (0.0%) | 22 (2.3%) |
| $20,000 to $22,499 | 4 (0.4%) | 22 (2.3%) |
| $22,500 to $24,999 | 59 (5.1%) | 55 (5.9%) |
| $25,000 to $29,999 | 37 (3.2%) | 52 (5.5%) |
| $30,000 to $34,999 | 92 (8.0%) | 69 (7.3%) |
| $35,000 to $39,999 | 48 (4.2%) | 77 (8.2%) |
| $40,000 to $44,999 | 89 (7.7%) | 70 (7.4%) |
| $45,000 to $49,999 | 81 (7.0%) | 138 (14.7%) |
| $50,000 to $54,999 | 81 (7.0%) | 24 (2.5%) |
| $55,000 to $64,999 | 146 (12.6%) | 45 (4.8%) |
| $65,000 to $74,999 | 74 (6.4%) | 29 (3.1%) |
| $75,000 to $99,999 | 98 (8.5%) | 52 (5.5%) |
| $100,000+ | 172 (14.9%) | 35 (3.7%) |
| Total | 1,156 (100.0%) | 940 (100.0%) |
Earnings by Sex by Educational Attainment in Perry
Average earnings in Perry are $56,000 for men and $40,445 for women, a difference of 27.8%. Men with an educational attainment of bachelor's degree enjoy the highest average annual earnings of $110,893, while those with less than high school education earn the least with $33,321. Women with an educational attainment of bachelor's degree earn the most with the average annual earnings of $48,598, while those with high school diploma education have the smallest earnings of $23,144.
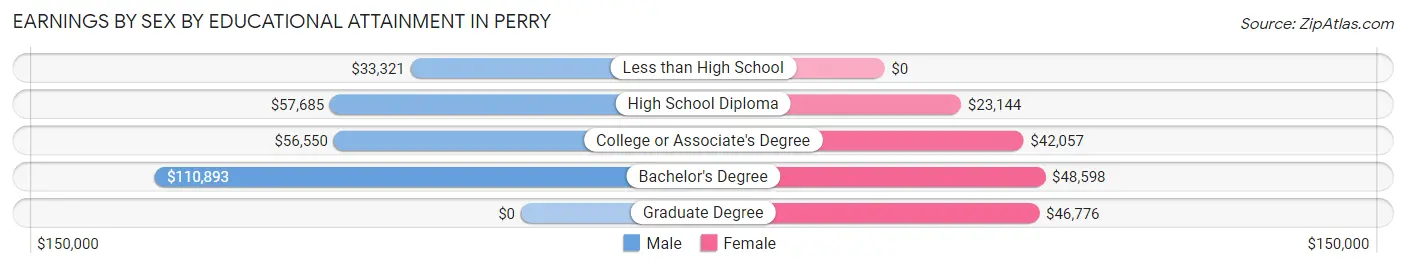
| Educational Attainment | Male Income | Female Income |
| Less than High School | $33,321 | $0 |
| High School Diploma | $57,685 | $23,144 |
| College or Associate's Degree | $56,550 | $42,057 |
| Bachelor's Degree | $110,893 | $48,598 |
| Graduate Degree | - | - |
| Total | $56,000 | $40,445 |
Family Income in Perry
Family Income Brackets in Perry
According to the Perry family income data, there are 238 families falling into the $100,000 to $149,999 income range, which is the most common income bracket and makes up 22.7% of all families. Conversely, the $15,000 to $24,999 income bracket is the least frequent group with only 8 families (0.8%) belonging to this category.
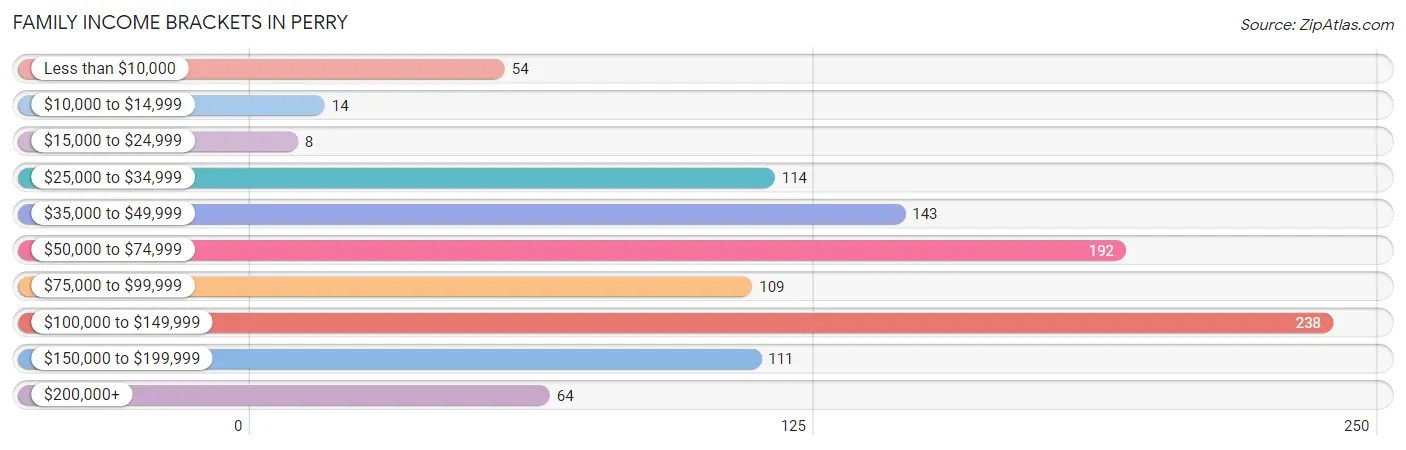
| Income Bracket | # Families | % Families |
| Less than $10,000 | 54 | 5.2% |
| $10,000 to $14,999 | 14 | 1.3% |
| $15,000 to $24,999 | 8 | 0.8% |
| $25,000 to $34,999 | 114 | 10.9% |
| $35,000 to $49,999 | 143 | 13.7% |
| $50,000 to $74,999 | 192 | 18.3% |
| $75,000 to $99,999 | 109 | 10.4% |
| $100,000 to $149,999 | 238 | 22.7% |
| $150,000 to $199,999 | 111 | 10.6% |
| $200,000+ | 64 | 6.1% |
Family Income by Famaliy Size in Perry
4-person families (220 | 21.0%) account for the highest median family income in Perry with $112,000 per family, while 2-person families (411 | 39.3%) have the highest median income of $29,271 per family member.
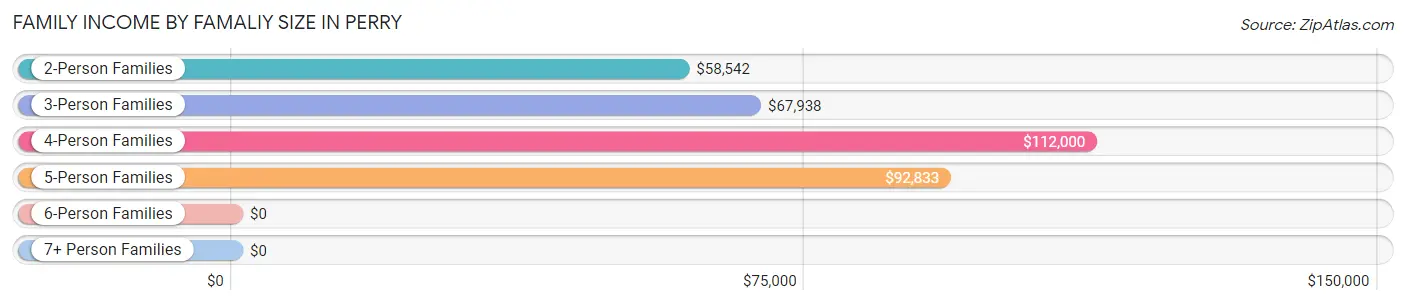
| Income Bracket | # Families | Median Income |
| 2-Person Families | 411 (39.3%) | $58,542 |
| 3-Person Families | 269 (25.7%) | $67,938 |
| 4-Person Families | 220 (21.0%) | $112,000 |
| 5-Person Families | 112 (10.7%) | $92,833 |
| 6-Person Families | 20 (1.9%) | $0 |
| 7+ Person Families | 15 (1.4%) | $0 |
| Total | 1,047 (100.0%) | $74,821 |
Family Income by Number of Earners in Perry
The median family income in Perry is $74,821, with families comprising 3+ earners (113) having the highest median family income of $157,361, while families with no earners (110) have the lowest median family income of $31,538, accounting for 10.8% and 10.5% of families, respectively.
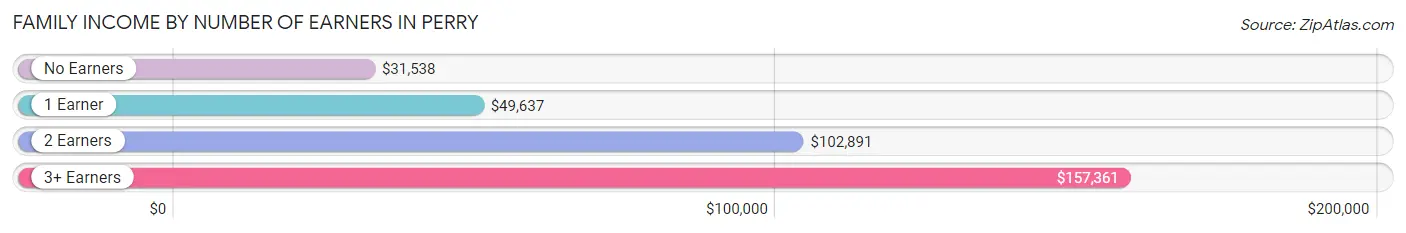
| Number of Earners | # Families | Median Income |
| No Earners | 110 (10.5%) | $31,538 |
| 1 Earner | 439 (41.9%) | $49,637 |
| 2 Earners | 385 (36.8%) | $102,891 |
| 3+ Earners | 113 (10.8%) | $157,361 |
| Total | 1,047 (100.0%) | $74,821 |
Household Income in Perry
Household Income Brackets in Perry
With 335 households falling in the category, the $50,000 to $74,999 income range is the most frequent in Perry, accounting for 21.0% of all households. In contrast, only 61 households (3.8%) fall into the less than $10,000 income bracket, making it the least populous group.
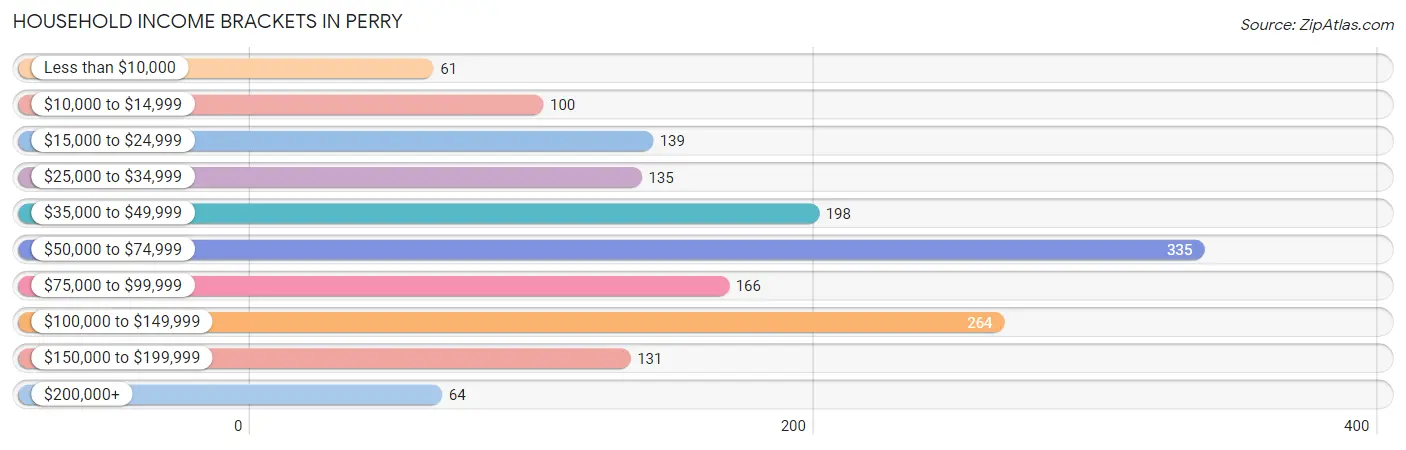
| Income Bracket | # Households | % Households |
| Less than $10,000 | 61 | 3.8% |
| $10,000 to $14,999 | 100 | 6.3% |
| $15,000 to $24,999 | 139 | 8.7% |
| $25,000 to $34,999 | 135 | 8.5% |
| $35,000 to $49,999 | 198 | 12.4% |
| $50,000 to $74,999 | 335 | 21.0% |
| $75,000 to $99,999 | 166 | 10.4% |
| $100,000 to $149,999 | 264 | 16.6% |
| $150,000 to $199,999 | 131 | 8.2% |
| $200,000+ | 64 | 4.0% |
Household Income by Householder Age in Perry
The median household income in Perry is $61,410, with the highest median household income of $83,523 found in the 25 to 44 years age bracket for the primary householder. A total of 546 households (34.3%) fall into this category. Meanwhile, the 65+ years age bracket for the primary householder has the lowest median household income of $40,893, with 431 households (27.1%) in this group.
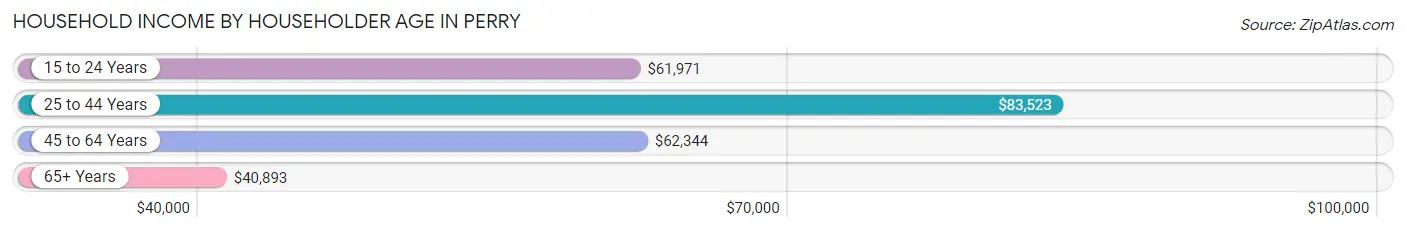
| Income Bracket | # Households | Median Income |
| 15 to 24 Years | 61 (3.8%) | $61,971 |
| 25 to 44 Years | 546 (34.3%) | $83,523 |
| 45 to 64 Years | 555 (34.8%) | $62,344 |
| 65+ Years | 431 (27.1%) | $40,893 |
| Total | 1,593 (100.0%) | $61,410 |
Poverty in Perry
Income Below Poverty by Sex and Age in Perry
With 6.9% poverty level for males and 14.5% for females among the residents of Perry, 6 to 11 year old males and 5 year old females are the most vulnerable to poverty, with 60 males (26.9%) and 39 females (100.0%) in their respective age groups living below the poverty level.
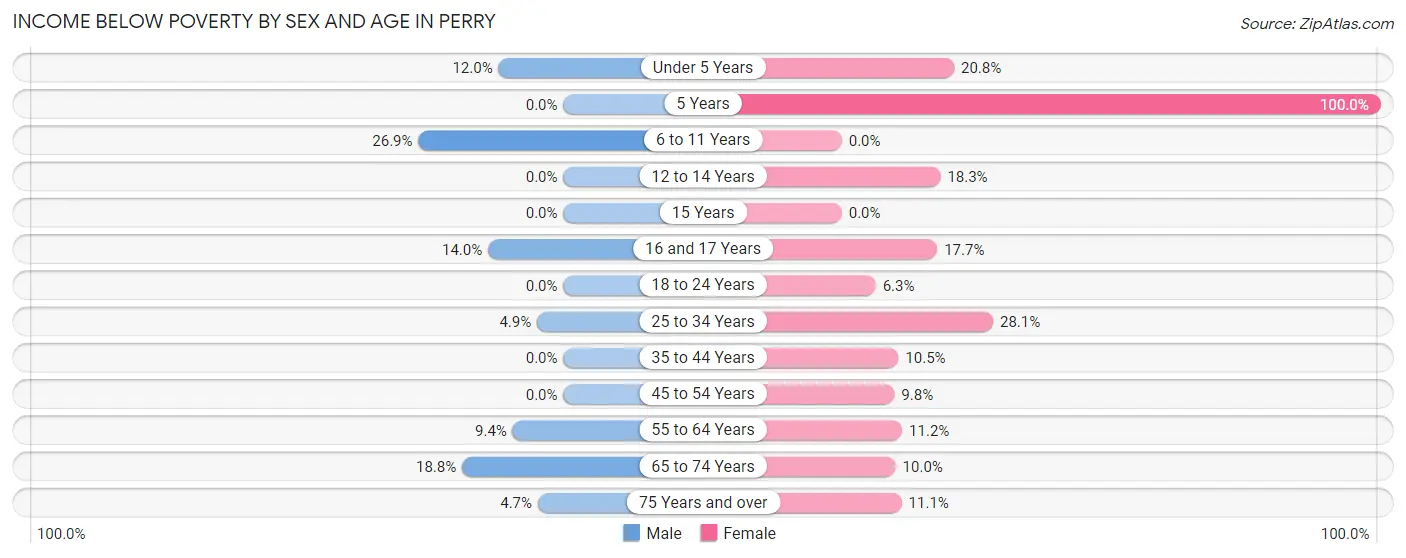
| Age Bracket | Male | Female |
| Under 5 Years | 13 (12.0%) | 30 (20.8%) |
| 5 Years | 0 (0.0%) | 39 (100.0%) |
| 6 to 11 Years | 60 (26.9%) | 0 (0.0%) |
| 12 to 14 Years | 0 (0.0%) | 13 (18.3%) |
| 15 Years | 0 (0.0%) | 0 (0.0%) |
| 16 and 17 Years | 13 (14.0%) | 17 (17.7%) |
| 18 to 24 Years | 0 (0.0%) | 11 (6.3%) |
| 25 to 34 Years | 11 (4.9%) | 89 (28.1%) |
| 35 to 44 Years | 0 (0.0%) | 29 (10.5%) |
| 45 to 54 Years | 0 (0.0%) | 17 (9.8%) |
| 55 to 64 Years | 27 (9.4%) | 27 (11.2%) |
| 65 to 74 Years | 25 (18.8%) | 18 (10.0%) |
| 75 Years and over | 7 (4.7%) | 15 (11.1%) |
| Total | 156 (6.9%) | 305 (14.5%) |
Income Above Poverty by Sex and Age in Perry
According to the poverty statistics in Perry, males aged 5 years and females aged 6 to 11 years are the age groups that are most secure financially, with 100.0% of males and 100.0% of females in these age groups living above the poverty line.
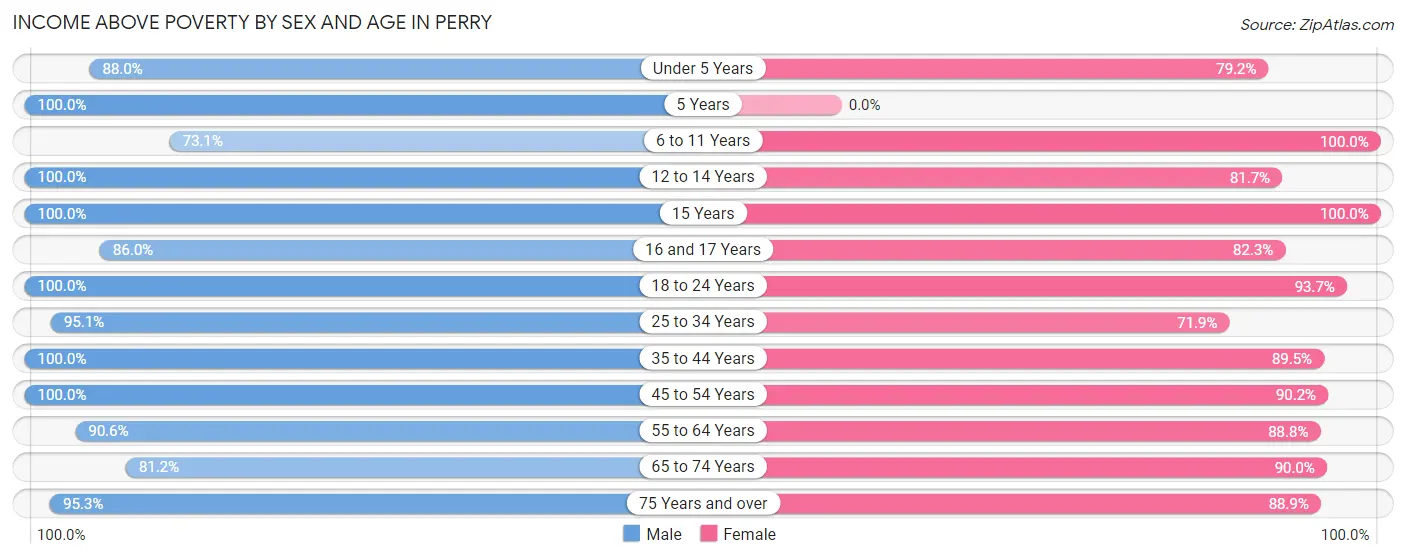
| Age Bracket | Male | Female |
| Under 5 Years | 95 (88.0%) | 114 (79.2%) |
| 5 Years | 23 (100.0%) | 0 (0.0%) |
| 6 to 11 Years | 163 (73.1%) | 207 (100.0%) |
| 12 to 14 Years | 186 (100.0%) | 58 (81.7%) |
| 15 Years | 21 (100.0%) | 43 (100.0%) |
| 16 and 17 Years | 80 (86.0%) | 79 (82.3%) |
| 18 to 24 Years | 245 (100.0%) | 164 (93.7%) |
| 25 to 34 Years | 214 (95.1%) | 228 (71.9%) |
| 35 to 44 Years | 259 (100.0%) | 247 (89.5%) |
| 45 to 54 Years | 314 (100.0%) | 157 (90.2%) |
| 55 to 64 Years | 260 (90.6%) | 214 (88.8%) |
| 65 to 74 Years | 108 (81.2%) | 162 (90.0%) |
| 75 Years and over | 141 (95.3%) | 120 (88.9%) |
| Total | 2,109 (93.1%) | 1,793 (85.5%) |
Income Below Poverty Among Married-Couple Families in Perry
The poverty statistics for married-couple families in Perry show that 4.8% or 33 of the total 694 families live below the poverty line. Families with no children have the highest poverty rate of 6.9%, comprising of 22 families. On the other hand, families with 3 or 4 children have the lowest poverty rate of 0.0%, which includes 0 families.
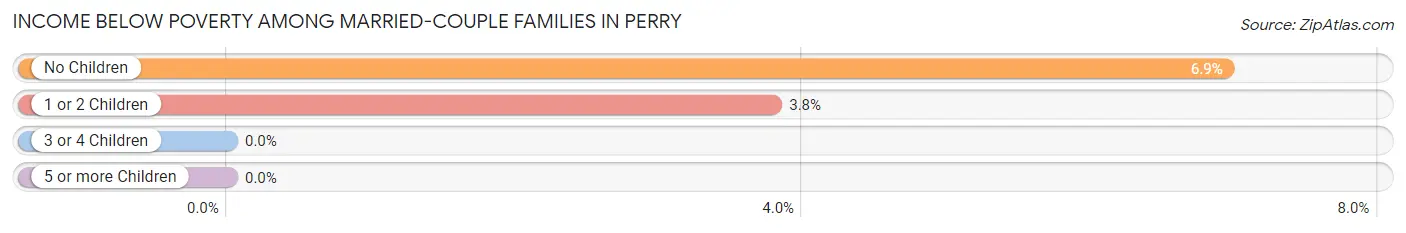
| Children | Above Poverty | Below Poverty |
| No Children | 295 (93.1%) | 22 (6.9%) |
| 1 or 2 Children | 279 (96.2%) | 11 (3.8%) |
| 3 or 4 Children | 72 (100.0%) | 0 (0.0%) |
| 5 or more Children | 15 (100.0%) | 0 (0.0%) |
| Total | 661 (95.2%) | 33 (4.8%) |
Income Below Poverty Among Single-Parent Households in Perry
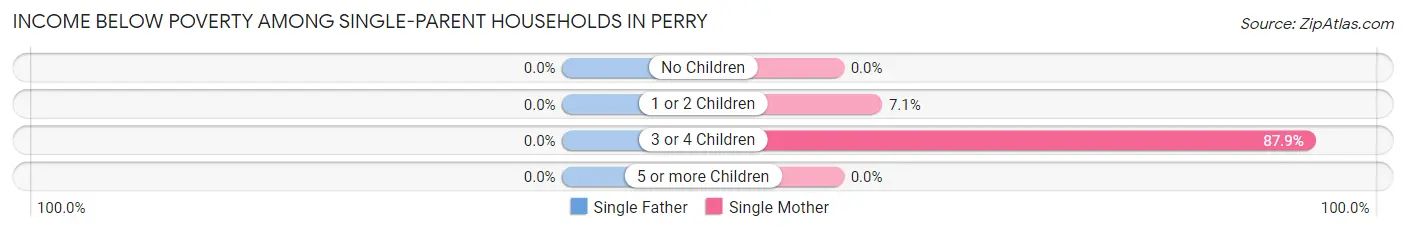
| Children | Single Father | Single Mother |
| No Children | 0 (0.0%) | 0 (0.0%) |
| 1 or 2 Children | 0 (0.0%) | 6 (7.1%) |
| 3 or 4 Children | 0 (0.0%) | 29 (87.9%) |
| 5 or more Children | 0 (0.0%) | 0 (0.0%) |
| Total | 0 (0.0%) | 35 (16.5%) |
Income Below Poverty Among Married-Couple vs Single-Parent Households in Perry
The poverty data for Perry shows that 33 of the married-couple family households (4.8%) and 35 of the single-parent households (9.9%) are living below the poverty level. Within the married-couple family households, those with no children have the highest poverty rate, with 22 households (6.9%) falling below the poverty line. Among the single-parent households, those with 3 or 4 children have the highest poverty rate, with 29 household (87.9%) living below poverty.
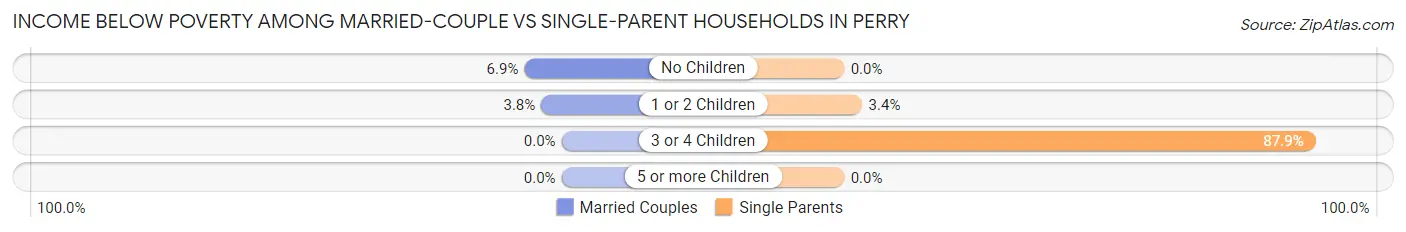
| Children | Married-Couple Families | Single-Parent Households |
| No Children | 22 (6.9%) | 0 (0.0%) |
| 1 or 2 Children | 11 (3.8%) | 6 (3.4%) |
| 3 or 4 Children | 0 (0.0%) | 29 (87.9%) |
| 5 or more Children | 0 (0.0%) | 0 (0.0%) |
| Total | 33 (4.8%) | 35 (9.9%) |
Race in Perry
The most populous races in Perry are White / Caucasian (4,017 | 88.7%), Two or more Races (285 | 6.3%), and Hispanic or Latino (163 | 3.6%).

| Race | # Population | % Population |
| Asian | 0 | 0.0% |
| Black / African American | 114 | 2.5% |
| Hawaiian / Pacific | 0 | 0.0% |
| Hispanic or Latino | 163 | 3.6% |
| Native / Alaskan | 59 | 1.3% |
| White / Caucasian | 4,017 | 88.7% |
| Two or more Races | 285 | 6.3% |
| Some other Race | 51 | 1.1% |
| Total | 4,526 | 100.0% |
Ancestry in Perry
The most populous ancestries reported in Perry are German (782 | 17.3%), English (480 | 10.6%), Irish (385 | 8.5%), American (354 | 7.8%), and Italian (172 | 3.8%), together accounting for 48.0% of all Perry residents.
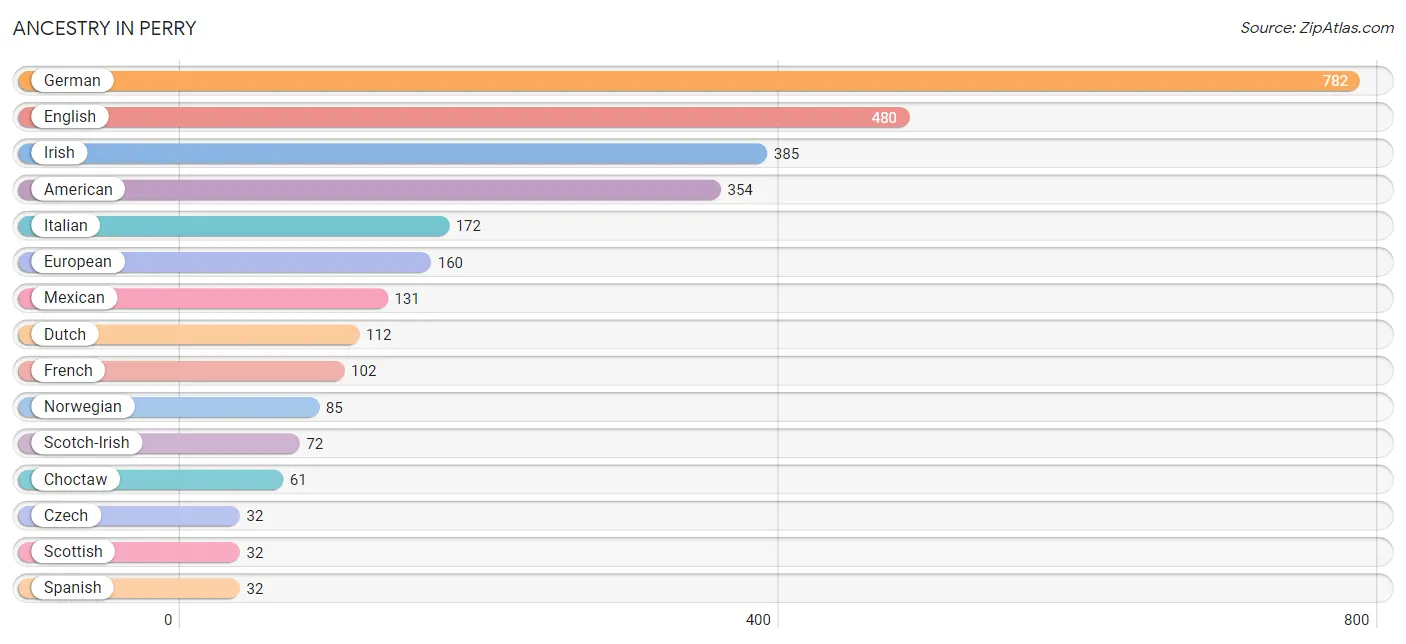
| Ancestry | # Population | % Population |
| American | 354 | 7.8% |
| Austrian | 12 | 0.3% |
| British | 7 | 0.2% |
| Cherokee | 6 | 0.1% |
| Choctaw | 61 | 1.3% |
| Creek | 10 | 0.2% |
| Czech | 32 | 0.7% |
| Czechoslovakian | 3 | 0.1% |
| Dutch | 112 | 2.5% |
| English | 480 | 10.6% |
| European | 160 | 3.5% |
| French | 102 | 2.2% |
| German | 782 | 17.3% |
| Inupiat | 7 | 0.2% |
| Irish | 385 | 8.5% |
| Italian | 172 | 3.8% |
| Mexican | 131 | 2.9% |
| Northern European | 5 | 0.1% |
| Norwegian | 85 | 1.9% |
| Osage | 12 | 0.3% |
| Polish | 25 | 0.5% |
| Scandinavian | 7 | 0.2% |
| Scotch-Irish | 72 | 1.6% |
| Scottish | 32 | 0.7% |
| Seminole | 7 | 0.2% |
| Spanish | 32 | 0.7% |
| Swiss | 21 | 0.5% |
| Ute | 32 | 0.7% | View All 28 Rows |
Immigrants in Perry
The most numerous immigrant groups reported in Perry came from Europe (5 | 0.1%), Germany (5 | 0.1%), and Western Europe (5 | 0.1%), together accounting for 0.3% of all Perry residents.
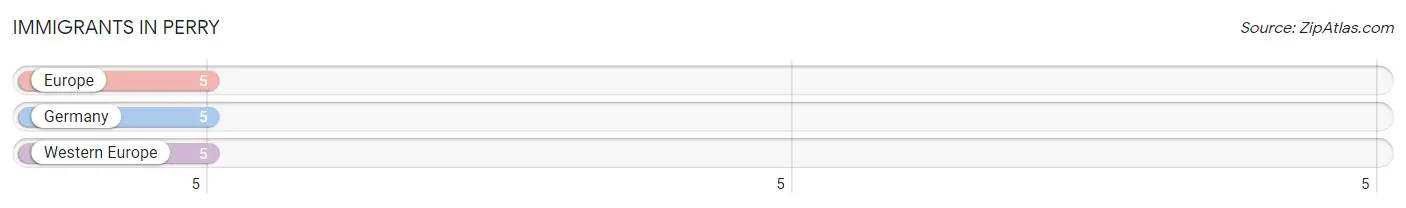
| Immigration Origin | # Population | % Population |
| Europe | 5 | 0.1% |
| Germany | 5 | 0.1% |
| Western Europe | 5 | 0.1% | View All 3 Rows |
Sex and Age in Perry
Sex and Age in Perry
The most populous age groups in Perry are 10 to 14 Years (219 | 9.4%) for men and 10 to 14 Years (180 | 8.2%) for women.
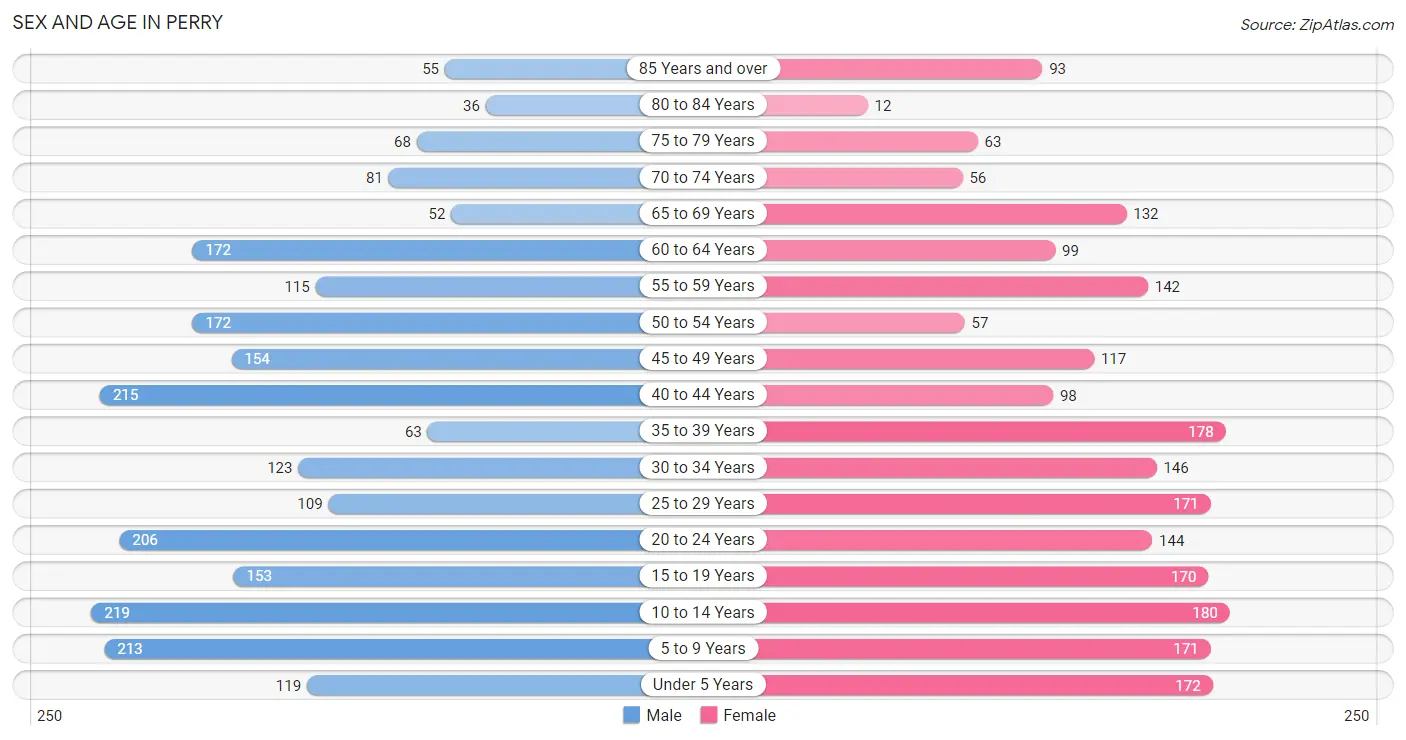
| Age Bracket | Male | Female |
| Under 5 Years | 119 (5.1%) | 172 (7.8%) |
| 5 to 9 Years | 213 (9.2%) | 171 (7.8%) |
| 10 to 14 Years | 219 (9.4%) | 180 (8.2%) |
| 15 to 19 Years | 153 (6.6%) | 170 (7.7%) |
| 20 to 24 Years | 206 (8.9%) | 144 (6.5%) |
| 25 to 29 Years | 109 (4.7%) | 171 (7.8%) |
| 30 to 34 Years | 123 (5.3%) | 146 (6.6%) |
| 35 to 39 Years | 63 (2.7%) | 178 (8.1%) |
| 40 to 44 Years | 215 (9.2%) | 98 (4.4%) |
| 45 to 49 Years | 154 (6.6%) | 117 (5.3%) |
| 50 to 54 Years | 172 (7.4%) | 57 (2.6%) |
| 55 to 59 Years | 115 (5.0%) | 142 (6.5%) |
| 60 to 64 Years | 172 (7.4%) | 99 (4.5%) |
| 65 to 69 Years | 52 (2.2%) | 132 (6.0%) |
| 70 to 74 Years | 81 (3.5%) | 56 (2.5%) |
| 75 to 79 Years | 68 (2.9%) | 63 (2.9%) |
| 80 to 84 Years | 36 (1.5%) | 12 (0.5%) |
| 85 Years and over | 55 (2.4%) | 93 (4.2%) |
| Total | 2,325 (100.0%) | 2,201 (100.0%) |
Families and Households in Perry
Median Family Size in Perry
The median family size in Perry is 3.49 persons per family, with married-couple families (694 | 66.3%) accounting for the largest median family size of 3.57 persons per family. On the other hand, single female/mother families (212 | 20.3%) represent the smallest median family size with 3.24 persons per family.
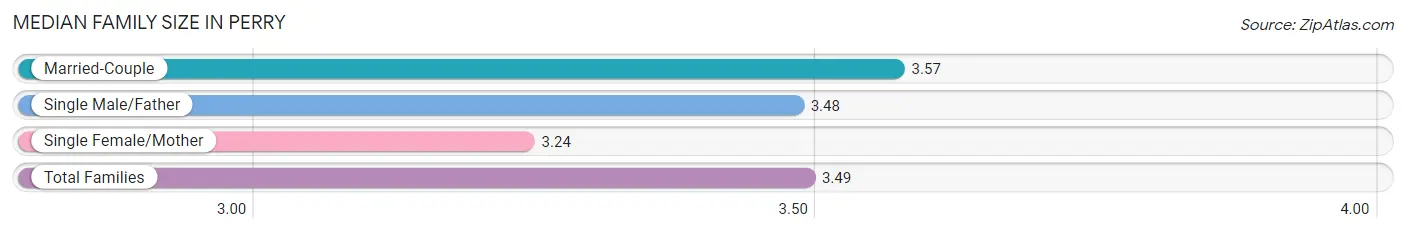
| Family Type | # Families | Family Size |
| Married-Couple | 694 (66.3%) | 3.57 |
| Single Male/Father | 141 (13.5%) | 3.48 |
| Single Female/Mother | 212 (20.3%) | 3.24 |
| Total Families | 1,047 (100.0%) | 3.49 |
Median Household Size in Perry
The median household size in Perry is 2.78 persons per household, with single male/father households (141 | 8.8%) accounting for the largest median household size of 3.99 persons per household. non-family households (546 | 34.3%) represent the smallest median household size with 1.21 persons per household.
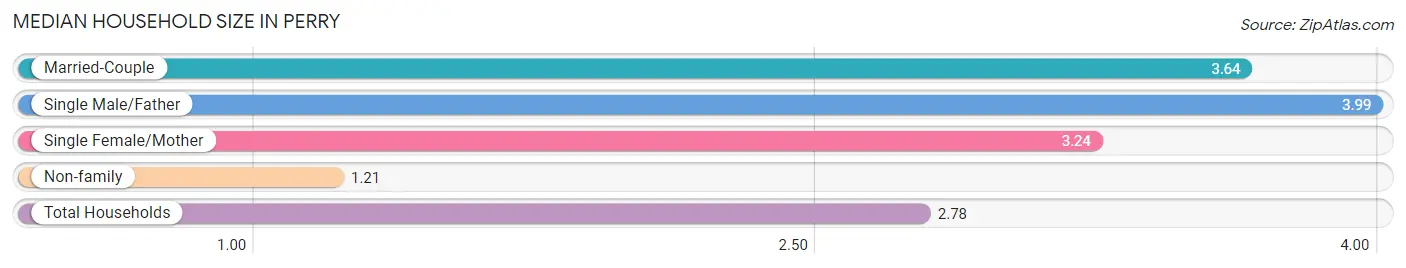
| Household Type | # Households | Household Size |
| Married-Couple | 694 (43.6%) | 3.64 |
| Single Male/Father | 141 (8.8%) | 3.99 |
| Single Female/Mother | 212 (13.3%) | 3.24 |
| Non-family | 546 (34.3%) | 1.21 |
| Total Households | 1,593 (100.0%) | 2.78 |
Household Size by Marriage Status in Perry
Out of a total of 1,593 households in Perry, 1,047 (65.7%) are family households, while 546 (34.3%) are nonfamily households. The most numerous type of family households are 2-person households, comprising 377, and the most common type of nonfamily households are 1-person households, comprising 462.
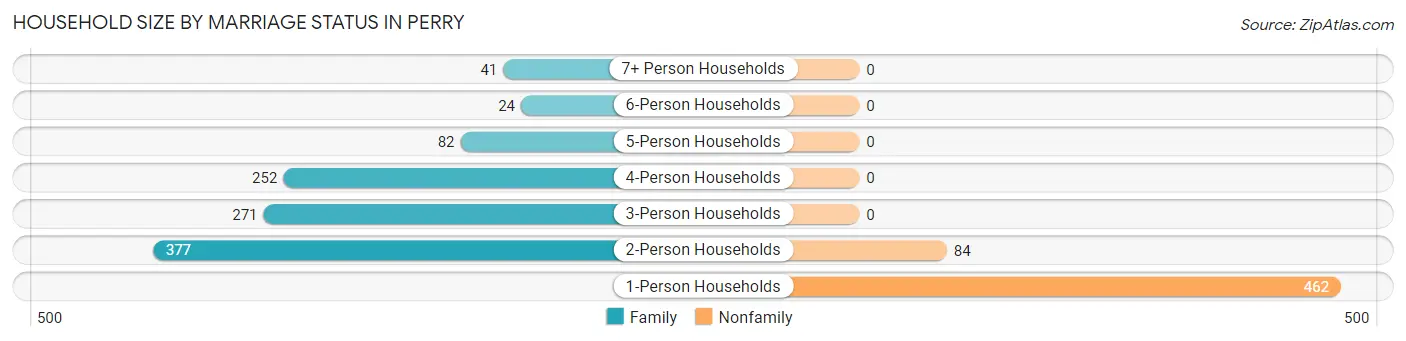
| Household Size | Family Households | Nonfamily Households |
| 1-Person Households | - | 462 (29.0%) |
| 2-Person Households | 377 (23.7%) | 84 (5.3%) |
| 3-Person Households | 271 (17.0%) | 0 (0.0%) |
| 4-Person Households | 252 (15.8%) | 0 (0.0%) |
| 5-Person Households | 82 (5.1%) | 0 (0.0%) |
| 6-Person Households | 24 (1.5%) | 0 (0.0%) |
| 7+ Person Households | 41 (2.6%) | 0 (0.0%) |
| Total | 1,047 (65.7%) | 546 (34.3%) |
Female Fertility in Perry
Fertility by Age in Perry
Average fertility rate in Perry is 45.0 births per 1,000 women. Women in the age bracket of 20 to 34 years have the highest fertility rate with 100.0 births per 1,000 women. Women in the age bracket of 20 to 34 years acount for 100.0% of all women with births.
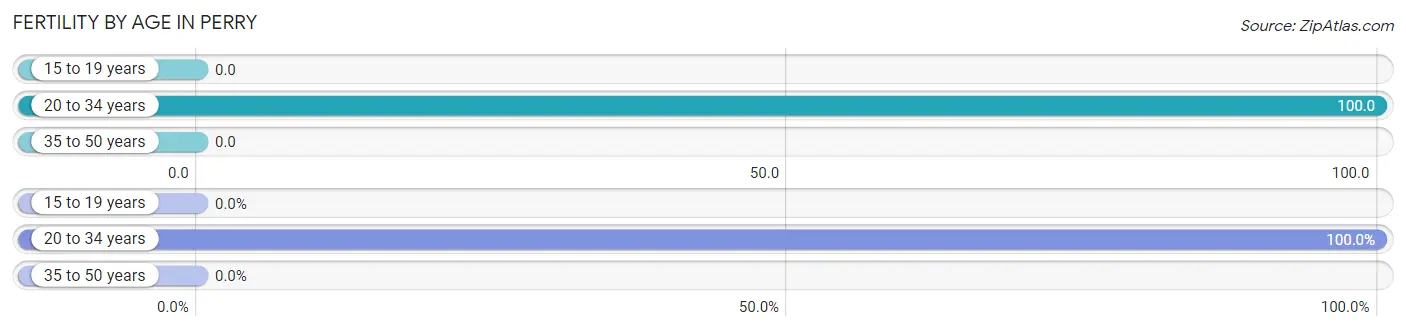
| Age Bracket | Women with Births | Births / 1,000 Women |
| 15 to 19 years | 0 (0.0%) | 0.0 |
| 20 to 34 years | 46 (100.0%) | 100.0 |
| 35 to 50 years | 0 (0.0%) | 0.0 |
| Total | 46 (100.0%) | 45.0 |
Fertility by Age by Marriage Status in Perry
50.0% of women with births (46) in Perry are married. The highest percentage of unmarried women with births falls into 20 to 34 years age bracket with 50.0% of them unmarried at the time of birth, while the lowest percentage of unmarried women with births belong to 20 to 34 years age bracket with 50.0% of them unmarried.
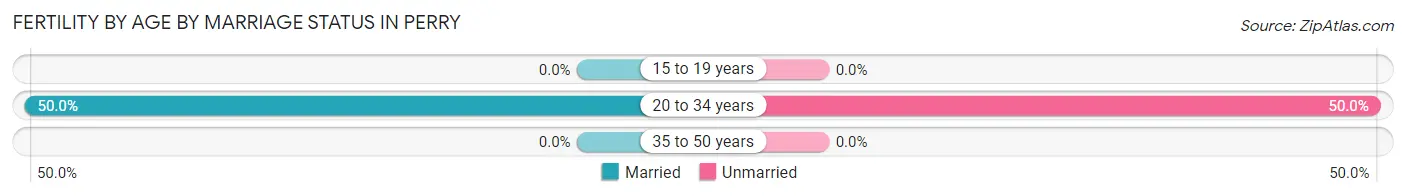
| Age Bracket | Married | Unmarried |
| 15 to 19 years | 0 (0.0%) | 0 (0.0%) |
| 20 to 34 years | 23 (50.0%) | 23 (50.0%) |
| 35 to 50 years | 0 (0.0%) | 0 (0.0%) |
| Total | 23 (50.0%) | 23 (50.0%) |
Fertility by Education in Perry
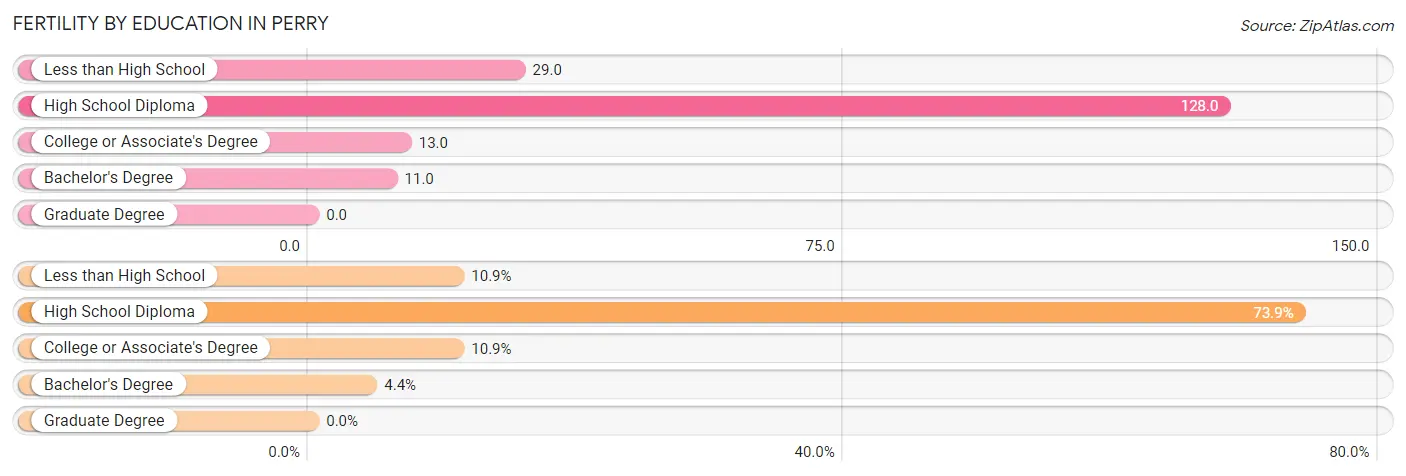
| Educational Attainment | Women with Births | Births / 1,000 Women |
| Less than High School | 5 (10.9%) | 29.0 |
| High School Diploma | 34 (73.9%) | 128.0 |
| College or Associate's Degree | 5 (10.9%) | 13.0 |
| Bachelor's Degree | 2 (4.3%) | 11.0 |
| Graduate Degree | 0 (0.0%) | 0.0 |
| Total | 46 (100.0%) | 45.0 |
Fertility by Education by Marriage Status in Perry
50.0% of women with births in Perry are unmarried. Women with the educational attainment of less than high school are most likely to be married with 100.0% of them married at childbirth, while women with the educational attainment of high school diploma are least likely to be married with 67.6% of them unmarried at childbirth.
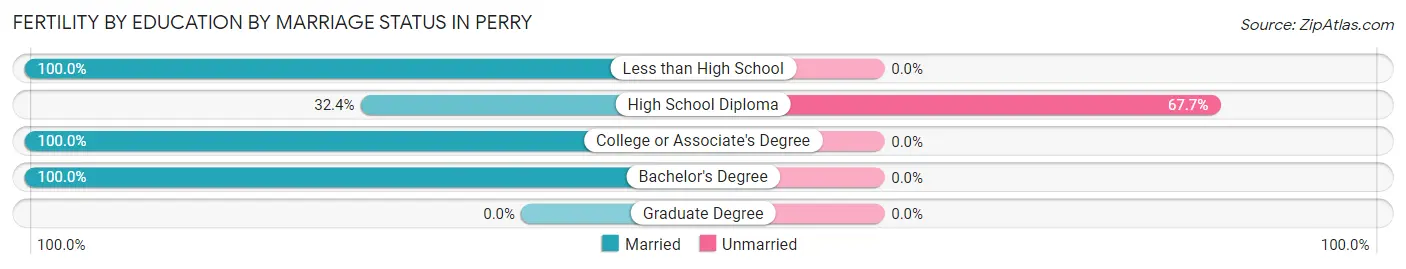
| Educational Attainment | Married | Unmarried |
| Less than High School | 5 (100.0%) | 0 (0.0%) |
| High School Diploma | 11 (32.4%) | 23 (67.6%) |
| College or Associate's Degree | 5 (100.0%) | 0 (0.0%) |
| Bachelor's Degree | 2 (100.0%) | 0 (0.0%) |
| Graduate Degree | 0 (0.0%) | 0 (0.0%) |
| Total | 23 (50.0%) | 23 (50.0%) |
Employment Characteristics in Perry
Employment by Class of Employer in Perry
Among the 1,996 employed individuals in Perry, private company employees (1,386 | 69.4%), not-for-profit organizations (166 | 8.3%), and local government employees (163 | 8.2%) make up the most common classes of employment.
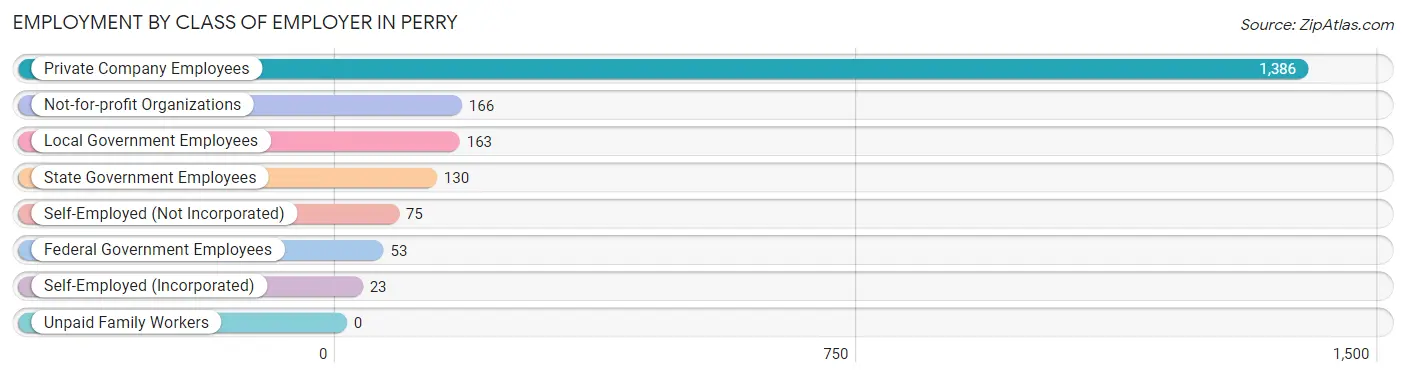
| Employer Class | # Employees | % Employees |
| Private Company Employees | 1,386 | 69.4% |
| Self-Employed (Incorporated) | 23 | 1.1% |
| Self-Employed (Not Incorporated) | 75 | 3.8% |
| Not-for-profit Organizations | 166 | 8.3% |
| Local Government Employees | 163 | 8.2% |
| State Government Employees | 130 | 6.5% |
| Federal Government Employees | 53 | 2.7% |
| Unpaid Family Workers | 0 | 0.0% |
| Total | 1,996 | 100.0% |
Employment Status by Age in Perry
According to the labor force statistics for Perry, out of the total population over 16 years of age (3,388), 60.5% or 2,050 individuals are in the labor force, with 2.7% or 55 of them unemployed. The age group with the highest labor force participation rate is 20 to 24 years, with 84.9% or 297 individuals in the labor force. Within the labor force, the 16 to 19 years age range has the highest percentage of unemployed individuals, with 37.9% or 22 of them being unemployed.
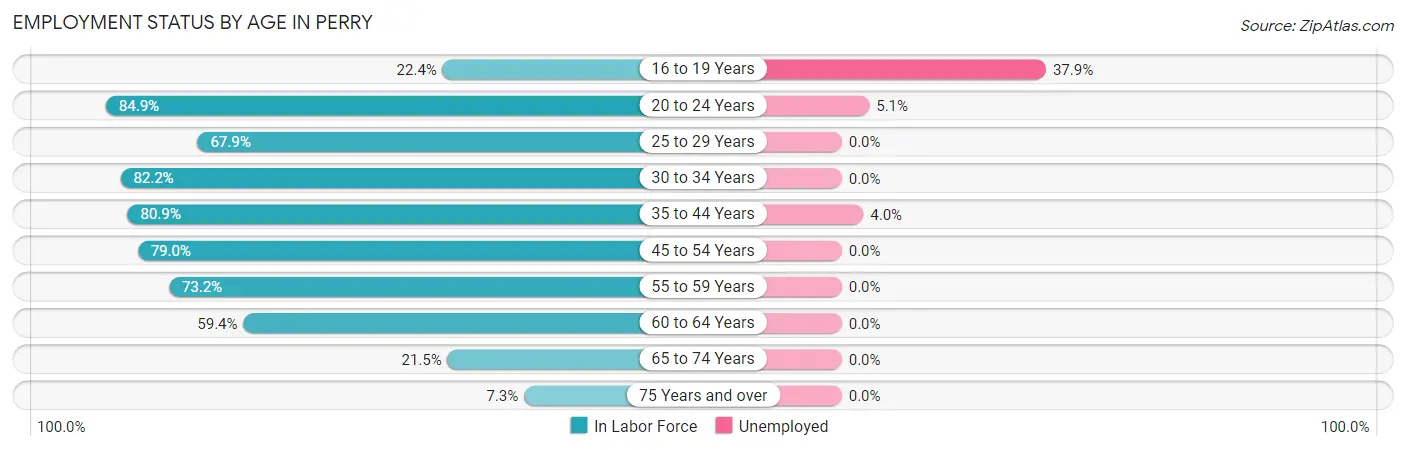
| Age Bracket | In Labor Force | Unemployed |
| 16 to 19 Years | 58 (22.4%) | 22 (37.9%) |
| 20 to 24 Years | 297 (84.9%) | 15 (5.1%) |
| 25 to 29 Years | 190 (67.9%) | 0 (0.0%) |
| 30 to 34 Years | 221 (82.2%) | 0 (0.0%) |
| 35 to 44 Years | 448 (80.9%) | 18 (4.0%) |
| 45 to 54 Years | 395 (79.0%) | 0 (0.0%) |
| 55 to 59 Years | 188 (73.2%) | 0 (0.0%) |
| 60 to 64 Years | 161 (59.4%) | 0 (0.0%) |
| 65 to 74 Years | 69 (21.5%) | 0 (0.0%) |
| 75 Years and over | 24 (7.3%) | 0 (0.0%) |
| Total | 2,050 (60.5%) | 55 (2.7%) |
Employment Status by Educational Attainment in Perry
According to labor force statistics for Perry, 75.2% of individuals (1,603) out of the total population between 25 and 64 years of age (2,131) are in the labor force, with 1.1% or 18 of them being unemployed. The group with the highest labor force participation rate are those with the educational attainment of bachelor's degree or higher, with 97.3% or 355 individuals in the labor force. Within the labor force, individuals with less than high school education have the highest percentage of unemployment, with 12.3% or 18 of them being unemployed.
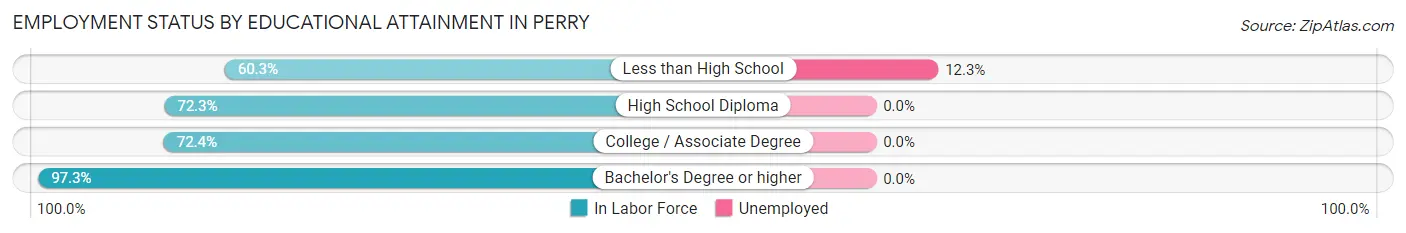
| Educational Attainment | In Labor Force | Unemployed |
| Less than High School | 146 (60.3%) | 30 (12.3%) |
| High School Diploma | 677 (72.3%) | 0 (0.0%) |
| College / Associate Degree | 425 (72.4%) | 0 (0.0%) |
| Bachelor's Degree or higher | 355 (97.3%) | 0 (0.0%) |
| Total | 1,603 (75.2%) | 23 (1.1%) |
Employment Occupations by Sex in Perry
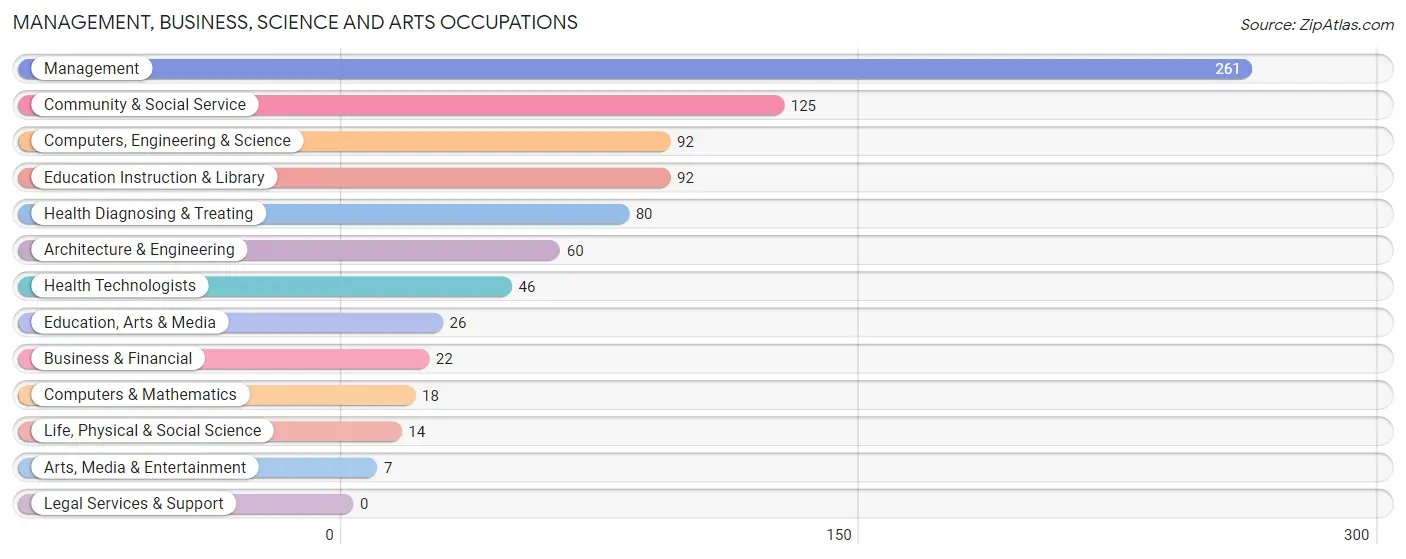
Management, Business, Science and Arts Occupations
The most common Management, Business, Science and Arts occupations in Perry are Management (261 | 13.1%), Community & Social Service (125 | 6.3%), Computers, Engineering & Science (92 | 4.6%), Education Instruction & Library (92 | 4.6%), and Health Diagnosing & Treating (80 | 4.0%).
Management, Business, Science and Arts Occupations by Sex
Within the Management, Business, Science and Arts occupations in Perry, the most male-oriented occupations are Computers & Mathematics (100.0%), Architecture & Engineering (100.0%), and Computers, Engineering & Science (84.8%), while the most female-oriented occupations are Life, Physical & Social Science (100.0%), Education Instruction & Library (100.0%), and Arts, Media & Entertainment (100.0%).
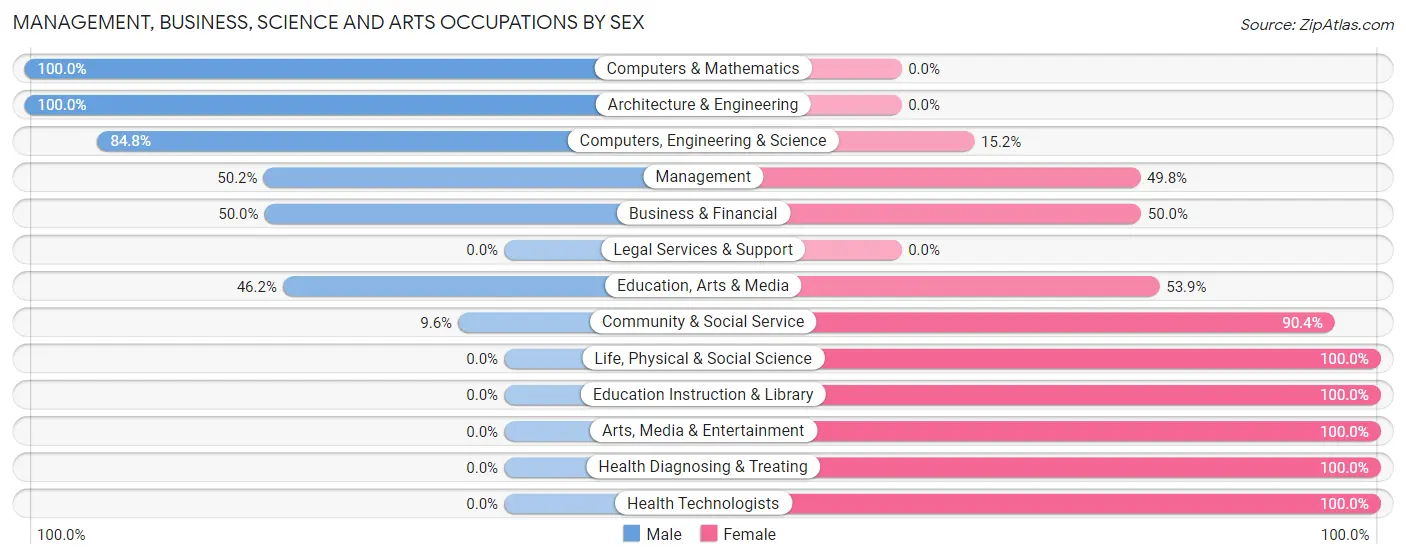
| Occupation | Male | Female |
| Management | 131 (50.2%) | 130 (49.8%) |
| Business & Financial | 11 (50.0%) | 11 (50.0%) |
| Computers, Engineering & Science | 78 (84.8%) | 14 (15.2%) |
| Computers & Mathematics | 18 (100.0%) | 0 (0.0%) |
| Architecture & Engineering | 60 (100.0%) | 0 (0.0%) |
| Life, Physical & Social Science | 0 (0.0%) | 14 (100.0%) |
| Community & Social Service | 12 (9.6%) | 113 (90.4%) |
| Education, Arts & Media | 12 (46.2%) | 14 (53.8%) |
| Legal Services & Support | 0 (0.0%) | 0 (0.0%) |
| Education Instruction & Library | 0 (0.0%) | 92 (100.0%) |
| Arts, Media & Entertainment | 0 (0.0%) | 7 (100.0%) |
| Health Diagnosing & Treating | 0 (0.0%) | 80 (100.0%) |
| Health Technologists | 0 (0.0%) | 46 (100.0%) |
| Total (Category) | 232 (40.0%) | 348 (60.0%) |
| Total (Overall) | 1,124 (56.3%) | 872 (43.7%) |
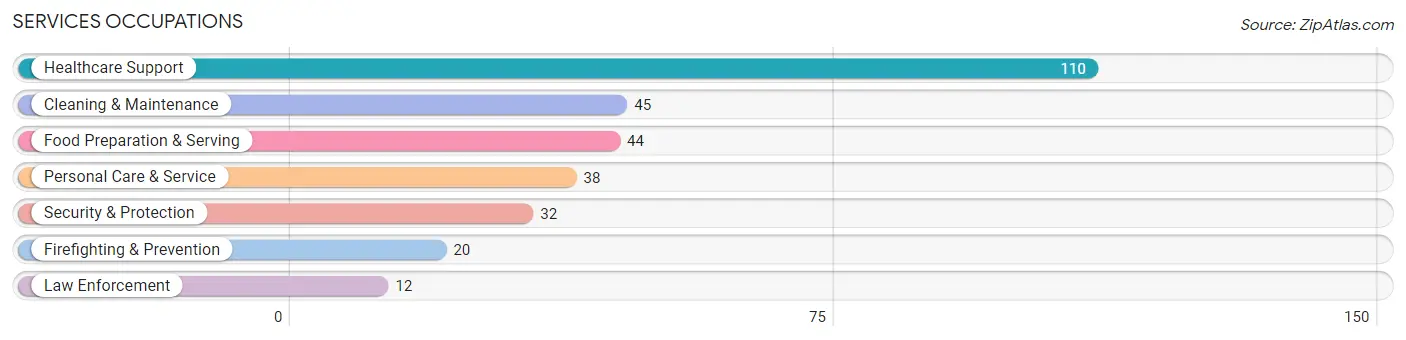
Services Occupations
The most common Services occupations in Perry are Healthcare Support (110 | 5.5%), Cleaning & Maintenance (45 | 2.2%), Food Preparation & Serving (44 | 2.2%), Personal Care & Service (38 | 1.9%), and Security & Protection (32 | 1.6%).
Services Occupations by Sex
Within the Services occupations in Perry, the most male-oriented occupations are Firefighting & Prevention (100.0%), Security & Protection (87.5%), and Law Enforcement (66.7%), while the most female-oriented occupations are Personal Care & Service (100.0%), Cleaning & Maintenance (97.8%), and Healthcare Support (83.6%).
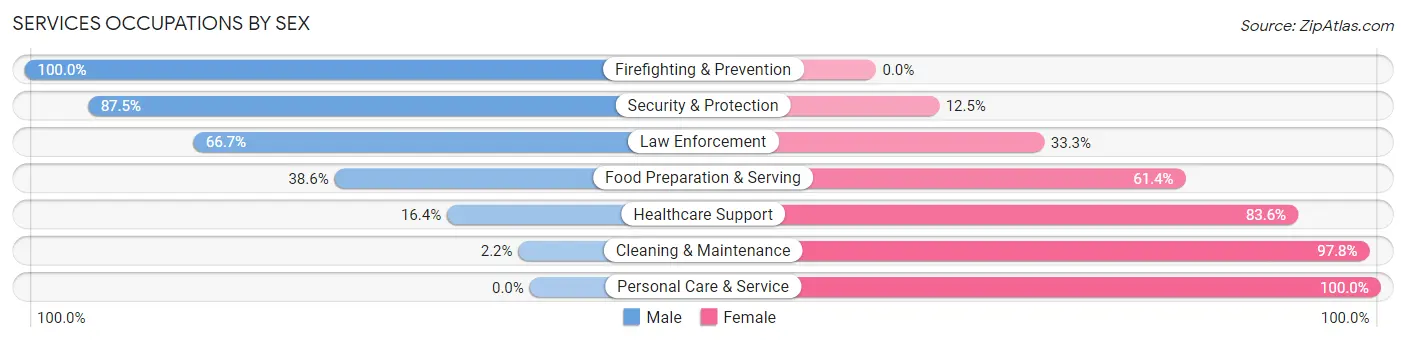
| Occupation | Male | Female |
| Healthcare Support | 18 (16.4%) | 92 (83.6%) |
| Security & Protection | 28 (87.5%) | 4 (12.5%) |
| Firefighting & Prevention | 20 (100.0%) | 0 (0.0%) |
| Law Enforcement | 8 (66.7%) | 4 (33.3%) |
| Food Preparation & Serving | 17 (38.6%) | 27 (61.4%) |
| Cleaning & Maintenance | 1 (2.2%) | 44 (97.8%) |
| Personal Care & Service | 0 (0.0%) | 38 (100.0%) |
| Total (Category) | 64 (23.8%) | 205 (76.2%) |
| Total (Overall) | 1,124 (56.3%) | 872 (43.7%) |
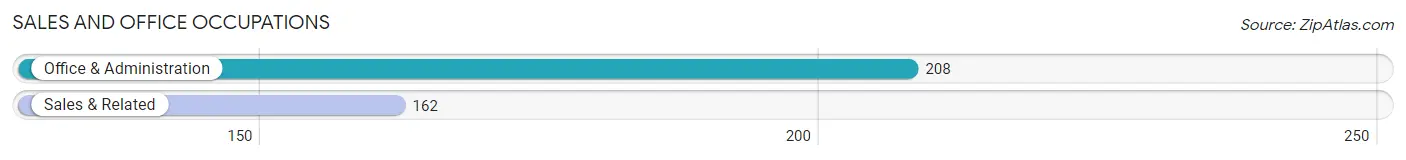
Sales and Office Occupations
The most common Sales and Office occupations in Perry are Office & Administration (208 | 10.4%), and Sales & Related (162 | 8.1%).
Sales and Office Occupations by Sex
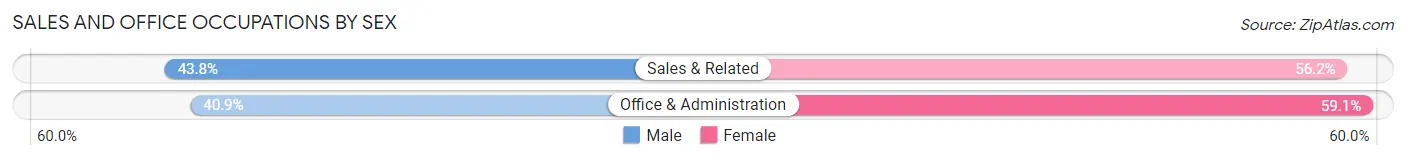
| Occupation | Male | Female |
| Sales & Related | 71 (43.8%) | 91 (56.2%) |
| Office & Administration | 85 (40.9%) | 123 (59.1%) |
| Total (Category) | 156 (42.2%) | 214 (57.8%) |
| Total (Overall) | 1,124 (56.3%) | 872 (43.7%) |
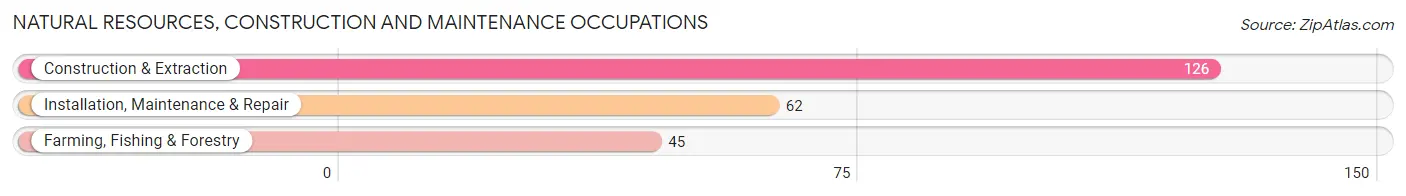
Natural Resources, Construction and Maintenance Occupations
The most common Natural Resources, Construction and Maintenance occupations in Perry are Construction & Extraction (126 | 6.3%), Installation, Maintenance & Repair (62 | 3.1%), and Farming, Fishing & Forestry (45 | 2.2%).
Natural Resources, Construction and Maintenance Occupations by Sex
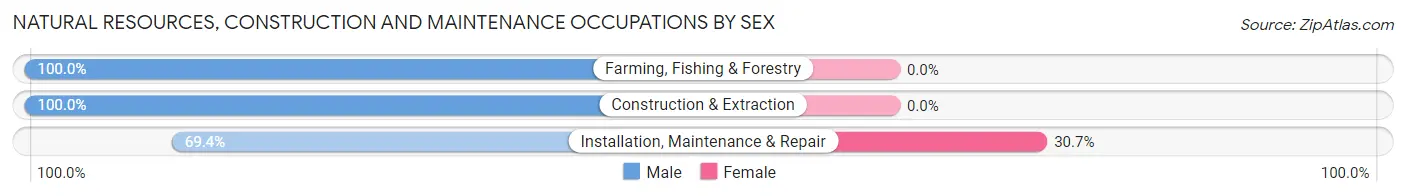
| Occupation | Male | Female |
| Farming, Fishing & Forestry | 45 (100.0%) | 0 (0.0%) |
| Construction & Extraction | 126 (100.0%) | 0 (0.0%) |
| Installation, Maintenance & Repair | 43 (69.4%) | 19 (30.6%) |
| Total (Category) | 214 (91.8%) | 19 (8.2%) |
| Total (Overall) | 1,124 (56.3%) | 872 (43.7%) |
Production, Transportation and Moving Occupations
The most common Production, Transportation and Moving occupations in Perry are Production (416 | 20.8%), Material Moving (97 | 4.9%), and Transportation (31 | 1.5%).
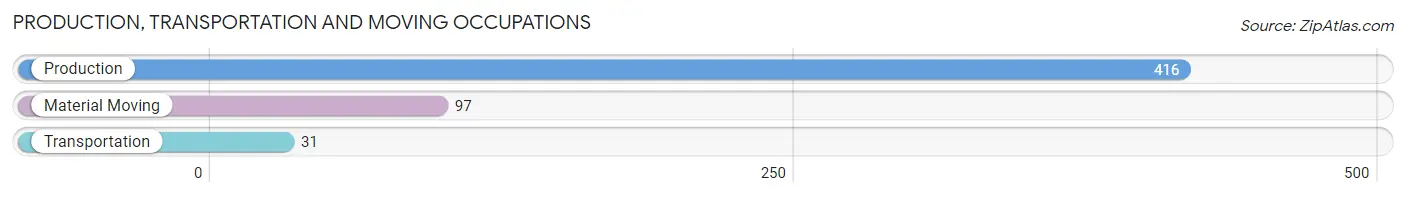
Production, Transportation and Moving Occupations by Sex
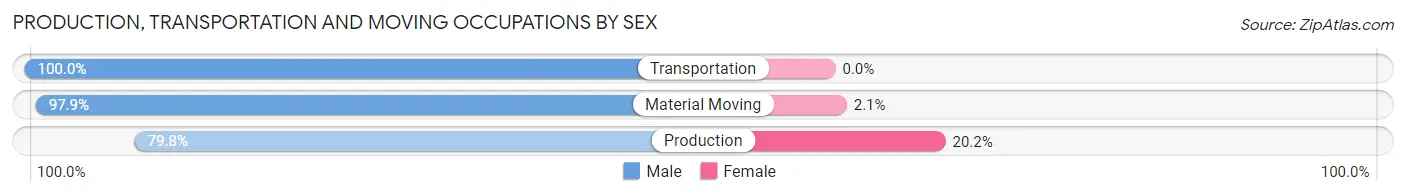
| Occupation | Male | Female |
| Production | 332 (79.8%) | 84 (20.2%) |
| Transportation | 31 (100.0%) | 0 (0.0%) |
| Material Moving | 95 (97.9%) | 2 (2.1%) |
| Total (Category) | 458 (84.2%) | 86 (15.8%) |
| Total (Overall) | 1,124 (56.3%) | 872 (43.7%) |
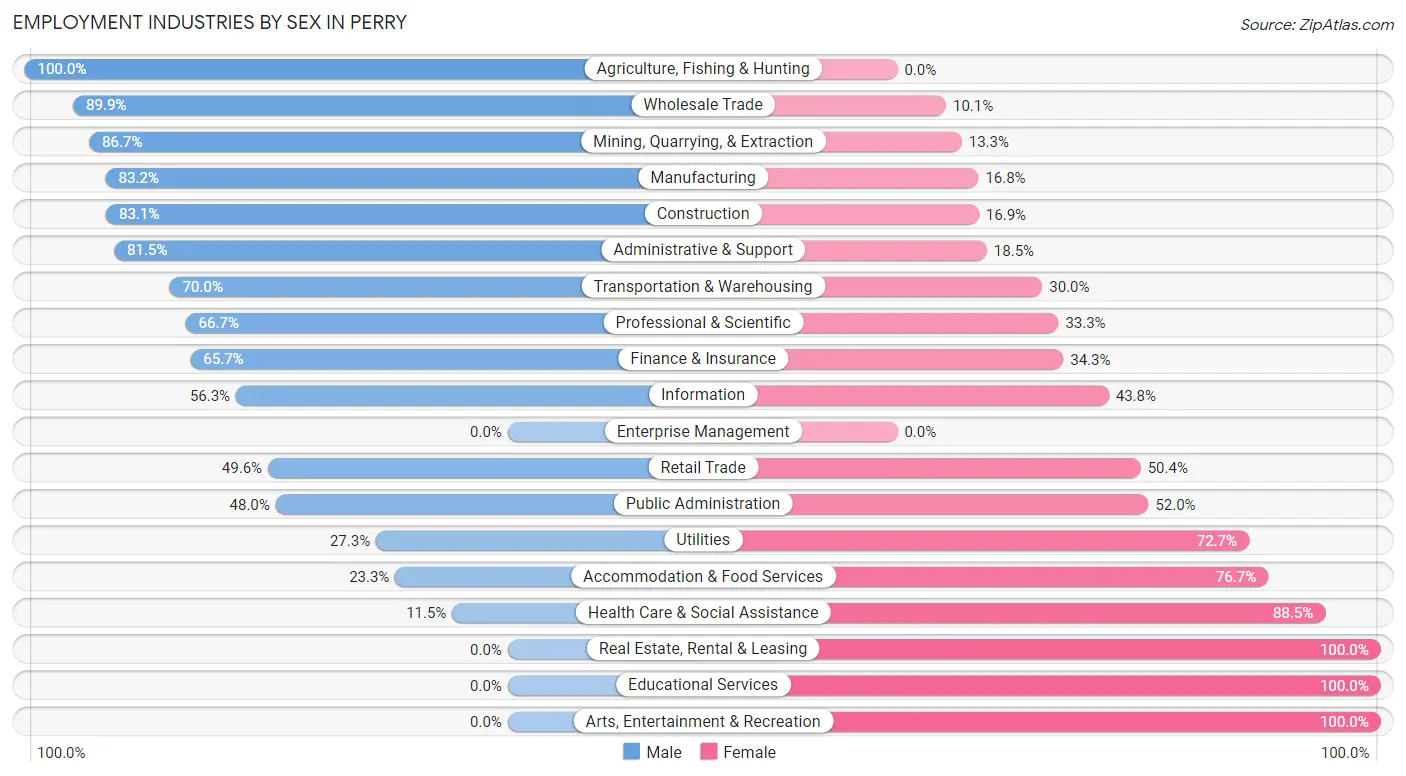
Employment Industries by Sex in Perry
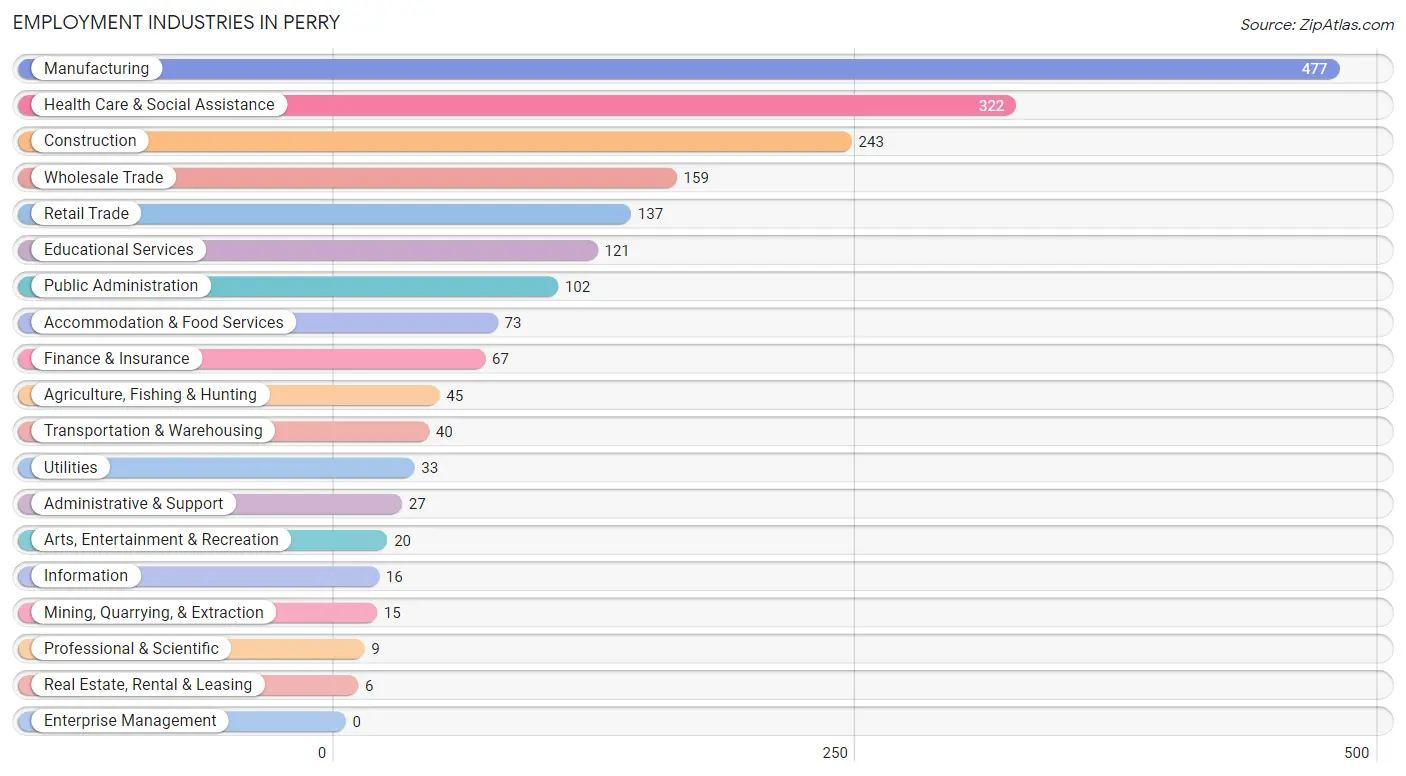
Employment Industries in Perry
The major employment industries in Perry include Manufacturing (477 | 23.9%), Health Care & Social Assistance (322 | 16.1%), Construction (243 | 12.2%), Wholesale Trade (159 | 8.0%), and Retail Trade (137 | 6.9%).
Employment Industries by Sex in Perry
The Perry industries that see more men than women are Agriculture, Fishing & Hunting (100.0%), Wholesale Trade (89.9%), and Mining, Quarrying, & Extraction (86.7%), whereas the industries that tend to have a higher number of women are Real Estate, Rental & Leasing (100.0%), Educational Services (100.0%), and Arts, Entertainment & Recreation (100.0%).
| Industry | Male | Female |
| Agriculture, Fishing & Hunting | 45 (100.0%) | 0 (0.0%) |
| Mining, Quarrying, & Extraction | 13 (86.7%) | 2 (13.3%) |
| Construction | 202 (83.1%) | 41 (16.9%) |
| Manufacturing | 397 (83.2%) | 80 (16.8%) |
| Wholesale Trade | 143 (89.9%) | 16 (10.1%) |
| Retail Trade | 68 (49.6%) | 69 (50.4%) |
| Transportation & Warehousing | 28 (70.0%) | 12 (30.0%) |
| Utilities | 9 (27.3%) | 24 (72.7%) |
| Information | 9 (56.2%) | 7 (43.8%) |
| Finance & Insurance | 44 (65.7%) | 23 (34.3%) |
| Real Estate, Rental & Leasing | 0 (0.0%) | 6 (100.0%) |
| Professional & Scientific | 6 (66.7%) | 3 (33.3%) |
| Enterprise Management | 0 (0.0%) | 0 (0.0%) |
| Administrative & Support | 22 (81.5%) | 5 (18.5%) |
| Educational Services | 0 (0.0%) | 121 (100.0%) |
| Health Care & Social Assistance | 37 (11.5%) | 285 (88.5%) |
| Arts, Entertainment & Recreation | 0 (0.0%) | 20 (100.0%) |
| Accommodation & Food Services | 17 (23.3%) | 56 (76.7%) |
| Public Administration | 49 (48.0%) | 53 (52.0%) |
| Total | 1,124 (56.3%) | 872 (43.7%) |
Education in Perry
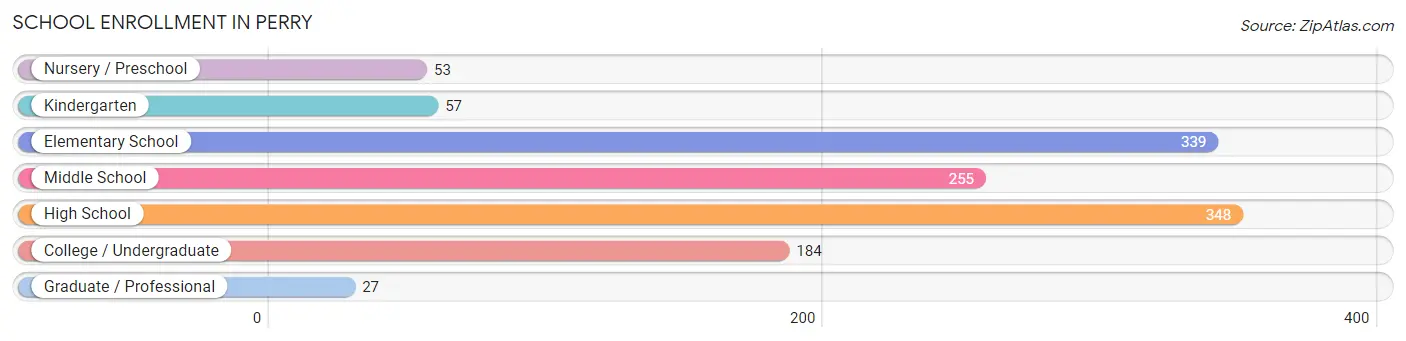
School Enrollment in Perry
The most common levels of schooling among the 1,263 students in Perry are high school (348 | 27.6%), elementary school (339 | 26.8%), and middle school (255 | 20.2%).
| School Level | # Students | % Students |
| Nursery / Preschool | 53 | 4.2% |
| Kindergarten | 57 | 4.5% |
| Elementary School | 339 | 26.8% |
| Middle School | 255 | 20.2% |
| High School | 348 | 27.6% |
| College / Undergraduate | 184 | 14.6% |
| Graduate / Professional | 27 | 2.1% |
| Total | 1,263 | 100.0% |
School Enrollment by Age by Funding Source in Perry
Out of a total of 1,263 students who are enrolled in schools in Perry, 81 (6.4%) attend a private institution, while the remaining 1,182 (93.6%) are enrolled in public schools. The age group of 25 to 34 year olds has the highest likelihood of being enrolled in private schools, with 27 (21.6% in the age bracket) enrolled. Conversely, the age group of 3 to 4 year olds has the lowest likelihood of being enrolled in a private school, with 30 (100.0% in the age bracket) attending a public institution.
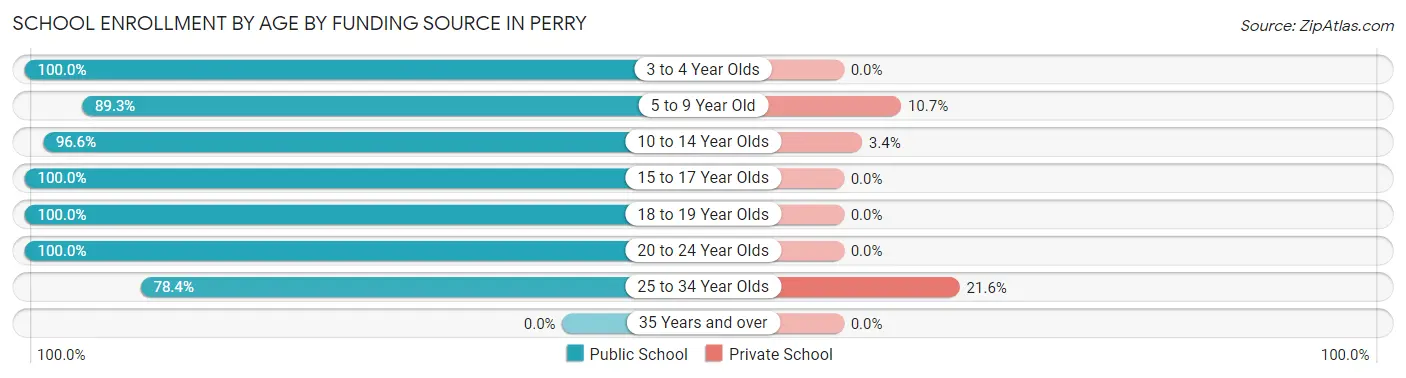
| Age Bracket | Public School | Private School |
| 3 to 4 Year Olds | 30 (100.0%) | 0 (0.0%) |
| 5 to 9 Year Old | 343 (89.3%) | 41 (10.7%) |
| 10 to 14 Year Olds | 369 (96.6%) | 13 (3.4%) |
| 15 to 17 Year Olds | 195 (100.0%) | 0 (0.0%) |
| 18 to 19 Year Olds | 39 (100.0%) | 0 (0.0%) |
| 20 to 24 Year Olds | 108 (100.0%) | 0 (0.0%) |
| 25 to 34 Year Olds | 98 (78.4%) | 27 (21.6%) |
| 35 Years and over | 0 (0.0%) | 0 (0.0%) |
| Total | 1,182 (93.6%) | 81 (6.4%) |
Educational Attainment by Field of Study in Perry
Education (137 | 24.4%), business (104 | 18.5%), science & technology (77 | 13.7%), social sciences (48 | 8.5%), and engineering (48 | 8.5%) are the most common fields of study among 562 individuals in Perry who have obtained a bachelor's degree or higher.
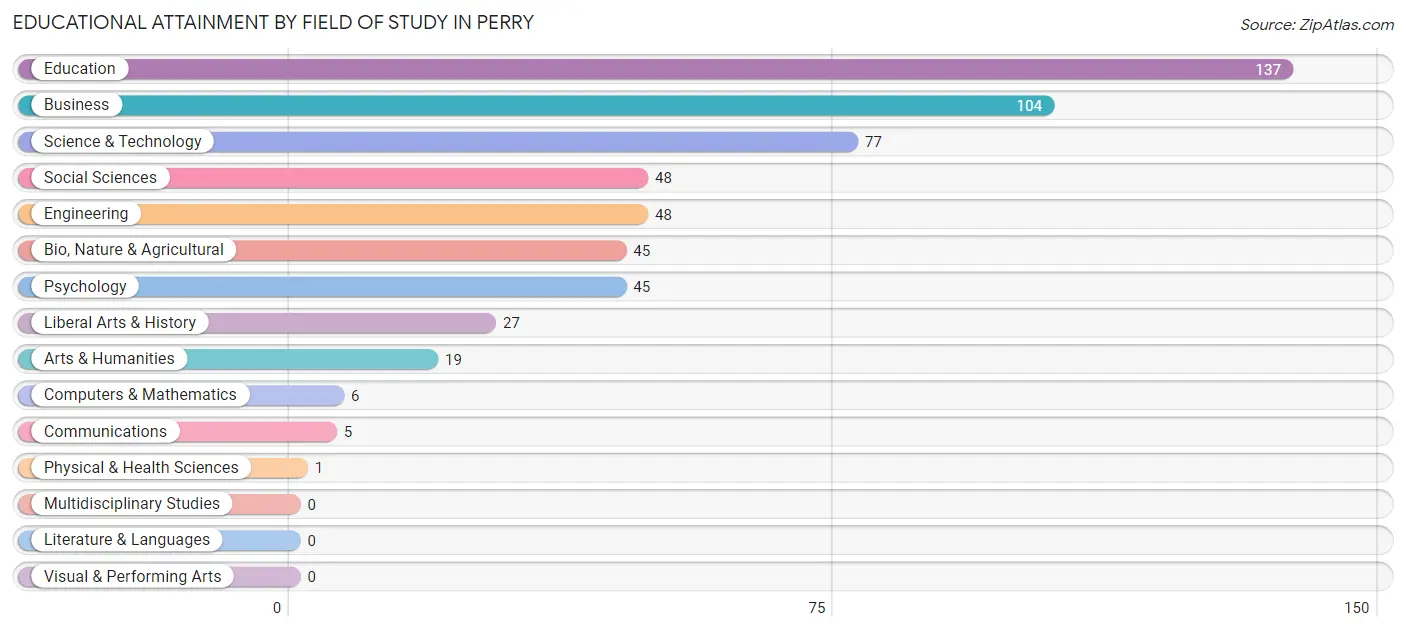
| Field of Study | # Graduates | % Graduates |
| Computers & Mathematics | 6 | 1.1% |
| Bio, Nature & Agricultural | 45 | 8.0% |
| Physical & Health Sciences | 1 | 0.2% |
| Psychology | 45 | 8.0% |
| Social Sciences | 48 | 8.5% |
| Engineering | 48 | 8.5% |
| Multidisciplinary Studies | 0 | 0.0% |
| Science & Technology | 77 | 13.7% |
| Business | 104 | 18.5% |
| Education | 137 | 24.4% |
| Literature & Languages | 0 | 0.0% |
| Liberal Arts & History | 27 | 4.8% |
| Visual & Performing Arts | 0 | 0.0% |
| Communications | 5 | 0.9% |
| Arts & Humanities | 19 | 3.4% |
| Total | 562 | 100.0% |
Transportation & Commute in Perry
Vehicle Availability by Sex in Perry
The most prevalent vehicle ownership categories in Perry are males with 3 vehicles (382, accounting for 34.0%) and females with 3 vehicles (207, making up 43.8%).
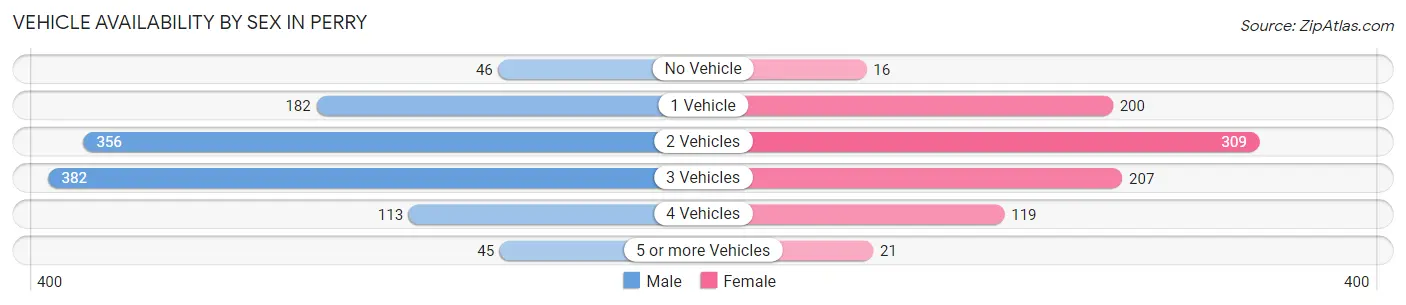
| Vehicles Available | Male | Female |
| No Vehicle | 46 (4.1%) | 16 (1.8%) |
| 1 Vehicle | 182 (16.2%) | 200 (22.9%) |
| 2 Vehicles | 356 (31.7%) | 309 (35.4%) |
| 3 Vehicles | 382 (34.0%) | 207 (23.7%) |
| 4 Vehicles | 113 (10.1%) | 119 (13.7%) |
| 5 or more Vehicles | 45 (4.0%) | 21 (2.4%) |
| Total | 1,124 (100.0%) | 872 (100.0%) |
Commute Time in Perry
The most frequently occuring commute durations in Perry are 5 to 9 minutes (589 commuters, 30.1%), less than 5 minutes (385 commuters, 19.7%), and 10 to 14 minutes (245 commuters, 12.5%).
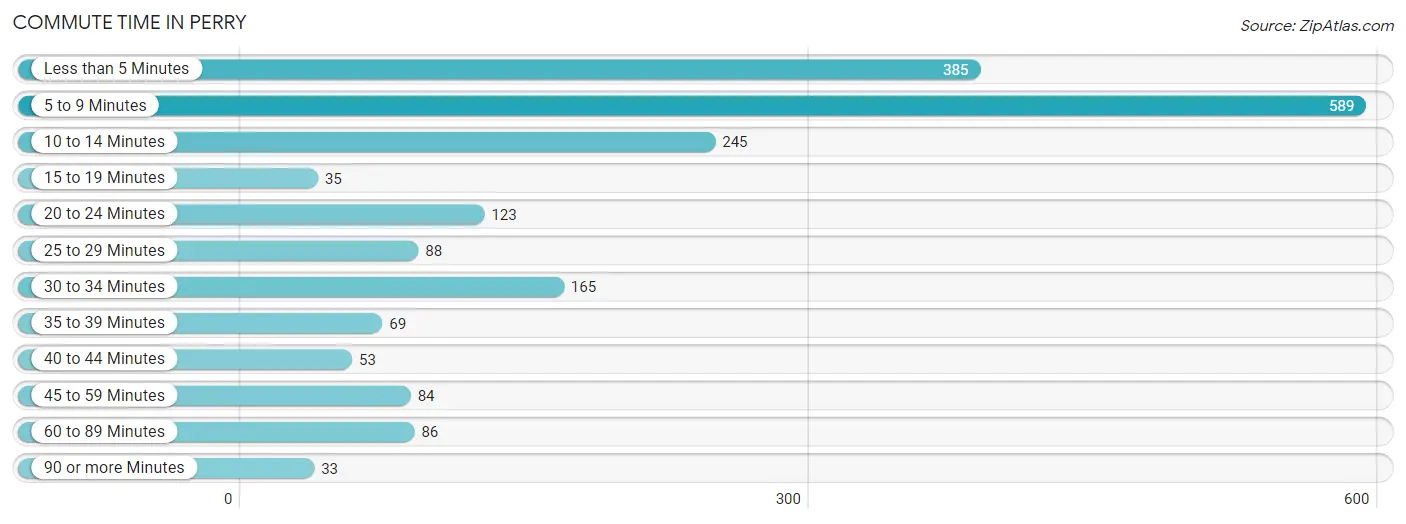
| Commute Time | # Commuters | % Commuters |
| Less than 5 Minutes | 385 | 19.7% |
| 5 to 9 Minutes | 589 | 30.1% |
| 10 to 14 Minutes | 245 | 12.5% |
| 15 to 19 Minutes | 35 | 1.8% |
| 20 to 24 Minutes | 123 | 6.3% |
| 25 to 29 Minutes | 88 | 4.5% |
| 30 to 34 Minutes | 165 | 8.4% |
| 35 to 39 Minutes | 69 | 3.5% |
| 40 to 44 Minutes | 53 | 2.7% |
| 45 to 59 Minutes | 84 | 4.3% |
| 60 to 89 Minutes | 86 | 4.4% |
| 90 or more Minutes | 33 | 1.7% |
Commute Time by Sex in Perry
The most common commute times in Perry are 5 to 9 minutes (398 commuters, 35.6%) for males and less than 5 minutes (267 commuters, 31.9%) for females.
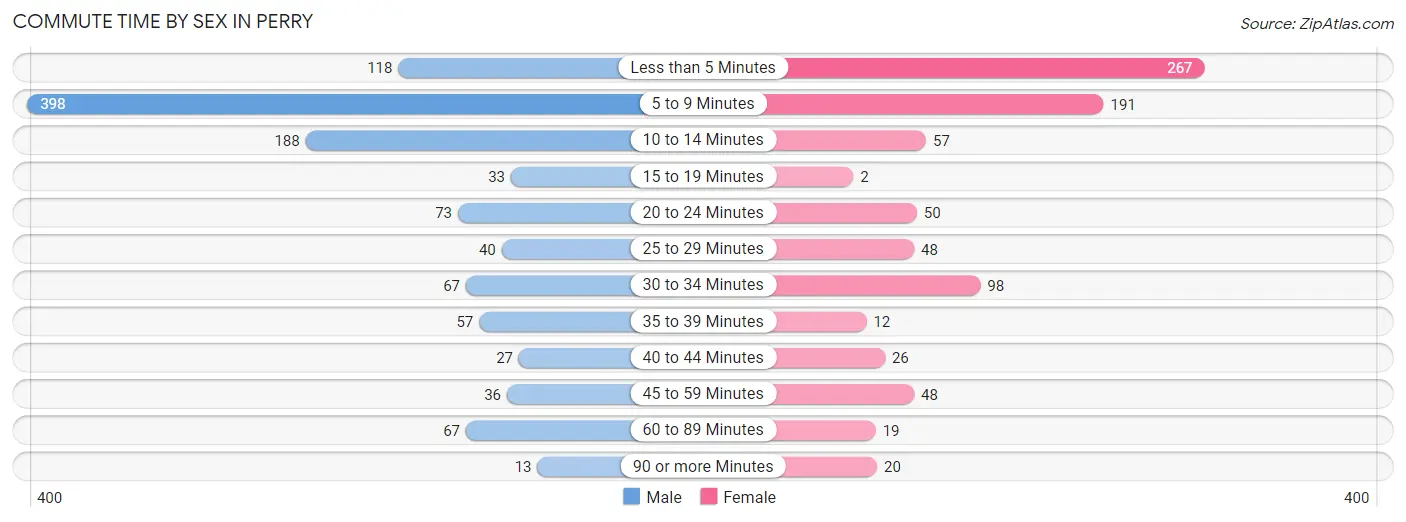
| Commute Time | Male | Female |
| Less than 5 Minutes | 118 (10.6%) | 267 (31.9%) |
| 5 to 9 Minutes | 398 (35.6%) | 191 (22.8%) |
| 10 to 14 Minutes | 188 (16.8%) | 57 (6.8%) |
| 15 to 19 Minutes | 33 (2.9%) | 2 (0.2%) |
| 20 to 24 Minutes | 73 (6.5%) | 50 (6.0%) |
| 25 to 29 Minutes | 40 (3.6%) | 48 (5.7%) |
| 30 to 34 Minutes | 67 (6.0%) | 98 (11.7%) |
| 35 to 39 Minutes | 57 (5.1%) | 12 (1.4%) |
| 40 to 44 Minutes | 27 (2.4%) | 26 (3.1%) |
| 45 to 59 Minutes | 36 (3.2%) | 48 (5.7%) |
| 60 to 89 Minutes | 67 (6.0%) | 19 (2.3%) |
| 90 or more Minutes | 13 (1.2%) | 20 (2.4%) |
Time of Departure to Work by Sex in Perry
The most frequent times of departure to work in Perry are 5:30 AM to 5:59 AM (241, 21.6%) for males and 7:00 AM to 7:29 AM (189, 22.6%) for females.
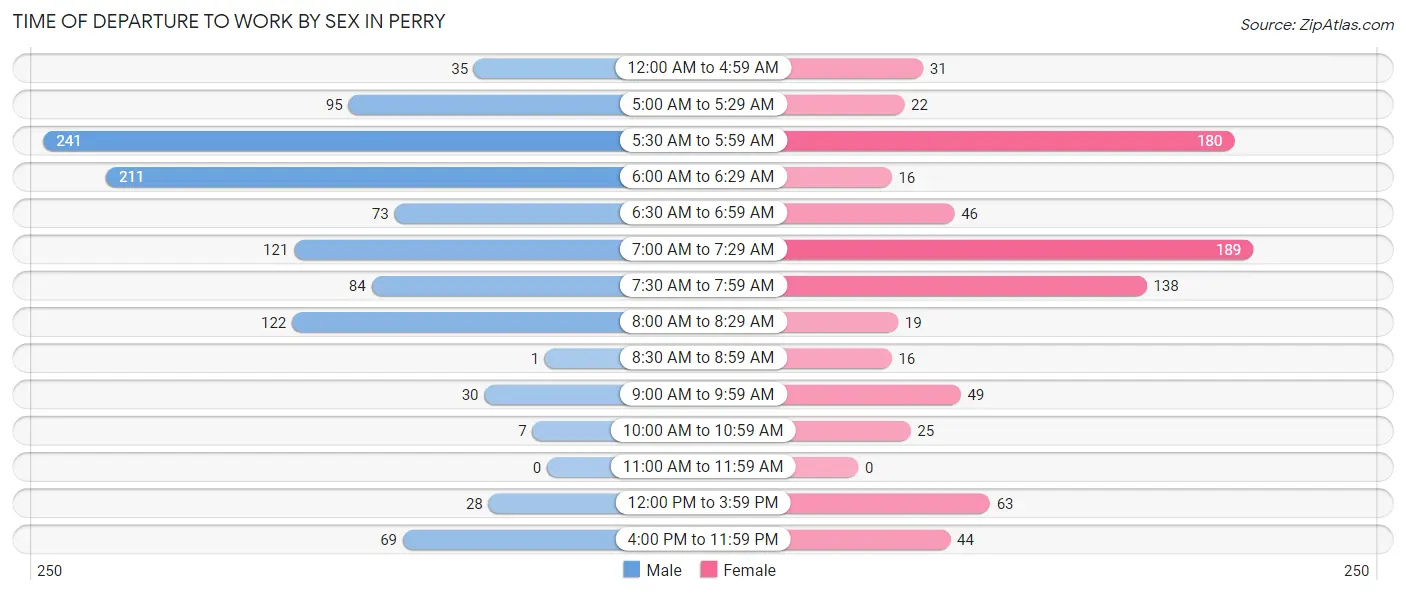
| Time of Departure | Male | Female |
| 12:00 AM to 4:59 AM | 35 (3.1%) | 31 (3.7%) |
| 5:00 AM to 5:29 AM | 95 (8.5%) | 22 (2.6%) |
| 5:30 AM to 5:59 AM | 241 (21.6%) | 180 (21.5%) |
| 6:00 AM to 6:29 AM | 211 (18.9%) | 16 (1.9%) |
| 6:30 AM to 6:59 AM | 73 (6.5%) | 46 (5.5%) |
| 7:00 AM to 7:29 AM | 121 (10.8%) | 189 (22.6%) |
| 7:30 AM to 7:59 AM | 84 (7.5%) | 138 (16.5%) |
| 8:00 AM to 8:29 AM | 122 (10.9%) | 19 (2.3%) |
| 8:30 AM to 8:59 AM | 1 (0.1%) | 16 (1.9%) |
| 9:00 AM to 9:59 AM | 30 (2.7%) | 49 (5.9%) |
| 10:00 AM to 10:59 AM | 7 (0.6%) | 25 (3.0%) |
| 11:00 AM to 11:59 AM | 0 (0.0%) | 0 (0.0%) |
| 12:00 PM to 3:59 PM | 28 (2.5%) | 63 (7.5%) |
| 4:00 PM to 11:59 PM | 69 (6.2%) | 44 (5.2%) |
| Total | 1,117 (100.0%) | 838 (100.0%) |
Housing Occupancy in Perry
Occupancy by Ownership in Perry
Of the total 1,593 dwellings in Perry, owner-occupied units account for 1,143 (71.8%), while renter-occupied units make up 450 (28.2%).
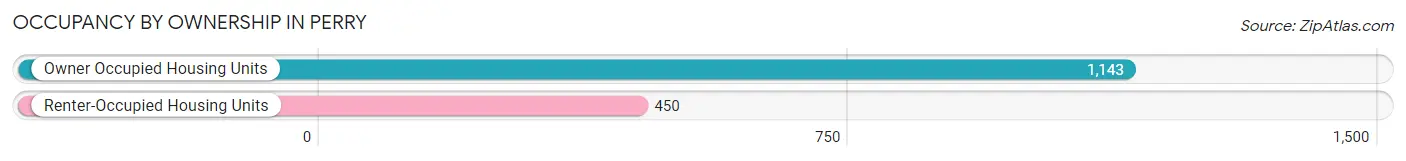
| Occupancy | # Housing Units | % Housing Units |
| Owner Occupied Housing Units | 1,143 | 71.8% |
| Renter-Occupied Housing Units | 450 | 28.2% |
| Total Occupied Housing Units | 1,593 | 100.0% |
Occupancy by Household Size in Perry
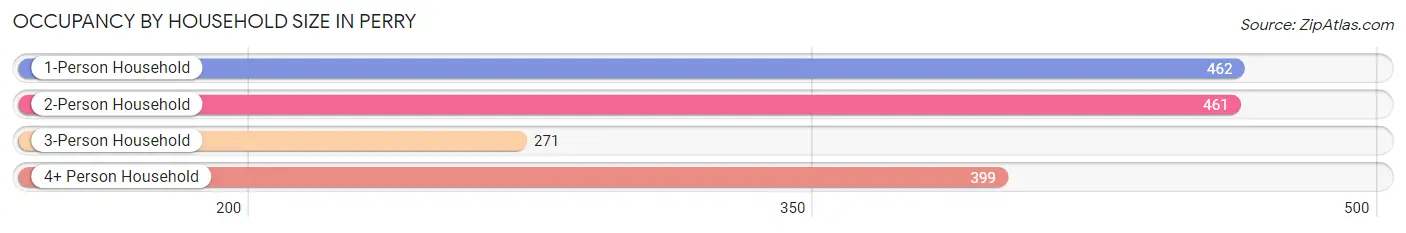
| Household Size | # Housing Units | % Housing Units |
| 1-Person Household | 462 | 29.0% |
| 2-Person Household | 461 | 28.9% |
| 3-Person Household | 271 | 17.0% |
| 4+ Person Household | 399 | 25.1% |
| Total Housing Units | 1,593 | 100.0% |
Occupancy by Ownership by Household Size in Perry
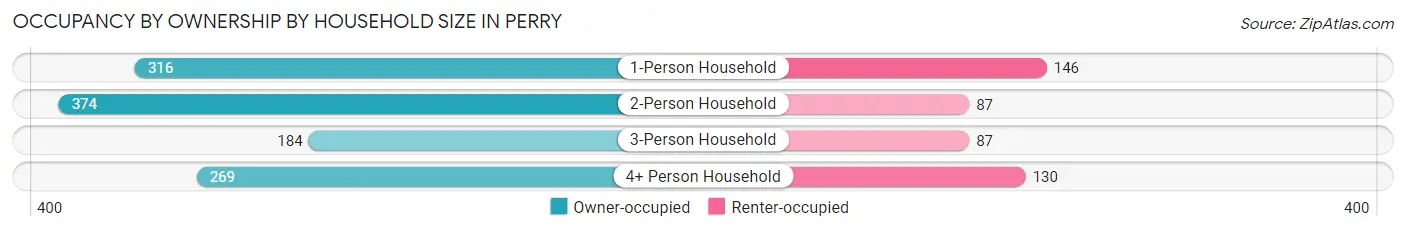
| Household Size | Owner-occupied | Renter-occupied |
| 1-Person Household | 316 (68.4%) | 146 (31.6%) |
| 2-Person Household | 374 (81.1%) | 87 (18.9%) |
| 3-Person Household | 184 (67.9%) | 87 (32.1%) |
| 4+ Person Household | 269 (67.4%) | 130 (32.6%) |
| Total Housing Units | 1,143 (71.8%) | 450 (28.2%) |
Occupancy by Educational Attainment in Perry
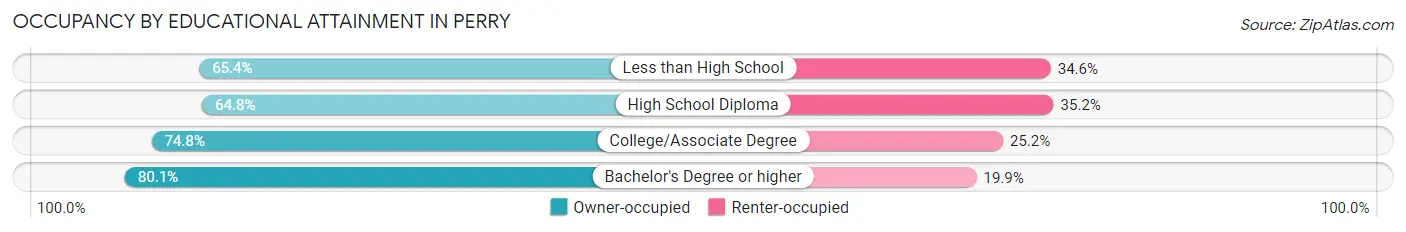
| Household Size | Owner-occupied | Renter-occupied |
| Less than High School | 68 (65.4%) | 36 (34.6%) |
| High School Diploma | 396 (64.8%) | 215 (35.2%) |
| College/Associate Degree | 345 (74.8%) | 116 (25.2%) |
| Bachelor's Degree or higher | 334 (80.1%) | 83 (19.9%) |
Occupancy by Age of Householder in Perry
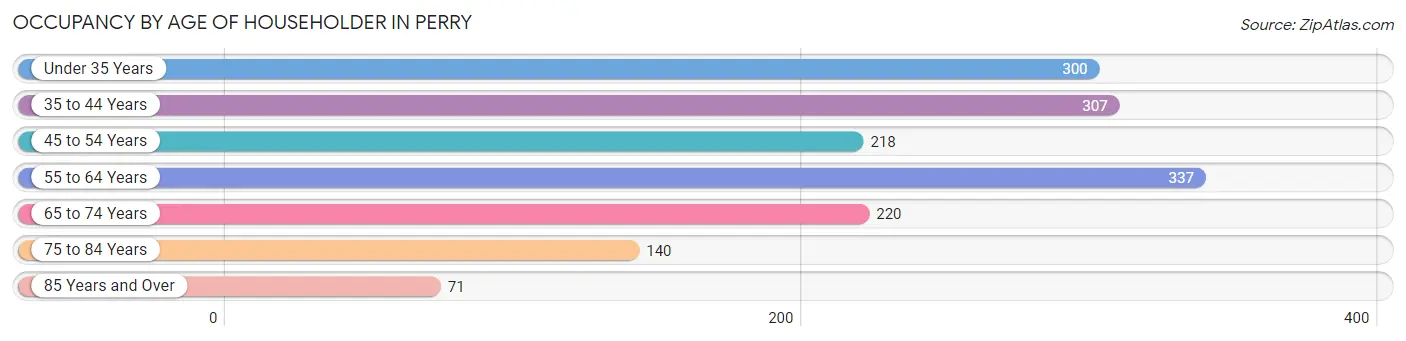
| Age Bracket | # Households | % Households |
| Under 35 Years | 300 | 18.8% |
| 35 to 44 Years | 307 | 19.3% |
| 45 to 54 Years | 218 | 13.7% |
| 55 to 64 Years | 337 | 21.2% |
| 65 to 74 Years | 220 | 13.8% |
| 75 to 84 Years | 140 | 8.8% |
| 85 Years and Over | 71 | 4.5% |
| Total | 1,593 | 100.0% |
Housing Finances in Perry
Median Income by Occupancy in Perry
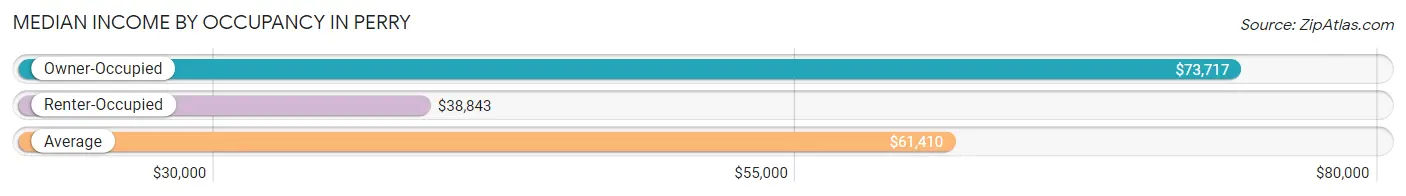
| Occupancy Type | # Households | Median Income |
| Owner-Occupied | 1,143 (71.8%) | $73,717 |
| Renter-Occupied | 450 (28.2%) | $38,843 |
| Average | 1,593 (100.0%) | $61,410 |
Occupancy by Householder Income Bracket in Perry
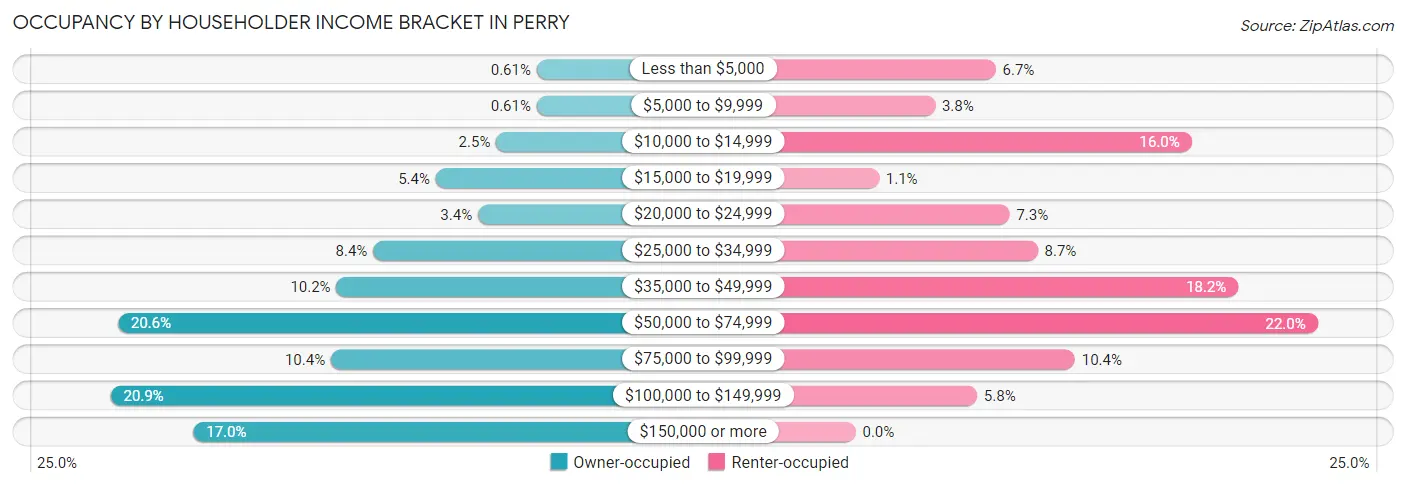
| Income Bracket | Owner-occupied | Renter-occupied |
| Less than $5,000 | 7 (0.6%) | 30 (6.7%) |
| $5,000 to $9,999 | 7 (0.6%) | 17 (3.8%) |
| $10,000 to $14,999 | 29 (2.5%) | 72 (16.0%) |
| $15,000 to $19,999 | 62 (5.4%) | 5 (1.1%) |
| $20,000 to $24,999 | 39 (3.4%) | 33 (7.3%) |
| $25,000 to $34,999 | 96 (8.4%) | 39 (8.7%) |
| $35,000 to $49,999 | 116 (10.2%) | 82 (18.2%) |
| $50,000 to $74,999 | 235 (20.6%) | 99 (22.0%) |
| $75,000 to $99,999 | 119 (10.4%) | 47 (10.4%) |
| $100,000 to $149,999 | 239 (20.9%) | 26 (5.8%) |
| $150,000 or more | 194 (17.0%) | 0 (0.0%) |
| Total | 1,143 (100.0%) | 450 (100.0%) |
Monthly Housing Cost Tiers in Perry
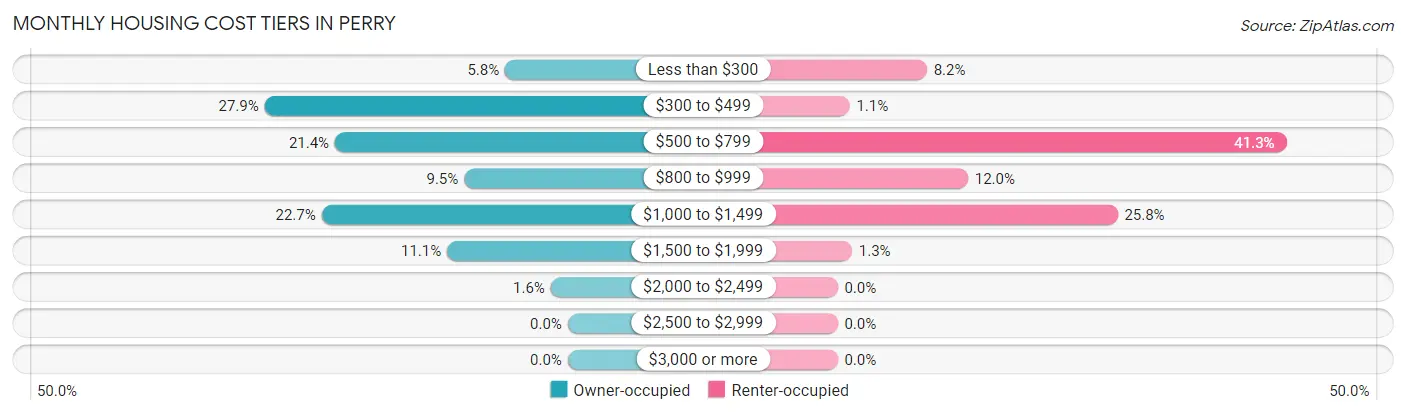
| Monthly Cost | Owner-occupied | Renter-occupied |
| Less than $300 | 66 (5.8%) | 37 (8.2%) |
| $300 to $499 | 319 (27.9%) | 5 (1.1%) |
| $500 to $799 | 245 (21.4%) | 186 (41.3%) |
| $800 to $999 | 109 (9.5%) | 54 (12.0%) |
| $1,000 to $1,499 | 259 (22.7%) | 116 (25.8%) |
| $1,500 to $1,999 | 127 (11.1%) | 6 (1.3%) |
| $2,000 to $2,499 | 18 (1.6%) | 0 (0.0%) |
| $2,500 to $2,999 | 0 (0.0%) | 0 (0.0%) |
| $3,000 or more | 0 (0.0%) | 0 (0.0%) |
| Total | 1,143 (100.0%) | 450 (100.0%) |
Physical Housing Characteristics in Perry
Housing Structures in Perry
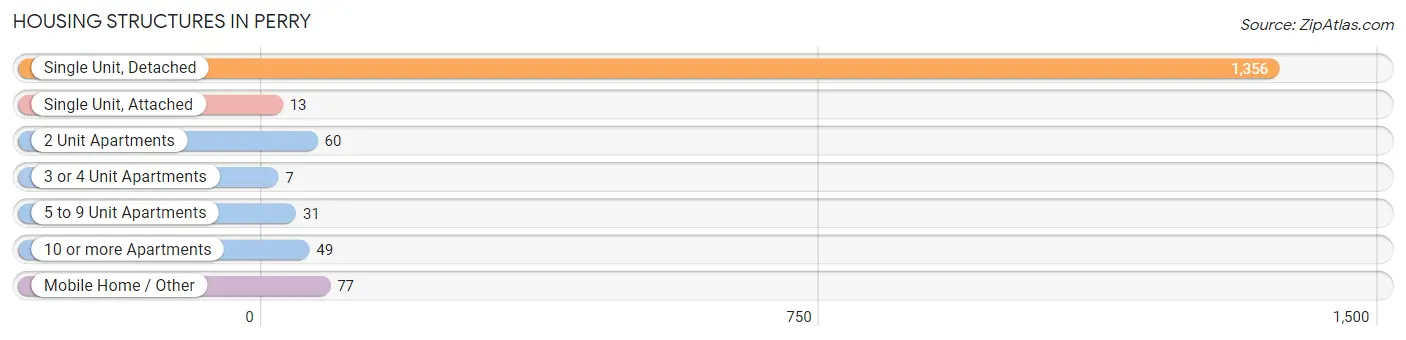
| Structure Type | # Housing Units | % Housing Units |
| Single Unit, Detached | 1,356 | 85.1% |
| Single Unit, Attached | 13 | 0.8% |
| 2 Unit Apartments | 60 | 3.8% |
| 3 or 4 Unit Apartments | 7 | 0.4% |
| 5 to 9 Unit Apartments | 31 | 1.9% |
| 10 or more Apartments | 49 | 3.1% |
| Mobile Home / Other | 77 | 4.8% |
| Total | 1,593 | 100.0% |
Housing Structures by Occupancy in Perry
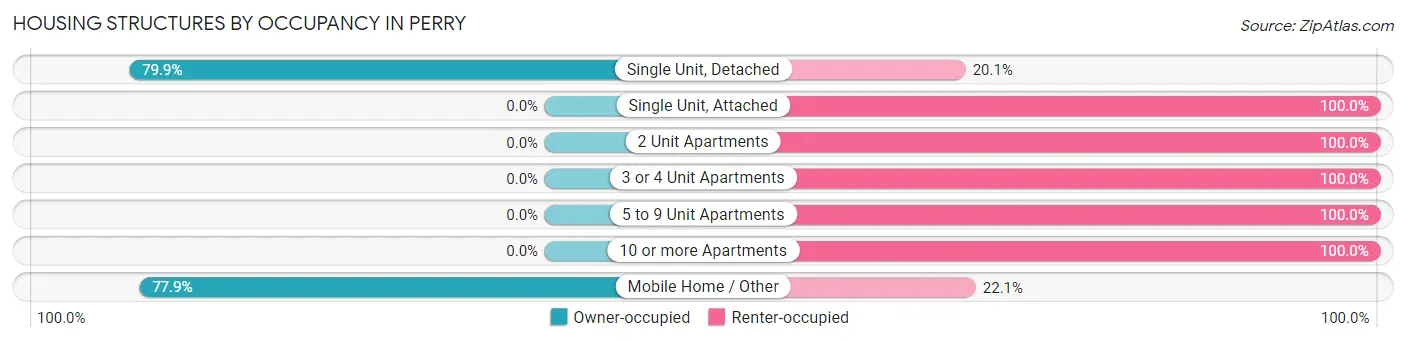
| Structure Type | Owner-occupied | Renter-occupied |
| Single Unit, Detached | 1,083 (79.9%) | 273 (20.1%) |
| Single Unit, Attached | 0 (0.0%) | 13 (100.0%) |
| 2 Unit Apartments | 0 (0.0%) | 60 (100.0%) |
| 3 or 4 Unit Apartments | 0 (0.0%) | 7 (100.0%) |
| 5 to 9 Unit Apartments | 0 (0.0%) | 31 (100.0%) |
| 10 or more Apartments | 0 (0.0%) | 49 (100.0%) |
| Mobile Home / Other | 60 (77.9%) | 17 (22.1%) |
| Total | 1,143 (71.8%) | 450 (28.2%) |
Housing Structures by Number of Rooms in Perry
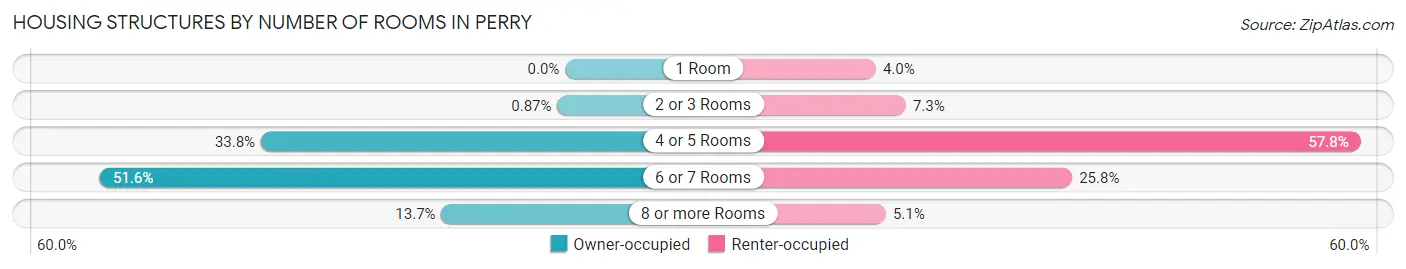
| Number of Rooms | Owner-occupied | Renter-occupied |
| 1 Room | 0 (0.0%) | 18 (4.0%) |
| 2 or 3 Rooms | 10 (0.9%) | 33 (7.3%) |
| 4 or 5 Rooms | 386 (33.8%) | 260 (57.8%) |
| 6 or 7 Rooms | 590 (51.6%) | 116 (25.8%) |
| 8 or more Rooms | 157 (13.7%) | 23 (5.1%) |
| Total | 1,143 (100.0%) | 450 (100.0%) |
Housing Structure by Heating Type in Perry
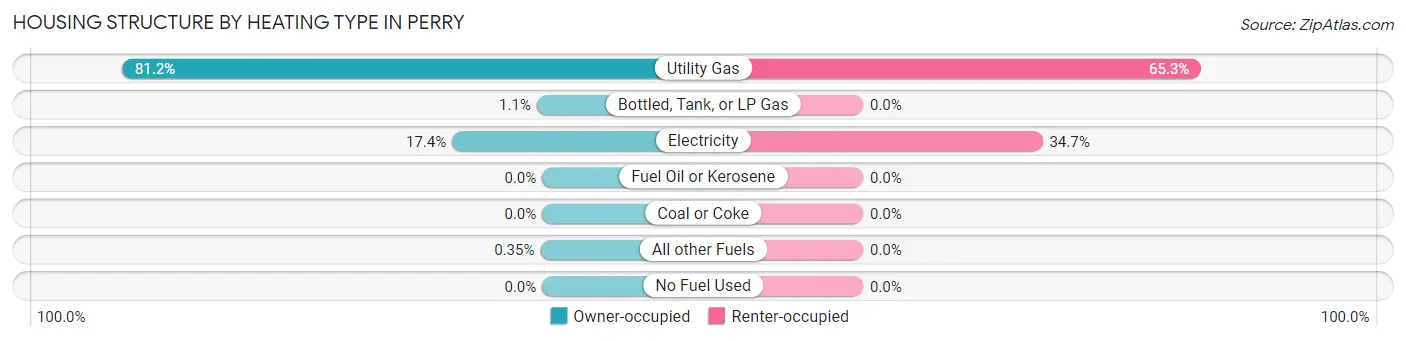
| Heating Type | Owner-occupied | Renter-occupied |
| Utility Gas | 928 (81.2%) | 294 (65.3%) |
| Bottled, Tank, or LP Gas | 12 (1.1%) | 0 (0.0%) |
| Electricity | 199 (17.4%) | 156 (34.7%) |
| Fuel Oil or Kerosene | 0 (0.0%) | 0 (0.0%) |
| Coal or Coke | 0 (0.0%) | 0 (0.0%) |
| All other Fuels | 4 (0.4%) | 0 (0.0%) |
| No Fuel Used | 0 (0.0%) | 0 (0.0%) |
| Total | 1,143 (100.0%) | 450 (100.0%) |
Household Vehicle Usage in Perry
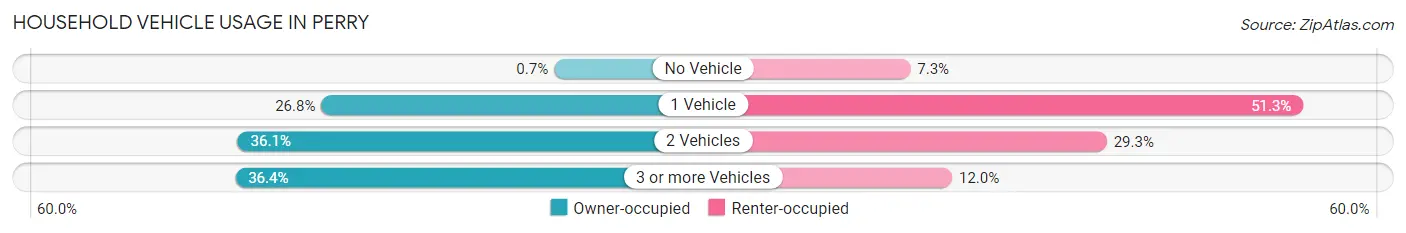
| Vehicles per Household | Owner-occupied | Renter-occupied |
| No Vehicle | 8 (0.7%) | 33 (7.3%) |
| 1 Vehicle | 306 (26.8%) | 231 (51.3%) |
| 2 Vehicles | 413 (36.1%) | 132 (29.3%) |
| 3 or more Vehicles | 416 (36.4%) | 54 (12.0%) |
| Total | 1,143 (100.0%) | 450 (100.0%) |
Real Estate & Mortgages in Perry
Real Estate and Mortgage Overview in Perry
| Characteristic | Without Mortgage | With Mortgage |
| Housing Units | 507 | 636 |
| Median Property Value | $85,500 | $120,000 |
| Median Household Income | $46,625 | $140 |
| Monthly Housing Costs | $447 | $0 |
| Real Estate Taxes | $511 | $28 |
Property Value by Mortgage Status in Perry
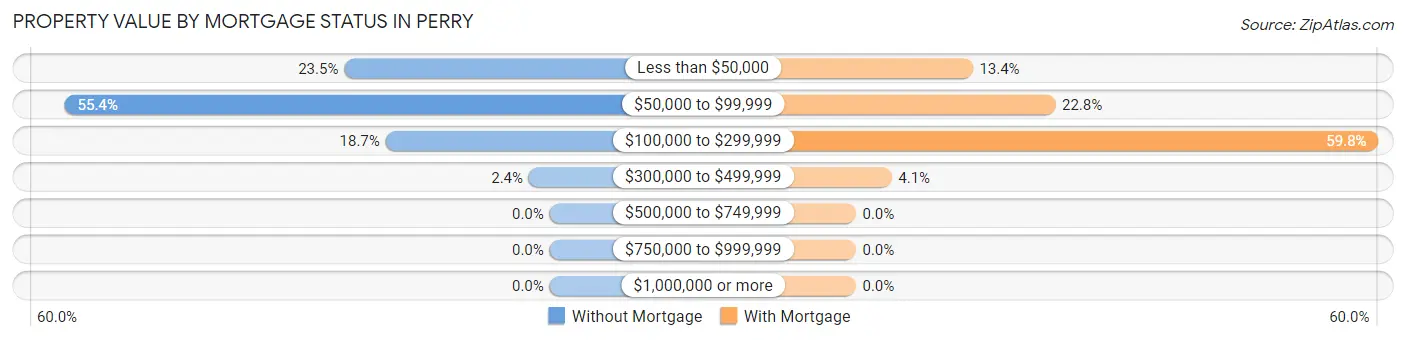
| Property Value | Without Mortgage | With Mortgage |
| Less than $50,000 | 119 (23.5%) | 85 (13.4%) |
| $50,000 to $99,999 | 281 (55.4%) | 145 (22.8%) |
| $100,000 to $299,999 | 95 (18.7%) | 380 (59.8%) |
| $300,000 to $499,999 | 12 (2.4%) | 26 (4.1%) |
| $500,000 to $749,999 | 0 (0.0%) | 0 (0.0%) |
| $750,000 to $999,999 | 0 (0.0%) | 0 (0.0%) |
| $1,000,000 or more | 0 (0.0%) | 0 (0.0%) |
| Total | 507 (100.0%) | 636 (100.0%) |
Household Income by Mortgage Status in Perry
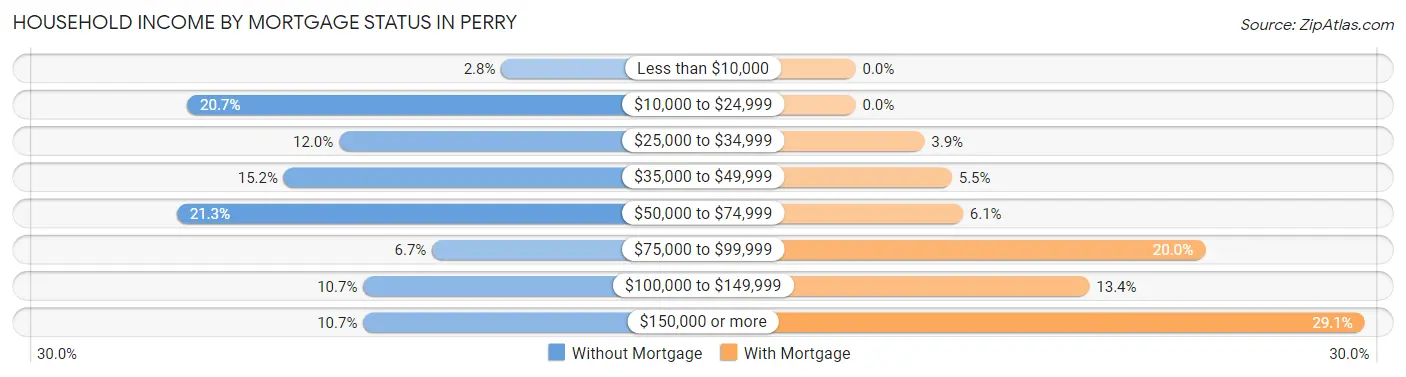
| Household Income | Without Mortgage | With Mortgage |
| Less than $10,000 | 14 (2.8%) | 0 (0.0%) |
| $10,000 to $24,999 | 105 (20.7%) | 0 (0.0%) |
| $25,000 to $34,999 | 61 (12.0%) | 25 (3.9%) |
| $35,000 to $49,999 | 77 (15.2%) | 35 (5.5%) |
| $50,000 to $74,999 | 108 (21.3%) | 39 (6.1%) |
| $75,000 to $99,999 | 34 (6.7%) | 127 (20.0%) |
| $100,000 to $149,999 | 54 (10.6%) | 85 (13.4%) |
| $150,000 or more | 54 (10.6%) | 185 (29.1%) |
| Total | 507 (100.0%) | 636 (100.0%) |
Property Value to Household Income Ratio in Perry
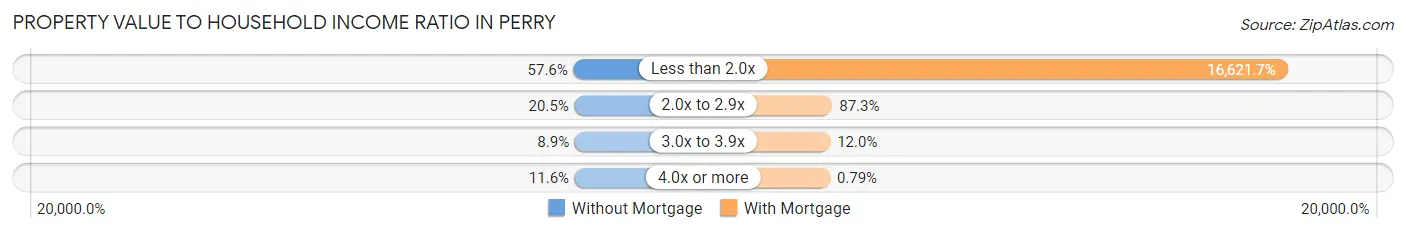
| Value-to-Income Ratio | Without Mortgage | With Mortgage |
| Less than 2.0x | 292 (57.6%) | 105,714 (16,621.7%) |
| 2.0x to 2.9x | 104 (20.5%) | 555 (87.3%) |
| 3.0x to 3.9x | 45 (8.9%) | 76 (11.9%) |
| 4.0x or more | 59 (11.6%) | 5 (0.8%) |
| Total | 507 (100.0%) | 636 (100.0%) |
Real Estate Taxes by Mortgage Status in Perry
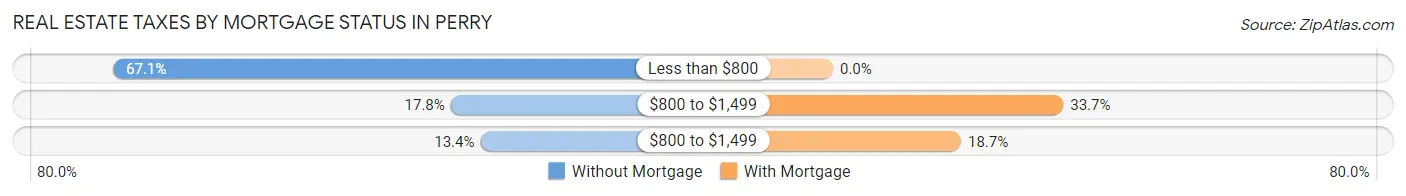
| Property Taxes | Without Mortgage | With Mortgage |
| Less than $800 | 340 (67.1%) | 0 (0.0%) |
| $800 to $1,499 | 90 (17.7%) | 214 (33.7%) |
| $800 to $1,499 | 68 (13.4%) | 119 (18.7%) |
| Total | 507 (100.0%) | 636 (100.0%) |
Health & Disability in Perry
Health Insurance Coverage by Age in Perry
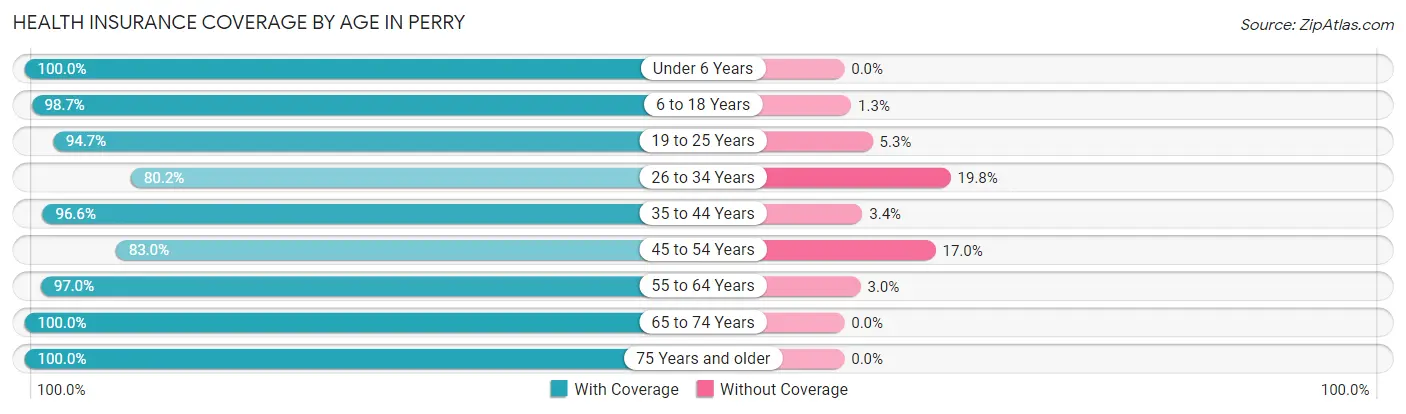
| Age Bracket | With Coverage | Without Coverage |
| Under 6 Years | 371 (100.0%) | 0 (0.0%) |
| 6 to 18 Years | 1,004 (98.7%) | 13 (1.3%) |
| 19 to 25 Years | 395 (94.7%) | 22 (5.3%) |
| 26 to 34 Years | 388 (80.2%) | 96 (19.8%) |
| 35 to 44 Years | 517 (96.6%) | 18 (3.4%) |
| 45 to 54 Years | 405 (83.0%) | 83 (17.0%) |
| 55 to 64 Years | 512 (97.0%) | 16 (3.0%) |
| 65 to 74 Years | 313 (100.0%) | 0 (0.0%) |
| 75 Years and older | 283 (100.0%) | 0 (0.0%) |
| Total | 4,188 (94.4%) | 248 (5.6%) |
Health Insurance Coverage by Citizenship Status in Perry
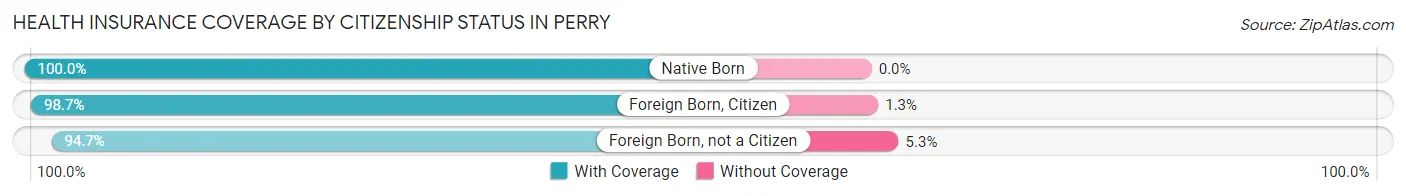
| Citizenship Status | With Coverage | Without Coverage |
| Native Born | 371 (100.0%) | 0 (0.0%) |
| Foreign Born, Citizen | 1,004 (98.7%) | 13 (1.3%) |
| Foreign Born, not a Citizen | 395 (94.7%) | 22 (5.3%) |
Health Insurance Coverage by Household Income in Perry
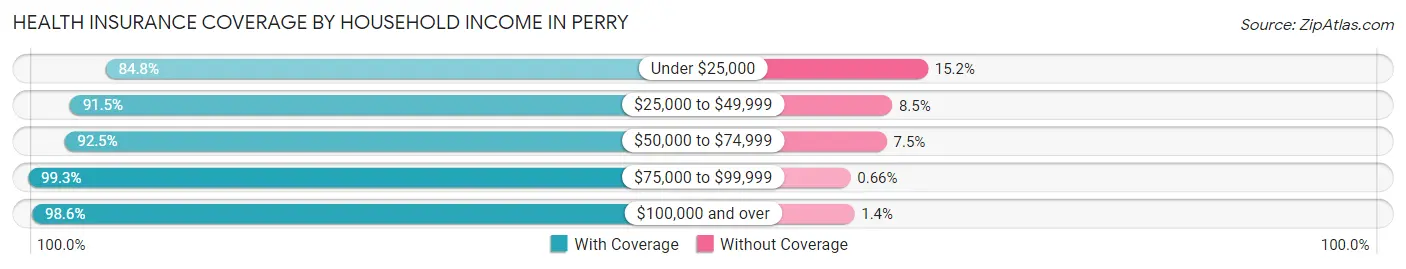
| Household Income | With Coverage | Without Coverage |
| Under $25,000 | 503 (84.8%) | 90 (15.2%) |
| $25,000 to $49,999 | 747 (91.5%) | 69 (8.5%) |
| $50,000 to $74,999 | 781 (92.5%) | 63 (7.5%) |
| $75,000 to $99,999 | 603 (99.3%) | 4 (0.7%) |
| $100,000 and over | 1,554 (98.6%) | 22 (1.4%) |
Public vs Private Health Insurance Coverage by Age in Perry
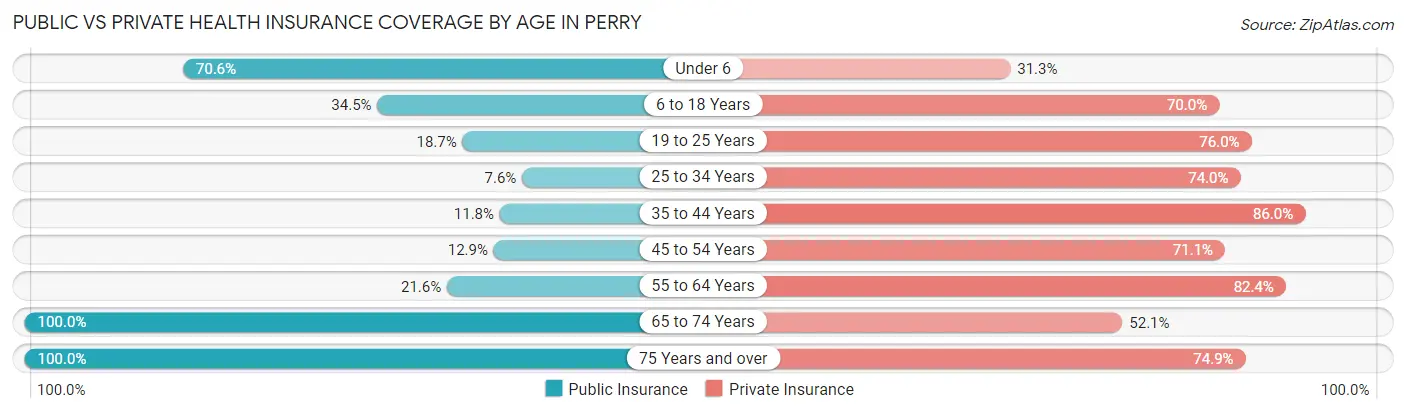
| Age Bracket | Public Insurance | Private Insurance |
| Under 6 | 262 (70.6%) | 116 (31.3%) |
| 6 to 18 Years | 351 (34.5%) | 712 (70.0%) |
| 19 to 25 Years | 78 (18.7%) | 317 (76.0%) |
| 25 to 34 Years | 37 (7.6%) | 358 (74.0%) |
| 35 to 44 Years | 63 (11.8%) | 460 (86.0%) |
| 45 to 54 Years | 63 (12.9%) | 347 (71.1%) |
| 55 to 64 Years | 114 (21.6%) | 435 (82.4%) |
| 65 to 74 Years | 313 (100.0%) | 163 (52.1%) |
| 75 Years and over | 283 (100.0%) | 212 (74.9%) |
| Total | 1,564 (35.3%) | 3,120 (70.3%) |
Disability Status by Sex by Age in Perry
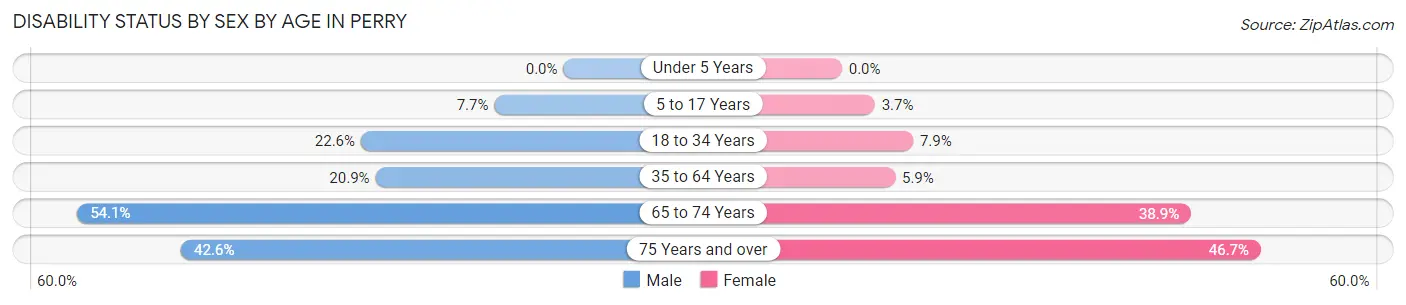
| Age Bracket | Male | Female |
| Under 5 Years | 0 (0.0%) | 0 (0.0%) |
| 5 to 17 Years | 42 (7.7%) | 18 (3.7%) |
| 18 to 34 Years | 106 (22.6%) | 39 (7.9%) |
| 35 to 64 Years | 180 (20.9%) | 41 (5.9%) |
| 65 to 74 Years | 72 (54.1%) | 70 (38.9%) |
| 75 Years and over | 63 (42.6%) | 63 (46.7%) |
Disability Class by Sex by Age in Perry
Disability Class: Hearing Difficulty
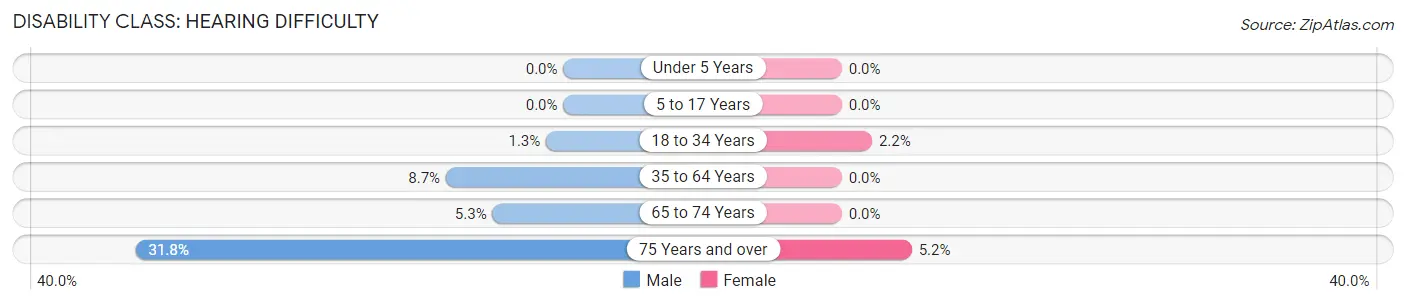
| Age Bracket | Male | Female |
| Under 5 Years | 0 (0.0%) | 0 (0.0%) |
| 5 to 17 Years | 0 (0.0%) | 0 (0.0%) |
| 18 to 34 Years | 6 (1.3%) | 11 (2.2%) |
| 35 to 64 Years | 75 (8.7%) | 0 (0.0%) |
| 65 to 74 Years | 7 (5.3%) | 0 (0.0%) |
| 75 Years and over | 47 (31.8%) | 7 (5.2%) |
Disability Class: Vision Difficulty
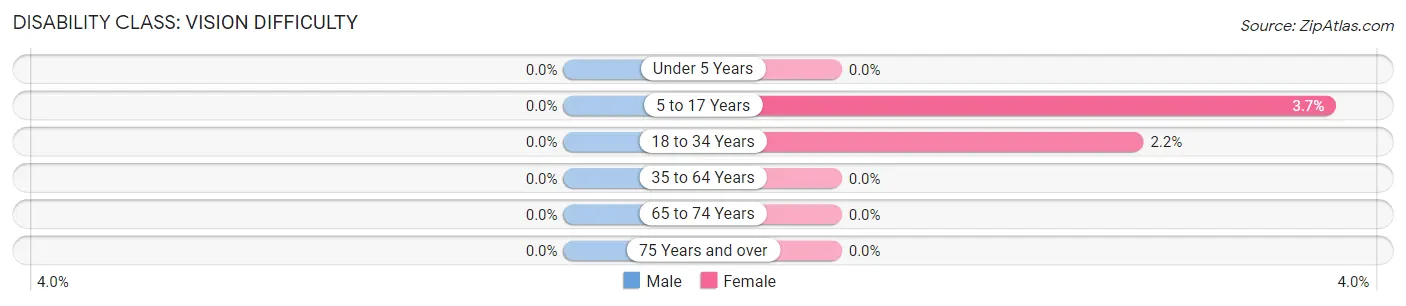
| Age Bracket | Male | Female |
| Under 5 Years | 0 (0.0%) | 0 (0.0%) |
| 5 to 17 Years | 0 (0.0%) | 18 (3.7%) |
| 18 to 34 Years | 0 (0.0%) | 11 (2.2%) |
| 35 to 64 Years | 0 (0.0%) | 0 (0.0%) |
| 65 to 74 Years | 0 (0.0%) | 0 (0.0%) |
| 75 Years and over | 0 (0.0%) | 0 (0.0%) |
Disability Class: Cognitive Difficulty
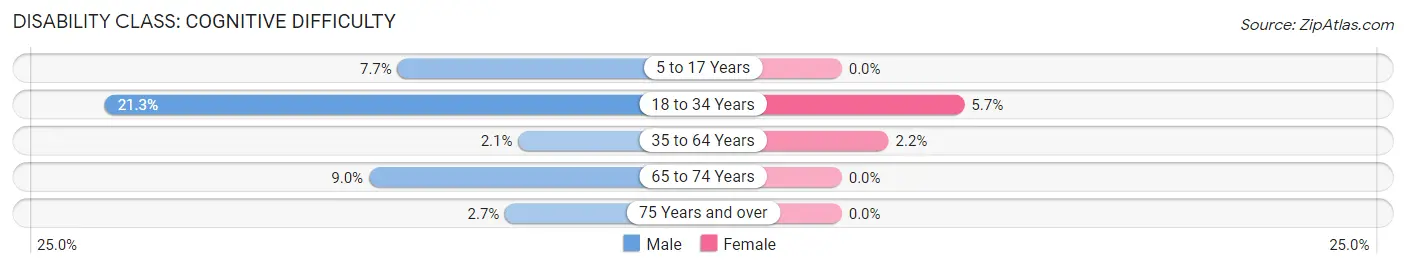
| Age Bracket | Male | Female |
| 5 to 17 Years | 42 (7.7%) | 0 (0.0%) |
| 18 to 34 Years | 100 (21.3%) | 28 (5.7%) |
| 35 to 64 Years | 18 (2.1%) | 15 (2.2%) |
| 65 to 74 Years | 12 (9.0%) | 0 (0.0%) |
| 75 Years and over | 4 (2.7%) | 0 (0.0%) |
Disability Class: Ambulatory Difficulty
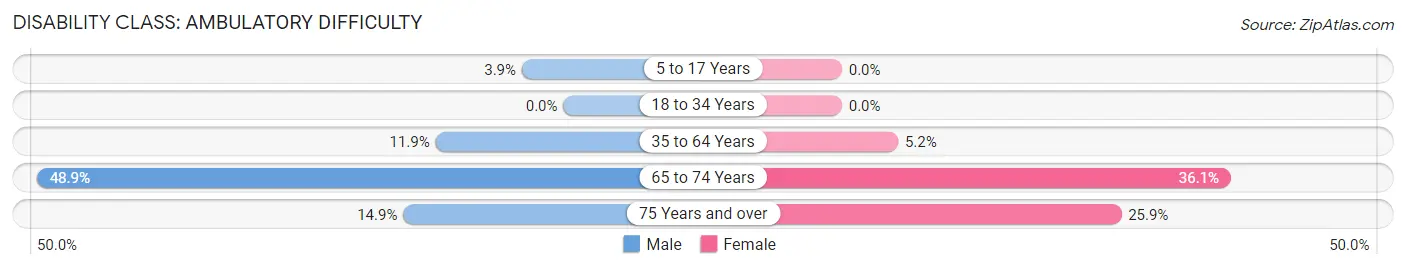
| Age Bracket | Male | Female |
| 5 to 17 Years | 21 (3.8%) | 0 (0.0%) |
| 18 to 34 Years | 0 (0.0%) | 0 (0.0%) |
| 35 to 64 Years | 102 (11.9%) | 36 (5.2%) |
| 65 to 74 Years | 65 (48.9%) | 65 (36.1%) |
| 75 Years and over | 22 (14.9%) | 35 (25.9%) |
Disability Class: Self-Care Difficulty
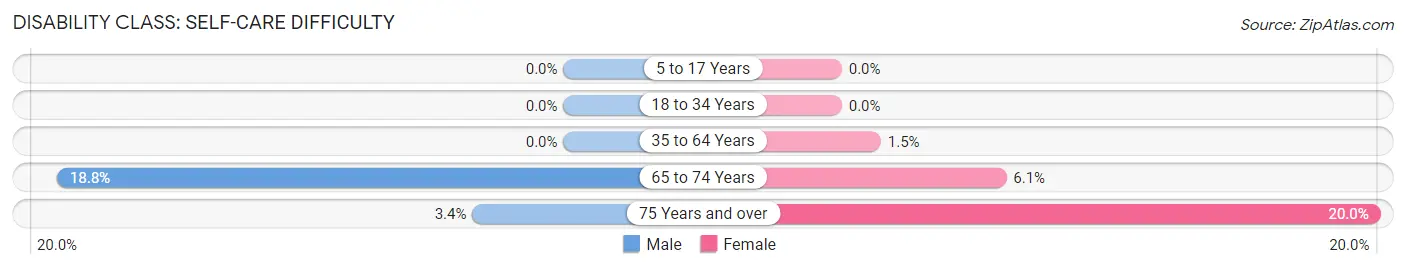
| Age Bracket | Male | Female |
| 5 to 17 Years | 0 (0.0%) | 0 (0.0%) |
| 18 to 34 Years | 0 (0.0%) | 0 (0.0%) |
| 35 to 64 Years | 0 (0.0%) | 10 (1.5%) |
| 65 to 74 Years | 25 (18.8%) | 11 (6.1%) |
| 75 Years and over | 5 (3.4%) | 27 (20.0%) |
Technology Access in Perry
Computing Device Access in Perry
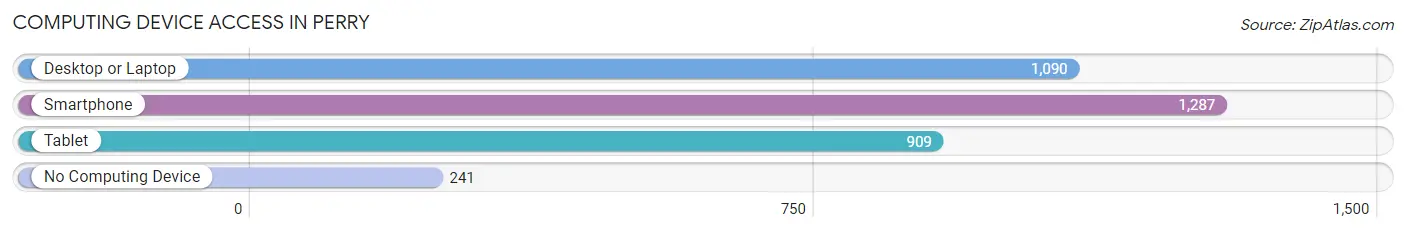
| Device Type | # Households | % Households |
| Desktop or Laptop | 1,090 | 68.4% |
| Smartphone | 1,287 | 80.8% |
| Tablet | 909 | 57.1% |
| No Computing Device | 241 | 15.1% |
| Total | 1,593 | 100.0% |
Internet Access in Perry
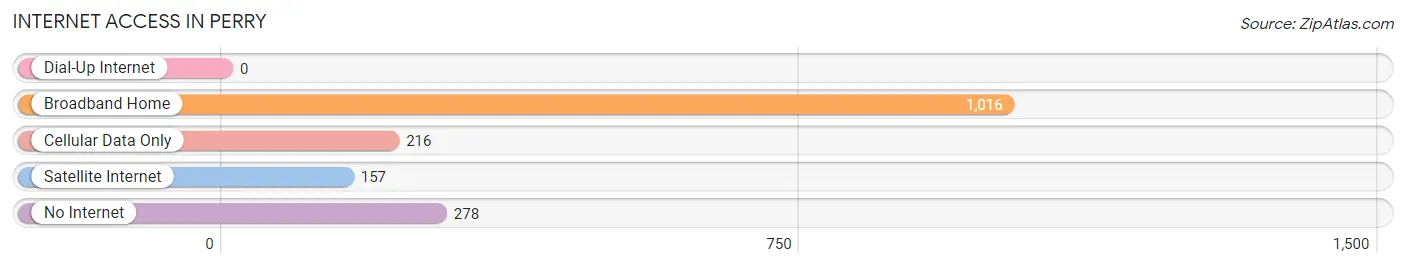
| Internet Type | # Households | % Households |
| Dial-Up Internet | 0 | 0.0% |
| Broadband Home | 1,016 | 63.8% |
| Cellular Data Only | 216 | 13.6% |
| Satellite Internet | 157 | 9.9% |
| No Internet | 278 | 17.4% |
| Total | 1,593 | 100.0% |
Perry Summary
Perry, Oklahoma is a small city located in Noble County, Oklahoma. It is situated in the north-central part of the state, approximately 70 miles north of Oklahoma City. The city has a population of approximately 5,000 people and is the county seat of Noble County.
History
Perry was founded in 1891 by the Santa Fe Railroad. The city was named after Perry Sipes, a railroad official. The city was incorporated in 1895 and was the first city in Noble County.
In the early 1900s, Perry was a thriving agricultural center. The city was home to several cotton gins, a flour mill, and a canning factory. The city also had a large number of businesses, including a bank, a hotel, and a newspaper.
In the 1920s, Perry experienced a period of growth and prosperity. The city was home to several oil and gas companies, and the population grew to over 5,000 people.
In the 1930s, the Great Depression hit Perry hard. Many businesses closed and the population declined. The city was able to recover in the 1940s and 1950s, and the population began to grow again.
Geography
Perry is located in the north-central part of Oklahoma, approximately 70 miles north of Oklahoma City. The city is situated in the Red Bed Plains region of the state, which is characterized by flat terrain and red-colored soil.
The city is located at the intersection of U.S. Highway 64 and State Highway 33. The nearest major cities are Oklahoma City, Tulsa, and Stillwater.
Economy
Perry’s economy is largely based on agriculture and oil and gas production. The city is home to several agricultural businesses, including a cotton gin, a flour mill, and a canning factory.
The city is also home to several oil and gas companies, including Chesapeake Energy, Devon Energy, and SandRidge Energy. These companies are responsible for much of the city’s economic growth.
In addition to agriculture and oil and gas production, Perry is home to several other businesses, including a bank, a hotel, and a newspaper.
Demographics
As of the 2010 census, Perry had a population of 5,126 people. The racial makeup of the city was 87.3% White, 8.2% Native American, 0.7% African American, 0.3% Asian, and 3.5% from other races.
The median household income in Perry was $35,945, and the median family income was $41,944. The per capita income was $17,845.
Conclusion
Perry, Oklahoma is a small city located in Noble County, Oklahoma. It is situated in the north-central part of the state, approximately 70 miles north of Oklahoma City. The city has a population of approximately 5,000 people and is the county seat of Noble County. Perry’s economy is largely based on agriculture and oil and gas production. The city is home to several agricultural businesses, including a cotton gin, a flour mill, and a canning factory. The city is also home to several oil and gas companies, including Chesapeake Energy, Devon Energy, and SandRidge Energy. As of the 2010 census, Perry had a population of 5,126 people. The racial makeup of the city was 87.3% White, 8.2% Native American, 0.7% African American, 0.3% Asian, and 3.5% from other races. The median household income in Perry was $35,945, and the median family income was $41,944. The per capita income was $17,845.
Common Questions
What is Per Capita Income in Perry?
Per Capita income in Perry is $29,817.
What is the Median Family Income in Perry?
Median Family Income in Perry is $74,821.
What is the Median Household income in Perry?
Median Household Income in Perry is $61,410.
What is Income or Wage Gap in Perry?
Income or Wage Gap in Perry is 29.5%.
Women in Perry earn 70.5 cents for every dollar earned by a man.
What is Family Income Deficit in Perry?
Family Income Deficit in Perry is $16,899.
Families that are below poverty line in Perry earn $16,899 less on average than the poverty threshold level.
What is Inequality or Gini Index in Perry?
Inequality or Gini Index in Perry is 0.41.
What is the Total Population of Perry?
Total Population of Perry is 4,526.
What is the Total Male Population of Perry?
Total Male Population of Perry is 2,325.
What is the Total Female Population of Perry?
Total Female Population of Perry is 2,201.
What is the Ratio of Males per 100 Females in Perry?
There are 105.63 Males per 100 Females in Perry.
What is the Ratio of Females per 100 Males in Perry?
There are 94.67 Females per 100 Males in Perry.
What is the Median Population Age in Perry?
Median Population Age in Perry is 34.4 Years.
What is the Average Family Size in Perry
Average Family Size in Perry is 3.5 People.
What is the Average Household Size in Perry
Average Household Size in Perry is 2.8 People.
How Large is the Labor Force in Perry?
There are 2,050 People in the Labor Forcein in Perry.
What is the Percentage of People in the Labor Force in Perry?
60.5% of People are in the Labor Force in Perry.
What is the Unemployment Rate in Perry?
Unemployment Rate in Perry is 2.7%.