Flint Creek, OK Map & Demographics
Flint Creek Map
Flint Creek Overview
$27,590
PER CAPITA INCOME
$52,159
AVG FAMILY INCOME
$47,460
AVG HOUSEHOLD INCOME
16.8%
WAGE / INCOME GAP [ % ]
83.2¢/ $1
WAGE / INCOME GAP [ $ ]
0.42
INEQUALITY / GINI INDEX
969
TOTAL POPULATION
414
MALE POPULATION
555
FEMALE POPULATION
74.59
MALES / 100 FEMALES
134.06
FEMALES / 100 MALES
46.6
MEDIAN AGE
3.2
AVG FAMILY SIZE
2.4
AVG HOUSEHOLD SIZE
358
LABOR FORCE [ PEOPLE ]
43.5%
PERCENT IN LABOR FORCE
5.0%
UNEMPLOYMENT RATE
Income in Flint Creek
Income Overview in Flint Creek
Per Capita Income in Flint Creek is $27,590, while median incomes of families and households are $52,159 and $47,460 respectively.
| Characteristic | Number | Measure |
| Per Capita Income | 969 | $27,590 |
| Median Family Income | 235 | $52,159 |
| Mean Family Income | 235 | $80,930 |
| Median Household Income | 406 | $47,460 |
| Mean Household Income | 406 | $64,962 |
| Income Deficit | 235 | $0 |
| Wage / Income Gap (%) | 969 | 16.84% |
| Wage / Income Gap ($) | 969 | 83.16¢ per $1 |
| Gini / Inequality Index | 969 | 0.42 |
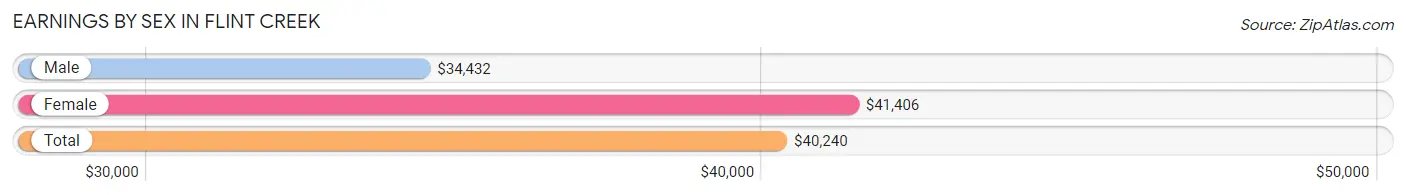
Earnings by Sex in Flint Creek
Average Earnings in Flint Creek are $40,240, $34,432 for men and $41,406 for women, a difference of 16.8%.
| Sex | Number | Average Earnings |
| Male | 183 (48.7%) | $34,432 |
| Female | 193 (51.3%) | $41,406 |
| Total | 376 (100.0%) | $40,240 |
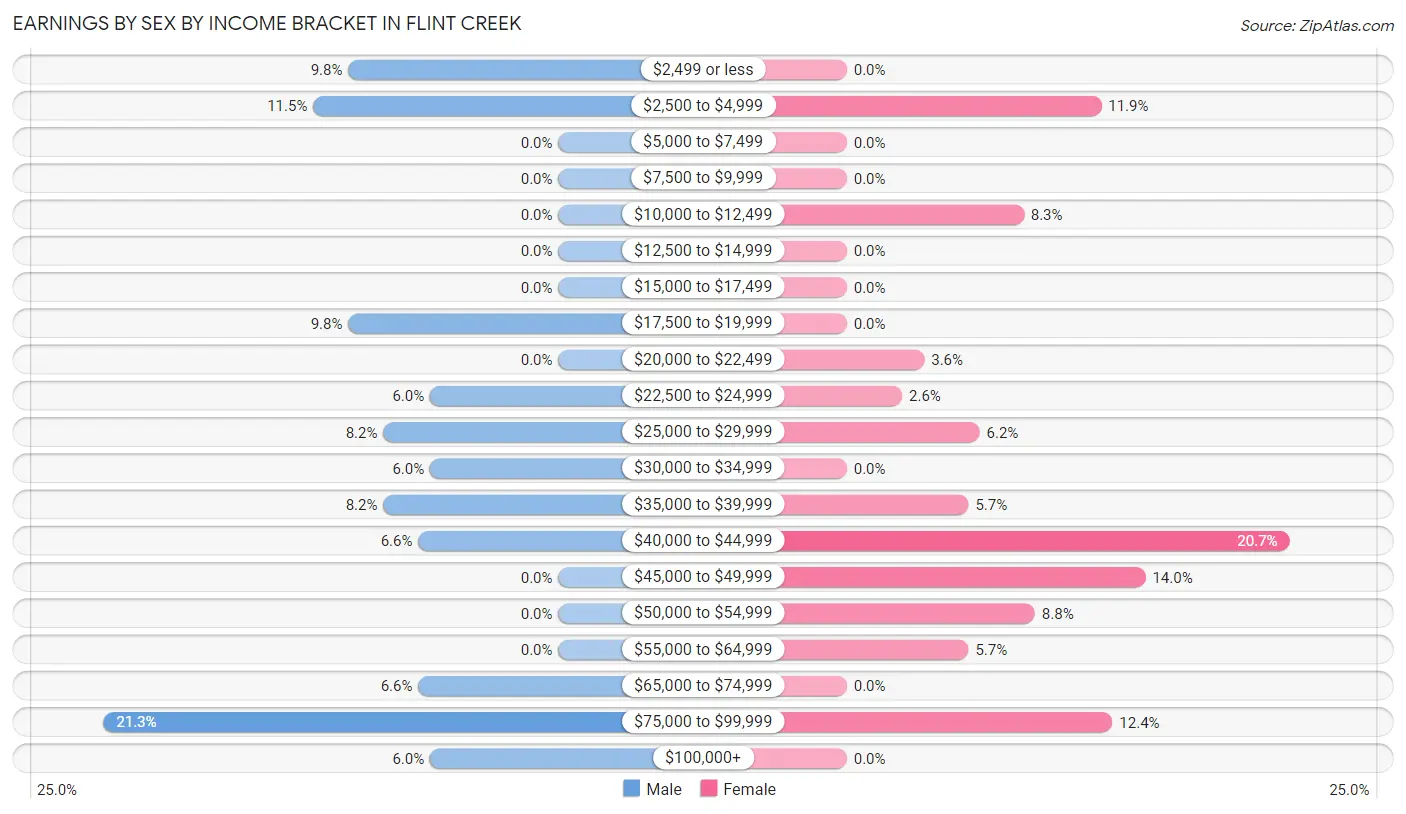
Earnings by Sex by Income Bracket in Flint Creek
The most common earnings brackets in Flint Creek are $75,000 to $99,999 for men (39 | 21.3%) and $40,000 to $44,999 for women (40 | 20.7%).
| Income | Male | Female |
| $2,499 or less | 18 (9.8%) | 0 (0.0%) |
| $2,500 to $4,999 | 21 (11.5%) | 23 (11.9%) |
| $5,000 to $7,499 | 0 (0.0%) | 0 (0.0%) |
| $7,500 to $9,999 | 0 (0.0%) | 0 (0.0%) |
| $10,000 to $12,499 | 0 (0.0%) | 16 (8.3%) |
| $12,500 to $14,999 | 0 (0.0%) | 0 (0.0%) |
| $15,000 to $17,499 | 0 (0.0%) | 0 (0.0%) |
| $17,500 to $19,999 | 18 (9.8%) | 0 (0.0%) |
| $20,000 to $22,499 | 0 (0.0%) | 7 (3.6%) |
| $22,500 to $24,999 | 11 (6.0%) | 5 (2.6%) |
| $25,000 to $29,999 | 15 (8.2%) | 12 (6.2%) |
| $30,000 to $34,999 | 11 (6.0%) | 0 (0.0%) |
| $35,000 to $39,999 | 15 (8.2%) | 11 (5.7%) |
| $40,000 to $44,999 | 12 (6.6%) | 40 (20.7%) |
| $45,000 to $49,999 | 0 (0.0%) | 27 (14.0%) |
| $50,000 to $54,999 | 0 (0.0%) | 17 (8.8%) |
| $55,000 to $64,999 | 0 (0.0%) | 11 (5.7%) |
| $65,000 to $74,999 | 12 (6.6%) | 0 (0.0%) |
| $75,000 to $99,999 | 39 (21.3%) | 24 (12.4%) |
| $100,000+ | 11 (6.0%) | 0 (0.0%) |
| Total | 183 (100.0%) | 193 (100.0%) |
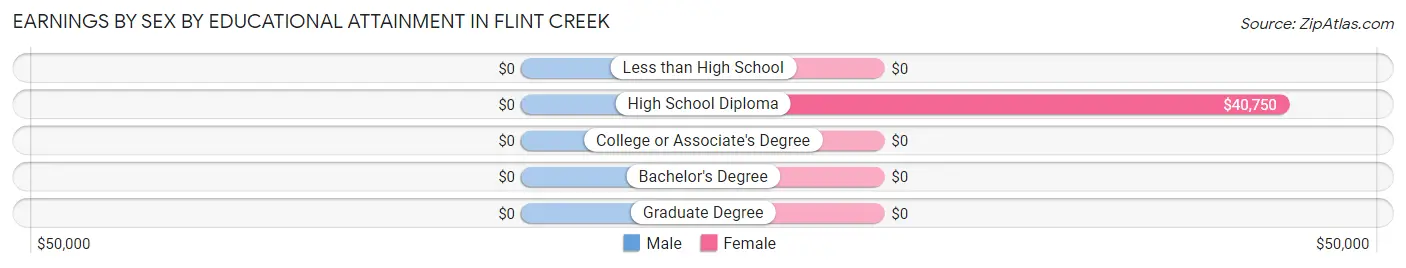
Earnings by Sex by Educational Attainment in Flint Creek
| Educational Attainment | Male Income | Female Income |
| Less than High School | - | - |
| High School Diploma | - | - |
| College or Associate's Degree | - | - |
| Bachelor's Degree | - | - |
| Graduate Degree | - | - |
| Total | $33,068 | $42,125 |
Family Income in Flint Creek
Family Income Brackets in Flint Creek
According to the Flint Creek family income data, there are 67 families falling into the $35,000 to $49,999 income range, which is the most common income bracket and makes up 28.5% of all families. Conversely, the $25,000 to $34,999 income bracket is the least frequent group with only 7 families (3.0%) belonging to this category.
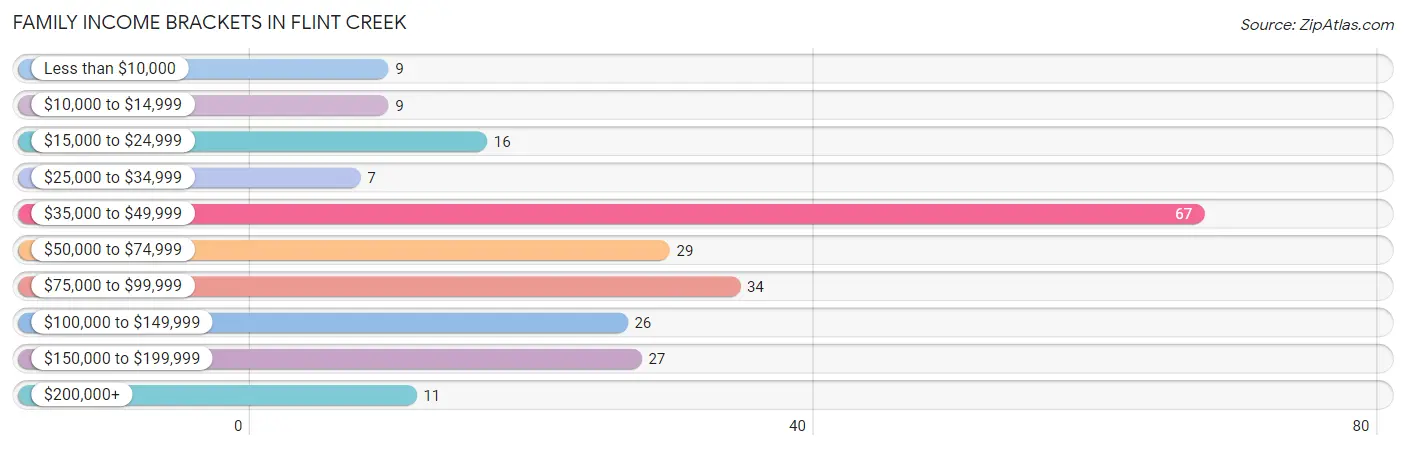
| Income Bracket | # Families | % Families |
| Less than $10,000 | 9 | 3.8% |
| $10,000 to $14,999 | 9 | 3.8% |
| $15,000 to $24,999 | 16 | 6.8% |
| $25,000 to $34,999 | 7 | 3.0% |
| $35,000 to $49,999 | 67 | 28.5% |
| $50,000 to $74,999 | 29 | 12.3% |
| $75,000 to $99,999 | 34 | 14.5% |
| $100,000 to $149,999 | 26 | 11.1% |
| $150,000 to $199,999 | 27 | 11.5% |
| $200,000+ | 11 | 4.7% |
Family Income by Famaliy Size in Flint Creek
2-person families (131 | 55.7%) account for the highest median family income in Flint Creek with $63,393 per family, while 2-person families (131 | 55.7%) have the highest median income of $31,696 per family member.
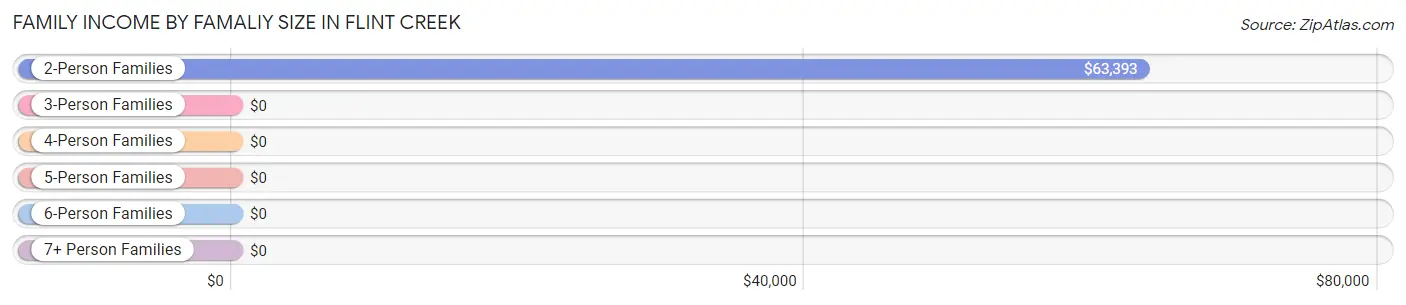
| Income Bracket | # Families | Median Income |
| 2-Person Families | 131 (55.7%) | $63,393 |
| 3-Person Families | 26 (11.1%) | $0 |
| 4-Person Families | 29 (12.3%) | $0 |
| 5-Person Families | 49 (20.8%) | $0 |
| 6-Person Families | 0 (0.0%) | $0 |
| 7+ Person Families | 0 (0.0%) | $0 |
| Total | 235 (100.0%) | $52,159 |
Family Income by Number of Earners in Flint Creek
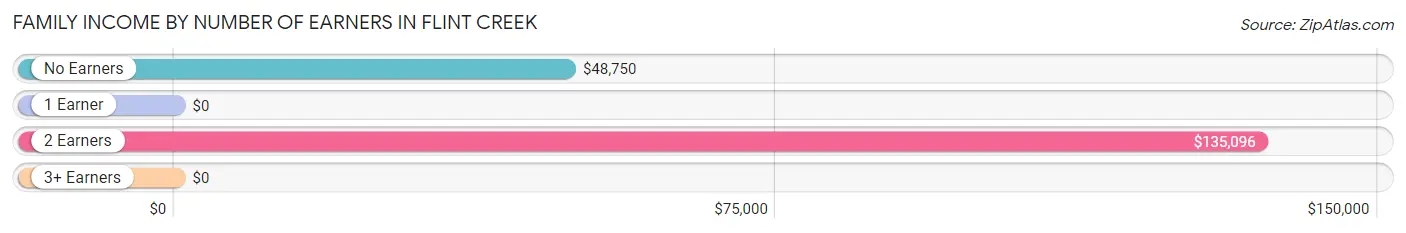
| Number of Earners | # Families | Median Income |
| No Earners | 73 (31.1%) | $48,750 |
| 1 Earner | 36 (15.3%) | $0 |
| 2 Earners | 126 (53.6%) | $135,096 |
| 3+ Earners | 0 (0.0%) | $0 |
| Total | 235 (100.0%) | $52,159 |
Household Income in Flint Creek
Household Income Brackets in Flint Creek
With 125 households falling in the category, the $35,000 to $49,999 income range is the most frequent in Flint Creek, accounting for 30.8% of all households. In contrast, only 9 households (2.2%) fall into the less than $10,000 income bracket, making it the least populous group.
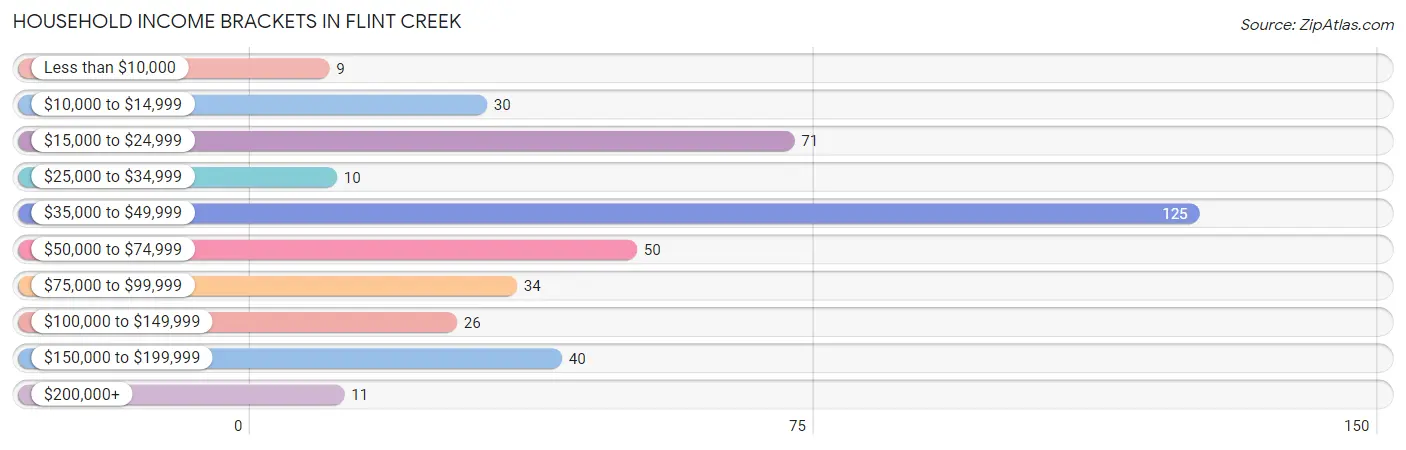
| Income Bracket | # Households | % Households |
| Less than $10,000 | 9 | 2.2% |
| $10,000 to $14,999 | 30 | 7.4% |
| $15,000 to $24,999 | 71 | 17.5% |
| $25,000 to $34,999 | 10 | 2.5% |
| $35,000 to $49,999 | 125 | 30.8% |
| $50,000 to $74,999 | 50 | 12.3% |
| $75,000 to $99,999 | 34 | 8.4% |
| $100,000 to $149,999 | 26 | 6.4% |
| $150,000 to $199,999 | 40 | 9.9% |
| $200,000+ | 11 | 2.7% |
Household Income by Householder Age in Flint Creek
The median household income in Flint Creek is $47,460, with the highest median household income of $47,470 found in the 45 to 64 years age bracket for the primary householder. A total of 105 households (25.9%) fall into this category.
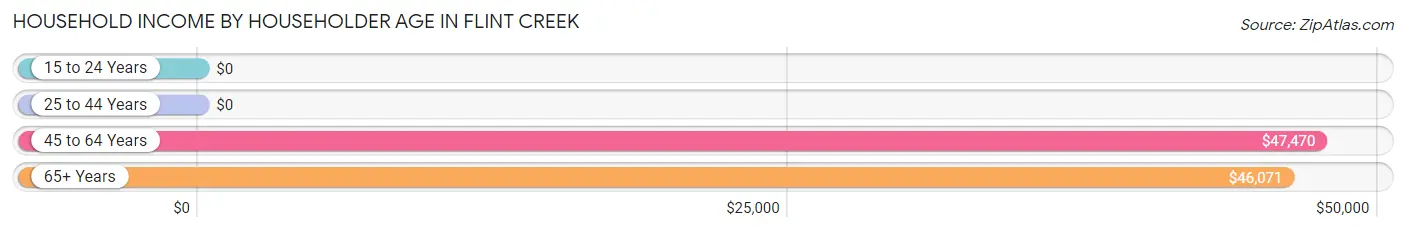
| Income Bracket | # Households | Median Income |
| 15 to 24 Years | 0 (0.0%) | $0 |
| 25 to 44 Years | 91 (22.4%) | $0 |
| 45 to 64 Years | 105 (25.9%) | $47,470 |
| 65+ Years | 210 (51.7%) | $46,071 |
| Total | 406 (100.0%) | $47,460 |
Poverty in Flint Creek
Income Below Poverty by Sex and Age in Flint Creek
With 22.2% poverty level for males and 34.8% for females among the residents of Flint Creek, under 5 year old males and 18 to 24 year old females are the most vulnerable to poverty, with 19 males (100.0%) and 36 females (100.0%) in their respective age groups living below the poverty level.
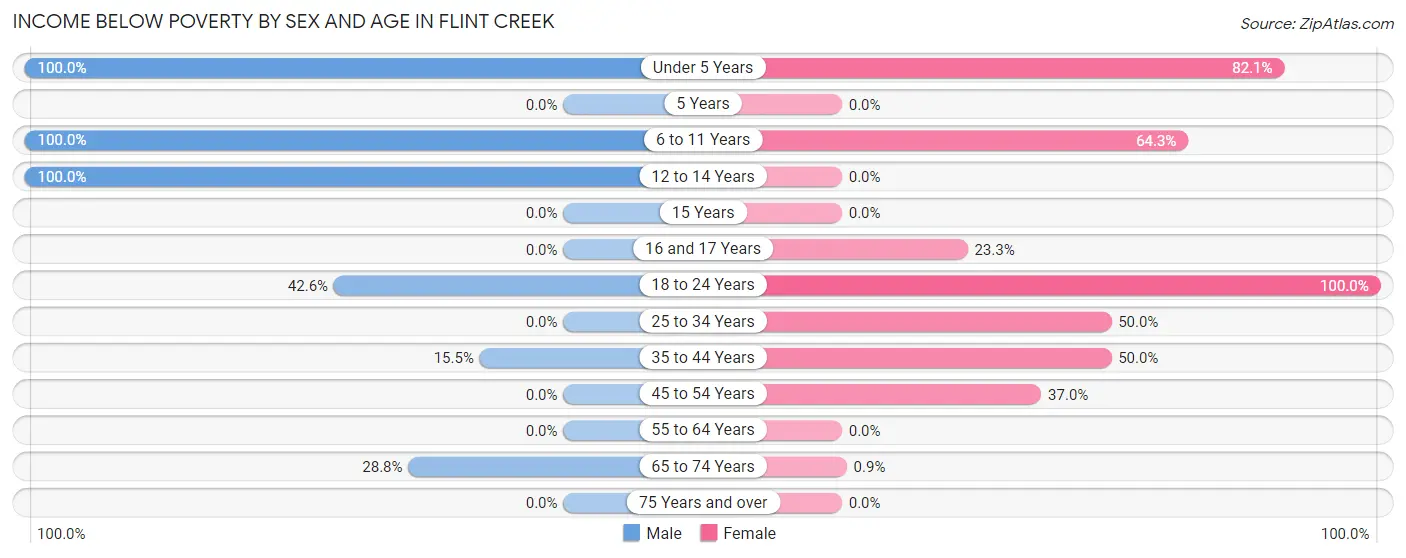
| Age Bracket | Male | Female |
| Under 5 Years | 19 (100.0%) | 46 (82.1%) |
| 5 Years | 0 (0.0%) | 0 (0.0%) |
| 6 to 11 Years | 9 (100.0%) | 18 (64.3%) |
| 12 to 14 Years | 11 (100.0%) | 0 (0.0%) |
| 15 Years | 0 (0.0%) | 0 (0.0%) |
| 16 and 17 Years | 0 (0.0%) | 14 (23.3%) |
| 18 to 24 Years | 23 (42.6%) | 36 (100.0%) |
| 25 to 34 Years | 0 (0.0%) | 16 (50.0%) |
| 35 to 44 Years | 9 (15.5%) | 25 (50.0%) |
| 45 to 54 Years | 0 (0.0%) | 37 (37.0%) |
| 55 to 64 Years | 0 (0.0%) | 0 (0.0%) |
| 65 to 74 Years | 21 (28.8%) | 1 (0.9%) |
| 75 Years and over | 0 (0.0%) | 0 (0.0%) |
| Total | 92 (22.2%) | 193 (34.8%) |
Income Above Poverty by Sex and Age in Flint Creek
According to the poverty statistics in Flint Creek, males aged 25 to 34 years and females aged 12 to 14 years are the age groups that are most secure financially, with 100.0% of males and 100.0% of females in these age groups living above the poverty line.
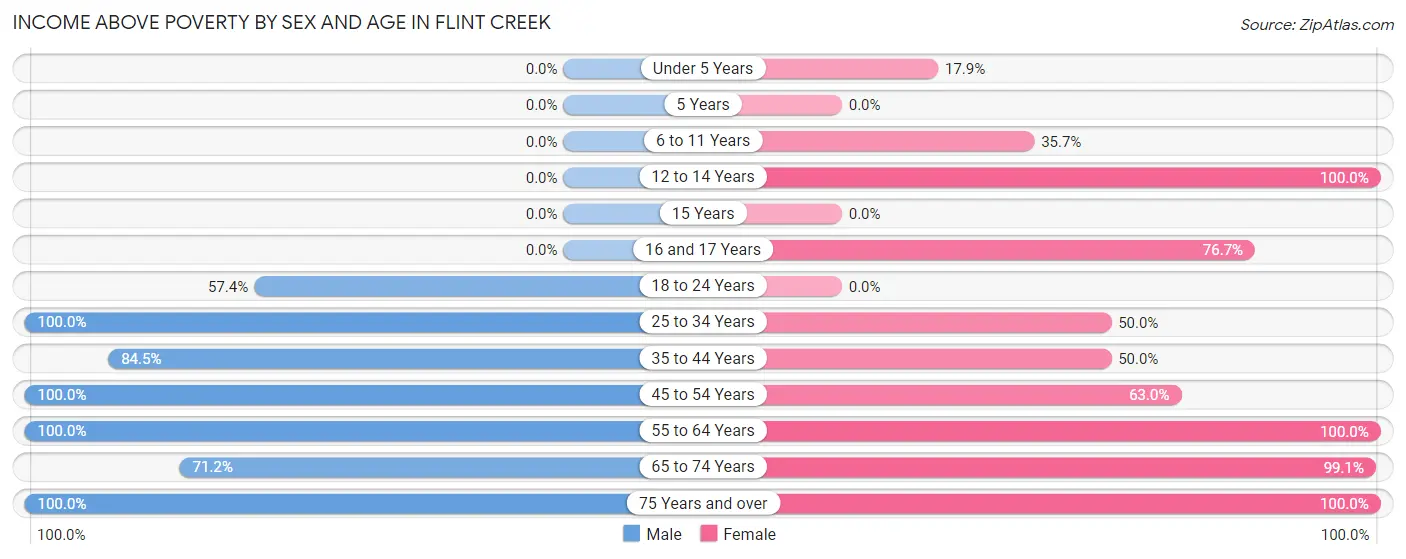
| Age Bracket | Male | Female |
| Under 5 Years | 0 (0.0%) | 10 (17.9%) |
| 5 Years | 0 (0.0%) | 0 (0.0%) |
| 6 to 11 Years | 0 (0.0%) | 10 (35.7%) |
| 12 to 14 Years | 0 (0.0%) | 23 (100.0%) |
| 15 Years | 0 (0.0%) | 0 (0.0%) |
| 16 and 17 Years | 0 (0.0%) | 46 (76.7%) |
| 18 to 24 Years | 31 (57.4%) | 0 (0.0%) |
| 25 to 34 Years | 28 (100.0%) | 16 (50.0%) |
| 35 to 44 Years | 49 (84.5%) | 25 (50.0%) |
| 45 to 54 Years | 38 (100.0%) | 63 (63.0%) |
| 55 to 64 Years | 62 (100.0%) | 28 (100.0%) |
| 65 to 74 Years | 52 (71.2%) | 110 (99.1%) |
| 75 Years and over | 62 (100.0%) | 31 (100.0%) |
| Total | 322 (77.8%) | 362 (65.2%) |
Income Below Poverty Among Married-Couple Families in Flint Creek
The poverty statistics for married-couple families in Flint Creek show that 4.4% or 9 of the total 203 families live below the poverty line. Families with 1 or 2 children have the highest poverty rate of 14.7%, comprising of 9 families. On the other hand, families with no children have the lowest poverty rate of 0.0%, which includes 0 families.
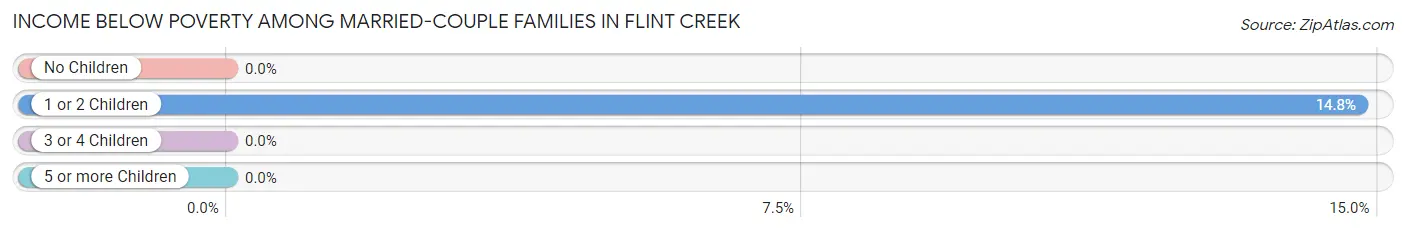
| Children | Above Poverty | Below Poverty |
| No Children | 142 (100.0%) | 0 (0.0%) |
| 1 or 2 Children | 52 (85.3%) | 9 (14.7%) |
| 3 or 4 Children | 0 (0.0%) | 0 (0.0%) |
| 5 or more Children | 0 (0.0%) | 0 (0.0%) |
| Total | 194 (95.6%) | 9 (4.4%) |
Income Below Poverty Among Single-Parent Households in Flint Creek
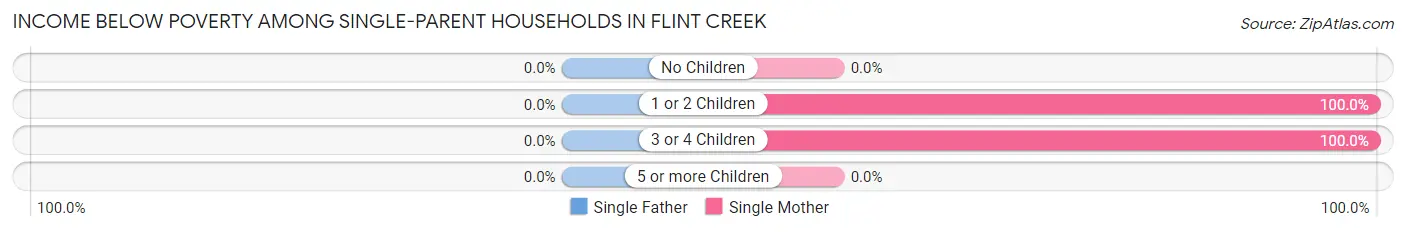
| Children | Single Father | Single Mother |
| No Children | 0 (0.0%) | 0 (0.0%) |
| 1 or 2 Children | 0 (0.0%) | 16 (100.0%) |
| 3 or 4 Children | 0 (0.0%) | 16 (100.0%) |
| 5 or more Children | 0 (0.0%) | 0 (0.0%) |
| Total | 0 (0.0%) | 32 (100.0%) |
Income Below Poverty Among Married-Couple vs Single-Parent Households in Flint Creek
The poverty data for Flint Creek shows that 9 of the married-couple family households (4.4%) and 32 of the single-parent households (100.0%) are living below the poverty level. Within the married-couple family households, those with 1 or 2 children have the highest poverty rate, with 9 households (14.7%) falling below the poverty line. Among the single-parent households, those with 1 or 2 children have the highest poverty rate, with 16 household (100.0%) living below poverty.
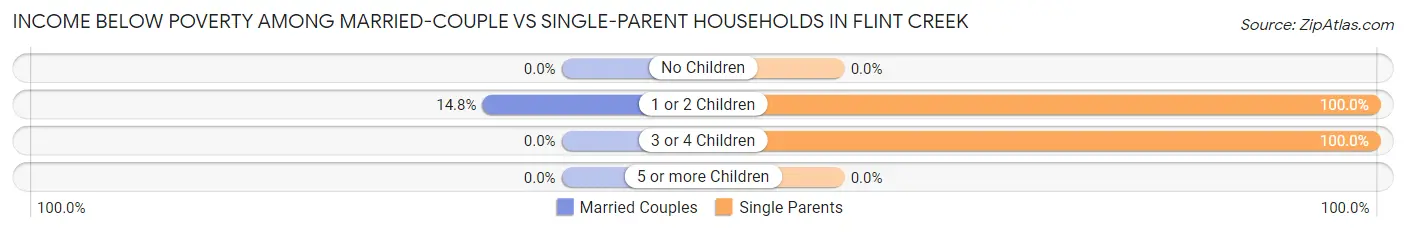
| Children | Married-Couple Families | Single-Parent Households |
| No Children | 0 (0.0%) | 0 (0.0%) |
| 1 or 2 Children | 9 (14.7%) | 16 (100.0%) |
| 3 or 4 Children | 0 (0.0%) | 16 (100.0%) |
| 5 or more Children | 0 (0.0%) | 0 (0.0%) |
| Total | 9 (4.4%) | 32 (100.0%) |
Race in Flint Creek
The most populous races in Flint Creek are White / Caucasian (686 | 70.8%), Two or more Races (144 | 14.9%), and Native / Alaskan (120 | 12.4%).
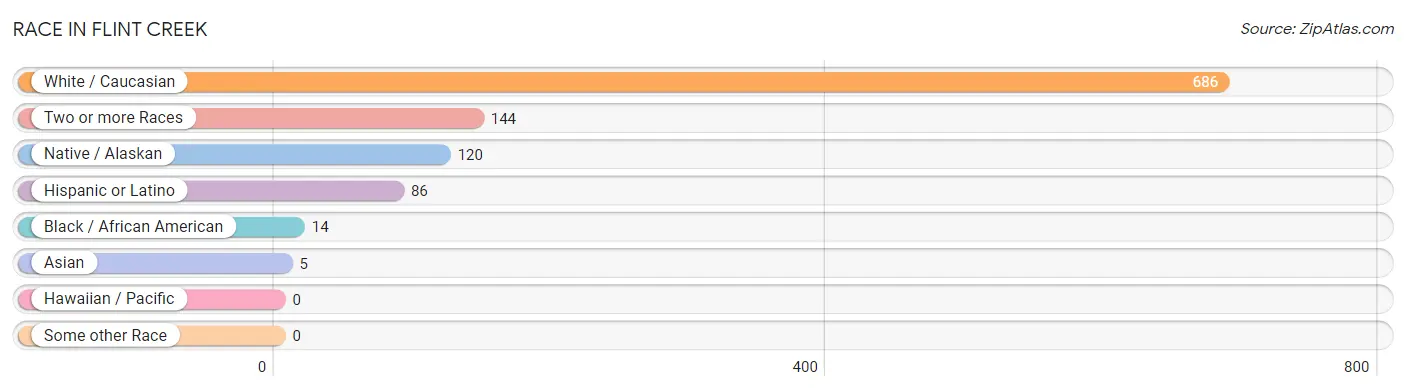
| Race | # Population | % Population |
| Asian | 5 | 0.5% |
| Black / African American | 14 | 1.4% |
| Hawaiian / Pacific | 0 | 0.0% |
| Hispanic or Latino | 86 | 8.9% |
| Native / Alaskan | 120 | 12.4% |
| White / Caucasian | 686 | 70.8% |
| Two or more Races | 144 | 14.9% |
| Some other Race | 0 | 0.0% |
| Total | 969 | 100.0% |
Ancestry in Flint Creek
The most populous ancestries reported in Flint Creek are Cherokee (257 | 26.5%), Irish (200 | 20.6%), English (110 | 11.4%), French (102 | 10.5%), and Mexican (86 | 8.9%), together accounting for 77.9% of all Flint Creek residents.
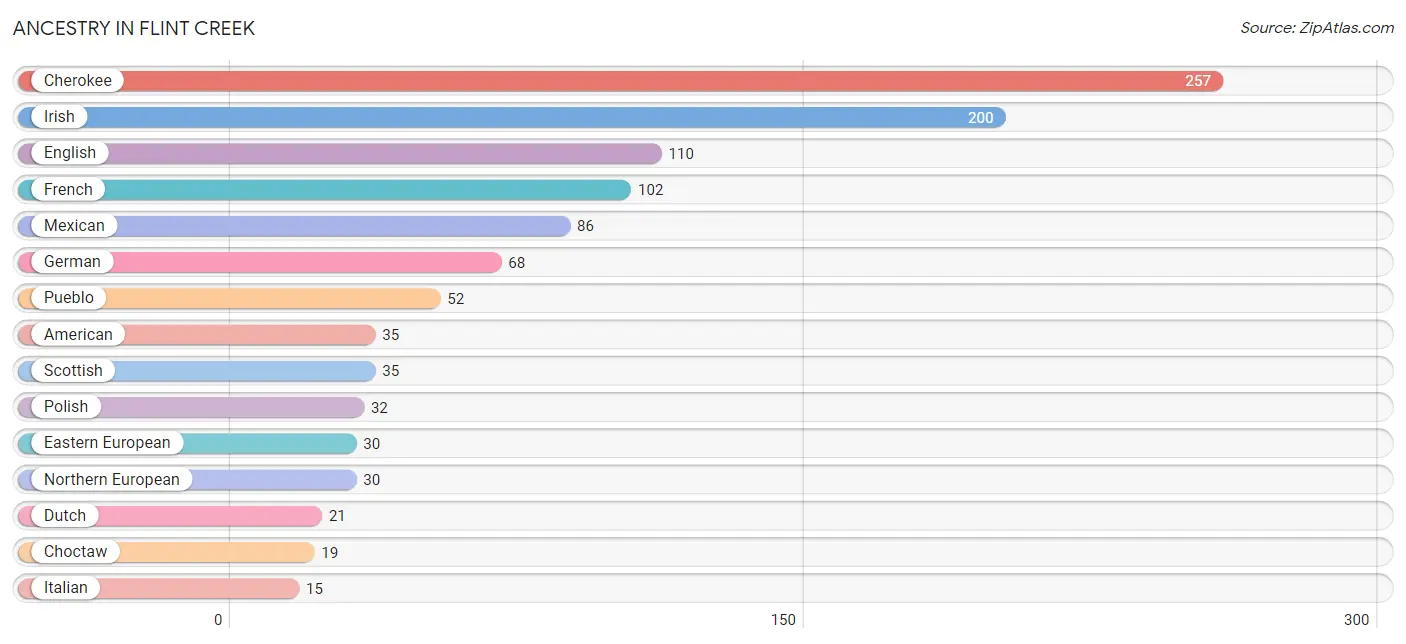
| Ancestry | # Population | % Population |
| American | 35 | 3.6% |
| Cherokee | 257 | 26.5% |
| Choctaw | 19 | 2.0% |
| Dutch | 21 | 2.2% |
| Eastern European | 30 | 3.1% |
| English | 110 | 11.4% |
| French | 102 | 10.5% |
| German | 68 | 7.0% |
| Irish | 200 | 20.6% |
| Italian | 15 | 1.5% |
| Korean | 5 | 0.5% |
| Mexican | 86 | 8.9% |
| Northern European | 30 | 3.1% |
| Polish | 32 | 3.3% |
| Pueblo | 52 | 5.4% |
| Scottish | 35 | 3.6% |
| Welsh | 12 | 1.2% | View All 17 Rows |
Immigrants in Flint Creek
The most numerous immigrant groups reported in Flint Creek came from Asia (5 | 0.5%), Philippines (5 | 0.5%), and South Eastern Asia (5 | 0.5%), together accounting for 1.6% of all Flint Creek residents.
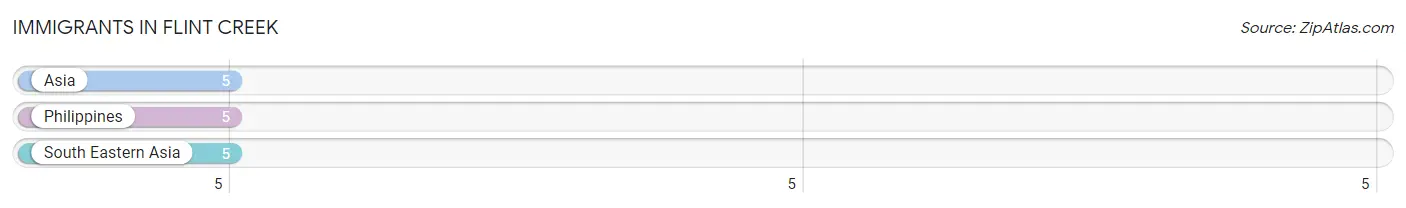
| Immigration Origin | # Population | % Population |
| Asia | 5 | 0.5% |
| Philippines | 5 | 0.5% |
| South Eastern Asia | 5 | 0.5% | View All 3 Rows |
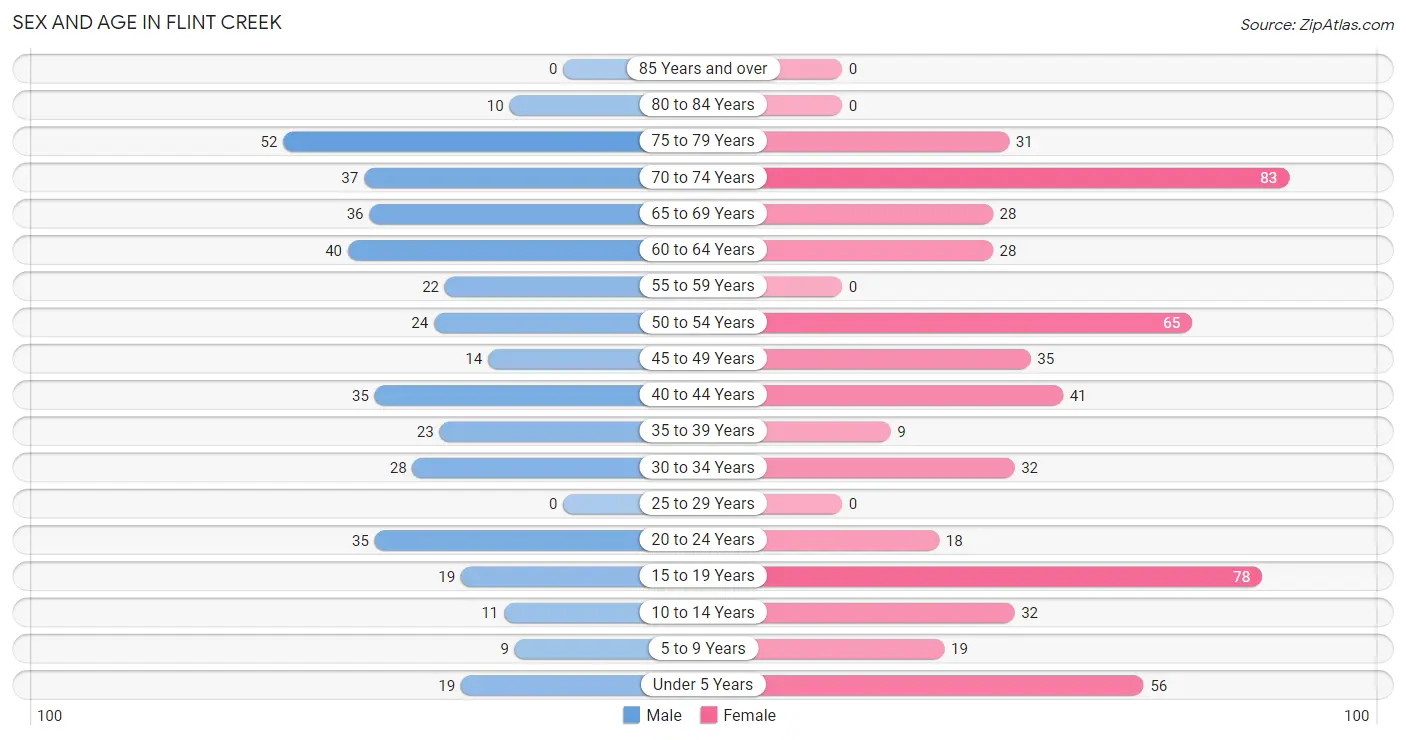
Sex and Age in Flint Creek
Sex and Age in Flint Creek
The most populous age groups in Flint Creek are 75 to 79 Years (52 | 12.6%) for men and 70 to 74 Years (83 | 14.9%) for women.
| Age Bracket | Male | Female |
| Under 5 Years | 19 (4.6%) | 56 (10.1%) |
| 5 to 9 Years | 9 (2.2%) | 19 (3.4%) |
| 10 to 14 Years | 11 (2.7%) | 32 (5.8%) |
| 15 to 19 Years | 19 (4.6%) | 78 (14.1%) |
| 20 to 24 Years | 35 (8.5%) | 18 (3.2%) |
| 25 to 29 Years | 0 (0.0%) | 0 (0.0%) |
| 30 to 34 Years | 28 (6.8%) | 32 (5.8%) |
| 35 to 39 Years | 23 (5.6%) | 9 (1.6%) |
| 40 to 44 Years | 35 (8.5%) | 41 (7.4%) |
| 45 to 49 Years | 14 (3.4%) | 35 (6.3%) |
| 50 to 54 Years | 24 (5.8%) | 65 (11.7%) |
| 55 to 59 Years | 22 (5.3%) | 0 (0.0%) |
| 60 to 64 Years | 40 (9.7%) | 28 (5.1%) |
| 65 to 69 Years | 36 (8.7%) | 28 (5.1%) |
| 70 to 74 Years | 37 (8.9%) | 83 (14.9%) |
| 75 to 79 Years | 52 (12.6%) | 31 (5.6%) |
| 80 to 84 Years | 10 (2.4%) | 0 (0.0%) |
| 85 Years and over | 0 (0.0%) | 0 (0.0%) |
| Total | 414 (100.0%) | 555 (100.0%) |
Families and Households in Flint Creek
Median Family Size in Flint Creek
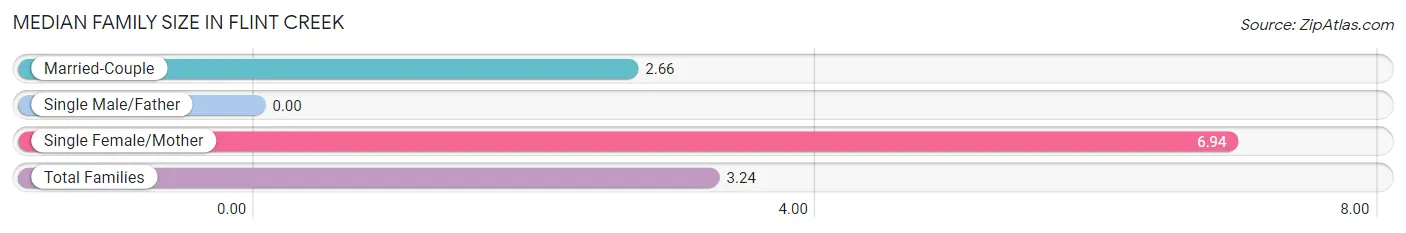
| Family Type | # Families | Family Size |
| Married-Couple | 203 (86.4%) | 2.66 |
| Single Male/Father | 0 (0.0%) | - |
| Single Female/Mother | 32 (13.6%) | 6.94 |
| Total Families | 235 (100.0%) | 3.24 |
Median Household Size in Flint Creek
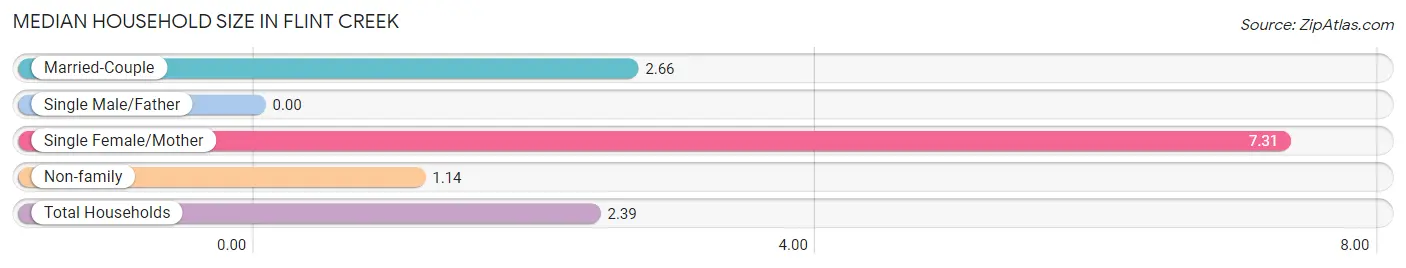
| Household Type | # Households | Household Size |
| Married-Couple | 203 (50.0%) | 2.66 |
| Single Male/Father | 0 (0.0%) | - |
| Single Female/Mother | 32 (7.9%) | 7.31 |
| Non-family | 171 (42.1%) | 1.14 |
| Total Households | 406 (100.0%) | 2.39 |
Household Size by Marriage Status in Flint Creek
Out of a total of 406 households in Flint Creek, 235 (57.9%) are family households, while 171 (42.1%) are nonfamily households. The most numerous type of family households are 2-person households, comprising 131, and the most common type of nonfamily households are 1-person households, comprising 157.
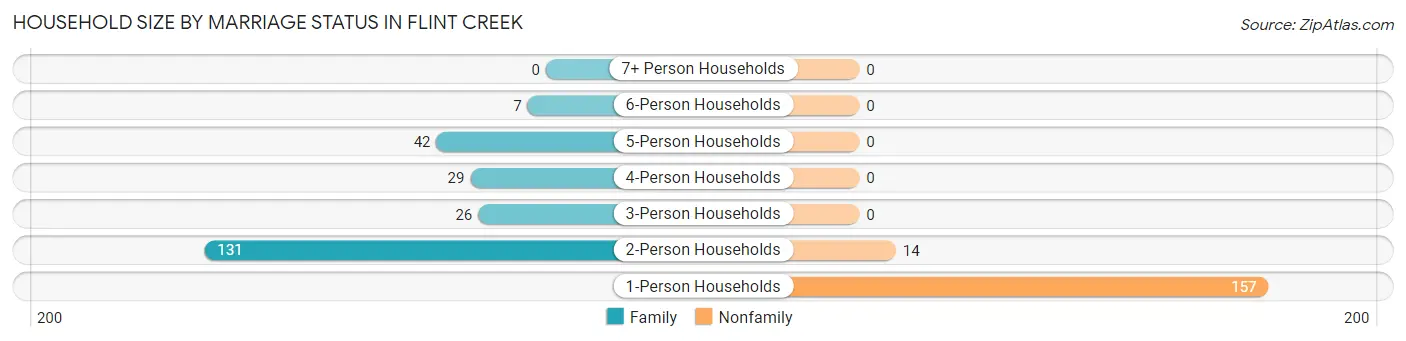
| Household Size | Family Households | Nonfamily Households |
| 1-Person Households | - | 157 (38.7%) |
| 2-Person Households | 131 (32.3%) | 14 (3.5%) |
| 3-Person Households | 26 (6.4%) | 0 (0.0%) |
| 4-Person Households | 29 (7.1%) | 0 (0.0%) |
| 5-Person Households | 42 (10.3%) | 0 (0.0%) |
| 6-Person Households | 7 (1.7%) | 0 (0.0%) |
| 7+ Person Households | 0 (0.0%) | 0 (0.0%) |
| Total | 235 (57.9%) | 171 (42.1%) |
Female Fertility in Flint Creek
Fertility by Age in Flint Creek
| Age Bracket | Women with Births | Births / 1,000 Women |
| 15 to 19 years | 0 (0.0%) | 0.0 |
| 20 to 34 years | 0 (0.0%) | 0.0 |
| 35 to 50 years | 0 (0.0%) | 0.0 |
| Total | 0 (0.0%) | 0.0 |
Fertility by Age by Marriage Status in Flint Creek
| Age Bracket | Married | Unmarried |
| 15 to 19 years | 0 (0.0%) | 0 (0.0%) |
| 20 to 34 years | 0 (0.0%) | 0 (0.0%) |
| 35 to 50 years | 0 (0.0%) | 0 (0.0%) |
| Total | 0 (0.0%) | 0 (0.0%) |
Fertility by Education in Flint Creek
| Educational Attainment | Women with Births | Births / 1,000 Women |
| Less than High School | 0 (0.0%) | 0.0 |
| High School Diploma | 0 (0.0%) | 0.0 |
| College or Associate's Degree | 0 (0.0%) | 0.0 |
| Bachelor's Degree | 0 (0.0%) | 0.0 |
| Graduate Degree | 0 (0.0%) | 0.0 |
| Total | 0 (0.0%) | 0.0 |
Fertility by Education by Marriage Status in Flint Creek
| Educational Attainment | Married | Unmarried |
| Less than High School | 0 (0.0%) | 0 (0.0%) |
| High School Diploma | 0 (0.0%) | 0 (0.0%) |
| College or Associate's Degree | 0 (0.0%) | 0 (0.0%) |
| Bachelor's Degree | 0 (0.0%) | 0 (0.0%) |
| Graduate Degree | 0 (0.0%) | 0 (0.0%) |
| Total | 0 (0.0%) | 0 (0.0%) |
Employment Characteristics in Flint Creek
Employment by Class of Employer in Flint Creek
Among the 340 employed individuals in Flint Creek, private company employees (152 | 44.7%), local government employees (77 | 22.7%), and federal government employees (35 | 10.3%) make up the most common classes of employment.
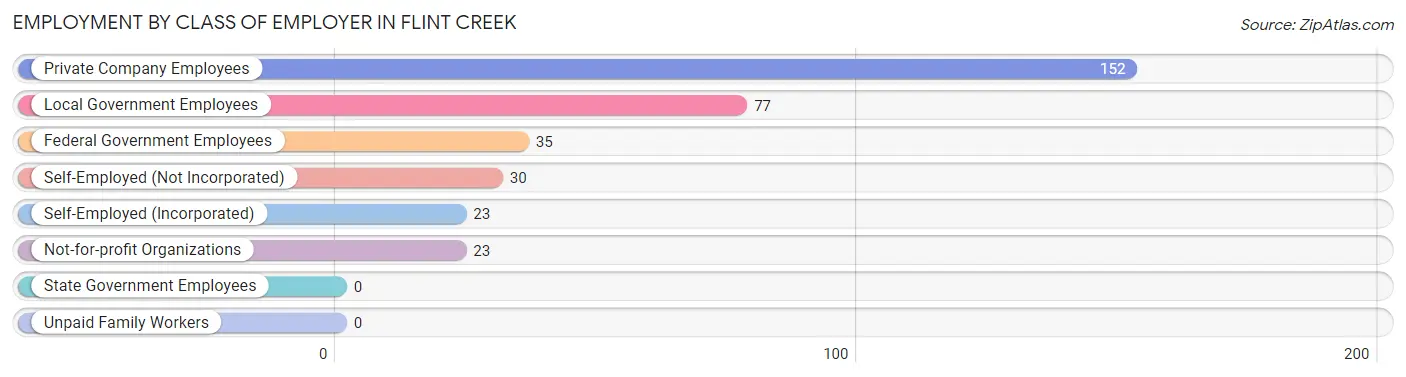
| Employer Class | # Employees | % Employees |
| Private Company Employees | 152 | 44.7% |
| Self-Employed (Incorporated) | 23 | 6.8% |
| Self-Employed (Not Incorporated) | 30 | 8.8% |
| Not-for-profit Organizations | 23 | 6.8% |
| Local Government Employees | 77 | 22.7% |
| State Government Employees | 0 | 0.0% |
| Federal Government Employees | 35 | 10.3% |
| Unpaid Family Workers | 0 | 0.0% |
| Total | 340 | 100.0% |
Employment Status by Age in Flint Creek
According to the labor force statistics for Flint Creek, out of the total population over 16 years of age (823), 43.5% or 358 individuals are in the labor force, with 5.0% or 18 of them unemployed. The age group with the highest labor force participation rate is 35 to 44 years, with 85.2% or 92 individuals in the labor force. Within the labor force, the 35 to 44 years age range has the highest percentage of unemployed individuals, with 19.6% or 18 of them being unemployed.
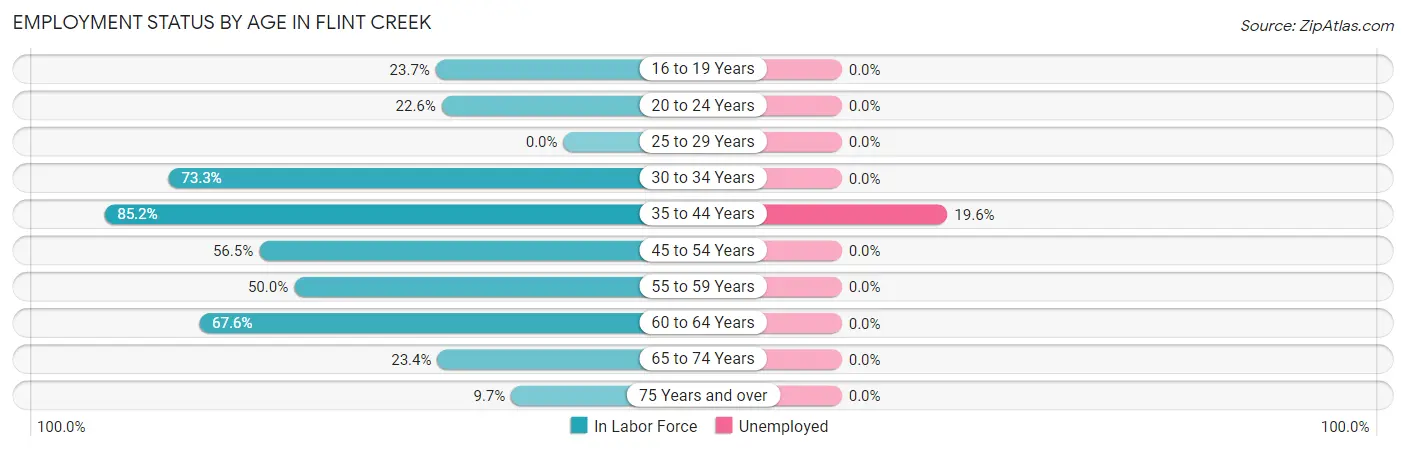
| Age Bracket | In Labor Force | Unemployed |
| 16 to 19 Years | 23 (23.7%) | 0 (0.0%) |
| 20 to 24 Years | 12 (22.6%) | 0 (0.0%) |
| 25 to 29 Years | 0 (0.0%) | 0 (0.0%) |
| 30 to 34 Years | 44 (73.3%) | 0 (0.0%) |
| 35 to 44 Years | 92 (85.2%) | 18 (19.6%) |
| 45 to 54 Years | 78 (56.5%) | 0 (0.0%) |
| 55 to 59 Years | 11 (50.0%) | 0 (0.0%) |
| 60 to 64 Years | 46 (67.6%) | 0 (0.0%) |
| 65 to 74 Years | 43 (23.4%) | 0 (0.0%) |
| 75 Years and over | 9 (9.7%) | 0 (0.0%) |
| Total | 358 (43.5%) | 18 (5.0%) |
Employment Status by Educational Attainment in Flint Creek
According to labor force statistics for Flint Creek, 68.4% of individuals (271) out of the total population between 25 and 64 years of age (396) are in the labor force, with 6.6% or 18 of them being unemployed. The group with the highest labor force participation rate are those with the educational attainment of high school diploma, with 78.5% or 84 individuals in the labor force. Within the labor force, individuals with bachelor's degree or higher education have the highest percentage of unemployment, with 11.8% or 9 of them being unemployed.
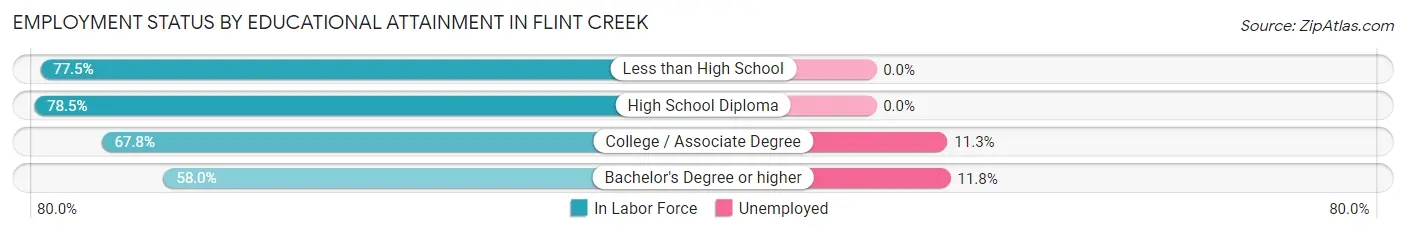
| Educational Attainment | In Labor Force | Unemployed |
| Less than High School | 31 (77.5%) | 0 (0.0%) |
| High School Diploma | 84 (78.5%) | 0 (0.0%) |
| College / Associate Degree | 80 (67.8%) | 13 (11.3%) |
| Bachelor's Degree or higher | 76 (58.0%) | 15 (11.8%) |
| Total | 271 (68.4%) | 26 (6.6%) |
Employment Occupations by Sex in Flint Creek
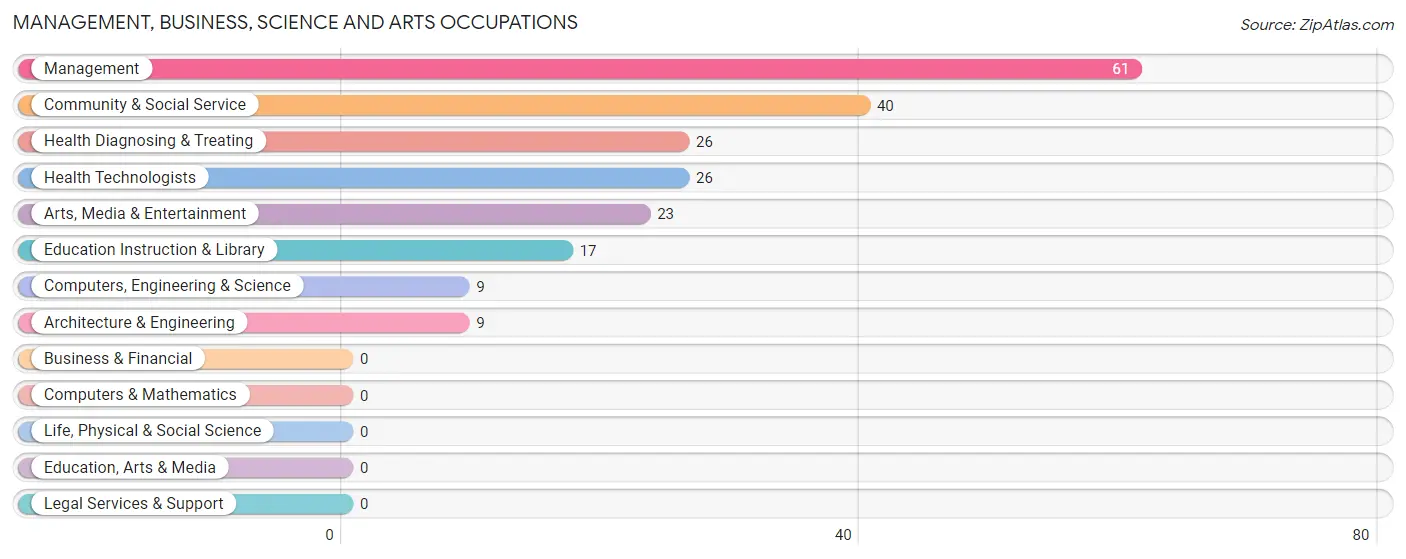
Management, Business, Science and Arts Occupations
The most common Management, Business, Science and Arts occupations in Flint Creek are Management (61 | 17.9%), Community & Social Service (40 | 11.8%), Health Diagnosing & Treating (26 | 7.6%), Health Technologists (26 | 7.6%), and Arts, Media & Entertainment (23 | 6.8%).
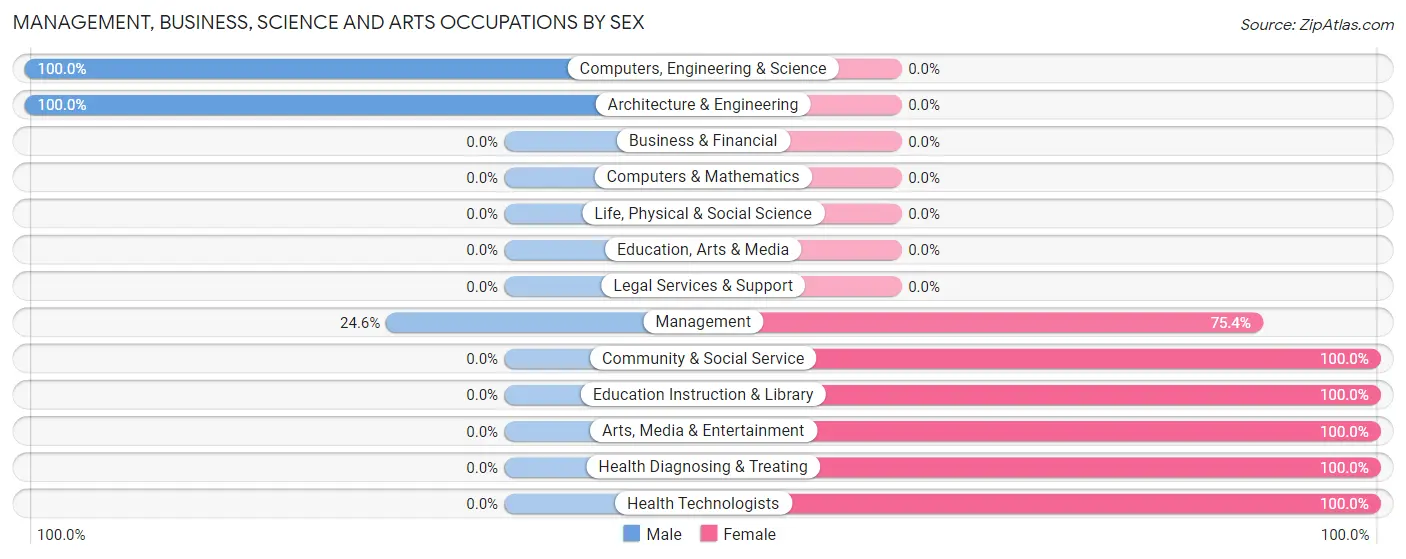
Management, Business, Science and Arts Occupations by Sex
Within the Management, Business, Science and Arts occupations in Flint Creek, the most male-oriented occupations are Computers, Engineering & Science (100.0%), Architecture & Engineering (100.0%), and Management (24.6%), while the most female-oriented occupations are Community & Social Service (100.0%), Education Instruction & Library (100.0%), and Arts, Media & Entertainment (100.0%).
| Occupation | Male | Female |
| Management | 15 (24.6%) | 46 (75.4%) |
| Business & Financial | 0 (0.0%) | 0 (0.0%) |
| Computers, Engineering & Science | 9 (100.0%) | 0 (0.0%) |
| Computers & Mathematics | 0 (0.0%) | 0 (0.0%) |
| Architecture & Engineering | 9 (100.0%) | 0 (0.0%) |
| Life, Physical & Social Science | 0 (0.0%) | 0 (0.0%) |
| Community & Social Service | 0 (0.0%) | 40 (100.0%) |
| Education, Arts & Media | 0 (0.0%) | 0 (0.0%) |
| Legal Services & Support | 0 (0.0%) | 0 (0.0%) |
| Education Instruction & Library | 0 (0.0%) | 17 (100.0%) |
| Arts, Media & Entertainment | 0 (0.0%) | 23 (100.0%) |
| Health Diagnosing & Treating | 0 (0.0%) | 26 (100.0%) |
| Health Technologists | 0 (0.0%) | 26 (100.0%) |
| Total (Category) | 24 (17.6%) | 112 (82.4%) |
| Total (Overall) | 163 (47.9%) | 177 (52.1%) |
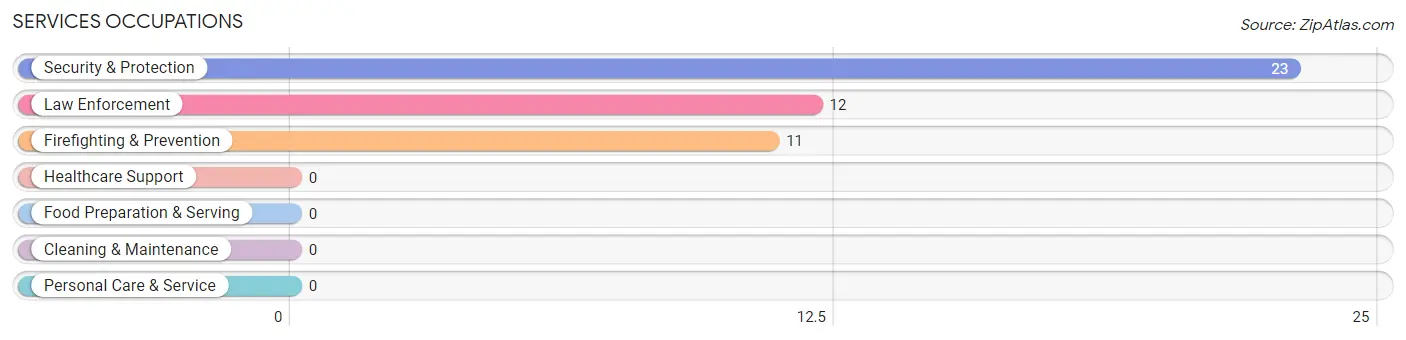
Services Occupations
The most common Services occupations in Flint Creek are Security & Protection (23 | 6.8%), Law Enforcement (12 | 3.5%), and Firefighting & Prevention (11 | 3.2%).
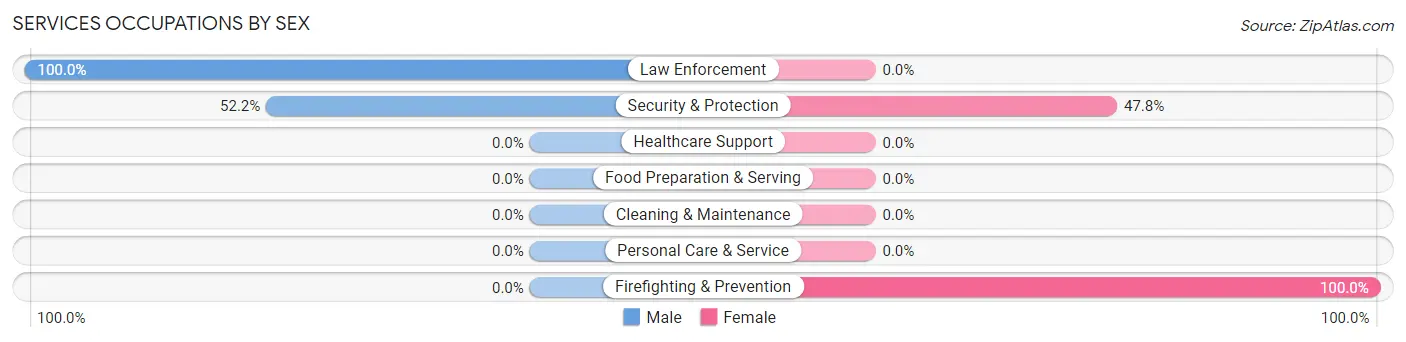
Services Occupations by Sex
Within the Services occupations in Flint Creek, the most male-oriented occupations are Law Enforcement (100.0%), and Security & Protection (52.2%), while the most female-oriented occupations are Firefighting & Prevention (100.0%), and Security & Protection (47.8%).
| Occupation | Male | Female |
| Healthcare Support | 0 (0.0%) | 0 (0.0%) |
| Security & Protection | 12 (52.2%) | 11 (47.8%) |
| Firefighting & Prevention | 0 (0.0%) | 11 (100.0%) |
| Law Enforcement | 12 (100.0%) | 0 (0.0%) |
| Food Preparation & Serving | 0 (0.0%) | 0 (0.0%) |
| Cleaning & Maintenance | 0 (0.0%) | 0 (0.0%) |
| Personal Care & Service | 0 (0.0%) | 0 (0.0%) |
| Total (Category) | 12 (52.2%) | 11 (47.8%) |
| Total (Overall) | 163 (47.9%) | 177 (52.1%) |
Sales and Office Occupations
The most common Sales and Office occupations in Flint Creek are Office & Administration (33 | 9.7%), and Sales & Related (26 | 7.6%).
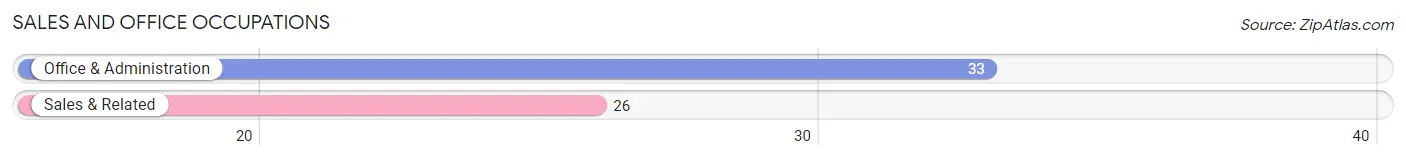
Sales and Office Occupations by Sex
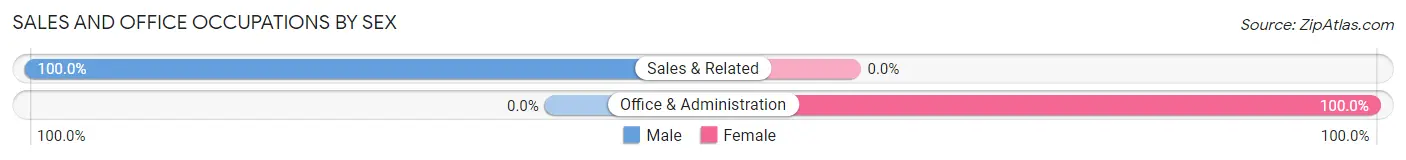
| Occupation | Male | Female |
| Sales & Related | 26 (100.0%) | 0 (0.0%) |
| Office & Administration | 0 (0.0%) | 33 (100.0%) |
| Total (Category) | 26 (44.1%) | 33 (55.9%) |
| Total (Overall) | 163 (47.9%) | 177 (52.1%) |
Natural Resources, Construction and Maintenance Occupations
The most common Natural Resources, Construction and Maintenance occupations in Flint Creek are , and Construction & Extraction (21 | 6.2%).
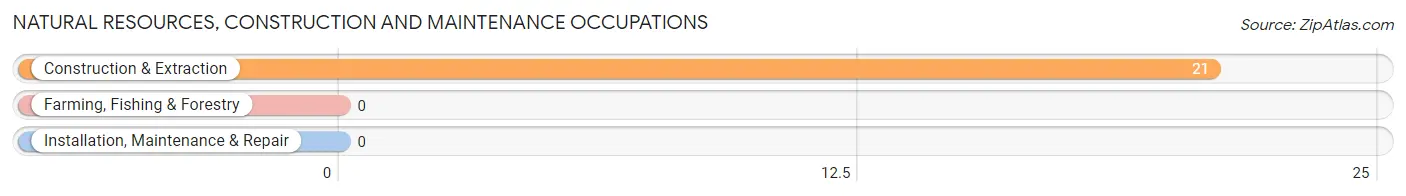
Natural Resources, Construction and Maintenance Occupations by Sex
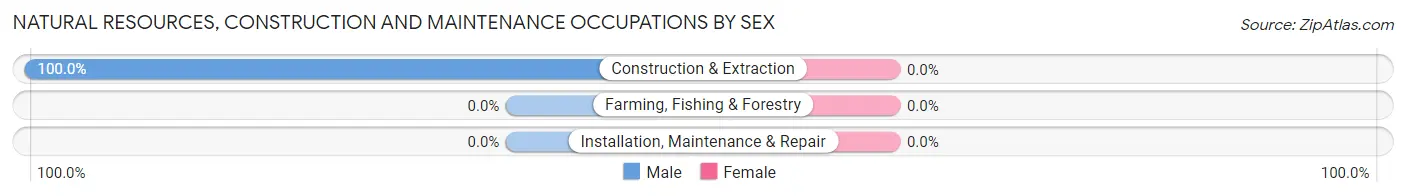
| Occupation | Male | Female |
| Farming, Fishing & Forestry | 0 (0.0%) | 0 (0.0%) |
| Construction & Extraction | 21 (100.0%) | 0 (0.0%) |
| Installation, Maintenance & Repair | 0 (0.0%) | 0 (0.0%) |
| Total (Category) | 21 (100.0%) | 0 (0.0%) |
| Total (Overall) | 163 (47.9%) | 177 (52.1%) |
Production, Transportation and Moving Occupations
The most common Production, Transportation and Moving occupations in Flint Creek are Production (88 | 25.9%), and Transportation (13 | 3.8%).
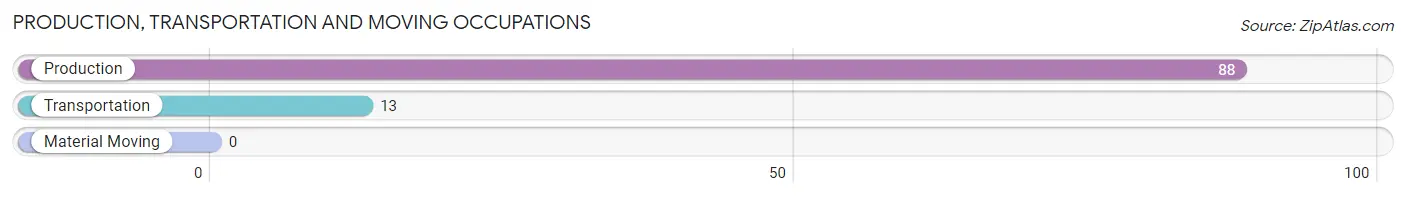
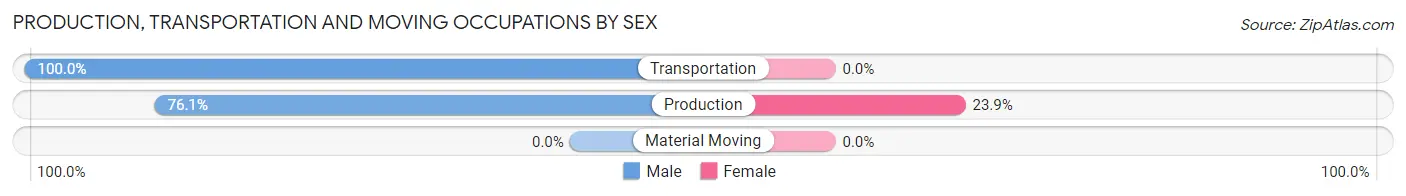
Production, Transportation and Moving Occupations by Sex
| Occupation | Male | Female |
| Production | 67 (76.1%) | 21 (23.9%) |
| Transportation | 13 (100.0%) | 0 (0.0%) |
| Material Moving | 0 (0.0%) | 0 (0.0%) |
| Total (Category) | 80 (79.2%) | 21 (20.8%) |
| Total (Overall) | 163 (47.9%) | 177 (52.1%) |
Employment Industries by Sex in Flint Creek
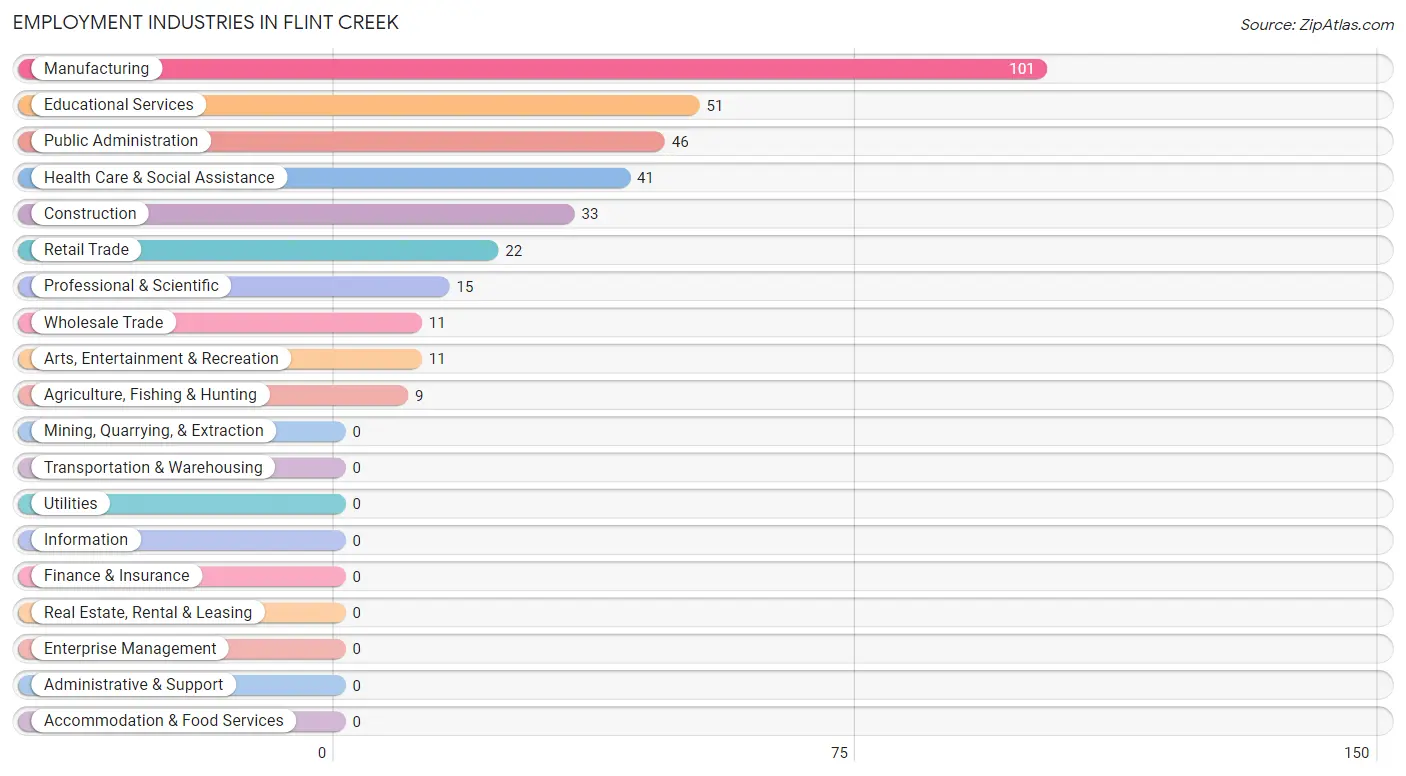
Employment Industries in Flint Creek
The major employment industries in Flint Creek include Manufacturing (101 | 29.7%), Educational Services (51 | 15.0%), Public Administration (46 | 13.5%), Health Care & Social Assistance (41 | 12.1%), and Construction (33 | 9.7%).
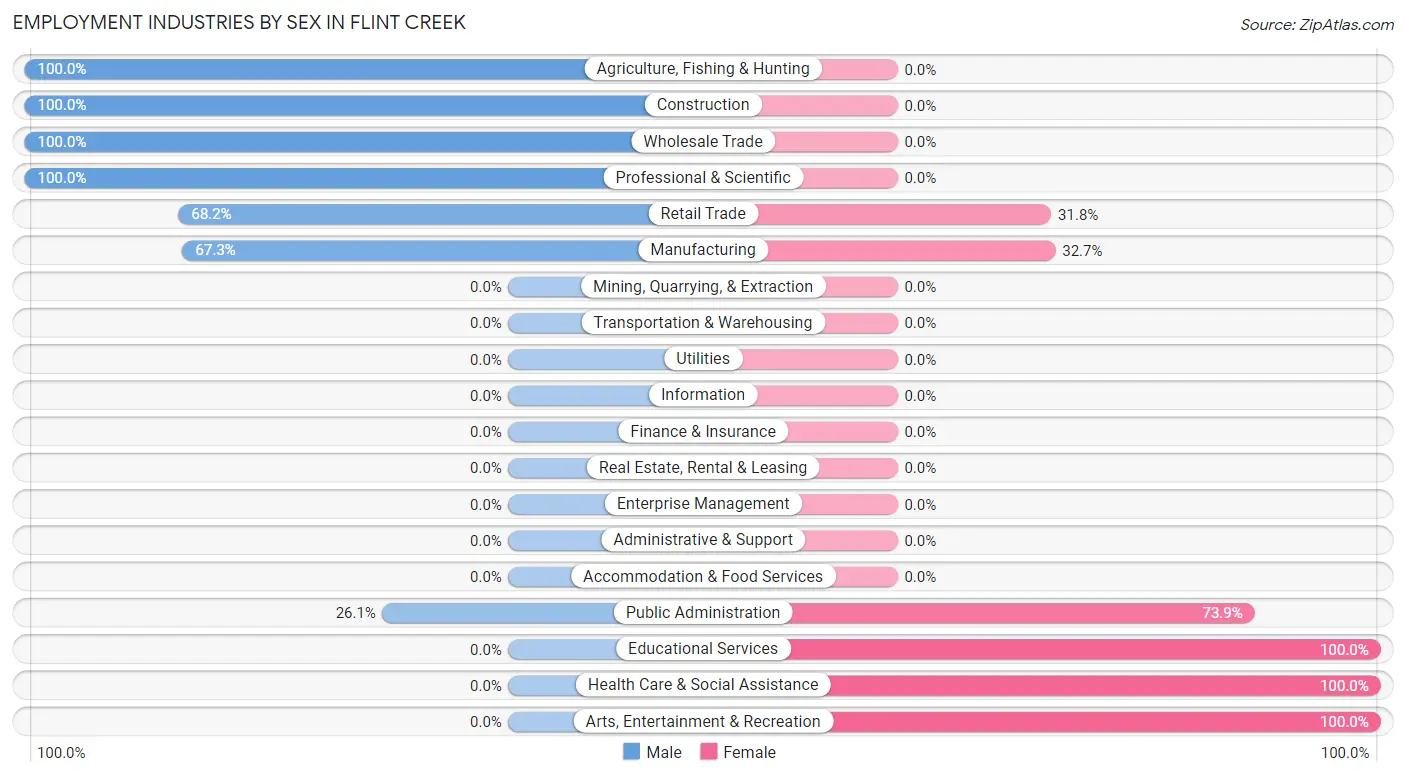
Employment Industries by Sex in Flint Creek
The Flint Creek industries that see more men than women are Agriculture, Fishing & Hunting (100.0%), Construction (100.0%), and Wholesale Trade (100.0%), whereas the industries that tend to have a higher number of women are Educational Services (100.0%), Health Care & Social Assistance (100.0%), and Arts, Entertainment & Recreation (100.0%).
| Industry | Male | Female |
| Agriculture, Fishing & Hunting | 9 (100.0%) | 0 (0.0%) |
| Mining, Quarrying, & Extraction | 0 (0.0%) | 0 (0.0%) |
| Construction | 33 (100.0%) | 0 (0.0%) |
| Manufacturing | 68 (67.3%) | 33 (32.7%) |
| Wholesale Trade | 11 (100.0%) | 0 (0.0%) |
| Retail Trade | 15 (68.2%) | 7 (31.8%) |
| Transportation & Warehousing | 0 (0.0%) | 0 (0.0%) |
| Utilities | 0 (0.0%) | 0 (0.0%) |
| Information | 0 (0.0%) | 0 (0.0%) |
| Finance & Insurance | 0 (0.0%) | 0 (0.0%) |
| Real Estate, Rental & Leasing | 0 (0.0%) | 0 (0.0%) |
| Professional & Scientific | 15 (100.0%) | 0 (0.0%) |
| Enterprise Management | 0 (0.0%) | 0 (0.0%) |
| Administrative & Support | 0 (0.0%) | 0 (0.0%) |
| Educational Services | 0 (0.0%) | 51 (100.0%) |
| Health Care & Social Assistance | 0 (0.0%) | 41 (100.0%) |
| Arts, Entertainment & Recreation | 0 (0.0%) | 11 (100.0%) |
| Accommodation & Food Services | 0 (0.0%) | 0 (0.0%) |
| Public Administration | 12 (26.1%) | 34 (73.9%) |
| Total | 163 (47.9%) | 177 (52.1%) |
Education in Flint Creek
School Enrollment in Flint Creek
The most common levels of schooling among the 194 students in Flint Creek are high school (97 | 50.0%), middle school (32 | 16.5%), and nursery / preschool (19 | 9.8%).
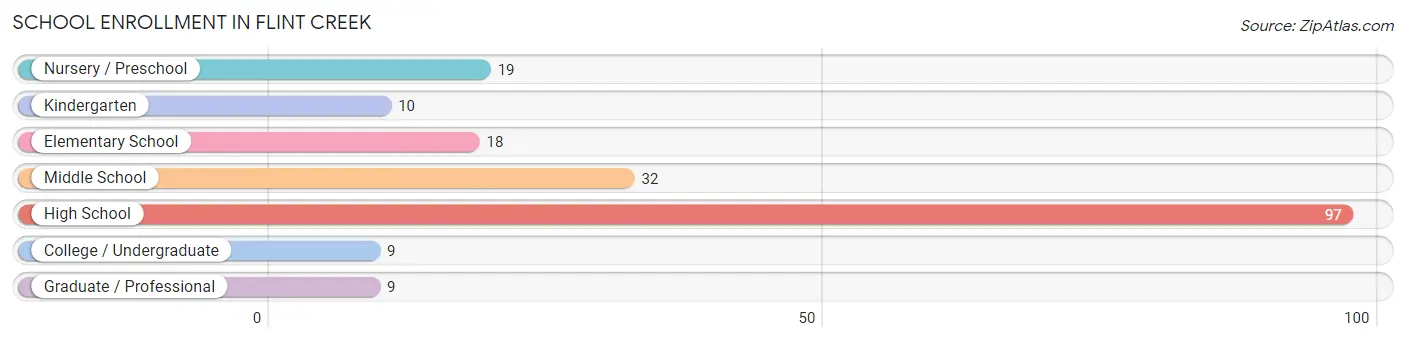
| School Level | # Students | % Students |
| Nursery / Preschool | 19 | 9.8% |
| Kindergarten | 10 | 5.1% |
| Elementary School | 18 | 9.3% |
| Middle School | 32 | 16.5% |
| High School | 97 | 50.0% |
| College / Undergraduate | 9 | 4.6% |
| Graduate / Professional | 9 | 4.6% |
| Total | 194 | 100.0% |
School Enrollment by Age by Funding Source in Flint Creek
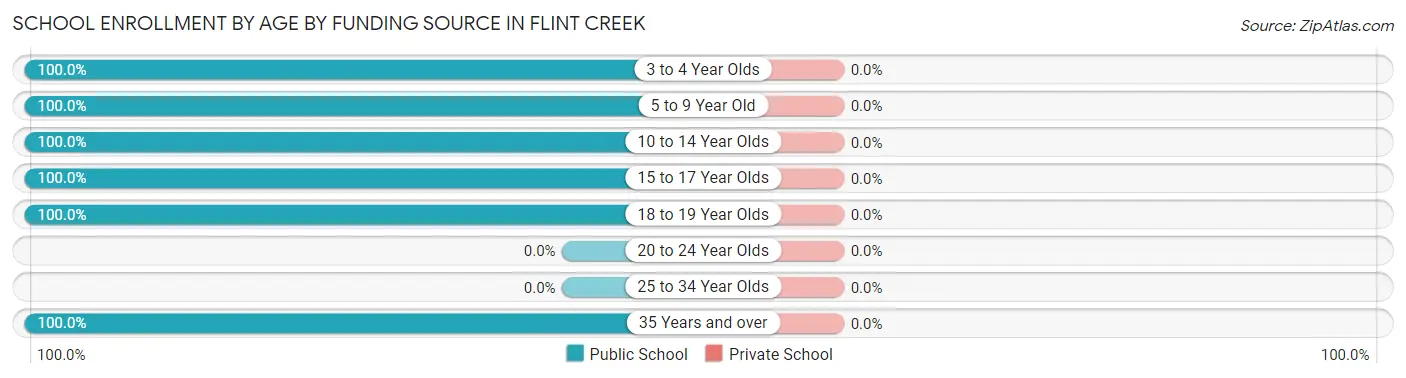
| Age Bracket | Public School | Private School |
| 3 to 4 Year Olds | 19 (100.0%) | 0 (0.0%) |
| 5 to 9 Year Old | 28 (100.0%) | 0 (0.0%) |
| 10 to 14 Year Olds | 32 (100.0%) | 0 (0.0%) |
| 15 to 17 Year Olds | 60 (100.0%) | 0 (0.0%) |
| 18 to 19 Year Olds | 37 (100.0%) | 0 (0.0%) |
| 20 to 24 Year Olds | 0 (0.0%) | 0 (0.0%) |
| 25 to 34 Year Olds | 0 (0.0%) | 0 (0.0%) |
| 35 Years and over | 18 (100.0%) | 0 (0.0%) |
| Total | 194 (100.0%) | 0 (0.0%) |
Educational Attainment by Field of Study in Flint Creek
Education (47 | 25.8%), arts & humanities (44 | 24.2%), business (36 | 19.8%), liberal arts & history (35 | 19.2%), and physical & health sciences (11 | 6.0%) are the most common fields of study among 182 individuals in Flint Creek who have obtained a bachelor's degree or higher.
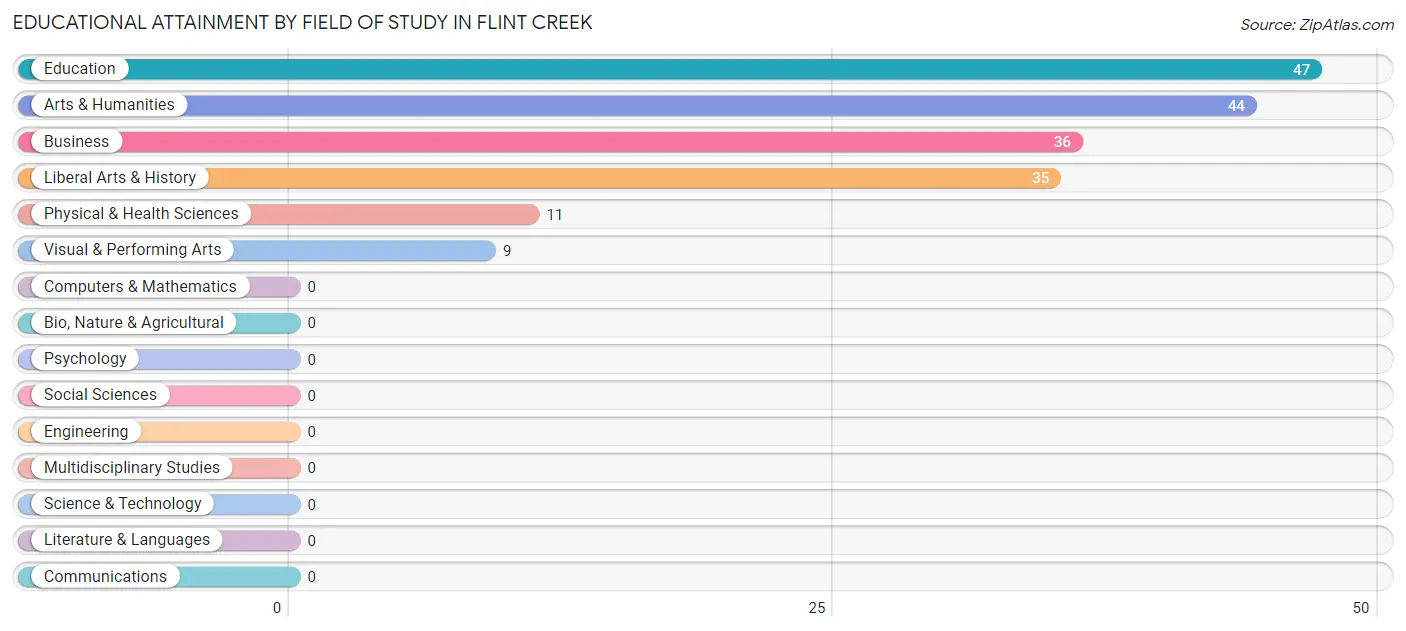
| Field of Study | # Graduates | % Graduates |
| Computers & Mathematics | 0 | 0.0% |
| Bio, Nature & Agricultural | 0 | 0.0% |
| Physical & Health Sciences | 11 | 6.0% |
| Psychology | 0 | 0.0% |
| Social Sciences | 0 | 0.0% |
| Engineering | 0 | 0.0% |
| Multidisciplinary Studies | 0 | 0.0% |
| Science & Technology | 0 | 0.0% |
| Business | 36 | 19.8% |
| Education | 47 | 25.8% |
| Literature & Languages | 0 | 0.0% |
| Liberal Arts & History | 35 | 19.2% |
| Visual & Performing Arts | 9 | 5.0% |
| Communications | 0 | 0.0% |
| Arts & Humanities | 44 | 24.2% |
| Total | 182 | 100.0% |
Transportation & Commute in Flint Creek
Vehicle Availability by Sex in Flint Creek
The most prevalent vehicle ownership categories in Flint Creek are males with 2 vehicles (73, accounting for 44.8%) and females with 2 vehicles (38, making up 41.2%).
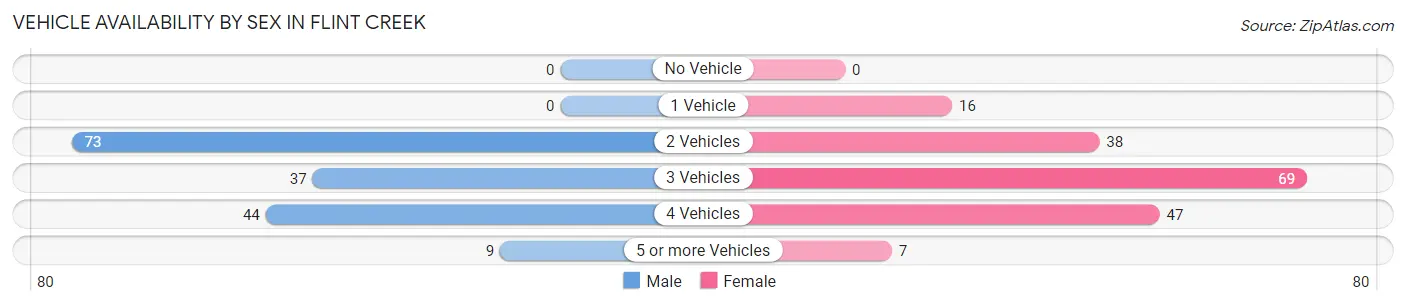
| Vehicles Available | Male | Female |
| No Vehicle | 0 (0.0%) | 0 (0.0%) |
| 1 Vehicle | 0 (0.0%) | 16 (9.0%) |
| 2 Vehicles | 73 (44.8%) | 38 (21.5%) |
| 3 Vehicles | 37 (22.7%) | 69 (39.0%) |
| 4 Vehicles | 44 (27.0%) | 47 (26.6%) |
| 5 or more Vehicles | 9 (5.5%) | 7 (4.0%) |
| Total | 163 (100.0%) | 177 (100.0%) |
Commute Time in Flint Creek
The most frequently occuring commute durations in Flint Creek are 45 to 59 minutes (77 commuters, 22.7%), 60 to 89 minutes (60 commuters, 17.6%), and 20 to 24 minutes (49 commuters, 14.4%).
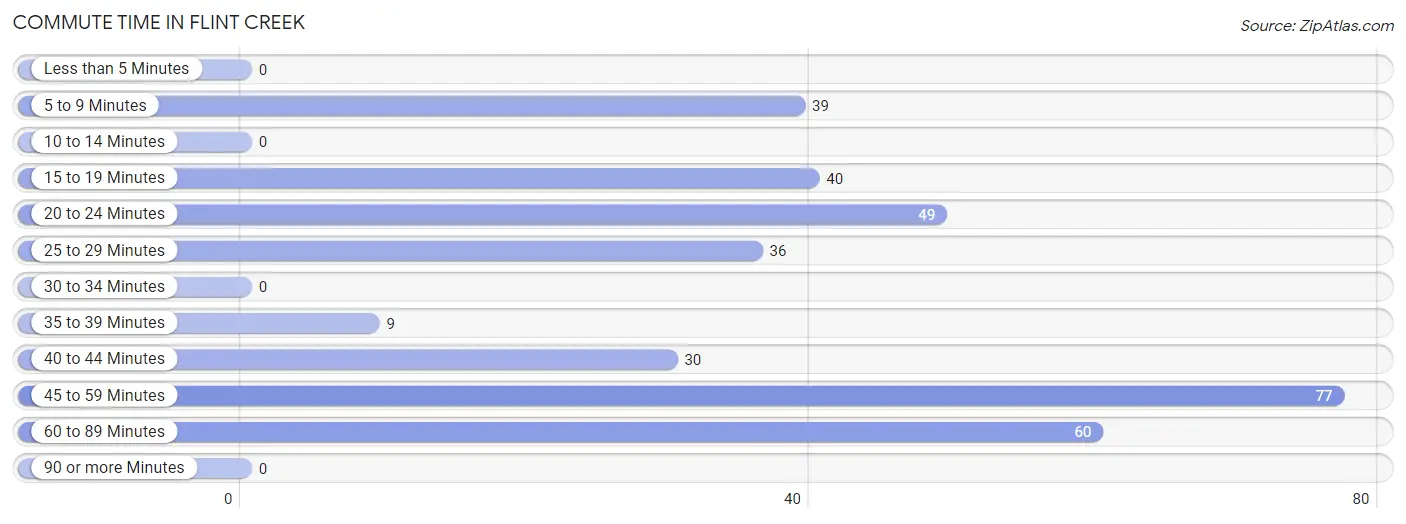
| Commute Time | # Commuters | % Commuters |
| Less than 5 Minutes | 0 | 0.0% |
| 5 to 9 Minutes | 39 | 11.5% |
| 10 to 14 Minutes | 0 | 0.0% |
| 15 to 19 Minutes | 40 | 11.8% |
| 20 to 24 Minutes | 49 | 14.4% |
| 25 to 29 Minutes | 36 | 10.6% |
| 30 to 34 Minutes | 0 | 0.0% |
| 35 to 39 Minutes | 9 | 2.6% |
| 40 to 44 Minutes | 30 | 8.8% |
| 45 to 59 Minutes | 77 | 22.7% |
| 60 to 89 Minutes | 60 | 17.6% |
| 90 or more Minutes | 0 | 0.0% |
Commute Time by Sex in Flint Creek
The most common commute times in Flint Creek are 45 to 59 minutes (41 commuters, 25.2%) for males and 45 to 59 minutes (36 commuters, 20.3%) for females.
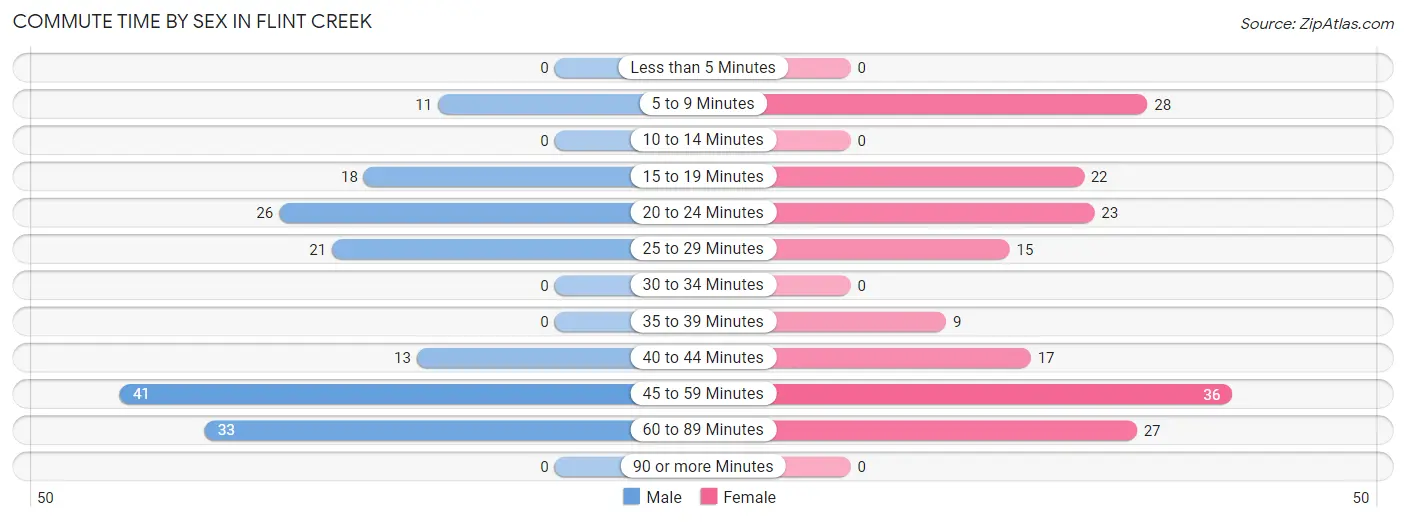
| Commute Time | Male | Female |
| Less than 5 Minutes | 0 (0.0%) | 0 (0.0%) |
| 5 to 9 Minutes | 11 (6.8%) | 28 (15.8%) |
| 10 to 14 Minutes | 0 (0.0%) | 0 (0.0%) |
| 15 to 19 Minutes | 18 (11.0%) | 22 (12.4%) |
| 20 to 24 Minutes | 26 (16.0%) | 23 (13.0%) |
| 25 to 29 Minutes | 21 (12.9%) | 15 (8.5%) |
| 30 to 34 Minutes | 0 (0.0%) | 0 (0.0%) |
| 35 to 39 Minutes | 0 (0.0%) | 9 (5.1%) |
| 40 to 44 Minutes | 13 (8.0%) | 17 (9.6%) |
| 45 to 59 Minutes | 41 (25.2%) | 36 (20.3%) |
| 60 to 89 Minutes | 33 (20.3%) | 27 (15.2%) |
| 90 or more Minutes | 0 (0.0%) | 0 (0.0%) |
Time of Departure to Work by Sex in Flint Creek
The most frequent times of departure to work in Flint Creek are 12:00 AM to 4:59 AM (38, 23.3%) for males and 7:30 AM to 7:59 AM (38, 21.5%) for females.
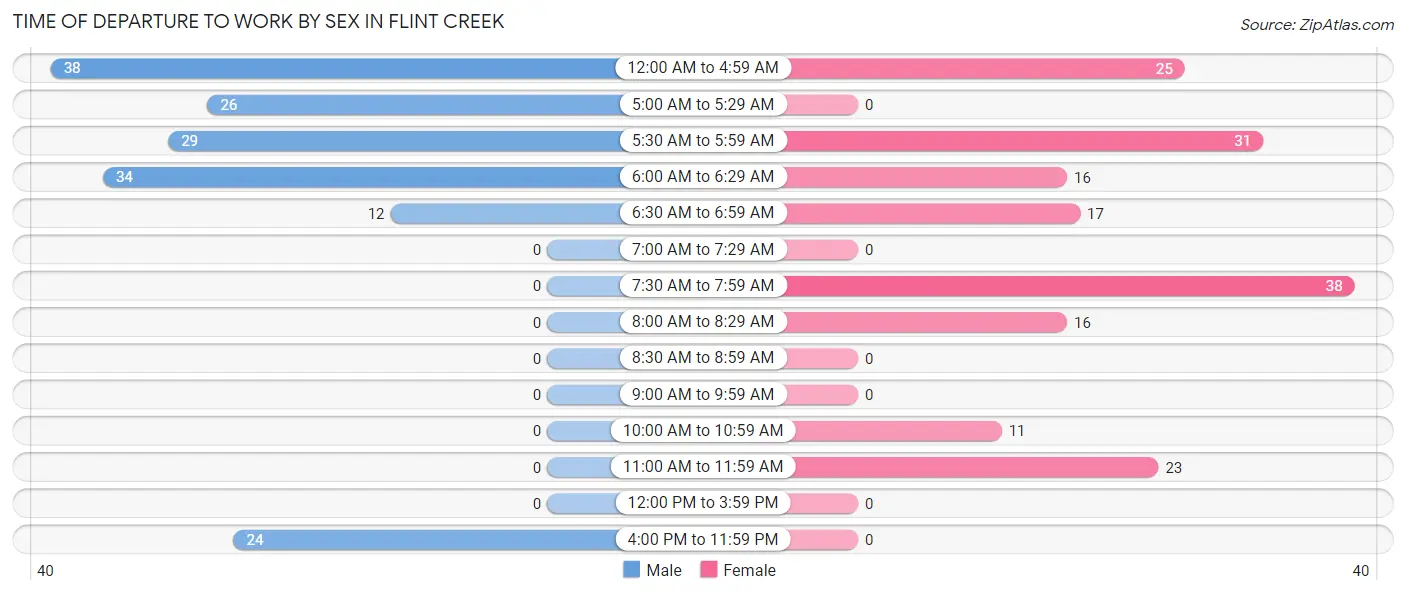
| Time of Departure | Male | Female |
| 12:00 AM to 4:59 AM | 38 (23.3%) | 25 (14.1%) |
| 5:00 AM to 5:29 AM | 26 (16.0%) | 0 (0.0%) |
| 5:30 AM to 5:59 AM | 29 (17.8%) | 31 (17.5%) |
| 6:00 AM to 6:29 AM | 34 (20.9%) | 16 (9.0%) |
| 6:30 AM to 6:59 AM | 12 (7.4%) | 17 (9.6%) |
| 7:00 AM to 7:29 AM | 0 (0.0%) | 0 (0.0%) |
| 7:30 AM to 7:59 AM | 0 (0.0%) | 38 (21.5%) |
| 8:00 AM to 8:29 AM | 0 (0.0%) | 16 (9.0%) |
| 8:30 AM to 8:59 AM | 0 (0.0%) | 0 (0.0%) |
| 9:00 AM to 9:59 AM | 0 (0.0%) | 0 (0.0%) |
| 10:00 AM to 10:59 AM | 0 (0.0%) | 11 (6.2%) |
| 11:00 AM to 11:59 AM | 0 (0.0%) | 23 (13.0%) |
| 12:00 PM to 3:59 PM | 0 (0.0%) | 0 (0.0%) |
| 4:00 PM to 11:59 PM | 24 (14.7%) | 0 (0.0%) |
| Total | 163 (100.0%) | 177 (100.0%) |
Housing Occupancy in Flint Creek
Occupancy by Ownership in Flint Creek
Of the total 406 dwellings in Flint Creek, owner-occupied units account for 387 (95.3%), while renter-occupied units make up 19 (4.7%).
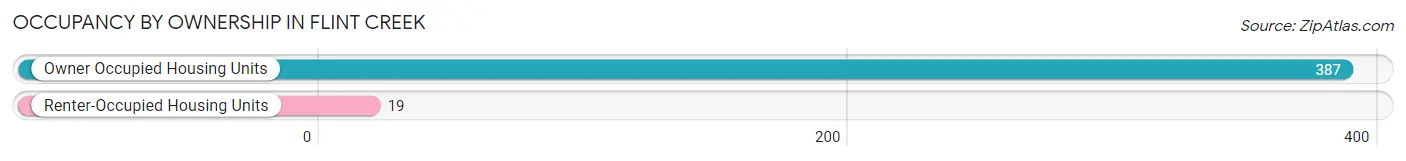
| Occupancy | # Housing Units | % Housing Units |
| Owner Occupied Housing Units | 387 | 95.3% |
| Renter-Occupied Housing Units | 19 | 4.7% |
| Total Occupied Housing Units | 406 | 100.0% |
Occupancy by Household Size in Flint Creek
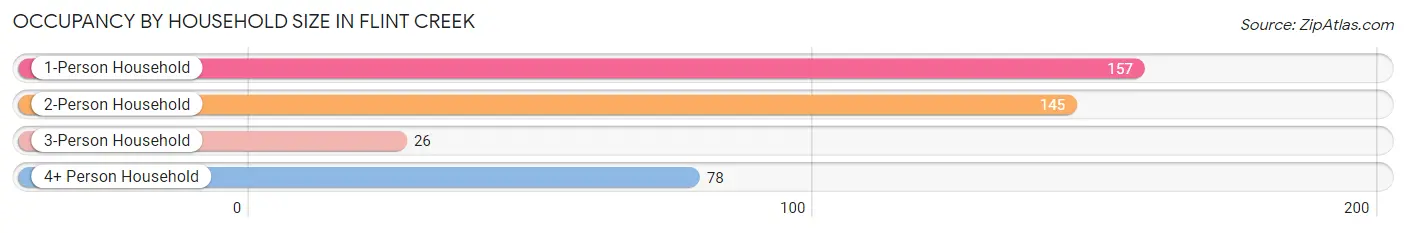
| Household Size | # Housing Units | % Housing Units |
| 1-Person Household | 157 | 38.7% |
| 2-Person Household | 145 | 35.7% |
| 3-Person Household | 26 | 6.4% |
| 4+ Person Household | 78 | 19.2% |
| Total Housing Units | 406 | 100.0% |
Occupancy by Ownership by Household Size in Flint Creek
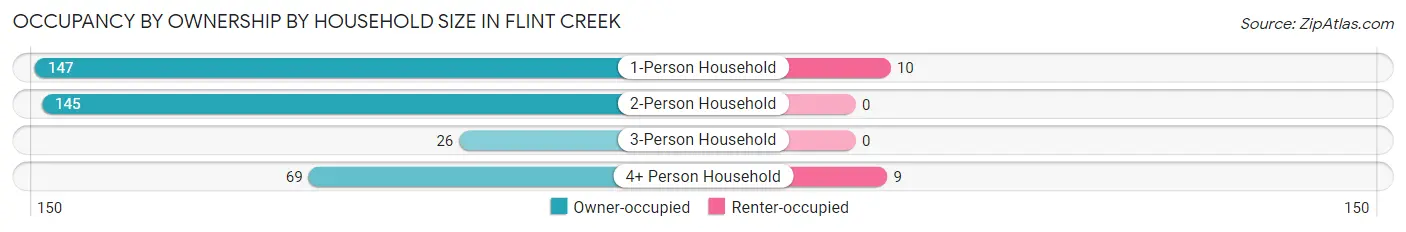
| Household Size | Owner-occupied | Renter-occupied |
| 1-Person Household | 147 (93.6%) | 10 (6.4%) |
| 2-Person Household | 145 (100.0%) | 0 (0.0%) |
| 3-Person Household | 26 (100.0%) | 0 (0.0%) |
| 4+ Person Household | 69 (88.5%) | 9 (11.5%) |
| Total Housing Units | 387 (95.3%) | 19 (4.7%) |
Occupancy by Educational Attainment in Flint Creek
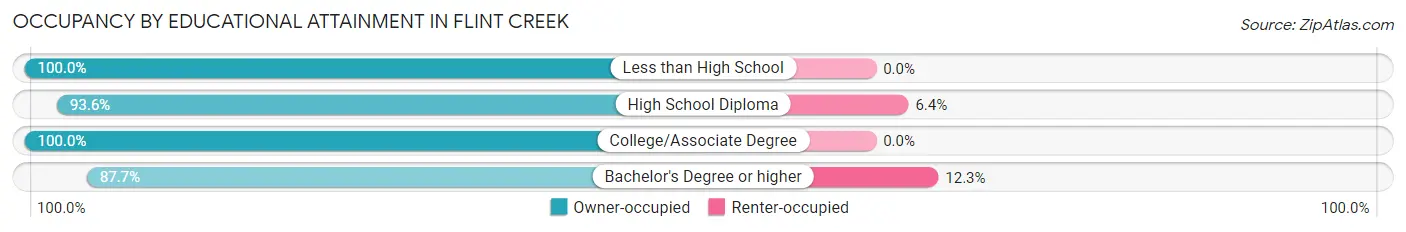
| Household Size | Owner-occupied | Renter-occupied |
| Less than High School | 25 (100.0%) | 0 (0.0%) |
| High School Diploma | 146 (93.6%) | 10 (6.4%) |
| College/Associate Degree | 152 (100.0%) | 0 (0.0%) |
| Bachelor's Degree or higher | 64 (87.7%) | 9 (12.3%) |
Occupancy by Age of Householder in Flint Creek
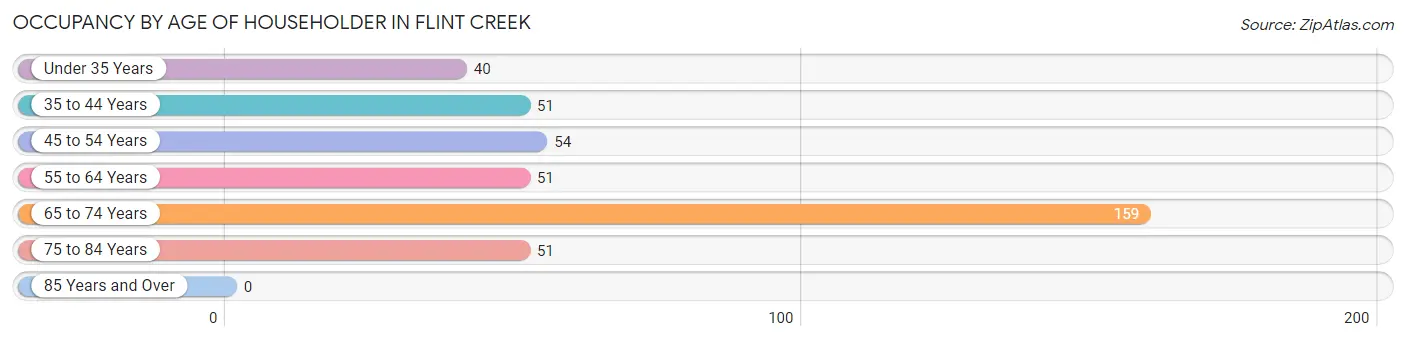
| Age Bracket | # Households | % Households |
| Under 35 Years | 40 | 9.9% |
| 35 to 44 Years | 51 | 12.6% |
| 45 to 54 Years | 54 | 13.3% |
| 55 to 64 Years | 51 | 12.6% |
| 65 to 74 Years | 159 | 39.2% |
| 75 to 84 Years | 51 | 12.6% |
| 85 Years and Over | 0 | 0.0% |
| Total | 406 | 100.0% |
Housing Finances in Flint Creek
Median Income by Occupancy in Flint Creek
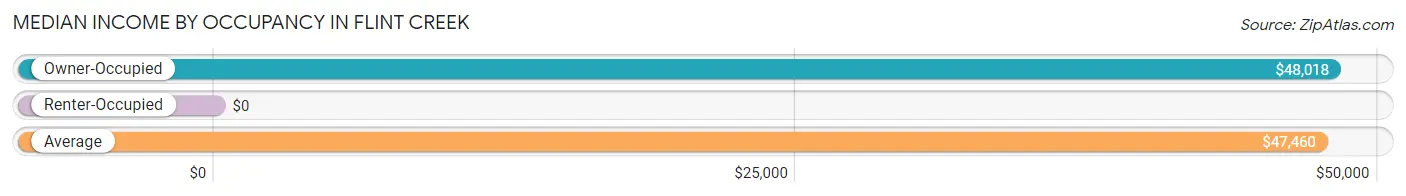
| Occupancy Type | # Households | Median Income |
| Owner-Occupied | 387 (95.3%) | $48,018 |
| Renter-Occupied | 19 (4.7%) | $0 |
| Average | 406 (100.0%) | $47,460 |
Occupancy by Householder Income Bracket in Flint Creek
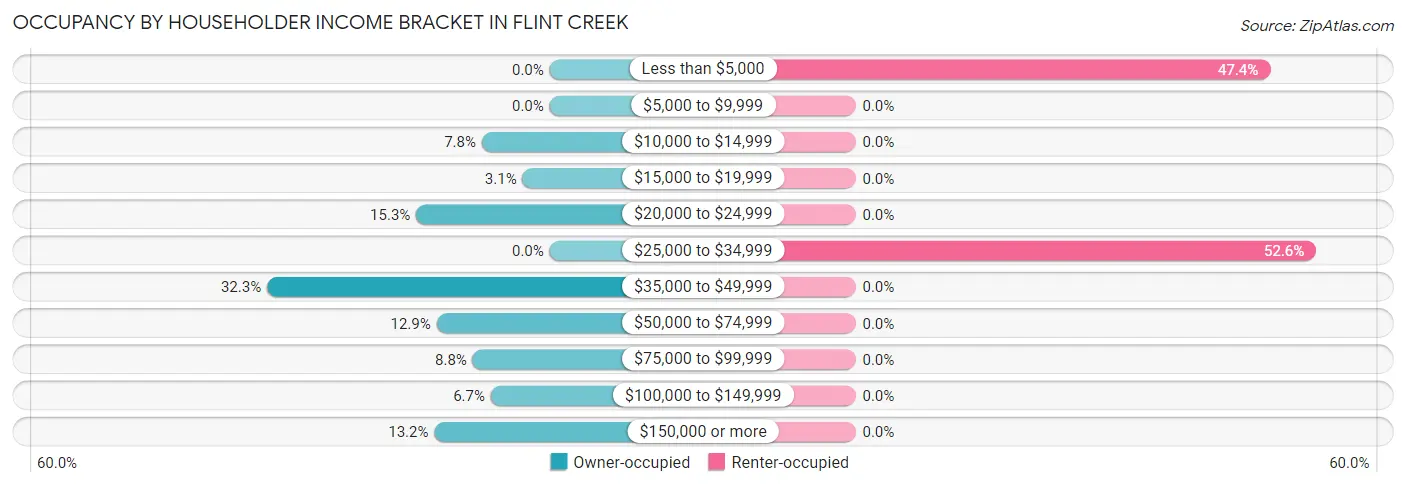
| Income Bracket | Owner-occupied | Renter-occupied |
| Less than $5,000 | 0 (0.0%) | 9 (47.4%) |
| $5,000 to $9,999 | 0 (0.0%) | 0 (0.0%) |
| $10,000 to $14,999 | 30 (7.7%) | 0 (0.0%) |
| $15,000 to $19,999 | 12 (3.1%) | 0 (0.0%) |
| $20,000 to $24,999 | 59 (15.2%) | 0 (0.0%) |
| $25,000 to $34,999 | 0 (0.0%) | 10 (52.6%) |
| $35,000 to $49,999 | 125 (32.3%) | 0 (0.0%) |
| $50,000 to $74,999 | 50 (12.9%) | 0 (0.0%) |
| $75,000 to $99,999 | 34 (8.8%) | 0 (0.0%) |
| $100,000 to $149,999 | 26 (6.7%) | 0 (0.0%) |
| $150,000 or more | 51 (13.2%) | 0 (0.0%) |
| Total | 387 (100.0%) | 19 (100.0%) |
Monthly Housing Cost Tiers in Flint Creek
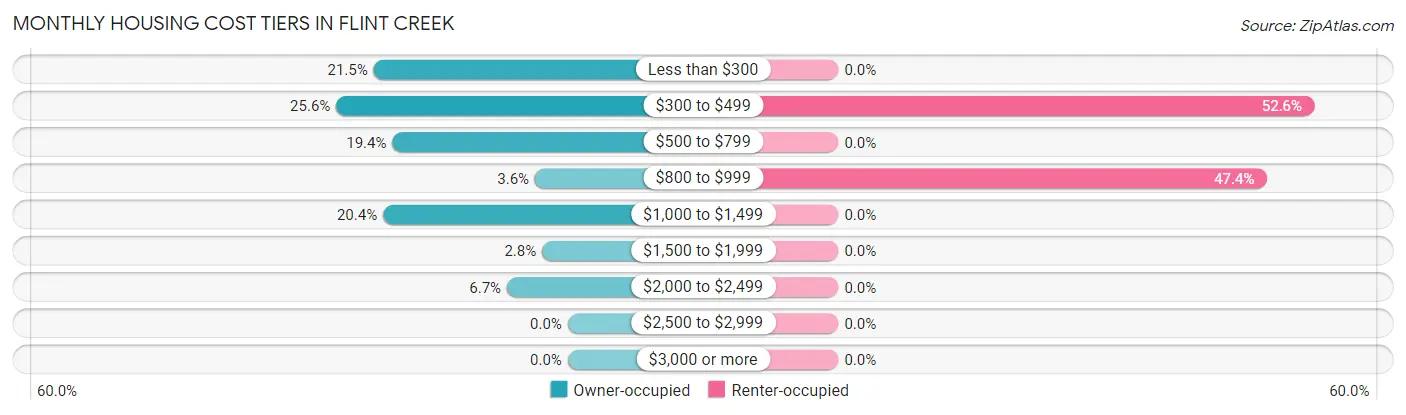
| Monthly Cost | Owner-occupied | Renter-occupied |
| Less than $300 | 83 (21.4%) | 0 (0.0%) |
| $300 to $499 | 99 (25.6%) | 10 (52.6%) |
| $500 to $799 | 75 (19.4%) | 0 (0.0%) |
| $800 to $999 | 14 (3.6%) | 9 (47.4%) |
| $1,000 to $1,499 | 79 (20.4%) | 0 (0.0%) |
| $1,500 to $1,999 | 11 (2.8%) | 0 (0.0%) |
| $2,000 to $2,499 | 26 (6.7%) | 0 (0.0%) |
| $2,500 to $2,999 | 0 (0.0%) | 0 (0.0%) |
| $3,000 or more | 0 (0.0%) | 0 (0.0%) |
| Total | 387 (100.0%) | 19 (100.0%) |
Physical Housing Characteristics in Flint Creek
Housing Structures in Flint Creek
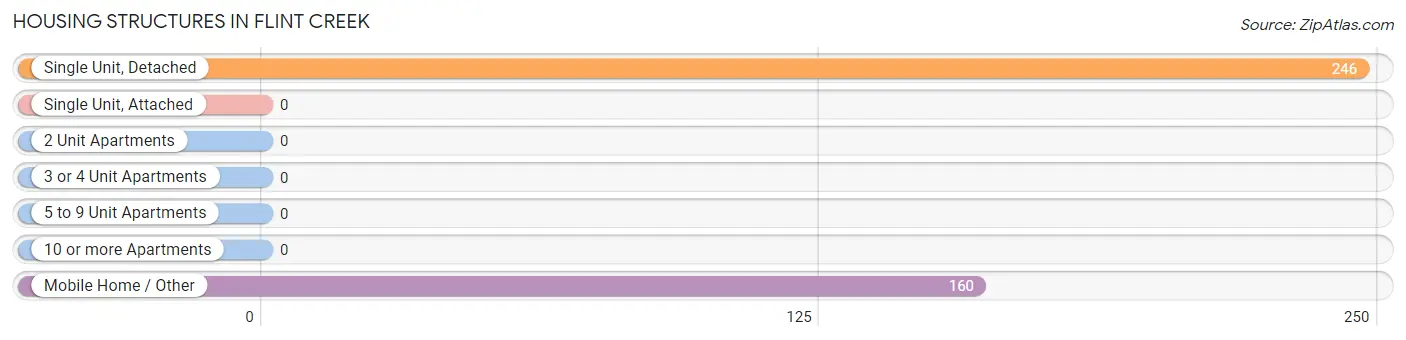
| Structure Type | # Housing Units | % Housing Units |
| Single Unit, Detached | 246 | 60.6% |
| Single Unit, Attached | 0 | 0.0% |
| 2 Unit Apartments | 0 | 0.0% |
| 3 or 4 Unit Apartments | 0 | 0.0% |
| 5 to 9 Unit Apartments | 0 | 0.0% |
| 10 or more Apartments | 0 | 0.0% |
| Mobile Home / Other | 160 | 39.4% |
| Total | 406 | 100.0% |
Housing Structures by Occupancy in Flint Creek
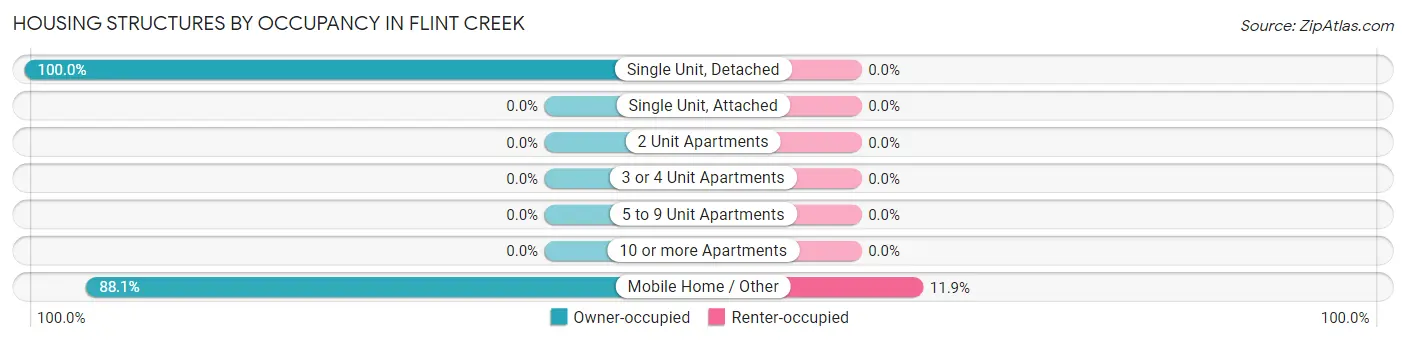
| Structure Type | Owner-occupied | Renter-occupied |
| Single Unit, Detached | 246 (100.0%) | 0 (0.0%) |
| Single Unit, Attached | 0 (0.0%) | 0 (0.0%) |
| 2 Unit Apartments | 0 (0.0%) | 0 (0.0%) |
| 3 or 4 Unit Apartments | 0 (0.0%) | 0 (0.0%) |
| 5 to 9 Unit Apartments | 0 (0.0%) | 0 (0.0%) |
| 10 or more Apartments | 0 (0.0%) | 0 (0.0%) |
| Mobile Home / Other | 141 (88.1%) | 19 (11.9%) |
| Total | 387 (95.3%) | 19 (4.7%) |
Housing Structures by Number of Rooms in Flint Creek
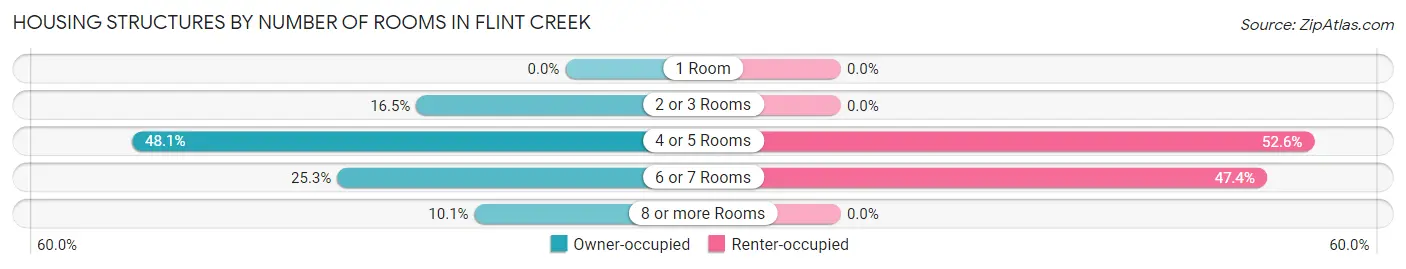
| Number of Rooms | Owner-occupied | Renter-occupied |
| 1 Room | 0 (0.0%) | 0 (0.0%) |
| 2 or 3 Rooms | 64 (16.5%) | 0 (0.0%) |
| 4 or 5 Rooms | 186 (48.1%) | 10 (52.6%) |
| 6 or 7 Rooms | 98 (25.3%) | 9 (47.4%) |
| 8 or more Rooms | 39 (10.1%) | 0 (0.0%) |
| Total | 387 (100.0%) | 19 (100.0%) |
Housing Structure by Heating Type in Flint Creek
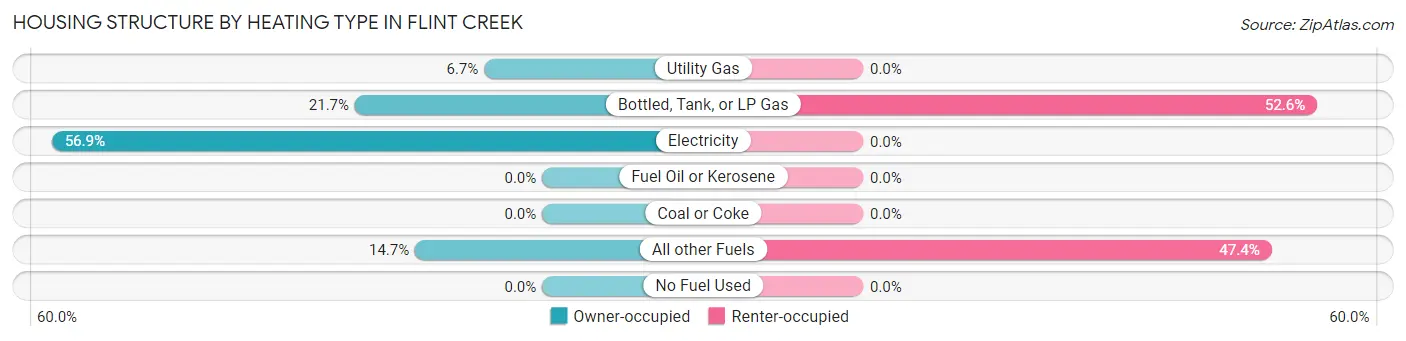
| Heating Type | Owner-occupied | Renter-occupied |
| Utility Gas | 26 (6.7%) | 0 (0.0%) |
| Bottled, Tank, or LP Gas | 84 (21.7%) | 10 (52.6%) |
| Electricity | 220 (56.9%) | 0 (0.0%) |
| Fuel Oil or Kerosene | 0 (0.0%) | 0 (0.0%) |
| Coal or Coke | 0 (0.0%) | 0 (0.0%) |
| All other Fuels | 57 (14.7%) | 9 (47.4%) |
| No Fuel Used | 0 (0.0%) | 0 (0.0%) |
| Total | 387 (100.0%) | 19 (100.0%) |
Household Vehicle Usage in Flint Creek
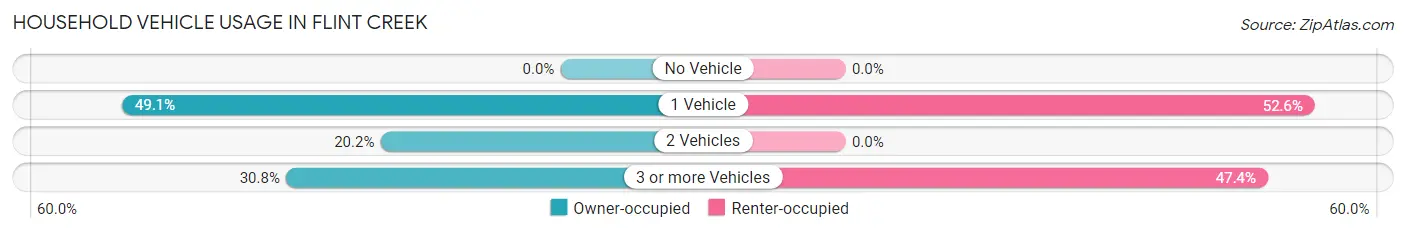
| Vehicles per Household | Owner-occupied | Renter-occupied |
| No Vehicle | 0 (0.0%) | 0 (0.0%) |
| 1 Vehicle | 190 (49.1%) | 10 (52.6%) |
| 2 Vehicles | 78 (20.2%) | 0 (0.0%) |
| 3 or more Vehicles | 119 (30.7%) | 9 (47.4%) |
| Total | 387 (100.0%) | 19 (100.0%) |
Real Estate & Mortgages in Flint Creek
Real Estate and Mortgage Overview in Flint Creek
| Characteristic | Without Mortgage | With Mortgage |
| Housing Units | 205 | 182 |
| Median Property Value | $84,400 | $130,800 |
| Median Household Income | $45,880 | $39 |
| Monthly Housing Costs | $409 | $0 |
| Real Estate Taxes | - | - |
Property Value by Mortgage Status in Flint Creek
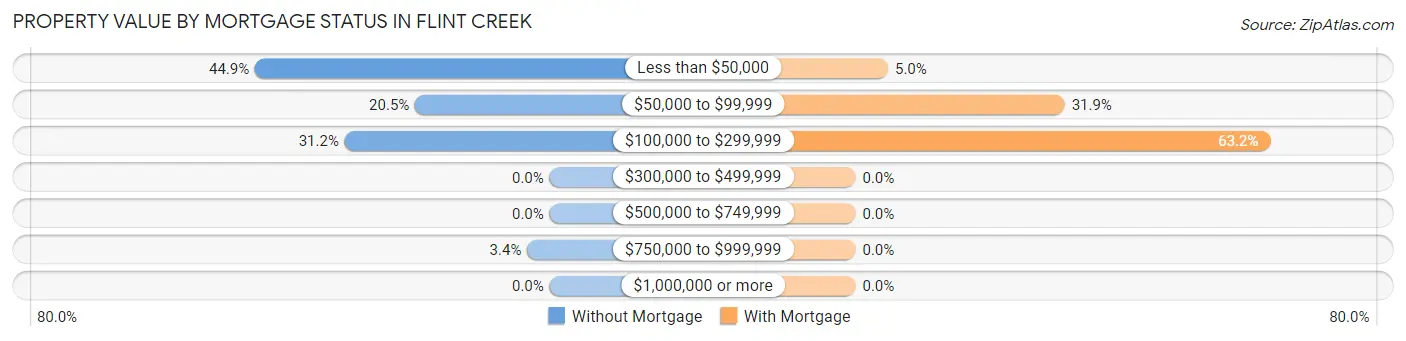
| Property Value | Without Mortgage | With Mortgage |
| Less than $50,000 | 92 (44.9%) | 9 (5.0%) |
| $50,000 to $99,999 | 42 (20.5%) | 58 (31.9%) |
| $100,000 to $299,999 | 64 (31.2%) | 115 (63.2%) |
| $300,000 to $499,999 | 0 (0.0%) | 0 (0.0%) |
| $500,000 to $749,999 | 0 (0.0%) | 0 (0.0%) |
| $750,000 to $999,999 | 7 (3.4%) | 0 (0.0%) |
| $1,000,000 or more | 0 (0.0%) | 0 (0.0%) |
| Total | 205 (100.0%) | 182 (100.0%) |
Household Income by Mortgage Status in Flint Creek
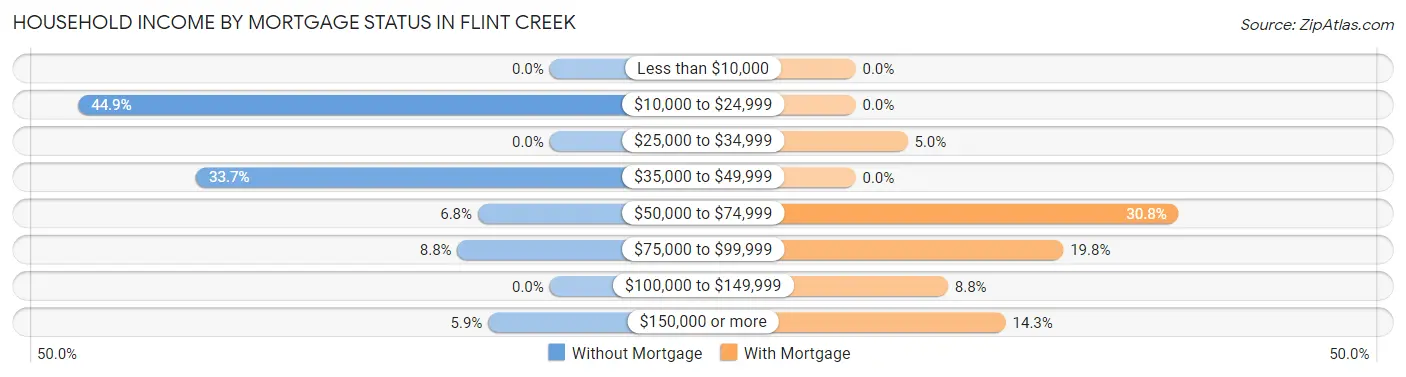
| Household Income | Without Mortgage | With Mortgage |
| Less than $10,000 | 0 (0.0%) | 0 (0.0%) |
| $10,000 to $24,999 | 92 (44.9%) | 0 (0.0%) |
| $25,000 to $34,999 | 0 (0.0%) | 9 (5.0%) |
| $35,000 to $49,999 | 69 (33.7%) | 0 (0.0%) |
| $50,000 to $74,999 | 14 (6.8%) | 56 (30.8%) |
| $75,000 to $99,999 | 18 (8.8%) | 36 (19.8%) |
| $100,000 to $149,999 | 0 (0.0%) | 16 (8.8%) |
| $150,000 or more | 12 (5.9%) | 26 (14.3%) |
| Total | 205 (100.0%) | 182 (100.0%) |
Property Value to Household Income Ratio in Flint Creek
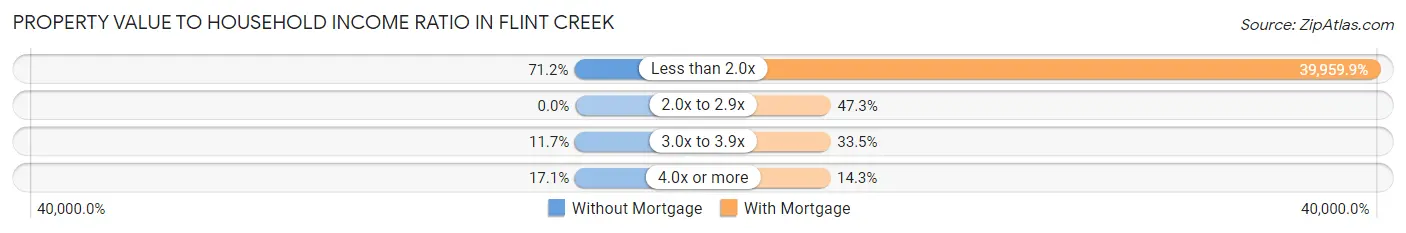
| Value-to-Income Ratio | Without Mortgage | With Mortgage |
| Less than 2.0x | 146 (71.2%) | 72,727 (39,959.9%) |
| 2.0x to 2.9x | 0 (0.0%) | 86 (47.2%) |
| 3.0x to 3.9x | 24 (11.7%) | 61 (33.5%) |
| 4.0x or more | 35 (17.1%) | 26 (14.3%) |
| Total | 205 (100.0%) | 182 (100.0%) |
Real Estate Taxes by Mortgage Status in Flint Creek
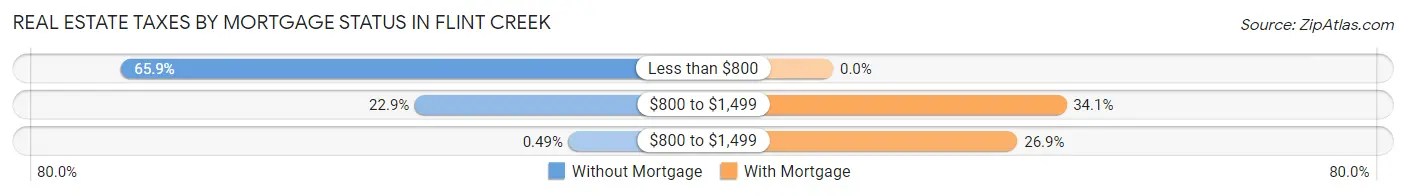
| Property Taxes | Without Mortgage | With Mortgage |
| Less than $800 | 135 (65.8%) | 0 (0.0%) |
| $800 to $1,499 | 47 (22.9%) | 62 (34.1%) |
| $800 to $1,499 | 1 (0.5%) | 49 (26.9%) |
| Total | 205 (100.0%) | 182 (100.0%) |
Health & Disability in Flint Creek
Health Insurance Coverage by Age in Flint Creek
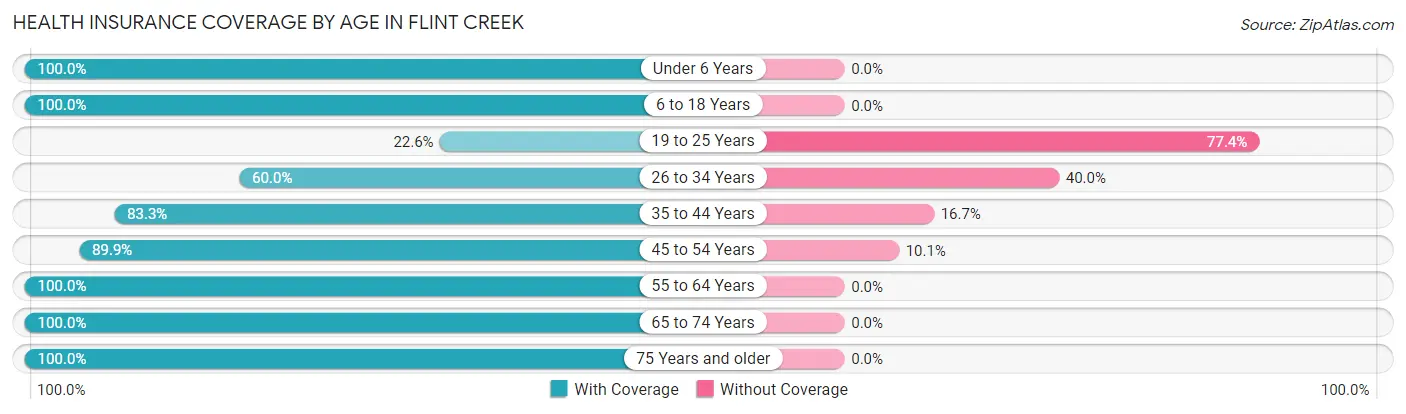
| Age Bracket | With Coverage | Without Coverage |
| Under 6 Years | 75 (100.0%) | 0 (0.0%) |
| 6 to 18 Years | 168 (100.0%) | 0 (0.0%) |
| 19 to 25 Years | 12 (22.6%) | 41 (77.4%) |
| 26 to 34 Years | 36 (60.0%) | 24 (40.0%) |
| 35 to 44 Years | 90 (83.3%) | 18 (16.7%) |
| 45 to 54 Years | 124 (89.9%) | 14 (10.1%) |
| 55 to 64 Years | 90 (100.0%) | 0 (0.0%) |
| 65 to 74 Years | 184 (100.0%) | 0 (0.0%) |
| 75 Years and older | 93 (100.0%) | 0 (0.0%) |
| Total | 872 (90.0%) | 97 (10.0%) |
Health Insurance Coverage by Citizenship Status in Flint Creek
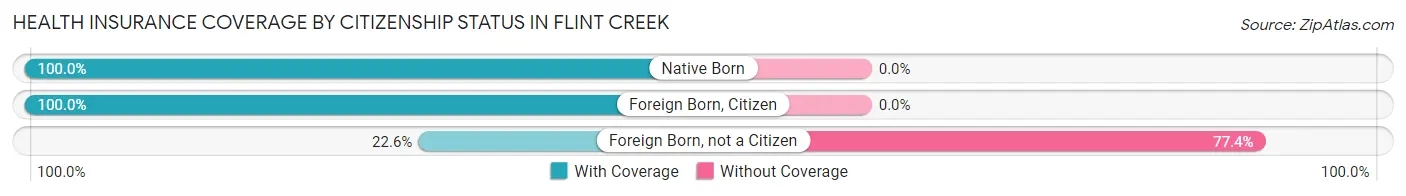
| Citizenship Status | With Coverage | Without Coverage |
| Native Born | 75 (100.0%) | 0 (0.0%) |
| Foreign Born, Citizen | 168 (100.0%) | 0 (0.0%) |
| Foreign Born, not a Citizen | 12 (22.6%) | 41 (77.4%) |
Health Insurance Coverage by Household Income in Flint Creek
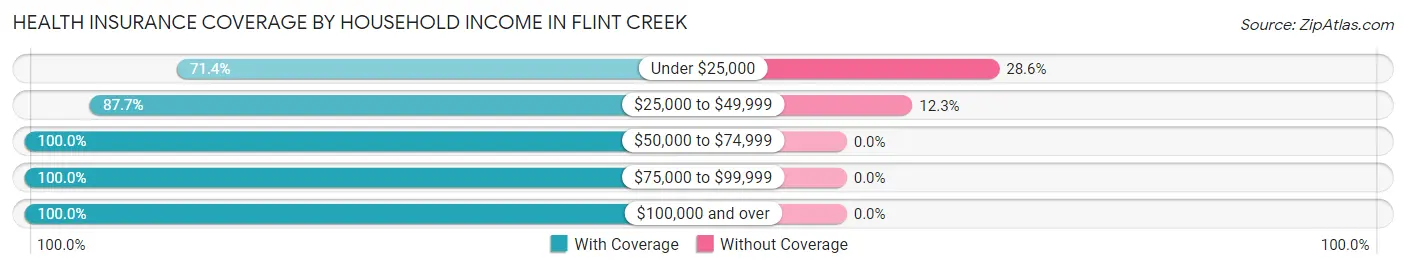
| Household Income | With Coverage | Without Coverage |
| Under $25,000 | 170 (71.4%) | 68 (28.6%) |
| $25,000 to $49,999 | 207 (87.7%) | 29 (12.3%) |
| $50,000 to $74,999 | 207 (100.0%) | 0 (0.0%) |
| $75,000 to $99,999 | 65 (100.0%) | 0 (0.0%) |
| $100,000 and over | 223 (100.0%) | 0 (0.0%) |
Public vs Private Health Insurance Coverage by Age in Flint Creek
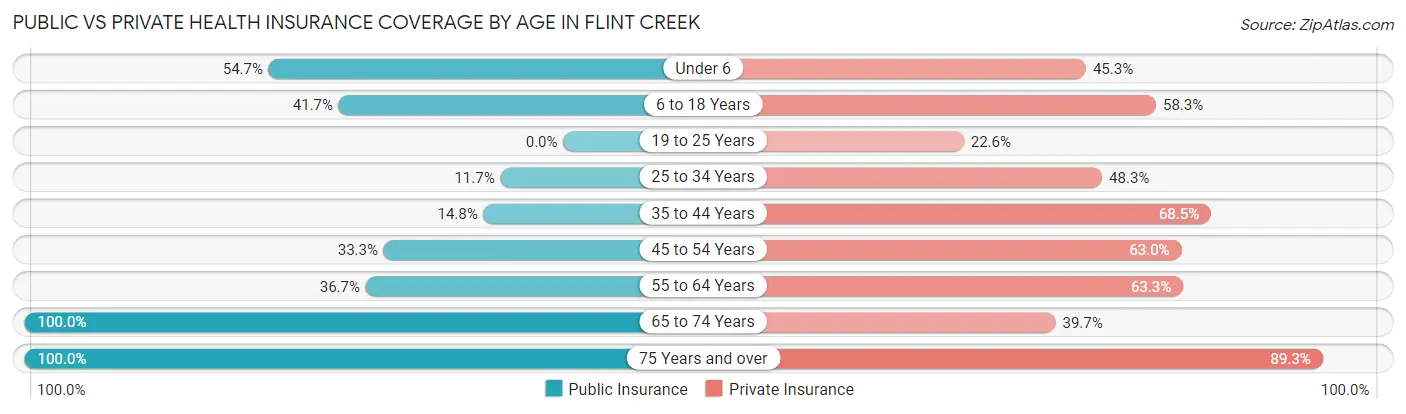
| Age Bracket | Public Insurance | Private Insurance |
| Under 6 | 41 (54.7%) | 34 (45.3%) |
| 6 to 18 Years | 70 (41.7%) | 98 (58.3%) |
| 19 to 25 Years | 0 (0.0%) | 12 (22.6%) |
| 25 to 34 Years | 7 (11.7%) | 29 (48.3%) |
| 35 to 44 Years | 16 (14.8%) | 74 (68.5%) |
| 45 to 54 Years | 46 (33.3%) | 87 (63.0%) |
| 55 to 64 Years | 33 (36.7%) | 57 (63.3%) |
| 65 to 74 Years | 184 (100.0%) | 73 (39.7%) |
| 75 Years and over | 93 (100.0%) | 83 (89.2%) |
| Total | 490 (50.6%) | 547 (56.5%) |
Disability Status by Sex by Age in Flint Creek
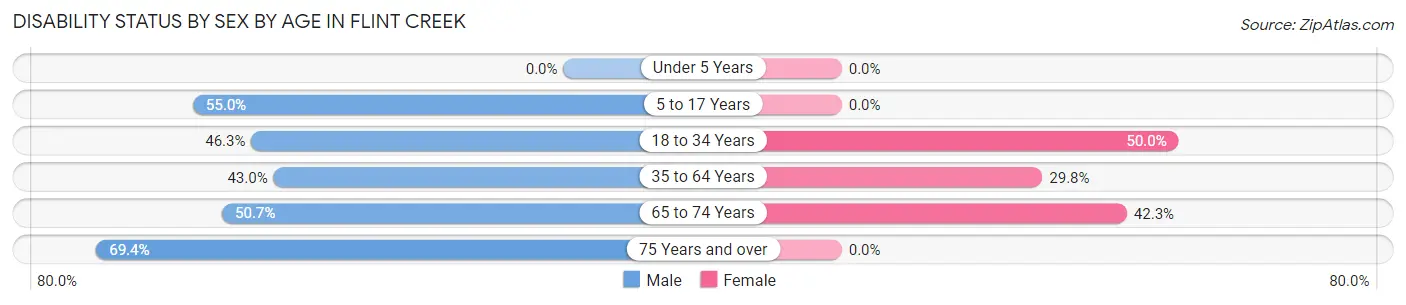
| Age Bracket | Male | Female |
| Under 5 Years | 0 (0.0%) | 0 (0.0%) |
| 5 to 17 Years | 11 (55.0%) | 0 (0.0%) |
| 18 to 34 Years | 38 (46.3%) | 34 (50.0%) |
| 35 to 64 Years | 68 (43.0%) | 53 (29.8%) |
| 65 to 74 Years | 37 (50.7%) | 47 (42.3%) |
| 75 Years and over | 43 (69.4%) | 0 (0.0%) |
Disability Class by Sex by Age in Flint Creek
Disability Class: Hearing Difficulty
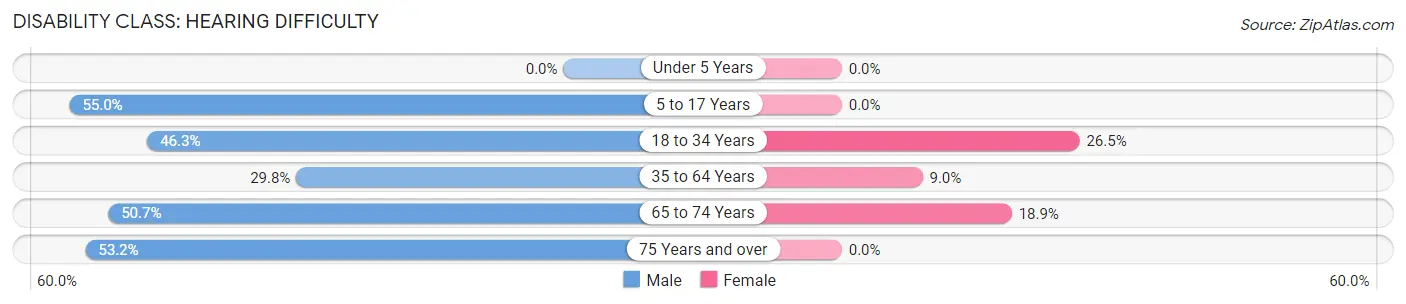
| Age Bracket | Male | Female |
| Under 5 Years | 0 (0.0%) | 0 (0.0%) |
| 5 to 17 Years | 11 (55.0%) | 0 (0.0%) |
| 18 to 34 Years | 38 (46.3%) | 18 (26.5%) |
| 35 to 64 Years | 47 (29.7%) | 16 (9.0%) |
| 65 to 74 Years | 37 (50.7%) | 21 (18.9%) |
| 75 Years and over | 33 (53.2%) | 0 (0.0%) |
Disability Class: Vision Difficulty
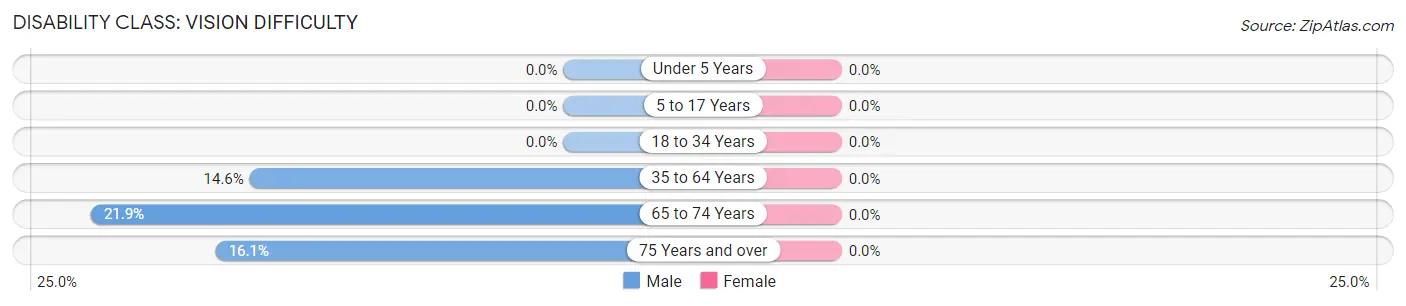
| Age Bracket | Male | Female |
| Under 5 Years | 0 (0.0%) | 0 (0.0%) |
| 5 to 17 Years | 0 (0.0%) | 0 (0.0%) |
| 18 to 34 Years | 0 (0.0%) | 0 (0.0%) |
| 35 to 64 Years | 23 (14.6%) | 0 (0.0%) |
| 65 to 74 Years | 16 (21.9%) | 0 (0.0%) |
| 75 Years and over | 10 (16.1%) | 0 (0.0%) |
Disability Class: Cognitive Difficulty
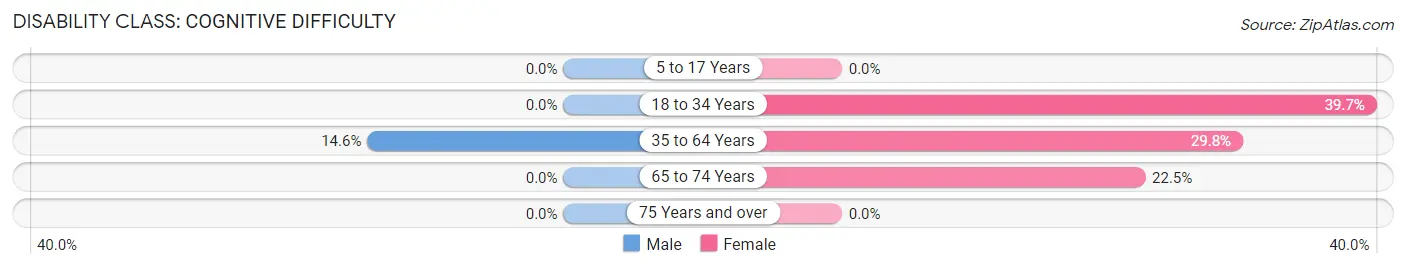
| Age Bracket | Male | Female |
| 5 to 17 Years | 0 (0.0%) | 0 (0.0%) |
| 18 to 34 Years | 0 (0.0%) | 27 (39.7%) |
| 35 to 64 Years | 23 (14.6%) | 53 (29.8%) |
| 65 to 74 Years | 0 (0.0%) | 25 (22.5%) |
| 75 Years and over | 0 (0.0%) | 0 (0.0%) |
Disability Class: Ambulatory Difficulty
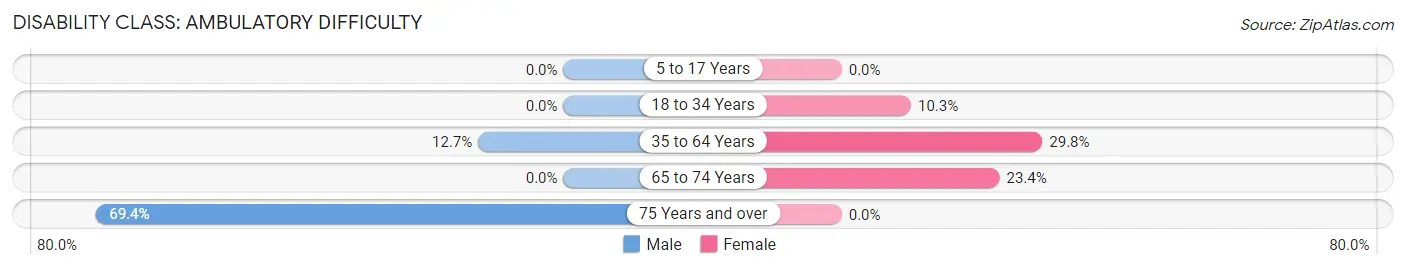
| Age Bracket | Male | Female |
| 5 to 17 Years | 0 (0.0%) | 0 (0.0%) |
| 18 to 34 Years | 0 (0.0%) | 7 (10.3%) |
| 35 to 64 Years | 20 (12.7%) | 53 (29.8%) |
| 65 to 74 Years | 0 (0.0%) | 26 (23.4%) |
| 75 Years and over | 43 (69.4%) | 0 (0.0%) |
Disability Class: Self-Care Difficulty
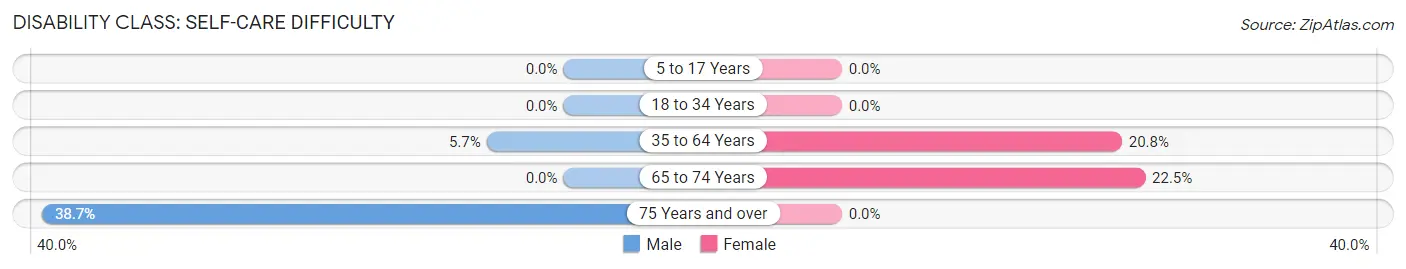
| Age Bracket | Male | Female |
| 5 to 17 Years | 0 (0.0%) | 0 (0.0%) |
| 18 to 34 Years | 0 (0.0%) | 0 (0.0%) |
| 35 to 64 Years | 9 (5.7%) | 37 (20.8%) |
| 65 to 74 Years | 0 (0.0%) | 25 (22.5%) |
| 75 Years and over | 24 (38.7%) | 0 (0.0%) |
Technology Access in Flint Creek
Computing Device Access in Flint Creek
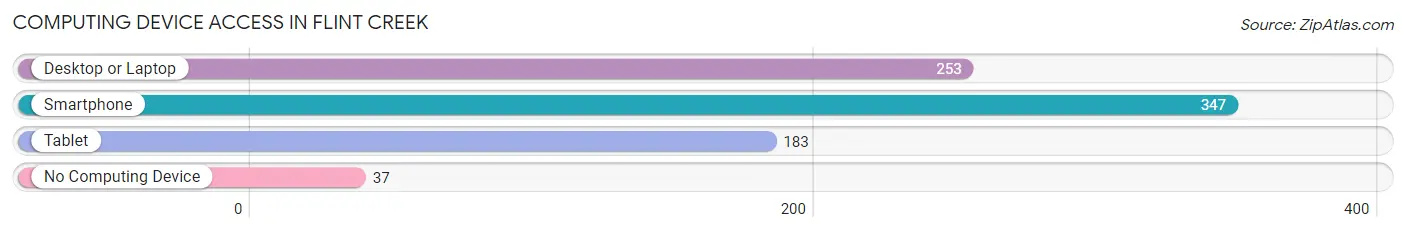
| Device Type | # Households | % Households |
| Desktop or Laptop | 253 | 62.3% |
| Smartphone | 347 | 85.5% |
| Tablet | 183 | 45.1% |
| No Computing Device | 37 | 9.1% |
| Total | 406 | 100.0% |
Internet Access in Flint Creek
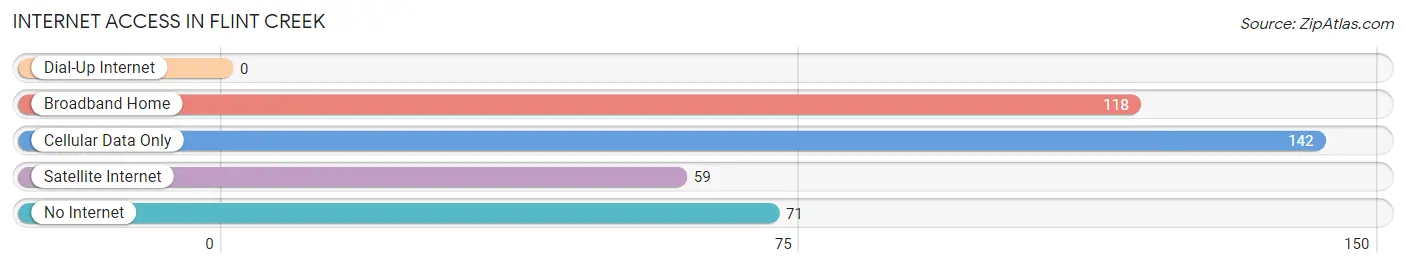
| Internet Type | # Households | % Households |
| Dial-Up Internet | 0 | 0.0% |
| Broadband Home | 118 | 29.1% |
| Cellular Data Only | 142 | 35.0% |
| Satellite Internet | 59 | 14.5% |
| No Internet | 71 | 17.5% |
| Total | 406 | 100.0% |
Flint Creek Summary
Flint Creek, Oklahoma is a small unincorporated community located in the northeastern corner of the state. It is situated in the foothills of the Ozark Mountains, and is part of the Ozark Plateau. The town is located in Adair County, and is bordered by the Arkansas River to the east and the Flint Creek to the west.
History
Flint Creek was first settled in the late 1800s by settlers from the nearby Cherokee Nation. The town was originally known as Flint Hill, and was named after the nearby creek. The town was officially incorporated in 1902, and the name was changed to Flint Creek.
The town was a popular stop for travelers on the Arkansas River, and was a hub for the local timber industry. The town was also home to a number of small businesses, including a general store, a blacksmith, and a sawmill.
Geography
Flint Creek is located in the foothills of the Ozark Mountains, and is part of the Ozark Plateau. The town is situated in Adair County, and is bordered by the Arkansas River to the east and the Flint Creek to the west. The town is located at an elevation of 890 feet above sea level.
The town is located in a temperate climate, with hot summers and mild winters. The average annual temperature is around 60 degrees Fahrenheit, and the average annual precipitation is around 40 inches.
Economy
The economy of Flint Creek is largely based on agriculture and tourism. The town is home to a number of small farms, and the surrounding area is known for its production of hay, corn, and soybeans. The town is also home to a number of small businesses, including a general store, a blacksmith, and a sawmill.
The town is also a popular tourist destination, and is home to a number of attractions, including the Flint Creek Wildlife Refuge, the Flint Creek Nature Center, and the Flint Creek Museum. The town is also home to a number of outdoor recreation opportunities, including fishing, hunting, and camping.
Demographics
As of the 2010 census, the population of Flint Creek was 1,072. The town is predominantly white, with a small minority population. The median household income is around $35,000, and the median home value is around $90,000. The town has a low unemployment rate, and the poverty rate is around 10%.
Conclusion
Flint Creek, Oklahoma is a small unincorporated community located in the northeastern corner of the state. It is situated in the foothills of the Ozark Mountains, and is part of the Ozark Plateau. The town is home to a number of small businesses, and is a popular tourist destination. The economy of Flint Creek is largely based on agriculture and tourism, and the town has a low unemployment rate and a median household income of around $35,000.
Common Questions
What is Per Capita Income in Flint Creek?
Per Capita income in Flint Creek is $27,590.
What is the Median Family Income in Flint Creek?
Median Family Income in Flint Creek is $52,159.
What is the Median Household income in Flint Creek?
Median Household Income in Flint Creek is $47,460.
What is Income or Wage Gap in Flint Creek?
Income or Wage Gap in Flint Creek is 16.8%.
Women in Flint Creek earn 83.2 cents for every dollar earned by a man.
What is Inequality or Gini Index in Flint Creek?
Inequality or Gini Index in Flint Creek is 0.42.
What is the Total Population of Flint Creek?
Total Population of Flint Creek is 969.
What is the Total Male Population of Flint Creek?
Total Male Population of Flint Creek is 414.
What is the Total Female Population of Flint Creek?
Total Female Population of Flint Creek is 555.
What is the Ratio of Males per 100 Females in Flint Creek?
There are 74.59 Males per 100 Females in Flint Creek.
What is the Ratio of Females per 100 Males in Flint Creek?
There are 134.06 Females per 100 Males in Flint Creek.
What is the Median Population Age in Flint Creek?
Median Population Age in Flint Creek is 46.6 Years.
What is the Average Family Size in Flint Creek
Average Family Size in Flint Creek is 3.2 People.
What is the Average Household Size in Flint Creek
Average Household Size in Flint Creek is 2.4 People.
How Large is the Labor Force in Flint Creek?
There are 358 People in the Labor Forcein in Flint Creek.
What is the Percentage of People in the Labor Force in Flint Creek?
43.5% of People are in the Labor Force in Flint Creek.
What is the Unemployment Rate in Flint Creek?
Unemployment Rate in Flint Creek is 5.0%.