Laverne, OK Map & Demographics
Laverne Map
Laverne Overview
$22,316
PER CAPITA INCOME
$57,019
AVG FAMILY INCOME
$54,886
AVG HOUSEHOLD INCOME
30.7%
WAGE / INCOME GAP [ % ]
69.3¢/ $1
WAGE / INCOME GAP [ $ ]
0.37
INEQUALITY / GINI INDEX
1,035
TOTAL POPULATION
504
MALE POPULATION
531
FEMALE POPULATION
94.92
MALES / 100 FEMALES
105.36
FEMALES / 100 MALES
35.2
MEDIAN AGE
3.3
AVG FAMILY SIZE
2.9
AVG HOUSEHOLD SIZE
506
LABOR FORCE [ PEOPLE ]
66.1%
PERCENT IN LABOR FORCE
3.0%
UNEMPLOYMENT RATE
Laverne Zip Codes
Laverne Area Codes
Income in Laverne
Income Overview in Laverne
Per Capita Income in Laverne is $22,316, while median incomes of families and households are $57,019 and $54,886 respectively.
| Characteristic | Number | Measure |
| Per Capita Income | 1,035 | $22,316 |
| Median Family Income | 287 | $57,019 |
| Mean Family Income | 287 | $64,351 |
| Median Household Income | 363 | $54,886 |
| Mean Household Income | 363 | $62,605 |
| Income Deficit | 287 | $0 |
| Wage / Income Gap (%) | 1,035 | 30.70% |
| Wage / Income Gap ($) | 1,035 | 69.30¢ per $1 |
| Gini / Inequality Index | 1,035 | 0.37 |
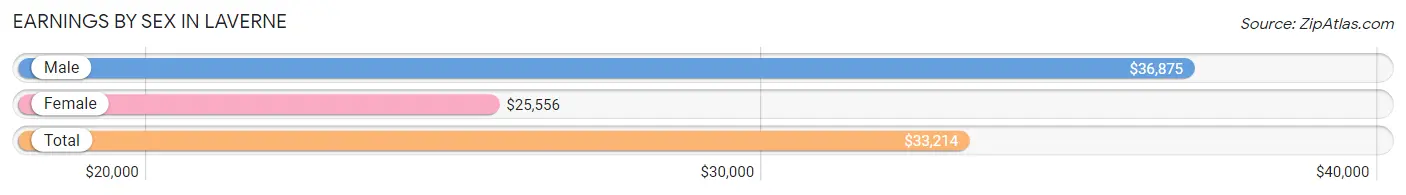
Earnings by Sex in Laverne
Average Earnings in Laverne are $33,214, $36,875 for men and $25,556 for women, a difference of 30.7%.
| Sex | Number | Average Earnings |
| Male | 312 (60.0%) | $36,875 |
| Female | 208 (40.0%) | $25,556 |
| Total | 520 (100.0%) | $33,214 |
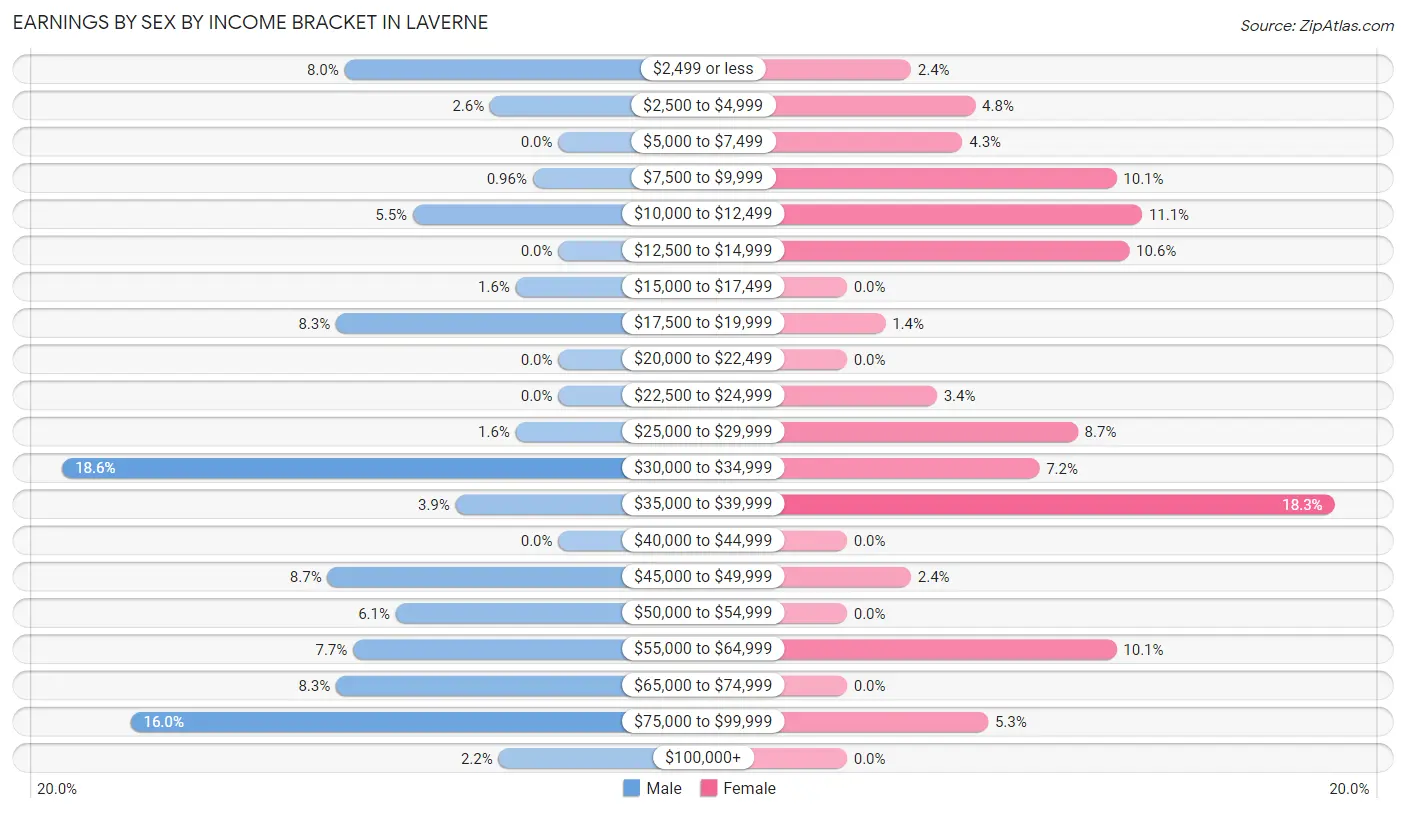
Earnings by Sex by Income Bracket in Laverne
The most common earnings brackets in Laverne are $30,000 to $34,999 for men (58 | 18.6%) and $35,000 to $39,999 for women (38 | 18.3%).
| Income | Male | Female |
| $2,499 or less | 25 (8.0%) | 5 (2.4%) |
| $2,500 to $4,999 | 8 (2.6%) | 10 (4.8%) |
| $5,000 to $7,499 | 0 (0.0%) | 9 (4.3%) |
| $7,500 to $9,999 | 3 (1.0%) | 21 (10.1%) |
| $10,000 to $12,499 | 17 (5.4%) | 23 (11.1%) |
| $12,500 to $14,999 | 0 (0.0%) | 22 (10.6%) |
| $15,000 to $17,499 | 5 (1.6%) | 0 (0.0%) |
| $17,500 to $19,999 | 26 (8.3%) | 3 (1.4%) |
| $20,000 to $22,499 | 0 (0.0%) | 0 (0.0%) |
| $22,500 to $24,999 | 0 (0.0%) | 7 (3.4%) |
| $25,000 to $29,999 | 5 (1.6%) | 18 (8.6%) |
| $30,000 to $34,999 | 58 (18.6%) | 15 (7.2%) |
| $35,000 to $39,999 | 12 (3.8%) | 38 (18.3%) |
| $40,000 to $44,999 | 0 (0.0%) | 0 (0.0%) |
| $45,000 to $49,999 | 27 (8.6%) | 5 (2.4%) |
| $50,000 to $54,999 | 19 (6.1%) | 0 (0.0%) |
| $55,000 to $64,999 | 24 (7.7%) | 21 (10.1%) |
| $65,000 to $74,999 | 26 (8.3%) | 0 (0.0%) |
| $75,000 to $99,999 | 50 (16.0%) | 11 (5.3%) |
| $100,000+ | 7 (2.2%) | 0 (0.0%) |
| Total | 312 (100.0%) | 208 (100.0%) |
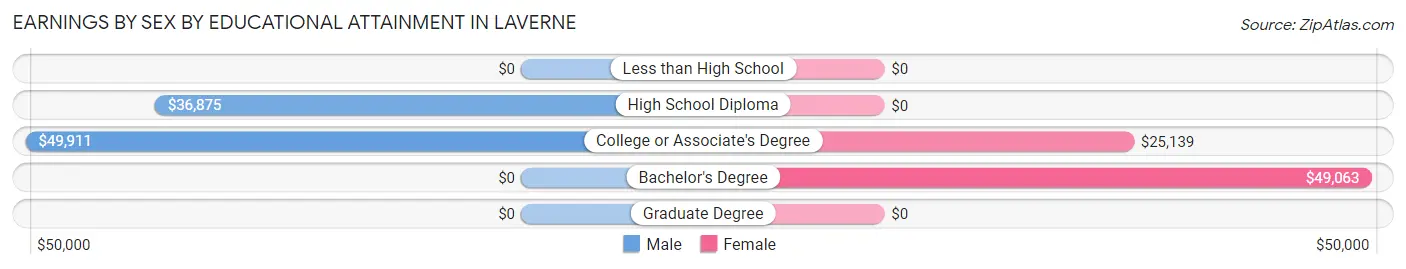
Earnings by Sex by Educational Attainment in Laverne
Average earnings in Laverne are $48,854 for men and $30,250 for women, a difference of 38.1%. Men with an educational attainment of college or associate's degree enjoy the highest average annual earnings of $49,911, while those with high school diploma education earn the least with $36,875. Women with an educational attainment of bachelor's degree earn the most with the average annual earnings of $49,063, while those with college or associate's degree education have the smallest earnings of $25,139.
| Educational Attainment | Male Income | Female Income |
| Less than High School | - | - |
| High School Diploma | $36,875 | $0 |
| College or Associate's Degree | $49,911 | $25,139 |
| Bachelor's Degree | - | - |
| Graduate Degree | - | - |
| Total | $48,854 | $30,250 |
Family Income in Laverne
Family Income Brackets in Laverne
According to the Laverne family income data, there are 89 families falling into the $50,000 to $74,999 income range, which is the most common income bracket and makes up 31.0% of all families.
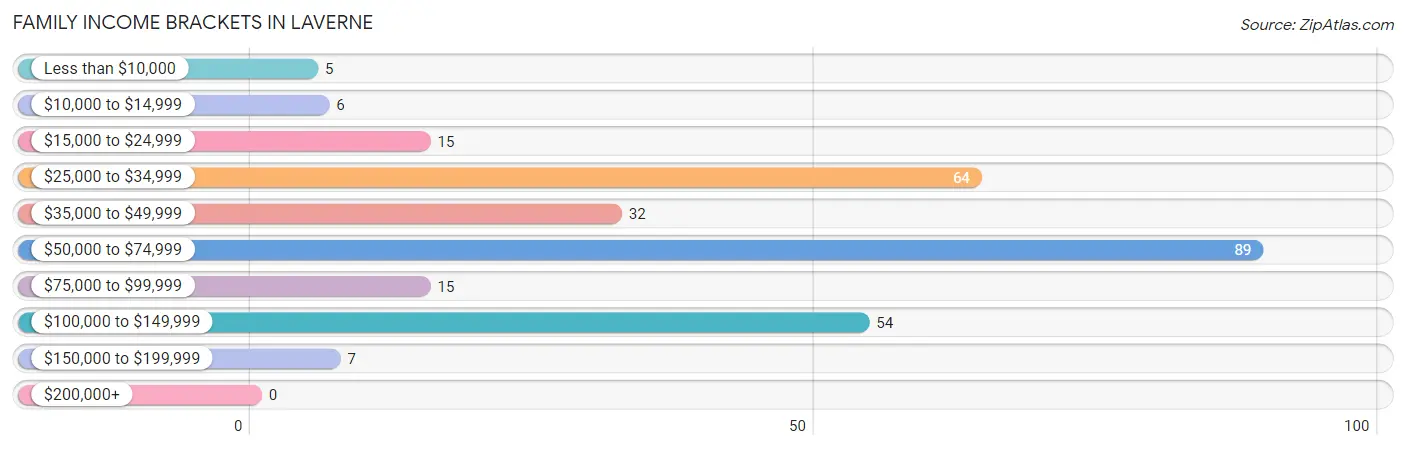
| Income Bracket | # Families | % Families |
| Less than $10,000 | 5 | 1.7% |
| $10,000 to $14,999 | 6 | 2.1% |
| $15,000 to $24,999 | 15 | 5.2% |
| $25,000 to $34,999 | 64 | 22.3% |
| $35,000 to $49,999 | 32 | 11.1% |
| $50,000 to $74,999 | 89 | 31.0% |
| $75,000 to $99,999 | 15 | 5.2% |
| $100,000 to $149,999 | 54 | 18.8% |
| $150,000 to $199,999 | 7 | 2.4% |
| $200,000+ | 0 | 0.0% |
Family Income by Famaliy Size in Laverne
4-person families (68 | 23.7%) account for the highest median family income in Laverne with $68,261 per family, while 2-person families (65 | 22.7%) have the highest median income of $28,792 per family member.
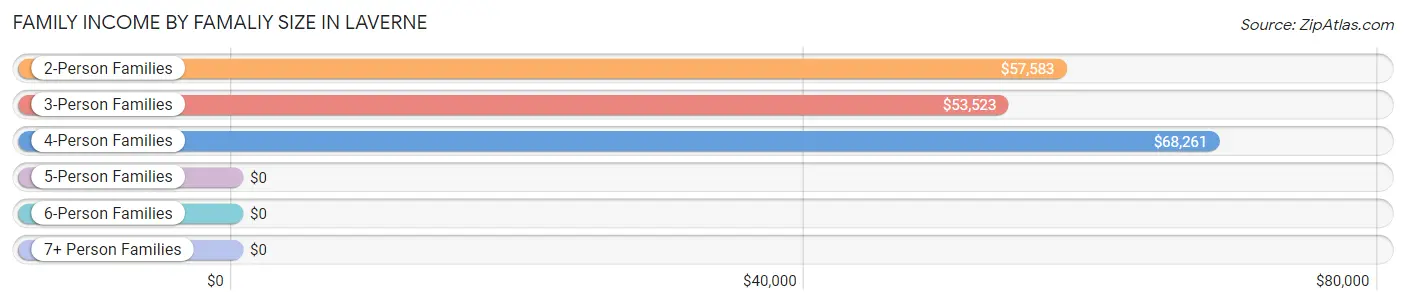
| Income Bracket | # Families | Median Income |
| 2-Person Families | 65 (22.7%) | $57,583 |
| 3-Person Families | 65 (22.7%) | $53,523 |
| 4-Person Families | 68 (23.7%) | $68,261 |
| 5-Person Families | 38 (13.2%) | $0 |
| 6-Person Families | 51 (17.8%) | $0 |
| 7+ Person Families | 0 (0.0%) | $0 |
| Total | 287 (100.0%) | $57,019 |
Family Income by Number of Earners in Laverne
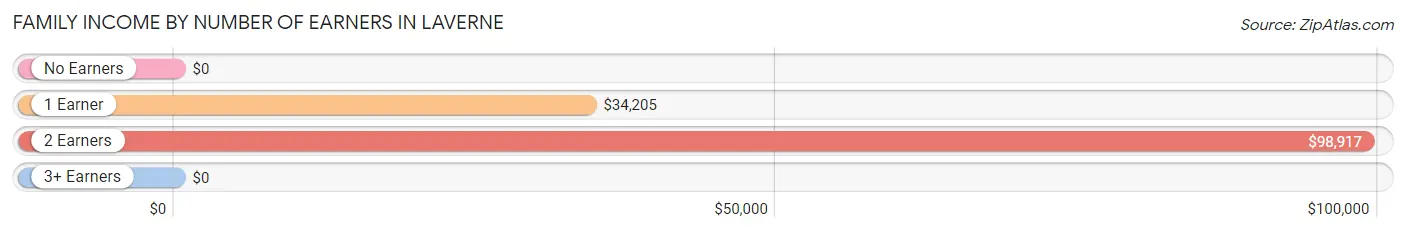
| Number of Earners | # Families | Median Income |
| No Earners | 21 (7.3%) | $0 |
| 1 Earner | 128 (44.6%) | $34,205 |
| 2 Earners | 95 (33.1%) | $98,917 |
| 3+ Earners | 43 (15.0%) | $0 |
| Total | 287 (100.0%) | $57,019 |
Household Income in Laverne
Household Income Brackets in Laverne
With 83 households falling in the category, the $50,000 to $74,999 income range is the most frequent in Laverne, accounting for 22.9% of all households.
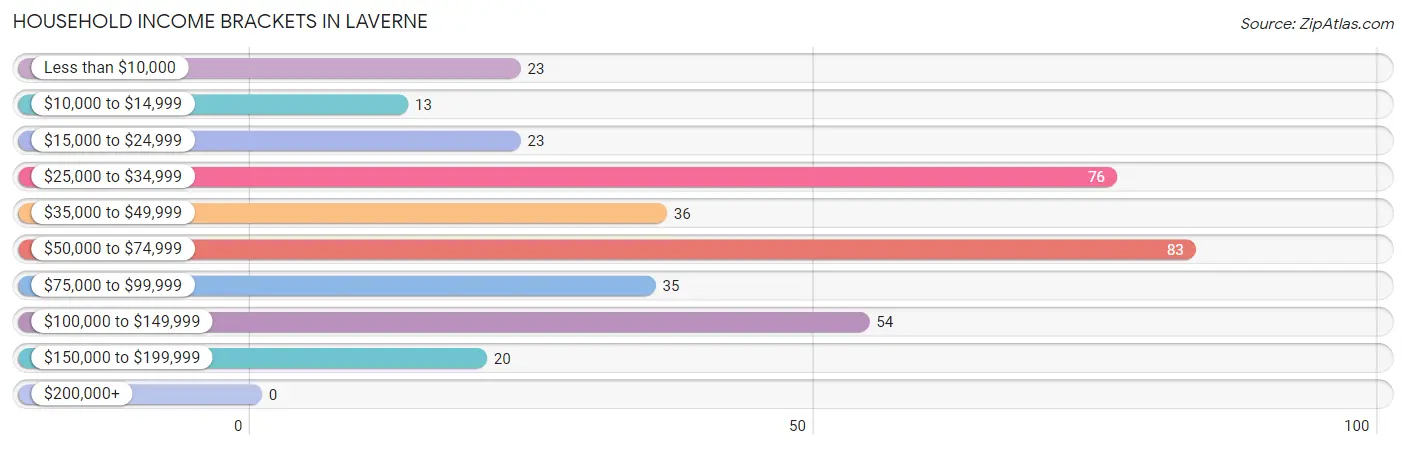
| Income Bracket | # Households | % Households |
| Less than $10,000 | 23 | 6.3% |
| $10,000 to $14,999 | 13 | 3.6% |
| $15,000 to $24,999 | 23 | 6.3% |
| $25,000 to $34,999 | 76 | 20.9% |
| $35,000 to $49,999 | 36 | 9.9% |
| $50,000 to $74,999 | 83 | 22.9% |
| $75,000 to $99,999 | 35 | 9.6% |
| $100,000 to $149,999 | 54 | 14.9% |
| $150,000 to $199,999 | 20 | 5.5% |
| $200,000+ | 0 | 0.0% |
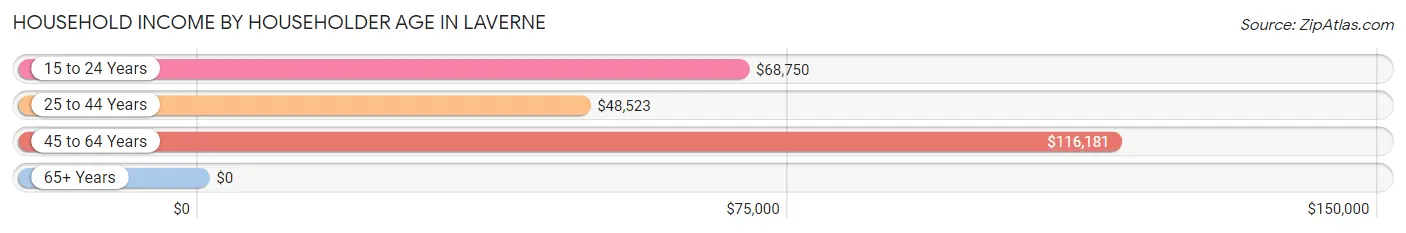
Household Income by Householder Age in Laverne
The median household income in Laverne is $54,886, with the highest median household income of $116,181 found in the 45 to 64 years age bracket for the primary householder. A total of 89 households (24.5%) fall into this category. Meanwhile, the 65+ years age bracket for the primary householder has the lowest median household income of $0, with 57 households (15.7%) in this group.
| Income Bracket | # Households | Median Income |
| 15 to 24 Years | 28 (7.7%) | $68,750 |
| 25 to 44 Years | 189 (52.1%) | $48,523 |
| 45 to 64 Years | 89 (24.5%) | $116,181 |
| 65+ Years | 57 (15.7%) | $0 |
| Total | 363 (100.0%) | $54,886 |
Poverty in Laverne
Income Below Poverty by Sex and Age in Laverne
With 17.9% poverty level for males and 22.8% for females among the residents of Laverne, 65 to 74 year old males and 16 and 17 year old females are the most vulnerable to poverty, with 14 males (100.0%) and 13 females (54.2%) in their respective age groups living below the poverty level.
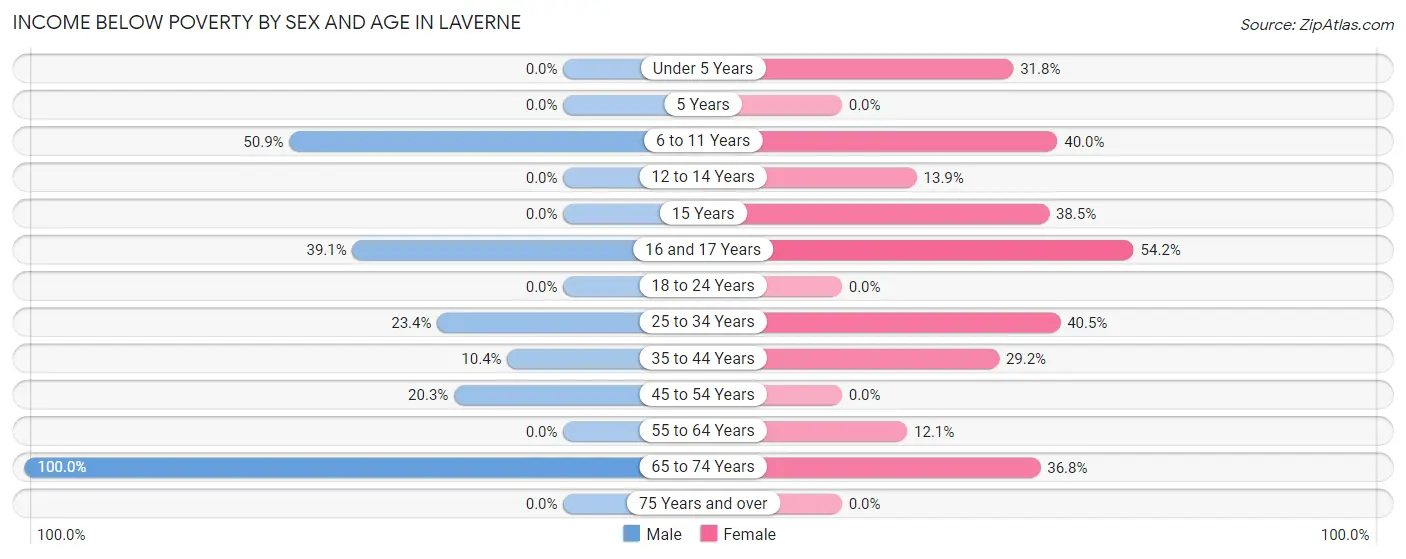
| Age Bracket | Male | Female |
| Under 5 Years | 0 (0.0%) | 7 (31.8%) |
| 5 Years | 0 (0.0%) | 0 (0.0%) |
| 6 to 11 Years | 30 (50.8%) | 30 (40.0%) |
| 12 to 14 Years | 0 (0.0%) | 5 (13.9%) |
| 15 Years | 0 (0.0%) | 5 (38.5%) |
| 16 and 17 Years | 9 (39.1%) | 13 (54.2%) |
| 18 to 24 Years | 0 (0.0%) | 0 (0.0%) |
| 25 to 34 Years | 11 (23.4%) | 15 (40.5%) |
| 35 to 44 Years | 11 (10.4%) | 35 (29.2%) |
| 45 to 54 Years | 15 (20.3%) | 0 (0.0%) |
| 55 to 64 Years | 0 (0.0%) | 4 (12.1%) |
| 65 to 74 Years | 14 (100.0%) | 7 (36.8%) |
| 75 Years and over | 0 (0.0%) | 0 (0.0%) |
| Total | 90 (17.9%) | 121 (22.8%) |
Income Above Poverty by Sex and Age in Laverne
According to the poverty statistics in Laverne, males aged under 5 years and females aged 5 years are the age groups that are most secure financially, with 100.0% of males and 100.0% of females in these age groups living above the poverty line.
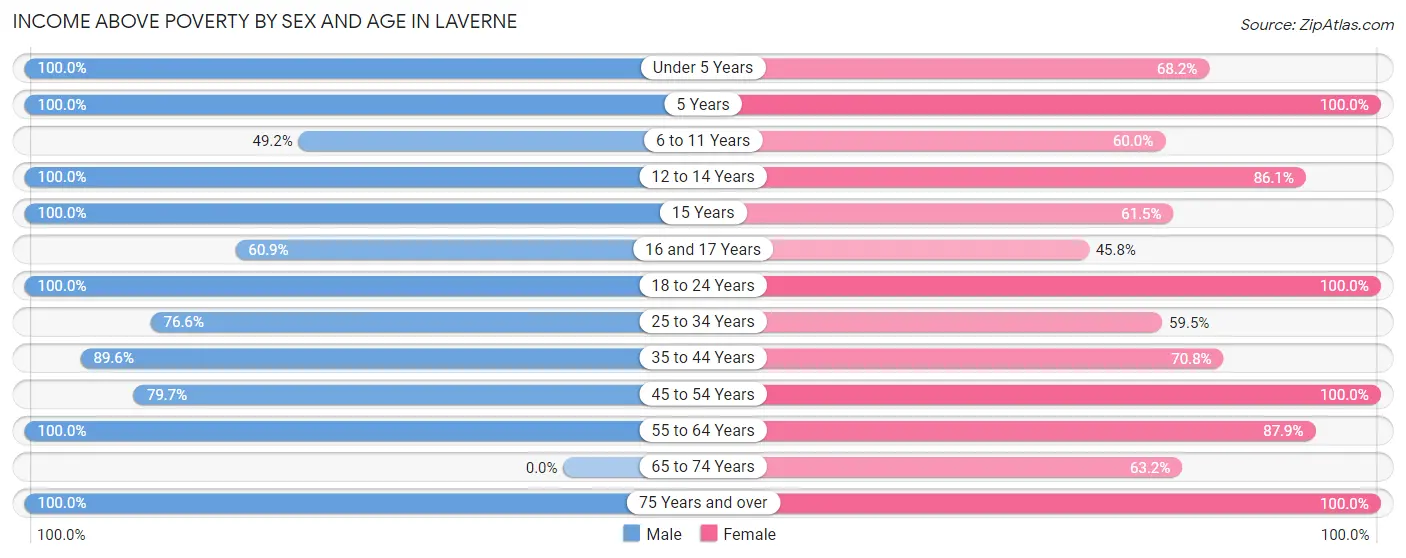
| Age Bracket | Male | Female |
| Under 5 Years | 26 (100.0%) | 15 (68.2%) |
| 5 Years | 2 (100.0%) | 9 (100.0%) |
| 6 to 11 Years | 29 (49.1%) | 45 (60.0%) |
| 12 to 14 Years | 15 (100.0%) | 31 (86.1%) |
| 15 Years | 12 (100.0%) | 8 (61.5%) |
| 16 and 17 Years | 14 (60.9%) | 11 (45.8%) |
| 18 to 24 Years | 63 (100.0%) | 49 (100.0%) |
| 25 to 34 Years | 36 (76.6%) | 22 (59.5%) |
| 35 to 44 Years | 95 (89.6%) | 85 (70.8%) |
| 45 to 54 Years | 59 (79.7%) | 63 (100.0%) |
| 55 to 64 Years | 44 (100.0%) | 29 (87.9%) |
| 65 to 74 Years | 0 (0.0%) | 12 (63.2%) |
| 75 Years and over | 19 (100.0%) | 31 (100.0%) |
| Total | 414 (82.1%) | 410 (77.2%) |
Income Below Poverty Among Married-Couple Families in Laverne
The poverty statistics for married-couple families in Laverne show that 25.5% or 48 of the total 188 families live below the poverty line. Families with 3 or 4 children have the highest poverty rate of 60.0%, comprising of 48 families. On the other hand, families with no children have the lowest poverty rate of 0.0%, which includes 0 families.
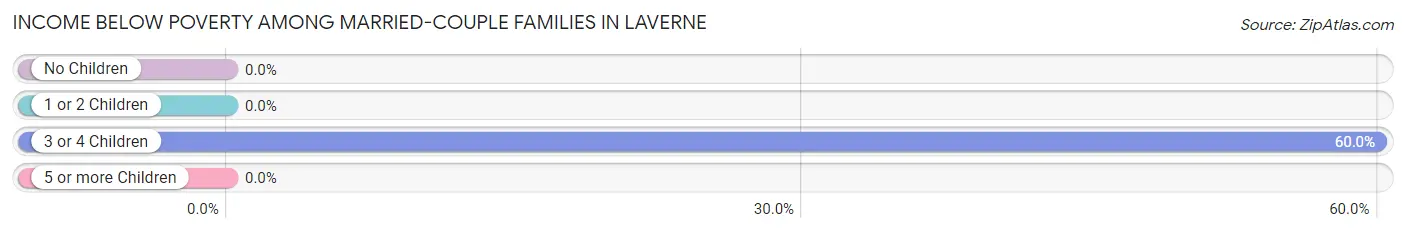
| Children | Above Poverty | Below Poverty |
| No Children | 27 (100.0%) | 0 (0.0%) |
| 1 or 2 Children | 81 (100.0%) | 0 (0.0%) |
| 3 or 4 Children | 32 (40.0%) | 48 (60.0%) |
| 5 or more Children | 0 (0.0%) | 0 (0.0%) |
| Total | 140 (74.5%) | 48 (25.5%) |
Income Below Poverty Among Single-Parent Households in Laverne
According to the poverty data in Laverne, 12.0% or 6 single-father households and 10.2% or 5 single-mother households are living below the poverty line. Among single-father households, those with 1 or 2 children have the highest poverty rate, with 6 households (12.0%) experiencing poverty. Likewise, among single-mother households, those with 1 or 2 children have the highest poverty rate, with 5 households (23.8%) falling below the poverty line.
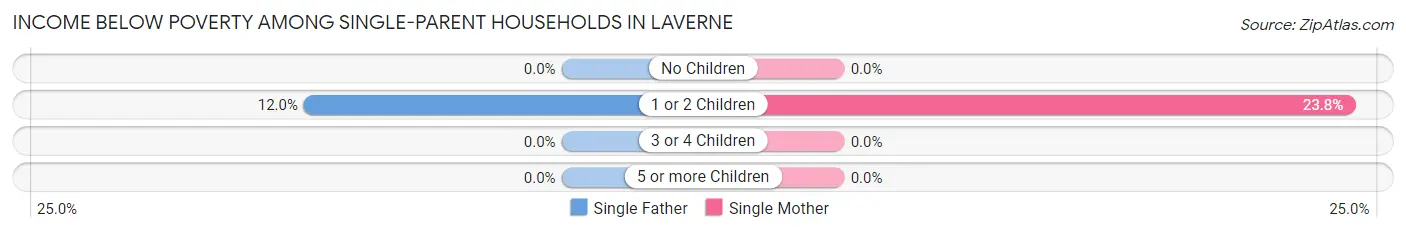
| Children | Single Father | Single Mother |
| No Children | 0 (0.0%) | 0 (0.0%) |
| 1 or 2 Children | 6 (12.0%) | 5 (23.8%) |
| 3 or 4 Children | 0 (0.0%) | 0 (0.0%) |
| 5 or more Children | 0 (0.0%) | 0 (0.0%) |
| Total | 6 (12.0%) | 5 (10.2%) |
Income Below Poverty Among Married-Couple vs Single-Parent Households in Laverne
The poverty data for Laverne shows that 48 of the married-couple family households (25.5%) and 11 of the single-parent households (11.1%) are living below the poverty level. Within the married-couple family households, those with 3 or 4 children have the highest poverty rate, with 48 households (60.0%) falling below the poverty line. Among the single-parent households, those with 1 or 2 children have the highest poverty rate, with 11 household (15.5%) living below poverty.
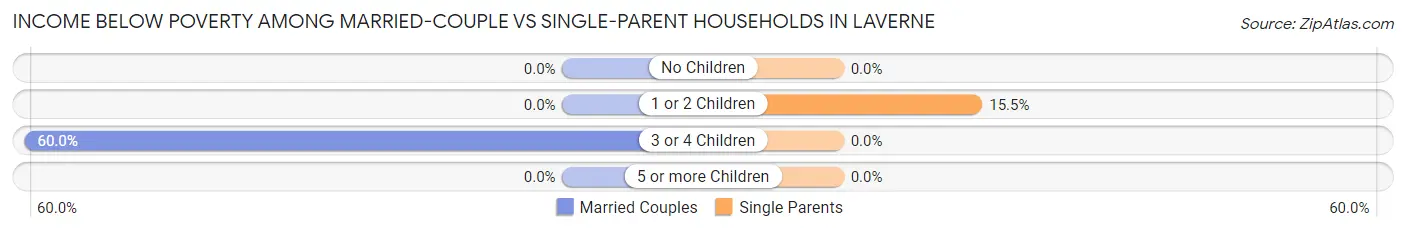
| Children | Married-Couple Families | Single-Parent Households |
| No Children | 0 (0.0%) | 0 (0.0%) |
| 1 or 2 Children | 0 (0.0%) | 11 (15.5%) |
| 3 or 4 Children | 48 (60.0%) | 0 (0.0%) |
| 5 or more Children | 0 (0.0%) | 0 (0.0%) |
| Total | 48 (25.5%) | 11 (11.1%) |
Race in Laverne
The most populous races in Laverne are White / Caucasian (715 | 69.1%), Hispanic or Latino (334 | 32.3%), and Some other Race (305 | 29.5%).
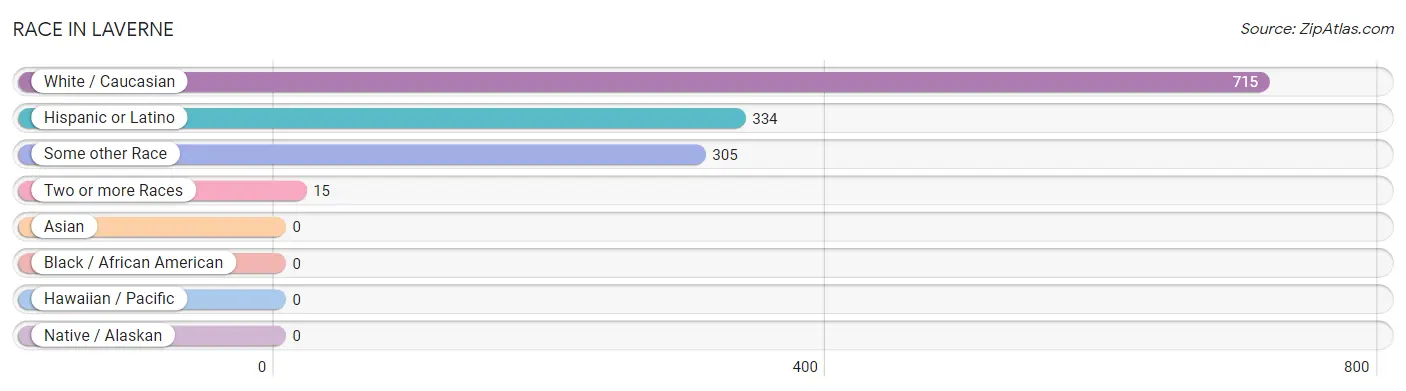
| Race | # Population | % Population |
| Asian | 0 | 0.0% |
| Black / African American | 0 | 0.0% |
| Hawaiian / Pacific | 0 | 0.0% |
| Hispanic or Latino | 334 | 32.3% |
| Native / Alaskan | 0 | 0.0% |
| White / Caucasian | 715 | 69.1% |
| Two or more Races | 15 | 1.5% |
| Some other Race | 305 | 29.5% |
| Total | 1,035 | 100.0% |
Ancestry in Laverne
The most populous ancestries reported in Laverne are Mexican (287 | 27.7%), German (152 | 14.7%), Irish (140 | 13.5%), English (79 | 7.6%), and Central American (47 | 4.5%), together accounting for 68.1% of all Laverne residents.
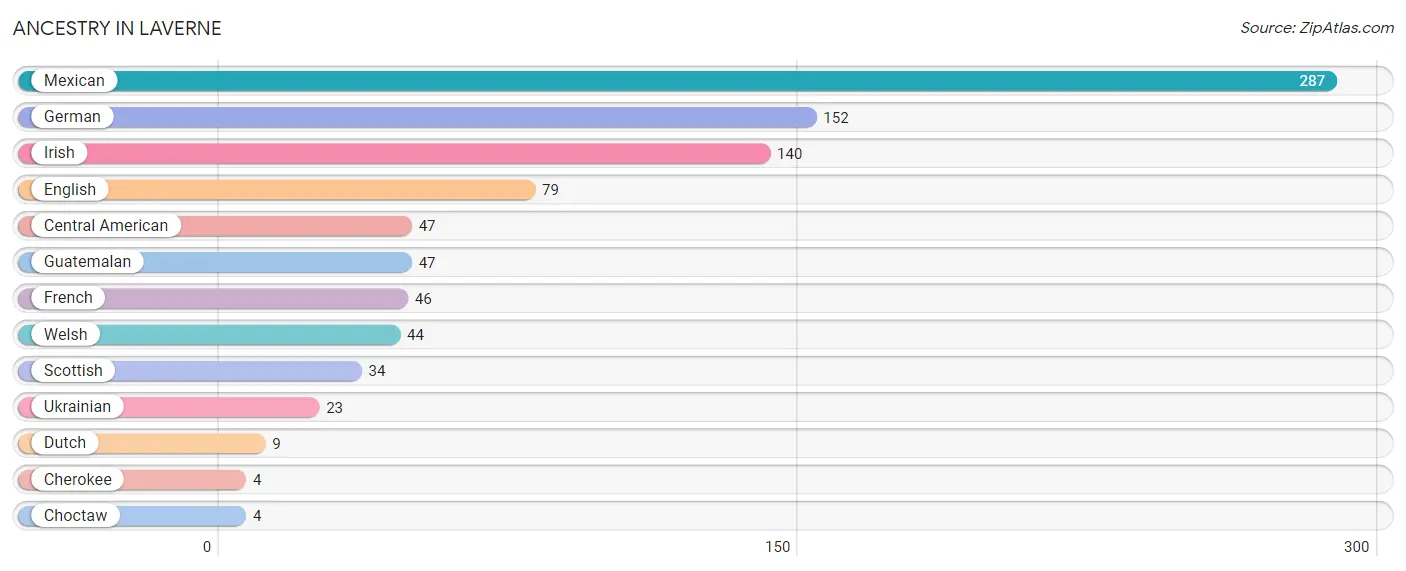
| Ancestry | # Population | % Population |
| Central American | 47 | 4.5% |
| Cherokee | 4 | 0.4% |
| Choctaw | 4 | 0.4% |
| Dutch | 9 | 0.9% |
| English | 79 | 7.6% |
| French | 46 | 4.4% |
| German | 152 | 14.7% |
| Guatemalan | 47 | 4.5% |
| Irish | 140 | 13.5% |
| Mexican | 287 | 27.7% |
| Scottish | 34 | 3.3% |
| Ukrainian | 23 | 2.2% |
| Welsh | 44 | 4.3% | View All 13 Rows |
Immigrants in Laverne
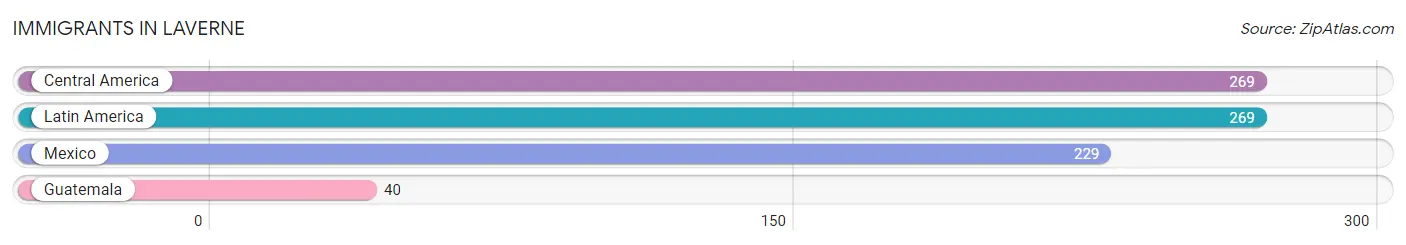
The most numerous immigrant groups reported in Laverne came from Central America (269 | 26.0%), Latin America (269 | 26.0%), Mexico (229 | 22.1%), and Guatemala (40 | 3.9%), together accounting for 78.0% of all Laverne residents.
| Immigration Origin | # Population | % Population |
| Central America | 269 | 26.0% |
| Guatemala | 40 | 3.9% |
| Latin America | 269 | 26.0% |
| Mexico | 229 | 22.1% | View All 4 Rows |
Sex and Age in Laverne
Sex and Age in Laverne
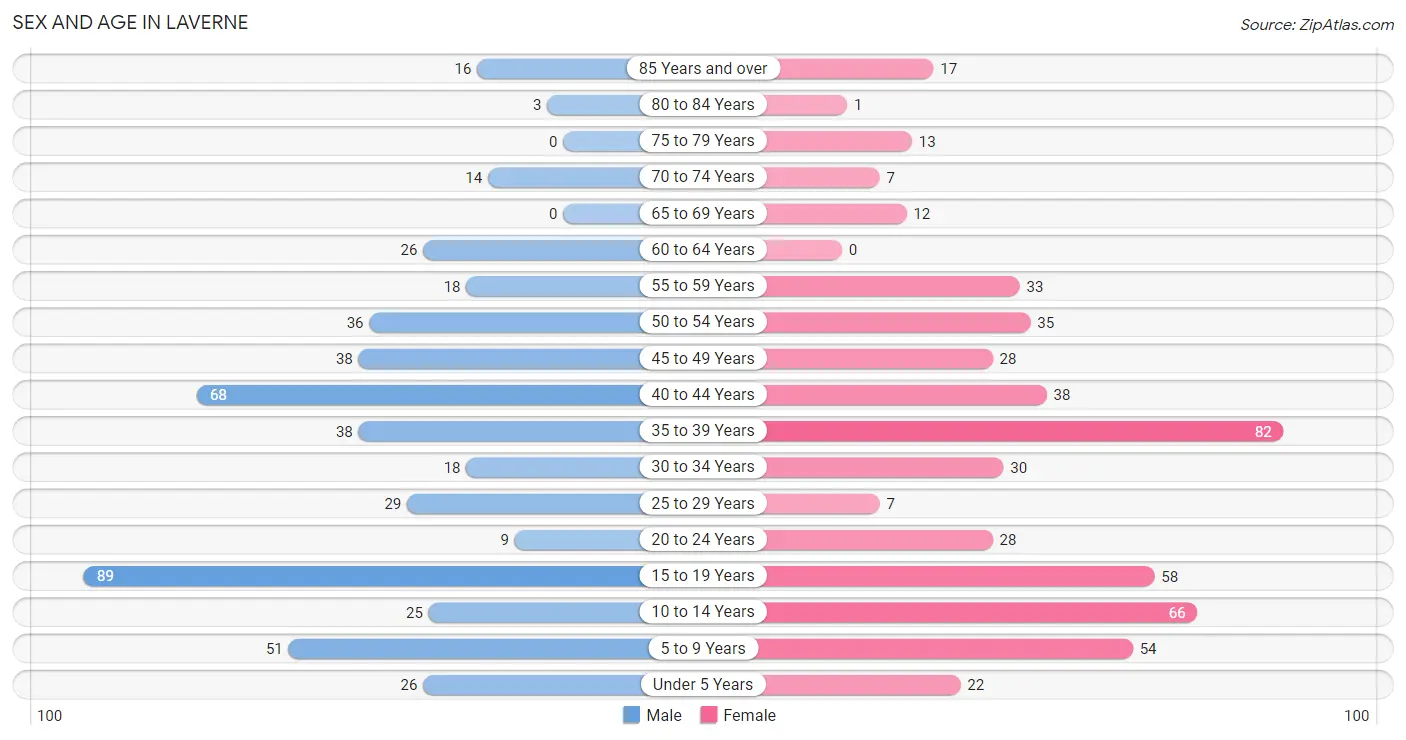
The most populous age groups in Laverne are 15 to 19 Years (89 | 17.7%) for men and 35 to 39 Years (82 | 15.4%) for women.
| Age Bracket | Male | Female |
| Under 5 Years | 26 (5.2%) | 22 (4.1%) |
| 5 to 9 Years | 51 (10.1%) | 54 (10.2%) |
| 10 to 14 Years | 25 (5.0%) | 66 (12.4%) |
| 15 to 19 Years | 89 (17.7%) | 58 (10.9%) |
| 20 to 24 Years | 9 (1.8%) | 28 (5.3%) |
| 25 to 29 Years | 29 (5.8%) | 7 (1.3%) |
| 30 to 34 Years | 18 (3.6%) | 30 (5.7%) |
| 35 to 39 Years | 38 (7.5%) | 82 (15.4%) |
| 40 to 44 Years | 68 (13.5%) | 38 (7.2%) |
| 45 to 49 Years | 38 (7.5%) | 28 (5.3%) |
| 50 to 54 Years | 36 (7.1%) | 35 (6.6%) |
| 55 to 59 Years | 18 (3.6%) | 33 (6.2%) |
| 60 to 64 Years | 26 (5.2%) | 0 (0.0%) |
| 65 to 69 Years | 0 (0.0%) | 12 (2.3%) |
| 70 to 74 Years | 14 (2.8%) | 7 (1.3%) |
| 75 to 79 Years | 0 (0.0%) | 13 (2.5%) |
| 80 to 84 Years | 3 (0.6%) | 1 (0.2%) |
| 85 Years and over | 16 (3.2%) | 17 (3.2%) |
| Total | 504 (100.0%) | 531 (100.0%) |
Families and Households in Laverne
Median Family Size in Laverne
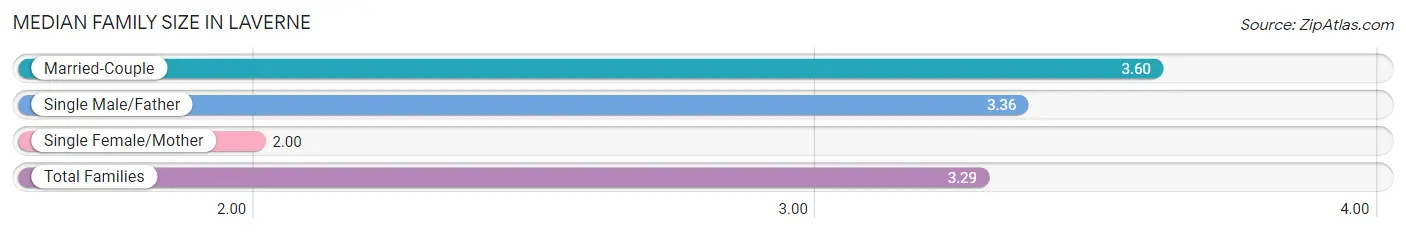
The median family size in Laverne is 3.29 persons per family, with married-couple families (188 | 65.5%) accounting for the largest median family size of 3.6 persons per family. On the other hand, single female/mother families (49 | 17.1%) represent the smallest median family size with 2.00 persons per family.
| Family Type | # Families | Family Size |
| Married-Couple | 188 (65.5%) | 3.60 |
| Single Male/Father | 50 (17.4%) | 3.36 |
| Single Female/Mother | 49 (17.1%) | 2.00 |
| Total Families | 287 (100.0%) | 3.29 |
Median Household Size in Laverne
| Household Type | # Households | Household Size |
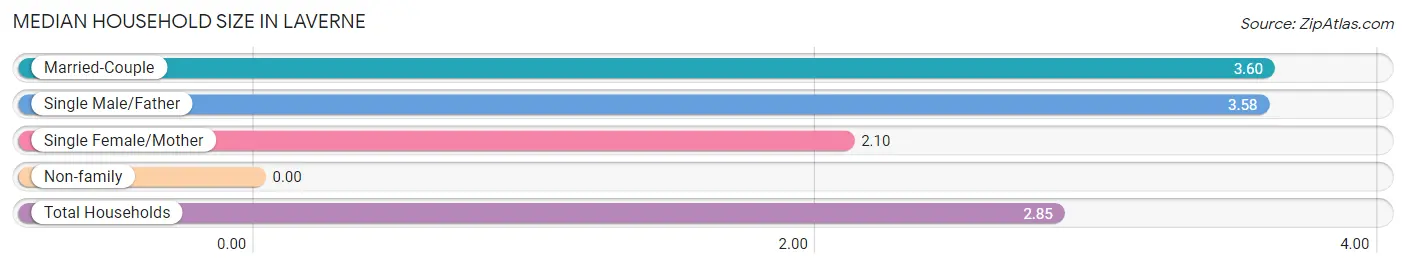
| Married-Couple | 188 (51.8%) | 3.60 |
| Single Male/Father | 50 (13.8%) | 3.58 |
| Single Female/Mother | 49 (13.5%) | 2.10 |
| Non-family | 76 (20.9%) | - |
| Total Households | 363 (100.0%) | 2.85 |
Household Size by Marriage Status in Laverne
Out of a total of 363 households in Laverne, 287 (79.1%) are family households, while 76 (20.9%) are nonfamily households. The most numerous type of family households are 2-person households, comprising 65, and the most common type of nonfamily households are 1-person households, comprising 76.
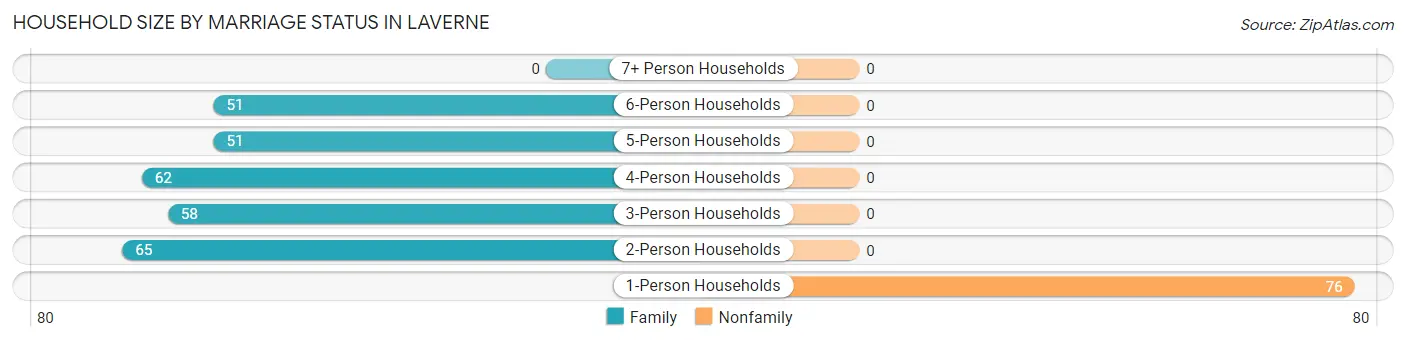
| Household Size | Family Households | Nonfamily Households |
| 1-Person Households | - | 76 (20.9%) |
| 2-Person Households | 65 (17.9%) | 0 (0.0%) |
| 3-Person Households | 58 (16.0%) | 0 (0.0%) |
| 4-Person Households | 62 (17.1%) | 0 (0.0%) |
| 5-Person Households | 51 (14.1%) | 0 (0.0%) |
| 6-Person Households | 51 (14.1%) | 0 (0.0%) |
| 7+ Person Households | 0 (0.0%) | 0 (0.0%) |
| Total | 287 (79.1%) | 76 (20.9%) |
Female Fertility in Laverne
Fertility by Age in Laverne
Average fertility rate in Laverne is 35.0 births per 1,000 women. Women in the age bracket of 20 to 34 years have the highest fertility rate with 154.0 births per 1,000 women. Women in the age bracket of 20 to 34 years acount for 100.0% of all women with births.
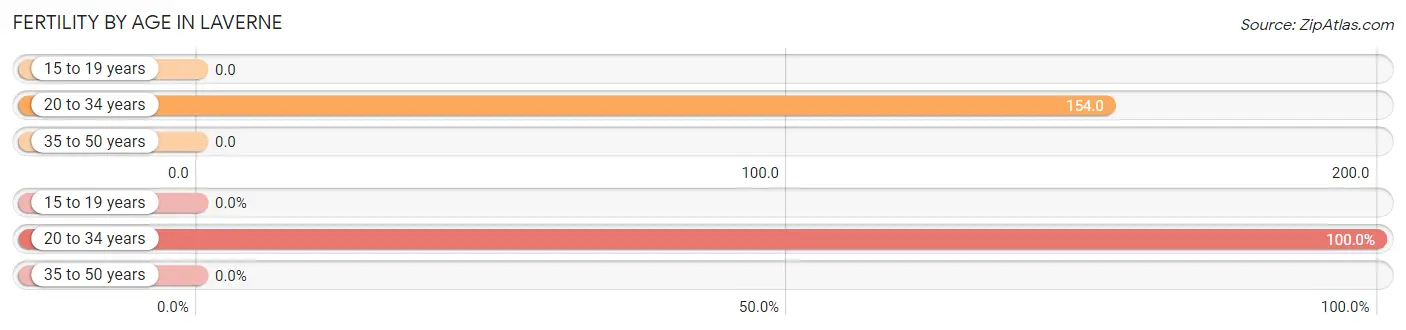
| Age Bracket | Women with Births | Births / 1,000 Women |
| 15 to 19 years | 0 (0.0%) | 0.0 |
| 20 to 34 years | 10 (100.0%) | 154.0 |
| 35 to 50 years | 0 (0.0%) | 0.0 |
| Total | 10 (100.0%) | 35.0 |
Fertility by Age by Marriage Status in Laverne
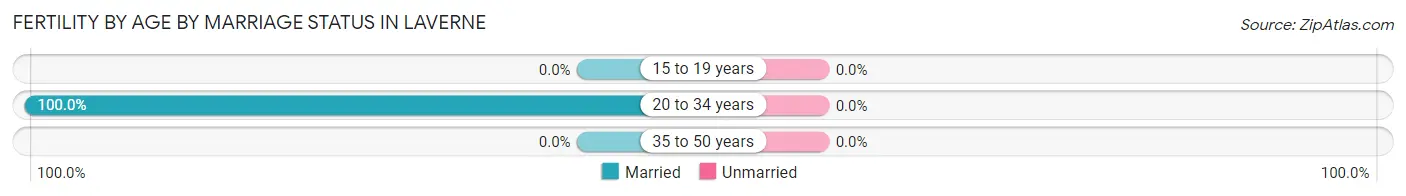
| Age Bracket | Married | Unmarried |
| 15 to 19 years | 0 (0.0%) | 0 (0.0%) |
| 20 to 34 years | 10 (100.0%) | 0 (0.0%) |
| 35 to 50 years | 0 (0.0%) | 0 (0.0%) |
| Total | 10 (100.0%) | 0 (0.0%) |
Fertility by Education in Laverne
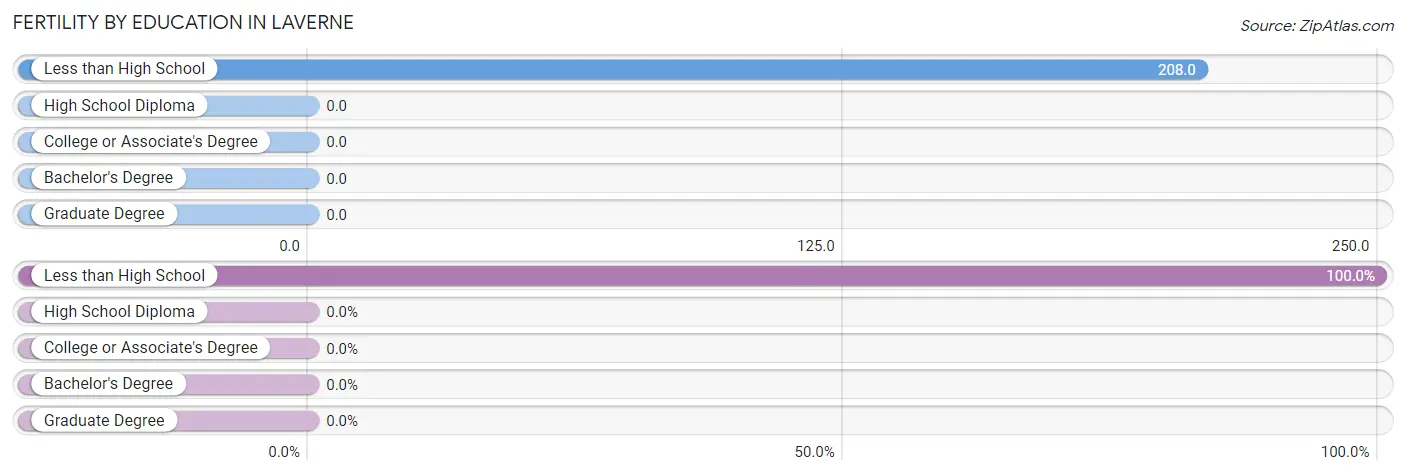
| Educational Attainment | Women with Births | Births / 1,000 Women |
| Less than High School | 10 (100.0%) | 208.0 |
| High School Diploma | 0 (0.0%) | 0.0 |
| College or Associate's Degree | 0 (0.0%) | 0.0 |
| Bachelor's Degree | 0 (0.0%) | 0.0 |
| Graduate Degree | 0 (0.0%) | 0.0 |
| Total | 10 (100.0%) | 35.0 |
Fertility by Education by Marriage Status in Laverne
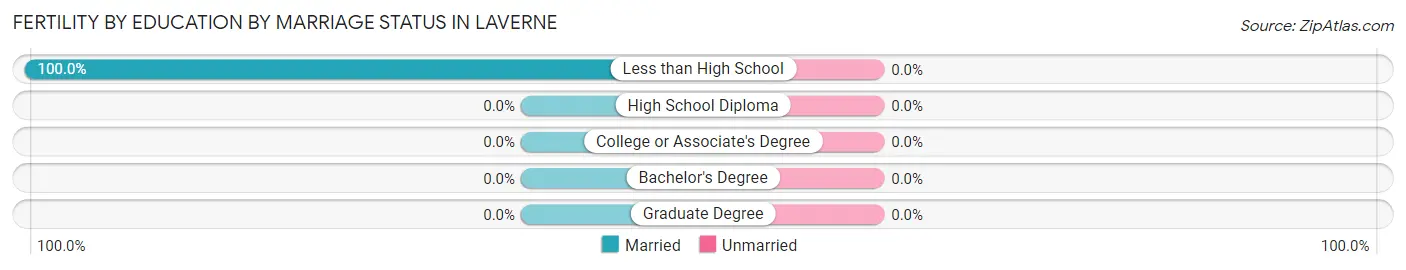
| Educational Attainment | Married | Unmarried |
| Less than High School | 10 (100.0%) | 0 (0.0%) |
| High School Diploma | 0 (0.0%) | 0 (0.0%) |
| College or Associate's Degree | 0 (0.0%) | 0 (0.0%) |
| Bachelor's Degree | 0 (0.0%) | 0 (0.0%) |
| Graduate Degree | 0 (0.0%) | 0 (0.0%) |
| Total | 10 (100.0%) | 0 (0.0%) |
Employment Characteristics in Laverne
Employment by Class of Employer in Laverne
Among the 477 employed individuals in Laverne, private company employees (306 | 64.1%), local government employees (67 | 14.1%), and state government employees (51 | 10.7%) make up the most common classes of employment.
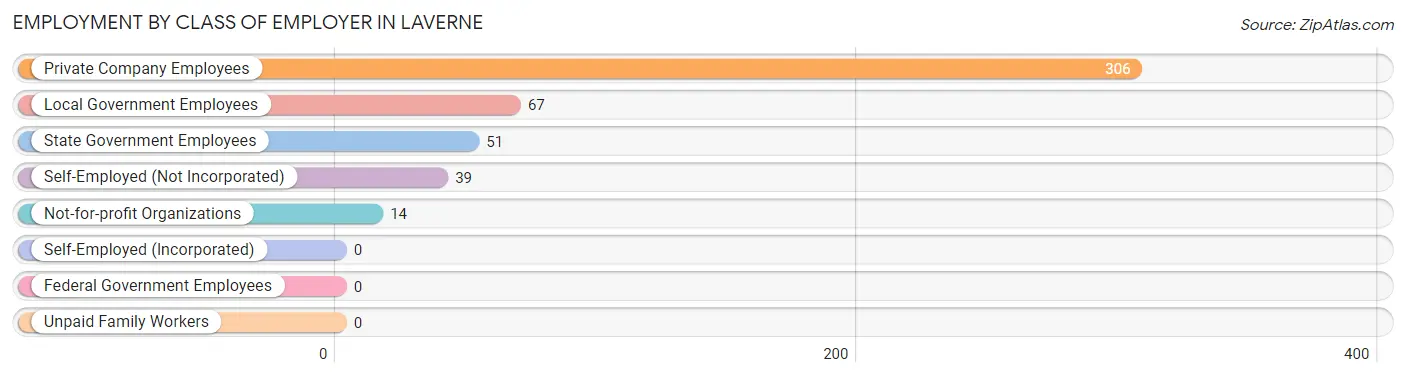
| Employer Class | # Employees | % Employees |
| Private Company Employees | 306 | 64.1% |
| Self-Employed (Incorporated) | 0 | 0.0% |
| Self-Employed (Not Incorporated) | 39 | 8.2% |
| Not-for-profit Organizations | 14 | 2.9% |
| Local Government Employees | 67 | 14.1% |
| State Government Employees | 51 | 10.7% |
| Federal Government Employees | 0 | 0.0% |
| Unpaid Family Workers | 0 | 0.0% |
| Total | 477 | 100.0% |
Employment Status by Age in Laverne
According to the labor force statistics for Laverne, out of the total population over 16 years of age (766), 66.1% or 506 individuals are in the labor force, with 3.0% or 15 of them unemployed. The age group with the highest labor force participation rate is 25 to 29 years, with 100.0% or 36 individuals in the labor force. Within the labor force, the 55 to 59 years age range has the highest percentage of unemployed individuals, with 10.3% or 4 of them being unemployed.
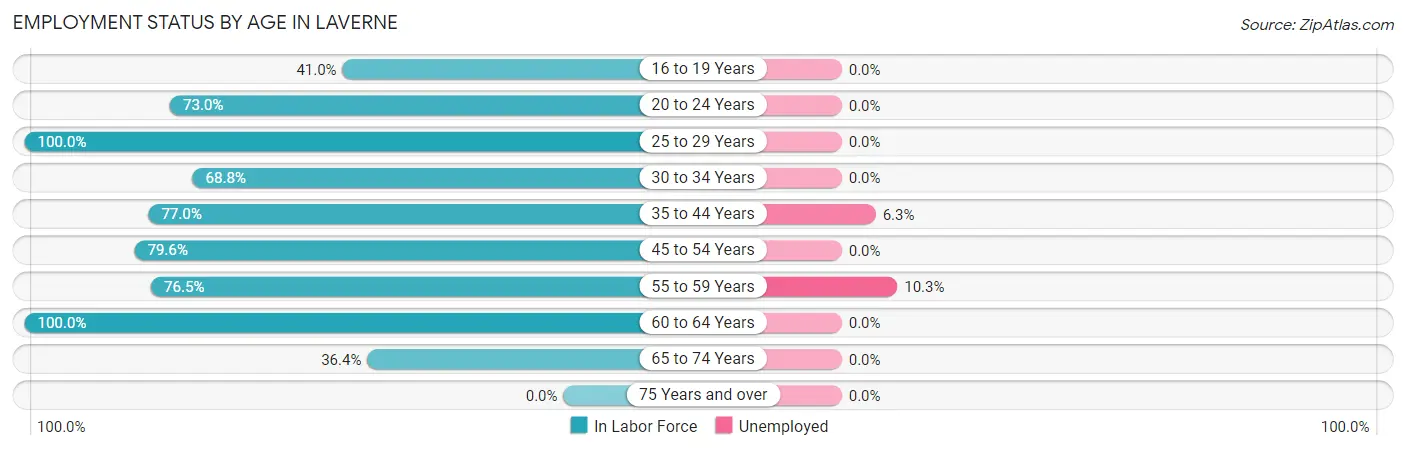
| Age Bracket | In Labor Force | Unemployed |
| 16 to 19 Years | 50 (41.0%) | 0 (0.0%) |
| 20 to 24 Years | 27 (73.0%) | 0 (0.0%) |
| 25 to 29 Years | 36 (100.0%) | 0 (0.0%) |
| 30 to 34 Years | 33 (68.8%) | 0 (0.0%) |
| 35 to 44 Years | 174 (77.0%) | 11 (6.3%) |
| 45 to 54 Years | 109 (79.6%) | 0 (0.0%) |
| 55 to 59 Years | 39 (76.5%) | 4 (10.3%) |
| 60 to 64 Years | 26 (100.0%) | 0 (0.0%) |
| 65 to 74 Years | 12 (36.4%) | 0 (0.0%) |
| 75 Years and over | 0 (0.0%) | 0 (0.0%) |
| Total | 506 (66.1%) | 15 (3.0%) |
Employment Status by Educational Attainment in Laverne
According to labor force statistics for Laverne, 79.6% of individuals (417) out of the total population between 25 and 64 years of age (524) are in the labor force, with 3.6% or 15 of them being unemployed. The group with the highest labor force participation rate are those with the educational attainment of less than high school, with 100.0% or 8 individuals in the labor force. Within the labor force, individuals with college / associate degree education have the highest percentage of unemployment, with 8.0% or 15 of them being unemployed.
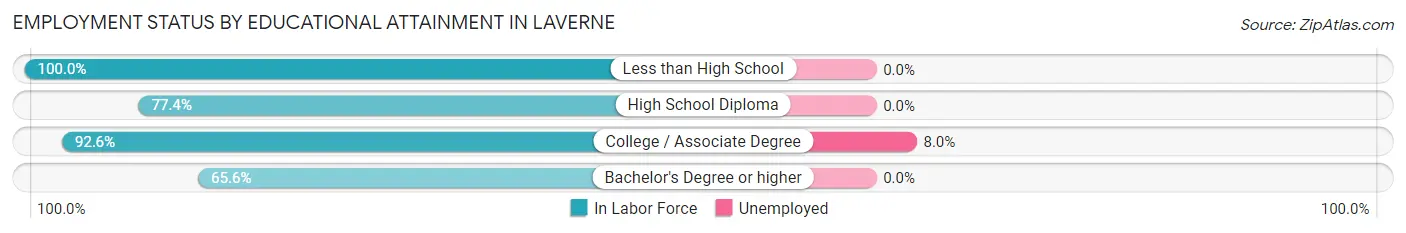
| Educational Attainment | In Labor Force | Unemployed |
| Less than High School | 8 (100.0%) | 0 (0.0%) |
| High School Diploma | 103 (77.4%) | 0 (0.0%) |
| College / Associate Degree | 188 (92.6%) | 16 (8.0%) |
| Bachelor's Degree or higher | 118 (65.6%) | 0 (0.0%) |
| Total | 417 (79.6%) | 19 (3.6%) |
Employment Occupations by Sex in Laverne
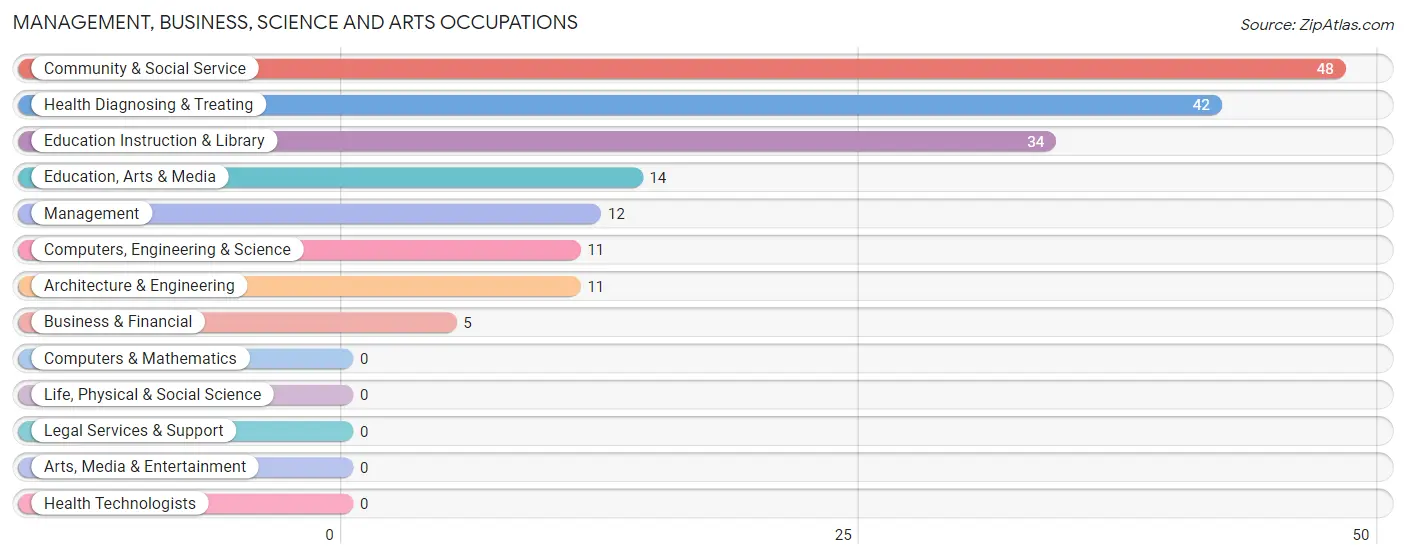
Management, Business, Science and Arts Occupations
The most common Management, Business, Science and Arts occupations in Laverne are Community & Social Service (48 | 9.8%), Health Diagnosing & Treating (42 | 8.6%), Education Instruction & Library (34 | 6.9%), Education, Arts & Media (14 | 2.9%), and Management (12 | 2.4%).
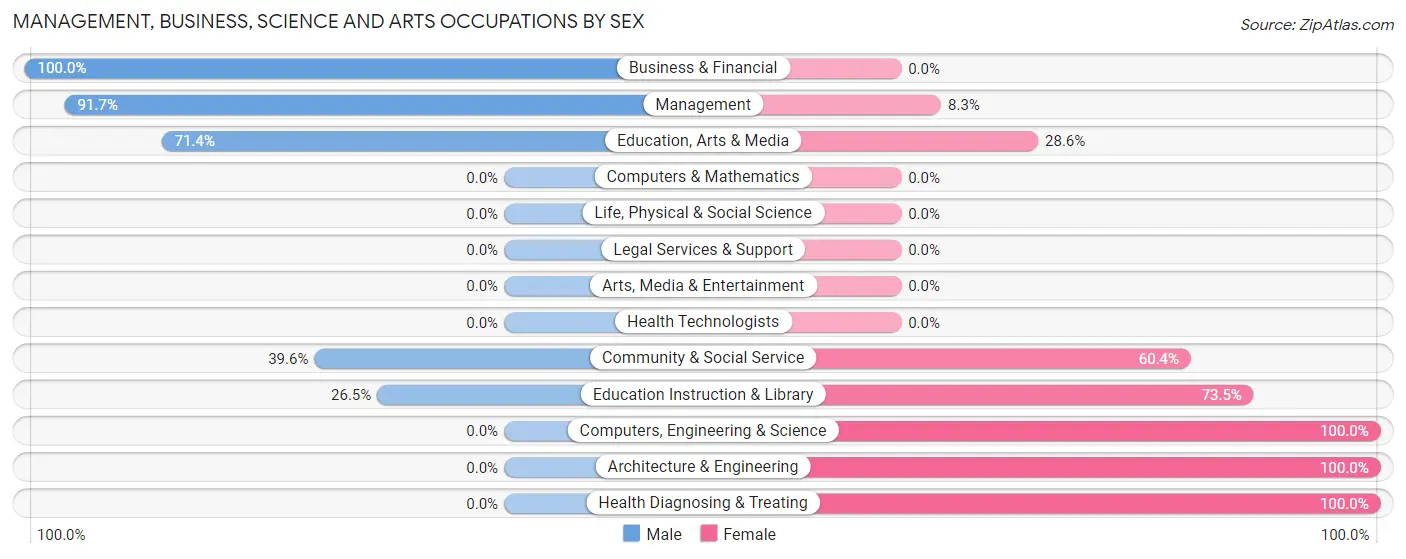
Management, Business, Science and Arts Occupations by Sex
Within the Management, Business, Science and Arts occupations in Laverne, the most male-oriented occupations are Business & Financial (100.0%), Management (91.7%), and Education, Arts & Media (71.4%), while the most female-oriented occupations are Computers, Engineering & Science (100.0%), Architecture & Engineering (100.0%), and Health Diagnosing & Treating (100.0%).
| Occupation | Male | Female |
| Management | 11 (91.7%) | 1 (8.3%) |
| Business & Financial | 5 (100.0%) | 0 (0.0%) |
| Computers, Engineering & Science | 0 (0.0%) | 11 (100.0%) |
| Computers & Mathematics | 0 (0.0%) | 0 (0.0%) |
| Architecture & Engineering | 0 (0.0%) | 11 (100.0%) |
| Life, Physical & Social Science | 0 (0.0%) | 0 (0.0%) |
| Community & Social Service | 19 (39.6%) | 29 (60.4%) |
| Education, Arts & Media | 10 (71.4%) | 4 (28.6%) |
| Legal Services & Support | 0 (0.0%) | 0 (0.0%) |
| Education Instruction & Library | 9 (26.5%) | 25 (73.5%) |
| Arts, Media & Entertainment | 0 (0.0%) | 0 (0.0%) |
| Health Diagnosing & Treating | 0 (0.0%) | 42 (100.0%) |
| Health Technologists | 0 (0.0%) | 0 (0.0%) |
| Total (Category) | 35 (29.7%) | 83 (70.3%) |
| Total (Overall) | 293 (59.7%) | 198 (40.3%) |
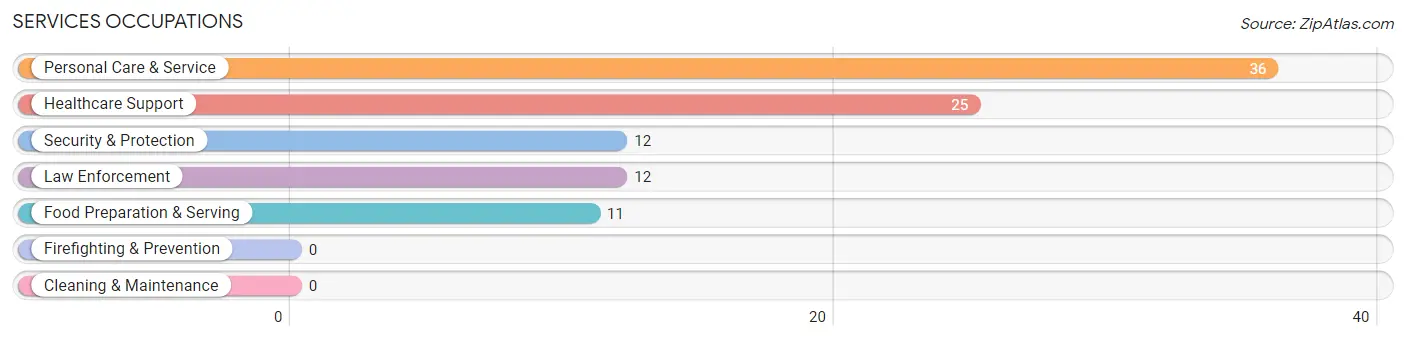
Services Occupations
The most common Services occupations in Laverne are Personal Care & Service (36 | 7.3%), Healthcare Support (25 | 5.1%), Security & Protection (12 | 2.4%), Law Enforcement (12 | 2.4%), and Food Preparation & Serving (11 | 2.2%).
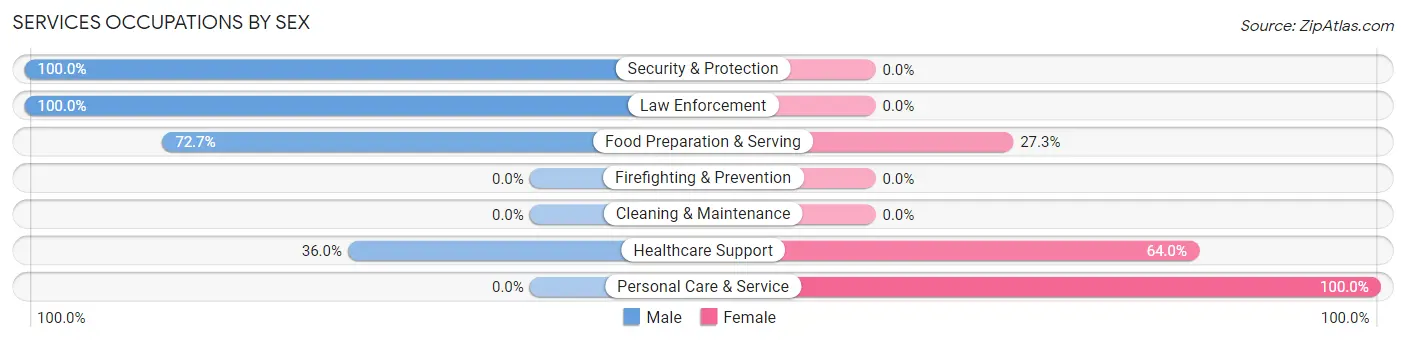
Services Occupations by Sex
Within the Services occupations in Laverne, the most male-oriented occupations are Security & Protection (100.0%), Law Enforcement (100.0%), and Food Preparation & Serving (72.7%), while the most female-oriented occupations are Personal Care & Service (100.0%), Healthcare Support (64.0%), and Food Preparation & Serving (27.3%).
| Occupation | Male | Female |
| Healthcare Support | 9 (36.0%) | 16 (64.0%) |
| Security & Protection | 12 (100.0%) | 0 (0.0%) |
| Firefighting & Prevention | 0 (0.0%) | 0 (0.0%) |
| Law Enforcement | 12 (100.0%) | 0 (0.0%) |
| Food Preparation & Serving | 8 (72.7%) | 3 (27.3%) |
| Cleaning & Maintenance | 0 (0.0%) | 0 (0.0%) |
| Personal Care & Service | 0 (0.0%) | 36 (100.0%) |
| Total (Category) | 29 (34.5%) | 55 (65.5%) |
| Total (Overall) | 293 (59.7%) | 198 (40.3%) |
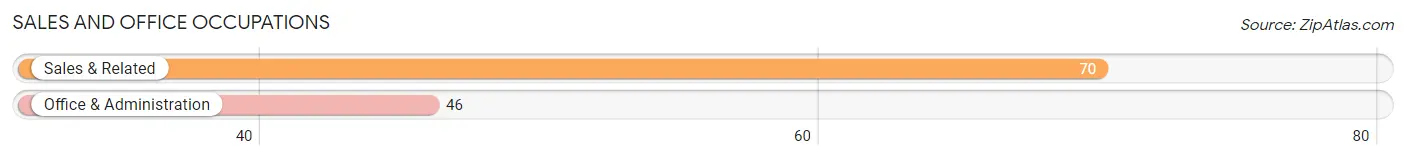
Sales and Office Occupations
The most common Sales and Office occupations in Laverne are Sales & Related (70 | 14.3%), and Office & Administration (46 | 9.4%).
Sales and Office Occupations by Sex
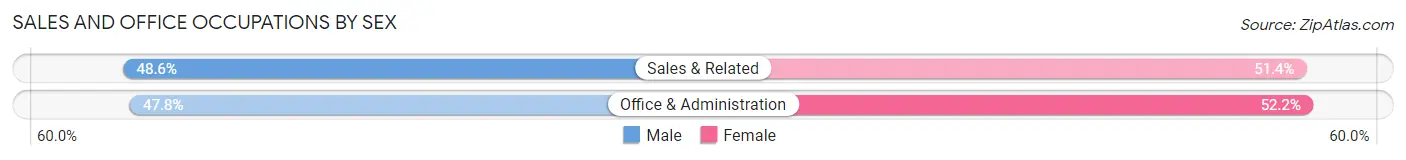
| Occupation | Male | Female |
| Sales & Related | 34 (48.6%) | 36 (51.4%) |
| Office & Administration | 22 (47.8%) | 24 (52.2%) |
| Total (Category) | 56 (48.3%) | 60 (51.7%) |
| Total (Overall) | 293 (59.7%) | 198 (40.3%) |
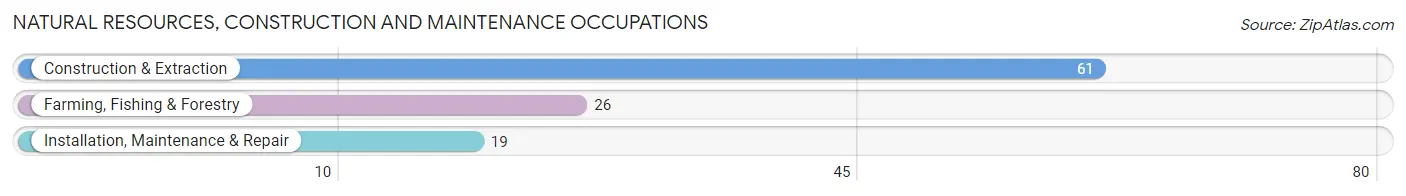
Natural Resources, Construction and Maintenance Occupations
The most common Natural Resources, Construction and Maintenance occupations in Laverne are Construction & Extraction (61 | 12.4%), Farming, Fishing & Forestry (26 | 5.3%), and Installation, Maintenance & Repair (19 | 3.9%).
Natural Resources, Construction and Maintenance Occupations by Sex
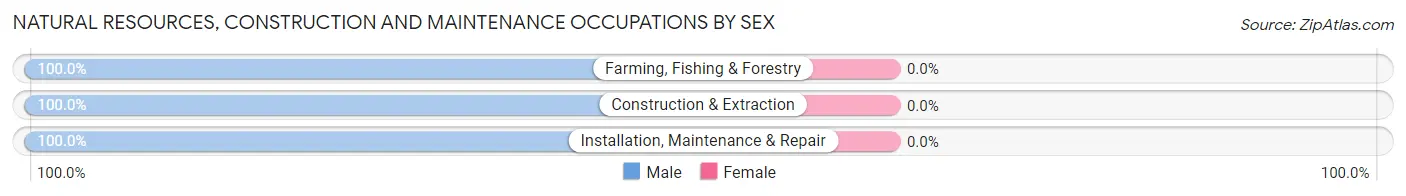
| Occupation | Male | Female |
| Farming, Fishing & Forestry | 26 (100.0%) | 0 (0.0%) |
| Construction & Extraction | 61 (100.0%) | 0 (0.0%) |
| Installation, Maintenance & Repair | 19 (100.0%) | 0 (0.0%) |
| Total (Category) | 106 (100.0%) | 0 (0.0%) |
| Total (Overall) | 293 (59.7%) | 198 (40.3%) |
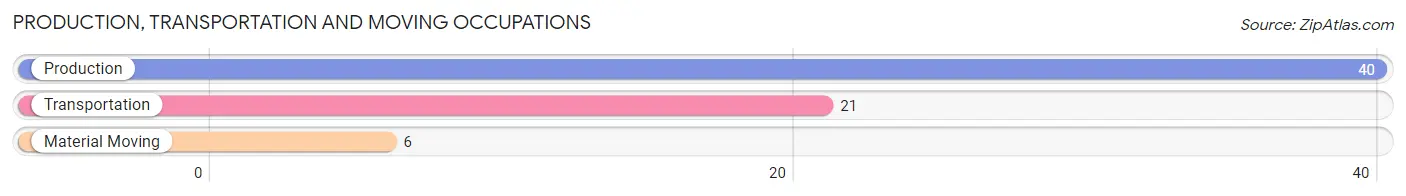
Production, Transportation and Moving Occupations
The most common Production, Transportation and Moving occupations in Laverne are Production (40 | 8.2%), Transportation (21 | 4.3%), and Material Moving (6 | 1.2%).
Production, Transportation and Moving Occupations by Sex
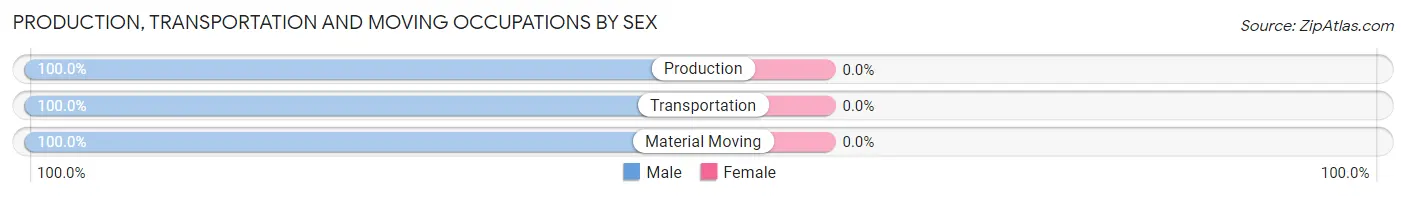
| Occupation | Male | Female |
| Production | 40 (100.0%) | 0 (0.0%) |
| Transportation | 21 (100.0%) | 0 (0.0%) |
| Material Moving | 6 (100.0%) | 0 (0.0%) |
| Total (Category) | 67 (100.0%) | 0 (0.0%) |
| Total (Overall) | 293 (59.7%) | 198 (40.3%) |
Employment Industries by Sex in Laverne
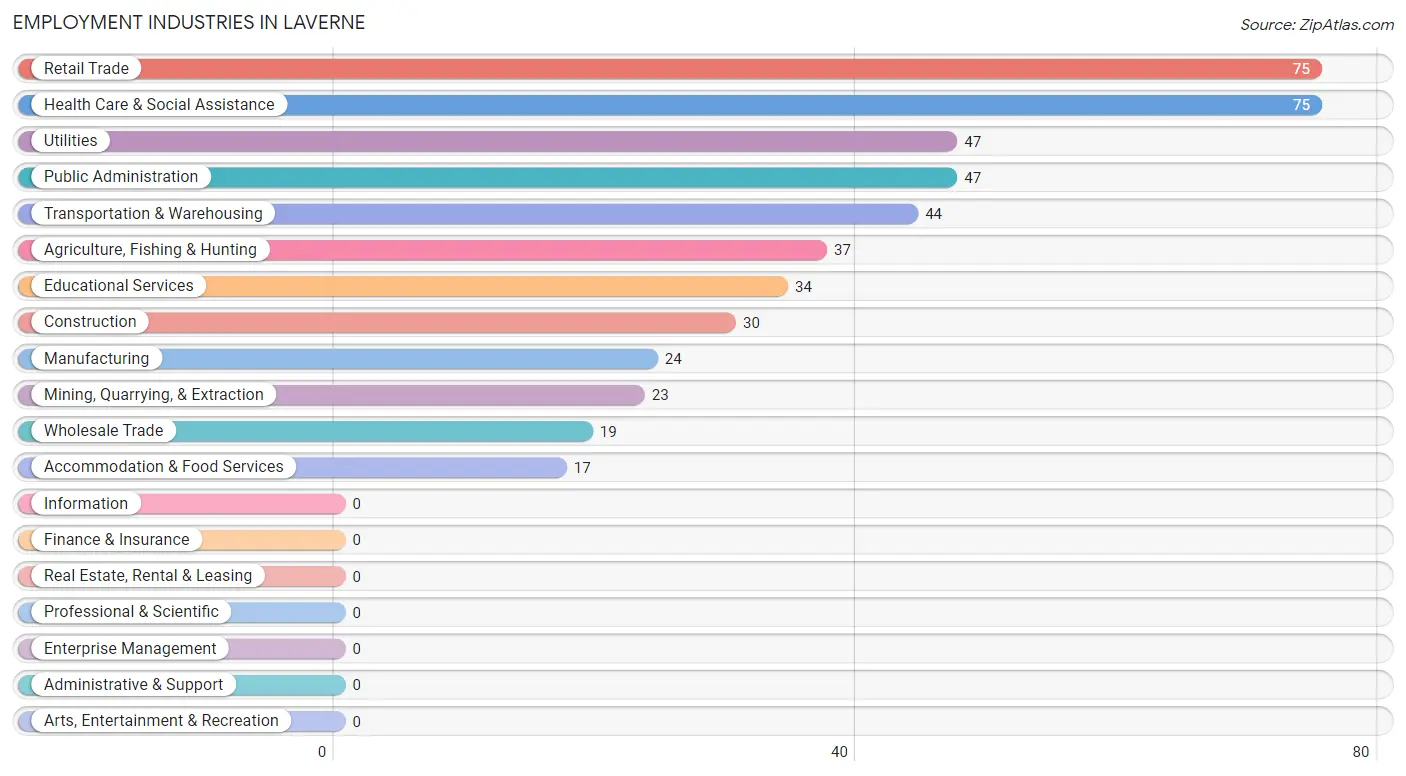
Employment Industries in Laverne
The major employment industries in Laverne include Retail Trade (75 | 15.3%), Health Care & Social Assistance (75 | 15.3%), Utilities (47 | 9.6%), Public Administration (47 | 9.6%), and Transportation & Warehousing (44 | 9.0%).
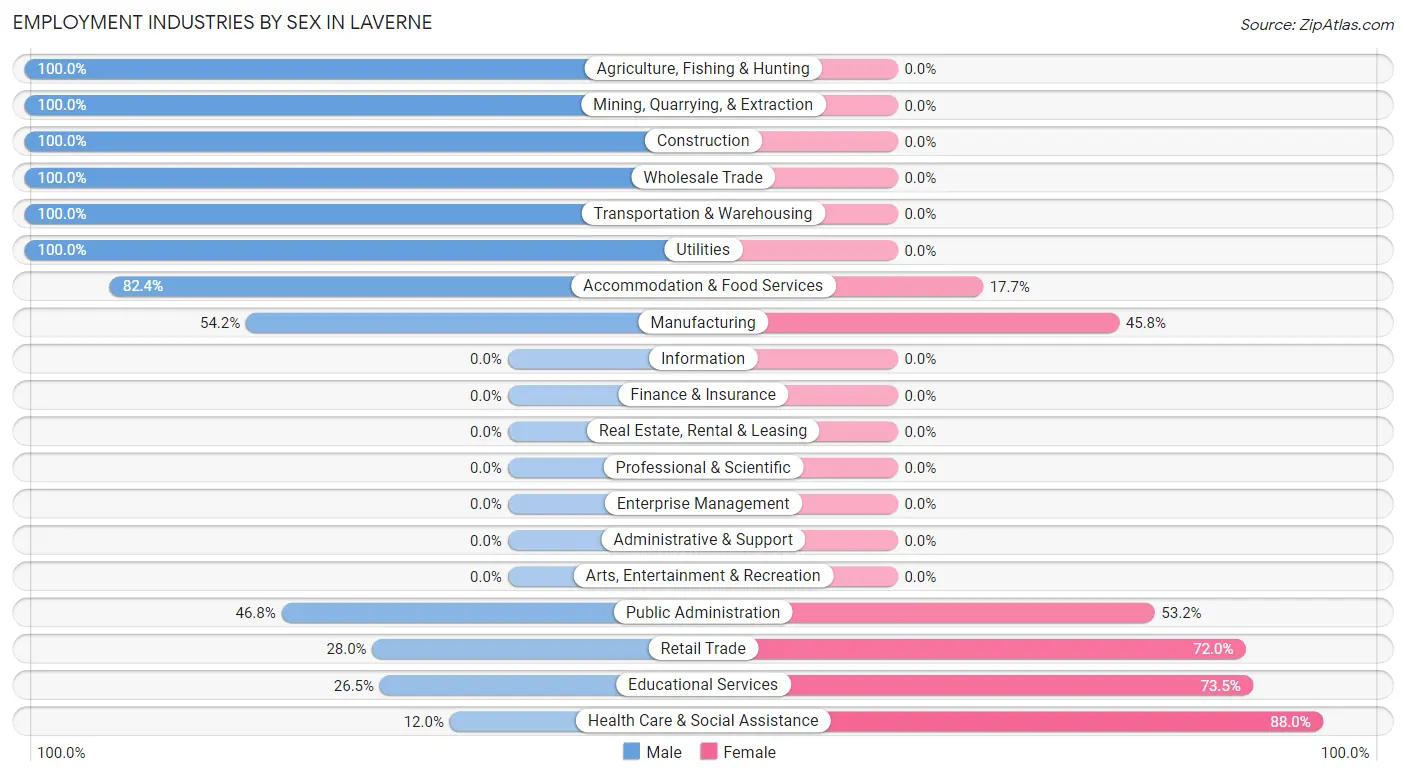
Employment Industries by Sex in Laverne
The Laverne industries that see more men than women are Agriculture, Fishing & Hunting (100.0%), Mining, Quarrying, & Extraction (100.0%), and Construction (100.0%), whereas the industries that tend to have a higher number of women are Health Care & Social Assistance (88.0%), Educational Services (73.5%), and Retail Trade (72.0%).
| Industry | Male | Female |
| Agriculture, Fishing & Hunting | 37 (100.0%) | 0 (0.0%) |
| Mining, Quarrying, & Extraction | 23 (100.0%) | 0 (0.0%) |
| Construction | 30 (100.0%) | 0 (0.0%) |
| Manufacturing | 13 (54.2%) | 11 (45.8%) |
| Wholesale Trade | 19 (100.0%) | 0 (0.0%) |
| Retail Trade | 21 (28.0%) | 54 (72.0%) |
| Transportation & Warehousing | 44 (100.0%) | 0 (0.0%) |
| Utilities | 47 (100.0%) | 0 (0.0%) |
| Information | 0 (0.0%) | 0 (0.0%) |
| Finance & Insurance | 0 (0.0%) | 0 (0.0%) |
| Real Estate, Rental & Leasing | 0 (0.0%) | 0 (0.0%) |
| Professional & Scientific | 0 (0.0%) | 0 (0.0%) |
| Enterprise Management | 0 (0.0%) | 0 (0.0%) |
| Administrative & Support | 0 (0.0%) | 0 (0.0%) |
| Educational Services | 9 (26.5%) | 25 (73.5%) |
| Health Care & Social Assistance | 9 (12.0%) | 66 (88.0%) |
| Arts, Entertainment & Recreation | 0 (0.0%) | 0 (0.0%) |
| Accommodation & Food Services | 14 (82.4%) | 3 (17.6%) |
| Public Administration | 22 (46.8%) | 25 (53.2%) |
| Total | 293 (59.7%) | 198 (40.3%) |
Education in Laverne
School Enrollment in Laverne
The most common levels of schooling among the 341 students in Laverne are high school (127 | 37.2%), middle school (81 | 23.7%), and elementary school (74 | 21.7%).
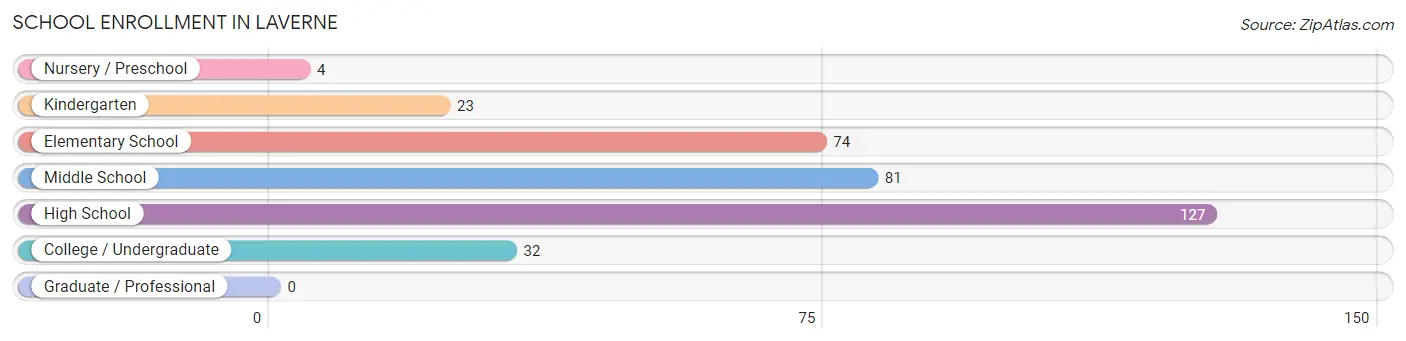
| School Level | # Students | % Students |
| Nursery / Preschool | 4 | 1.2% |
| Kindergarten | 23 | 6.7% |
| Elementary School | 74 | 21.7% |
| Middle School | 81 | 23.7% |
| High School | 127 | 37.2% |
| College / Undergraduate | 32 | 9.4% |
| Graduate / Professional | 0 | 0.0% |
| Total | 341 | 100.0% |
School Enrollment by Age by Funding Source in Laverne
Out of a total of 341 students who are enrolled in schools in Laverne, 21 (6.2%) attend a private institution, while the remaining 320 (93.8%) are enrolled in public schools. The age group of 35 years and over has the highest likelihood of being enrolled in private schools, with 9 (27.3% in the age bracket) enrolled. Conversely, the age group of 15 to 17 year olds has the lowest likelihood of being enrolled in a private school, with 72 (100.0% in the age bracket) attending a public institution.
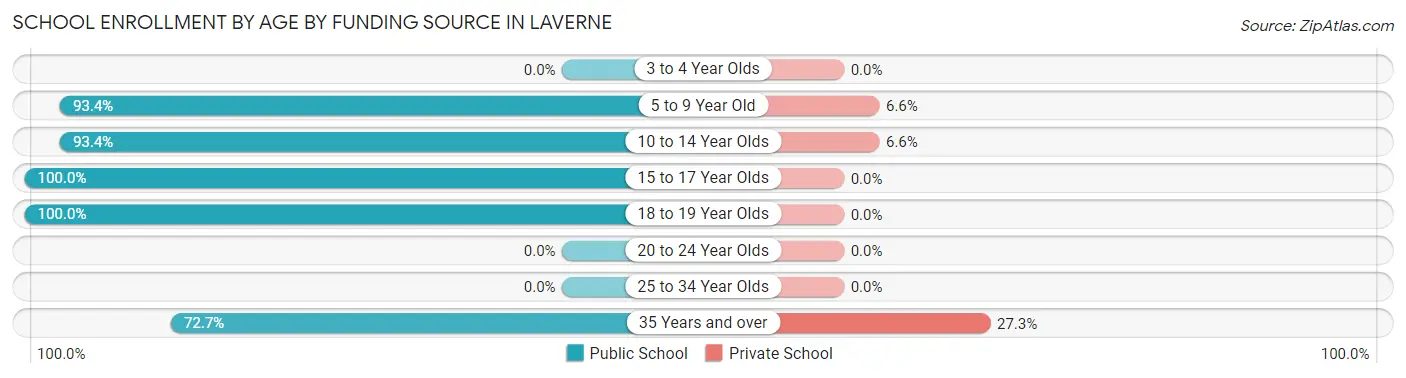
| Age Bracket | Public School | Private School |
| 3 to 4 Year Olds | 0 (0.0%) | 0 (0.0%) |
| 5 to 9 Year Old | 85 (93.4%) | 6 (6.6%) |
| 10 to 14 Year Olds | 85 (93.4%) | 6 (6.6%) |
| 15 to 17 Year Olds | 72 (100.0%) | 0 (0.0%) |
| 18 to 19 Year Olds | 54 (100.0%) | 0 (0.0%) |
| 20 to 24 Year Olds | 0 (0.0%) | 0 (0.0%) |
| 25 to 34 Year Olds | 0 (0.0%) | 0 (0.0%) |
| 35 Years and over | 24 (72.7%) | 9 (27.3%) |
| Total | 320 (93.8%) | 21 (6.2%) |
Educational Attainment by Field of Study in Laverne
Education (45 | 20.6%), engineering (38 | 17.4%), business (33 | 15.1%), science & technology (28 | 12.8%), and bio, nature & agricultural (26 | 11.9%) are the most common fields of study among 218 individuals in Laverne who have obtained a bachelor's degree or higher.
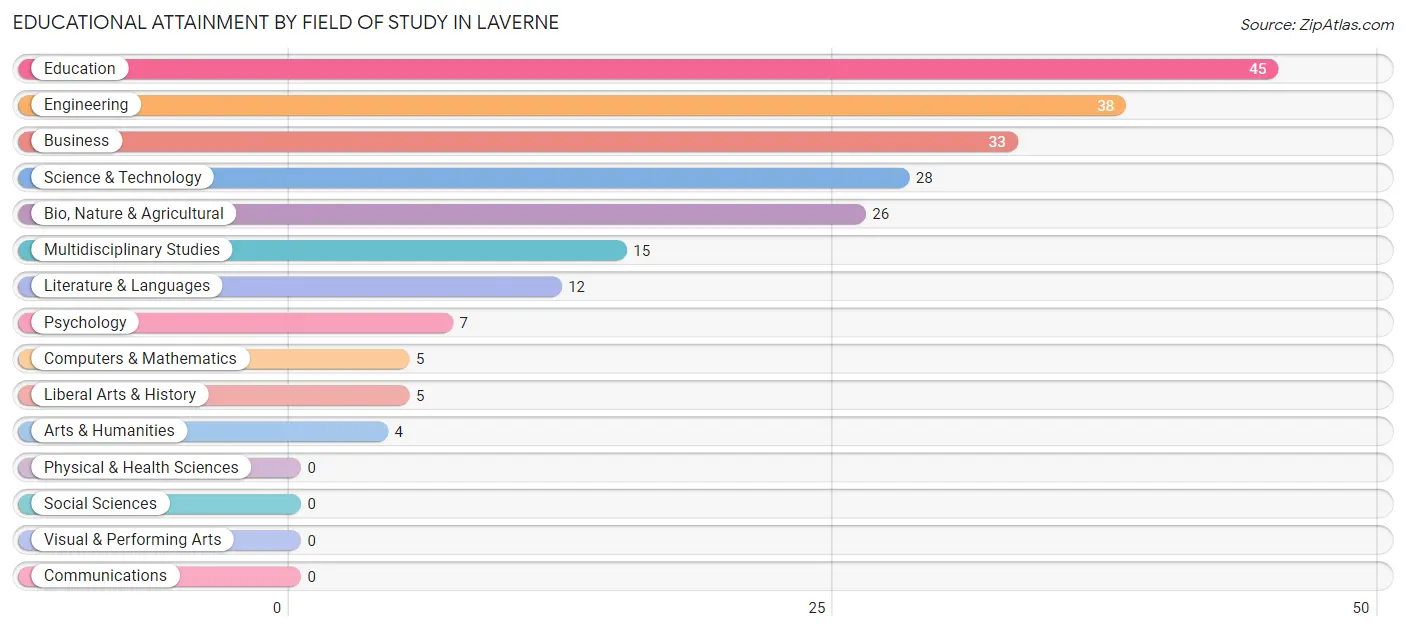
| Field of Study | # Graduates | % Graduates |
| Computers & Mathematics | 5 | 2.3% |
| Bio, Nature & Agricultural | 26 | 11.9% |
| Physical & Health Sciences | 0 | 0.0% |
| Psychology | 7 | 3.2% |
| Social Sciences | 0 | 0.0% |
| Engineering | 38 | 17.4% |
| Multidisciplinary Studies | 15 | 6.9% |
| Science & Technology | 28 | 12.8% |
| Business | 33 | 15.1% |
| Education | 45 | 20.6% |
| Literature & Languages | 12 | 5.5% |
| Liberal Arts & History | 5 | 2.3% |
| Visual & Performing Arts | 0 | 0.0% |
| Communications | 0 | 0.0% |
| Arts & Humanities | 4 | 1.8% |
| Total | 218 | 100.0% |
Transportation & Commute in Laverne
Vehicle Availability by Sex in Laverne
The most prevalent vehicle ownership categories in Laverne are males with 2 vehicles (108, accounting for 38.7%) and females with 2 vehicles (62, making up 54.5%).
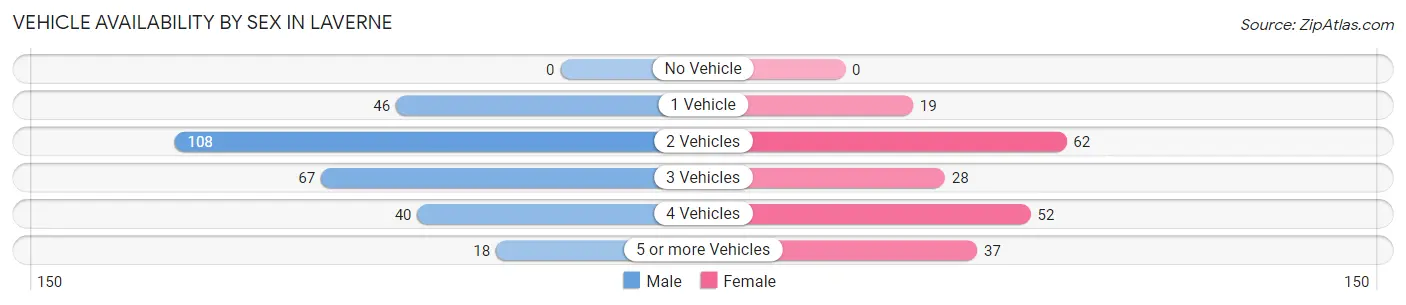
| Vehicles Available | Male | Female |
| No Vehicle | 0 (0.0%) | 0 (0.0%) |
| 1 Vehicle | 46 (16.5%) | 19 (9.6%) |
| 2 Vehicles | 108 (38.7%) | 62 (31.3%) |
| 3 Vehicles | 67 (24.0%) | 28 (14.1%) |
| 4 Vehicles | 40 (14.3%) | 52 (26.3%) |
| 5 or more Vehicles | 18 (6.5%) | 37 (18.7%) |
| Total | 279 (100.0%) | 198 (100.0%) |
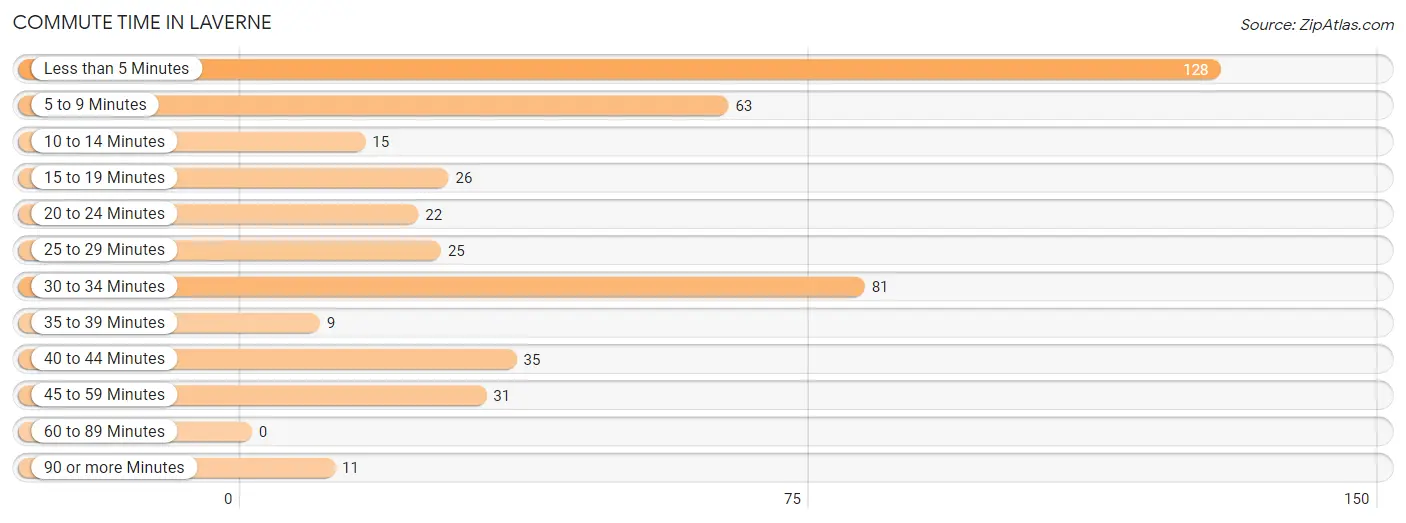
Commute Time in Laverne
The most frequently occuring commute durations in Laverne are less than 5 minutes (128 commuters, 28.7%), 30 to 34 minutes (81 commuters, 18.2%), and 5 to 9 minutes (63 commuters, 14.1%).
| Commute Time | # Commuters | % Commuters |
| Less than 5 Minutes | 128 | 28.7% |
| 5 to 9 Minutes | 63 | 14.1% |
| 10 to 14 Minutes | 15 | 3.4% |
| 15 to 19 Minutes | 26 | 5.8% |
| 20 to 24 Minutes | 22 | 4.9% |
| 25 to 29 Minutes | 25 | 5.6% |
| 30 to 34 Minutes | 81 | 18.2% |
| 35 to 39 Minutes | 9 | 2.0% |
| 40 to 44 Minutes | 35 | 7.9% |
| 45 to 59 Minutes | 31 | 7.0% |
| 60 to 89 Minutes | 0 | 0.0% |
| 90 or more Minutes | 11 | 2.5% |
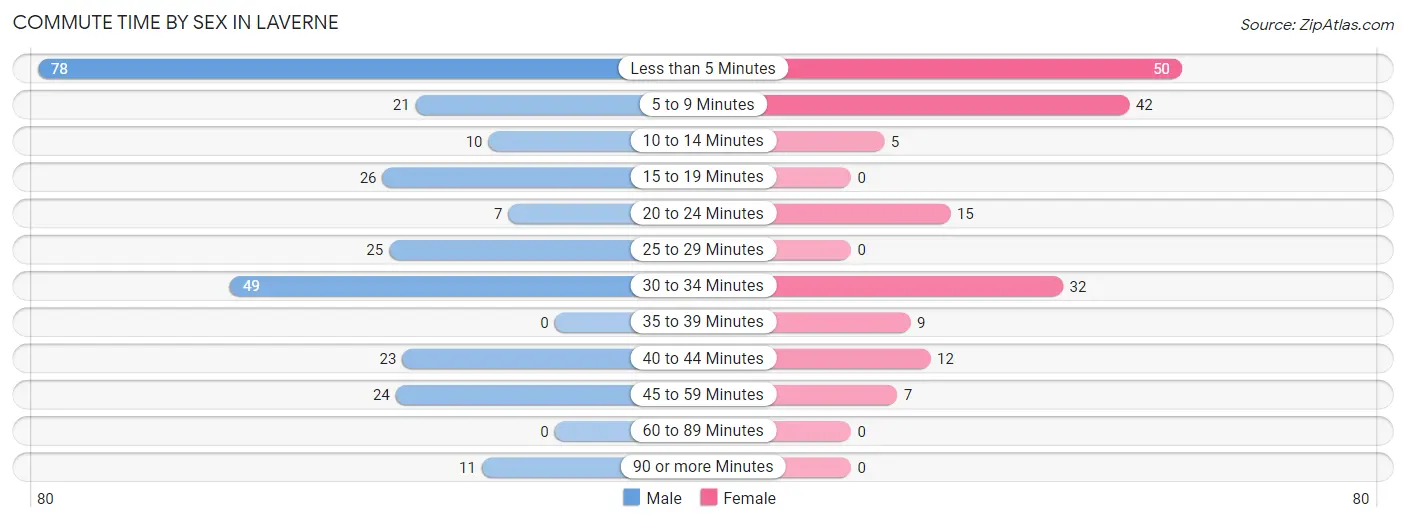
Commute Time by Sex in Laverne
The most common commute times in Laverne are less than 5 minutes (78 commuters, 28.5%) for males and less than 5 minutes (50 commuters, 29.1%) for females.
| Commute Time | Male | Female |
| Less than 5 Minutes | 78 (28.5%) | 50 (29.1%) |
| 5 to 9 Minutes | 21 (7.7%) | 42 (24.4%) |
| 10 to 14 Minutes | 10 (3.6%) | 5 (2.9%) |
| 15 to 19 Minutes | 26 (9.5%) | 0 (0.0%) |
| 20 to 24 Minutes | 7 (2.5%) | 15 (8.7%) |
| 25 to 29 Minutes | 25 (9.1%) | 0 (0.0%) |
| 30 to 34 Minutes | 49 (17.9%) | 32 (18.6%) |
| 35 to 39 Minutes | 0 (0.0%) | 9 (5.2%) |
| 40 to 44 Minutes | 23 (8.4%) | 12 (7.0%) |
| 45 to 59 Minutes | 24 (8.8%) | 7 (4.1%) |
| 60 to 89 Minutes | 0 (0.0%) | 0 (0.0%) |
| 90 or more Minutes | 11 (4.0%) | 0 (0.0%) |
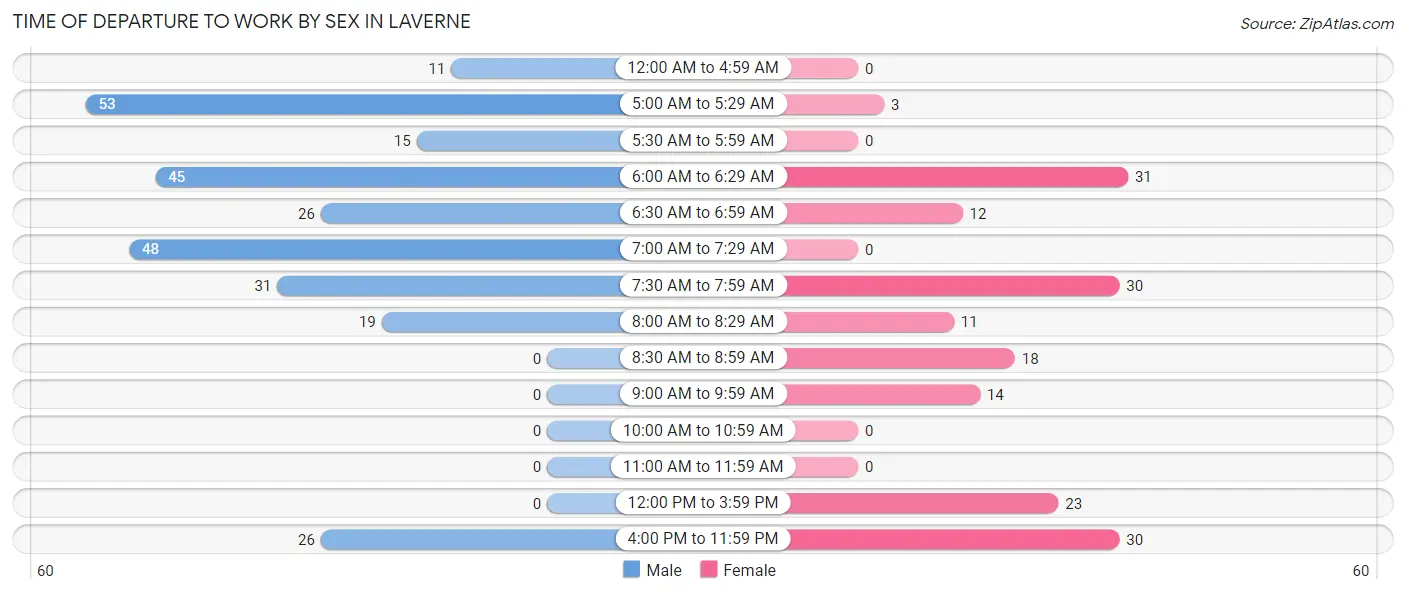
Time of Departure to Work by Sex in Laverne
The most frequent times of departure to work in Laverne are 5:00 AM to 5:29 AM (53, 19.3%) for males and 6:00 AM to 6:29 AM (31, 18.0%) for females.
| Time of Departure | Male | Female |
| 12:00 AM to 4:59 AM | 11 (4.0%) | 0 (0.0%) |
| 5:00 AM to 5:29 AM | 53 (19.3%) | 3 (1.7%) |
| 5:30 AM to 5:59 AM | 15 (5.5%) | 0 (0.0%) |
| 6:00 AM to 6:29 AM | 45 (16.4%) | 31 (18.0%) |
| 6:30 AM to 6:59 AM | 26 (9.5%) | 12 (7.0%) |
| 7:00 AM to 7:29 AM | 48 (17.5%) | 0 (0.0%) |
| 7:30 AM to 7:59 AM | 31 (11.3%) | 30 (17.4%) |
| 8:00 AM to 8:29 AM | 19 (6.9%) | 11 (6.4%) |
| 8:30 AM to 8:59 AM | 0 (0.0%) | 18 (10.5%) |
| 9:00 AM to 9:59 AM | 0 (0.0%) | 14 (8.1%) |
| 10:00 AM to 10:59 AM | 0 (0.0%) | 0 (0.0%) |
| 11:00 AM to 11:59 AM | 0 (0.0%) | 0 (0.0%) |
| 12:00 PM to 3:59 PM | 0 (0.0%) | 23 (13.4%) |
| 4:00 PM to 11:59 PM | 26 (9.5%) | 30 (17.4%) |
| Total | 274 (100.0%) | 172 (100.0%) |
Housing Occupancy in Laverne
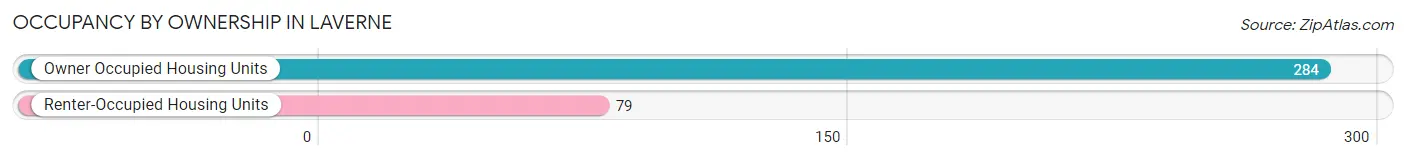
Occupancy by Ownership in Laverne
Of the total 363 dwellings in Laverne, owner-occupied units account for 284 (78.2%), while renter-occupied units make up 79 (21.8%).
| Occupancy | # Housing Units | % Housing Units |
| Owner Occupied Housing Units | 284 | 78.2% |
| Renter-Occupied Housing Units | 79 | 21.8% |
| Total Occupied Housing Units | 363 | 100.0% |
Occupancy by Household Size in Laverne
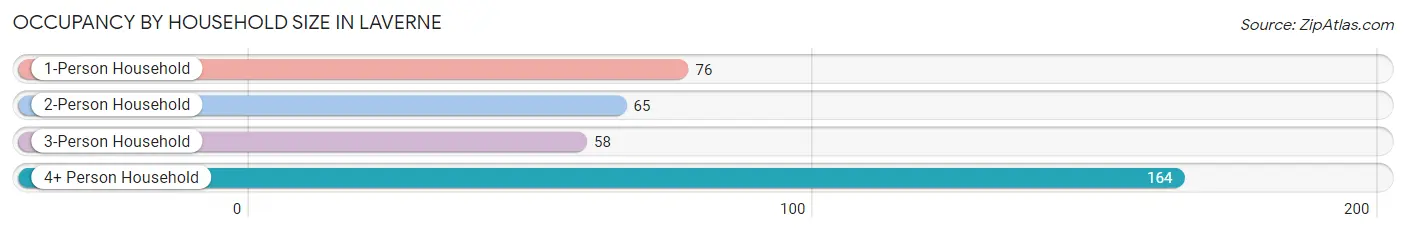
| Household Size | # Housing Units | % Housing Units |
| 1-Person Household | 76 | 20.9% |
| 2-Person Household | 65 | 17.9% |
| 3-Person Household | 58 | 16.0% |
| 4+ Person Household | 164 | 45.2% |
| Total Housing Units | 363 | 100.0% |
Occupancy by Ownership by Household Size in Laverne
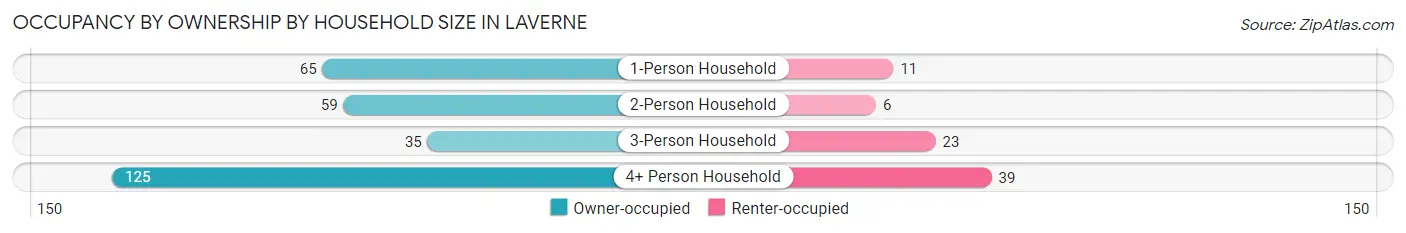
| Household Size | Owner-occupied | Renter-occupied |
| 1-Person Household | 65 (85.5%) | 11 (14.5%) |
| 2-Person Household | 59 (90.8%) | 6 (9.2%) |
| 3-Person Household | 35 (60.3%) | 23 (39.7%) |
| 4+ Person Household | 125 (76.2%) | 39 (23.8%) |
| Total Housing Units | 284 (78.2%) | 79 (21.8%) |
Occupancy by Educational Attainment in Laverne
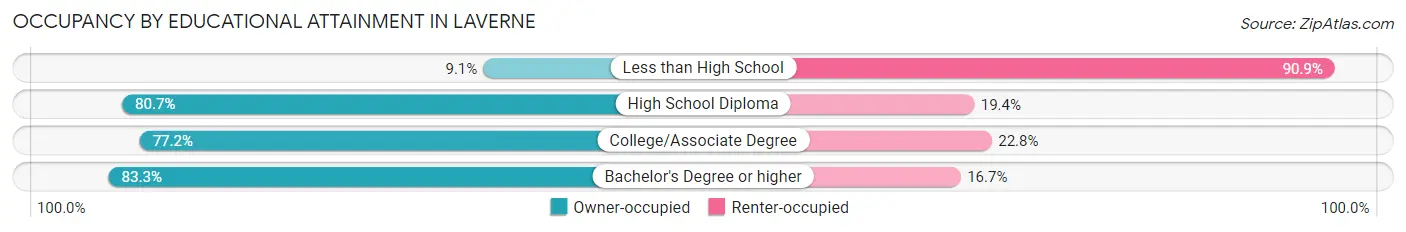
| Household Size | Owner-occupied | Renter-occupied |
| Less than High School | 1 (9.1%) | 10 (90.9%) |
| High School Diploma | 75 (80.6%) | 18 (19.4%) |
| College/Associate Degree | 98 (77.2%) | 29 (22.8%) |
| Bachelor's Degree or higher | 110 (83.3%) | 22 (16.7%) |
Occupancy by Age of Householder in Laverne
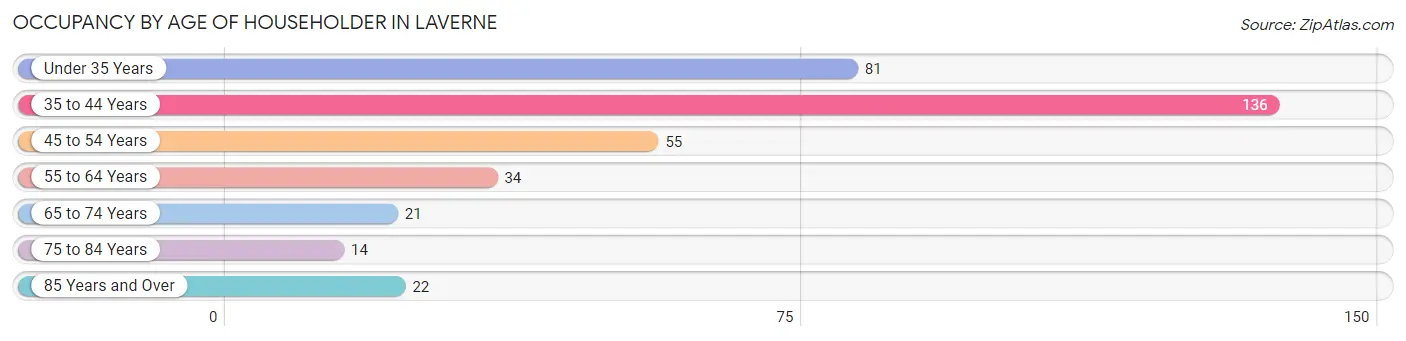
| Age Bracket | # Households | % Households |
| Under 35 Years | 81 | 22.3% |
| 35 to 44 Years | 136 | 37.5% |
| 45 to 54 Years | 55 | 15.1% |
| 55 to 64 Years | 34 | 9.4% |
| 65 to 74 Years | 21 | 5.8% |
| 75 to 84 Years | 14 | 3.9% |
| 85 Years and Over | 22 | 6.1% |
| Total | 363 | 100.0% |
Housing Finances in Laverne
Median Income by Occupancy in Laverne
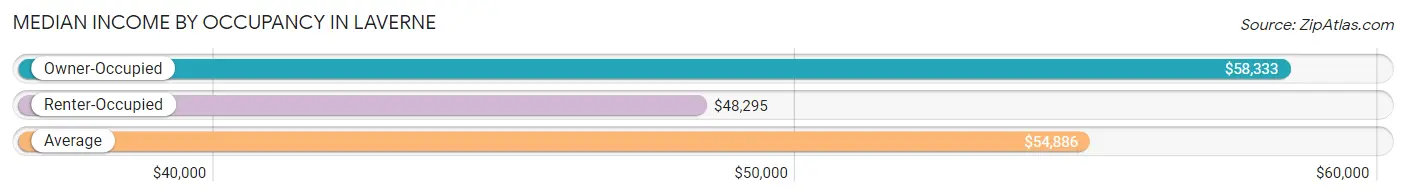
| Occupancy Type | # Households | Median Income |
| Owner-Occupied | 284 (78.2%) | $58,333 |
| Renter-Occupied | 79 (21.8%) | $48,295 |
| Average | 363 (100.0%) | $54,886 |
Occupancy by Householder Income Bracket in Laverne
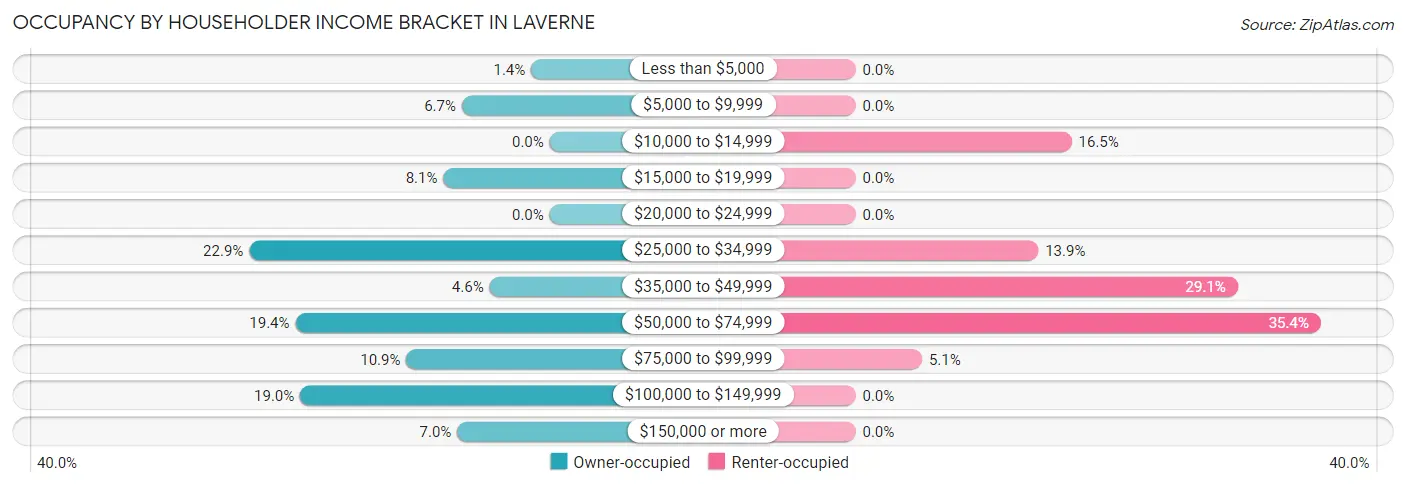
| Income Bracket | Owner-occupied | Renter-occupied |
| Less than $5,000 | 4 (1.4%) | 0 (0.0%) |
| $5,000 to $9,999 | 19 (6.7%) | 0 (0.0%) |
| $10,000 to $14,999 | 0 (0.0%) | 13 (16.5%) |
| $15,000 to $19,999 | 23 (8.1%) | 0 (0.0%) |
| $20,000 to $24,999 | 0 (0.0%) | 0 (0.0%) |
| $25,000 to $34,999 | 65 (22.9%) | 11 (13.9%) |
| $35,000 to $49,999 | 13 (4.6%) | 23 (29.1%) |
| $50,000 to $74,999 | 55 (19.4%) | 28 (35.4%) |
| $75,000 to $99,999 | 31 (10.9%) | 4 (5.1%) |
| $100,000 to $149,999 | 54 (19.0%) | 0 (0.0%) |
| $150,000 or more | 20 (7.0%) | 0 (0.0%) |
| Total | 284 (100.0%) | 79 (100.0%) |
Monthly Housing Cost Tiers in Laverne
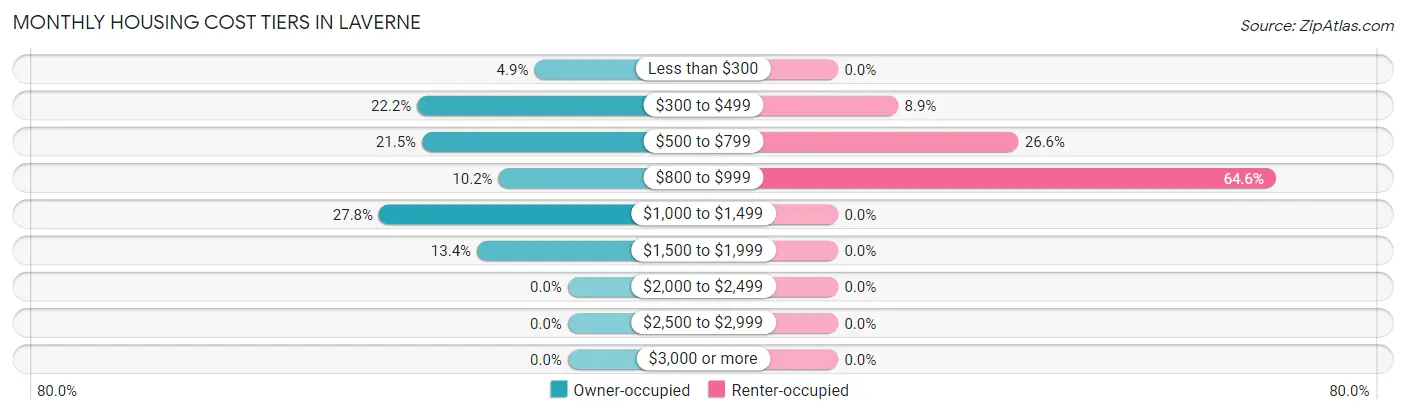
| Monthly Cost | Owner-occupied | Renter-occupied |
| Less than $300 | 14 (4.9%) | 0 (0.0%) |
| $300 to $499 | 63 (22.2%) | 7 (8.9%) |
| $500 to $799 | 61 (21.5%) | 21 (26.6%) |
| $800 to $999 | 29 (10.2%) | 51 (64.6%) |
| $1,000 to $1,499 | 79 (27.8%) | 0 (0.0%) |
| $1,500 to $1,999 | 38 (13.4%) | 0 (0.0%) |
| $2,000 to $2,499 | 0 (0.0%) | 0 (0.0%) |
| $2,500 to $2,999 | 0 (0.0%) | 0 (0.0%) |
| $3,000 or more | 0 (0.0%) | 0 (0.0%) |
| Total | 284 (100.0%) | 79 (100.0%) |
Physical Housing Characteristics in Laverne
Housing Structures in Laverne
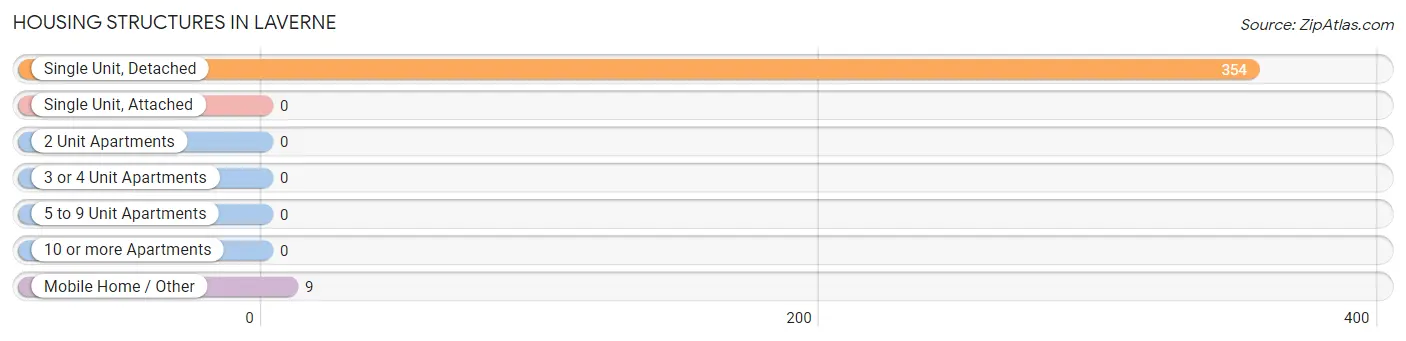
| Structure Type | # Housing Units | % Housing Units |
| Single Unit, Detached | 354 | 97.5% |
| Single Unit, Attached | 0 | 0.0% |
| 2 Unit Apartments | 0 | 0.0% |
| 3 or 4 Unit Apartments | 0 | 0.0% |
| 5 to 9 Unit Apartments | 0 | 0.0% |
| 10 or more Apartments | 0 | 0.0% |
| Mobile Home / Other | 9 | 2.5% |
| Total | 363 | 100.0% |
Housing Structures by Occupancy in Laverne
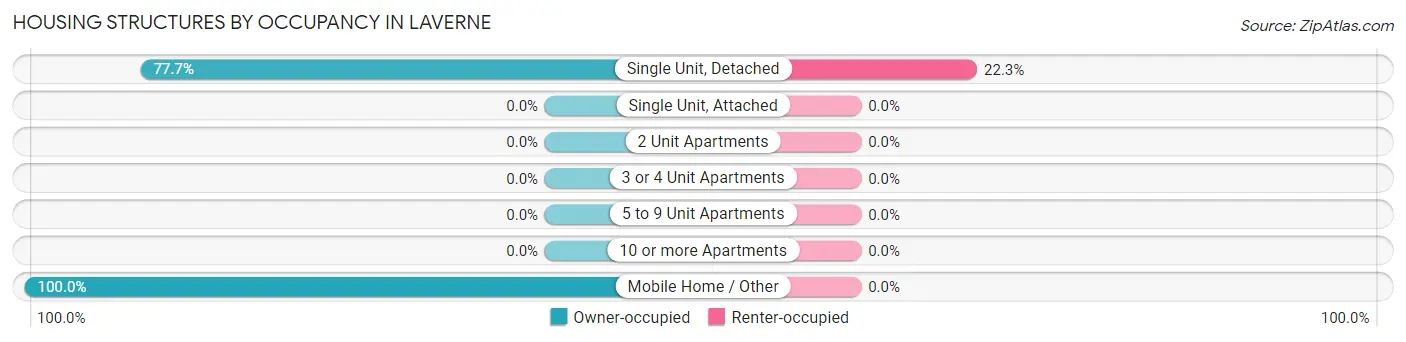
| Structure Type | Owner-occupied | Renter-occupied |
| Single Unit, Detached | 275 (77.7%) | 79 (22.3%) |
| Single Unit, Attached | 0 (0.0%) | 0 (0.0%) |
| 2 Unit Apartments | 0 (0.0%) | 0 (0.0%) |
| 3 or 4 Unit Apartments | 0 (0.0%) | 0 (0.0%) |
| 5 to 9 Unit Apartments | 0 (0.0%) | 0 (0.0%) |
| 10 or more Apartments | 0 (0.0%) | 0 (0.0%) |
| Mobile Home / Other | 9 (100.0%) | 0 (0.0%) |
| Total | 284 (78.2%) | 79 (21.8%) |
Housing Structures by Number of Rooms in Laverne
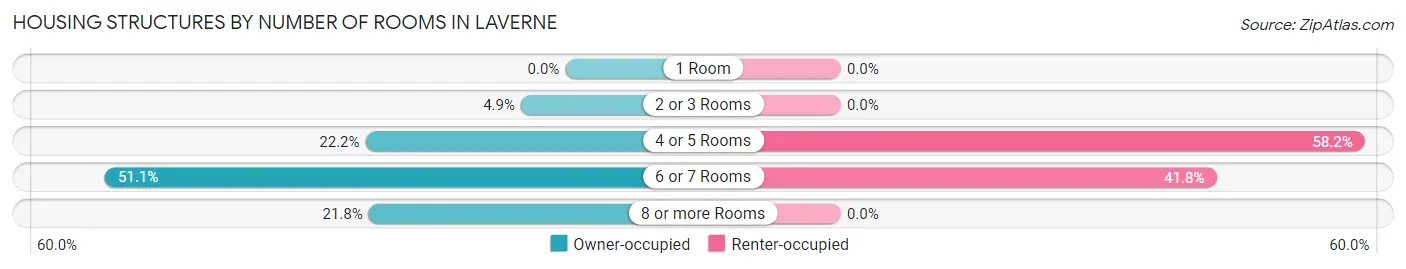
| Number of Rooms | Owner-occupied | Renter-occupied |
| 1 Room | 0 (0.0%) | 0 (0.0%) |
| 2 or 3 Rooms | 14 (4.9%) | 0 (0.0%) |
| 4 or 5 Rooms | 63 (22.2%) | 46 (58.2%) |
| 6 or 7 Rooms | 145 (51.1%) | 33 (41.8%) |
| 8 or more Rooms | 62 (21.8%) | 0 (0.0%) |
| Total | 284 (100.0%) | 79 (100.0%) |
Housing Structure by Heating Type in Laverne
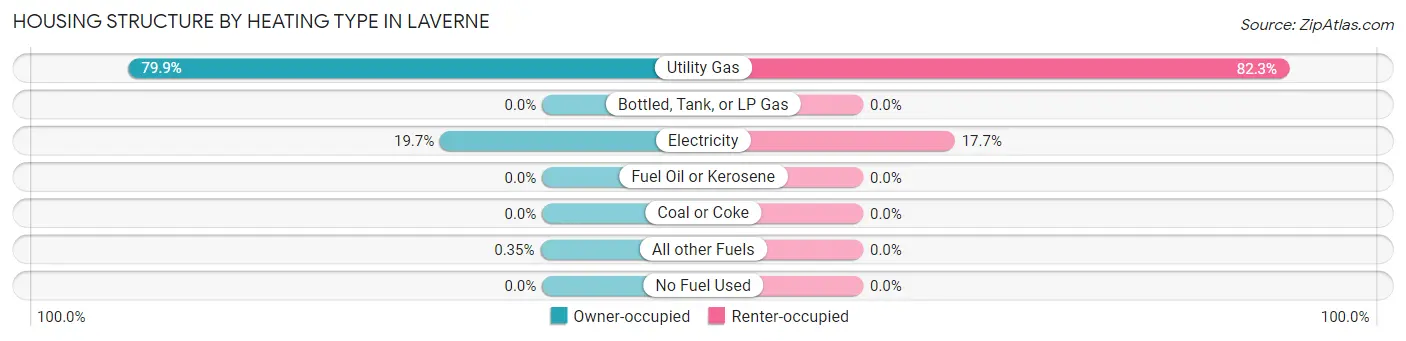
| Heating Type | Owner-occupied | Renter-occupied |
| Utility Gas | 227 (79.9%) | 65 (82.3%) |
| Bottled, Tank, or LP Gas | 0 (0.0%) | 0 (0.0%) |
| Electricity | 56 (19.7%) | 14 (17.7%) |
| Fuel Oil or Kerosene | 0 (0.0%) | 0 (0.0%) |
| Coal or Coke | 0 (0.0%) | 0 (0.0%) |
| All other Fuels | 1 (0.4%) | 0 (0.0%) |
| No Fuel Used | 0 (0.0%) | 0 (0.0%) |
| Total | 284 (100.0%) | 79 (100.0%) |
Household Vehicle Usage in Laverne
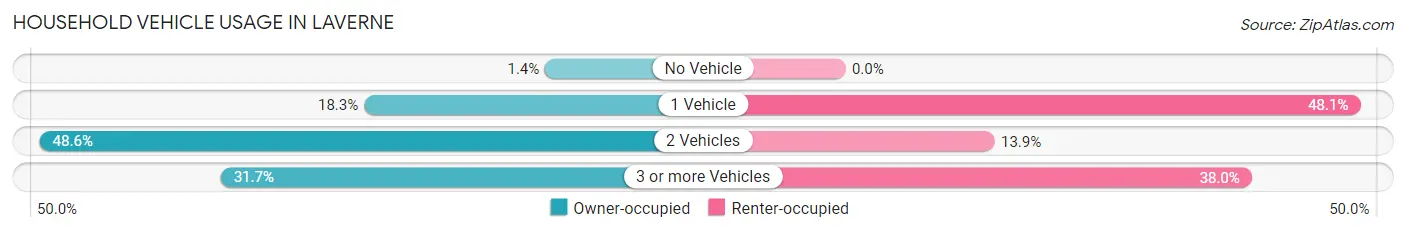
| Vehicles per Household | Owner-occupied | Renter-occupied |
| No Vehicle | 4 (1.4%) | 0 (0.0%) |
| 1 Vehicle | 52 (18.3%) | 38 (48.1%) |
| 2 Vehicles | 138 (48.6%) | 11 (13.9%) |
| 3 or more Vehicles | 90 (31.7%) | 30 (38.0%) |
| Total | 284 (100.0%) | 79 (100.0%) |
Real Estate & Mortgages in Laverne
Real Estate and Mortgage Overview in Laverne
| Characteristic | Without Mortgage | With Mortgage |
| Housing Units | 88 | 196 |
| Median Property Value | $126,800 | $85,000 |
| Median Household Income | $46,875 | $20 |
| Monthly Housing Costs | $395 | $0 |
| Real Estate Taxes | $331 | $0 |
Property Value by Mortgage Status in Laverne
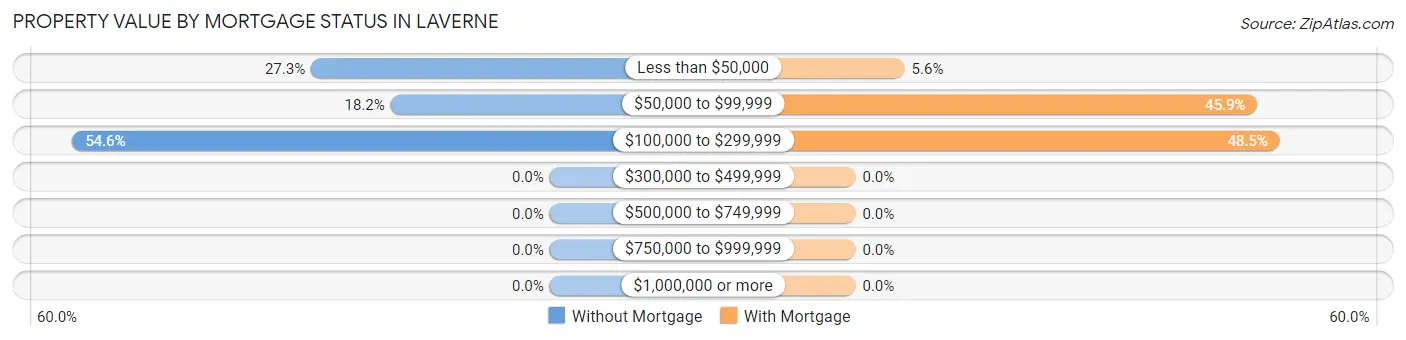
| Property Value | Without Mortgage | With Mortgage |
| Less than $50,000 | 24 (27.3%) | 11 (5.6%) |
| $50,000 to $99,999 | 16 (18.2%) | 90 (45.9%) |
| $100,000 to $299,999 | 48 (54.5%) | 95 (48.5%) |
| $300,000 to $499,999 | 0 (0.0%) | 0 (0.0%) |
| $500,000 to $749,999 | 0 (0.0%) | 0 (0.0%) |
| $750,000 to $999,999 | 0 (0.0%) | 0 (0.0%) |
| $1,000,000 or more | 0 (0.0%) | 0 (0.0%) |
| Total | 88 (100.0%) | 196 (100.0%) |
Household Income by Mortgage Status in Laverne
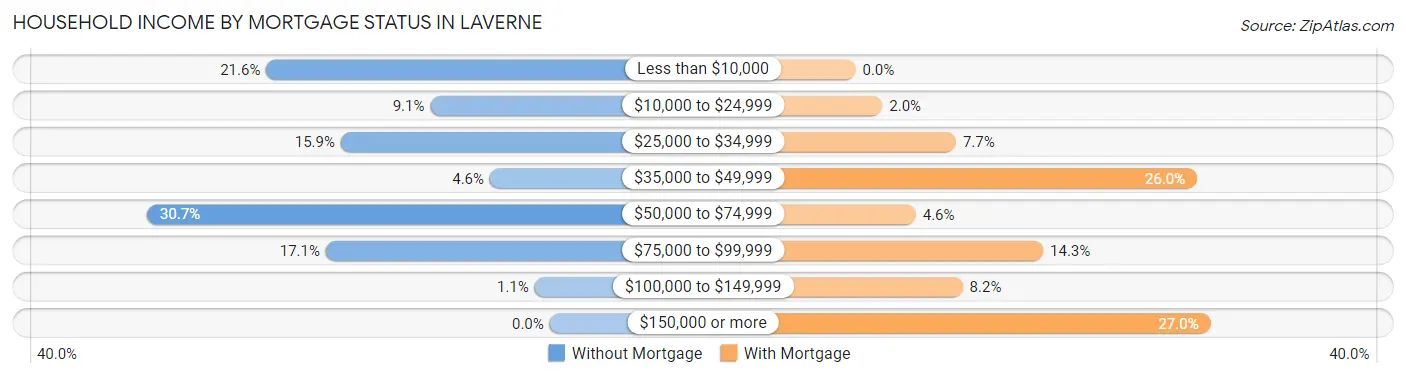
| Household Income | Without Mortgage | With Mortgage |
| Less than $10,000 | 19 (21.6%) | 0 (0.0%) |
| $10,000 to $24,999 | 8 (9.1%) | 4 (2.0%) |
| $25,000 to $34,999 | 14 (15.9%) | 15 (7.6%) |
| $35,000 to $49,999 | 4 (4.5%) | 51 (26.0%) |
| $50,000 to $74,999 | 27 (30.7%) | 9 (4.6%) |
| $75,000 to $99,999 | 15 (17.1%) | 28 (14.3%) |
| $100,000 to $149,999 | 1 (1.1%) | 16 (8.2%) |
| $150,000 or more | 0 (0.0%) | 53 (27.0%) |
| Total | 88 (100.0%) | 196 (100.0%) |
Property Value to Household Income Ratio in Laverne
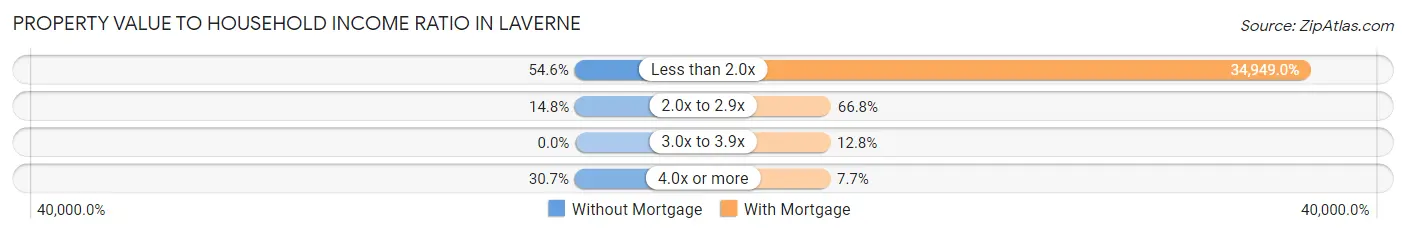
| Value-to-Income Ratio | Without Mortgage | With Mortgage |
| Less than 2.0x | 48 (54.5%) | 68,500 (34,949.0%) |
| 2.0x to 2.9x | 13 (14.8%) | 131 (66.8%) |
| 3.0x to 3.9x | 0 (0.0%) | 25 (12.8%) |
| 4.0x or more | 27 (30.7%) | 15 (7.6%) |
| Total | 88 (100.0%) | 196 (100.0%) |
Real Estate Taxes by Mortgage Status in Laverne
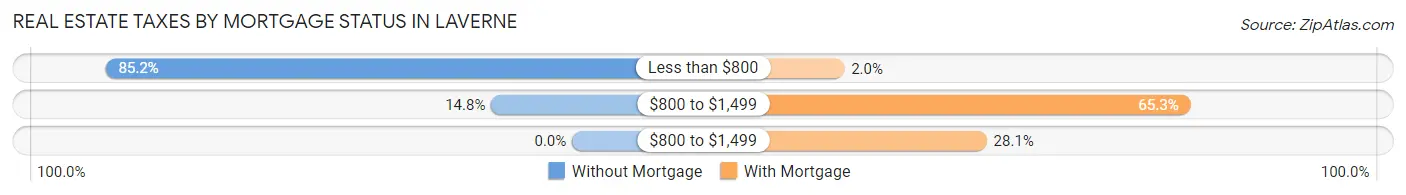
| Property Taxes | Without Mortgage | With Mortgage |
| Less than $800 | 75 (85.2%) | 4 (2.0%) |
| $800 to $1,499 | 13 (14.8%) | 128 (65.3%) |
| $800 to $1,499 | 0 (0.0%) | 55 (28.1%) |
| Total | 88 (100.0%) | 196 (100.0%) |
Health & Disability in Laverne
Health Insurance Coverage by Age in Laverne
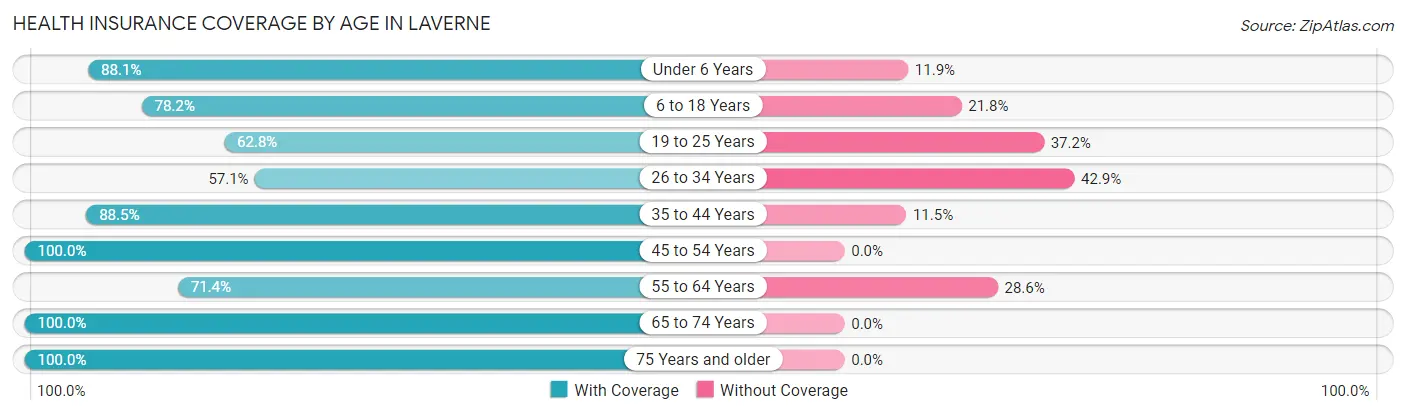
| Age Bracket | With Coverage | Without Coverage |
| Under 6 Years | 52 (88.1%) | 7 (11.9%) |
| 6 to 18 Years | 233 (78.2%) | 65 (21.8%) |
| 19 to 25 Years | 49 (62.8%) | 29 (37.2%) |
| 26 to 34 Years | 44 (57.1%) | 33 (42.9%) |
| 35 to 44 Years | 200 (88.5%) | 26 (11.5%) |
| 45 to 54 Years | 137 (100.0%) | 0 (0.0%) |
| 55 to 64 Years | 55 (71.4%) | 22 (28.6%) |
| 65 to 74 Years | 33 (100.0%) | 0 (0.0%) |
| 75 Years and older | 50 (100.0%) | 0 (0.0%) |
| Total | 853 (82.4%) | 182 (17.6%) |
Health Insurance Coverage by Citizenship Status in Laverne
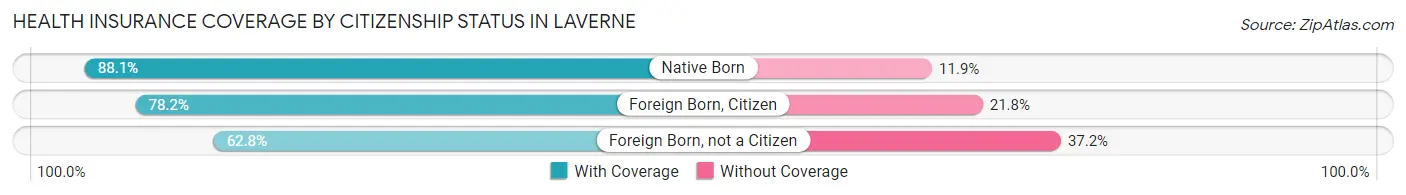
| Citizenship Status | With Coverage | Without Coverage |
| Native Born | 52 (88.1%) | 7 (11.9%) |
| Foreign Born, Citizen | 233 (78.2%) | 65 (21.8%) |
| Foreign Born, not a Citizen | 49 (62.8%) | 29 (37.2%) |
Health Insurance Coverage by Household Income in Laverne
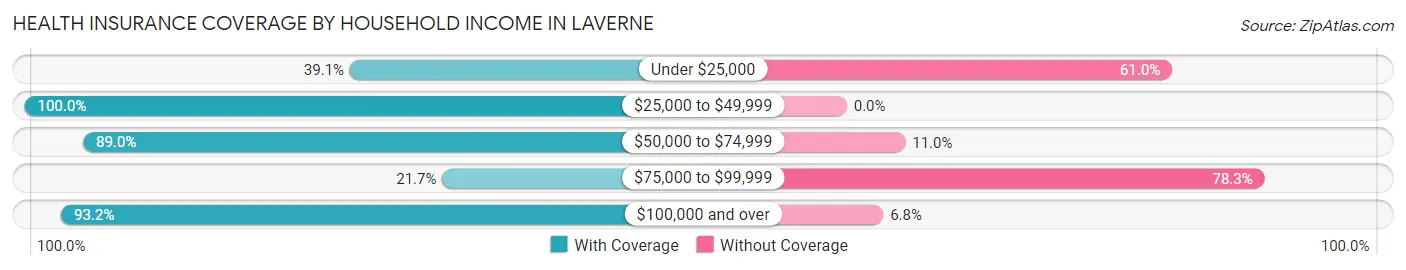
| Household Income | With Coverage | Without Coverage |
| Under $25,000 | 41 (39.1%) | 64 (61.0%) |
| $25,000 to $49,999 | 297 (100.0%) | 0 (0.0%) |
| $50,000 to $74,999 | 195 (89.0%) | 24 (11.0%) |
| $75,000 to $99,999 | 20 (21.7%) | 72 (78.3%) |
| $100,000 and over | 300 (93.2%) | 22 (6.8%) |
Public vs Private Health Insurance Coverage by Age in Laverne
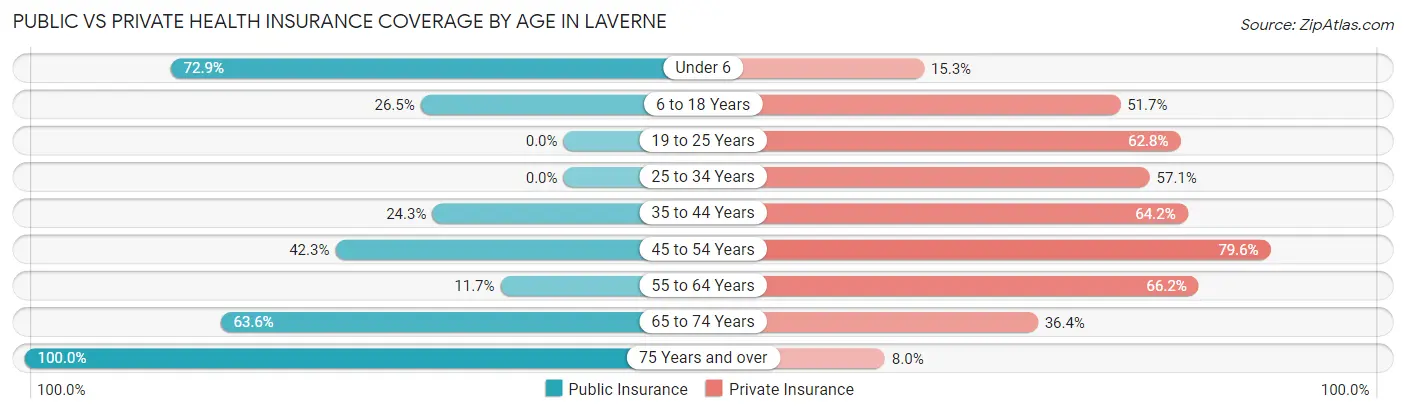
| Age Bracket | Public Insurance | Private Insurance |
| Under 6 | 43 (72.9%) | 9 (15.2%) |
| 6 to 18 Years | 79 (26.5%) | 154 (51.7%) |
| 19 to 25 Years | 0 (0.0%) | 49 (62.8%) |
| 25 to 34 Years | 0 (0.0%) | 44 (57.1%) |
| 35 to 44 Years | 55 (24.3%) | 145 (64.2%) |
| 45 to 54 Years | 58 (42.3%) | 109 (79.6%) |
| 55 to 64 Years | 9 (11.7%) | 51 (66.2%) |
| 65 to 74 Years | 21 (63.6%) | 12 (36.4%) |
| 75 Years and over | 50 (100.0%) | 4 (8.0%) |
| Total | 315 (30.4%) | 577 (55.7%) |
Disability Status by Sex by Age in Laverne
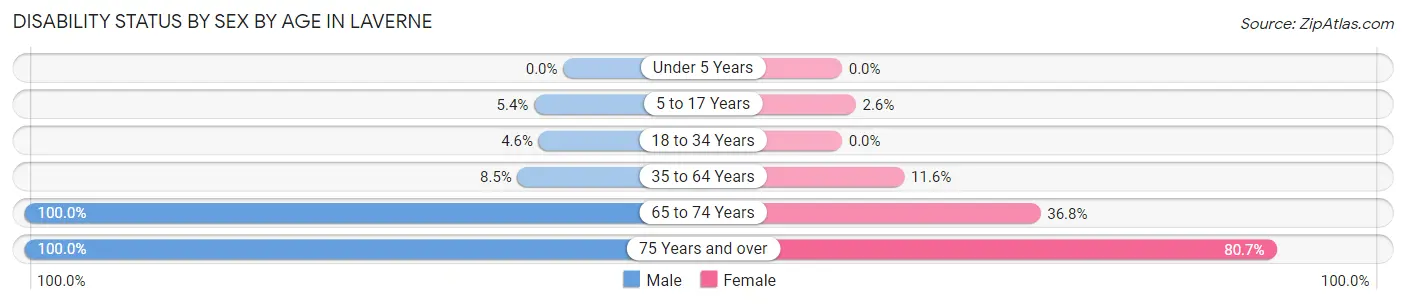
| Age Bracket | Male | Female |
| Under 5 Years | 0 (0.0%) | 0 (0.0%) |
| 5 to 17 Years | 6 (5.4%) | 4 (2.5%) |
| 18 to 34 Years | 5 (4.5%) | 0 (0.0%) |
| 35 to 64 Years | 19 (8.5%) | 25 (11.6%) |
| 65 to 74 Years | 14 (100.0%) | 7 (36.8%) |
| 75 Years and over | 19 (100.0%) | 25 (80.6%) |
Disability Class by Sex by Age in Laverne
Disability Class: Hearing Difficulty
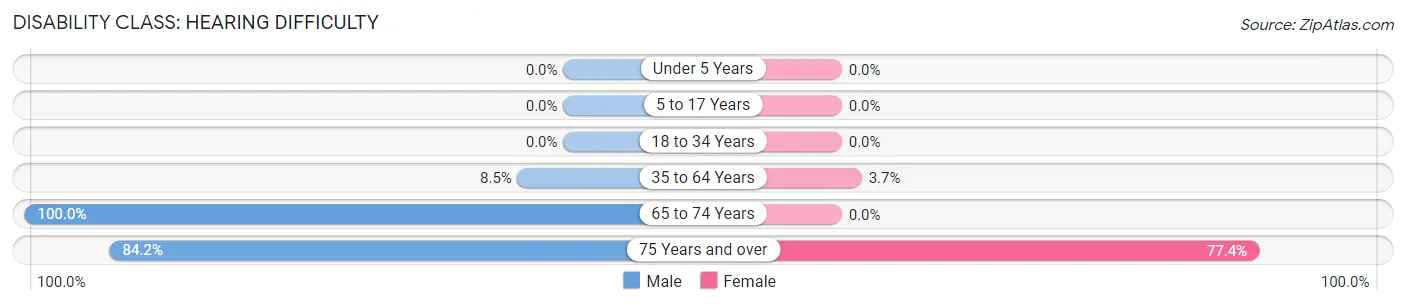
| Age Bracket | Male | Female |
| Under 5 Years | 0 (0.0%) | 0 (0.0%) |
| 5 to 17 Years | 0 (0.0%) | 0 (0.0%) |
| 18 to 34 Years | 0 (0.0%) | 0 (0.0%) |
| 35 to 64 Years | 19 (8.5%) | 8 (3.7%) |
| 65 to 74 Years | 14 (100.0%) | 0 (0.0%) |
| 75 Years and over | 16 (84.2%) | 24 (77.4%) |
Disability Class: Vision Difficulty
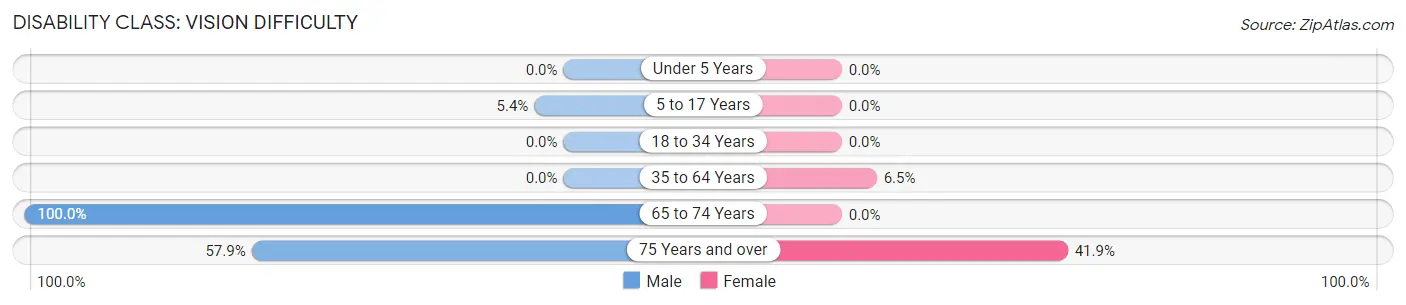
| Age Bracket | Male | Female |
| Under 5 Years | 0 (0.0%) | 0 (0.0%) |
| 5 to 17 Years | 6 (5.4%) | 0 (0.0%) |
| 18 to 34 Years | 0 (0.0%) | 0 (0.0%) |
| 35 to 64 Years | 0 (0.0%) | 14 (6.5%) |
| 65 to 74 Years | 14 (100.0%) | 0 (0.0%) |
| 75 Years and over | 11 (57.9%) | 13 (41.9%) |
Disability Class: Cognitive Difficulty
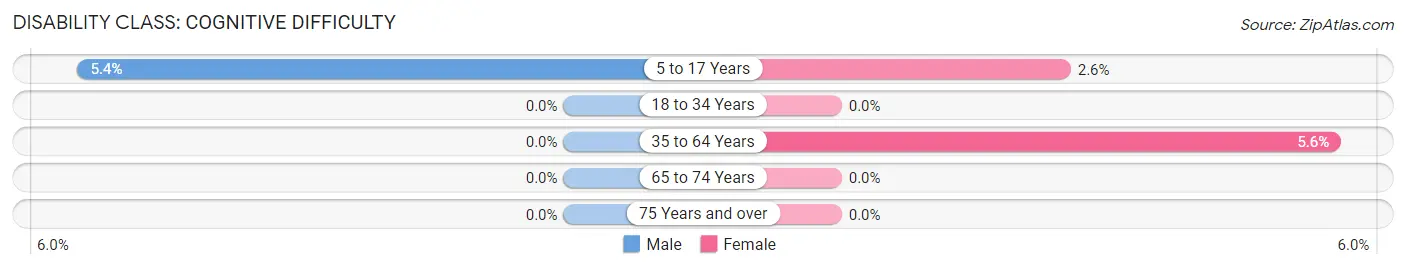
| Age Bracket | Male | Female |
| 5 to 17 Years | 6 (5.4%) | 4 (2.5%) |
| 18 to 34 Years | 0 (0.0%) | 0 (0.0%) |
| 35 to 64 Years | 0 (0.0%) | 12 (5.6%) |
| 65 to 74 Years | 0 (0.0%) | 0 (0.0%) |
| 75 Years and over | 0 (0.0%) | 0 (0.0%) |
Disability Class: Ambulatory Difficulty
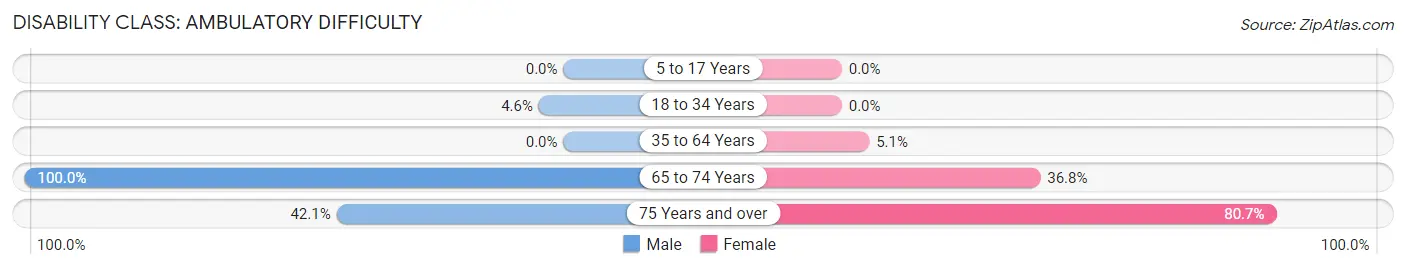
| Age Bracket | Male | Female |
| 5 to 17 Years | 0 (0.0%) | 0 (0.0%) |
| 18 to 34 Years | 5 (4.5%) | 0 (0.0%) |
| 35 to 64 Years | 0 (0.0%) | 11 (5.1%) |
| 65 to 74 Years | 14 (100.0%) | 7 (36.8%) |
| 75 Years and over | 8 (42.1%) | 25 (80.6%) |
Disability Class: Self-Care Difficulty
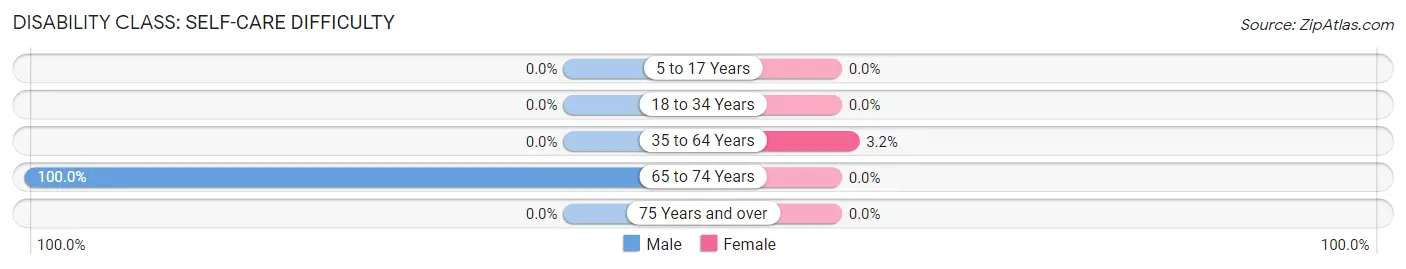
| Age Bracket | Male | Female |
| 5 to 17 Years | 0 (0.0%) | 0 (0.0%) |
| 18 to 34 Years | 0 (0.0%) | 0 (0.0%) |
| 35 to 64 Years | 0 (0.0%) | 7 (3.2%) |
| 65 to 74 Years | 14 (100.0%) | 0 (0.0%) |
| 75 Years and over | 0 (0.0%) | 0 (0.0%) |
Technology Access in Laverne
Computing Device Access in Laverne
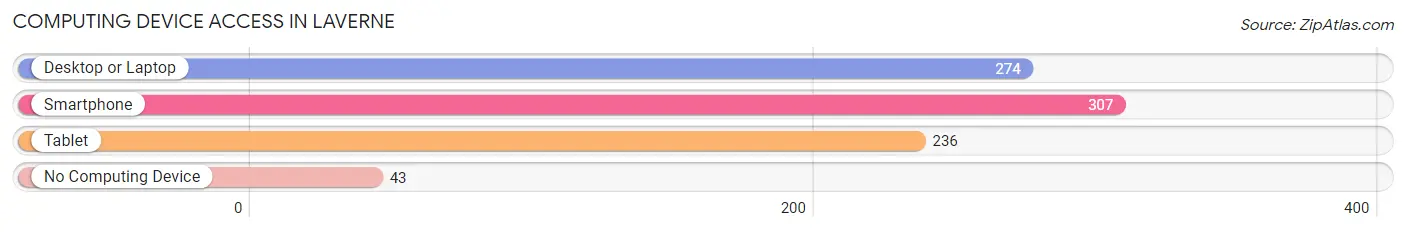
| Device Type | # Households | % Households |
| Desktop or Laptop | 274 | 75.5% |
| Smartphone | 307 | 84.6% |
| Tablet | 236 | 65.0% |
| No Computing Device | 43 | 11.8% |
| Total | 363 | 100.0% |
Internet Access in Laverne
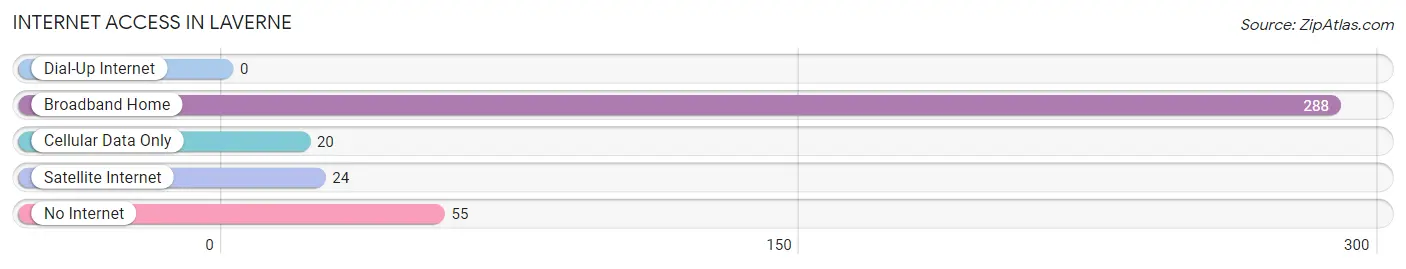
| Internet Type | # Households | % Households |
| Dial-Up Internet | 0 | 0.0% |
| Broadband Home | 288 | 79.3% |
| Cellular Data Only | 20 | 5.5% |
| Satellite Internet | 24 | 6.6% |
| No Internet | 55 | 15.1% |
| Total | 363 | 100.0% |
Laverne Summary
Laverne is a small town located in Harper County, Oklahoma. It is situated in the northwest corner of the state, approximately 30 miles from the Kansas border. The town was founded in 1892 and named after Laverne, Iowa, the hometown of the first postmaster. Laverne has a population of 1,845 people, according to the 2010 census.
Geography
Laverne is located in the northwest corner of Oklahoma, approximately 30 miles from the Kansas border. The town is situated in the Red Bed Plains region of the state, which is characterized by flat terrain and red-colored soil. The town is located at an elevation of 1,717 feet above sea level. Laverne is located in Harper County, which is bordered by Woodward County to the north, Ellis County to the east, Woods County to the south, and Beaver County to the west.
The town is located along U.S. Route 412, which runs east-west through the town. The nearest major cities are Woodward, Oklahoma, which is approximately 30 miles to the north, and Enid, Oklahoma, which is approximately 50 miles to the south.
Economy
The economy of Laverne is largely based on agriculture. The town is located in an area of the state that is known for its wheat production. Other crops grown in the area include corn, sorghum, and hay. The town is also home to several small businesses, including a grocery store, a hardware store, and a restaurant.
Demographics
According to the 2010 census, Laverne has a population of 1,845 people. The town has a median household income of $35,000, and the median age is 38. The town is predominantly white, with approximately 95% of the population identifying as such. The remaining 5% of the population is made up of African Americans, Native Americans, and Hispanics.
The town is served by the Laverne Public School District, which consists of one elementary school, one middle school, and one high school. The town is also home to a branch of the Harper County Library.
Conclusion
Laverne is a small town located in the northwest corner of Oklahoma. The town was founded in 1892 and has a population of 1,845 people, according to the 2010 census. The economy of Laverne is largely based on agriculture, and the town is served by the Laverne Public School District. Laverne is predominantly white, with approximately 95% of the population identifying as such.
Common Questions
What is Per Capita Income in Laverne?
Per Capita income in Laverne is $22,316.
What is the Median Family Income in Laverne?
Median Family Income in Laverne is $57,019.
What is the Median Household income in Laverne?
Median Household Income in Laverne is $54,886.
What is Income or Wage Gap in Laverne?
Income or Wage Gap in Laverne is 30.7%.
Women in Laverne earn 69.3 cents for every dollar earned by a man.
What is Inequality or Gini Index in Laverne?
Inequality or Gini Index in Laverne is 0.37.
What is the Total Population of Laverne?
Total Population of Laverne is 1,035.
What is the Total Male Population of Laverne?
Total Male Population of Laverne is 504.
What is the Total Female Population of Laverne?
Total Female Population of Laverne is 531.
What is the Ratio of Males per 100 Females in Laverne?
There are 94.92 Males per 100 Females in Laverne.
What is the Ratio of Females per 100 Males in Laverne?
There are 105.36 Females per 100 Males in Laverne.
What is the Median Population Age in Laverne?
Median Population Age in Laverne is 35.2 Years.
What is the Average Family Size in Laverne
Average Family Size in Laverne is 3.3 People.
What is the Average Household Size in Laverne
Average Household Size in Laverne is 2.9 People.
How Large is the Labor Force in Laverne?
There are 506 People in the Labor Forcein in Laverne.
What is the Percentage of People in the Labor Force in Laverne?
66.1% of People are in the Labor Force in Laverne.
What is the Unemployment Rate in Laverne?
Unemployment Rate in Laverne is 3.0%.