Oilton, OK Map & Demographics
Oilton Map
Oilton Overview
$20,579
PER CAPITA INCOME
$43,750
AVG FAMILY INCOME
$33,229
AVG HOUSEHOLD INCOME
39.0%
WAGE / INCOME GAP [ % ]
61.0¢/ $1
WAGE / INCOME GAP [ $ ]
0.47
INEQUALITY / GINI INDEX
806
TOTAL POPULATION
415
MALE POPULATION
391
FEMALE POPULATION
106.14
MALES / 100 FEMALES
94.22
FEMALES / 100 MALES
35.3
MEDIAN AGE
3.0
AVG FAMILY SIZE
2.3
AVG HOUSEHOLD SIZE
321
LABOR FORCE [ PEOPLE ]
53.4%
PERCENT IN LABOR FORCE
3.4%
UNEMPLOYMENT RATE
Oilton Zip Codes
Oilton Area Codes
Income in Oilton
Income Overview in Oilton
Per Capita Income in Oilton is $20,579, while median incomes of families and households are $43,750 and $33,229 respectively.
| Characteristic | Number | Measure |
| Per Capita Income | 806 | $20,579 |
| Median Family Income | 214 | $43,750 |
| Mean Family Income | 214 | $56,904 |
| Median Household Income | 349 | $33,229 |
| Mean Household Income | 349 | $46,613 |
| Income Deficit | 214 | $0 |
| Wage / Income Gap (%) | 806 | 39.02% |
| Wage / Income Gap ($) | 806 | 60.98¢ per $1 |
| Gini / Inequality Index | 806 | 0.47 |
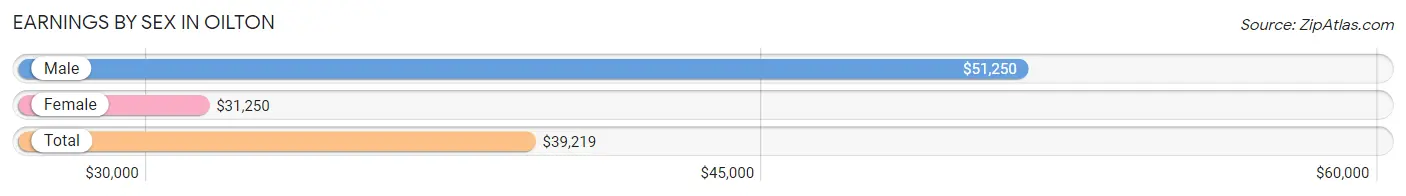
Earnings by Sex in Oilton
Average Earnings in Oilton are $39,219, $51,250 for men and $31,250 for women, a difference of 39.0%.
| Sex | Number | Average Earnings |
| Male | 159 (49.7%) | $51,250 |
| Female | 161 (50.3%) | $31,250 |
| Total | 320 (100.0%) | $39,219 |
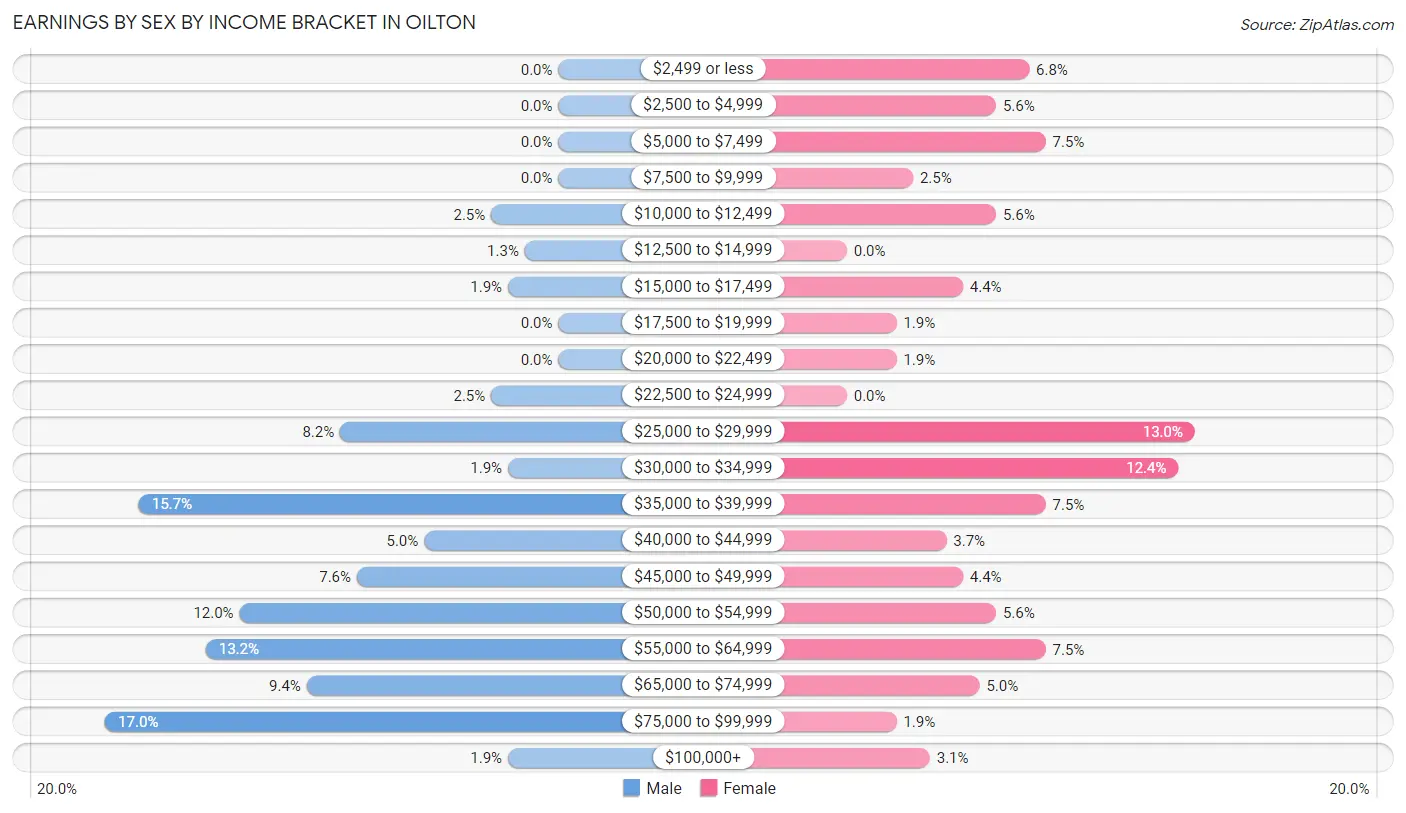
Earnings by Sex by Income Bracket in Oilton
The most common earnings brackets in Oilton are $75,000 to $99,999 for men (27 | 17.0%) and $25,000 to $29,999 for women (21 | 13.0%).
| Income | Male | Female |
| $2,499 or less | 0 (0.0%) | 11 (6.8%) |
| $2,500 to $4,999 | 0 (0.0%) | 9 (5.6%) |
| $5,000 to $7,499 | 0 (0.0%) | 12 (7.4%) |
| $7,500 to $9,999 | 0 (0.0%) | 4 (2.5%) |
| $10,000 to $12,499 | 4 (2.5%) | 9 (5.6%) |
| $12,500 to $14,999 | 2 (1.3%) | 0 (0.0%) |
| $15,000 to $17,499 | 3 (1.9%) | 7 (4.3%) |
| $17,500 to $19,999 | 0 (0.0%) | 3 (1.9%) |
| $20,000 to $22,499 | 0 (0.0%) | 3 (1.9%) |
| $22,500 to $24,999 | 4 (2.5%) | 0 (0.0%) |
| $25,000 to $29,999 | 13 (8.2%) | 21 (13.0%) |
| $30,000 to $34,999 | 3 (1.9%) | 20 (12.4%) |
| $35,000 to $39,999 | 25 (15.7%) | 12 (7.4%) |
| $40,000 to $44,999 | 8 (5.0%) | 6 (3.7%) |
| $45,000 to $49,999 | 12 (7.5%) | 7 (4.3%) |
| $50,000 to $54,999 | 19 (11.9%) | 9 (5.6%) |
| $55,000 to $64,999 | 21 (13.2%) | 12 (7.4%) |
| $65,000 to $74,999 | 15 (9.4%) | 8 (5.0%) |
| $75,000 to $99,999 | 27 (17.0%) | 3 (1.9%) |
| $100,000+ | 3 (1.9%) | 5 (3.1%) |
| Total | 159 (100.0%) | 161 (100.0%) |
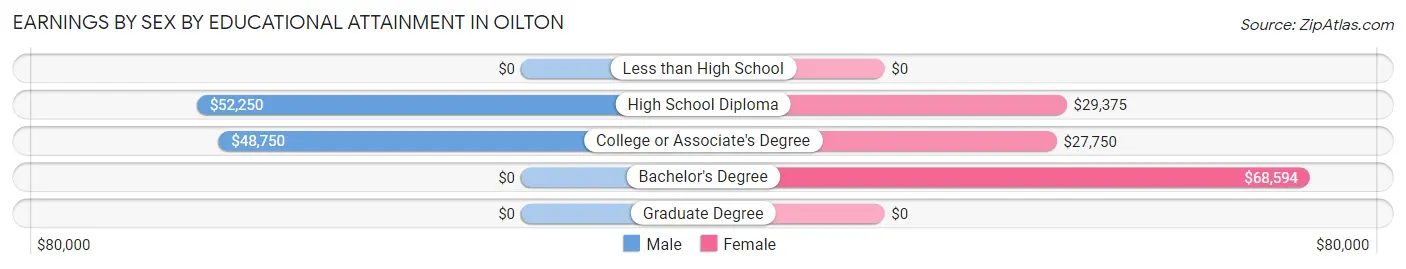
Earnings by Sex by Educational Attainment in Oilton
Average earnings in Oilton are $50,909 for men and $33,125 for women, a difference of 34.9%. Men with an educational attainment of high school diploma enjoy the highest average annual earnings of $52,250, while those with college or associate's degree education earn the least with $48,750. Women with an educational attainment of bachelor's degree earn the most with the average annual earnings of $68,594, while those with college or associate's degree education have the smallest earnings of $27,750.
| Educational Attainment | Male Income | Female Income |
| Less than High School | - | - |
| High School Diploma | $52,250 | $29,375 |
| College or Associate's Degree | $48,750 | $27,750 |
| Bachelor's Degree | - | - |
| Graduate Degree | - | - |
| Total | $50,909 | $33,125 |
Family Income in Oilton
Family Income Brackets in Oilton
According to the Oilton family income data, there are 37 families falling into the $50,000 to $74,999 income range, which is the most common income bracket and makes up 17.3% of all families.
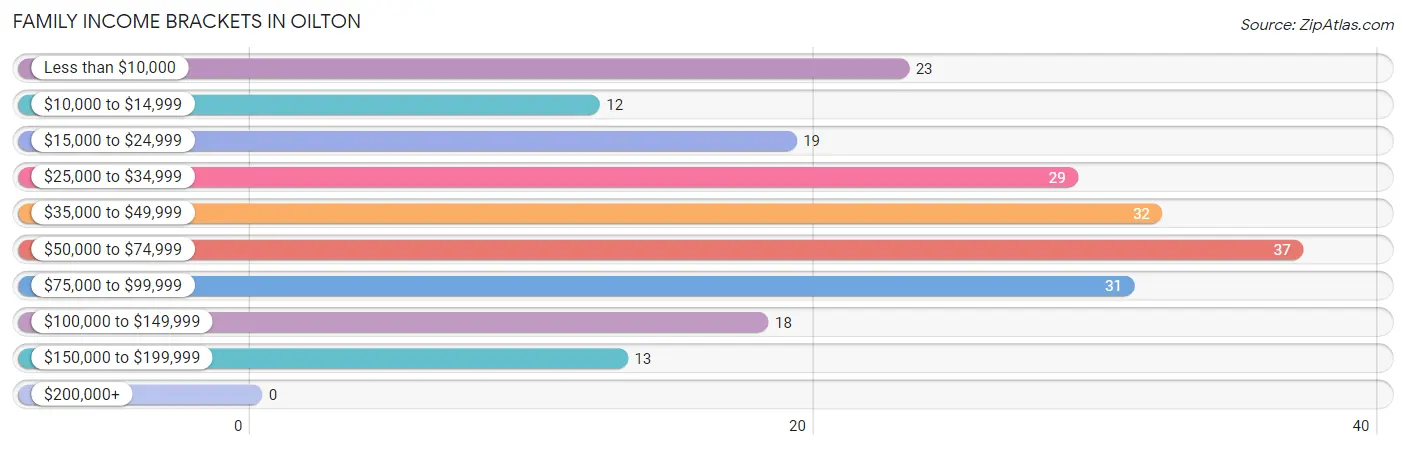
| Income Bracket | # Families | % Families |
| Less than $10,000 | 23 | 10.7% |
| $10,000 to $14,999 | 12 | 5.6% |
| $15,000 to $24,999 | 19 | 8.9% |
| $25,000 to $34,999 | 29 | 13.6% |
| $35,000 to $49,999 | 32 | 15.0% |
| $50,000 to $74,999 | 37 | 17.3% |
| $75,000 to $99,999 | 31 | 14.5% |
| $100,000 to $149,999 | 18 | 8.4% |
| $150,000 to $199,999 | 13 | 6.1% |
| $200,000+ | 0 | 0.0% |
Family Income by Famaliy Size in Oilton
2-person families (89 | 41.6%) account for the highest median family income in Oilton with $52,083 per family, while 2-person families (89 | 41.6%) have the highest median income of $26,042 per family member.

| Income Bracket | # Families | Median Income |
| 2-Person Families | 89 (41.6%) | $52,083 |
| 3-Person Families | 66 (30.8%) | $45,833 |
| 4-Person Families | 44 (20.6%) | $0 |
| 5-Person Families | 8 (3.7%) | $0 |
| 6-Person Families | 7 (3.3%) | $0 |
| 7+ Person Families | 0 (0.0%) | $0 |
| Total | 214 (100.0%) | $43,750 |
Family Income by Number of Earners in Oilton
The median family income in Oilton is $43,750, with families comprising 3+ earners (13) having the highest median family income of $176,250, while families with no earners (58) have the lowest median family income of $15,000, accounting for 6.1% and 27.1% of families, respectively.
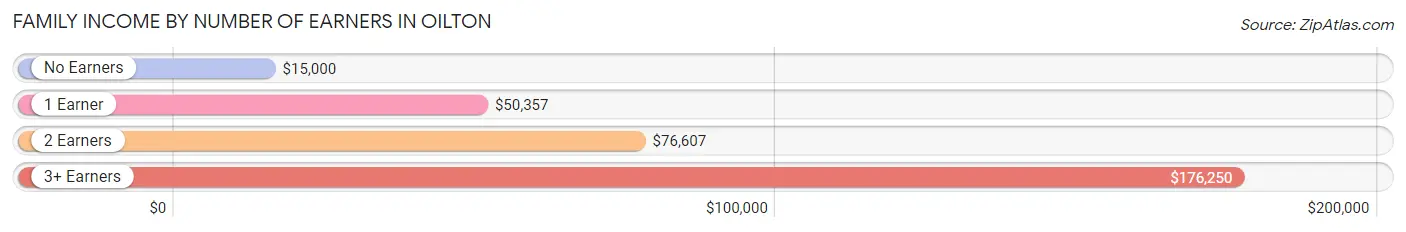
| Number of Earners | # Families | Median Income |
| No Earners | 58 (27.1%) | $15,000 |
| 1 Earner | 82 (38.3%) | $50,357 |
| 2 Earners | 61 (28.5%) | $76,607 |
| 3+ Earners | 13 (6.1%) | $176,250 |
| Total | 214 (100.0%) | $43,750 |
Household Income in Oilton
Household Income Brackets in Oilton
With 50 households falling in the category, the $25,000 to $34,999 income range is the most frequent in Oilton, accounting for 14.3% of all households.
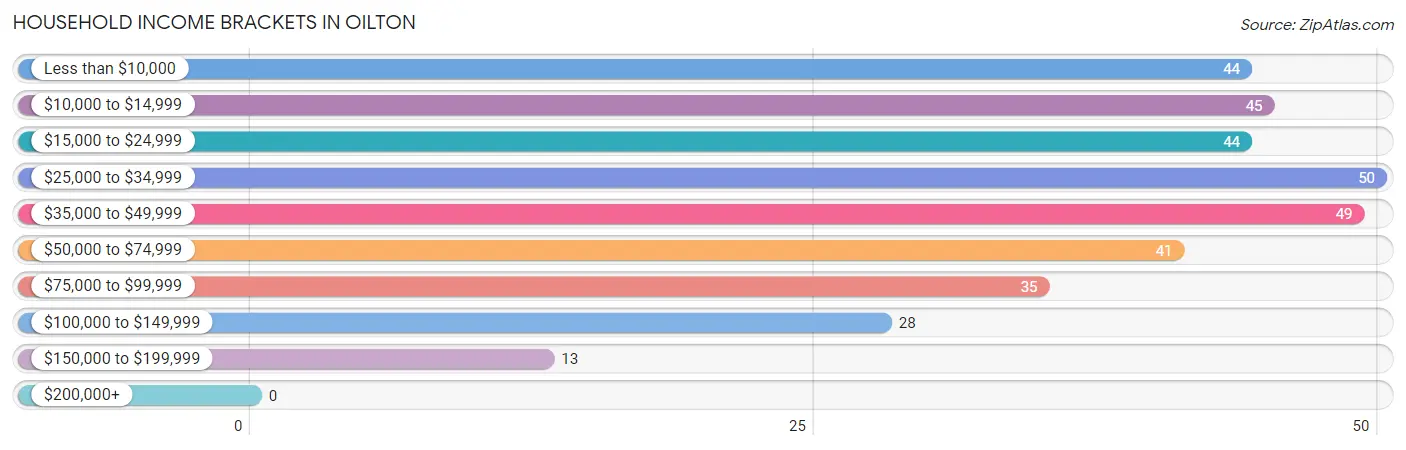
| Income Bracket | # Households | % Households |
| Less than $10,000 | 44 | 12.6% |
| $10,000 to $14,999 | 45 | 12.9% |
| $15,000 to $24,999 | 44 | 12.6% |
| $25,000 to $34,999 | 50 | 14.3% |
| $35,000 to $49,999 | 49 | 14.0% |
| $50,000 to $74,999 | 41 | 11.7% |
| $75,000 to $99,999 | 35 | 10.0% |
| $100,000 to $149,999 | 28 | 8.0% |
| $150,000 to $199,999 | 13 | 3.7% |
| $200,000+ | 0 | 0.0% |
Household Income by Householder Age in Oilton
The median household income in Oilton is $33,229, with the highest median household income of $40,000 found in the 25 to 44 years age bracket for the primary householder. A total of 128 households (36.7%) fall into this category. Meanwhile, the 15 to 24 years age bracket for the primary householder has the lowest median household income of $0, with 14 households (4.0%) in this group.
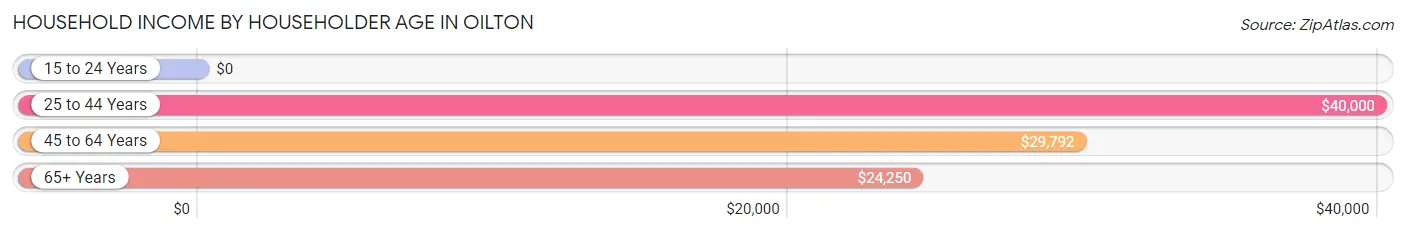
| Income Bracket | # Households | Median Income |
| 15 to 24 Years | 14 (4.0%) | $0 |
| 25 to 44 Years | 128 (36.7%) | $40,000 |
| 45 to 64 Years | 132 (37.8%) | $29,792 |
| 65+ Years | 75 (21.5%) | $24,250 |
| Total | 349 (100.0%) | $33,229 |
Poverty in Oilton
Income Below Poverty by Sex and Age in Oilton
With 28.0% poverty level for males and 30.2% for females among the residents of Oilton, 12 to 14 year old males and 15 year old females are the most vulnerable to poverty, with 12 males (66.7%) and 3 females (100.0%) in their respective age groups living below the poverty level.
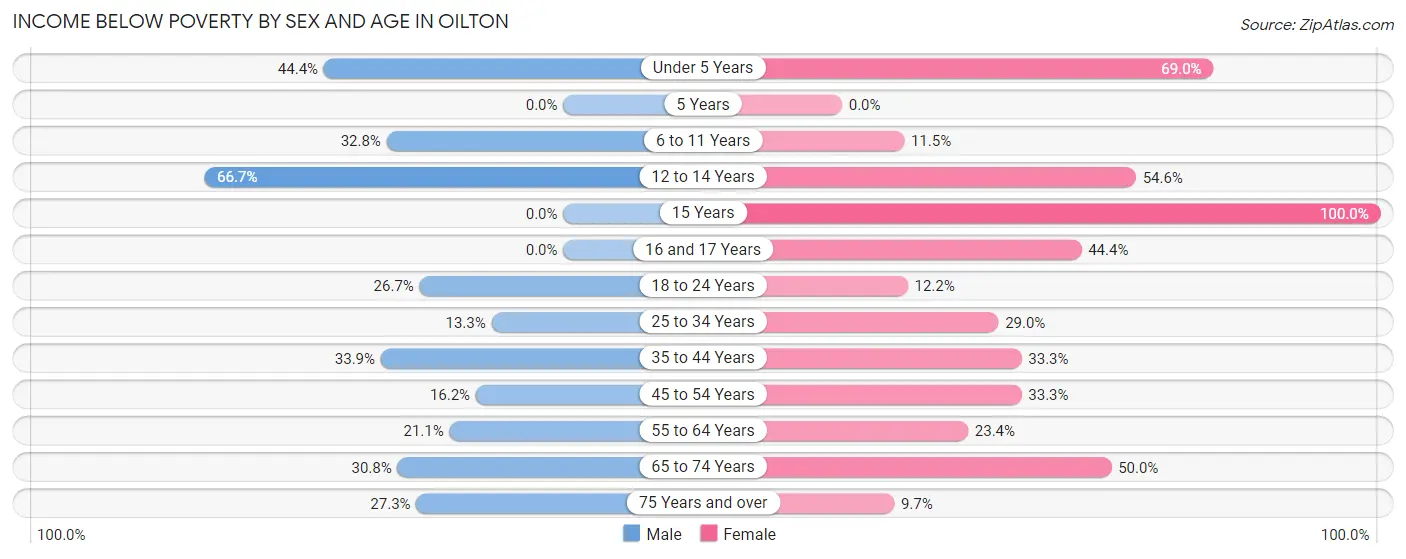
| Age Bracket | Male | Female |
| Under 5 Years | 16 (44.4%) | 20 (69.0%) |
| 5 Years | 0 (0.0%) | 0 (0.0%) |
| 6 to 11 Years | 20 (32.8%) | 3 (11.5%) |
| 12 to 14 Years | 12 (66.7%) | 6 (54.5%) |
| 15 Years | 0 (0.0%) | 3 (100.0%) |
| 16 and 17 Years | 0 (0.0%) | 4 (44.4%) |
| 18 to 24 Years | 8 (26.7%) | 5 (12.2%) |
| 25 to 34 Years | 6 (13.3%) | 18 (29.0%) |
| 35 to 44 Years | 21 (33.9%) | 20 (33.3%) |
| 45 to 54 Years | 6 (16.2%) | 15 (33.3%) |
| 55 to 64 Years | 15 (21.1%) | 11 (23.4%) |
| 65 to 74 Years | 8 (30.8%) | 10 (50.0%) |
| 75 Years and over | 3 (27.3%) | 3 (9.7%) |
| Total | 115 (28.0%) | 118 (30.2%) |
Income Above Poverty by Sex and Age in Oilton
According to the poverty statistics in Oilton, males aged 15 years and females aged 5 years are the age groups that are most secure financially, with 100.0% of males and 100.0% of females in these age groups living above the poverty line.
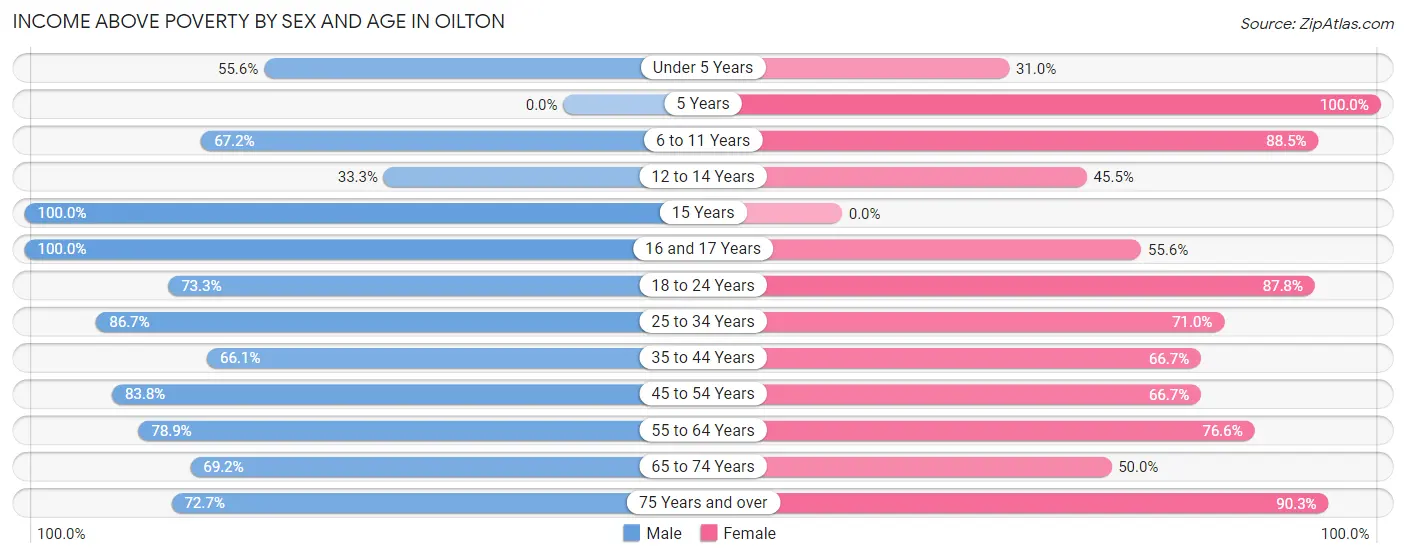
| Age Bracket | Male | Female |
| Under 5 Years | 20 (55.6%) | 9 (31.0%) |
| 5 Years | 0 (0.0%) | 7 (100.0%) |
| 6 to 11 Years | 41 (67.2%) | 23 (88.5%) |
| 12 to 14 Years | 6 (33.3%) | 5 (45.5%) |
| 15 Years | 10 (100.0%) | 0 (0.0%) |
| 16 and 17 Years | 4 (100.0%) | 5 (55.6%) |
| 18 to 24 Years | 22 (73.3%) | 36 (87.8%) |
| 25 to 34 Years | 39 (86.7%) | 44 (71.0%) |
| 35 to 44 Years | 41 (66.1%) | 40 (66.7%) |
| 45 to 54 Years | 31 (83.8%) | 30 (66.7%) |
| 55 to 64 Years | 56 (78.9%) | 36 (76.6%) |
| 65 to 74 Years | 18 (69.2%) | 10 (50.0%) |
| 75 Years and over | 8 (72.7%) | 28 (90.3%) |
| Total | 296 (72.0%) | 273 (69.8%) |
Income Below Poverty Among Married-Couple Families in Oilton
The poverty statistics for married-couple families in Oilton show that 18.3% or 24 of the total 131 families live below the poverty line. Families with 3 or 4 children have the highest poverty rate of 57.1%, comprising of 8 families. On the other hand, families with no children have the lowest poverty rate of 6.0%, which includes 4 families.
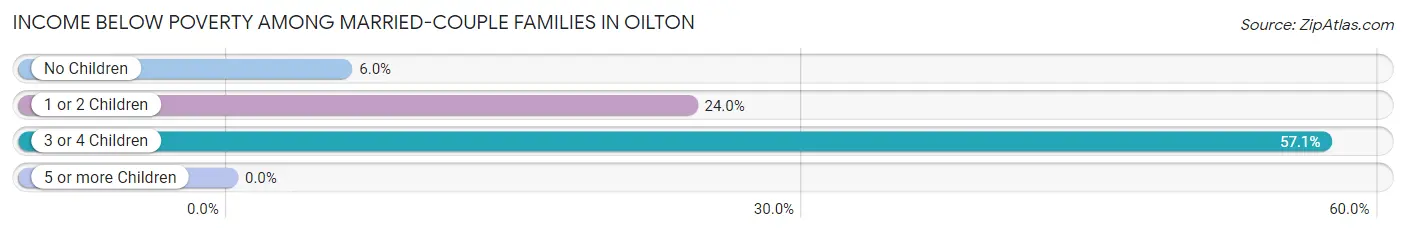
| Children | Above Poverty | Below Poverty |
| No Children | 63 (94.0%) | 4 (6.0%) |
| 1 or 2 Children | 38 (76.0%) | 12 (24.0%) |
| 3 or 4 Children | 6 (42.9%) | 8 (57.1%) |
| 5 or more Children | 0 (0.0%) | 0 (0.0%) |
| Total | 107 (81.7%) | 24 (18.3%) |
Income Below Poverty Among Single-Parent Households in Oilton
According to the poverty data in Oilton, 23.5% or 8 single-father households and 44.9% or 22 single-mother households are living below the poverty line. Among single-father households, those with 1 or 2 children have the highest poverty rate, with 8 households (44.4%) experiencing poverty. Likewise, among single-mother households, those with 1 or 2 children have the highest poverty rate, with 19 households (50.0%) falling below the poverty line.
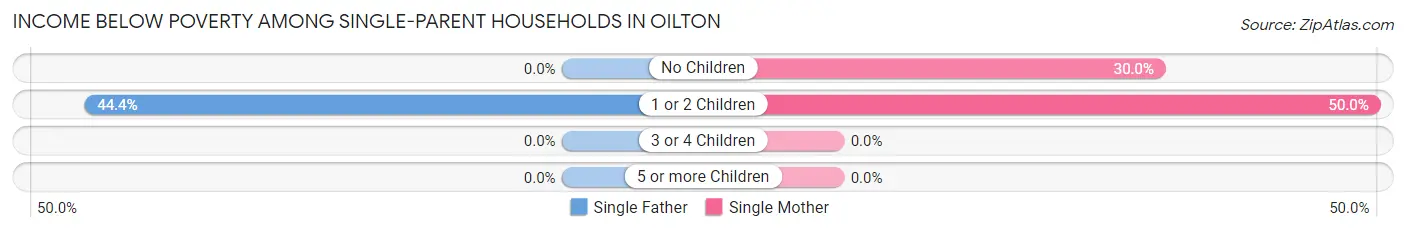
| Children | Single Father | Single Mother |
| No Children | 0 (0.0%) | 3 (30.0%) |
| 1 or 2 Children | 8 (44.4%) | 19 (50.0%) |
| 3 or 4 Children | 0 (0.0%) | 0 (0.0%) |
| 5 or more Children | 0 (0.0%) | 0 (0.0%) |
| Total | 8 (23.5%) | 22 (44.9%) |
Income Below Poverty Among Married-Couple vs Single-Parent Households in Oilton
The poverty data for Oilton shows that 24 of the married-couple family households (18.3%) and 30 of the single-parent households (36.1%) are living below the poverty level. Within the married-couple family households, those with 3 or 4 children have the highest poverty rate, with 8 households (57.1%) falling below the poverty line. Among the single-parent households, those with 1 or 2 children have the highest poverty rate, with 27 household (48.2%) living below poverty.
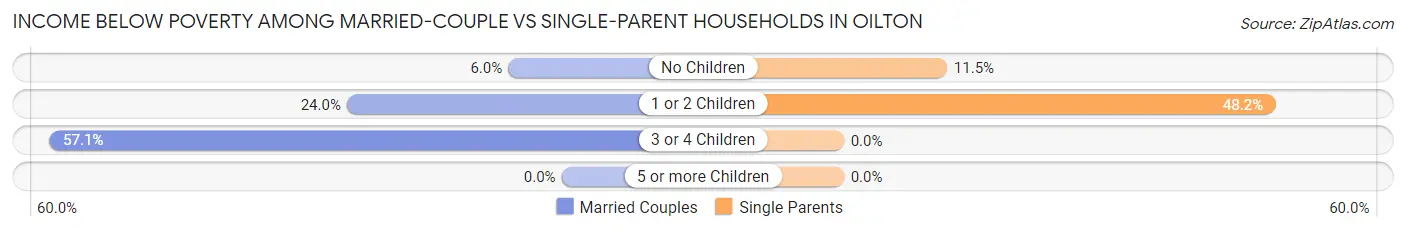
| Children | Married-Couple Families | Single-Parent Households |
| No Children | 4 (6.0%) | 3 (11.5%) |
| 1 or 2 Children | 12 (24.0%) | 27 (48.2%) |
| 3 or 4 Children | 8 (57.1%) | 0 (0.0%) |
| 5 or more Children | 0 (0.0%) | 0 (0.0%) |
| Total | 24 (18.3%) | 30 (36.1%) |
Race in Oilton
The most populous races in Oilton are White / Caucasian (706 | 87.6%), Native / Alaskan (65 | 8.1%), and Two or more Races (24 | 3.0%).
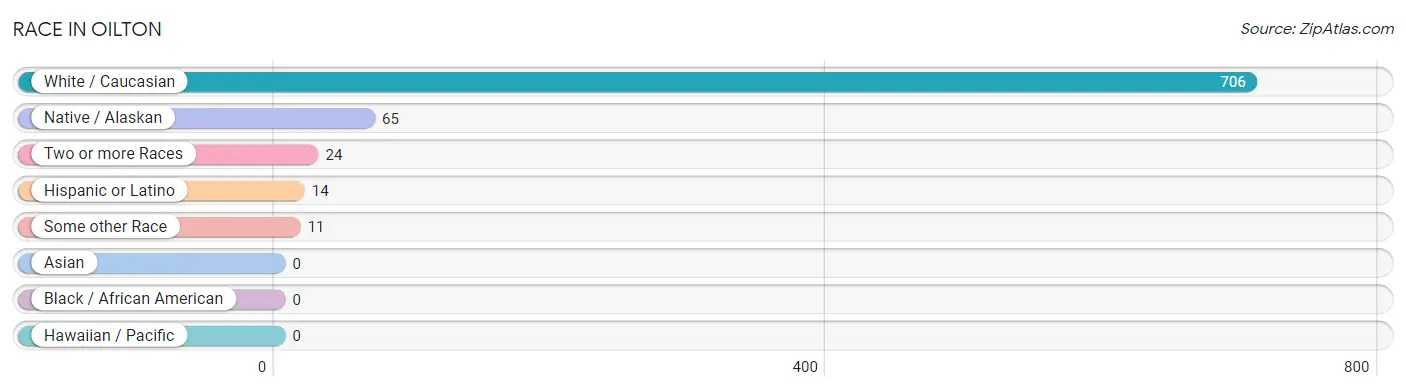
| Race | # Population | % Population |
| Asian | 0 | 0.0% |
| Black / African American | 0 | 0.0% |
| Hawaiian / Pacific | 0 | 0.0% |
| Hispanic or Latino | 14 | 1.7% |
| Native / Alaskan | 65 | 8.1% |
| White / Caucasian | 706 | 87.6% |
| Two or more Races | 24 | 3.0% |
| Some other Race | 11 | 1.4% |
| Total | 806 | 100.0% |
Ancestry in Oilton
The most populous ancestries reported in Oilton are Irish (130 | 16.1%), German (120 | 14.9%), French (31 | 3.8%), Creek (27 | 3.4%), and English (26 | 3.2%), together accounting for 41.4% of all Oilton residents.
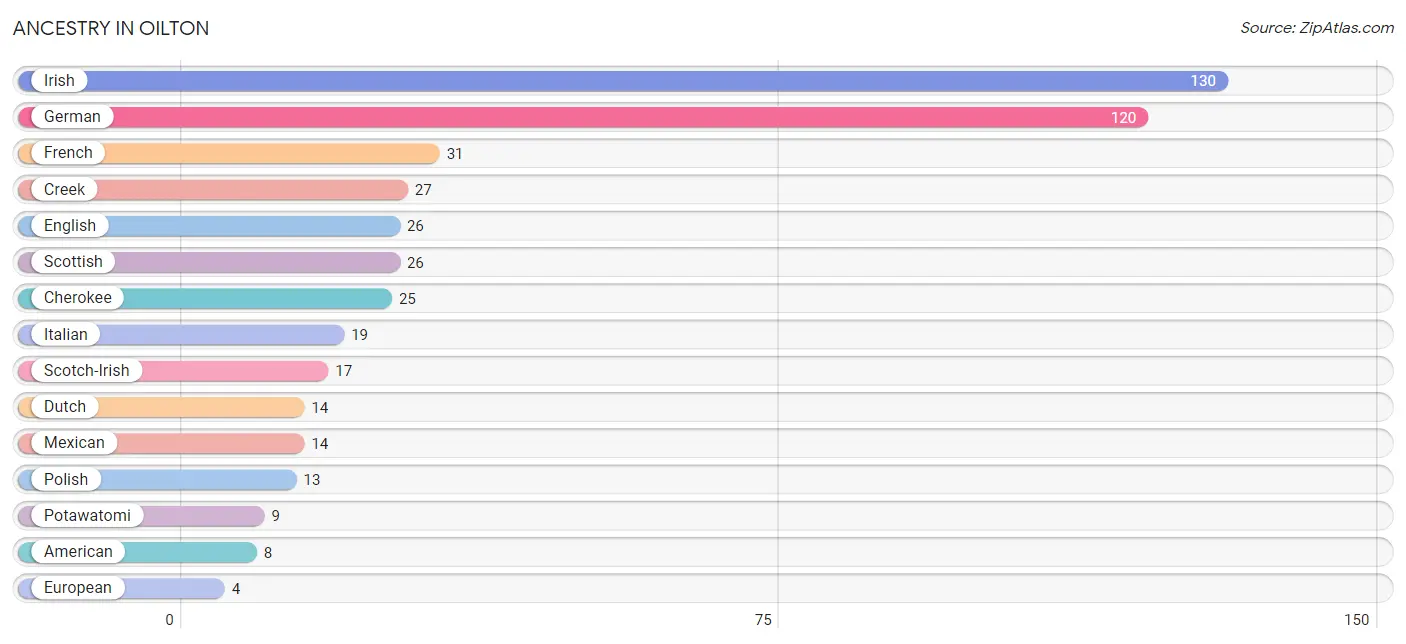
| Ancestry | # Population | % Population |
| American | 8 | 1.0% |
| Cherokee | 25 | 3.1% |
| Chickasaw | 3 | 0.4% |
| Creek | 27 | 3.4% |
| Dutch | 14 | 1.7% |
| English | 26 | 3.2% |
| European | 4 | 0.5% |
| French | 31 | 3.8% |
| German | 120 | 14.9% |
| Irish | 130 | 16.1% |
| Italian | 19 | 2.4% |
| Mexican | 14 | 1.7% |
| Polish | 13 | 1.6% |
| Potawatomi | 9 | 1.1% |
| Scotch-Irish | 17 | 2.1% |
| Scottish | 26 | 3.2% |
| Ukrainian | 4 | 0.5% | View All 17 Rows |
Immigrants in Oilton

| Immigration Origin | # Population | % Population | View All 0 Rows |
Sex and Age in Oilton
Sex and Age in Oilton
The most populous age groups in Oilton are 5 to 9 Years (59 | 14.2%) for men and 30 to 34 Years (44 | 11.3%) for women.
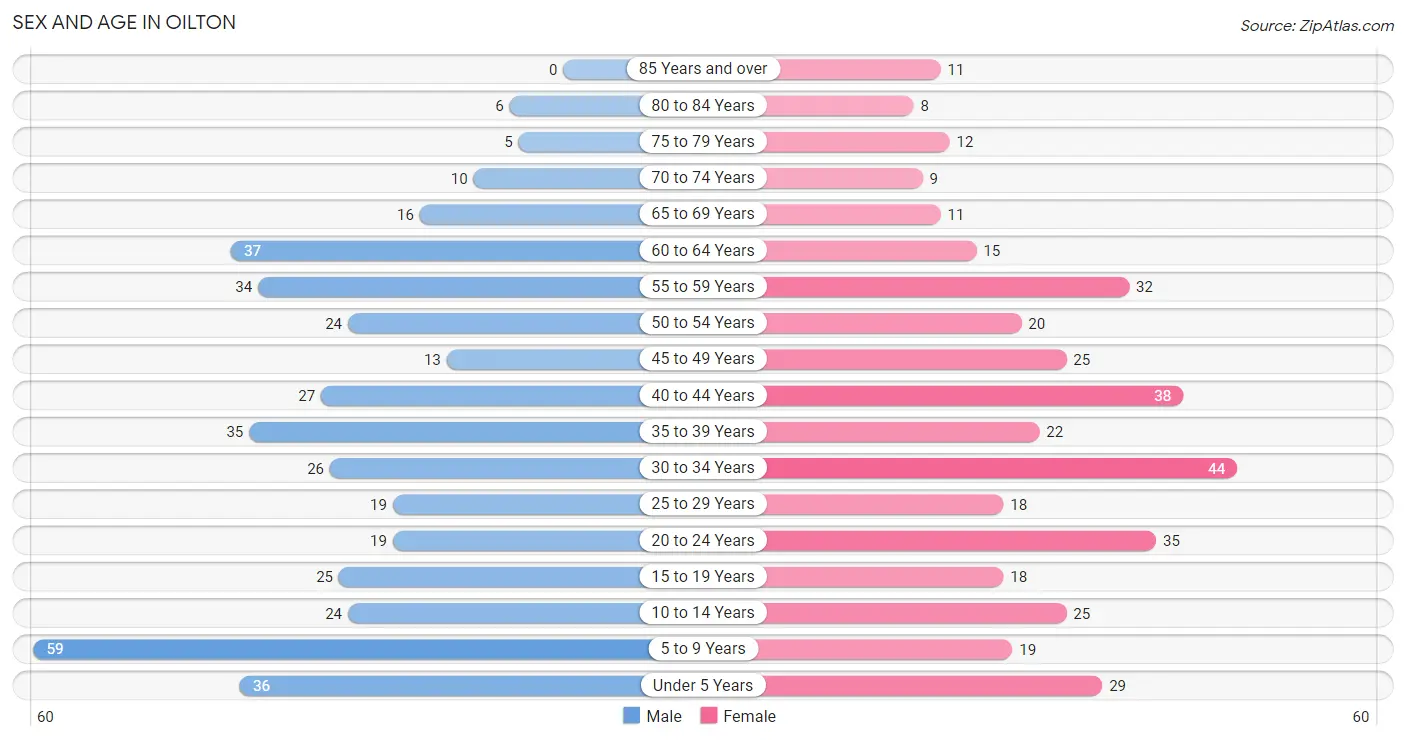
| Age Bracket | Male | Female |
| Under 5 Years | 36 (8.7%) | 29 (7.4%) |
| 5 to 9 Years | 59 (14.2%) | 19 (4.9%) |
| 10 to 14 Years | 24 (5.8%) | 25 (6.4%) |
| 15 to 19 Years | 25 (6.0%) | 18 (4.6%) |
| 20 to 24 Years | 19 (4.6%) | 35 (8.9%) |
| 25 to 29 Years | 19 (4.6%) | 18 (4.6%) |
| 30 to 34 Years | 26 (6.3%) | 44 (11.3%) |
| 35 to 39 Years | 35 (8.4%) | 22 (5.6%) |
| 40 to 44 Years | 27 (6.5%) | 38 (9.7%) |
| 45 to 49 Years | 13 (3.1%) | 25 (6.4%) |
| 50 to 54 Years | 24 (5.8%) | 20 (5.1%) |
| 55 to 59 Years | 34 (8.2%) | 32 (8.2%) |
| 60 to 64 Years | 37 (8.9%) | 15 (3.8%) |
| 65 to 69 Years | 16 (3.9%) | 11 (2.8%) |
| 70 to 74 Years | 10 (2.4%) | 9 (2.3%) |
| 75 to 79 Years | 5 (1.2%) | 12 (3.1%) |
| 80 to 84 Years | 6 (1.5%) | 8 (2.1%) |
| 85 Years and over | 0 (0.0%) | 11 (2.8%) |
| Total | 415 (100.0%) | 391 (100.0%) |
Families and Households in Oilton
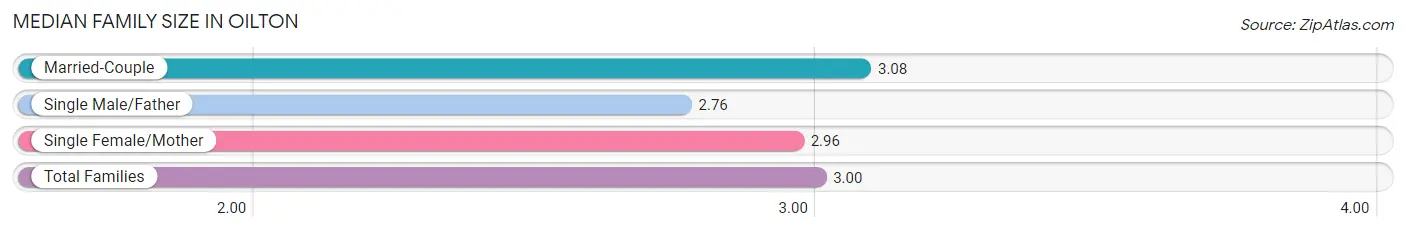
Median Family Size in Oilton
The median family size in Oilton is 3.00 persons per family, with married-couple families (131 | 61.2%) accounting for the largest median family size of 3.08 persons per family. On the other hand, single male/father families (34 | 15.9%) represent the smallest median family size with 2.76 persons per family.
| Family Type | # Families | Family Size |
| Married-Couple | 131 (61.2%) | 3.08 |
| Single Male/Father | 34 (15.9%) | 2.76 |
| Single Female/Mother | 49 (22.9%) | 2.96 |
| Total Families | 214 (100.0%) | 3.00 |
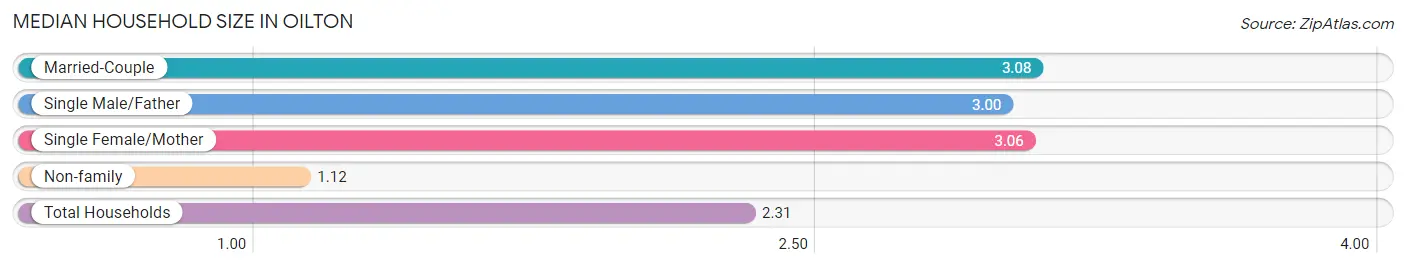
Median Household Size in Oilton
The median household size in Oilton is 2.31 persons per household, with married-couple households (131 | 37.5%) accounting for the largest median household size of 3.08 persons per household. non-family households (135 | 38.7%) represent the smallest median household size with 1.12 persons per household.
| Household Type | # Households | Household Size |
| Married-Couple | 131 (37.5%) | 3.08 |
| Single Male/Father | 34 (9.7%) | 3.00 |
| Single Female/Mother | 49 (14.0%) | 3.06 |
| Non-family | 135 (38.7%) | 1.12 |
| Total Households | 349 (100.0%) | 2.31 |
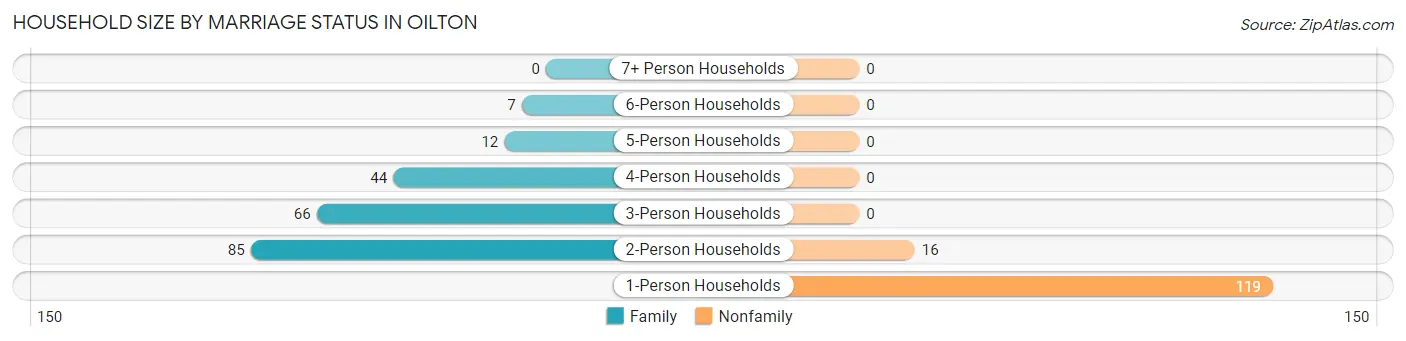
Household Size by Marriage Status in Oilton
Out of a total of 349 households in Oilton, 214 (61.3%) are family households, while 135 (38.7%) are nonfamily households. The most numerous type of family households are 2-person households, comprising 85, and the most common type of nonfamily households are 1-person households, comprising 119.
| Household Size | Family Households | Nonfamily Households |
| 1-Person Households | - | 119 (34.1%) |
| 2-Person Households | 85 (24.4%) | 16 (4.6%) |
| 3-Person Households | 66 (18.9%) | 0 (0.0%) |
| 4-Person Households | 44 (12.6%) | 0 (0.0%) |
| 5-Person Households | 12 (3.4%) | 0 (0.0%) |
| 6-Person Households | 7 (2.0%) | 0 (0.0%) |
| 7+ Person Households | 0 (0.0%) | 0 (0.0%) |
| Total | 214 (61.3%) | 135 (38.7%) |
Female Fertility in Oilton
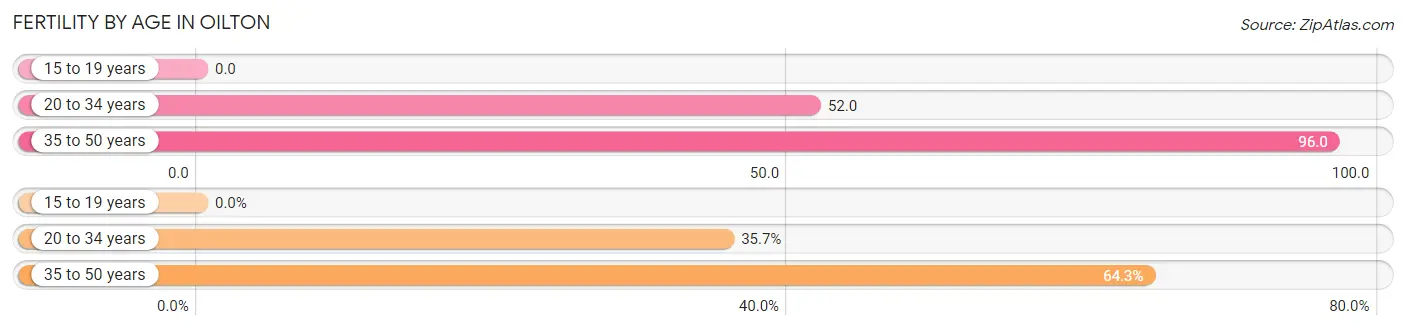
Fertility by Age in Oilton
Average fertility rate in Oilton is 67.0 births per 1,000 women. Women in the age bracket of 35 to 50 years have the highest fertility rate with 96.0 births per 1,000 women. Women in the age bracket of 35 to 50 years acount for 64.3% of all women with births.
| Age Bracket | Women with Births | Births / 1,000 Women |
| 15 to 19 years | 0 (0.0%) | 0.0 |
| 20 to 34 years | 5 (35.7%) | 52.0 |
| 35 to 50 years | 9 (64.3%) | 96.0 |
| Total | 14 (100.0%) | 67.0 |
Fertility by Age by Marriage Status in Oilton
64.3% of women with births (14) in Oilton are married. The highest percentage of unmarried women with births falls into 20 to 34 years age bracket with 100.0% of them unmarried at the time of birth, while the lowest percentage of unmarried women with births belong to 35 to 50 years age bracket with 0.0% of them unmarried.
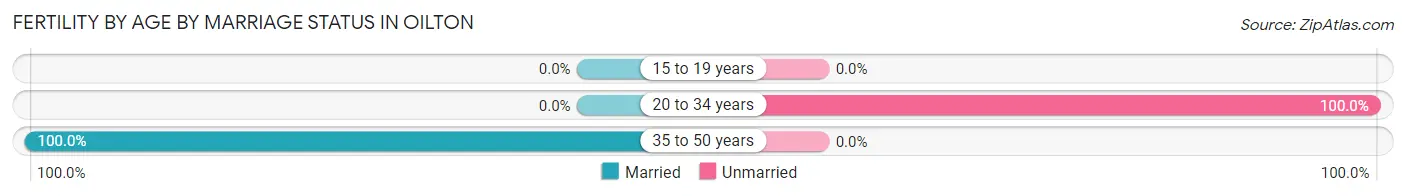
| Age Bracket | Married | Unmarried |
| 15 to 19 years | 0 (0.0%) | 0 (0.0%) |
| 20 to 34 years | 0 (0.0%) | 5 (100.0%) |
| 35 to 50 years | 9 (100.0%) | 0 (0.0%) |
| Total | 9 (64.3%) | 5 (35.7%) |
Fertility by Education in Oilton
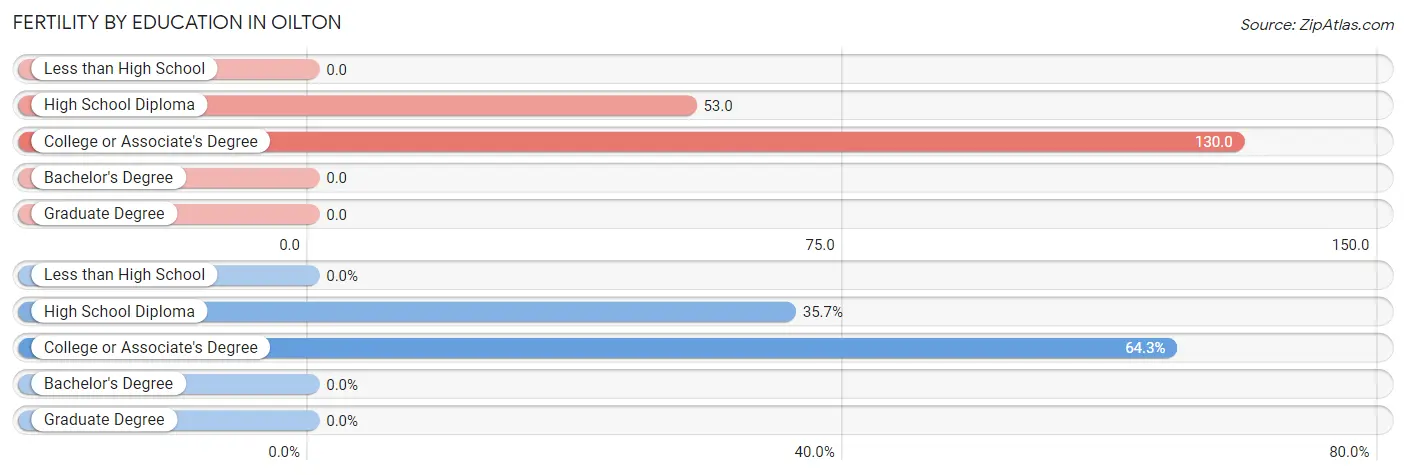
| Educational Attainment | Women with Births | Births / 1,000 Women |
| Less than High School | 0 (0.0%) | 0.0 |
| High School Diploma | 5 (35.7%) | 53.0 |
| College or Associate's Degree | 9 (64.3%) | 130.0 |
| Bachelor's Degree | 0 (0.0%) | 0.0 |
| Graduate Degree | 0 (0.0%) | 0.0 |
| Total | 14 (100.0%) | 67.0 |
Fertility by Education by Marriage Status in Oilton
35.7% of women with births in Oilton are unmarried. Women with the educational attainment of college or associate's degree are most likely to be married with 100.0% of them married at childbirth, while women with the educational attainment of high school diploma are least likely to be married with 100.0% of them unmarried at childbirth.
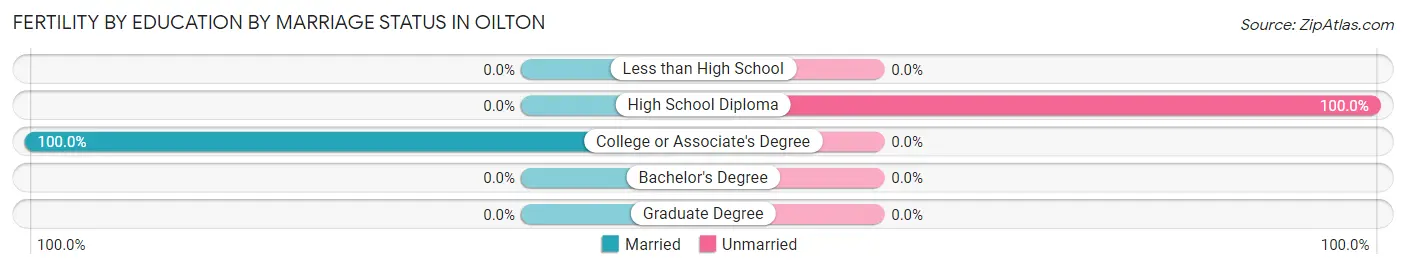
| Educational Attainment | Married | Unmarried |
| Less than High School | 0 (0.0%) | 0 (0.0%) |
| High School Diploma | 0 (0.0%) | 5 (100.0%) |
| College or Associate's Degree | 9 (100.0%) | 0 (0.0%) |
| Bachelor's Degree | 0 (0.0%) | 0 (0.0%) |
| Graduate Degree | 0 (0.0%) | 0 (0.0%) |
| Total | 9 (64.3%) | 5 (35.7%) |
Employment Characteristics in Oilton
Employment by Class of Employer in Oilton
Among the 310 employed individuals in Oilton, private company employees (234 | 75.5%), local government employees (28 | 9.0%), and not-for-profit organizations (14 | 4.5%) make up the most common classes of employment.
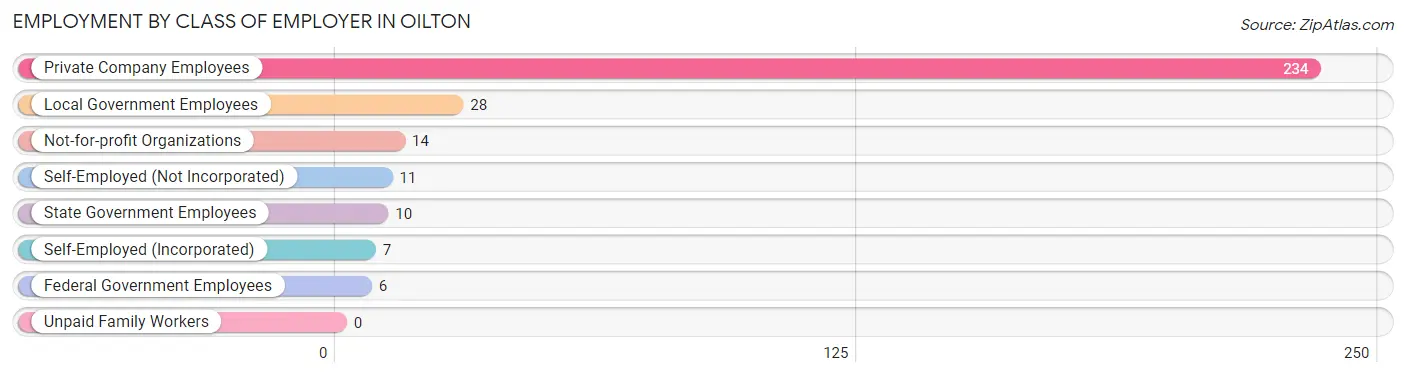
| Employer Class | # Employees | % Employees |
| Private Company Employees | 234 | 75.5% |
| Self-Employed (Incorporated) | 7 | 2.3% |
| Self-Employed (Not Incorporated) | 11 | 3.5% |
| Not-for-profit Organizations | 14 | 4.5% |
| Local Government Employees | 28 | 9.0% |
| State Government Employees | 10 | 3.2% |
| Federal Government Employees | 6 | 1.9% |
| Unpaid Family Workers | 0 | 0.0% |
| Total | 310 | 100.0% |
Employment Status by Age in Oilton
According to the labor force statistics for Oilton, out of the total population over 16 years of age (601), 53.4% or 321 individuals are in the labor force, with 3.4% or 11 of them unemployed. The age group with the highest labor force participation rate is 25 to 29 years, with 73.0% or 27 individuals in the labor force. Within the labor force, the 16 to 19 years age range has the highest percentage of unemployed individuals, with 25.0% or 3 of them being unemployed.
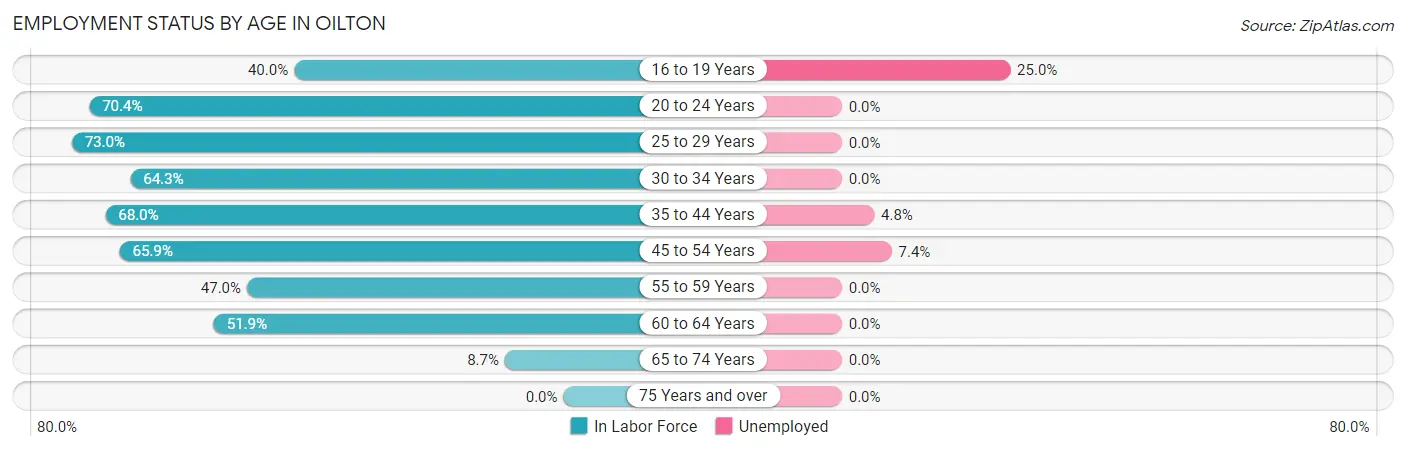
| Age Bracket | In Labor Force | Unemployed |
| 16 to 19 Years | 12 (40.0%) | 3 (25.0%) |
| 20 to 24 Years | 38 (70.4%) | 0 (0.0%) |
| 25 to 29 Years | 27 (73.0%) | 0 (0.0%) |
| 30 to 34 Years | 45 (64.3%) | 0 (0.0%) |
| 35 to 44 Years | 83 (68.0%) | 4 (4.8%) |
| 45 to 54 Years | 54 (65.9%) | 4 (7.4%) |
| 55 to 59 Years | 31 (47.0%) | 0 (0.0%) |
| 60 to 64 Years | 27 (51.9%) | 0 (0.0%) |
| 65 to 74 Years | 4 (8.7%) | 0 (0.0%) |
| 75 Years and over | 0 (0.0%) | 0 (0.0%) |
| Total | 321 (53.4%) | 11 (3.4%) |
Employment Status by Educational Attainment in Oilton
According to labor force statistics for Oilton, 62.2% of individuals (267) out of the total population between 25 and 64 years of age (429) are in the labor force, with 3.0% or 8 of them being unemployed. The group with the highest labor force participation rate are those with the educational attainment of bachelor's degree or higher, with 89.5% or 34 individuals in the labor force. Within the labor force, individuals with high school diploma education have the highest percentage of unemployment, with 5.7% or 8 of them being unemployed.
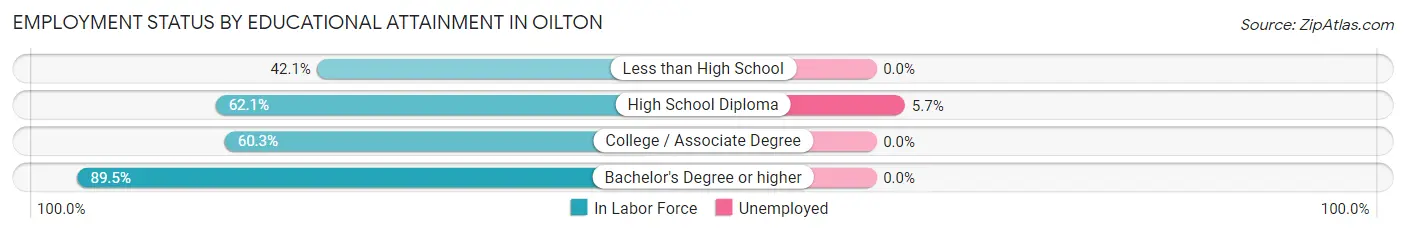
| Educational Attainment | In Labor Force | Unemployed |
| Less than High School | 16 (42.1%) | 0 (0.0%) |
| High School Diploma | 141 (62.1%) | 13 (5.7%) |
| College / Associate Degree | 76 (60.3%) | 0 (0.0%) |
| Bachelor's Degree or higher | 34 (89.5%) | 0 (0.0%) |
| Total | 267 (62.2%) | 13 (3.0%) |
Employment Occupations by Sex in Oilton
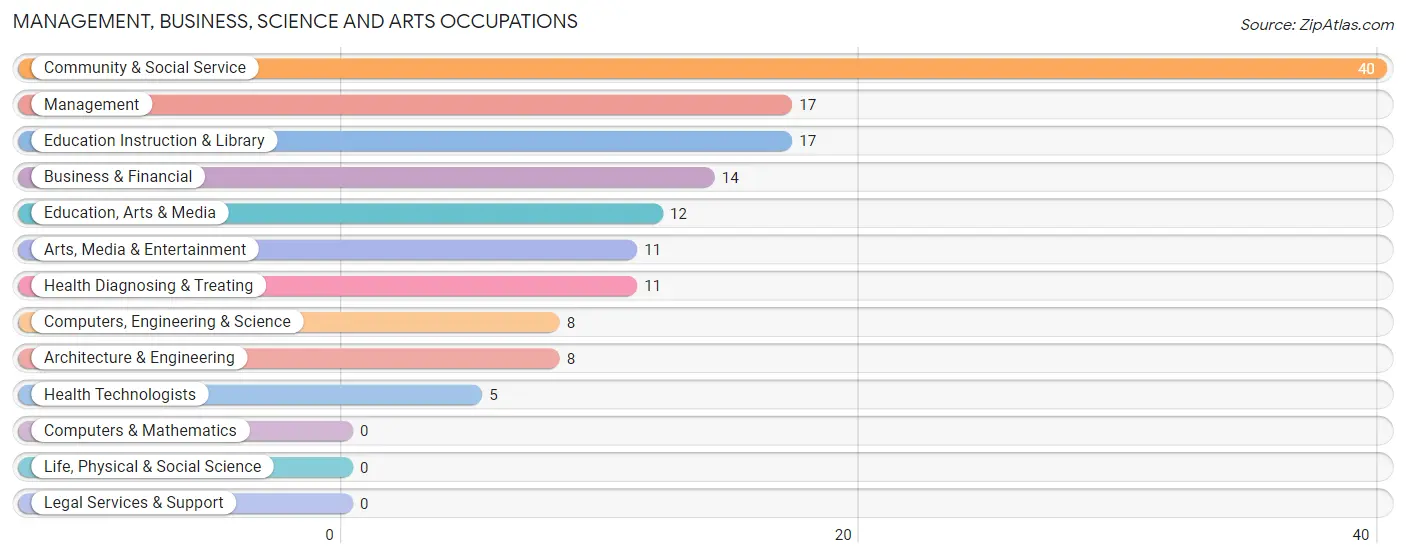
Management, Business, Science and Arts Occupations
The most common Management, Business, Science and Arts occupations in Oilton are Community & Social Service (40 | 12.9%), Management (17 | 5.5%), Education Instruction & Library (17 | 5.5%), Business & Financial (14 | 4.5%), and Education, Arts & Media (12 | 3.9%).
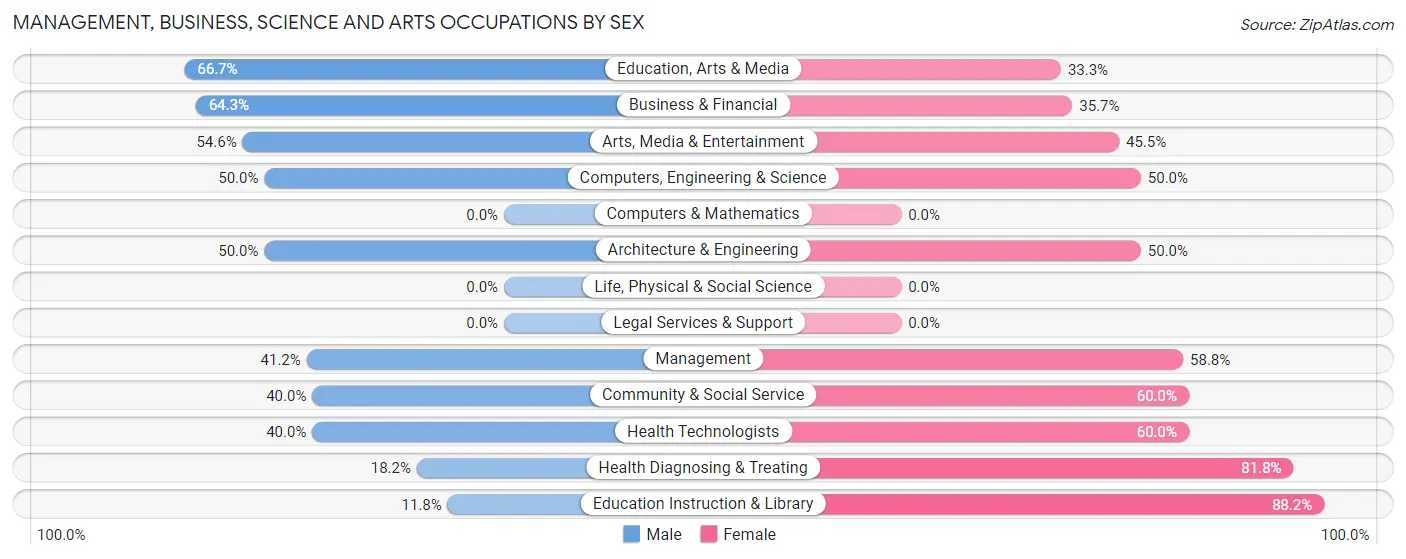
Management, Business, Science and Arts Occupations by Sex
Within the Management, Business, Science and Arts occupations in Oilton, the most male-oriented occupations are Education, Arts & Media (66.7%), Business & Financial (64.3%), and Arts, Media & Entertainment (54.5%), while the most female-oriented occupations are Education Instruction & Library (88.2%), Health Diagnosing & Treating (81.8%), and Community & Social Service (60.0%).
| Occupation | Male | Female |
| Management | 7 (41.2%) | 10 (58.8%) |
| Business & Financial | 9 (64.3%) | 5 (35.7%) |
| Computers, Engineering & Science | 4 (50.0%) | 4 (50.0%) |
| Computers & Mathematics | 0 (0.0%) | 0 (0.0%) |
| Architecture & Engineering | 4 (50.0%) | 4 (50.0%) |
| Life, Physical & Social Science | 0 (0.0%) | 0 (0.0%) |
| Community & Social Service | 16 (40.0%) | 24 (60.0%) |
| Education, Arts & Media | 8 (66.7%) | 4 (33.3%) |
| Legal Services & Support | 0 (0.0%) | 0 (0.0%) |
| Education Instruction & Library | 2 (11.8%) | 15 (88.2%) |
| Arts, Media & Entertainment | 6 (54.5%) | 5 (45.5%) |
| Health Diagnosing & Treating | 2 (18.2%) | 9 (81.8%) |
| Health Technologists | 2 (40.0%) | 3 (60.0%) |
| Total (Category) | 38 (42.2%) | 52 (57.8%) |
| Total (Overall) | 155 (50.0%) | 155 (50.0%) |
Services Occupations
The most common Services occupations in Oilton are Healthcare Support (18 | 5.8%), Cleaning & Maintenance (17 | 5.5%), Security & Protection (5 | 1.6%), Law Enforcement (5 | 1.6%), and Personal Care & Service (3 | 1.0%).
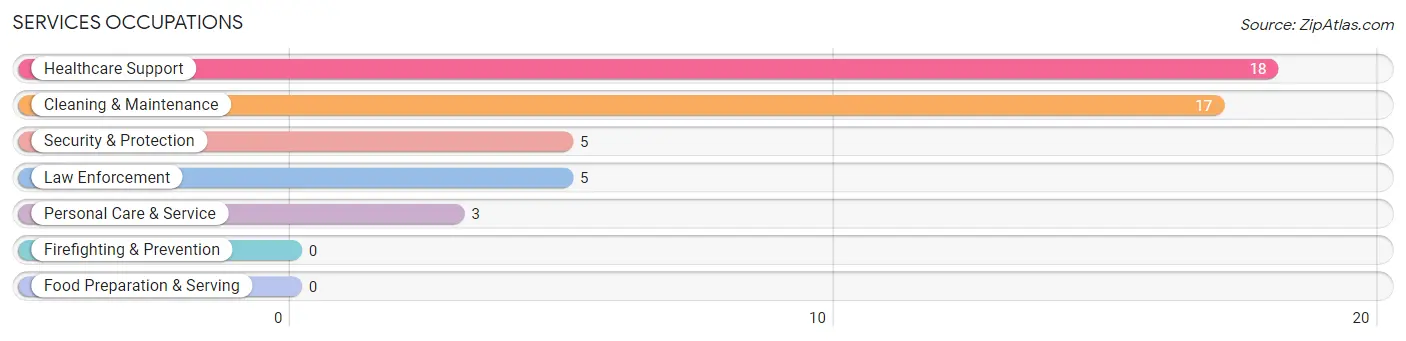
Services Occupations by Sex
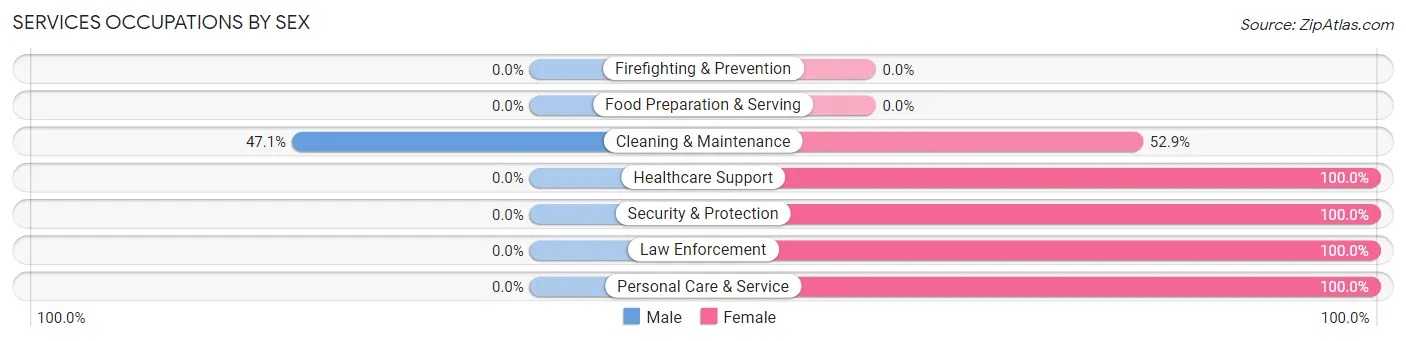
| Occupation | Male | Female |
| Healthcare Support | 0 (0.0%) | 18 (100.0%) |
| Security & Protection | 0 (0.0%) | 5 (100.0%) |
| Firefighting & Prevention | 0 (0.0%) | 0 (0.0%) |
| Law Enforcement | 0 (0.0%) | 5 (100.0%) |
| Food Preparation & Serving | 0 (0.0%) | 0 (0.0%) |
| Cleaning & Maintenance | 8 (47.1%) | 9 (52.9%) |
| Personal Care & Service | 0 (0.0%) | 3 (100.0%) |
| Total (Category) | 8 (18.6%) | 35 (81.4%) |
| Total (Overall) | 155 (50.0%) | 155 (50.0%) |
Sales and Office Occupations
The most common Sales and Office occupations in Oilton are Sales & Related (34 | 11.0%), and Office & Administration (29 | 9.3%).
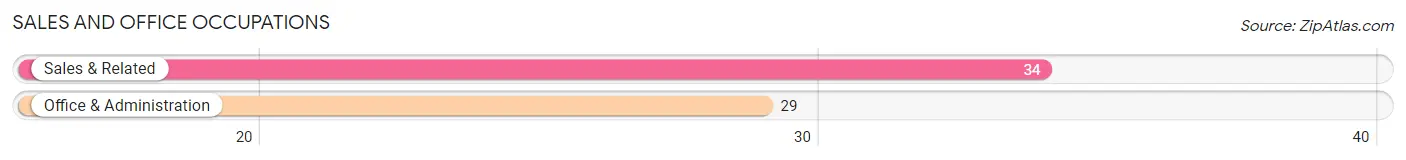
Sales and Office Occupations by Sex
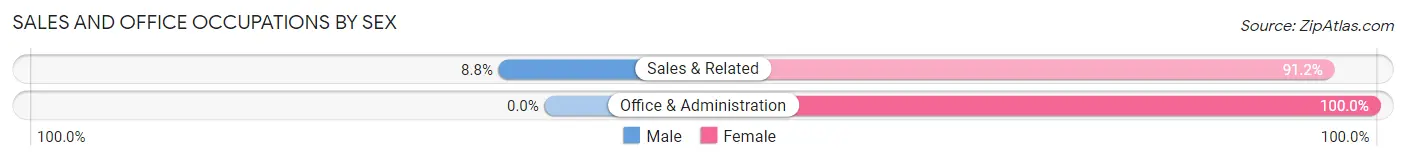
| Occupation | Male | Female |
| Sales & Related | 3 (8.8%) | 31 (91.2%) |
| Office & Administration | 0 (0.0%) | 29 (100.0%) |
| Total (Category) | 3 (4.8%) | 60 (95.2%) |
| Total (Overall) | 155 (50.0%) | 155 (50.0%) |
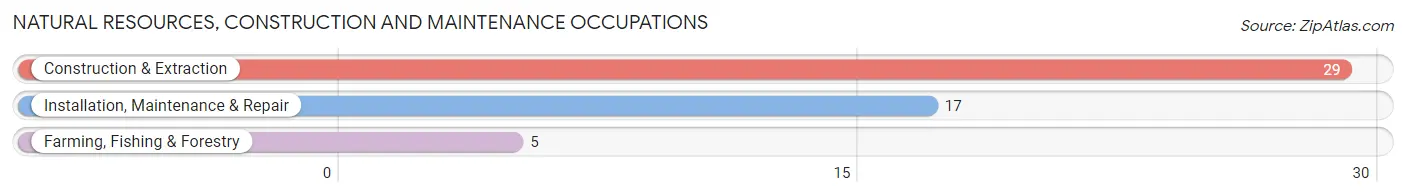
Natural Resources, Construction and Maintenance Occupations
The most common Natural Resources, Construction and Maintenance occupations in Oilton are Construction & Extraction (29 | 9.3%), Installation, Maintenance & Repair (17 | 5.5%), and Farming, Fishing & Forestry (5 | 1.6%).
Natural Resources, Construction and Maintenance Occupations by Sex
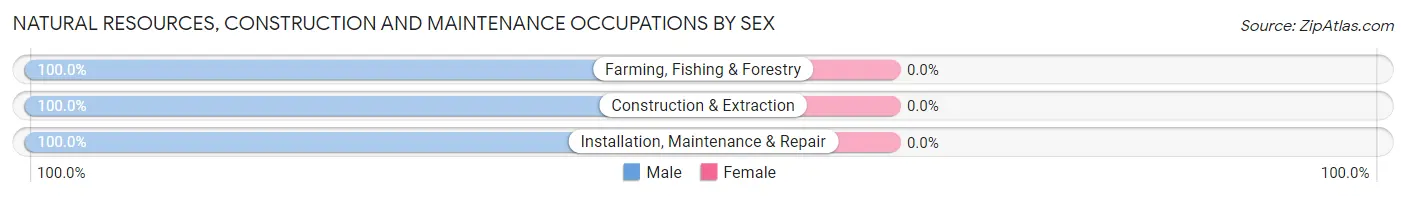
| Occupation | Male | Female |
| Farming, Fishing & Forestry | 5 (100.0%) | 0 (0.0%) |
| Construction & Extraction | 29 (100.0%) | 0 (0.0%) |
| Installation, Maintenance & Repair | 17 (100.0%) | 0 (0.0%) |
| Total (Category) | 51 (100.0%) | 0 (0.0%) |
| Total (Overall) | 155 (50.0%) | 155 (50.0%) |
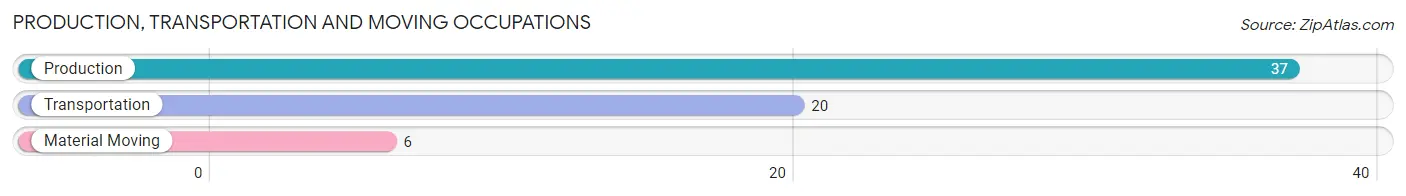
Production, Transportation and Moving Occupations
The most common Production, Transportation and Moving occupations in Oilton are Production (37 | 11.9%), Transportation (20 | 6.5%), and Material Moving (6 | 1.9%).
Production, Transportation and Moving Occupations by Sex
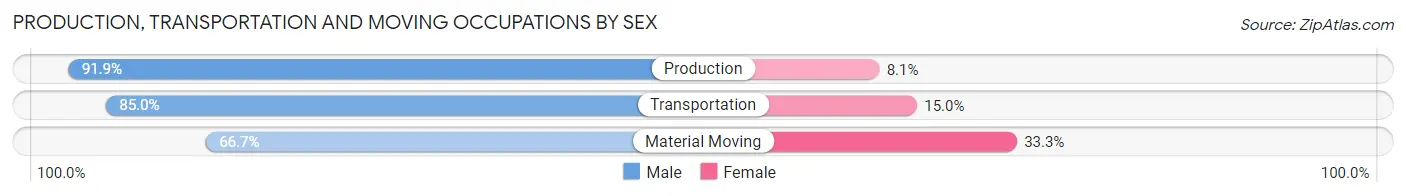
| Occupation | Male | Female |
| Production | 34 (91.9%) | 3 (8.1%) |
| Transportation | 17 (85.0%) | 3 (15.0%) |
| Material Moving | 4 (66.7%) | 2 (33.3%) |
| Total (Category) | 55 (87.3%) | 8 (12.7%) |
| Total (Overall) | 155 (50.0%) | 155 (50.0%) |
Employment Industries by Sex in Oilton
Employment Industries in Oilton
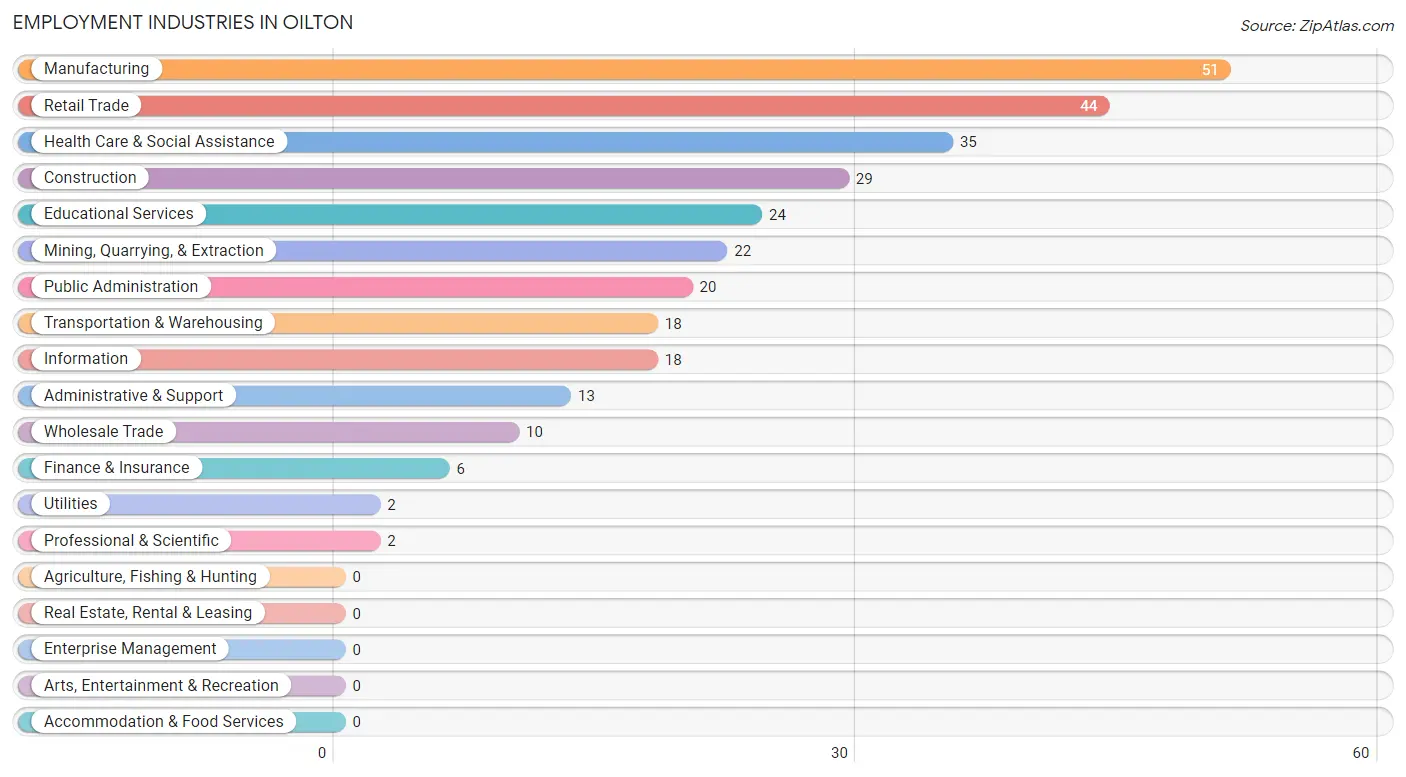
The major employment industries in Oilton include Manufacturing (51 | 16.5%), Retail Trade (44 | 14.2%), Health Care & Social Assistance (35 | 11.3%), Construction (29 | 9.3%), and Educational Services (24 | 7.7%).
Employment Industries by Sex in Oilton
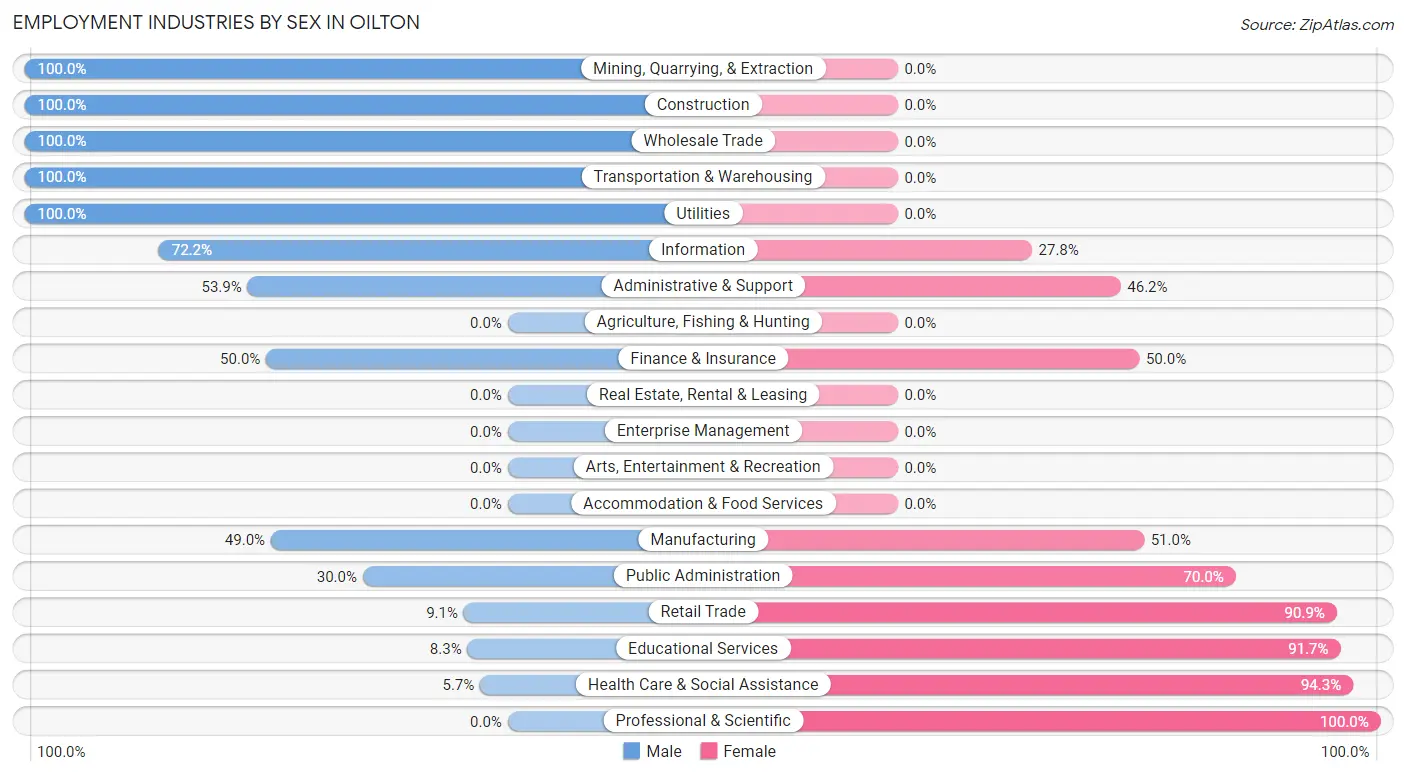
The Oilton industries that see more men than women are Mining, Quarrying, & Extraction (100.0%), Construction (100.0%), and Wholesale Trade (100.0%), whereas the industries that tend to have a higher number of women are Professional & Scientific (100.0%), Health Care & Social Assistance (94.3%), and Educational Services (91.7%).
| Industry | Male | Female |
| Agriculture, Fishing & Hunting | 0 (0.0%) | 0 (0.0%) |
| Mining, Quarrying, & Extraction | 22 (100.0%) | 0 (0.0%) |
| Construction | 29 (100.0%) | 0 (0.0%) |
| Manufacturing | 25 (49.0%) | 26 (51.0%) |
| Wholesale Trade | 10 (100.0%) | 0 (0.0%) |
| Retail Trade | 4 (9.1%) | 40 (90.9%) |
| Transportation & Warehousing | 18 (100.0%) | 0 (0.0%) |
| Utilities | 2 (100.0%) | 0 (0.0%) |
| Information | 13 (72.2%) | 5 (27.8%) |
| Finance & Insurance | 3 (50.0%) | 3 (50.0%) |
| Real Estate, Rental & Leasing | 0 (0.0%) | 0 (0.0%) |
| Professional & Scientific | 0 (0.0%) | 2 (100.0%) |
| Enterprise Management | 0 (0.0%) | 0 (0.0%) |
| Administrative & Support | 7 (53.8%) | 6 (46.2%) |
| Educational Services | 2 (8.3%) | 22 (91.7%) |
| Health Care & Social Assistance | 2 (5.7%) | 33 (94.3%) |
| Arts, Entertainment & Recreation | 0 (0.0%) | 0 (0.0%) |
| Accommodation & Food Services | 0 (0.0%) | 0 (0.0%) |
| Public Administration | 6 (30.0%) | 14 (70.0%) |
| Total | 155 (50.0%) | 155 (50.0%) |
Education in Oilton
School Enrollment in Oilton
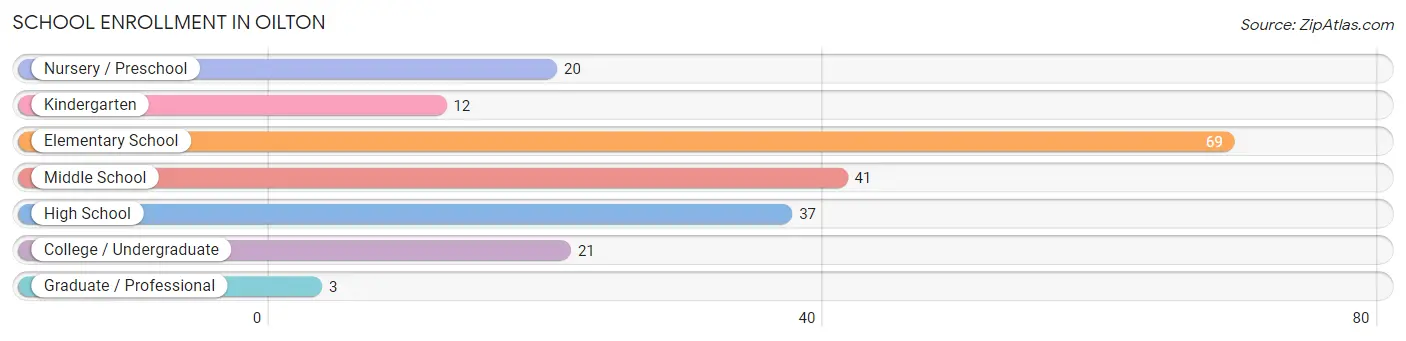
The most common levels of schooling among the 203 students in Oilton are elementary school (69 | 34.0%), middle school (41 | 20.2%), and high school (37 | 18.2%).
| School Level | # Students | % Students |
| Nursery / Preschool | 20 | 9.9% |
| Kindergarten | 12 | 5.9% |
| Elementary School | 69 | 34.0% |
| Middle School | 41 | 20.2% |
| High School | 37 | 18.2% |
| College / Undergraduate | 21 | 10.3% |
| Graduate / Professional | 3 | 1.5% |
| Total | 203 | 100.0% |
School Enrollment by Age by Funding Source in Oilton
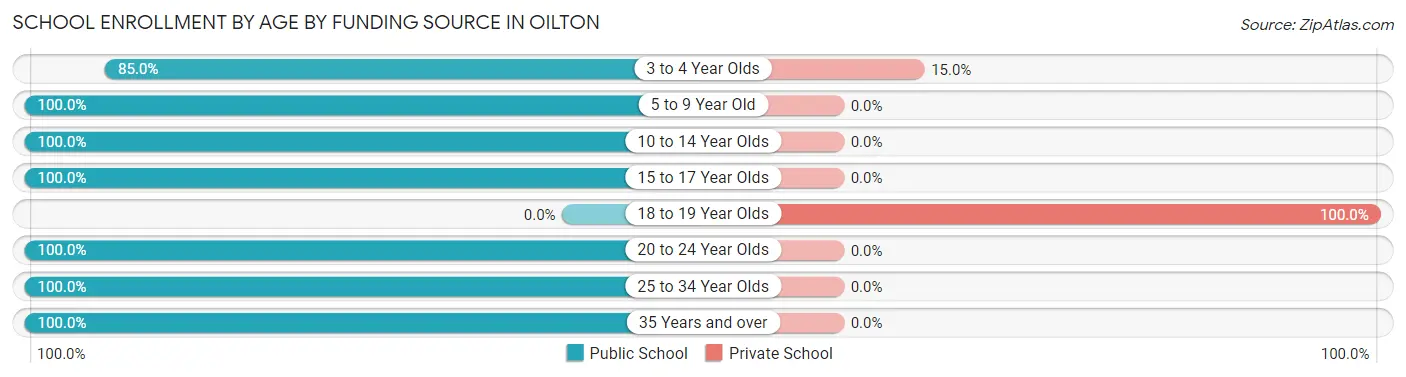
Out of a total of 203 students who are enrolled in schools in Oilton, 8 (3.9%) attend a private institution, while the remaining 195 (96.1%) are enrolled in public schools. The age group of 18 to 19 year olds has the highest likelihood of being enrolled in private schools, with 5 (100.0% in the age bracket) enrolled. Conversely, the age group of 5 to 9 year old has the lowest likelihood of being enrolled in a private school, with 78 (100.0% in the age bracket) attending a public institution.
| Age Bracket | Public School | Private School |
| 3 to 4 Year Olds | 17 (85.0%) | 3 (15.0%) |
| 5 to 9 Year Old | 78 (100.0%) | 0 (0.0%) |
| 10 to 14 Year Olds | 49 (100.0%) | 0 (0.0%) |
| 15 to 17 Year Olds | 26 (100.0%) | 0 (0.0%) |
| 18 to 19 Year Olds | 0 (0.0%) | 5 (100.0%) |
| 20 to 24 Year Olds | 21 (100.0%) | 0 (0.0%) |
| 25 to 34 Year Olds | 1 (100.0%) | 0 (0.0%) |
| 35 Years and over | 3 (100.0%) | 0 (0.0%) |
| Total | 195 (96.1%) | 8 (3.9%) |
Educational Attainment by Field of Study in Oilton
Business (12 | 21.8%), engineering (8 | 14.5%), arts & humanities (8 | 14.5%), education (7 | 12.7%), and psychology (6 | 10.9%) are the most common fields of study among 55 individuals in Oilton who have obtained a bachelor's degree or higher.
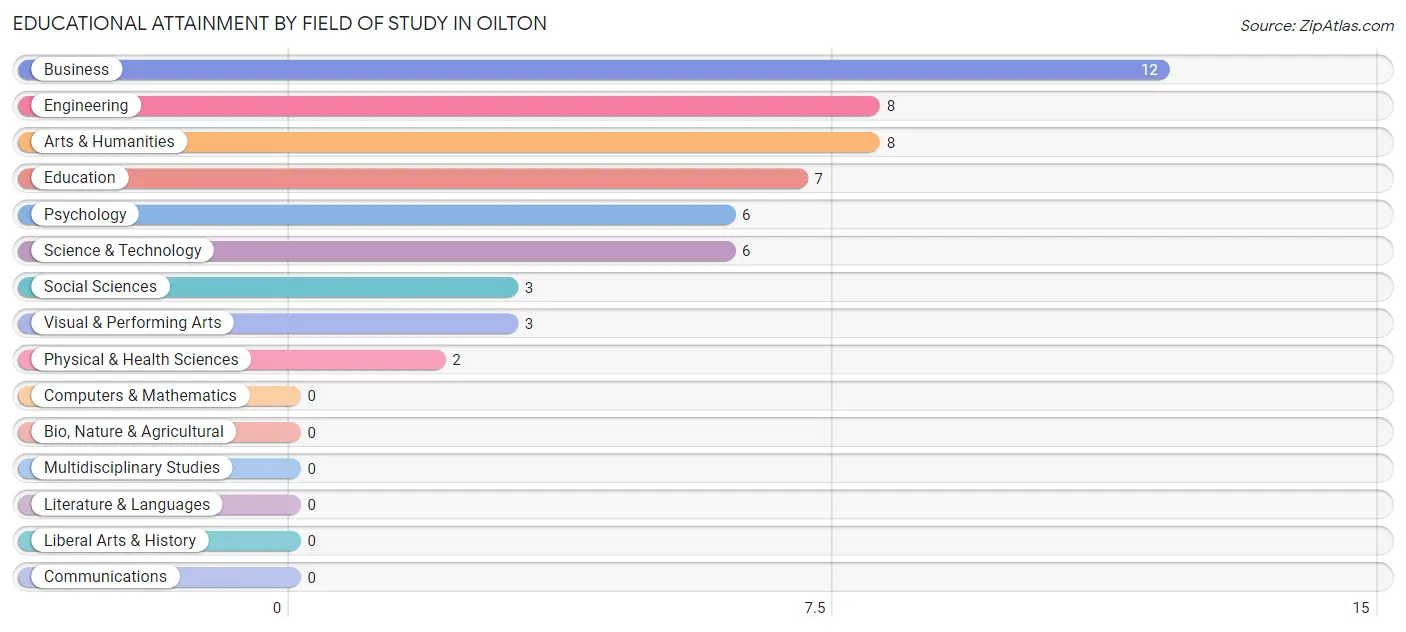
| Field of Study | # Graduates | % Graduates |
| Computers & Mathematics | 0 | 0.0% |
| Bio, Nature & Agricultural | 0 | 0.0% |
| Physical & Health Sciences | 2 | 3.6% |
| Psychology | 6 | 10.9% |
| Social Sciences | 3 | 5.4% |
| Engineering | 8 | 14.5% |
| Multidisciplinary Studies | 0 | 0.0% |
| Science & Technology | 6 | 10.9% |
| Business | 12 | 21.8% |
| Education | 7 | 12.7% |
| Literature & Languages | 0 | 0.0% |
| Liberal Arts & History | 0 | 0.0% |
| Visual & Performing Arts | 3 | 5.4% |
| Communications | 0 | 0.0% |
| Arts & Humanities | 8 | 14.5% |
| Total | 55 | 100.0% |
Transportation & Commute in Oilton
Vehicle Availability by Sex in Oilton
The most prevalent vehicle ownership categories in Oilton are males with 2 vehicles (80, accounting for 51.6%) and females with 2 vehicles (67, making up 51.6%).
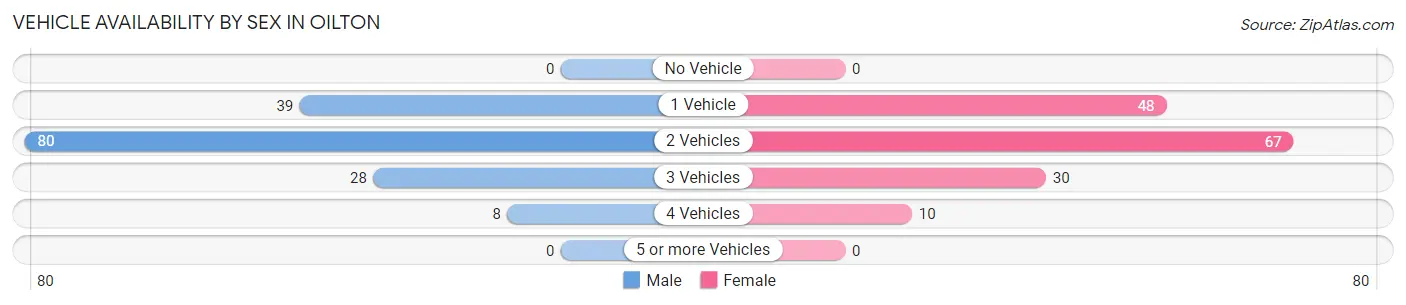
| Vehicles Available | Male | Female |
| No Vehicle | 0 (0.0%) | 0 (0.0%) |
| 1 Vehicle | 39 (25.2%) | 48 (31.0%) |
| 2 Vehicles | 80 (51.6%) | 67 (43.2%) |
| 3 Vehicles | 28 (18.1%) | 30 (19.4%) |
| 4 Vehicles | 8 (5.2%) | 10 (6.5%) |
| 5 or more Vehicles | 0 (0.0%) | 0 (0.0%) |
| Total | 155 (100.0%) | 155 (100.0%) |
Commute Time in Oilton
The most frequently occuring commute durations in Oilton are 5 to 9 minutes (51 commuters, 17.7%), 20 to 24 minutes (43 commuters, 14.9%), and 15 to 19 minutes (41 commuters, 14.2%).
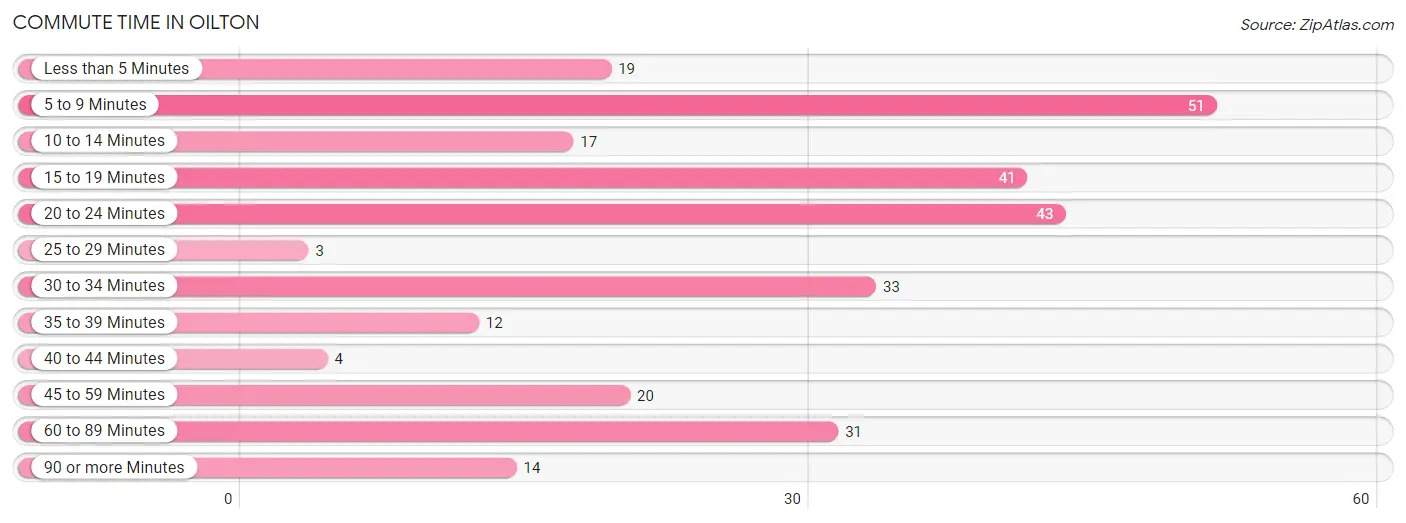
| Commute Time | # Commuters | % Commuters |
| Less than 5 Minutes | 19 | 6.6% |
| 5 to 9 Minutes | 51 | 17.7% |
| 10 to 14 Minutes | 17 | 5.9% |
| 15 to 19 Minutes | 41 | 14.2% |
| 20 to 24 Minutes | 43 | 14.9% |
| 25 to 29 Minutes | 3 | 1.0% |
| 30 to 34 Minutes | 33 | 11.5% |
| 35 to 39 Minutes | 12 | 4.2% |
| 40 to 44 Minutes | 4 | 1.4% |
| 45 to 59 Minutes | 20 | 6.9% |
| 60 to 89 Minutes | 31 | 10.8% |
| 90 or more Minutes | 14 | 4.9% |
Commute Time by Sex in Oilton
The most common commute times in Oilton are 15 to 19 minutes (30 commuters, 20.5%) for males and 5 to 9 minutes (35 commuters, 24.6%) for females.
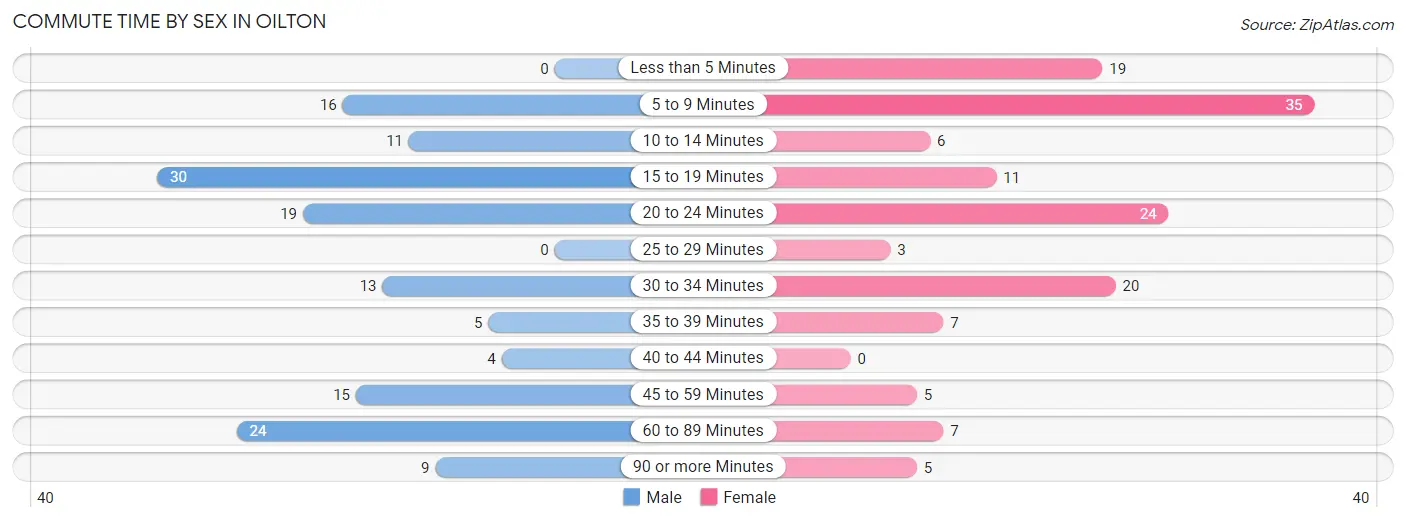
| Commute Time | Male | Female |
| Less than 5 Minutes | 0 (0.0%) | 19 (13.4%) |
| 5 to 9 Minutes | 16 (11.0%) | 35 (24.6%) |
| 10 to 14 Minutes | 11 (7.5%) | 6 (4.2%) |
| 15 to 19 Minutes | 30 (20.5%) | 11 (7.7%) |
| 20 to 24 Minutes | 19 (13.0%) | 24 (16.9%) |
| 25 to 29 Minutes | 0 (0.0%) | 3 (2.1%) |
| 30 to 34 Minutes | 13 (8.9%) | 20 (14.1%) |
| 35 to 39 Minutes | 5 (3.4%) | 7 (4.9%) |
| 40 to 44 Minutes | 4 (2.7%) | 0 (0.0%) |
| 45 to 59 Minutes | 15 (10.3%) | 5 (3.5%) |
| 60 to 89 Minutes | 24 (16.4%) | 7 (4.9%) |
| 90 or more Minutes | 9 (6.2%) | 5 (3.5%) |
Time of Departure to Work by Sex in Oilton
The most frequent times of departure to work in Oilton are 12:00 AM to 4:59 AM (29, 19.9%) for males and 5:00 AM to 5:29 AM (23, 16.2%) for females.
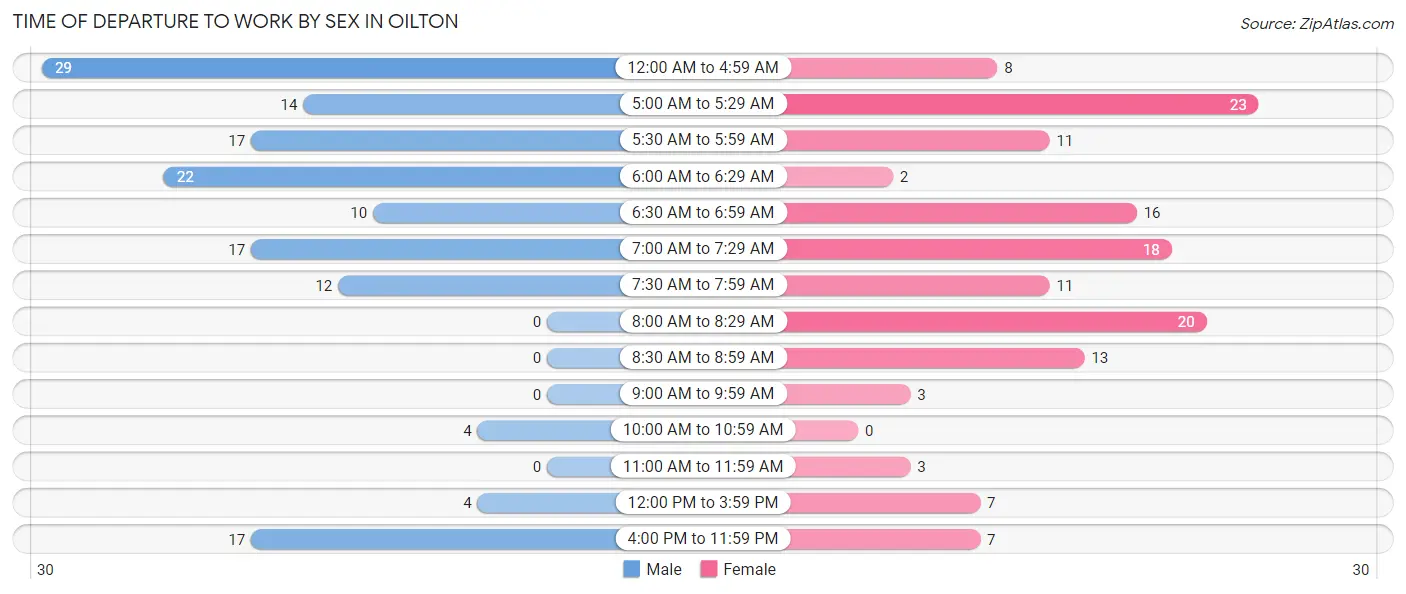
| Time of Departure | Male | Female |
| 12:00 AM to 4:59 AM | 29 (19.9%) | 8 (5.6%) |
| 5:00 AM to 5:29 AM | 14 (9.6%) | 23 (16.2%) |
| 5:30 AM to 5:59 AM | 17 (11.6%) | 11 (7.7%) |
| 6:00 AM to 6:29 AM | 22 (15.1%) | 2 (1.4%) |
| 6:30 AM to 6:59 AM | 10 (6.9%) | 16 (11.3%) |
| 7:00 AM to 7:29 AM | 17 (11.6%) | 18 (12.7%) |
| 7:30 AM to 7:59 AM | 12 (8.2%) | 11 (7.7%) |
| 8:00 AM to 8:29 AM | 0 (0.0%) | 20 (14.1%) |
| 8:30 AM to 8:59 AM | 0 (0.0%) | 13 (9.1%) |
| 9:00 AM to 9:59 AM | 0 (0.0%) | 3 (2.1%) |
| 10:00 AM to 10:59 AM | 4 (2.7%) | 0 (0.0%) |
| 11:00 AM to 11:59 AM | 0 (0.0%) | 3 (2.1%) |
| 12:00 PM to 3:59 PM | 4 (2.7%) | 7 (4.9%) |
| 4:00 PM to 11:59 PM | 17 (11.6%) | 7 (4.9%) |
| Total | 146 (100.0%) | 142 (100.0%) |
Housing Occupancy in Oilton
Occupancy by Ownership in Oilton
Of the total 349 dwellings in Oilton, owner-occupied units account for 214 (61.3%), while renter-occupied units make up 135 (38.7%).
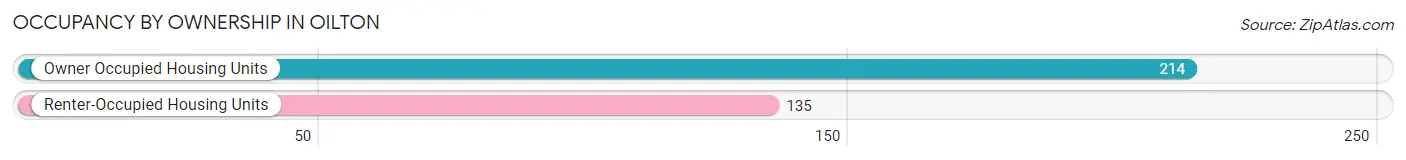
| Occupancy | # Housing Units | % Housing Units |
| Owner Occupied Housing Units | 214 | 61.3% |
| Renter-Occupied Housing Units | 135 | 38.7% |
| Total Occupied Housing Units | 349 | 100.0% |
Occupancy by Household Size in Oilton
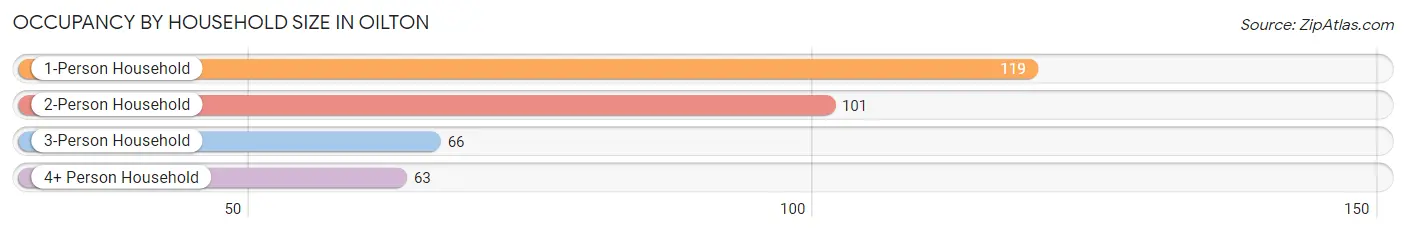
| Household Size | # Housing Units | % Housing Units |
| 1-Person Household | 119 | 34.1% |
| 2-Person Household | 101 | 28.9% |
| 3-Person Household | 66 | 18.9% |
| 4+ Person Household | 63 | 18.0% |
| Total Housing Units | 349 | 100.0% |
Occupancy by Ownership by Household Size in Oilton
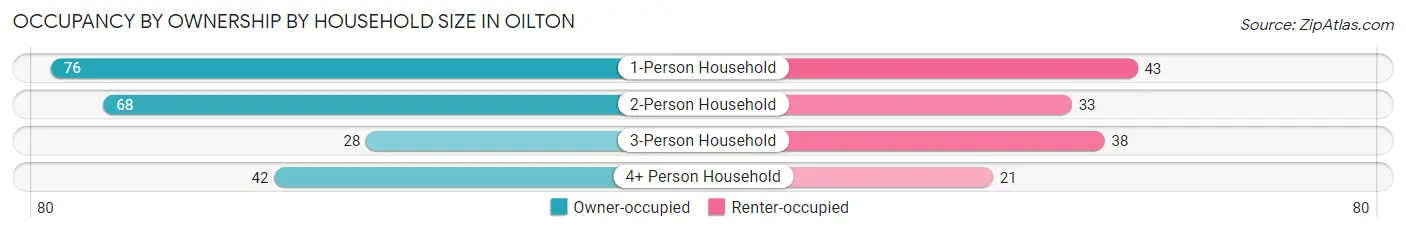
| Household Size | Owner-occupied | Renter-occupied |
| 1-Person Household | 76 (63.9%) | 43 (36.1%) |
| 2-Person Household | 68 (67.3%) | 33 (32.7%) |
| 3-Person Household | 28 (42.4%) | 38 (57.6%) |
| 4+ Person Household | 42 (66.7%) | 21 (33.3%) |
| Total Housing Units | 214 (61.3%) | 135 (38.7%) |
Occupancy by Educational Attainment in Oilton
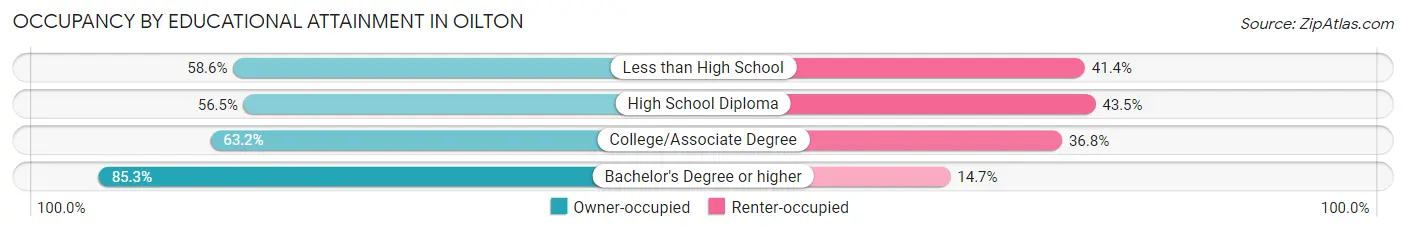
| Household Size | Owner-occupied | Renter-occupied |
| Less than High School | 17 (58.6%) | 12 (41.4%) |
| High School Diploma | 108 (56.5%) | 83 (43.5%) |
| College/Associate Degree | 60 (63.2%) | 35 (36.8%) |
| Bachelor's Degree or higher | 29 (85.3%) | 5 (14.7%) |
Occupancy by Age of Householder in Oilton
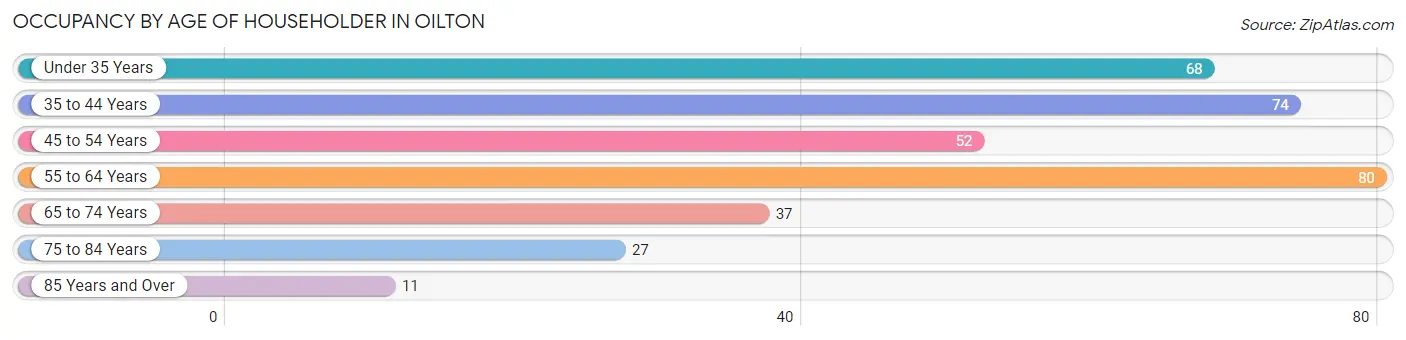
| Age Bracket | # Households | % Households |
| Under 35 Years | 68 | 19.5% |
| 35 to 44 Years | 74 | 21.2% |
| 45 to 54 Years | 52 | 14.9% |
| 55 to 64 Years | 80 | 22.9% |
| 65 to 74 Years | 37 | 10.6% |
| 75 to 84 Years | 27 | 7.7% |
| 85 Years and Over | 11 | 3.2% |
| Total | 349 | 100.0% |
Housing Finances in Oilton
Median Income by Occupancy in Oilton
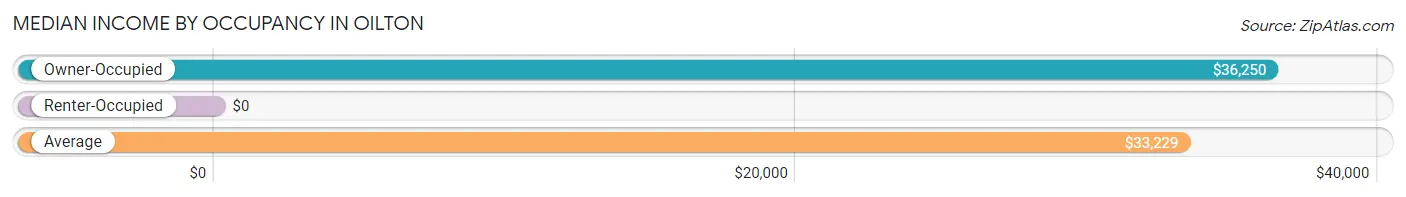
| Occupancy Type | # Households | Median Income |
| Owner-Occupied | 214 (61.3%) | $36,250 |
| Renter-Occupied | 135 (38.7%) | $0 |
| Average | 349 (100.0%) | $33,229 |
Occupancy by Householder Income Bracket in Oilton
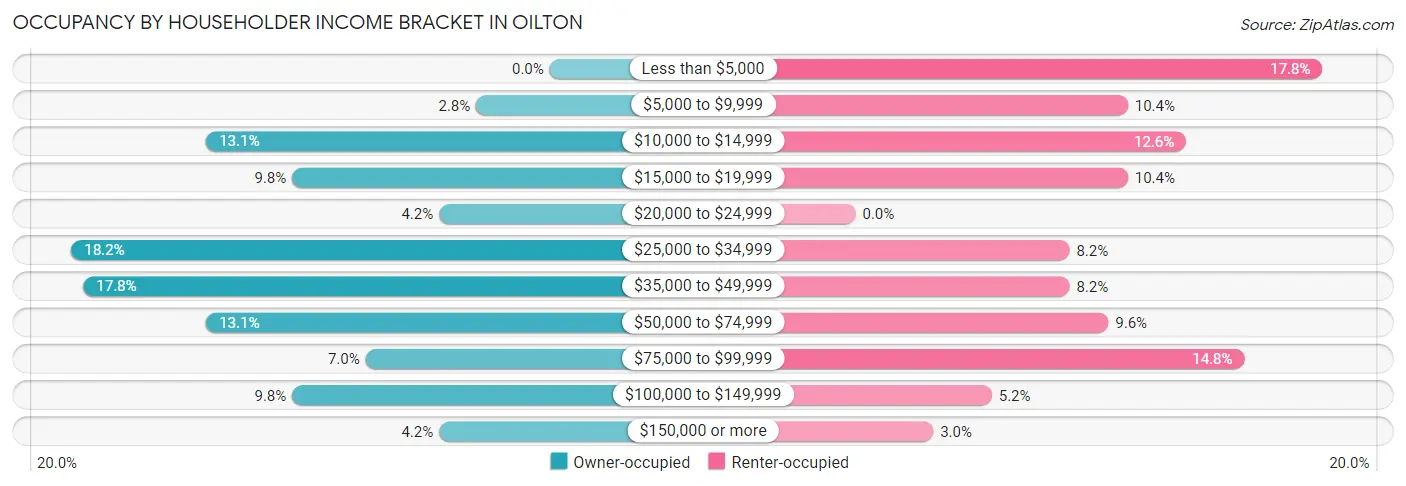
| Income Bracket | Owner-occupied | Renter-occupied |
| Less than $5,000 | 0 (0.0%) | 24 (17.8%) |
| $5,000 to $9,999 | 6 (2.8%) | 14 (10.4%) |
| $10,000 to $14,999 | 28 (13.1%) | 17 (12.6%) |
| $15,000 to $19,999 | 21 (9.8%) | 14 (10.4%) |
| $20,000 to $24,999 | 9 (4.2%) | 0 (0.0%) |
| $25,000 to $34,999 | 39 (18.2%) | 11 (8.2%) |
| $35,000 to $49,999 | 38 (17.8%) | 11 (8.2%) |
| $50,000 to $74,999 | 28 (13.1%) | 13 (9.6%) |
| $75,000 to $99,999 | 15 (7.0%) | 20 (14.8%) |
| $100,000 to $149,999 | 21 (9.8%) | 7 (5.2%) |
| $150,000 or more | 9 (4.2%) | 4 (3.0%) |
| Total | 214 (100.0%) | 135 (100.0%) |
Monthly Housing Cost Tiers in Oilton
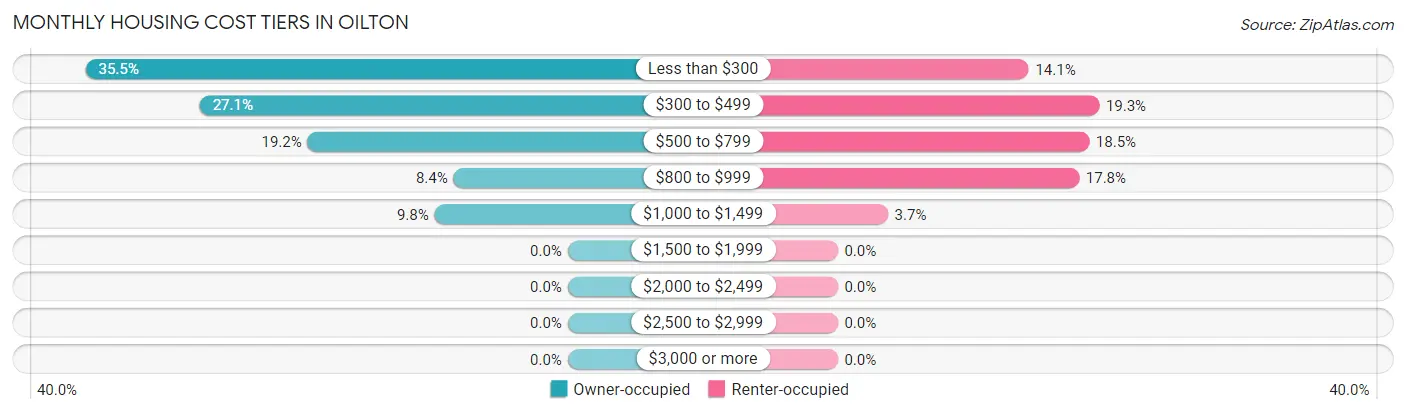
| Monthly Cost | Owner-occupied | Renter-occupied |
| Less than $300 | 76 (35.5%) | 19 (14.1%) |
| $300 to $499 | 58 (27.1%) | 26 (19.3%) |
| $500 to $799 | 41 (19.2%) | 25 (18.5%) |
| $800 to $999 | 18 (8.4%) | 24 (17.8%) |
| $1,000 to $1,499 | 21 (9.8%) | 5 (3.7%) |
| $1,500 to $1,999 | 0 (0.0%) | 0 (0.0%) |
| $2,000 to $2,499 | 0 (0.0%) | 0 (0.0%) |
| $2,500 to $2,999 | 0 (0.0%) | 0 (0.0%) |
| $3,000 or more | 0 (0.0%) | 0 (0.0%) |
| Total | 214 (100.0%) | 135 (100.0%) |
Physical Housing Characteristics in Oilton
Housing Structures in Oilton
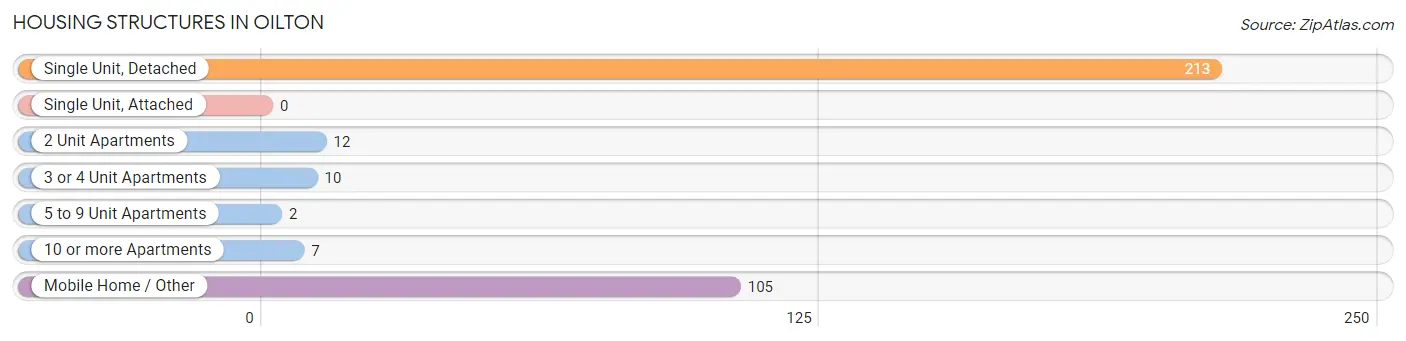
| Structure Type | # Housing Units | % Housing Units |
| Single Unit, Detached | 213 | 61.0% |
| Single Unit, Attached | 0 | 0.0% |
| 2 Unit Apartments | 12 | 3.4% |
| 3 or 4 Unit Apartments | 10 | 2.9% |
| 5 to 9 Unit Apartments | 2 | 0.6% |
| 10 or more Apartments | 7 | 2.0% |
| Mobile Home / Other | 105 | 30.1% |
| Total | 349 | 100.0% |
Housing Structures by Occupancy in Oilton
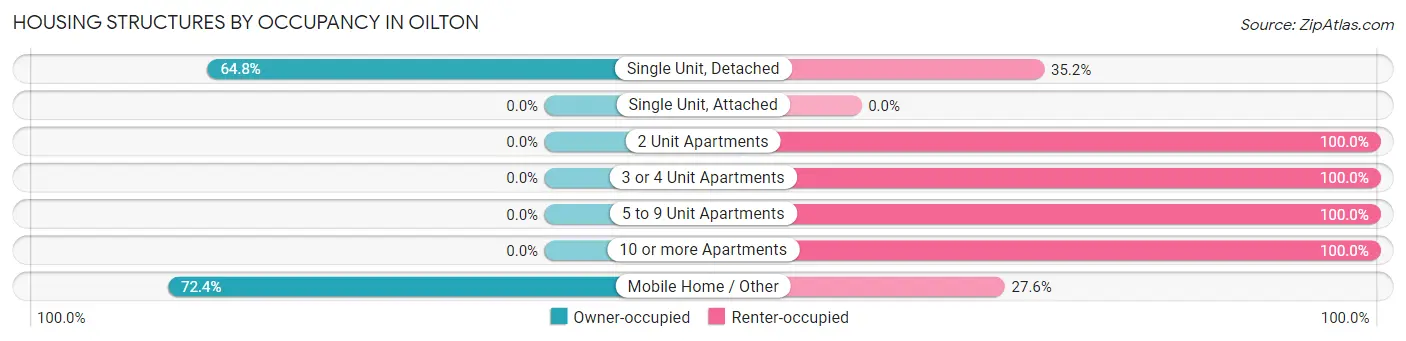
| Structure Type | Owner-occupied | Renter-occupied |
| Single Unit, Detached | 138 (64.8%) | 75 (35.2%) |
| Single Unit, Attached | 0 (0.0%) | 0 (0.0%) |
| 2 Unit Apartments | 0 (0.0%) | 12 (100.0%) |
| 3 or 4 Unit Apartments | 0 (0.0%) | 10 (100.0%) |
| 5 to 9 Unit Apartments | 0 (0.0%) | 2 (100.0%) |
| 10 or more Apartments | 0 (0.0%) | 7 (100.0%) |
| Mobile Home / Other | 76 (72.4%) | 29 (27.6%) |
| Total | 214 (61.3%) | 135 (38.7%) |
Housing Structures by Number of Rooms in Oilton
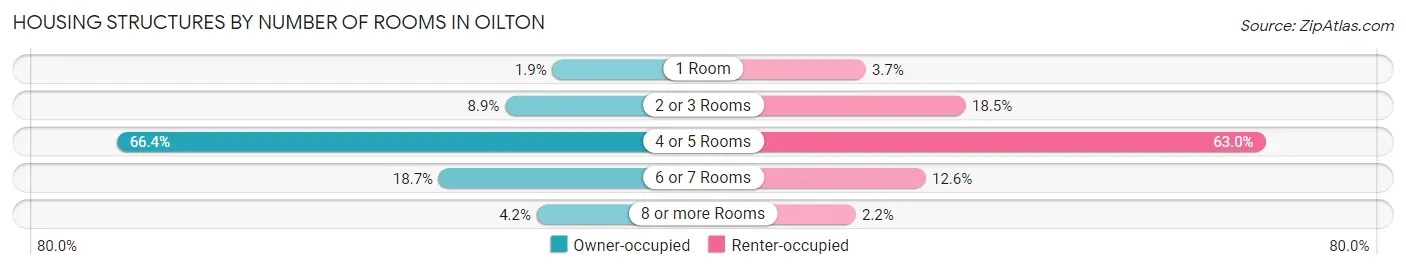
| Number of Rooms | Owner-occupied | Renter-occupied |
| 1 Room | 4 (1.9%) | 5 (3.7%) |
| 2 or 3 Rooms | 19 (8.9%) | 25 (18.5%) |
| 4 or 5 Rooms | 142 (66.4%) | 85 (63.0%) |
| 6 or 7 Rooms | 40 (18.7%) | 17 (12.6%) |
| 8 or more Rooms | 9 (4.2%) | 3 (2.2%) |
| Total | 214 (100.0%) | 135 (100.0%) |
Housing Structure by Heating Type in Oilton
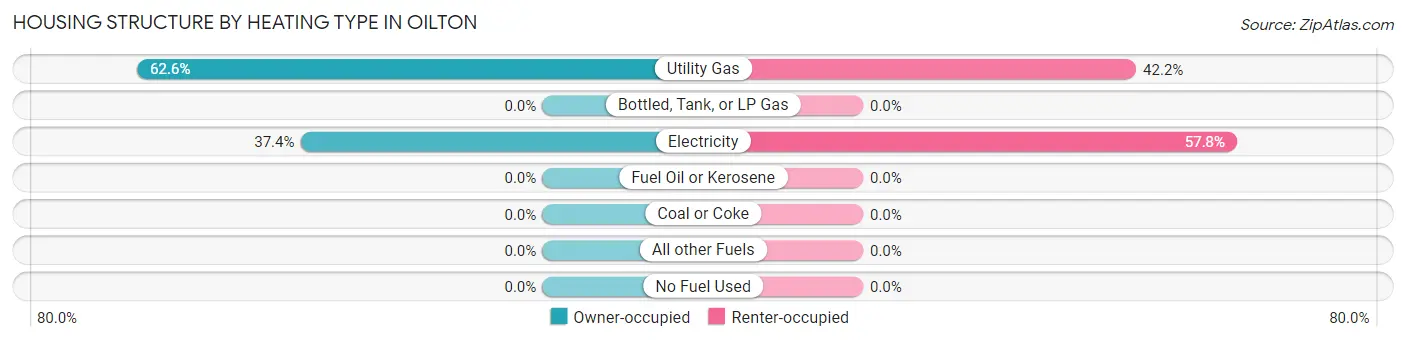
| Heating Type | Owner-occupied | Renter-occupied |
| Utility Gas | 134 (62.6%) | 57 (42.2%) |
| Bottled, Tank, or LP Gas | 0 (0.0%) | 0 (0.0%) |
| Electricity | 80 (37.4%) | 78 (57.8%) |
| Fuel Oil or Kerosene | 0 (0.0%) | 0 (0.0%) |
| Coal or Coke | 0 (0.0%) | 0 (0.0%) |
| All other Fuels | 0 (0.0%) | 0 (0.0%) |
| No Fuel Used | 0 (0.0%) | 0 (0.0%) |
| Total | 214 (100.0%) | 135 (100.0%) |
Household Vehicle Usage in Oilton
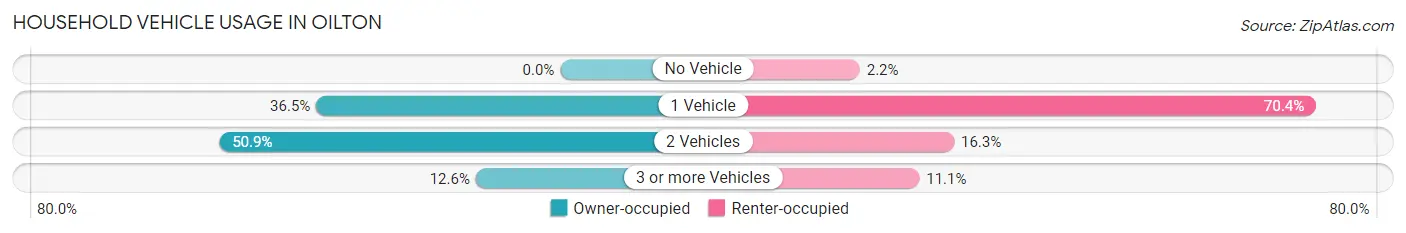
| Vehicles per Household | Owner-occupied | Renter-occupied |
| No Vehicle | 0 (0.0%) | 3 (2.2%) |
| 1 Vehicle | 78 (36.4%) | 95 (70.4%) |
| 2 Vehicles | 109 (50.9%) | 22 (16.3%) |
| 3 or more Vehicles | 27 (12.6%) | 15 (11.1%) |
| Total | 214 (100.0%) | 135 (100.0%) |
Real Estate & Mortgages in Oilton
Real Estate and Mortgage Overview in Oilton
| Characteristic | Without Mortgage | With Mortgage |
| Housing Units | 163 | 51 |
| Median Property Value | $40,600 | $118,100 |
| Median Household Income | $32,292 | $4 |
| Monthly Housing Costs | $310 | $0 |
| Real Estate Taxes | $289 | $11 |
Property Value by Mortgage Status in Oilton
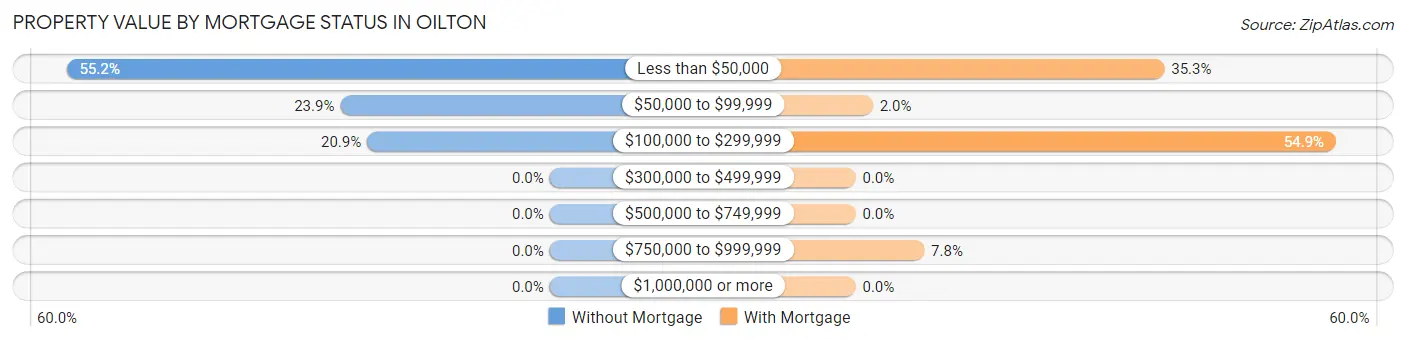
| Property Value | Without Mortgage | With Mortgage |
| Less than $50,000 | 90 (55.2%) | 18 (35.3%) |
| $50,000 to $99,999 | 39 (23.9%) | 1 (2.0%) |
| $100,000 to $299,999 | 34 (20.9%) | 28 (54.9%) |
| $300,000 to $499,999 | 0 (0.0%) | 0 (0.0%) |
| $500,000 to $749,999 | 0 (0.0%) | 0 (0.0%) |
| $750,000 to $999,999 | 0 (0.0%) | 4 (7.8%) |
| $1,000,000 or more | 0 (0.0%) | 0 (0.0%) |
| Total | 163 (100.0%) | 51 (100.0%) |
Household Income by Mortgage Status in Oilton
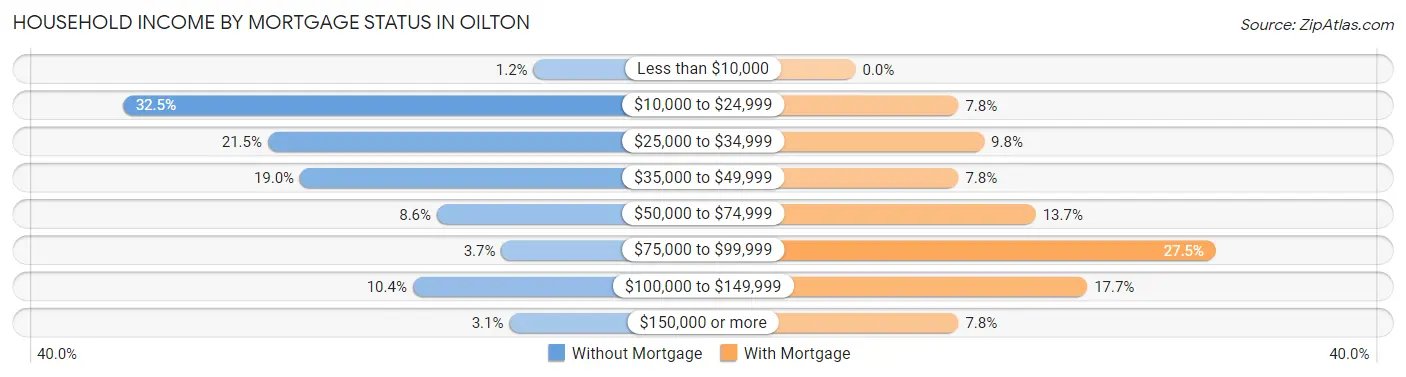
| Household Income | Without Mortgage | With Mortgage |
| Less than $10,000 | 2 (1.2%) | 0 (0.0%) |
| $10,000 to $24,999 | 53 (32.5%) | 4 (7.8%) |
| $25,000 to $34,999 | 35 (21.5%) | 5 (9.8%) |
| $35,000 to $49,999 | 31 (19.0%) | 4 (7.8%) |
| $50,000 to $74,999 | 14 (8.6%) | 7 (13.7%) |
| $75,000 to $99,999 | 6 (3.7%) | 14 (27.5%) |
| $100,000 to $149,999 | 17 (10.4%) | 9 (17.6%) |
| $150,000 or more | 5 (3.1%) | 4 (7.8%) |
| Total | 163 (100.0%) | 51 (100.0%) |
Property Value to Household Income Ratio in Oilton
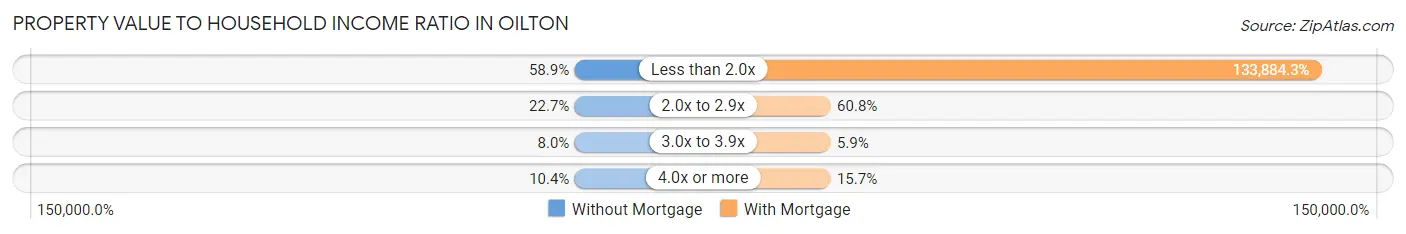
| Value-to-Income Ratio | Without Mortgage | With Mortgage |
| Less than 2.0x | 96 (58.9%) | 68,281 (133,884.3%) |
| 2.0x to 2.9x | 37 (22.7%) | 31 (60.8%) |
| 3.0x to 3.9x | 13 (8.0%) | 3 (5.9%) |
| 4.0x or more | 17 (10.4%) | 8 (15.7%) |
| Total | 163 (100.0%) | 51 (100.0%) |
Real Estate Taxes by Mortgage Status in Oilton
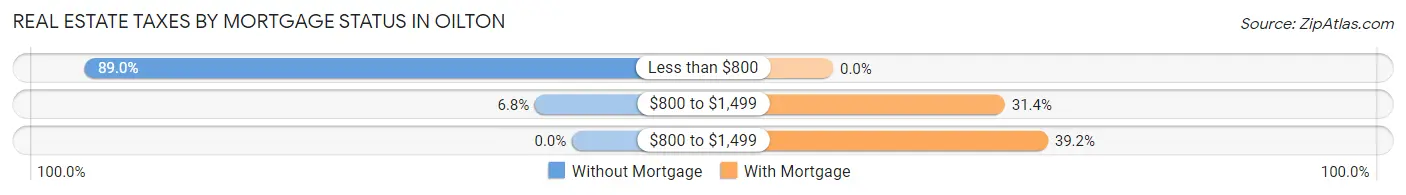
| Property Taxes | Without Mortgage | With Mortgage |
| Less than $800 | 145 (89.0%) | 0 (0.0%) |
| $800 to $1,499 | 11 (6.8%) | 16 (31.4%) |
| $800 to $1,499 | 0 (0.0%) | 20 (39.2%) |
| Total | 163 (100.0%) | 51 (100.0%) |
Health & Disability in Oilton
Health Insurance Coverage by Age in Oilton
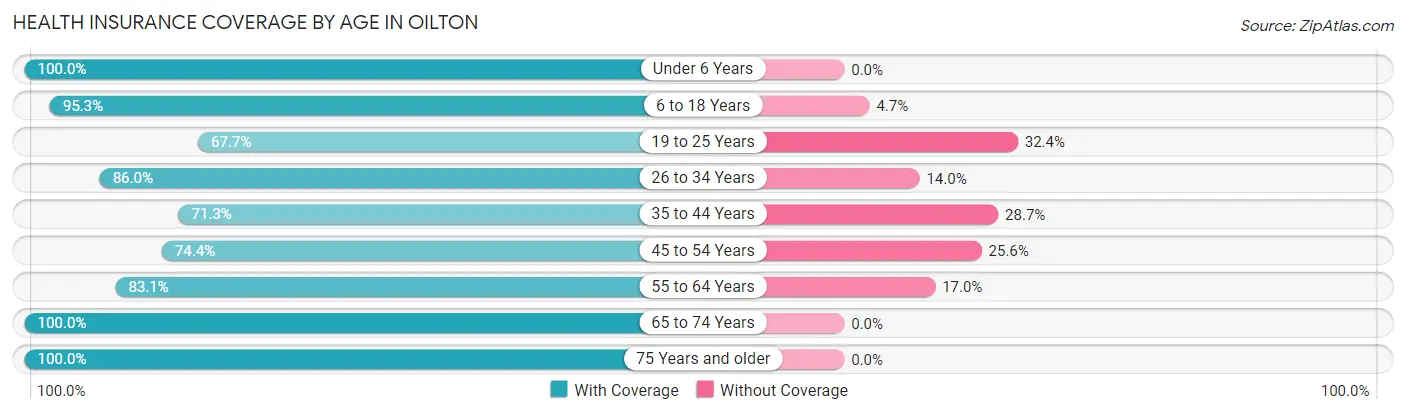
| Age Bracket | With Coverage | Without Coverage |
| Under 6 Years | 72 (100.0%) | 0 (0.0%) |
| 6 to 18 Years | 142 (95.3%) | 7 (4.7%) |
| 19 to 25 Years | 46 (67.6%) | 22 (32.4%) |
| 26 to 34 Years | 92 (86.0%) | 15 (14.0%) |
| 35 to 44 Years | 87 (71.3%) | 35 (28.7%) |
| 45 to 54 Years | 61 (74.4%) | 21 (25.6%) |
| 55 to 64 Years | 98 (83.1%) | 20 (17.0%) |
| 65 to 74 Years | 46 (100.0%) | 0 (0.0%) |
| 75 Years and older | 42 (100.0%) | 0 (0.0%) |
| Total | 686 (85.1%) | 120 (14.9%) |
Health Insurance Coverage by Citizenship Status in Oilton
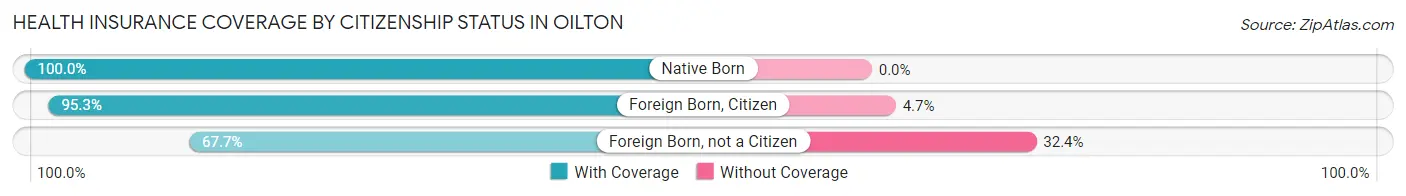
| Citizenship Status | With Coverage | Without Coverage |
| Native Born | 72 (100.0%) | 0 (0.0%) |
| Foreign Born, Citizen | 142 (95.3%) | 7 (4.7%) |
| Foreign Born, not a Citizen | 46 (67.6%) | 22 (32.4%) |
Health Insurance Coverage by Household Income in Oilton
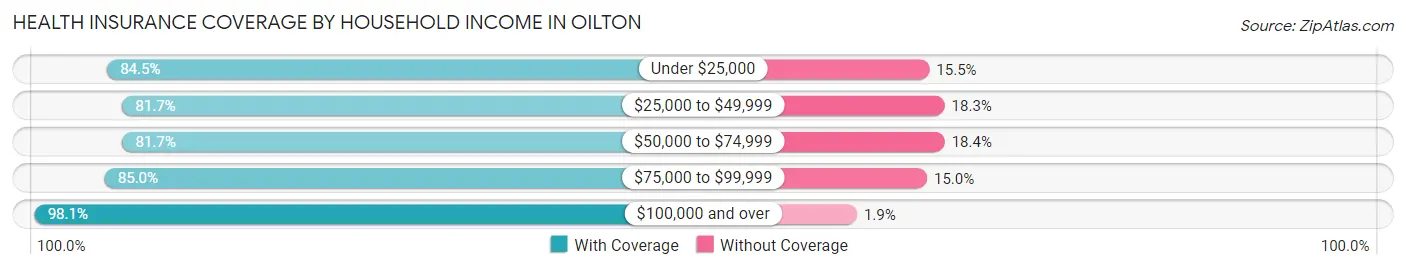
| Household Income | With Coverage | Without Coverage |
| Under $25,000 | 202 (84.5%) | 37 (15.5%) |
| $25,000 to $49,999 | 196 (81.7%) | 44 (18.3%) |
| $50,000 to $74,999 | 89 (81.7%) | 20 (18.3%) |
| $75,000 to $99,999 | 96 (85.0%) | 17 (15.0%) |
| $100,000 and over | 103 (98.1%) | 2 (1.9%) |
Public vs Private Health Insurance Coverage by Age in Oilton
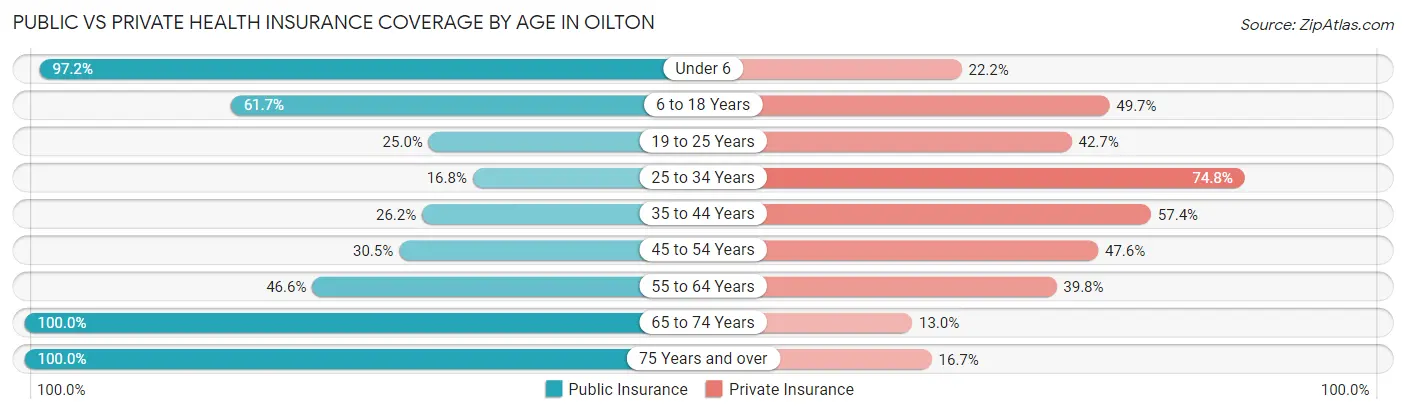
| Age Bracket | Public Insurance | Private Insurance |
| Under 6 | 70 (97.2%) | 16 (22.2%) |
| 6 to 18 Years | 92 (61.7%) | 74 (49.7%) |
| 19 to 25 Years | 17 (25.0%) | 29 (42.6%) |
| 25 to 34 Years | 18 (16.8%) | 80 (74.8%) |
| 35 to 44 Years | 32 (26.2%) | 70 (57.4%) |
| 45 to 54 Years | 25 (30.5%) | 39 (47.6%) |
| 55 to 64 Years | 55 (46.6%) | 47 (39.8%) |
| 65 to 74 Years | 46 (100.0%) | 6 (13.0%) |
| 75 Years and over | 42 (100.0%) | 7 (16.7%) |
| Total | 397 (49.3%) | 368 (45.7%) |
Disability Status by Sex by Age in Oilton
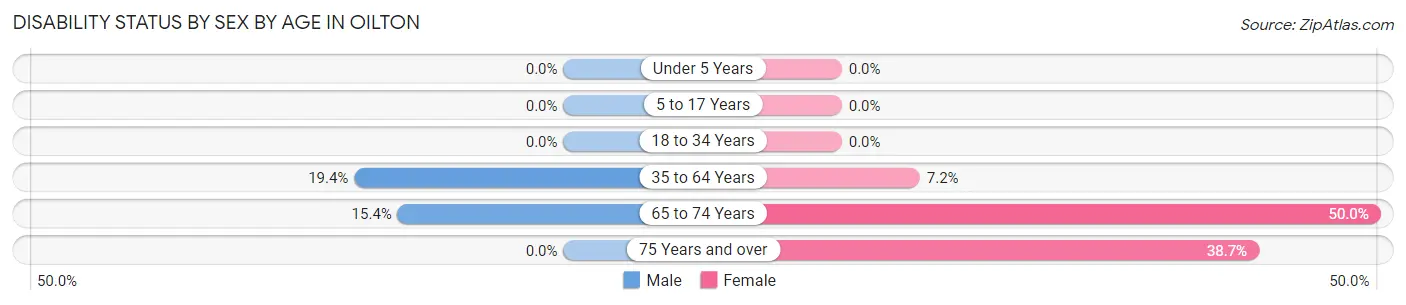
| Age Bracket | Male | Female |
| Under 5 Years | 0 (0.0%) | 0 (0.0%) |
| 5 to 17 Years | 0 (0.0%) | 0 (0.0%) |
| 18 to 34 Years | 0 (0.0%) | 0 (0.0%) |
| 35 to 64 Years | 33 (19.4%) | 11 (7.2%) |
| 65 to 74 Years | 4 (15.4%) | 10 (50.0%) |
| 75 Years and over | 0 (0.0%) | 12 (38.7%) |
Disability Class by Sex by Age in Oilton
Disability Class: Hearing Difficulty
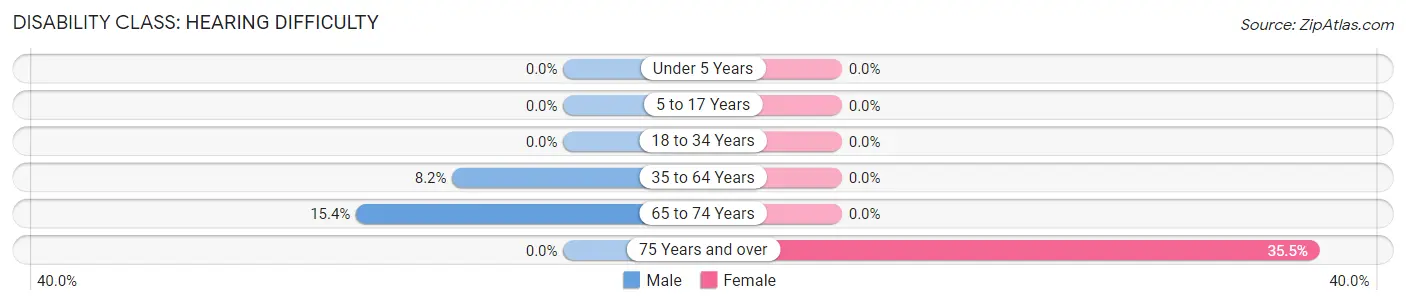
| Age Bracket | Male | Female |
| Under 5 Years | 0 (0.0%) | 0 (0.0%) |
| 5 to 17 Years | 0 (0.0%) | 0 (0.0%) |
| 18 to 34 Years | 0 (0.0%) | 0 (0.0%) |
| 35 to 64 Years | 14 (8.2%) | 0 (0.0%) |
| 65 to 74 Years | 4 (15.4%) | 0 (0.0%) |
| 75 Years and over | 0 (0.0%) | 11 (35.5%) |
Disability Class: Vision Difficulty
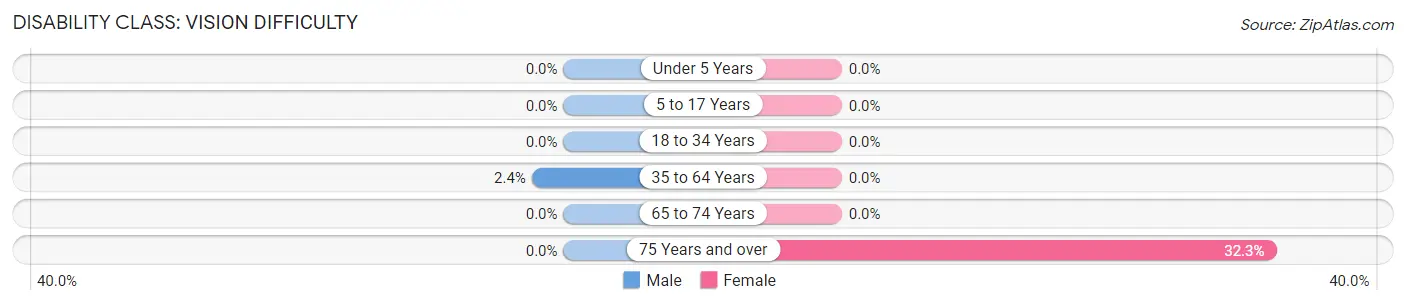
| Age Bracket | Male | Female |
| Under 5 Years | 0 (0.0%) | 0 (0.0%) |
| 5 to 17 Years | 0 (0.0%) | 0 (0.0%) |
| 18 to 34 Years | 0 (0.0%) | 0 (0.0%) |
| 35 to 64 Years | 4 (2.4%) | 0 (0.0%) |
| 65 to 74 Years | 0 (0.0%) | 0 (0.0%) |
| 75 Years and over | 0 (0.0%) | 10 (32.3%) |
Disability Class: Cognitive Difficulty
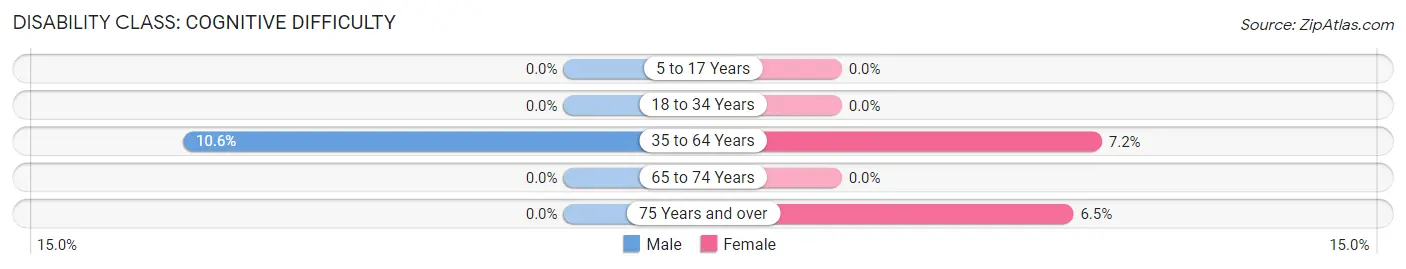
| Age Bracket | Male | Female |
| 5 to 17 Years | 0 (0.0%) | 0 (0.0%) |
| 18 to 34 Years | 0 (0.0%) | 0 (0.0%) |
| 35 to 64 Years | 18 (10.6%) | 11 (7.2%) |
| 65 to 74 Years | 0 (0.0%) | 0 (0.0%) |
| 75 Years and over | 0 (0.0%) | 2 (6.5%) |
Disability Class: Ambulatory Difficulty
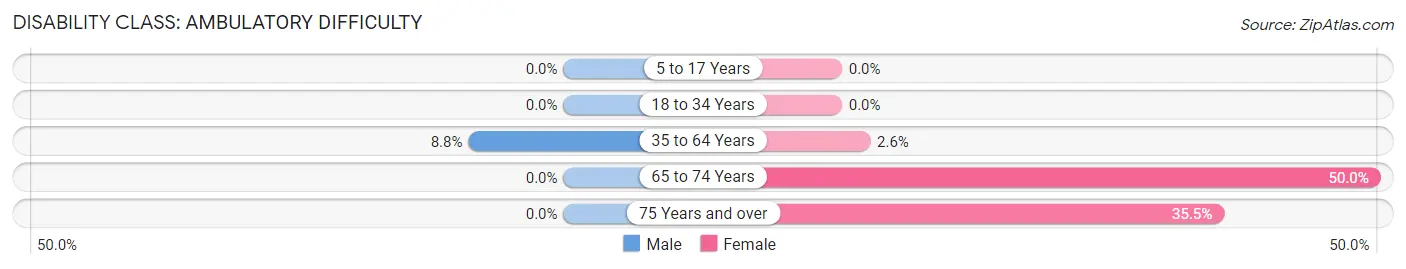
| Age Bracket | Male | Female |
| 5 to 17 Years | 0 (0.0%) | 0 (0.0%) |
| 18 to 34 Years | 0 (0.0%) | 0 (0.0%) |
| 35 to 64 Years | 15 (8.8%) | 4 (2.6%) |
| 65 to 74 Years | 0 (0.0%) | 10 (50.0%) |
| 75 Years and over | 0 (0.0%) | 11 (35.5%) |
Disability Class: Self-Care Difficulty
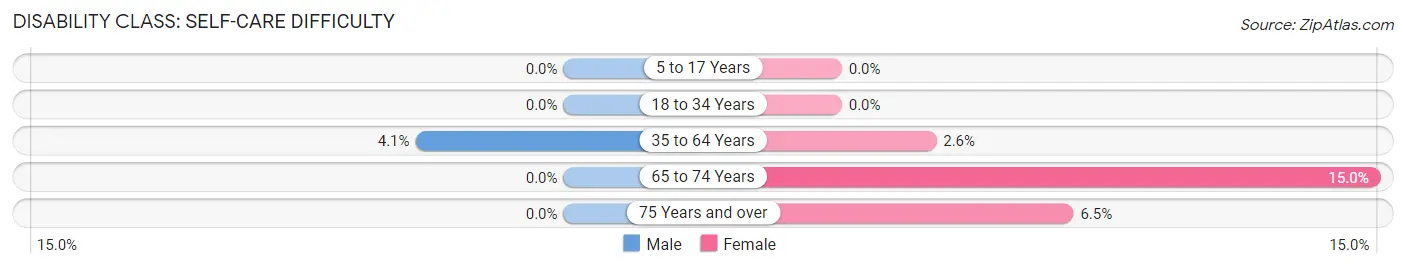
| Age Bracket | Male | Female |
| 5 to 17 Years | 0 (0.0%) | 0 (0.0%) |
| 18 to 34 Years | 0 (0.0%) | 0 (0.0%) |
| 35 to 64 Years | 7 (4.1%) | 4 (2.6%) |
| 65 to 74 Years | 0 (0.0%) | 3 (15.0%) |
| 75 Years and over | 0 (0.0%) | 2 (6.5%) |
Technology Access in Oilton
Computing Device Access in Oilton
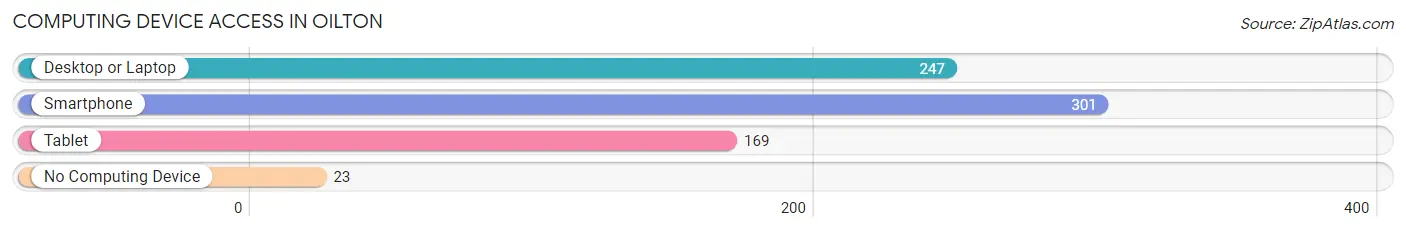
| Device Type | # Households | % Households |
| Desktop or Laptop | 247 | 70.8% |
| Smartphone | 301 | 86.3% |
| Tablet | 169 | 48.4% |
| No Computing Device | 23 | 6.6% |
| Total | 349 | 100.0% |
Internet Access in Oilton
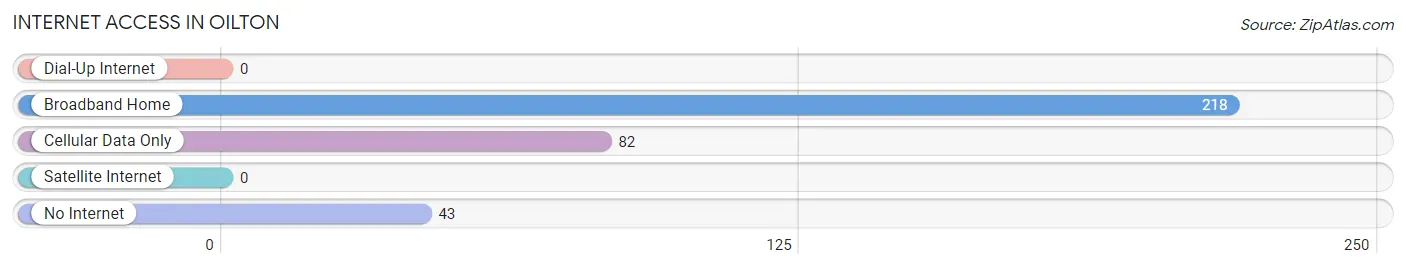
| Internet Type | # Households | % Households |
| Dial-Up Internet | 0 | 0.0% |
| Broadband Home | 218 | 62.5% |
| Cellular Data Only | 82 | 23.5% |
| Satellite Internet | 0 | 0.0% |
| No Internet | 43 | 12.3% |
| Total | 349 | 100.0% |
Oilton Summary
Oilton, Oklahoma is a small town located in Creek County, Oklahoma. It is situated about 20 miles east of Tulsa and is part of the Tulsa Metropolitan Statistical Area. The town was founded in 1891 and was named after the oil boom that was occurring in the area at the time. The population of Oilton was 1,093 at the time of the 2010 census.
Geography
Oilton is located in Creek County, Oklahoma at an elevation of 745 feet. It is situated on the banks of the Arkansas River and is surrounded by rolling hills and wooded areas. The town is located in the Central Plains region of the United States and has a humid subtropical climate. The average temperature in Oilton is around 70 degrees Fahrenheit in the summer and around 40 degrees Fahrenheit in the winter.
Economy
The economy of Oilton is largely based on agriculture and oil production. The town is home to several large farms and ranches that produce a variety of crops, including wheat, corn, soybeans, and cotton. The town is also home to several oil and gas production companies, which provide jobs for many of the town’s residents.
Demographics
At the time of the 2010 census, the population of Oilton was 1,093. The racial makeup of the town was 94.3% White, 0.7% African American, 0.7% Native American, 0.3% Asian, 0.1% Pacific Islander, and 3.1% from two or more races. The median household income in Oilton was $35,938, and the median family income was $41,250. The per capita income in Oilton was $17,845.
History
Oilton was founded in 1891 by a group of settlers from Arkansas. The town was named after the oil boom that was occurring in the area at the time. The town quickly grew and by the early 1900s, it had become a thriving community. The town was home to several businesses, including a bank, a hotel, a general store, and a post office.
In the 1920s, the town experienced a decline in population due to the Great Depression. However, the town was able to recover and by the 1950s, it had become a thriving community once again. The town has remained relatively stable since then and continues to be a small but vibrant community.
Conclusion
Oilton, Oklahoma is a small town located in Creek County, Oklahoma. It is situated about 20 miles east of Tulsa and is part of the Tulsa Metropolitan Statistical Area. The town was founded in 1891 and was named after the oil boom that was occurring in the area at the time. The population of Oilton was 1,093 at the time of the 2010 census. The economy of Oilton is largely based on agriculture and oil production, and the town is home to several large farms and ranches. The racial makeup of the town was 94.3% White, 0.7% African American, 0.7% Native American, 0.3% Asian, 0.1% Pacific Islander, and 3.1% from two or more races. The median household income in Oilton was $35,938, and the median family income was $41,250. The town has remained relatively stable since the 1950s and continues to be a small but vibrant community.
Common Questions
What is Per Capita Income in Oilton?
Per Capita income in Oilton is $20,579.
What is the Median Family Income in Oilton?
Median Family Income in Oilton is $43,750.
What is the Median Household income in Oilton?
Median Household Income in Oilton is $33,229.
What is Income or Wage Gap in Oilton?
Income or Wage Gap in Oilton is 39.0%.
Women in Oilton earn 61.0 cents for every dollar earned by a man.
What is Inequality or Gini Index in Oilton?
Inequality or Gini Index in Oilton is 0.47.
What is the Total Population of Oilton?
Total Population of Oilton is 806.
What is the Total Male Population of Oilton?
Total Male Population of Oilton is 415.
What is the Total Female Population of Oilton?
Total Female Population of Oilton is 391.
What is the Ratio of Males per 100 Females in Oilton?
There are 106.14 Males per 100 Females in Oilton.
What is the Ratio of Females per 100 Males in Oilton?
There are 94.22 Females per 100 Males in Oilton.
What is the Median Population Age in Oilton?
Median Population Age in Oilton is 35.3 Years.
What is the Average Family Size in Oilton
Average Family Size in Oilton is 3.0 People.
What is the Average Household Size in Oilton
Average Household Size in Oilton is 2.3 People.
How Large is the Labor Force in Oilton?
There are 321 People in the Labor Forcein in Oilton.
What is the Percentage of People in the Labor Force in Oilton?
53.4% of People are in the Labor Force in Oilton.
What is the Unemployment Rate in Oilton?
Unemployment Rate in Oilton is 3.4%.