Sequoyah, OK Map & Demographics
Sequoyah Map
Sequoyah Overview
$38,385
PER CAPITA INCOME
$100,938
AVG FAMILY INCOME
$90,556
AVG HOUSEHOLD INCOME
43.8%
WAGE / INCOME GAP [ % ]
56.2¢/ $1
WAGE / INCOME GAP [ $ ]
0.29
INEQUALITY / GINI INDEX
653
TOTAL POPULATION
353
MALE POPULATION
300
FEMALE POPULATION
117.67
MALES / 100 FEMALES
84.99
FEMALES / 100 MALES
49.6
MEDIAN AGE
3.0
AVG FAMILY SIZE
2.6
AVG HOUSEHOLD SIZE
369
LABOR FORCE [ PEOPLE ]
71.7%
PERCENT IN LABOR FORCE
4.6%
UNEMPLOYMENT RATE
Income in Sequoyah
Income Overview in Sequoyah
Per Capita Income in Sequoyah is $38,385, while median incomes of families and households are $100,938 and $90,556 respectively.
| Characteristic | Number | Measure |
| Per Capita Income | 653 | $38,385 |
| Median Family Income | 206 | $100,938 |
| Mean Family Income | 206 | $107,269 |
| Median Household Income | 252 | $90,556 |
| Mean Household Income | 252 | $94,952 |
| Income Deficit | 206 | $0 |
| Wage / Income Gap (%) | 653 | 43.85% |
| Wage / Income Gap ($) | 653 | 56.15¢ per $1 |
| Gini / Inequality Index | 653 | 0.29 |
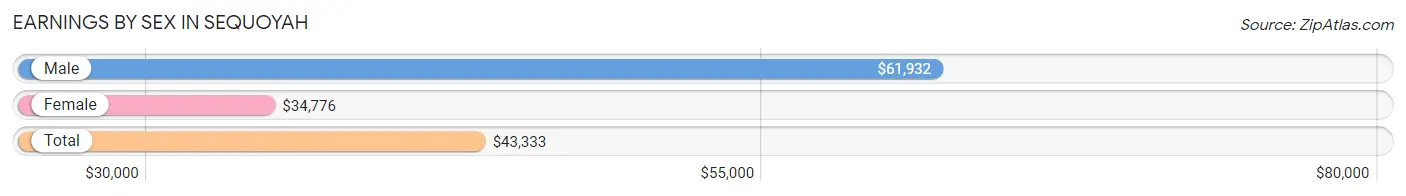
Earnings by Sex in Sequoyah
Average Earnings in Sequoyah are $43,333, $61,932 for men and $34,776 for women, a difference of 43.9%.
| Sex | Number | Average Earnings |
| Male | 178 (47.1%) | $61,932 |
| Female | 200 (52.9%) | $34,776 |
| Total | 378 (100.0%) | $43,333 |
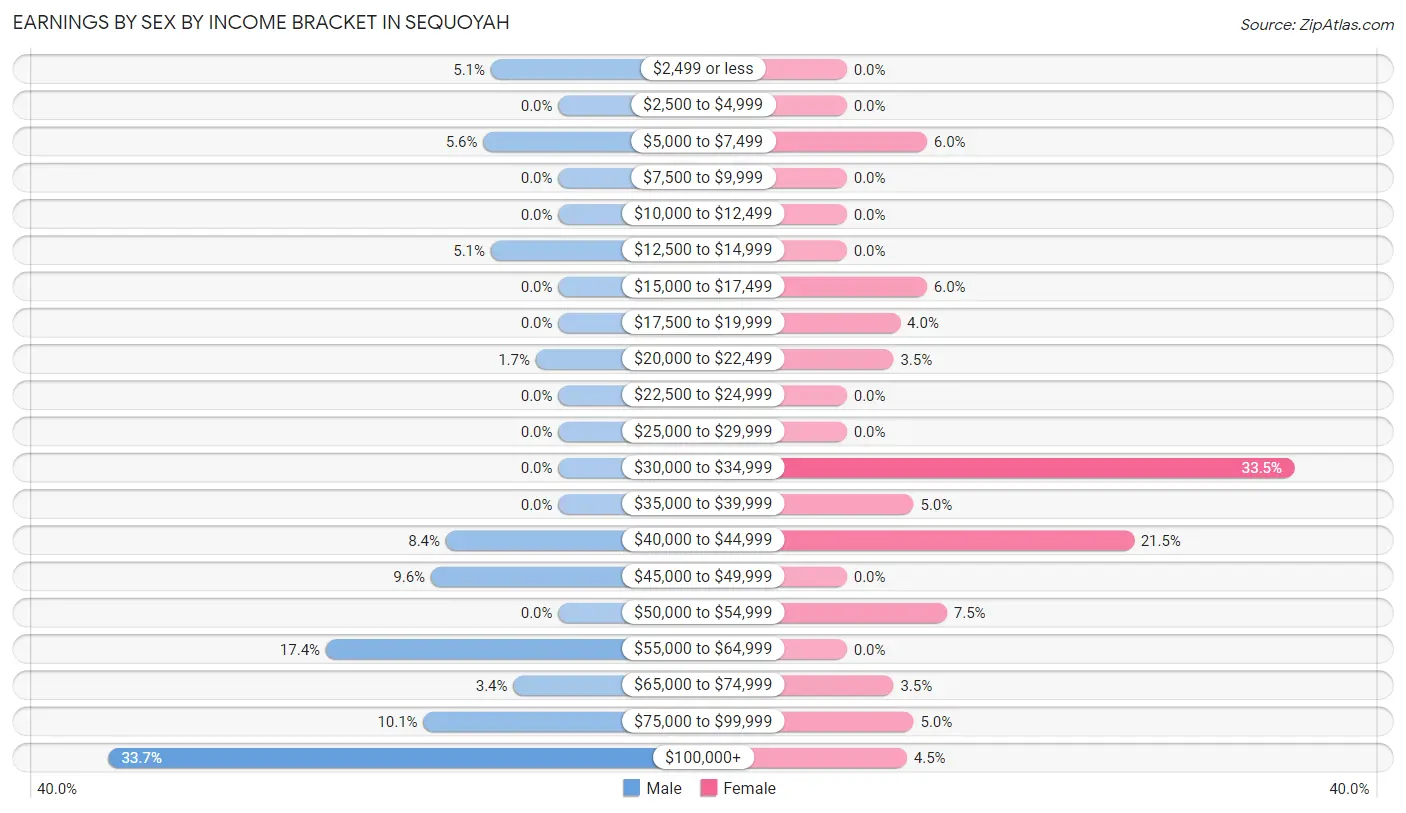
Earnings by Sex by Income Bracket in Sequoyah
The most common earnings brackets in Sequoyah are $100,000+ for men (60 | 33.7%) and $30,000 to $34,999 for women (67 | 33.5%).
| Income | Male | Female |
| $2,499 or less | 9 (5.1%) | 0 (0.0%) |
| $2,500 to $4,999 | 0 (0.0%) | 0 (0.0%) |
| $5,000 to $7,499 | 10 (5.6%) | 12 (6.0%) |
| $7,500 to $9,999 | 0 (0.0%) | 0 (0.0%) |
| $10,000 to $12,499 | 0 (0.0%) | 0 (0.0%) |
| $12,500 to $14,999 | 9 (5.1%) | 0 (0.0%) |
| $15,000 to $17,499 | 0 (0.0%) | 12 (6.0%) |
| $17,500 to $19,999 | 0 (0.0%) | 8 (4.0%) |
| $20,000 to $22,499 | 3 (1.7%) | 7 (3.5%) |
| $22,500 to $24,999 | 0 (0.0%) | 0 (0.0%) |
| $25,000 to $29,999 | 0 (0.0%) | 0 (0.0%) |
| $30,000 to $34,999 | 0 (0.0%) | 67 (33.5%) |
| $35,000 to $39,999 | 0 (0.0%) | 10 (5.0%) |
| $40,000 to $44,999 | 15 (8.4%) | 43 (21.5%) |
| $45,000 to $49,999 | 17 (9.6%) | 0 (0.0%) |
| $50,000 to $54,999 | 0 (0.0%) | 15 (7.5%) |
| $55,000 to $64,999 | 31 (17.4%) | 0 (0.0%) |
| $65,000 to $74,999 | 6 (3.4%) | 7 (3.5%) |
| $75,000 to $99,999 | 18 (10.1%) | 10 (5.0%) |
| $100,000+ | 60 (33.7%) | 9 (4.5%) |
| Total | 178 (100.0%) | 200 (100.0%) |
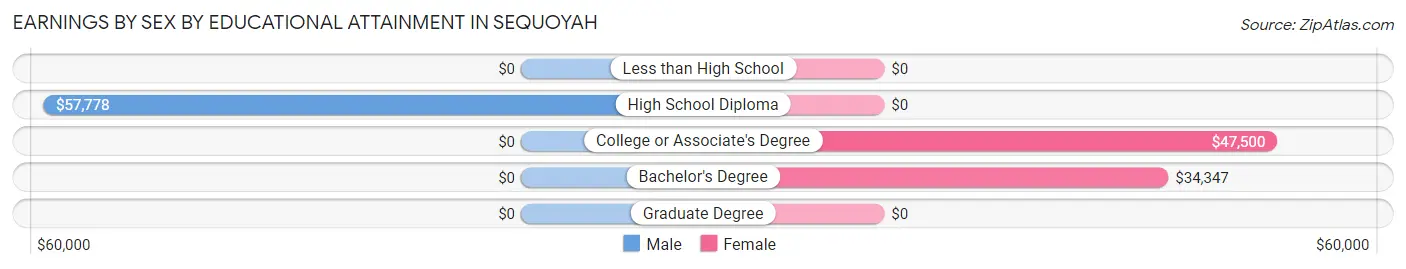
Earnings by Sex by Educational Attainment in Sequoyah
Average earnings in Sequoyah are $66,250 for men and $36,250 for women, a difference of 45.3%. Men with an educational attainment of high school diploma enjoy the highest average annual earnings of $57,778, while those with high school diploma education earn the least with $57,778. Women with an educational attainment of college or associate's degree earn the most with the average annual earnings of $47,500, while those with bachelor's degree education have the smallest earnings of $34,347.
| Educational Attainment | Male Income | Female Income |
| Less than High School | - | - |
| High School Diploma | $57,778 | $0 |
| College or Associate's Degree | - | - |
| Bachelor's Degree | - | - |
| Graduate Degree | - | - |
| Total | $66,250 | $36,250 |
Family Income in Sequoyah
Family Income Brackets in Sequoyah
According to the Sequoyah family income data, there are 92 families falling into the $100,000 to $149,999 income range, which is the most common income bracket and makes up 44.7% of all families.
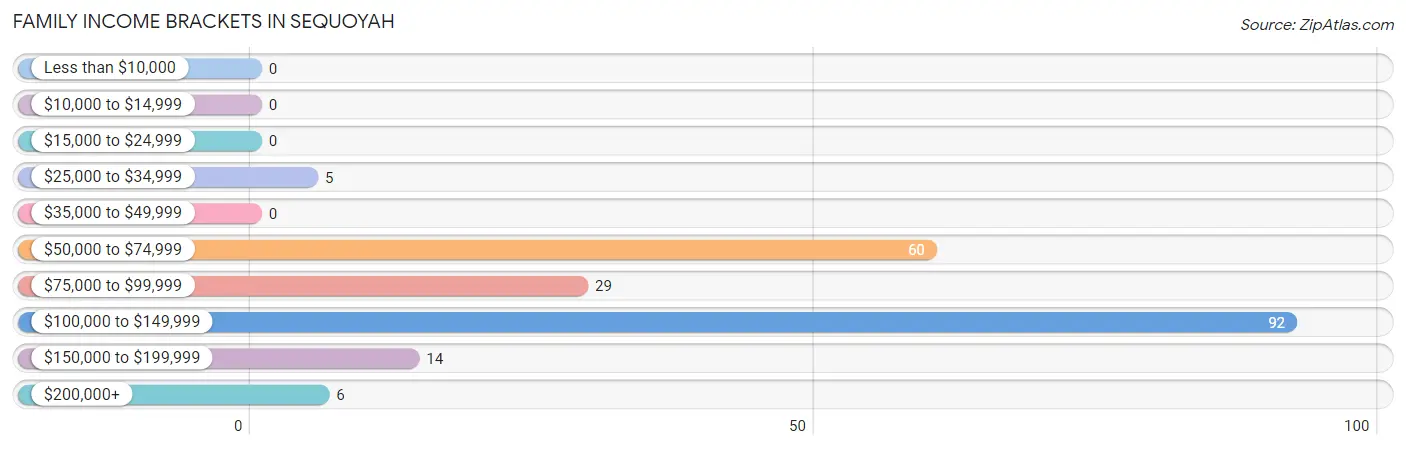
| Income Bracket | # Families | % Families |
| Less than $10,000 | 0 | 0.0% |
| $10,000 to $14,999 | 0 | 0.0% |
| $15,000 to $24,999 | 0 | 0.0% |
| $25,000 to $34,999 | 5 | 2.4% |
| $35,000 to $49,999 | 0 | 0.0% |
| $50,000 to $74,999 | 60 | 29.1% |
| $75,000 to $99,999 | 29 | 14.1% |
| $100,000 to $149,999 | 92 | 44.7% |
| $150,000 to $199,999 | 14 | 6.8% |
| $200,000+ | 6 | 2.9% |
Family Income by Famaliy Size in Sequoyah
2-person families (118 | 57.3%) account for the highest median family income in Sequoyah with $135,324 per family, while 2-person families (118 | 57.3%) have the highest median income of $67,662 per family member.
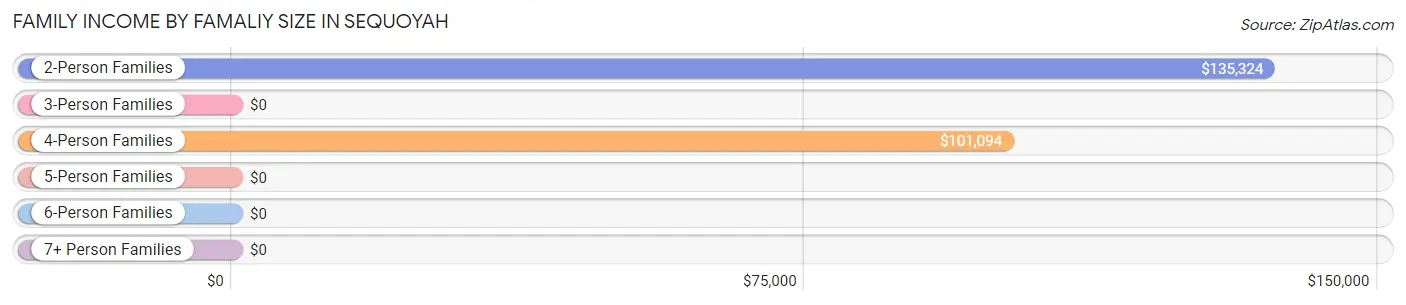
| Income Bracket | # Families | Median Income |
| 2-Person Families | 118 (57.3%) | $135,324 |
| 3-Person Families | 16 (7.8%) | $0 |
| 4-Person Families | 55 (26.7%) | $101,094 |
| 5-Person Families | 9 (4.4%) | $0 |
| 6-Person Families | 8 (3.9%) | $0 |
| 7+ Person Families | 0 (0.0%) | $0 |
| Total | 206 (100.0%) | $100,938 |
Family Income by Number of Earners in Sequoyah
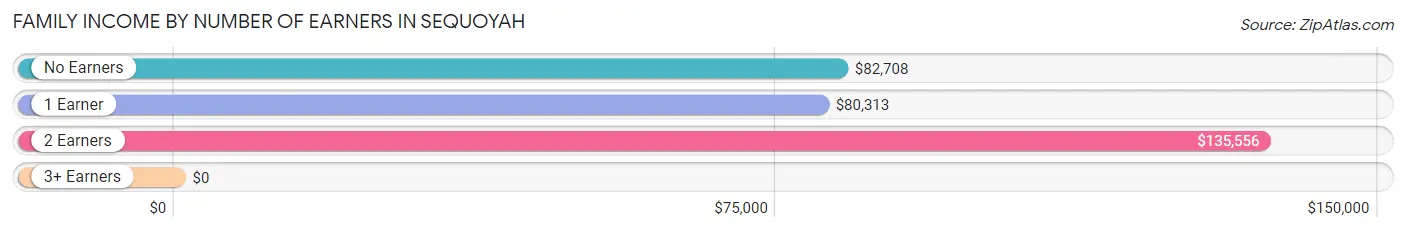
| Number of Earners | # Families | Median Income |
| No Earners | 25 (12.1%) | $82,708 |
| 1 Earner | 37 (18.0%) | $80,313 |
| 2 Earners | 130 (63.1%) | $135,556 |
| 3+ Earners | 14 (6.8%) | $0 |
| Total | 206 (100.0%) | $100,938 |
Household Income in Sequoyah
Household Income Brackets in Sequoyah
With 92 households falling in the category, the $100,000 to $149,999 income range is the most frequent in Sequoyah, accounting for 36.5% of all households.
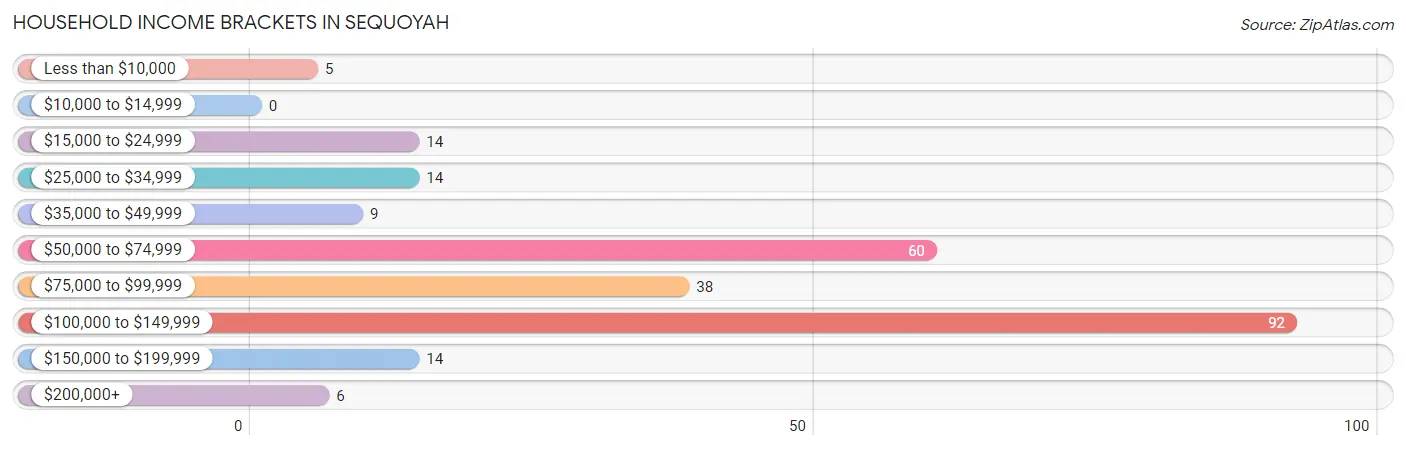
| Income Bracket | # Households | % Households |
| Less than $10,000 | 5 | 2.0% |
| $10,000 to $14,999 | 0 | 0.0% |
| $15,000 to $24,999 | 14 | 5.6% |
| $25,000 to $34,999 | 14 | 5.6% |
| $35,000 to $49,999 | 9 | 3.6% |
| $50,000 to $74,999 | 60 | 23.8% |
| $75,000 to $99,999 | 38 | 15.1% |
| $100,000 to $149,999 | 92 | 36.5% |
| $150,000 to $199,999 | 14 | 5.6% |
| $200,000+ | 6 | 2.4% |
Household Income by Householder Age in Sequoyah
The median household income in Sequoyah is $90,556, with the highest median household income of $135,255 found in the 45 to 64 years age bracket for the primary householder. A total of 115 households (45.6%) fall into this category.
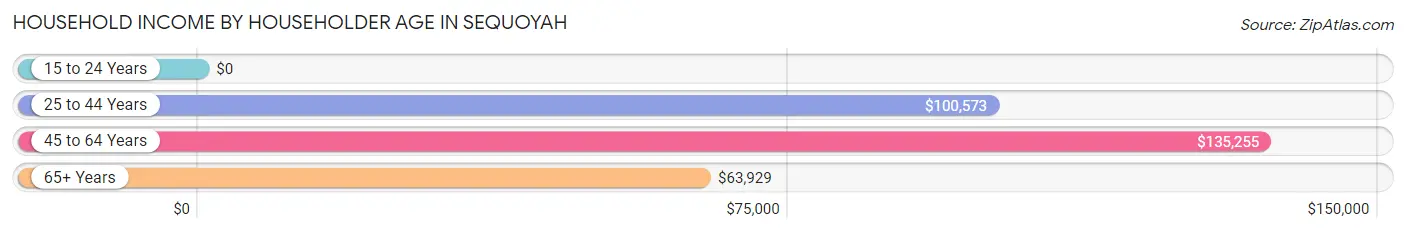
| Income Bracket | # Households | Median Income |
| 15 to 24 Years | 0 (0.0%) | $0 |
| 25 to 44 Years | 53 (21.0%) | $100,573 |
| 45 to 64 Years | 115 (45.6%) | $135,255 |
| 65+ Years | 84 (33.3%) | $63,929 |
| Total | 252 (100.0%) | $90,556 |
Poverty in Sequoyah
Income Below Poverty by Sex and Age in Sequoyah
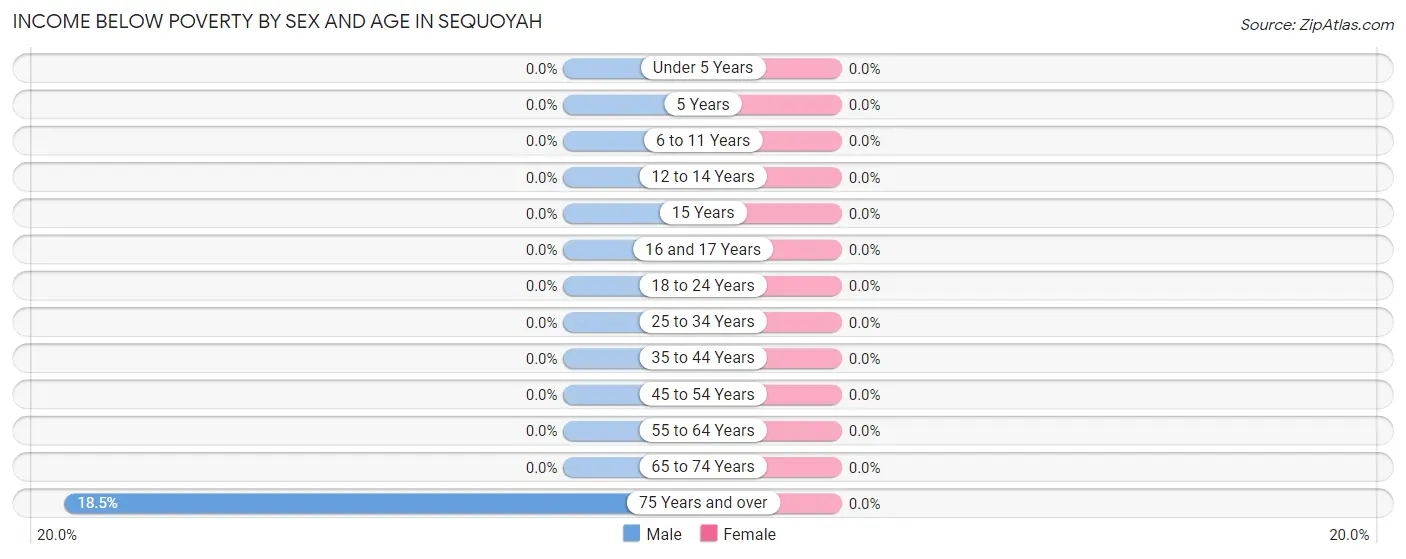
| Age Bracket | Male | Female |
| Under 5 Years | 0 (0.0%) | 0 (0.0%) |
| 5 Years | 0 (0.0%) | 0 (0.0%) |
| 6 to 11 Years | 0 (0.0%) | 0 (0.0%) |
| 12 to 14 Years | 0 (0.0%) | 0 (0.0%) |
| 15 Years | 0 (0.0%) | 0 (0.0%) |
| 16 and 17 Years | 0 (0.0%) | 0 (0.0%) |
| 18 to 24 Years | 0 (0.0%) | 0 (0.0%) |
| 25 to 34 Years | 0 (0.0%) | 0 (0.0%) |
| 35 to 44 Years | 0 (0.0%) | 0 (0.0%) |
| 45 to 54 Years | 0 (0.0%) | 0 (0.0%) |
| 55 to 64 Years | 0 (0.0%) | 0 (0.0%) |
| 65 to 74 Years | 0 (0.0%) | 0 (0.0%) |
| 75 Years and over | 5 (18.5%) | 0 (0.0%) |
| Total | 5 (1.4%) | 0 (0.0%) |
Income Above Poverty by Sex and Age in Sequoyah
According to the poverty statistics in Sequoyah, males aged under 5 years and females aged under 5 years are the age groups that are most secure financially, with 100.0% of males and 100.0% of females in these age groups living above the poverty line.
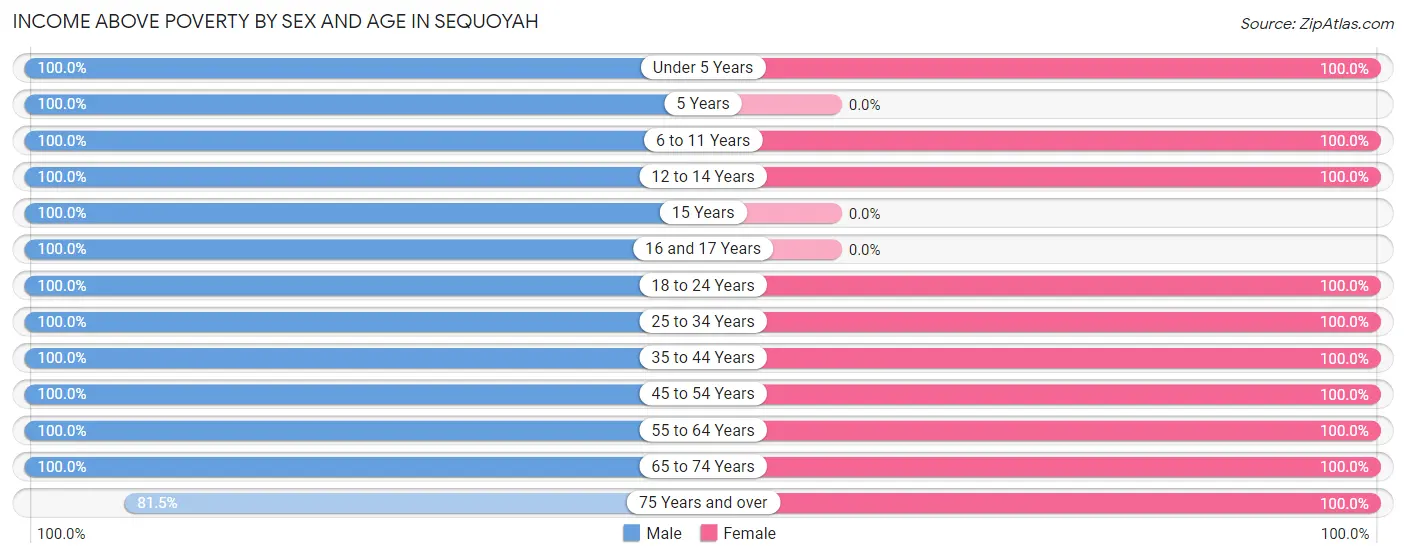
| Age Bracket | Male | Female |
| Under 5 Years | 23 (100.0%) | 15 (100.0%) |
| 5 Years | 10 (100.0%) | 0 (0.0%) |
| 6 to 11 Years | 32 (100.0%) | 26 (100.0%) |
| 12 to 14 Years | 13 (100.0%) | 4 (100.0%) |
| 15 Years | 15 (100.0%) | 0 (0.0%) |
| 16 and 17 Years | 14 (100.0%) | 0 (0.0%) |
| 18 to 24 Years | 10 (100.0%) | 12 (100.0%) |
| 25 to 34 Years | 19 (100.0%) | 44 (100.0%) |
| 35 to 44 Years | 41 (100.0%) | 33 (100.0%) |
| 45 to 54 Years | 87 (100.0%) | 83 (100.0%) |
| 55 to 64 Years | 9 (100.0%) | 33 (100.0%) |
| 65 to 74 Years | 53 (100.0%) | 43 (100.0%) |
| 75 Years and over | 22 (81.5%) | 7 (100.0%) |
| Total | 348 (98.6%) | 300 (100.0%) |
Income Below Poverty Among Married-Couple Families in Sequoyah
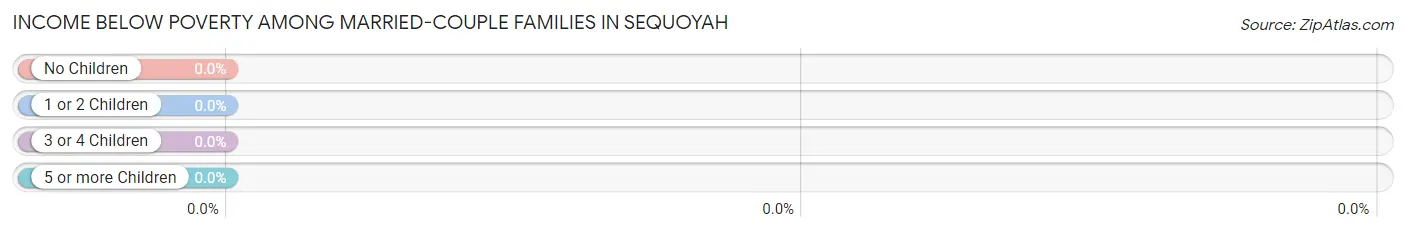
| Children | Above Poverty | Below Poverty |
| No Children | 125 (100.0%) | 0 (0.0%) |
| 1 or 2 Children | 50 (100.0%) | 0 (0.0%) |
| 3 or 4 Children | 17 (100.0%) | 0 (0.0%) |
| 5 or more Children | 0 (0.0%) | 0 (0.0%) |
| Total | 192 (100.0%) | 0 (0.0%) |
Income Below Poverty Among Single-Parent Households in Sequoyah
| Children | Single Father | Single Mother |
| No Children | 0 (0.0%) | 0 (0.0%) |
| 1 or 2 Children | 0 (0.0%) | 0 (0.0%) |
| 3 or 4 Children | 0 (0.0%) | 0 (0.0%) |
| 5 or more Children | 0 (0.0%) | 0 (0.0%) |
| Total | 0 (0.0%) | 0 (0.0%) |
Income Below Poverty Among Married-Couple vs Single-Parent Households in Sequoyah
| Children | Married-Couple Families | Single-Parent Households |
| No Children | 0 (0.0%) | 0 (0.0%) |
| 1 or 2 Children | 0 (0.0%) | 0 (0.0%) |
| 3 or 4 Children | 0 (0.0%) | 0 (0.0%) |
| 5 or more Children | 0 (0.0%) | 0 (0.0%) |
| Total | 0 (0.0%) | 0 (0.0%) |
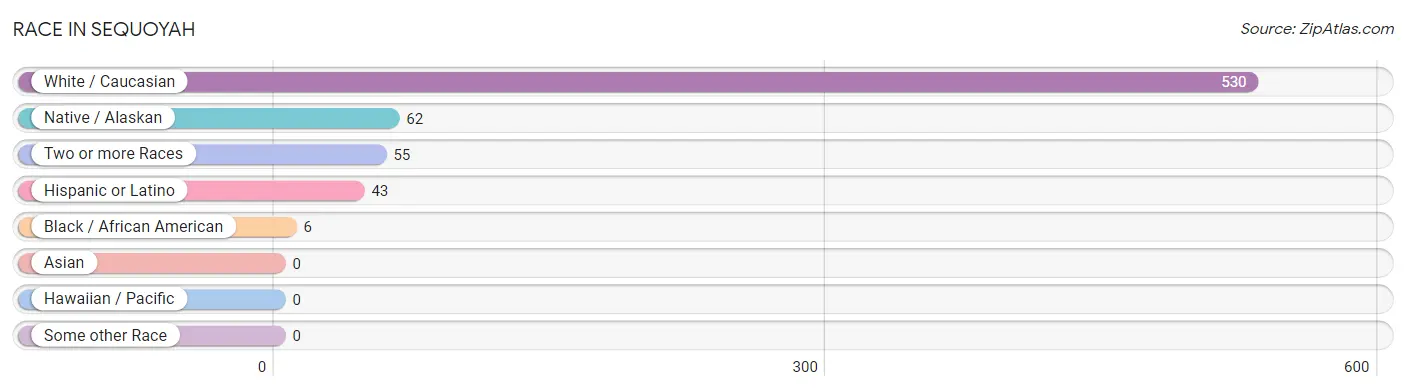
Race in Sequoyah
The most populous races in Sequoyah are White / Caucasian (530 | 81.2%), Native / Alaskan (62 | 9.5%), and Two or more Races (55 | 8.4%).
| Race | # Population | % Population |
| Asian | 0 | 0.0% |
| Black / African American | 6 | 0.9% |
| Hawaiian / Pacific | 0 | 0.0% |
| Hispanic or Latino | 43 | 6.6% |
| Native / Alaskan | 62 | 9.5% |
| White / Caucasian | 530 | 81.2% |
| Two or more Races | 55 | 8.4% |
| Some other Race | 0 | 0.0% |
| Total | 653 | 100.0% |
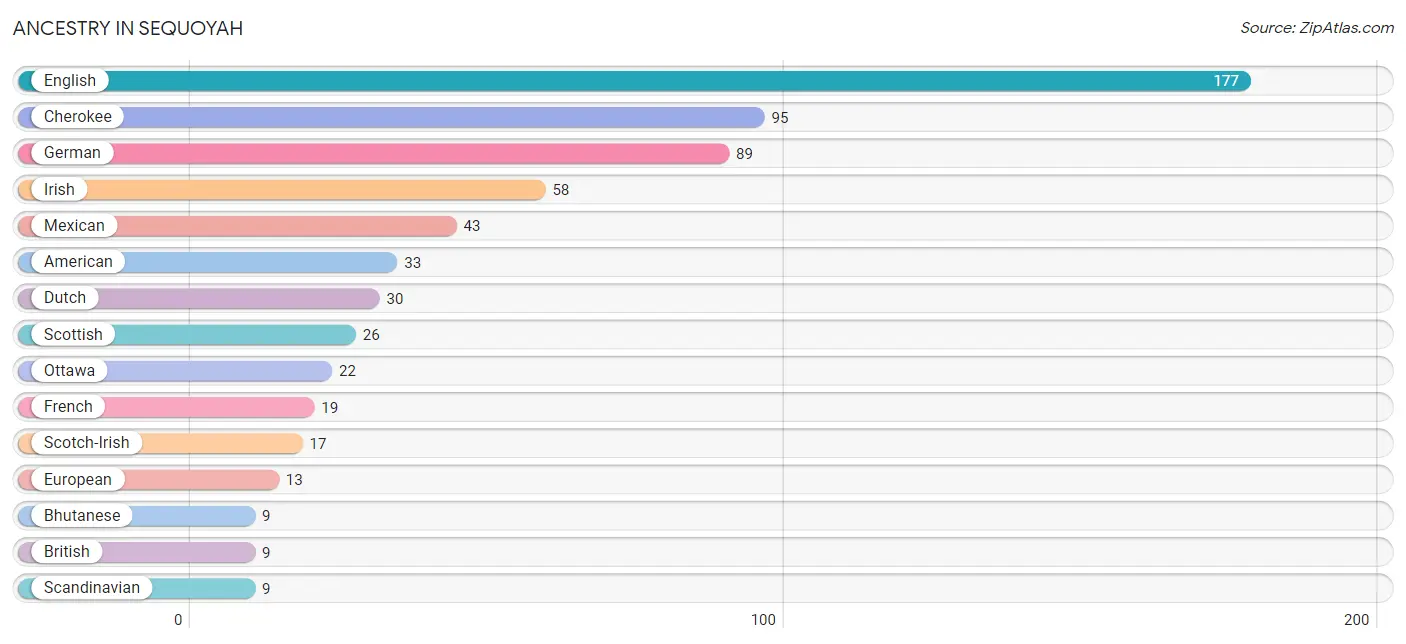
Ancestry in Sequoyah
The most populous ancestries reported in Sequoyah are English (177 | 27.1%), Cherokee (95 | 14.5%), German (89 | 13.6%), Irish (58 | 8.9%), and Mexican (43 | 6.6%), together accounting for 70.7% of all Sequoyah residents.
| Ancestry | # Population | % Population |
| American | 33 | 5.1% |
| Bhutanese | 9 | 1.4% |
| British | 9 | 1.4% |
| Cherokee | 95 | 14.5% |
| Dutch | 30 | 4.6% |
| English | 177 | 27.1% |
| European | 13 | 2.0% |
| French | 19 | 2.9% |
| German | 89 | 13.6% |
| Irish | 58 | 8.9% |
| Mexican | 43 | 6.6% |
| Norwegian | 5 | 0.8% |
| Ottawa | 22 | 3.4% |
| Scandinavian | 9 | 1.4% |
| Scotch-Irish | 17 | 2.6% |
| Scottish | 26 | 4.0% | View All 16 Rows |
Immigrants in Sequoyah

| Immigration Origin | # Population | % Population | View All 0 Rows |
Sex and Age in Sequoyah
Sex and Age in Sequoyah
The most populous age groups in Sequoyah are 50 to 54 Years (78 | 22.1%) for men and 50 to 54 Years (73 | 24.3%) for women.
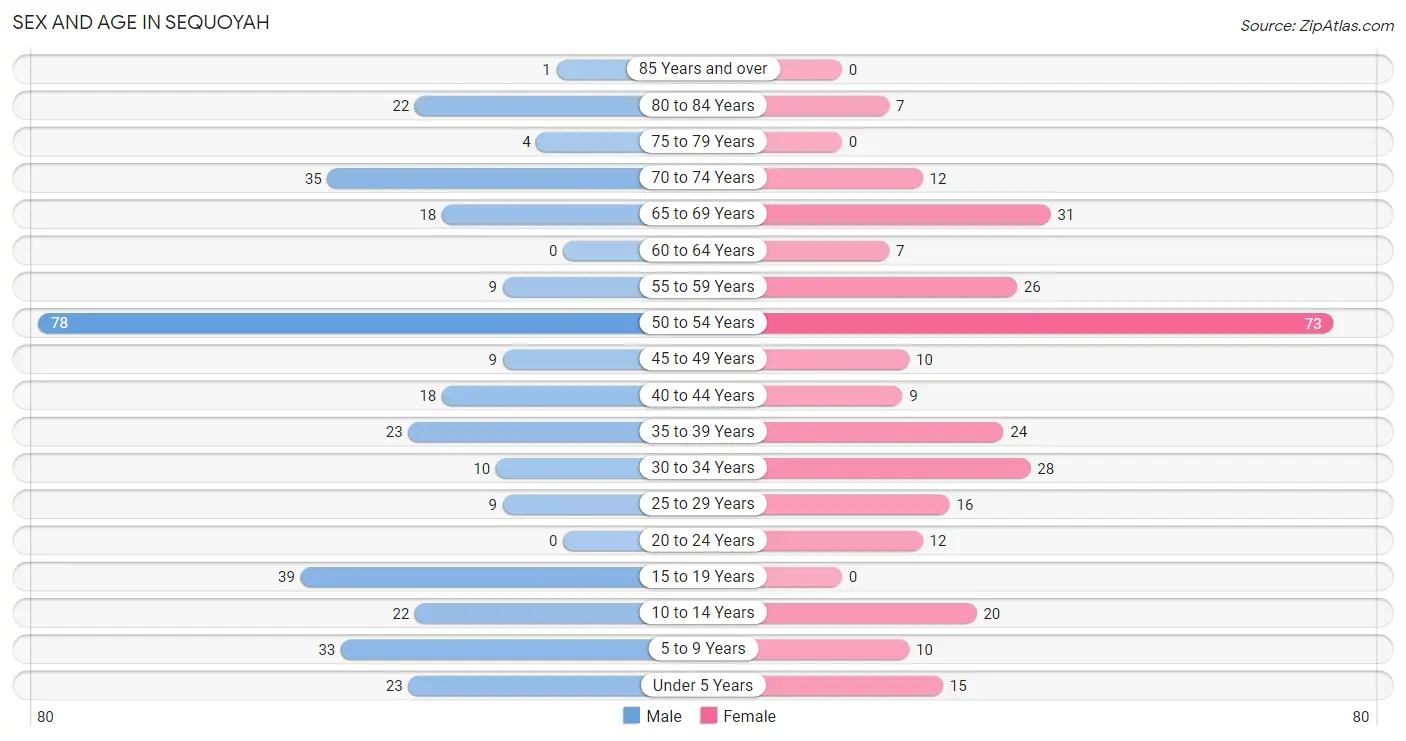
| Age Bracket | Male | Female |
| Under 5 Years | 23 (6.5%) | 15 (5.0%) |
| 5 to 9 Years | 33 (9.3%) | 10 (3.3%) |
| 10 to 14 Years | 22 (6.2%) | 20 (6.7%) |
| 15 to 19 Years | 39 (11.1%) | 0 (0.0%) |
| 20 to 24 Years | 0 (0.0%) | 12 (4.0%) |
| 25 to 29 Years | 9 (2.5%) | 16 (5.3%) |
| 30 to 34 Years | 10 (2.8%) | 28 (9.3%) |
| 35 to 39 Years | 23 (6.5%) | 24 (8.0%) |
| 40 to 44 Years | 18 (5.1%) | 9 (3.0%) |
| 45 to 49 Years | 9 (2.5%) | 10 (3.3%) |
| 50 to 54 Years | 78 (22.1%) | 73 (24.3%) |
| 55 to 59 Years | 9 (2.5%) | 26 (8.7%) |
| 60 to 64 Years | 0 (0.0%) | 7 (2.3%) |
| 65 to 69 Years | 18 (5.1%) | 31 (10.3%) |
| 70 to 74 Years | 35 (9.9%) | 12 (4.0%) |
| 75 to 79 Years | 4 (1.1%) | 0 (0.0%) |
| 80 to 84 Years | 22 (6.2%) | 7 (2.3%) |
| 85 Years and over | 1 (0.3%) | 0 (0.0%) |
| Total | 353 (100.0%) | 300 (100.0%) |
Families and Households in Sequoyah
Median Family Size in Sequoyah
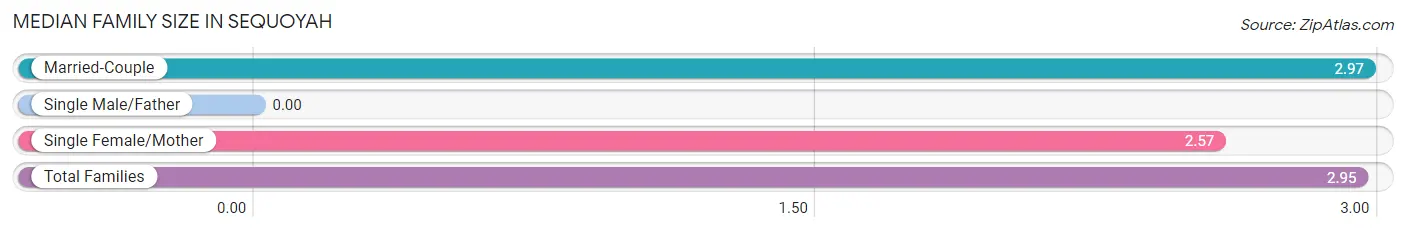
| Family Type | # Families | Family Size |
| Married-Couple | 192 (93.2%) | 2.97 |
| Single Male/Father | 0 (0.0%) | - |
| Single Female/Mother | 14 (6.8%) | 2.57 |
| Total Families | 206 (100.0%) | 2.95 |
Median Household Size in Sequoyah
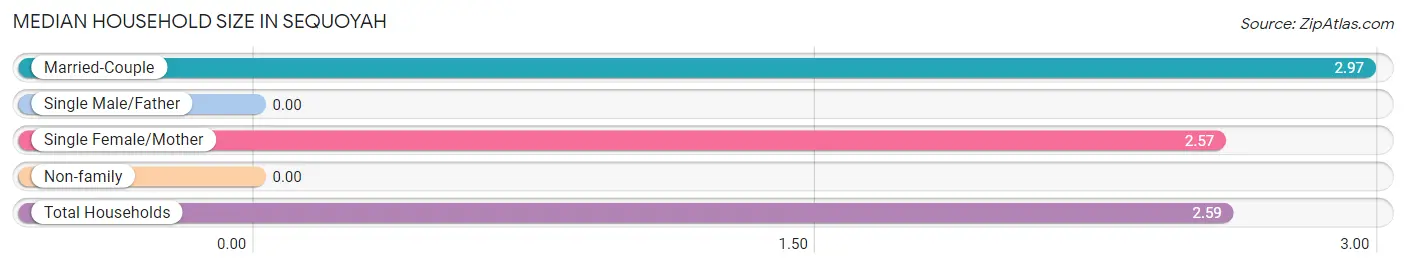
| Household Type | # Households | Household Size |
| Married-Couple | 192 (76.2%) | 2.97 |
| Single Male/Father | 0 (0.0%) | - |
| Single Female/Mother | 14 (5.6%) | 2.57 |
| Non-family | 46 (18.2%) | - |
| Total Households | 252 (100.0%) | 2.59 |
Household Size by Marriage Status in Sequoyah
Out of a total of 252 households in Sequoyah, 206 (81.8%) are family households, while 46 (18.2%) are nonfamily households. The most numerous type of family households are 2-person households, comprising 118, and the most common type of nonfamily households are 1-person households, comprising 46.
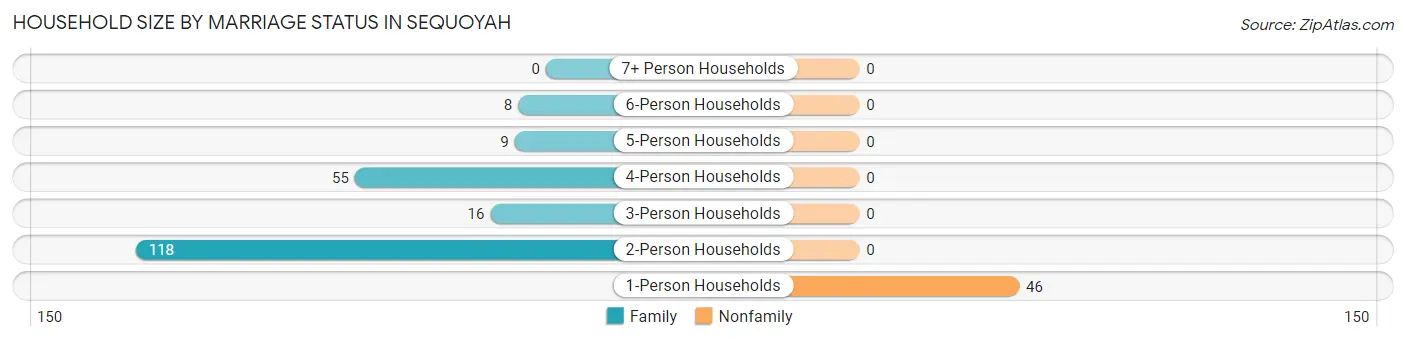
| Household Size | Family Households | Nonfamily Households |
| 1-Person Households | - | 46 (18.2%) |
| 2-Person Households | 118 (46.8%) | 0 (0.0%) |
| 3-Person Households | 16 (6.4%) | 0 (0.0%) |
| 4-Person Households | 55 (21.8%) | 0 (0.0%) |
| 5-Person Households | 9 (3.6%) | 0 (0.0%) |
| 6-Person Households | 8 (3.2%) | 0 (0.0%) |
| 7+ Person Households | 0 (0.0%) | 0 (0.0%) |
| Total | 206 (81.8%) | 46 (18.2%) |
Female Fertility in Sequoyah
Fertility by Age in Sequoyah
Average fertility rate in Sequoyah is 91.0 births per 1,000 women. Women in the age bracket of 20 to 34 years have the highest fertility rate with 161.0 births per 1,000 women. Women in the age bracket of 20 to 34 years acount for 100.0% of all women with births.
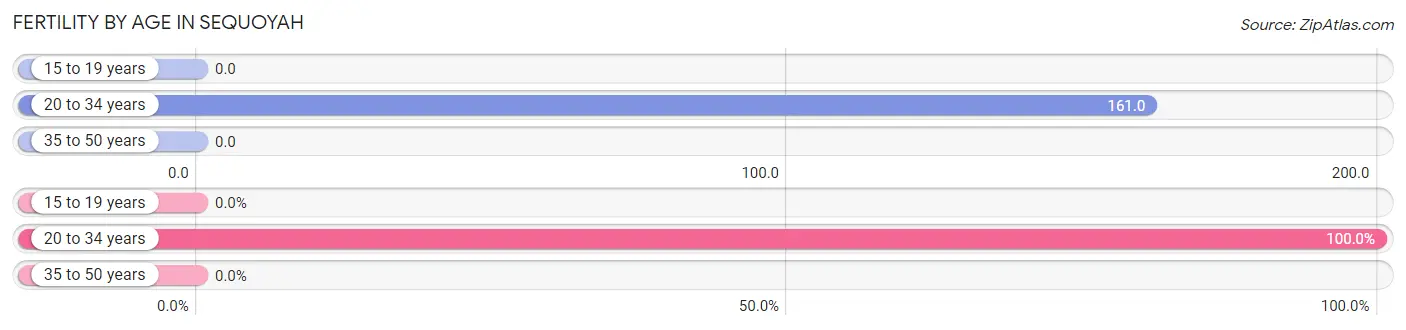
| Age Bracket | Women with Births | Births / 1,000 Women |
| 15 to 19 years | 0 (0.0%) | 0.0 |
| 20 to 34 years | 9 (100.0%) | 161.0 |
| 35 to 50 years | 0 (0.0%) | 0.0 |
| Total | 9 (100.0%) | 91.0 |
Fertility by Age by Marriage Status in Sequoyah
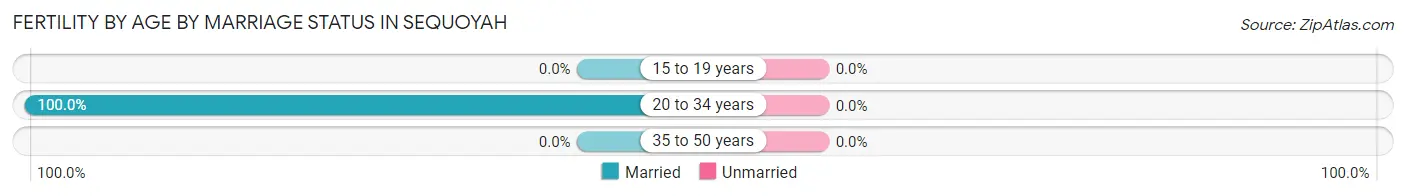
| Age Bracket | Married | Unmarried |
| 15 to 19 years | 0 (0.0%) | 0 (0.0%) |
| 20 to 34 years | 9 (100.0%) | 0 (0.0%) |
| 35 to 50 years | 0 (0.0%) | 0 (0.0%) |
| Total | 9 (100.0%) | 0 (0.0%) |
Fertility by Education in Sequoyah
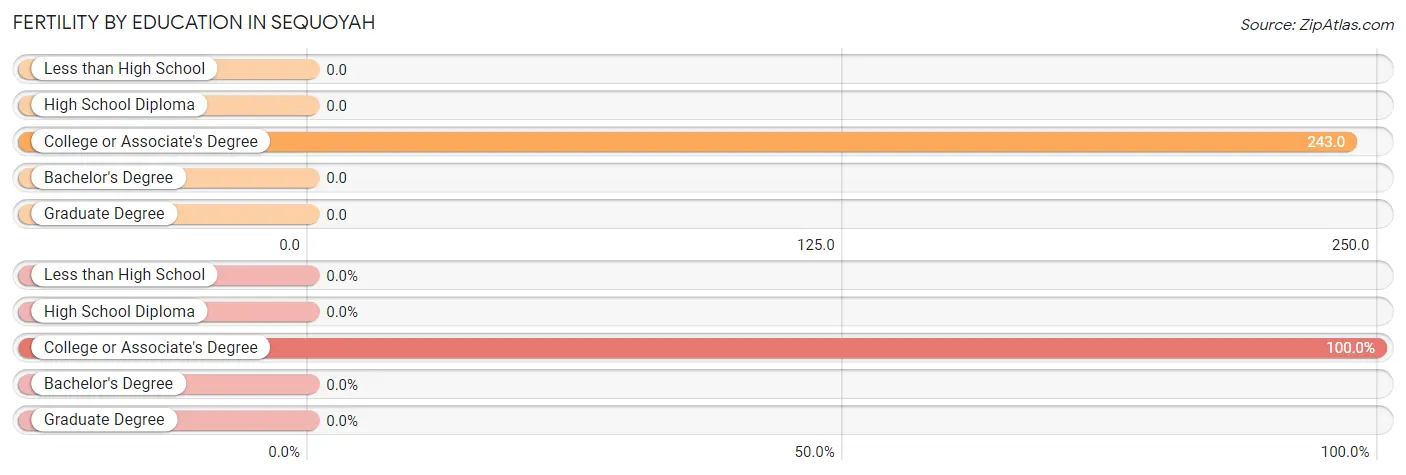
| Educational Attainment | Women with Births | Births / 1,000 Women |
| Less than High School | 0 (0.0%) | 0.0 |
| High School Diploma | 0 (0.0%) | 0.0 |
| College or Associate's Degree | 9 (100.0%) | 243.0 |
| Bachelor's Degree | 0 (0.0%) | 0.0 |
| Graduate Degree | 0 (0.0%) | 0.0 |
| Total | 9 (100.0%) | 91.0 |
Fertility by Education by Marriage Status in Sequoyah
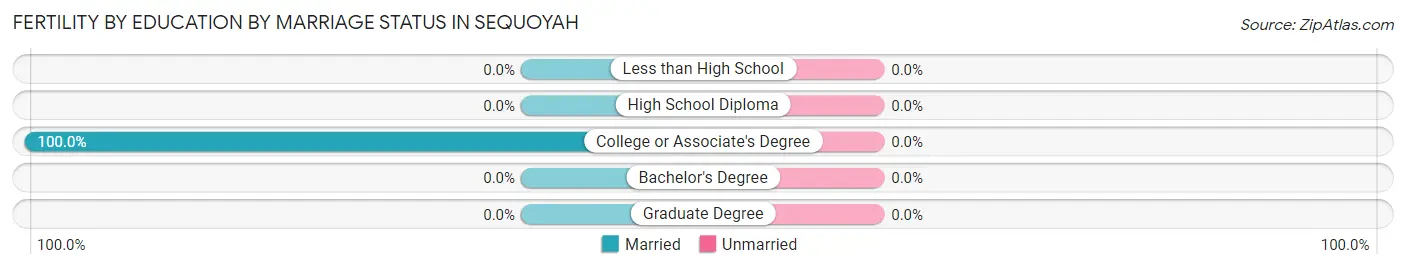
| Educational Attainment | Married | Unmarried |
| Less than High School | 0 (0.0%) | 0 (0.0%) |
| High School Diploma | 0 (0.0%) | 0 (0.0%) |
| College or Associate's Degree | 9 (100.0%) | 0 (0.0%) |
| Bachelor's Degree | 0 (0.0%) | 0 (0.0%) |
| Graduate Degree | 0 (0.0%) | 0 (0.0%) |
| Total | 9 (100.0%) | 0 (0.0%) |
Employment Characteristics in Sequoyah
Employment by Class of Employer in Sequoyah
Among the 343 employed individuals in Sequoyah, private company employees (206 | 60.1%), state government employees (74 | 21.6%), and self-employed (not incorporated) (46 | 13.4%) make up the most common classes of employment.
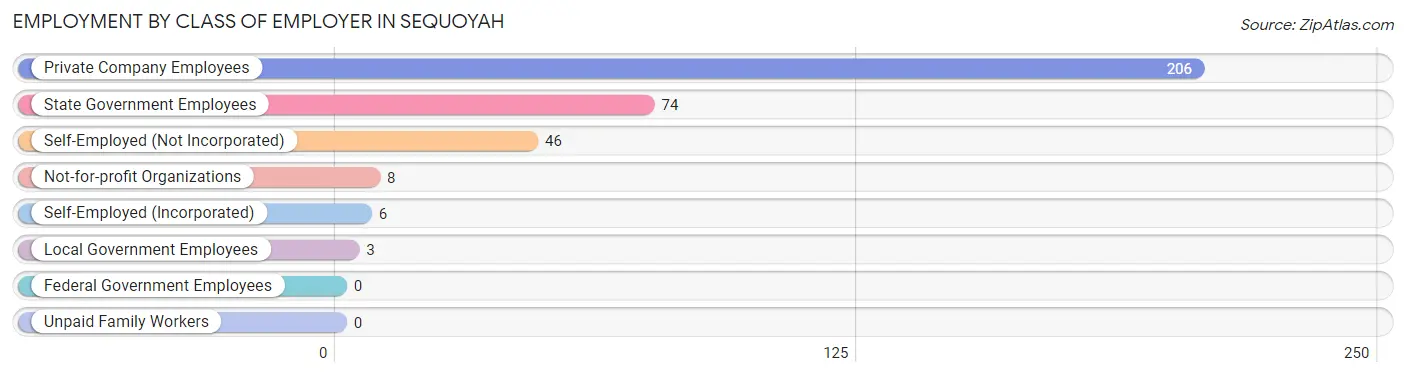
| Employer Class | # Employees | % Employees |
| Private Company Employees | 206 | 60.1% |
| Self-Employed (Incorporated) | 6 | 1.8% |
| Self-Employed (Not Incorporated) | 46 | 13.4% |
| Not-for-profit Organizations | 8 | 2.3% |
| Local Government Employees | 3 | 0.9% |
| State Government Employees | 74 | 21.6% |
| Federal Government Employees | 0 | 0.0% |
| Unpaid Family Workers | 0 | 0.0% |
| Total | 343 | 100.0% |
Employment Status by Age in Sequoyah
According to the labor force statistics for Sequoyah, out of the total population over 16 years of age (515), 71.7% or 369 individuals are in the labor force, with 4.6% or 17 of them unemployed. The age group with the highest labor force participation rate is 20 to 24 years, with 100.0% or 12 individuals in the labor force. Within the labor force, the 45 to 54 years age range has the highest percentage of unemployed individuals, with 10.0% or 17 of them being unemployed.
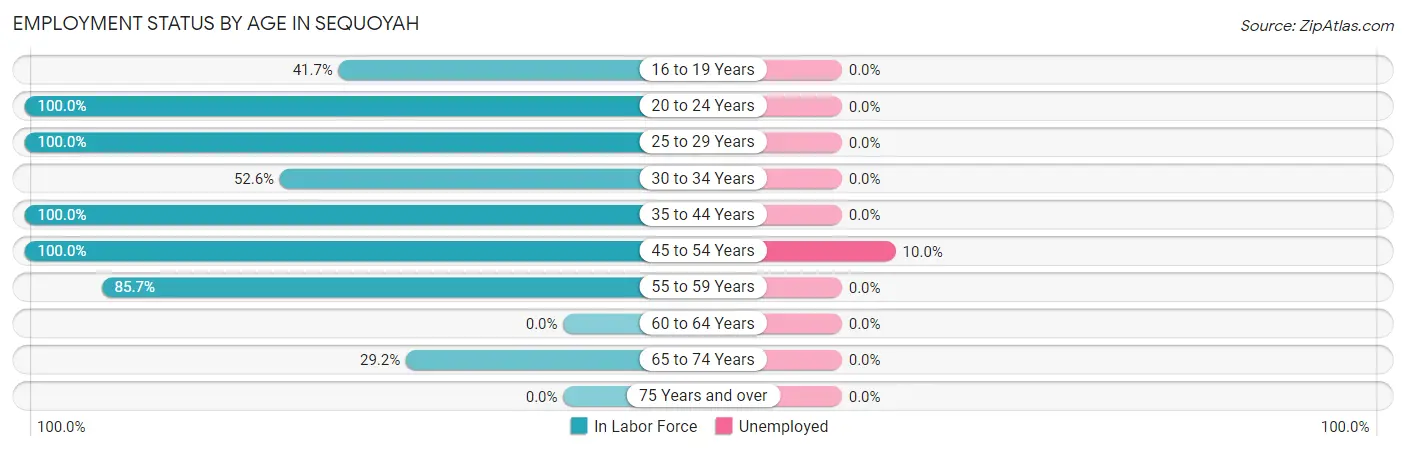
| Age Bracket | In Labor Force | Unemployed |
| 16 to 19 Years | 10 (41.7%) | 0 (0.0%) |
| 20 to 24 Years | 12 (100.0%) | 0 (0.0%) |
| 25 to 29 Years | 25 (100.0%) | 0 (0.0%) |
| 30 to 34 Years | 20 (52.6%) | 0 (0.0%) |
| 35 to 44 Years | 74 (100.0%) | 0 (0.0%) |
| 45 to 54 Years | 170 (100.0%) | 17 (10.0%) |
| 55 to 59 Years | 30 (85.7%) | 0 (0.0%) |
| 60 to 64 Years | 0 (0.0%) | 0 (0.0%) |
| 65 to 74 Years | 28 (29.2%) | 0 (0.0%) |
| 75 Years and over | 0 (0.0%) | 0 (0.0%) |
| Total | 369 (71.7%) | 17 (4.6%) |
Employment Status by Educational Attainment in Sequoyah
According to labor force statistics for Sequoyah, 91.4% of individuals (319) out of the total population between 25 and 64 years of age (349) are in the labor force, with 5.3% or 17 of them being unemployed. The group with the highest labor force participation rate are those with the educational attainment of less than high school, with 100.0% or 9 individuals in the labor force. Within the labor force, individuals with high school diploma education have the highest percentage of unemployment, with 16.7% or 17 of them being unemployed.
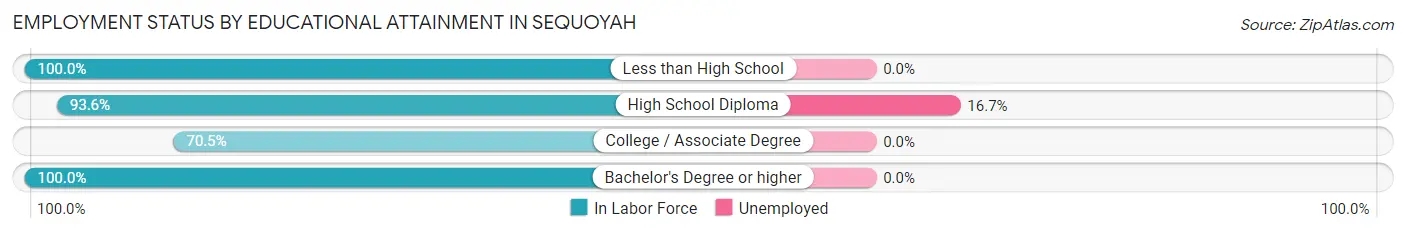
| Educational Attainment | In Labor Force | Unemployed |
| Less than High School | 9 (100.0%) | 0 (0.0%) |
| High School Diploma | 102 (93.6%) | 18 (16.7%) |
| College / Associate Degree | 55 (70.5%) | 0 (0.0%) |
| Bachelor's Degree or higher | 153 (100.0%) | 0 (0.0%) |
| Total | 319 (91.4%) | 18 (5.3%) |
Employment Occupations by Sex in Sequoyah
Management, Business, Science and Arts Occupations
The most common Management, Business, Science and Arts occupations in Sequoyah are Community & Social Service (77 | 21.9%), Education Instruction & Library (77 | 21.9%), Business & Financial (62 | 17.6%), Health Diagnosing & Treating (17 | 4.8%), and Management (15 | 4.3%).
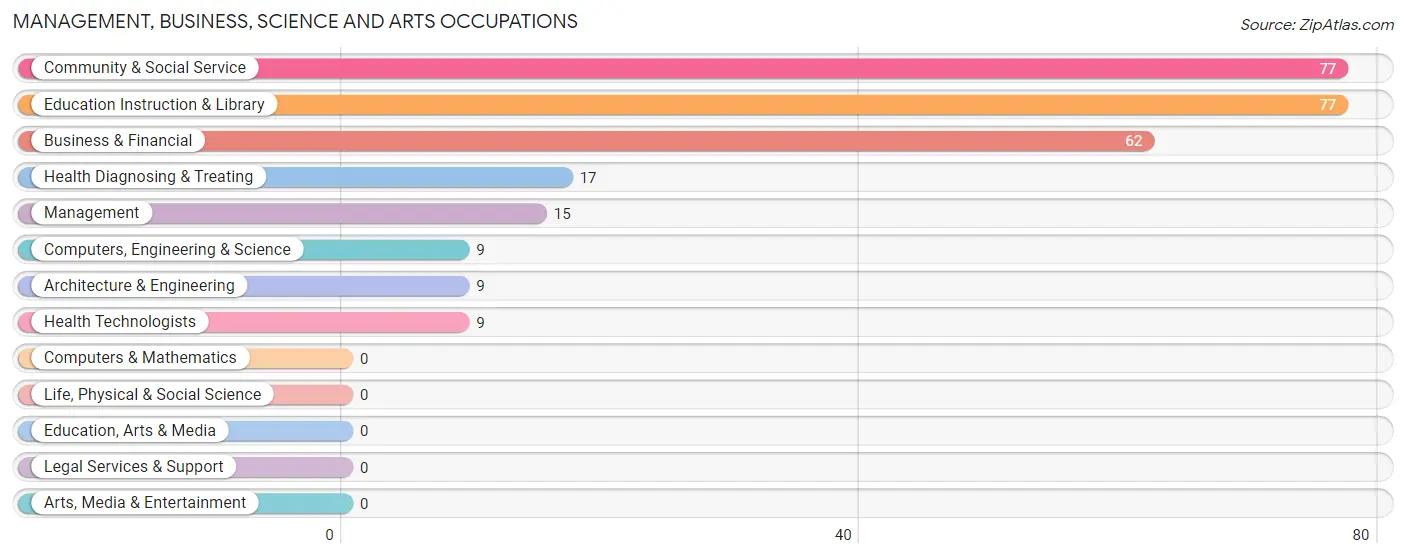
Management, Business, Science and Arts Occupations by Sex
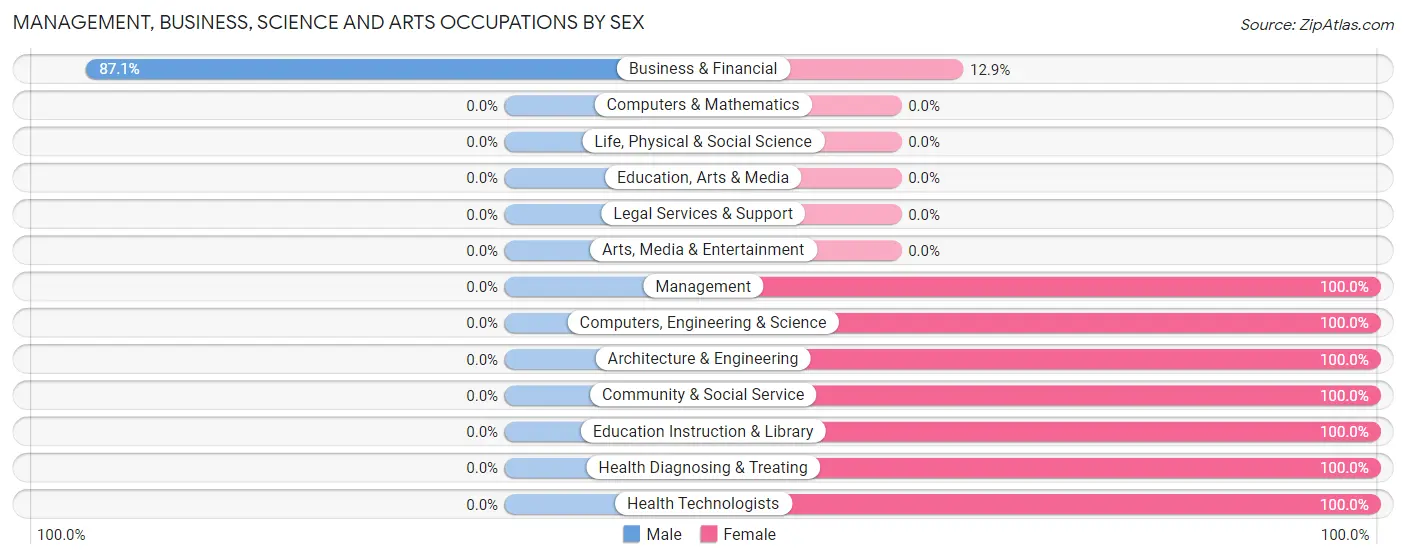
| Occupation | Male | Female |
| Management | 0 (0.0%) | 15 (100.0%) |
| Business & Financial | 54 (87.1%) | 8 (12.9%) |
| Computers, Engineering & Science | 0 (0.0%) | 9 (100.0%) |
| Computers & Mathematics | 0 (0.0%) | 0 (0.0%) |
| Architecture & Engineering | 0 (0.0%) | 9 (100.0%) |
| Life, Physical & Social Science | 0 (0.0%) | 0 (0.0%) |
| Community & Social Service | 0 (0.0%) | 77 (100.0%) |
| Education, Arts & Media | 0 (0.0%) | 0 (0.0%) |
| Legal Services & Support | 0 (0.0%) | 0 (0.0%) |
| Education Instruction & Library | 0 (0.0%) | 77 (100.0%) |
| Arts, Media & Entertainment | 0 (0.0%) | 0 (0.0%) |
| Health Diagnosing & Treating | 0 (0.0%) | 17 (100.0%) |
| Health Technologists | 0 (0.0%) | 9 (100.0%) |
| Total (Category) | 54 (30.0%) | 126 (70.0%) |
| Total (Overall) | 161 (45.7%) | 191 (54.3%) |
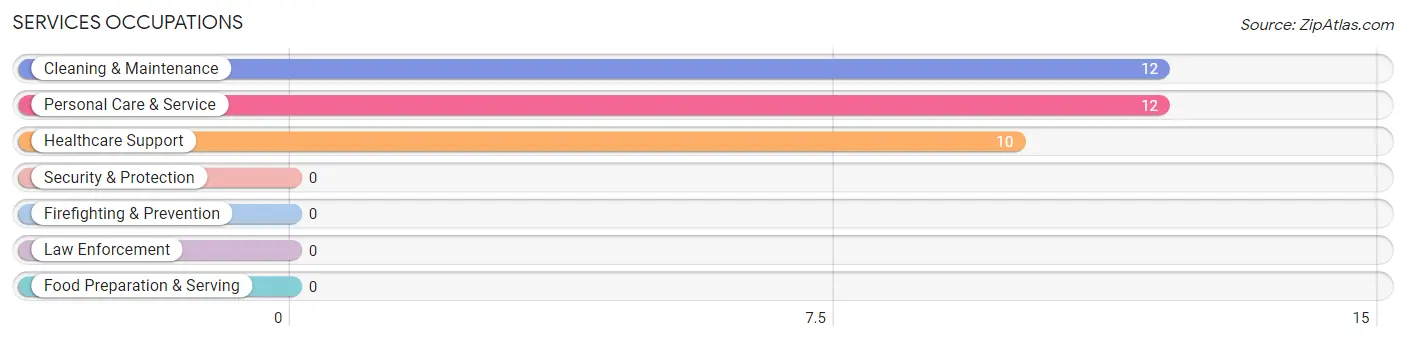
Services Occupations
The most common Services occupations in Sequoyah are Cleaning & Maintenance (12 | 3.4%), Personal Care & Service (12 | 3.4%), and Healthcare Support (10 | 2.8%).
Services Occupations by Sex
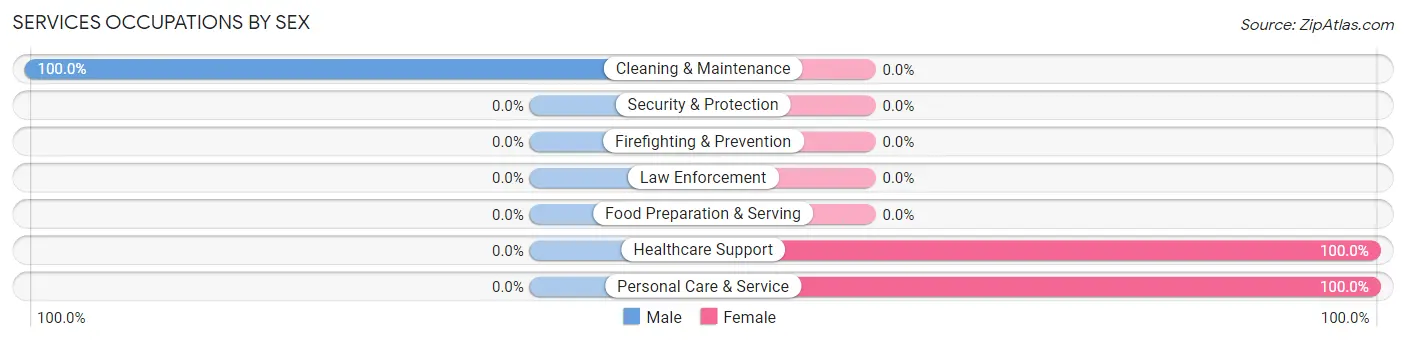
| Occupation | Male | Female |
| Healthcare Support | 0 (0.0%) | 10 (100.0%) |
| Security & Protection | 0 (0.0%) | 0 (0.0%) |
| Firefighting & Prevention | 0 (0.0%) | 0 (0.0%) |
| Law Enforcement | 0 (0.0%) | 0 (0.0%) |
| Food Preparation & Serving | 0 (0.0%) | 0 (0.0%) |
| Cleaning & Maintenance | 12 (100.0%) | 0 (0.0%) |
| Personal Care & Service | 0 (0.0%) | 12 (100.0%) |
| Total (Category) | 12 (35.3%) | 22 (64.7%) |
| Total (Overall) | 161 (45.7%) | 191 (54.3%) |
Sales and Office Occupations
The most common Sales and Office occupations in Sequoyah are Sales & Related (41 | 11.7%), and Office & Administration (11 | 3.1%).
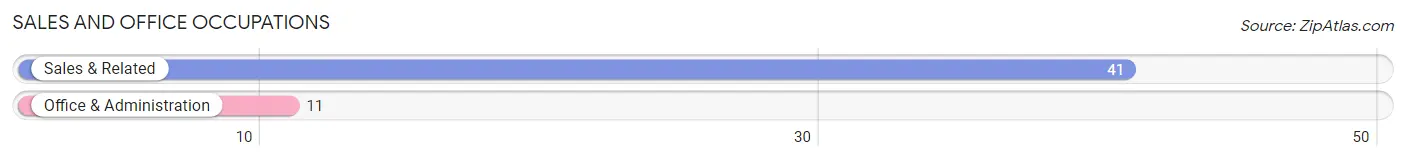
Sales and Office Occupations by Sex
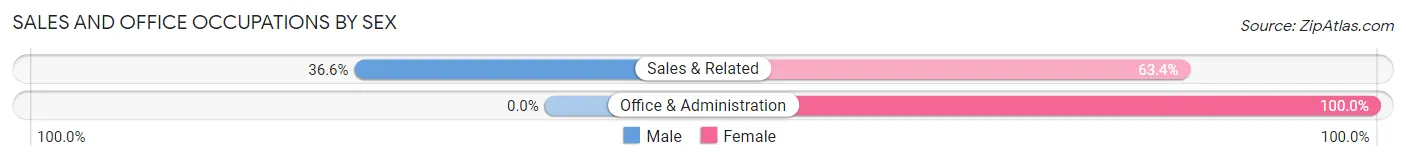
| Occupation | Male | Female |
| Sales & Related | 15 (36.6%) | 26 (63.4%) |
| Office & Administration | 0 (0.0%) | 11 (100.0%) |
| Total (Category) | 15 (28.8%) | 37 (71.2%) |
| Total (Overall) | 161 (45.7%) | 191 (54.3%) |
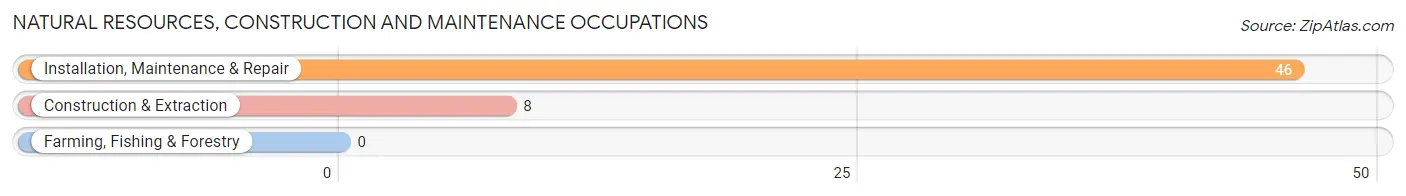
Natural Resources, Construction and Maintenance Occupations
The most common Natural Resources, Construction and Maintenance occupations in Sequoyah are Installation, Maintenance & Repair (46 | 13.1%), and Construction & Extraction (8 | 2.3%).
Natural Resources, Construction and Maintenance Occupations by Sex
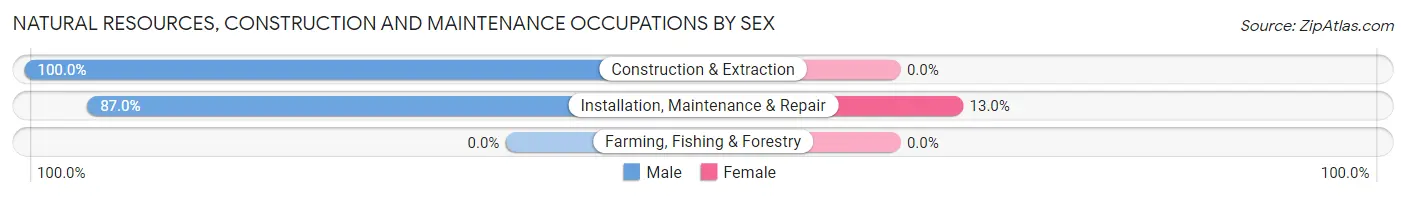
| Occupation | Male | Female |
| Farming, Fishing & Forestry | 0 (0.0%) | 0 (0.0%) |
| Construction & Extraction | 8 (100.0%) | 0 (0.0%) |
| Installation, Maintenance & Repair | 40 (87.0%) | 6 (13.0%) |
| Total (Category) | 48 (88.9%) | 6 (11.1%) |
| Total (Overall) | 161 (45.7%) | 191 (54.3%) |
Production, Transportation and Moving Occupations
The most common Production, Transportation and Moving occupations in Sequoyah are Production (25 | 7.1%), and Material Moving (7 | 2.0%).
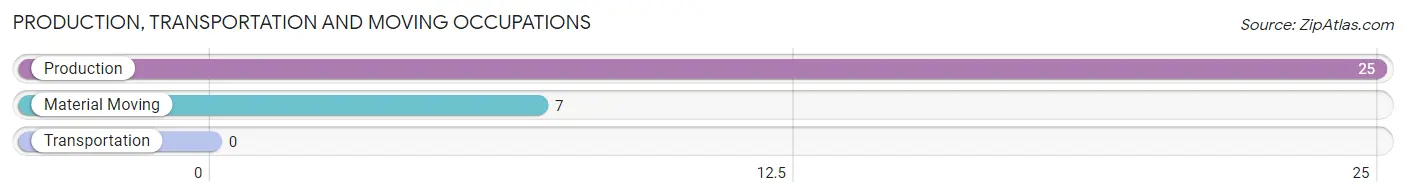
Production, Transportation and Moving Occupations by Sex
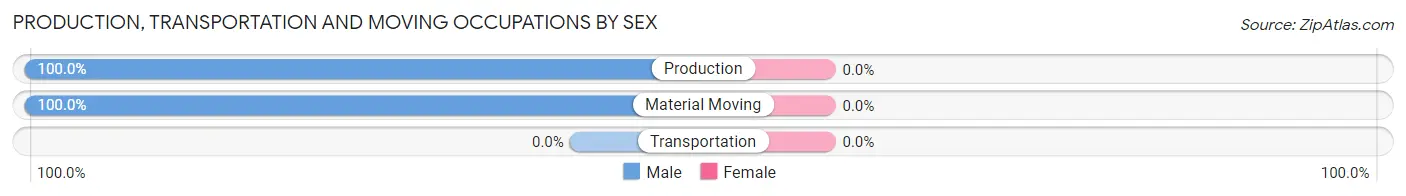
| Occupation | Male | Female |
| Production | 25 (100.0%) | 0 (0.0%) |
| Transportation | 0 (0.0%) | 0 (0.0%) |
| Material Moving | 7 (100.0%) | 0 (0.0%) |
| Total (Category) | 32 (100.0%) | 0 (0.0%) |
| Total (Overall) | 161 (45.7%) | 191 (54.3%) |
Employment Industries by Sex in Sequoyah
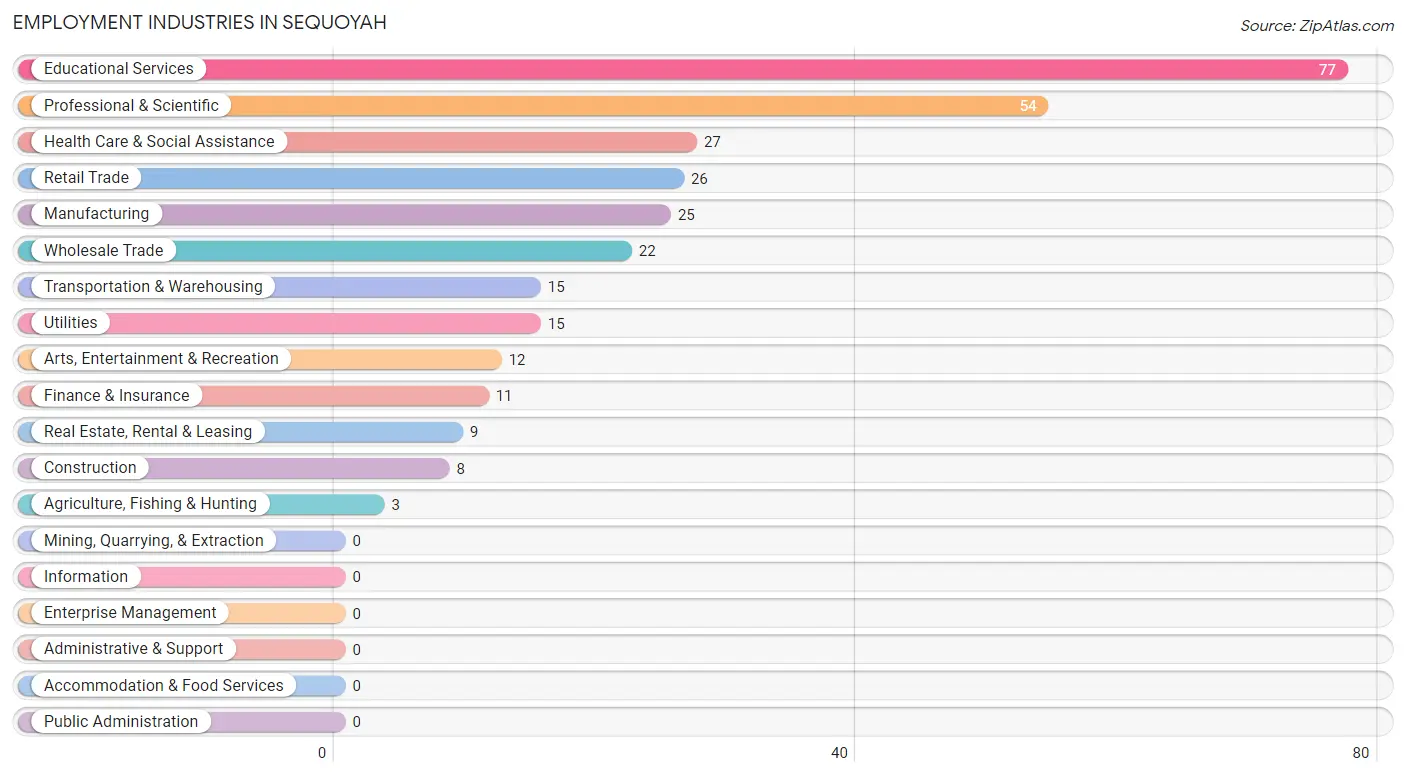
Employment Industries in Sequoyah
The major employment industries in Sequoyah include Educational Services (77 | 21.9%), Professional & Scientific (54 | 15.3%), Health Care & Social Assistance (27 | 7.7%), Retail Trade (26 | 7.4%), and Manufacturing (25 | 7.1%).
Employment Industries by Sex in Sequoyah
The Sequoyah industries that see more men than women are Agriculture, Fishing & Hunting (100.0%), Construction (100.0%), and Manufacturing (100.0%), whereas the industries that tend to have a higher number of women are Wholesale Trade (100.0%), Finance & Insurance (100.0%), and Real Estate, Rental & Leasing (100.0%).
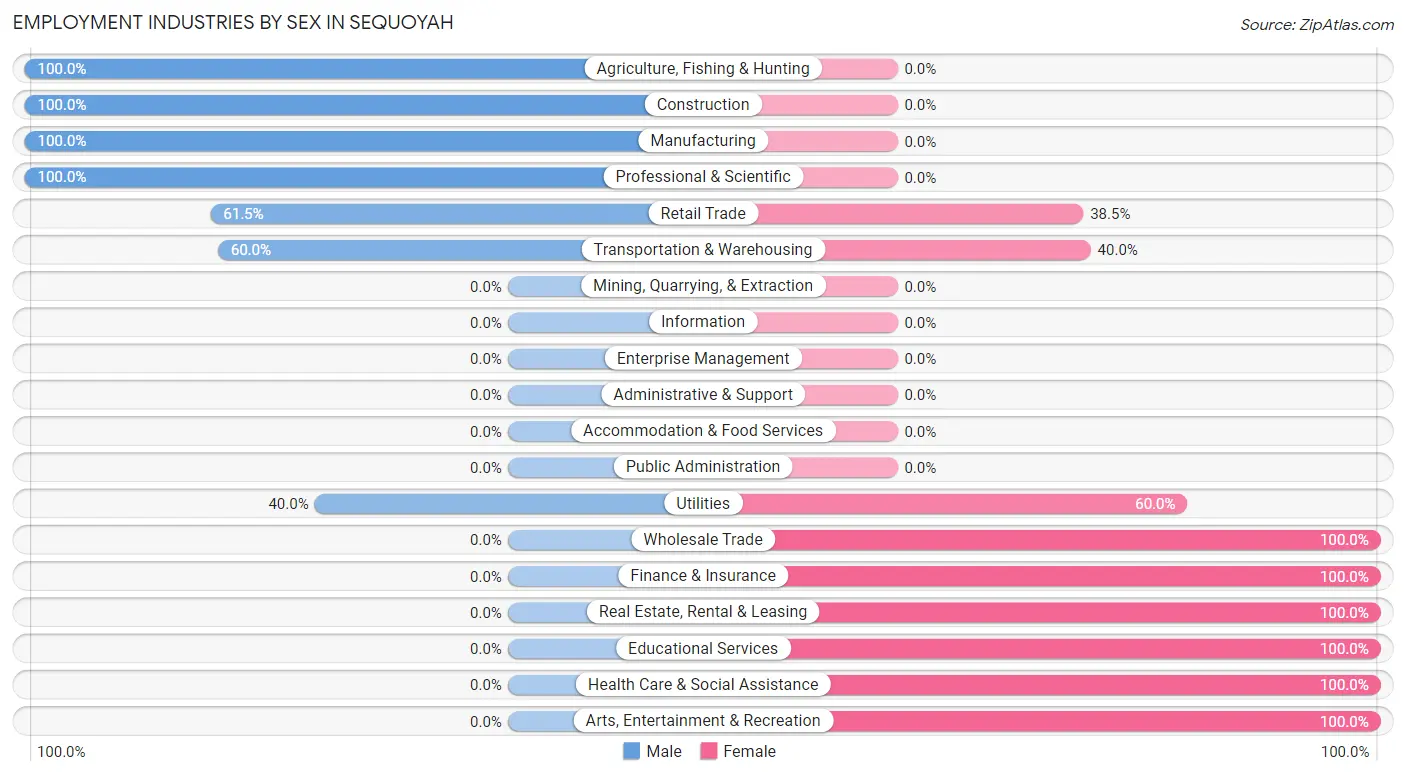
| Industry | Male | Female |
| Agriculture, Fishing & Hunting | 3 (100.0%) | 0 (0.0%) |
| Mining, Quarrying, & Extraction | 0 (0.0%) | 0 (0.0%) |
| Construction | 8 (100.0%) | 0 (0.0%) |
| Manufacturing | 25 (100.0%) | 0 (0.0%) |
| Wholesale Trade | 0 (0.0%) | 22 (100.0%) |
| Retail Trade | 16 (61.5%) | 10 (38.5%) |
| Transportation & Warehousing | 9 (60.0%) | 6 (40.0%) |
| Utilities | 6 (40.0%) | 9 (60.0%) |
| Information | 0 (0.0%) | 0 (0.0%) |
| Finance & Insurance | 0 (0.0%) | 11 (100.0%) |
| Real Estate, Rental & Leasing | 0 (0.0%) | 9 (100.0%) |
| Professional & Scientific | 54 (100.0%) | 0 (0.0%) |
| Enterprise Management | 0 (0.0%) | 0 (0.0%) |
| Administrative & Support | 0 (0.0%) | 0 (0.0%) |
| Educational Services | 0 (0.0%) | 77 (100.0%) |
| Health Care & Social Assistance | 0 (0.0%) | 27 (100.0%) |
| Arts, Entertainment & Recreation | 0 (0.0%) | 12 (100.0%) |
| Accommodation & Food Services | 0 (0.0%) | 0 (0.0%) |
| Public Administration | 0 (0.0%) | 0 (0.0%) |
| Total | 161 (45.7%) | 191 (54.3%) |
Education in Sequoyah
School Enrollment in Sequoyah
The most common levels of schooling among the 142 students in Sequoyah are middle school (42 | 29.6%), high school (39 | 27.5%), and kindergarten (22 | 15.5%).
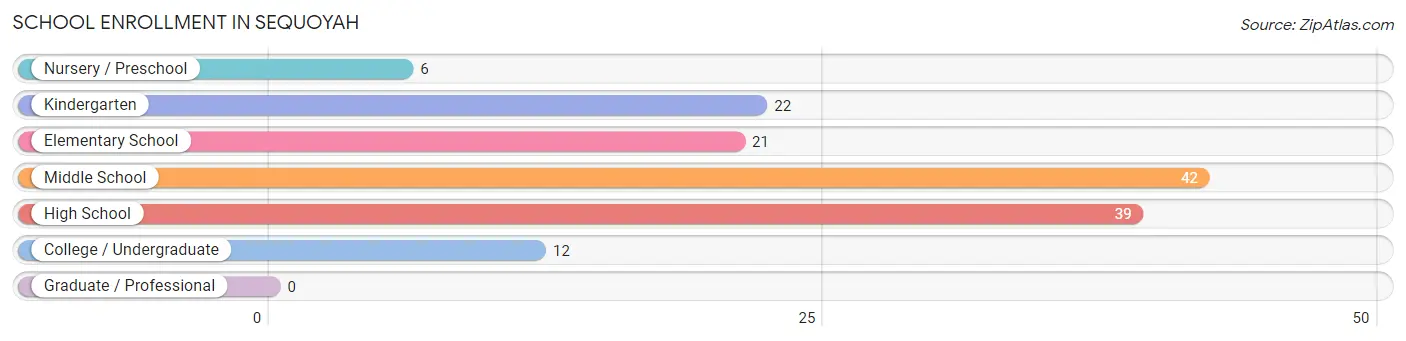
| School Level | # Students | % Students |
| Nursery / Preschool | 6 | 4.2% |
| Kindergarten | 22 | 15.5% |
| Elementary School | 21 | 14.8% |
| Middle School | 42 | 29.6% |
| High School | 39 | 27.5% |
| College / Undergraduate | 12 | 8.5% |
| Graduate / Professional | 0 | 0.0% |
| Total | 142 | 100.0% |
School Enrollment by Age by Funding Source in Sequoyah
Out of a total of 142 students who are enrolled in schools in Sequoyah, 37 (26.1%) attend a private institution, while the remaining 105 (73.9%) are enrolled in public schools. The age group of 3 to 4 year olds has the highest likelihood of being enrolled in private schools, with 6 (100.0% in the age bracket) enrolled. Conversely, the age group of 10 to 14 year olds has the lowest likelihood of being enrolled in a private school, with 42 (100.0% in the age bracket) attending a public institution.
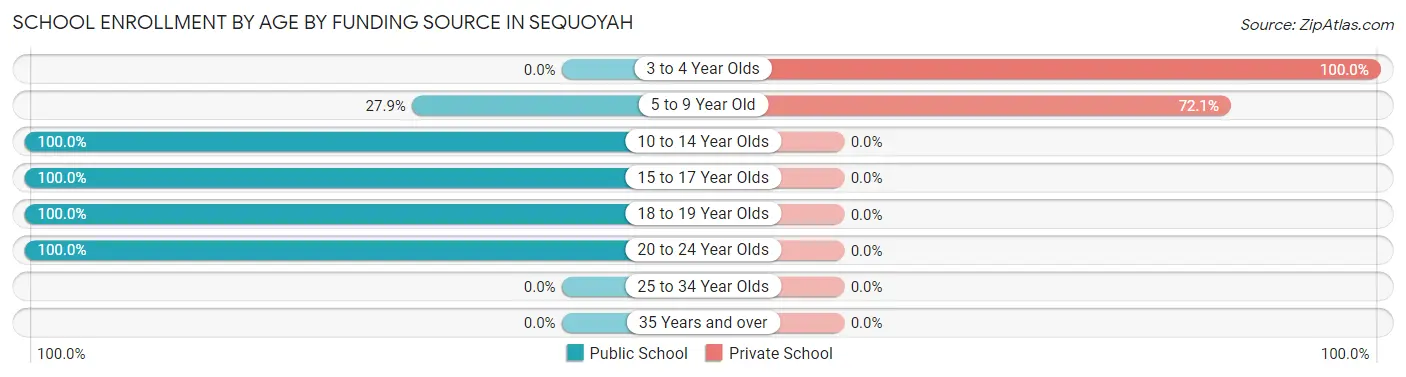
| Age Bracket | Public School | Private School |
| 3 to 4 Year Olds | 0 (0.0%) | 6 (100.0%) |
| 5 to 9 Year Old | 12 (27.9%) | 31 (72.1%) |
| 10 to 14 Year Olds | 42 (100.0%) | 0 (0.0%) |
| 15 to 17 Year Olds | 29 (100.0%) | 0 (0.0%) |
| 18 to 19 Year Olds | 10 (100.0%) | 0 (0.0%) |
| 20 to 24 Year Olds | 12 (100.0%) | 0 (0.0%) |
| 25 to 34 Year Olds | 0 (0.0%) | 0 (0.0%) |
| 35 Years and over | 0 (0.0%) | 0 (0.0%) |
| Total | 105 (73.9%) | 37 (26.1%) |
Educational Attainment by Field of Study in Sequoyah
Physical & health sciences (78 | 38.1%), education (74 | 36.1%), psychology (18 | 8.8%), business (17 | 8.3%), and social sciences (8 | 3.9%) are the most common fields of study among 205 individuals in Sequoyah who have obtained a bachelor's degree or higher.
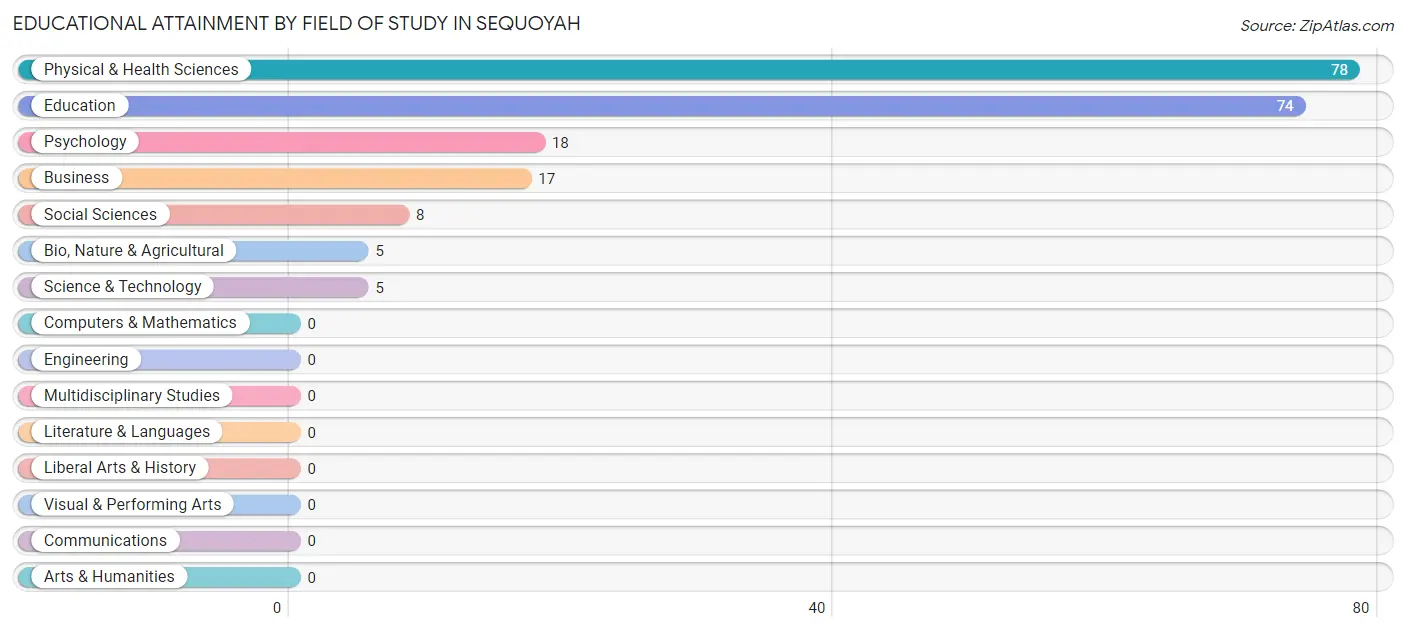
| Field of Study | # Graduates | % Graduates |
| Computers & Mathematics | 0 | 0.0% |
| Bio, Nature & Agricultural | 5 | 2.4% |
| Physical & Health Sciences | 78 | 38.1% |
| Psychology | 18 | 8.8% |
| Social Sciences | 8 | 3.9% |
| Engineering | 0 | 0.0% |
| Multidisciplinary Studies | 0 | 0.0% |
| Science & Technology | 5 | 2.4% |
| Business | 17 | 8.3% |
| Education | 74 | 36.1% |
| Literature & Languages | 0 | 0.0% |
| Liberal Arts & History | 0 | 0.0% |
| Visual & Performing Arts | 0 | 0.0% |
| Communications | 0 | 0.0% |
| Arts & Humanities | 0 | 0.0% |
| Total | 205 | 100.0% |
Transportation & Commute in Sequoyah
Vehicle Availability by Sex in Sequoyah
The most prevalent vehicle ownership categories in Sequoyah are males with 3 vehicles (100, accounting for 65.8%) and females with 3 vehicles (110, making up 52.4%).
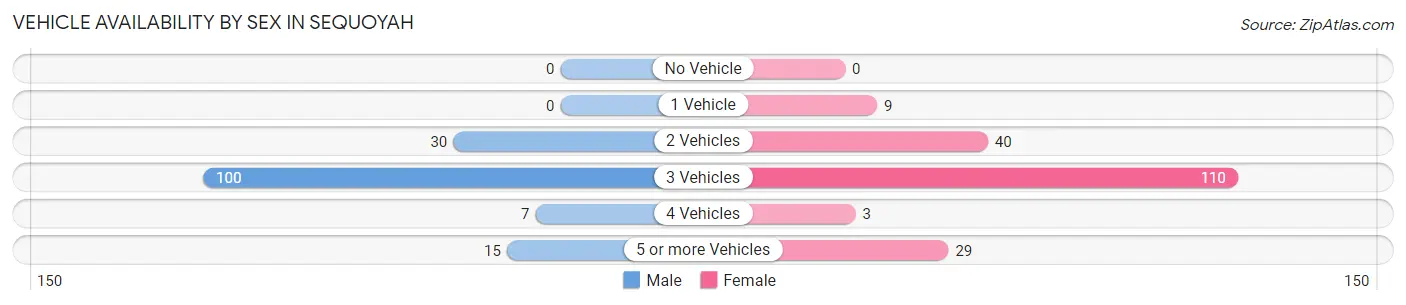
| Vehicles Available | Male | Female |
| No Vehicle | 0 (0.0%) | 0 (0.0%) |
| 1 Vehicle | 0 (0.0%) | 9 (4.7%) |
| 2 Vehicles | 30 (19.7%) | 40 (20.9%) |
| 3 Vehicles | 100 (65.8%) | 110 (57.6%) |
| 4 Vehicles | 7 (4.6%) | 3 (1.6%) |
| 5 or more Vehicles | 15 (9.9%) | 29 (15.2%) |
| Total | 152 (100.0%) | 191 (100.0%) |
Commute Time in Sequoyah
The most frequently occuring commute durations in Sequoyah are 30 to 34 minutes (93 commuters, 27.1%), 45 to 59 minutes (66 commuters, 19.2%), and 15 to 19 minutes (41 commuters, 11.9%).
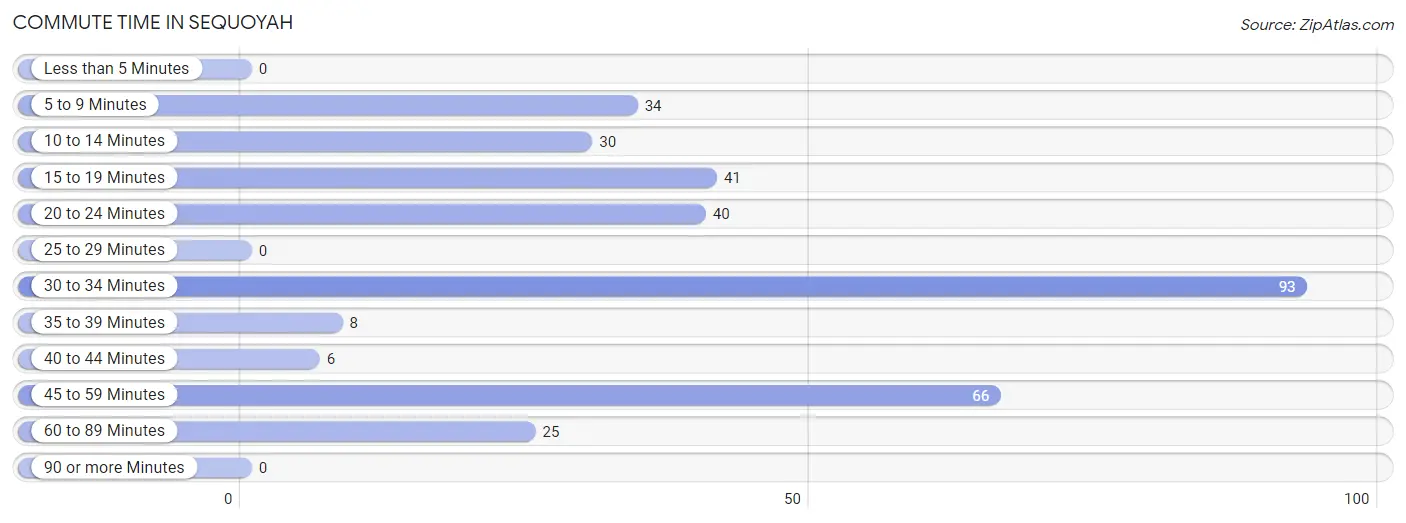
| Commute Time | # Commuters | % Commuters |
| Less than 5 Minutes | 0 | 0.0% |
| 5 to 9 Minutes | 34 | 9.9% |
| 10 to 14 Minutes | 30 | 8.7% |
| 15 to 19 Minutes | 41 | 11.9% |
| 20 to 24 Minutes | 40 | 11.7% |
| 25 to 29 Minutes | 0 | 0.0% |
| 30 to 34 Minutes | 93 | 27.1% |
| 35 to 39 Minutes | 8 | 2.3% |
| 40 to 44 Minutes | 6 | 1.8% |
| 45 to 59 Minutes | 66 | 19.2% |
| 60 to 89 Minutes | 25 | 7.3% |
| 90 or more Minutes | 0 | 0.0% |
Commute Time by Sex in Sequoyah
The most common commute times in Sequoyah are 45 to 59 minutes (66 commuters, 43.4%) for males and 30 to 34 minutes (87 commuters, 45.6%) for females.
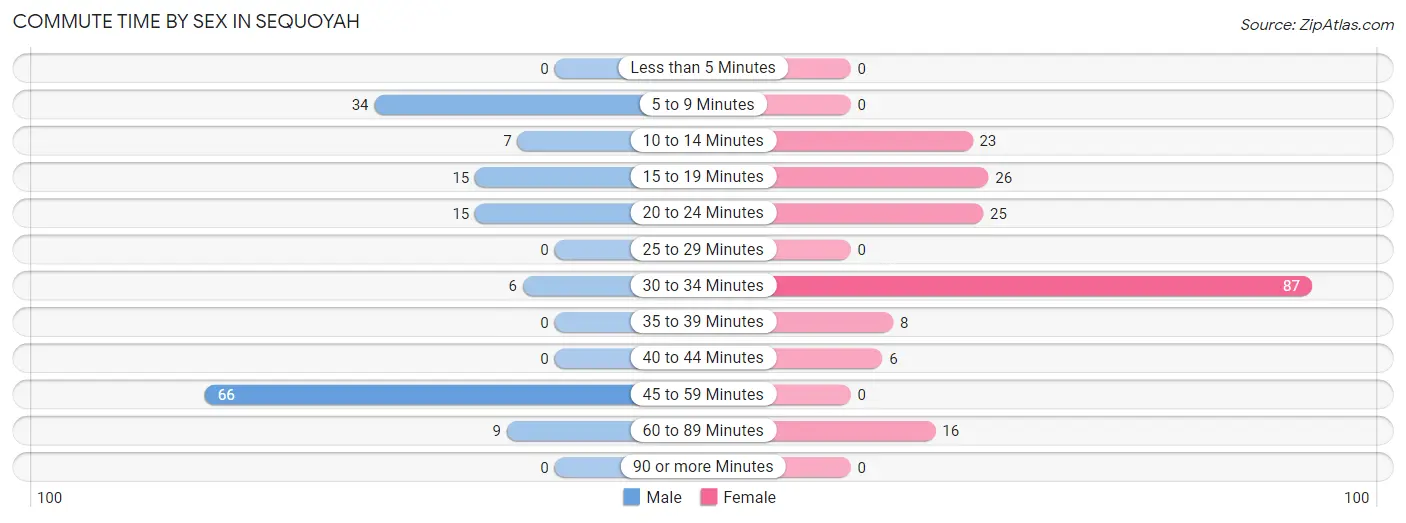
| Commute Time | Male | Female |
| Less than 5 Minutes | 0 (0.0%) | 0 (0.0%) |
| 5 to 9 Minutes | 34 (22.4%) | 0 (0.0%) |
| 10 to 14 Minutes | 7 (4.6%) | 23 (12.0%) |
| 15 to 19 Minutes | 15 (9.9%) | 26 (13.6%) |
| 20 to 24 Minutes | 15 (9.9%) | 25 (13.1%) |
| 25 to 29 Minutes | 0 (0.0%) | 0 (0.0%) |
| 30 to 34 Minutes | 6 (4.0%) | 87 (45.6%) |
| 35 to 39 Minutes | 0 (0.0%) | 8 (4.2%) |
| 40 to 44 Minutes | 0 (0.0%) | 6 (3.1%) |
| 45 to 59 Minutes | 66 (43.4%) | 0 (0.0%) |
| 60 to 89 Minutes | 9 (5.9%) | 16 (8.4%) |
| 90 or more Minutes | 0 (0.0%) | 0 (0.0%) |
Time of Departure to Work by Sex in Sequoyah
The most frequent times of departure to work in Sequoyah are 6:30 AM to 6:59 AM (66, 43.4%) for males and 7:00 AM to 7:29 AM (77, 40.3%) for females.
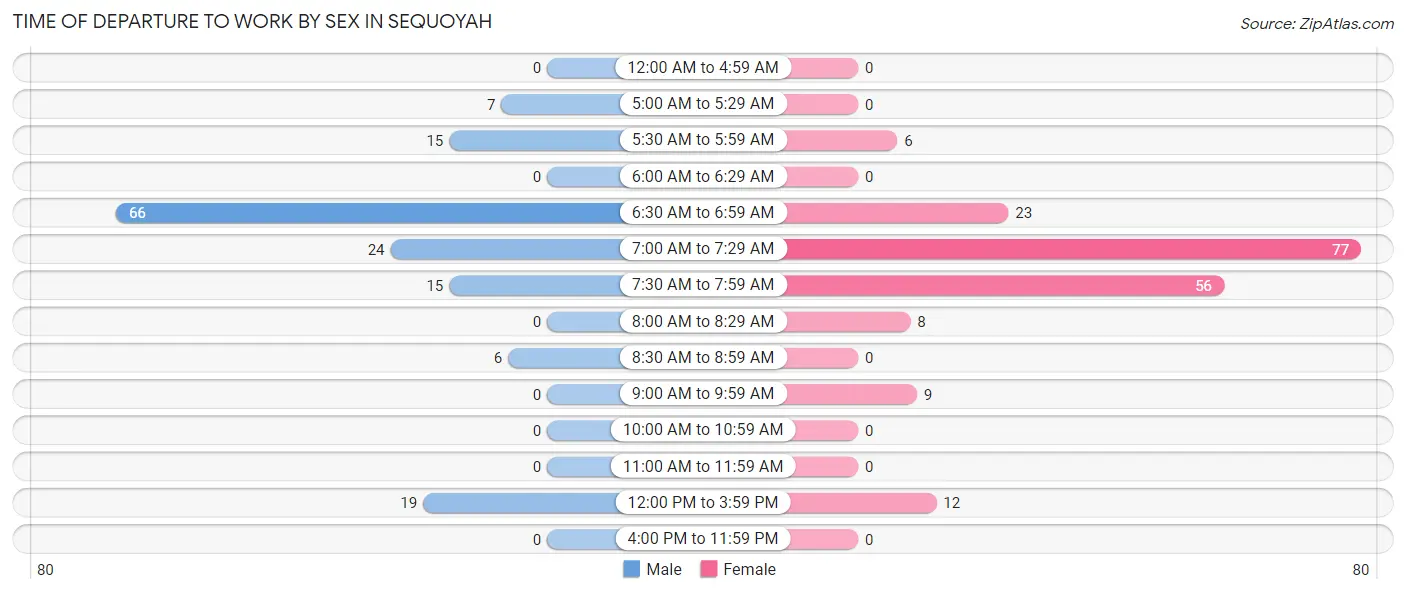
| Time of Departure | Male | Female |
| 12:00 AM to 4:59 AM | 0 (0.0%) | 0 (0.0%) |
| 5:00 AM to 5:29 AM | 7 (4.6%) | 0 (0.0%) |
| 5:30 AM to 5:59 AM | 15 (9.9%) | 6 (3.1%) |
| 6:00 AM to 6:29 AM | 0 (0.0%) | 0 (0.0%) |
| 6:30 AM to 6:59 AM | 66 (43.4%) | 23 (12.0%) |
| 7:00 AM to 7:29 AM | 24 (15.8%) | 77 (40.3%) |
| 7:30 AM to 7:59 AM | 15 (9.9%) | 56 (29.3%) |
| 8:00 AM to 8:29 AM | 0 (0.0%) | 8 (4.2%) |
| 8:30 AM to 8:59 AM | 6 (4.0%) | 0 (0.0%) |
| 9:00 AM to 9:59 AM | 0 (0.0%) | 9 (4.7%) |
| 10:00 AM to 10:59 AM | 0 (0.0%) | 0 (0.0%) |
| 11:00 AM to 11:59 AM | 0 (0.0%) | 0 (0.0%) |
| 12:00 PM to 3:59 PM | 19 (12.5%) | 12 (6.3%) |
| 4:00 PM to 11:59 PM | 0 (0.0%) | 0 (0.0%) |
| Total | 152 (100.0%) | 191 (100.0%) |
Housing Occupancy in Sequoyah
Occupancy by Ownership in Sequoyah
Of the total 252 dwellings in Sequoyah, owner-occupied units account for 243 (96.4%), while renter-occupied units make up 9 (3.6%).
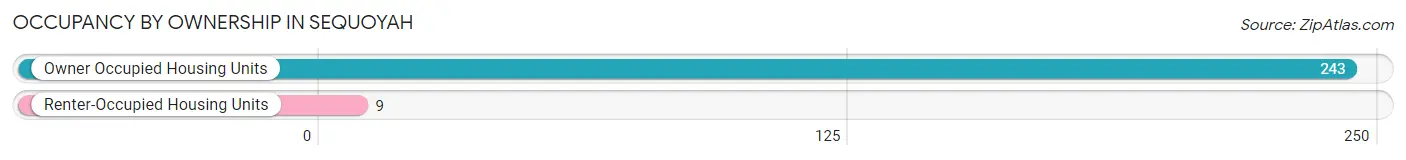
| Occupancy | # Housing Units | % Housing Units |
| Owner Occupied Housing Units | 243 | 96.4% |
| Renter-Occupied Housing Units | 9 | 3.6% |
| Total Occupied Housing Units | 252 | 100.0% |
Occupancy by Household Size in Sequoyah
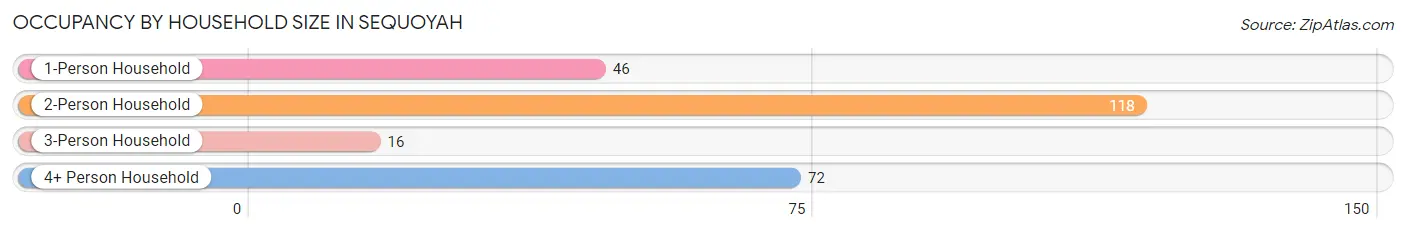
| Household Size | # Housing Units | % Housing Units |
| 1-Person Household | 46 | 18.2% |
| 2-Person Household | 118 | 46.8% |
| 3-Person Household | 16 | 6.4% |
| 4+ Person Household | 72 | 28.6% |
| Total Housing Units | 252 | 100.0% |
Occupancy by Ownership by Household Size in Sequoyah
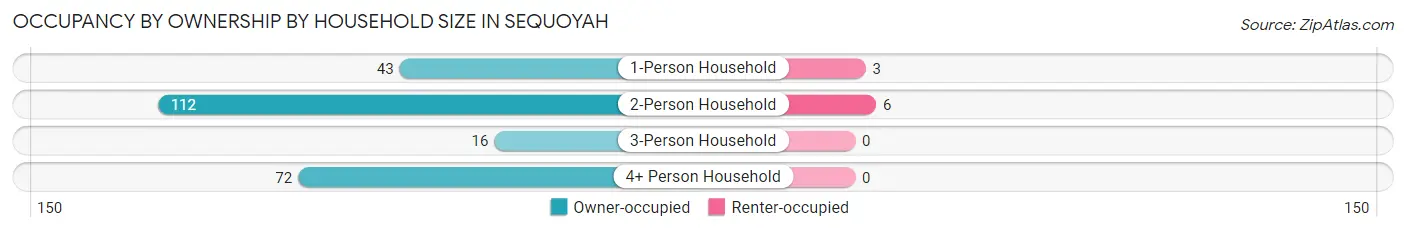
| Household Size | Owner-occupied | Renter-occupied |
| 1-Person Household | 43 (93.5%) | 3 (6.5%) |
| 2-Person Household | 112 (94.9%) | 6 (5.1%) |
| 3-Person Household | 16 (100.0%) | 0 (0.0%) |
| 4+ Person Household | 72 (100.0%) | 0 (0.0%) |
| Total Housing Units | 243 (96.4%) | 9 (3.6%) |
Occupancy by Educational Attainment in Sequoyah
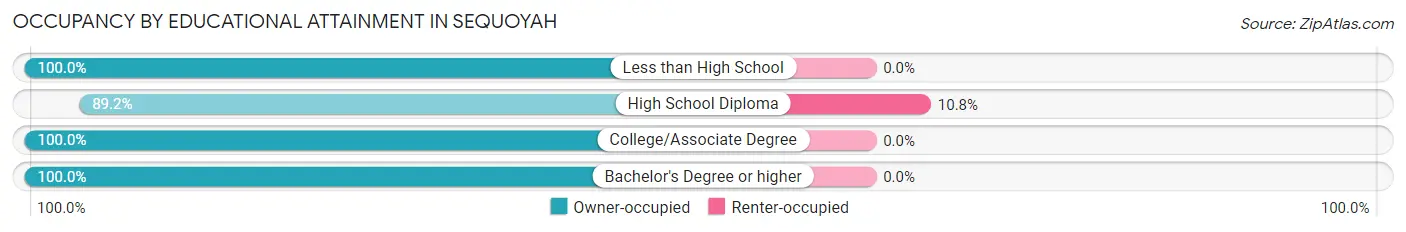
| Household Size | Owner-occupied | Renter-occupied |
| Less than High School | 23 (100.0%) | 0 (0.0%) |
| High School Diploma | 74 (89.2%) | 9 (10.8%) |
| College/Associate Degree | 66 (100.0%) | 0 (0.0%) |
| Bachelor's Degree or higher | 80 (100.0%) | 0 (0.0%) |
Occupancy by Age of Householder in Sequoyah
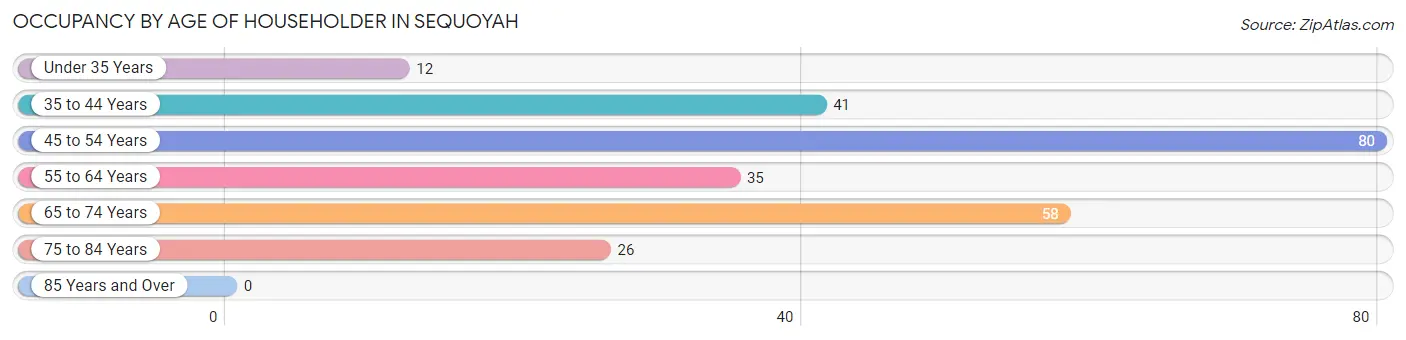
| Age Bracket | # Households | % Households |
| Under 35 Years | 12 | 4.8% |
| 35 to 44 Years | 41 | 16.3% |
| 45 to 54 Years | 80 | 31.8% |
| 55 to 64 Years | 35 | 13.9% |
| 65 to 74 Years | 58 | 23.0% |
| 75 to 84 Years | 26 | 10.3% |
| 85 Years and Over | 0 | 0.0% |
| Total | 252 | 100.0% |
Housing Finances in Sequoyah
Median Income by Occupancy in Sequoyah
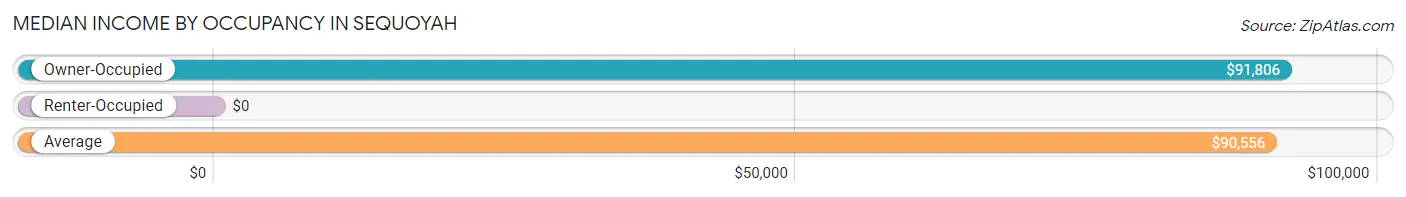
| Occupancy Type | # Households | Median Income |
| Owner-Occupied | 243 (96.4%) | $91,806 |
| Renter-Occupied | 9 (3.6%) | $0 |
| Average | 252 (100.0%) | $90,556 |
Occupancy by Householder Income Bracket in Sequoyah
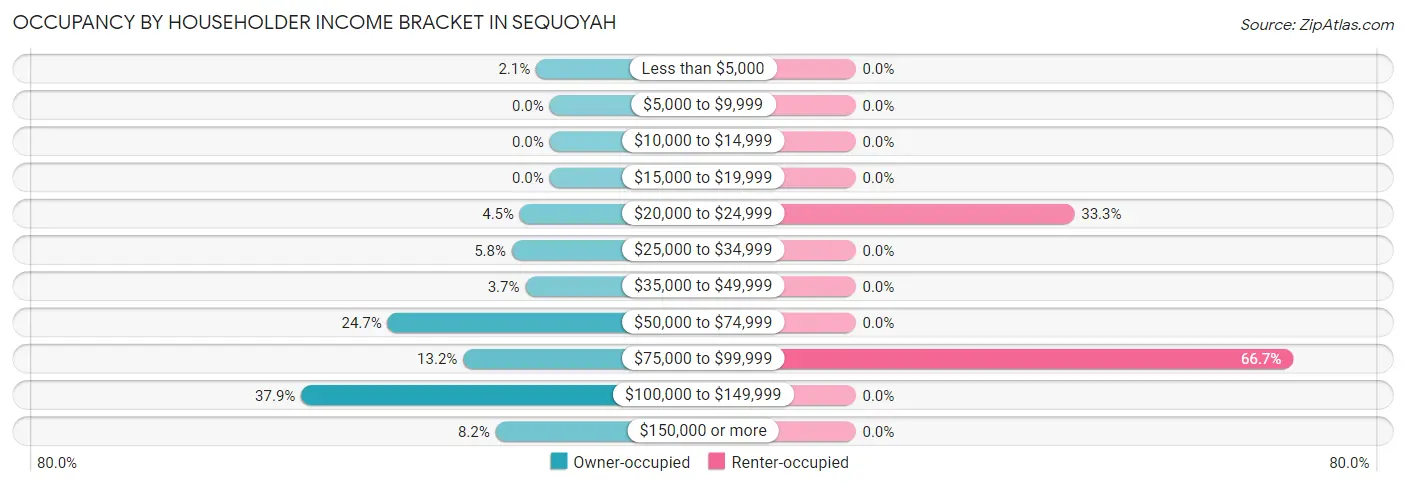
| Income Bracket | Owner-occupied | Renter-occupied |
| Less than $5,000 | 5 (2.1%) | 0 (0.0%) |
| $5,000 to $9,999 | 0 (0.0%) | 0 (0.0%) |
| $10,000 to $14,999 | 0 (0.0%) | 0 (0.0%) |
| $15,000 to $19,999 | 0 (0.0%) | 0 (0.0%) |
| $20,000 to $24,999 | 11 (4.5%) | 3 (33.3%) |
| $25,000 to $34,999 | 14 (5.8%) | 0 (0.0%) |
| $35,000 to $49,999 | 9 (3.7%) | 0 (0.0%) |
| $50,000 to $74,999 | 60 (24.7%) | 0 (0.0%) |
| $75,000 to $99,999 | 32 (13.2%) | 6 (66.7%) |
| $100,000 to $149,999 | 92 (37.9%) | 0 (0.0%) |
| $150,000 or more | 20 (8.2%) | 0 (0.0%) |
| Total | 243 (100.0%) | 9 (100.0%) |
Monthly Housing Cost Tiers in Sequoyah
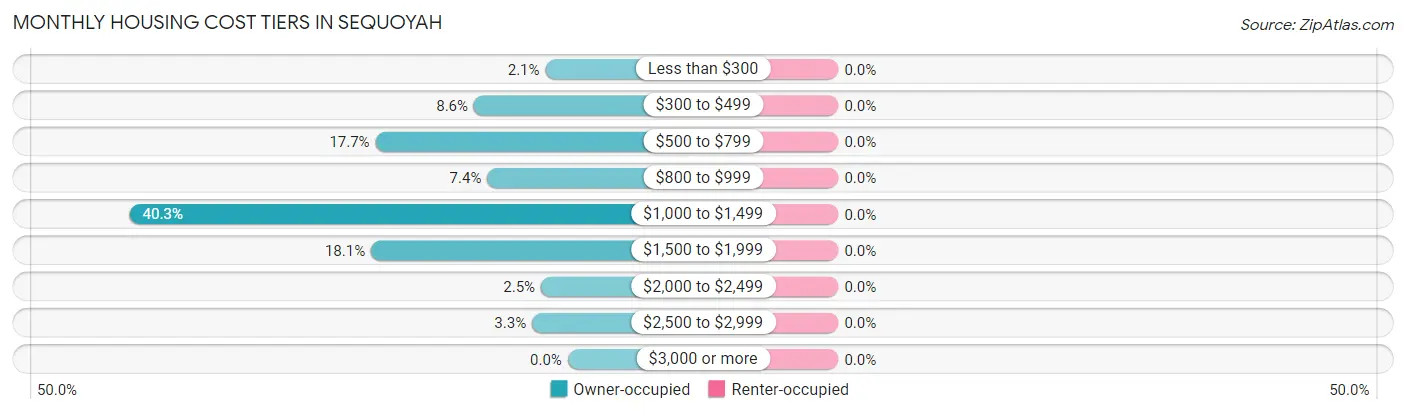
| Monthly Cost | Owner-occupied | Renter-occupied |
| Less than $300 | 5 (2.1%) | 0 (0.0%) |
| $300 to $499 | 21 (8.6%) | 0 (0.0%) |
| $500 to $799 | 43 (17.7%) | 0 (0.0%) |
| $800 to $999 | 18 (7.4%) | 0 (0.0%) |
| $1,000 to $1,499 | 98 (40.3%) | 0 (0.0%) |
| $1,500 to $1,999 | 44 (18.1%) | 0 (0.0%) |
| $2,000 to $2,499 | 6 (2.5%) | 0 (0.0%) |
| $2,500 to $2,999 | 8 (3.3%) | 0 (0.0%) |
| $3,000 or more | 0 (0.0%) | 0 (0.0%) |
| Total | 243 (100.0%) | 9 (100.0%) |
Physical Housing Characteristics in Sequoyah
Housing Structures in Sequoyah
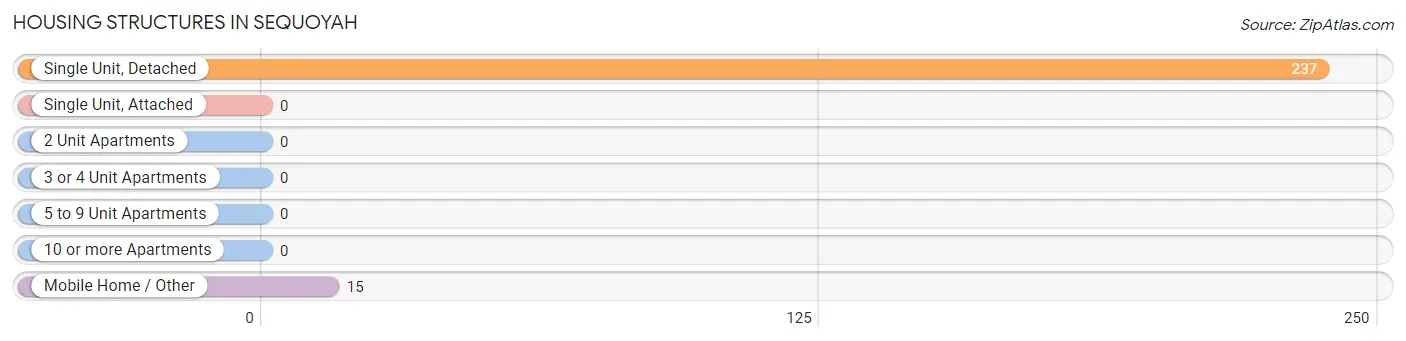
| Structure Type | # Housing Units | % Housing Units |
| Single Unit, Detached | 237 | 94.1% |
| Single Unit, Attached | 0 | 0.0% |
| 2 Unit Apartments | 0 | 0.0% |
| 3 or 4 Unit Apartments | 0 | 0.0% |
| 5 to 9 Unit Apartments | 0 | 0.0% |
| 10 or more Apartments | 0 | 0.0% |
| Mobile Home / Other | 15 | 5.9% |
| Total | 252 | 100.0% |
Housing Structures by Occupancy in Sequoyah
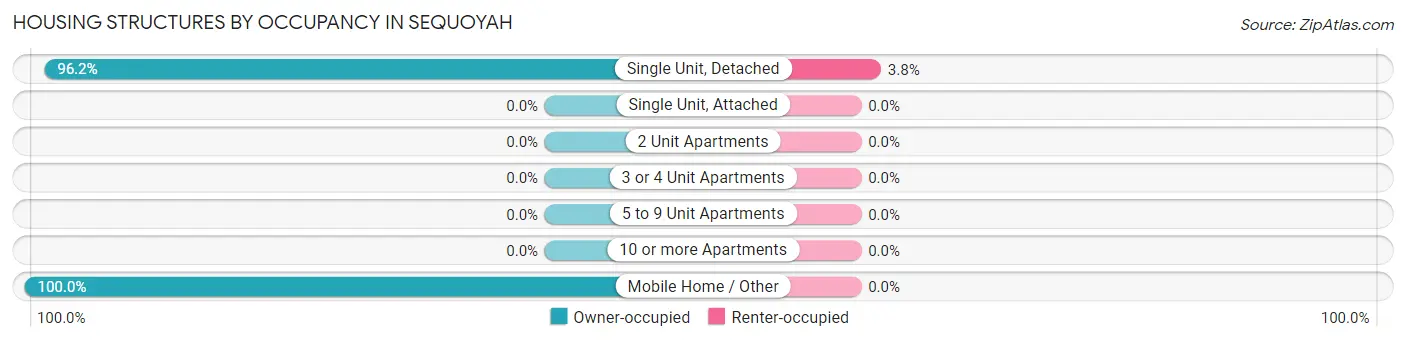
| Structure Type | Owner-occupied | Renter-occupied |
| Single Unit, Detached | 228 (96.2%) | 9 (3.8%) |
| Single Unit, Attached | 0 (0.0%) | 0 (0.0%) |
| 2 Unit Apartments | 0 (0.0%) | 0 (0.0%) |
| 3 or 4 Unit Apartments | 0 (0.0%) | 0 (0.0%) |
| 5 to 9 Unit Apartments | 0 (0.0%) | 0 (0.0%) |
| 10 or more Apartments | 0 (0.0%) | 0 (0.0%) |
| Mobile Home / Other | 15 (100.0%) | 0 (0.0%) |
| Total | 243 (96.4%) | 9 (3.6%) |
Housing Structures by Number of Rooms in Sequoyah
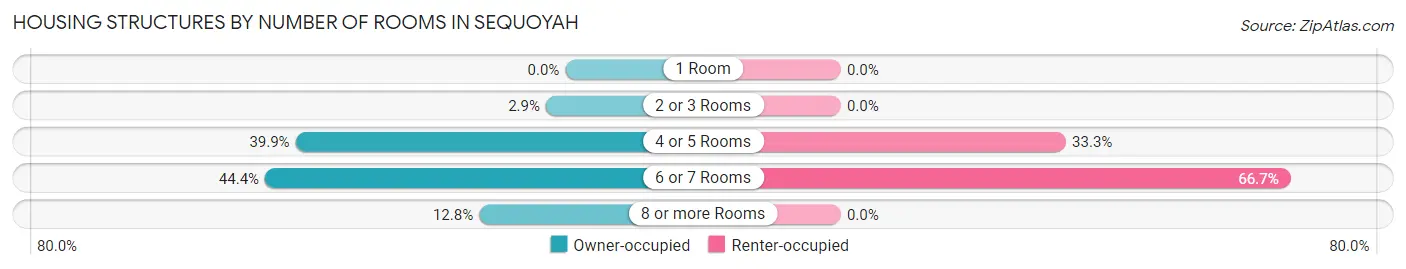
| Number of Rooms | Owner-occupied | Renter-occupied |
| 1 Room | 0 (0.0%) | 0 (0.0%) |
| 2 or 3 Rooms | 7 (2.9%) | 0 (0.0%) |
| 4 or 5 Rooms | 97 (39.9%) | 3 (33.3%) |
| 6 or 7 Rooms | 108 (44.4%) | 6 (66.7%) |
| 8 or more Rooms | 31 (12.8%) | 0 (0.0%) |
| Total | 243 (100.0%) | 9 (100.0%) |
Housing Structure by Heating Type in Sequoyah
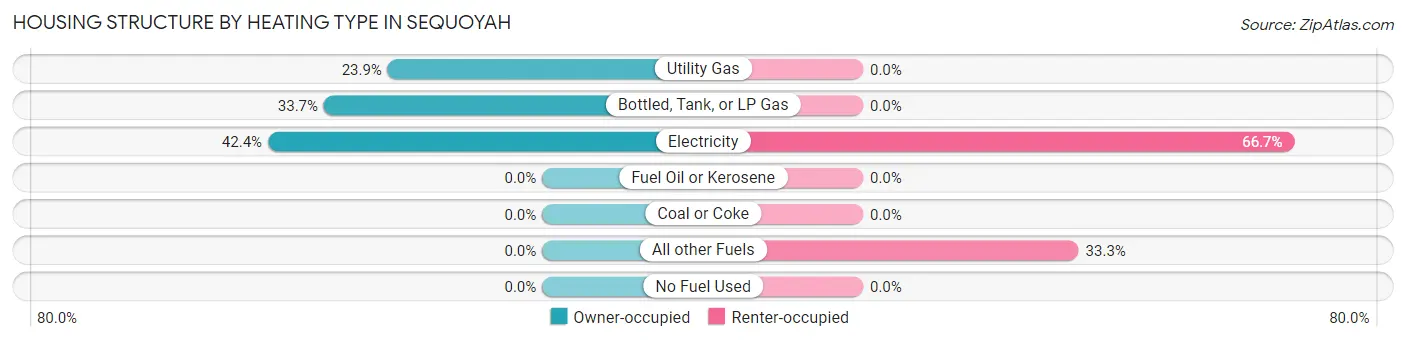
| Heating Type | Owner-occupied | Renter-occupied |
| Utility Gas | 58 (23.9%) | 0 (0.0%) |
| Bottled, Tank, or LP Gas | 82 (33.7%) | 0 (0.0%) |
| Electricity | 103 (42.4%) | 6 (66.7%) |
| Fuel Oil or Kerosene | 0 (0.0%) | 0 (0.0%) |
| Coal or Coke | 0 (0.0%) | 0 (0.0%) |
| All other Fuels | 0 (0.0%) | 3 (33.3%) |
| No Fuel Used | 0 (0.0%) | 0 (0.0%) |
| Total | 243 (100.0%) | 9 (100.0%) |
Household Vehicle Usage in Sequoyah
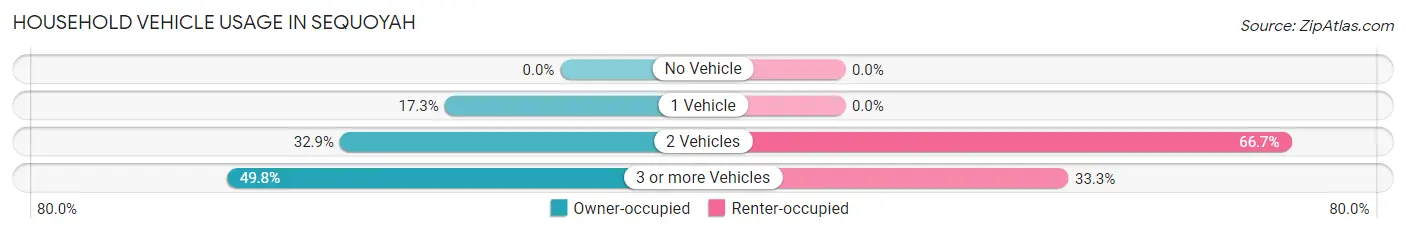
| Vehicles per Household | Owner-occupied | Renter-occupied |
| No Vehicle | 0 (0.0%) | 0 (0.0%) |
| 1 Vehicle | 42 (17.3%) | 0 (0.0%) |
| 2 Vehicles | 80 (32.9%) | 6 (66.7%) |
| 3 or more Vehicles | 121 (49.8%) | 3 (33.3%) |
| Total | 243 (100.0%) | 9 (100.0%) |
Real Estate & Mortgages in Sequoyah
Real Estate and Mortgage Overview in Sequoyah
| Characteristic | Without Mortgage | With Mortgage |
| Housing Units | 93 | 150 |
| Median Property Value | $231,000 | $211,100 |
| Median Household Income | $64,464 | $14 |
| Monthly Housing Costs | $659 | $0 |
| Real Estate Taxes | $1,466 | $0 |
Property Value by Mortgage Status in Sequoyah
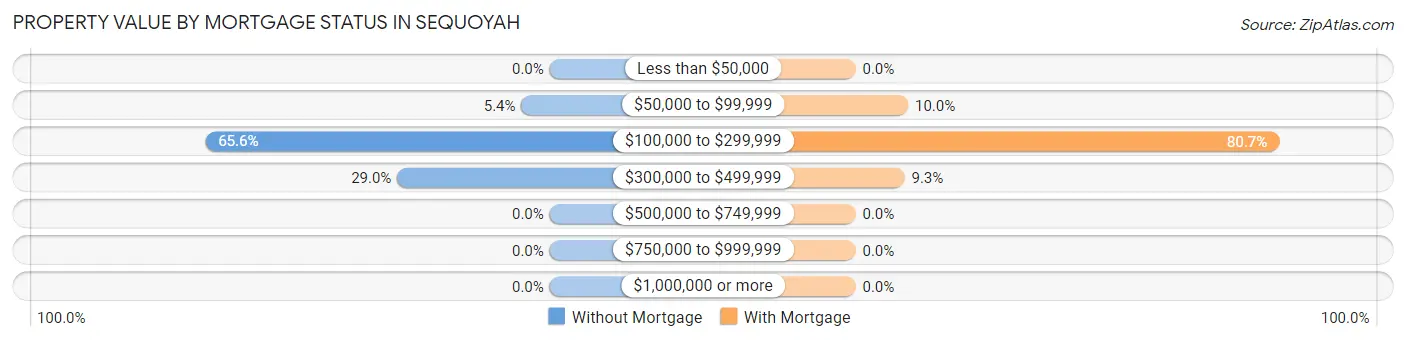
| Property Value | Without Mortgage | With Mortgage |
| Less than $50,000 | 0 (0.0%) | 0 (0.0%) |
| $50,000 to $99,999 | 5 (5.4%) | 15 (10.0%) |
| $100,000 to $299,999 | 61 (65.6%) | 121 (80.7%) |
| $300,000 to $499,999 | 27 (29.0%) | 14 (9.3%) |
| $500,000 to $749,999 | 0 (0.0%) | 0 (0.0%) |
| $750,000 to $999,999 | 0 (0.0%) | 0 (0.0%) |
| $1,000,000 or more | 0 (0.0%) | 0 (0.0%) |
| Total | 93 (100.0%) | 150 (100.0%) |
Household Income by Mortgage Status in Sequoyah
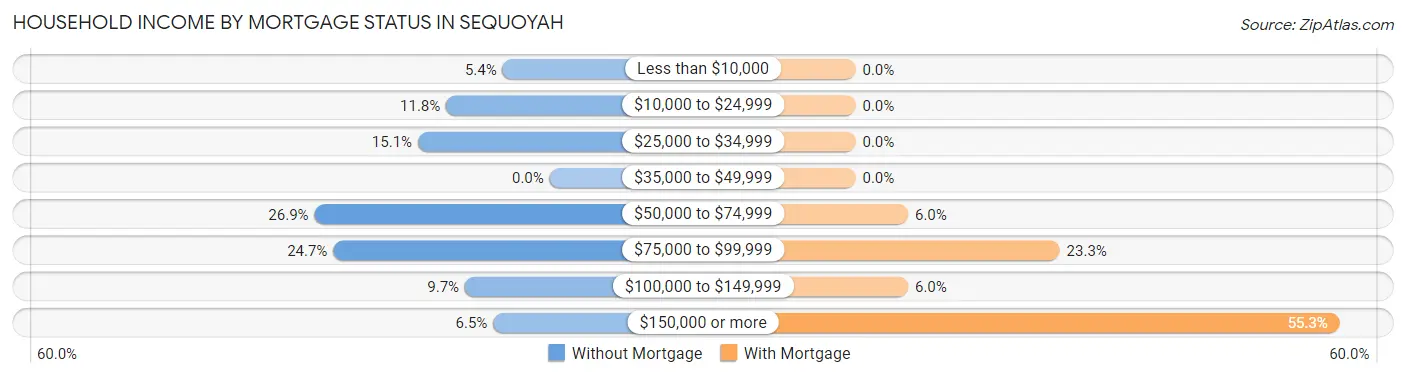
| Household Income | Without Mortgage | With Mortgage |
| Less than $10,000 | 5 (5.4%) | 0 (0.0%) |
| $10,000 to $24,999 | 11 (11.8%) | 0 (0.0%) |
| $25,000 to $34,999 | 14 (15.0%) | 0 (0.0%) |
| $35,000 to $49,999 | 0 (0.0%) | 0 (0.0%) |
| $50,000 to $74,999 | 25 (26.9%) | 9 (6.0%) |
| $75,000 to $99,999 | 23 (24.7%) | 35 (23.3%) |
| $100,000 to $149,999 | 9 (9.7%) | 9 (6.0%) |
| $150,000 or more | 6 (6.5%) | 83 (55.3%) |
| Total | 93 (100.0%) | 150 (100.0%) |
Property Value to Household Income Ratio in Sequoyah
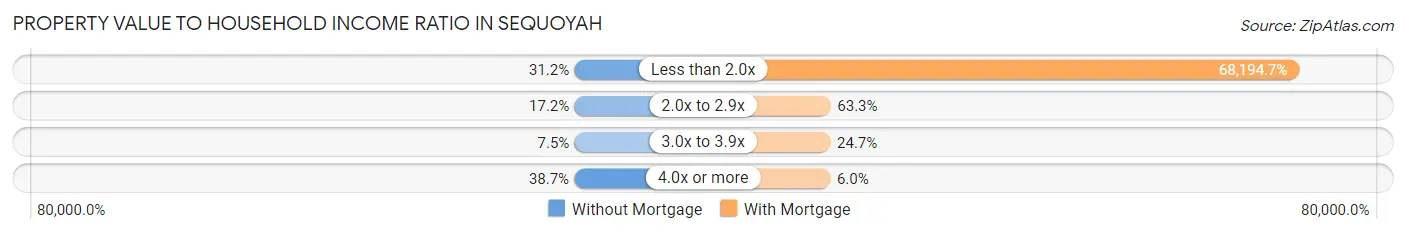
| Value-to-Income Ratio | Without Mortgage | With Mortgage |
| Less than 2.0x | 29 (31.2%) | 102,292 (68,194.7%) |
| 2.0x to 2.9x | 16 (17.2%) | 95 (63.3%) |
| 3.0x to 3.9x | 7 (7.5%) | 37 (24.7%) |
| 4.0x or more | 36 (38.7%) | 9 (6.0%) |
| Total | 93 (100.0%) | 150 (100.0%) |
Real Estate Taxes by Mortgage Status in Sequoyah
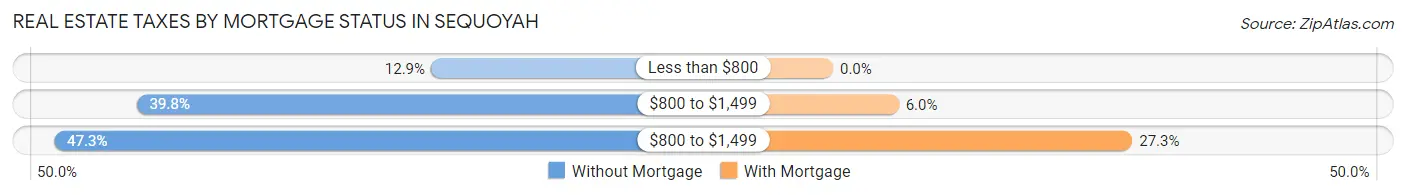
| Property Taxes | Without Mortgage | With Mortgage |
| Less than $800 | 12 (12.9%) | 0 (0.0%) |
| $800 to $1,499 | 37 (39.8%) | 9 (6.0%) |
| $800 to $1,499 | 44 (47.3%) | 41 (27.3%) |
| Total | 93 (100.0%) | 150 (100.0%) |
Health & Disability in Sequoyah
Health Insurance Coverage by Age in Sequoyah
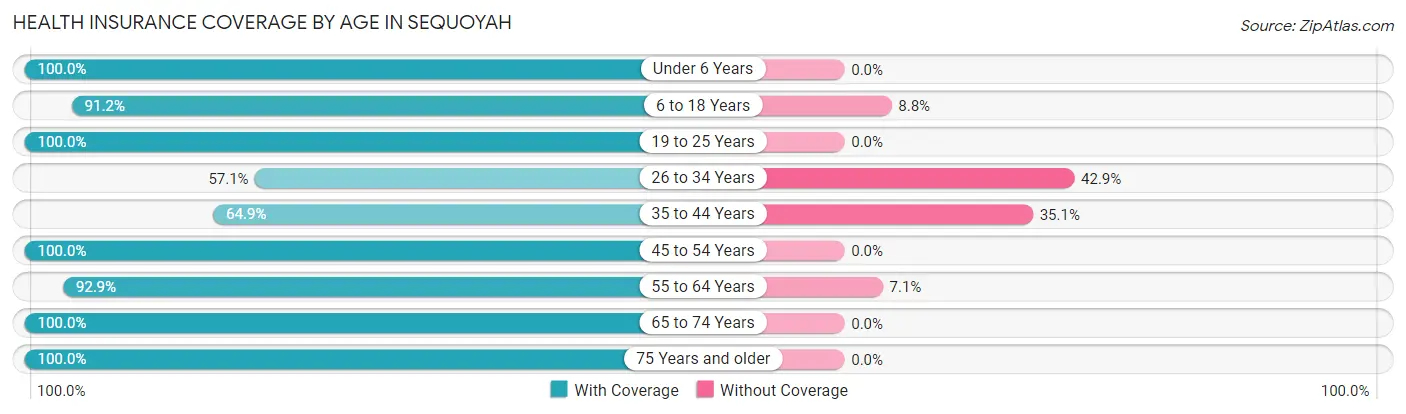
| Age Bracket | With Coverage | Without Coverage |
| Under 6 Years | 48 (100.0%) | 0 (0.0%) |
| 6 to 18 Years | 104 (91.2%) | 10 (8.8%) |
| 19 to 25 Years | 12 (100.0%) | 0 (0.0%) |
| 26 to 34 Years | 36 (57.1%) | 27 (42.9%) |
| 35 to 44 Years | 48 (64.9%) | 26 (35.1%) |
| 45 to 54 Years | 170 (100.0%) | 0 (0.0%) |
| 55 to 64 Years | 39 (92.9%) | 3 (7.1%) |
| 65 to 74 Years | 96 (100.0%) | 0 (0.0%) |
| 75 Years and older | 34 (100.0%) | 0 (0.0%) |
| Total | 587 (89.9%) | 66 (10.1%) |
Health Insurance Coverage by Citizenship Status in Sequoyah
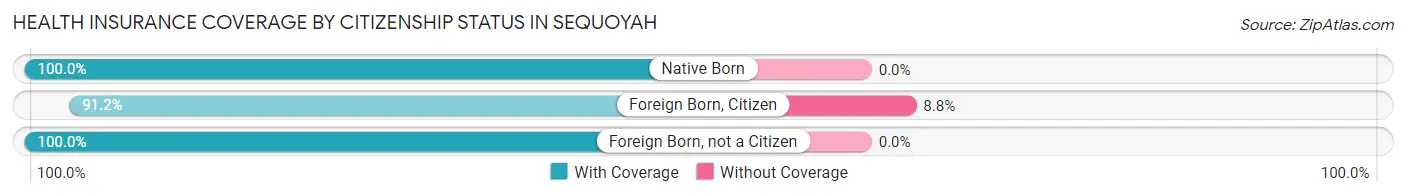
| Citizenship Status | With Coverage | Without Coverage |
| Native Born | 48 (100.0%) | 0 (0.0%) |
| Foreign Born, Citizen | 104 (91.2%) | 10 (8.8%) |
| Foreign Born, not a Citizen | 12 (100.0%) | 0 (0.0%) |
Health Insurance Coverage by Household Income in Sequoyah
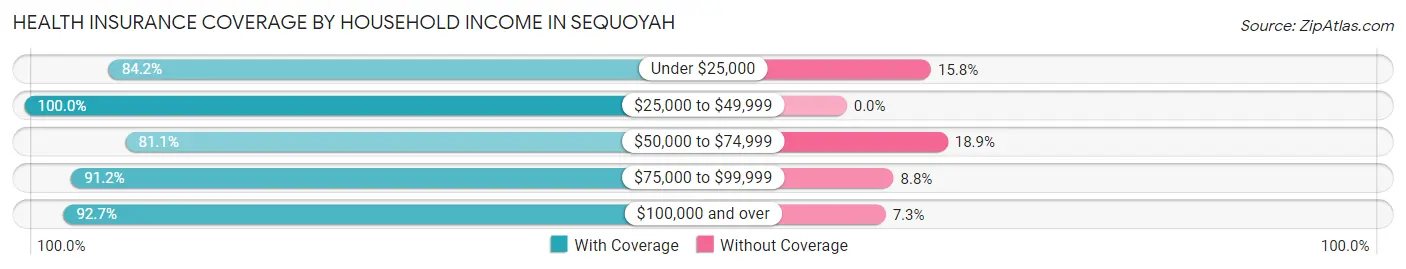
| Household Income | With Coverage | Without Coverage |
| Under $25,000 | 16 (84.2%) | 3 (15.8%) |
| $25,000 to $49,999 | 29 (100.0%) | 0 (0.0%) |
| $50,000 to $74,999 | 120 (81.1%) | 28 (18.9%) |
| $75,000 to $99,999 | 104 (91.2%) | 10 (8.8%) |
| $100,000 and over | 318 (92.7%) | 25 (7.3%) |
Public vs Private Health Insurance Coverage by Age in Sequoyah
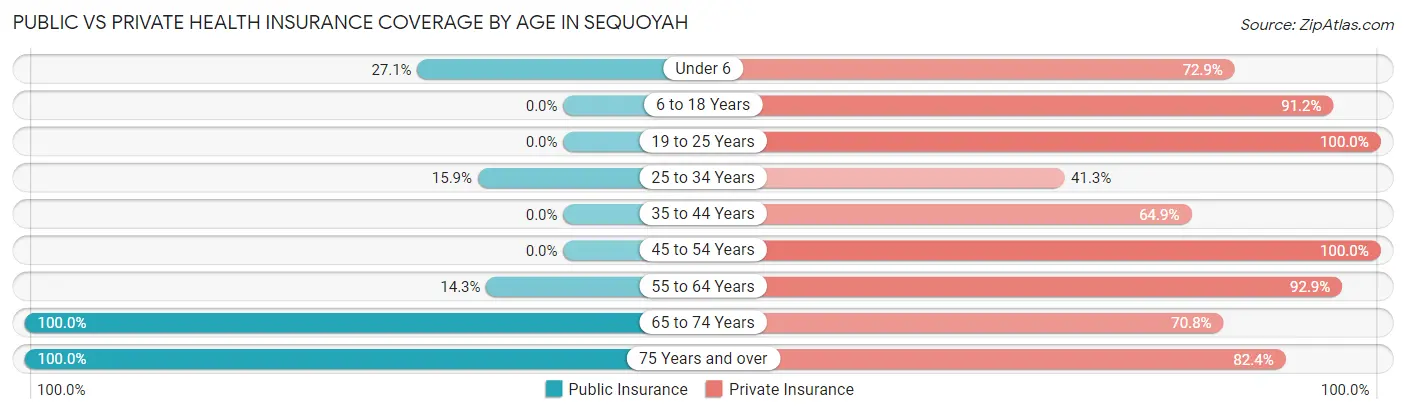
| Age Bracket | Public Insurance | Private Insurance |
| Under 6 | 13 (27.1%) | 35 (72.9%) |
| 6 to 18 Years | 0 (0.0%) | 104 (91.2%) |
| 19 to 25 Years | 0 (0.0%) | 12 (100.0%) |
| 25 to 34 Years | 10 (15.9%) | 26 (41.3%) |
| 35 to 44 Years | 0 (0.0%) | 48 (64.9%) |
| 45 to 54 Years | 0 (0.0%) | 170 (100.0%) |
| 55 to 64 Years | 6 (14.3%) | 39 (92.9%) |
| 65 to 74 Years | 96 (100.0%) | 68 (70.8%) |
| 75 Years and over | 34 (100.0%) | 28 (82.4%) |
| Total | 159 (24.3%) | 530 (81.2%) |
Disability Status by Sex by Age in Sequoyah
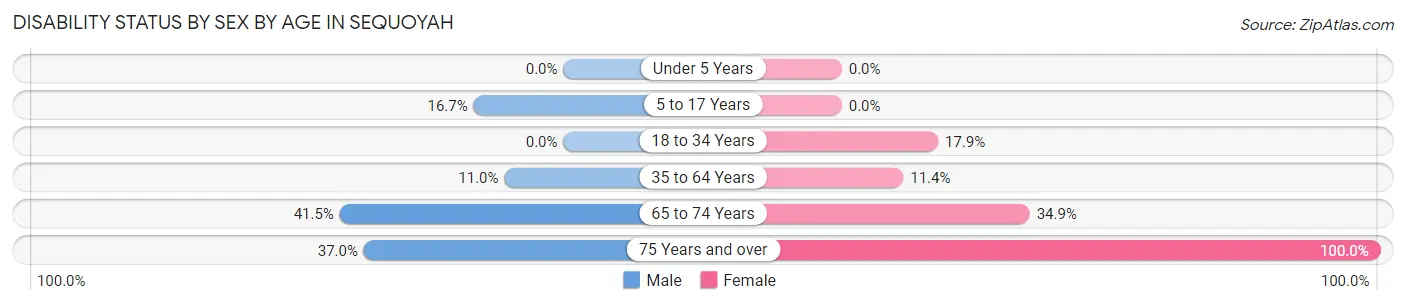
| Age Bracket | Male | Female |
| Under 5 Years | 0 (0.0%) | 0 (0.0%) |
| 5 to 17 Years | 14 (16.7%) | 0 (0.0%) |
| 18 to 34 Years | 0 (0.0%) | 10 (17.9%) |
| 35 to 64 Years | 15 (11.0%) | 17 (11.4%) |
| 65 to 74 Years | 22 (41.5%) | 15 (34.9%) |
| 75 Years and over | 10 (37.0%) | 7 (100.0%) |
Disability Class by Sex by Age in Sequoyah
Disability Class: Hearing Difficulty
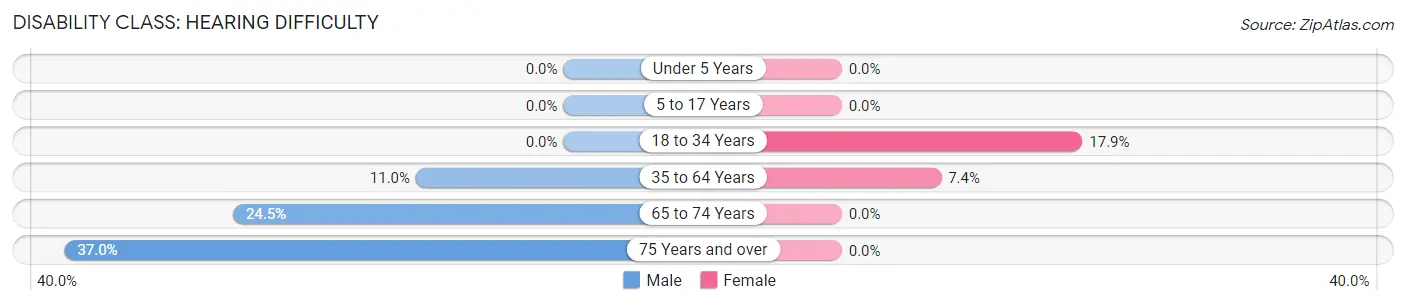
| Age Bracket | Male | Female |
| Under 5 Years | 0 (0.0%) | 0 (0.0%) |
| 5 to 17 Years | 0 (0.0%) | 0 (0.0%) |
| 18 to 34 Years | 0 (0.0%) | 10 (17.9%) |
| 35 to 64 Years | 15 (11.0%) | 11 (7.4%) |
| 65 to 74 Years | 13 (24.5%) | 0 (0.0%) |
| 75 Years and over | 10 (37.0%) | 0 (0.0%) |
Disability Class: Vision Difficulty
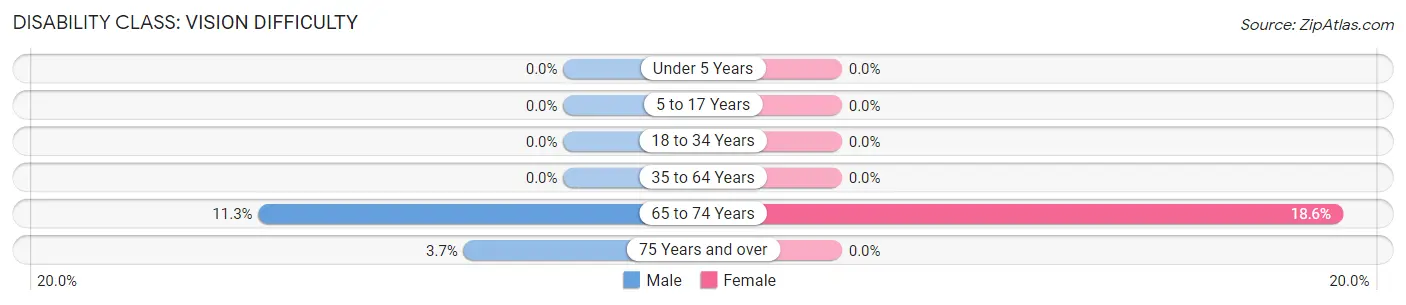
| Age Bracket | Male | Female |
| Under 5 Years | 0 (0.0%) | 0 (0.0%) |
| 5 to 17 Years | 0 (0.0%) | 0 (0.0%) |
| 18 to 34 Years | 0 (0.0%) | 0 (0.0%) |
| 35 to 64 Years | 0 (0.0%) | 0 (0.0%) |
| 65 to 74 Years | 6 (11.3%) | 8 (18.6%) |
| 75 Years and over | 1 (3.7%) | 0 (0.0%) |
Disability Class: Cognitive Difficulty
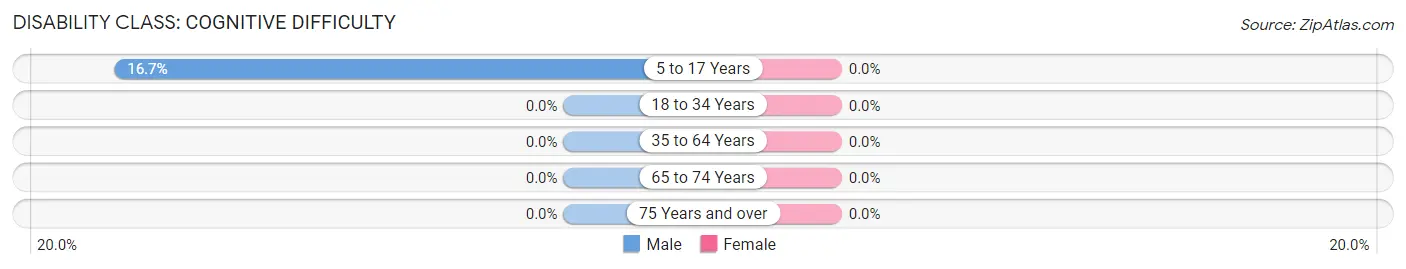
| Age Bracket | Male | Female |
| 5 to 17 Years | 14 (16.7%) | 0 (0.0%) |
| 18 to 34 Years | 0 (0.0%) | 0 (0.0%) |
| 35 to 64 Years | 0 (0.0%) | 0 (0.0%) |
| 65 to 74 Years | 0 (0.0%) | 0 (0.0%) |
| 75 Years and over | 0 (0.0%) | 0 (0.0%) |
Disability Class: Ambulatory Difficulty
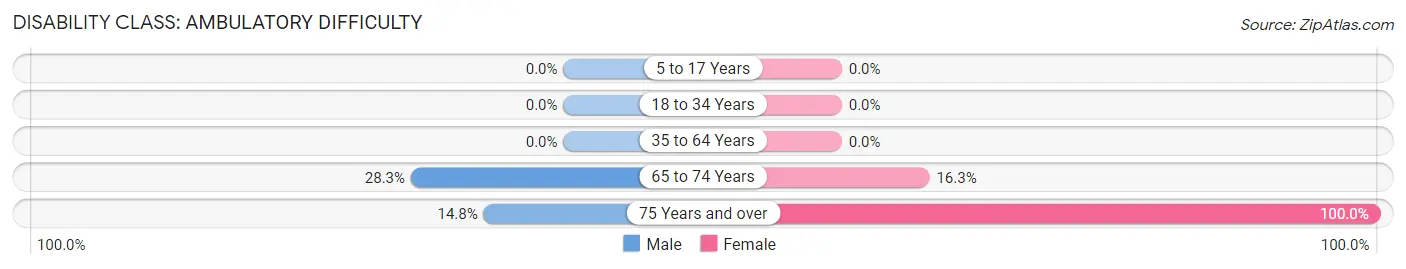
| Age Bracket | Male | Female |
| 5 to 17 Years | 0 (0.0%) | 0 (0.0%) |
| 18 to 34 Years | 0 (0.0%) | 0 (0.0%) |
| 35 to 64 Years | 0 (0.0%) | 0 (0.0%) |
| 65 to 74 Years | 15 (28.3%) | 7 (16.3%) |
| 75 Years and over | 4 (14.8%) | 7 (100.0%) |
Disability Class: Self-Care Difficulty
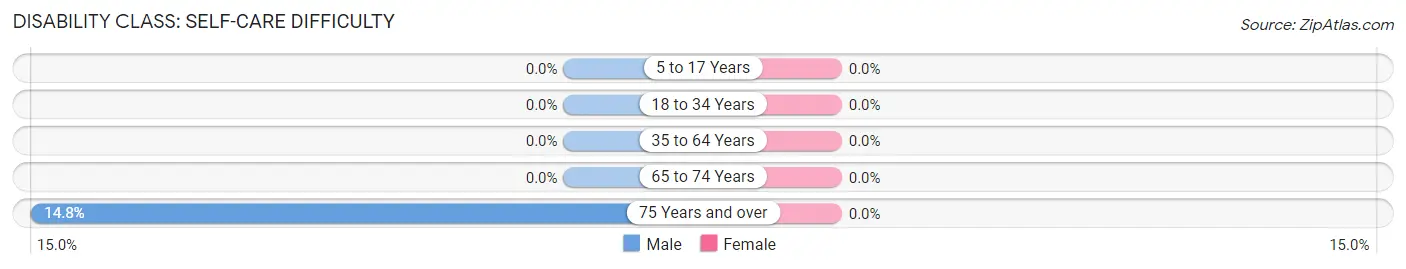
| Age Bracket | Male | Female |
| 5 to 17 Years | 0 (0.0%) | 0 (0.0%) |
| 18 to 34 Years | 0 (0.0%) | 0 (0.0%) |
| 35 to 64 Years | 0 (0.0%) | 0 (0.0%) |
| 65 to 74 Years | 0 (0.0%) | 0 (0.0%) |
| 75 Years and over | 4 (14.8%) | 0 (0.0%) |
Technology Access in Sequoyah
Computing Device Access in Sequoyah
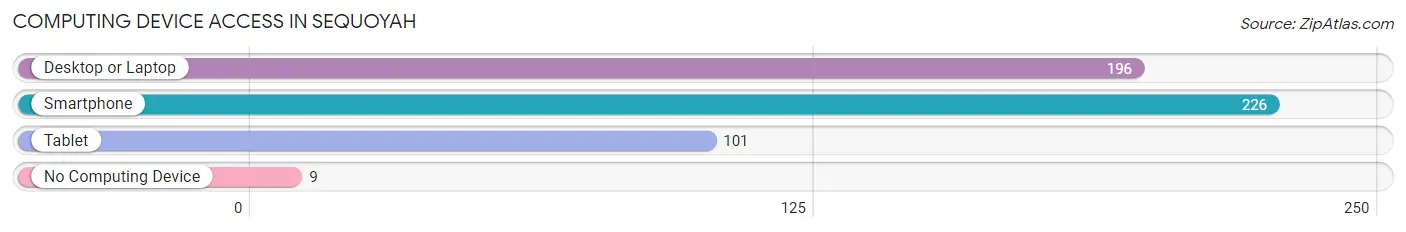
| Device Type | # Households | % Households |
| Desktop or Laptop | 196 | 77.8% |
| Smartphone | 226 | 89.7% |
| Tablet | 101 | 40.1% |
| No Computing Device | 9 | 3.6% |
| Total | 252 | 100.0% |
Internet Access in Sequoyah
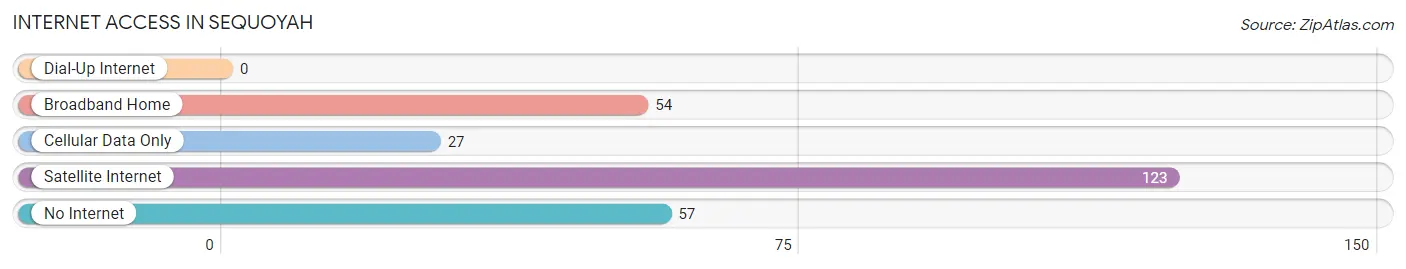
| Internet Type | # Households | % Households |
| Dial-Up Internet | 0 | 0.0% |
| Broadband Home | 54 | 21.4% |
| Cellular Data Only | 27 | 10.7% |
| Satellite Internet | 123 | 48.8% |
| No Internet | 57 | 22.6% |
| Total | 252 | 100.0% |
Sequoyah Summary
Situated in the foothills of the Ozark Mountains in eastern Oklahoma, the town of Sequoyah is a small, rural community with a population of just over 1,000 people. The town was founded in 1872 and named after the Cherokee leader Sequoyah, who developed the Cherokee syllabary. The town is located in Sequoyah County, which is part of the Cherokee Nation.
Geography
Sequoyah is located in the foothills of the Ozark Mountains in eastern Oklahoma. The town is situated on the banks of the Arkansas River, which flows through the county. The town is located in the Arkansas River Valley, which is a region of rolling hills and valleys. The town is surrounded by forests and is home to a variety of wildlife, including deer, turkey, and other small game. The town is located approximately 30 miles east of Tulsa and is accessible by US Highway 64.
Economy
The economy of Sequoyah is largely based on agriculture and tourism. The town is home to several farms, which produce a variety of crops, including corn, soybeans, and wheat. The town is also home to several small businesses, including restaurants, convenience stores, and a few small manufacturing companies. The town is also home to a number of tourist attractions, including the Sequoyah National Wildlife Refuge, which is a popular destination for birdwatchers and nature lovers.
Demographics
As of the 2010 census, the population of Sequoyah was 1,072. The town is predominantly white, with a population that is 97.2% white and 2.8% Native American. The median household income in the town is $35,000, and the median age is 40. The town is home to a number of churches, including the First Baptist Church of Sequoyah, which was founded in 1872.
Conclusion
Sequoyah is a small, rural town in eastern Oklahoma with a population of just over 1,000 people. The town is situated in the foothills of the Ozark Mountains and is home to a variety of wildlife. The economy of the town is largely based on agriculture and tourism, and the town is home to a number of small businesses and tourist attractions. The population of the town is predominantly white, with a median household income of $35,000 and a median age of 40.
Common Questions
What is Per Capita Income in Sequoyah?
Per Capita income in Sequoyah is $38,385.
What is the Median Family Income in Sequoyah?
Median Family Income in Sequoyah is $100,938.
What is the Median Household income in Sequoyah?
Median Household Income in Sequoyah is $90,556.
What is Income or Wage Gap in Sequoyah?
Income or Wage Gap in Sequoyah is 43.8%.
Women in Sequoyah earn 56.2 cents for every dollar earned by a man.
What is Inequality or Gini Index in Sequoyah?
Inequality or Gini Index in Sequoyah is 0.29.
What is the Total Population of Sequoyah?
Total Population of Sequoyah is 653.
What is the Total Male Population of Sequoyah?
Total Male Population of Sequoyah is 353.
What is the Total Female Population of Sequoyah?
Total Female Population of Sequoyah is 300.
What is the Ratio of Males per 100 Females in Sequoyah?
There are 117.67 Males per 100 Females in Sequoyah.
What is the Ratio of Females per 100 Males in Sequoyah?
There are 84.99 Females per 100 Males in Sequoyah.
What is the Median Population Age in Sequoyah?
Median Population Age in Sequoyah is 49.6 Years.
What is the Average Family Size in Sequoyah
Average Family Size in Sequoyah is 3.0 People.
What is the Average Household Size in Sequoyah
Average Household Size in Sequoyah is 2.6 People.
How Large is the Labor Force in Sequoyah?
There are 369 People in the Labor Forcein in Sequoyah.
What is the Percentage of People in the Labor Force in Sequoyah?
71.7% of People are in the Labor Force in Sequoyah.
What is the Unemployment Rate in Sequoyah?
Unemployment Rate in Sequoyah is 4.6%.