Cherokee, OK Map & Demographics
Cherokee Map
Cherokee Overview
$31,403
PER CAPITA INCOME
$86,719
AVG FAMILY INCOME
$75,547
AVG HOUSEHOLD INCOME
32.9%
WAGE / INCOME GAP [ % ]
67.1¢/ $1
WAGE / INCOME GAP [ $ ]
0.38
INEQUALITY / GINI INDEX
1,556
TOTAL POPULATION
812
MALE POPULATION
744
FEMALE POPULATION
109.14
MALES / 100 FEMALES
91.63
FEMALES / 100 MALES
42.4
MEDIAN AGE
2.9
AVG FAMILY SIZE
2.4
AVG HOUSEHOLD SIZE
742
LABOR FORCE [ PEOPLE ]
61.6%
PERCENT IN LABOR FORCE
6.9%
UNEMPLOYMENT RATE
Cherokee Zip Codes
Cherokee Area Codes
Income in Cherokee
Income Overview in Cherokee
Per Capita Income in Cherokee is $31,403, while median incomes of families and households are $86,719 and $75,547 respectively.
| Characteristic | Number | Measure |
| Per Capita Income | 1,556 | $31,403 |
| Median Family Income | 449 | $86,719 |
| Mean Family Income | 449 | $91,775 |
| Median Household Income | 632 | $75,547 |
| Mean Household Income | 632 | $75,993 |
| Income Deficit | 449 | $0 |
| Wage / Income Gap (%) | 1,556 | 32.89% |
| Wage / Income Gap ($) | 1,556 | 67.11¢ per $1 |
| Gini / Inequality Index | 1,556 | 0.38 |
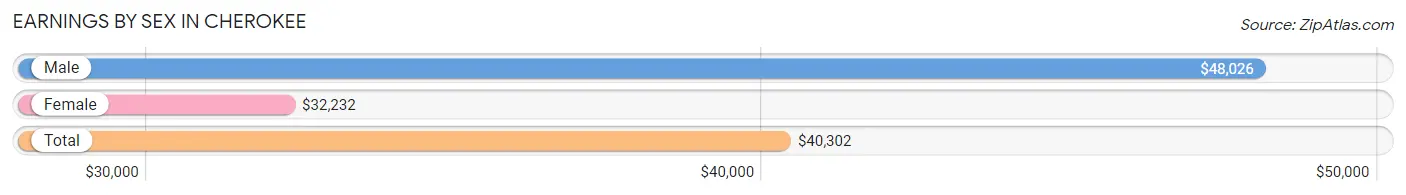
Earnings by Sex in Cherokee
Average Earnings in Cherokee are $40,302, $48,026 for men and $32,232 for women, a difference of 32.9%.
| Sex | Number | Average Earnings |
| Male | 466 (56.2%) | $48,026 |
| Female | 363 (43.8%) | $32,232 |
| Total | 829 (100.0%) | $40,302 |
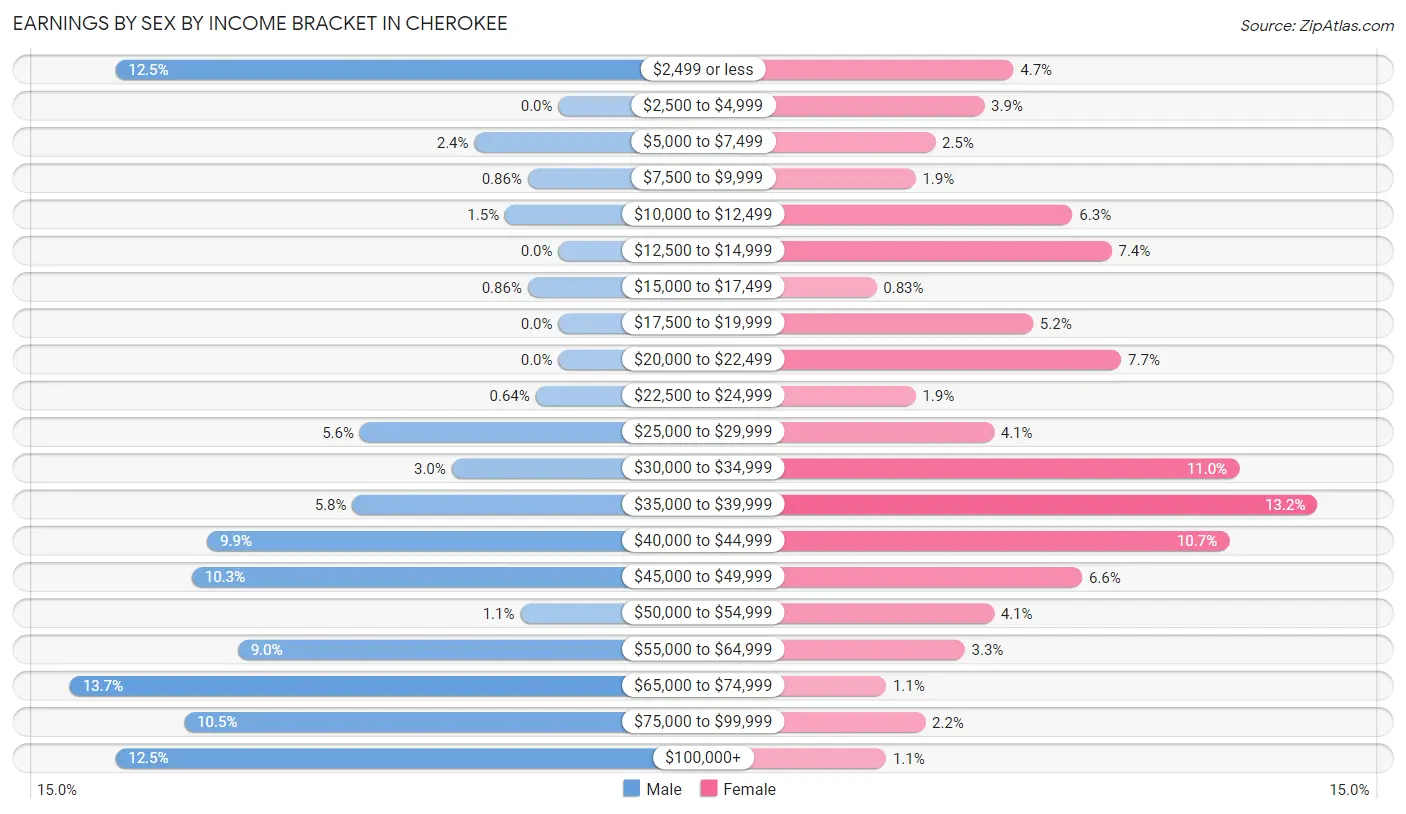
Earnings by Sex by Income Bracket in Cherokee
The most common earnings brackets in Cherokee are $65,000 to $74,999 for men (64 | 13.7%) and $35,000 to $39,999 for women (48 | 13.2%).
| Income | Male | Female |
| $2,499 or less | 58 (12.4%) | 17 (4.7%) |
| $2,500 to $4,999 | 0 (0.0%) | 14 (3.9%) |
| $5,000 to $7,499 | 11 (2.4%) | 9 (2.5%) |
| $7,500 to $9,999 | 4 (0.9%) | 7 (1.9%) |
| $10,000 to $12,499 | 7 (1.5%) | 23 (6.3%) |
| $12,500 to $14,999 | 0 (0.0%) | 27 (7.4%) |
| $15,000 to $17,499 | 4 (0.9%) | 3 (0.8%) |
| $17,500 to $19,999 | 0 (0.0%) | 19 (5.2%) |
| $20,000 to $22,499 | 0 (0.0%) | 28 (7.7%) |
| $22,500 to $24,999 | 3 (0.6%) | 7 (1.9%) |
| $25,000 to $29,999 | 26 (5.6%) | 15 (4.1%) |
| $30,000 to $34,999 | 14 (3.0%) | 40 (11.0%) |
| $35,000 to $39,999 | 27 (5.8%) | 48 (13.2%) |
| $40,000 to $44,999 | 46 (9.9%) | 39 (10.7%) |
| $45,000 to $49,999 | 48 (10.3%) | 24 (6.6%) |
| $50,000 to $54,999 | 5 (1.1%) | 15 (4.1%) |
| $55,000 to $64,999 | 42 (9.0%) | 12 (3.3%) |
| $65,000 to $74,999 | 64 (13.7%) | 4 (1.1%) |
| $75,000 to $99,999 | 49 (10.5%) | 8 (2.2%) |
| $100,000+ | 58 (12.4%) | 4 (1.1%) |
| Total | 466 (100.0%) | 363 (100.0%) |
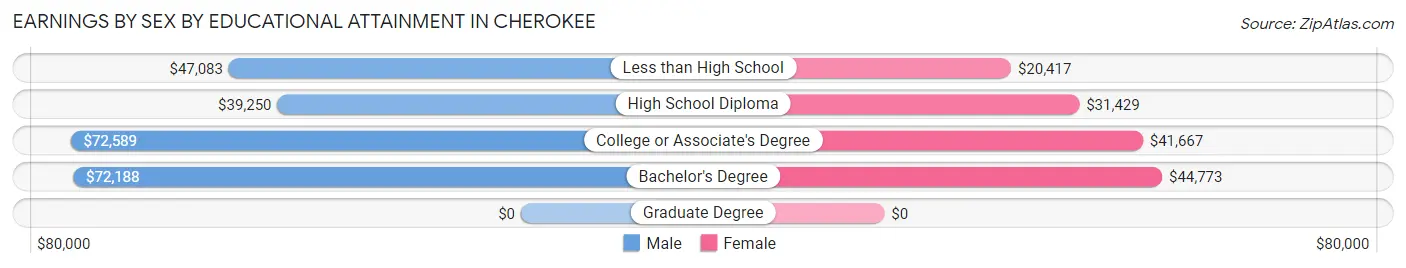
Earnings by Sex by Educational Attainment in Cherokee
Average earnings in Cherokee are $58,000 for men and $33,702 for women, a difference of 41.9%. Men with an educational attainment of college or associate's degree enjoy the highest average annual earnings of $72,589, while those with high school diploma education earn the least with $39,250. Women with an educational attainment of bachelor's degree earn the most with the average annual earnings of $44,773, while those with less than high school education have the smallest earnings of $20,417.
| Educational Attainment | Male Income | Female Income |
| Less than High School | $47,083 | $20,417 |
| High School Diploma | $39,250 | $31,429 |
| College or Associate's Degree | $72,589 | $41,667 |
| Bachelor's Degree | $72,188 | $44,773 |
| Graduate Degree | - | - |
| Total | $58,000 | $33,702 |
Family Income in Cherokee
Family Income Brackets in Cherokee
According to the Cherokee family income data, there are 128 families falling into the $75,000 to $99,999 income range, which is the most common income bracket and makes up 28.5% of all families.
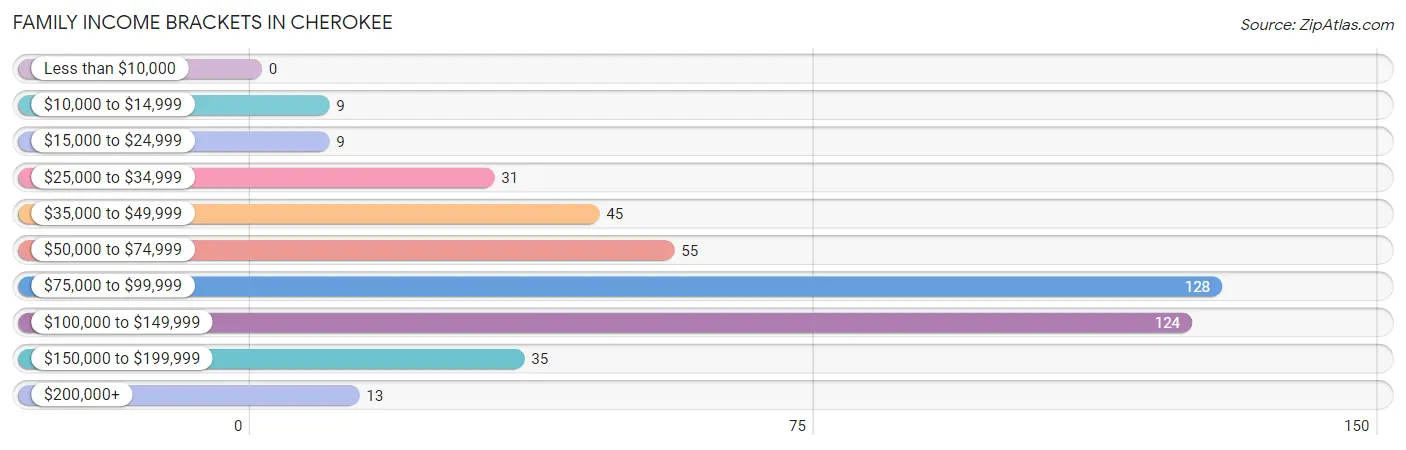
| Income Bracket | # Families | % Families |
| Less than $10,000 | 0 | 0.0% |
| $10,000 to $14,999 | 9 | 2.0% |
| $15,000 to $24,999 | 9 | 2.0% |
| $25,000 to $34,999 | 31 | 6.9% |
| $35,000 to $49,999 | 45 | 10.0% |
| $50,000 to $74,999 | 55 | 12.2% |
| $75,000 to $99,999 | 128 | 28.5% |
| $100,000 to $149,999 | 124 | 27.6% |
| $150,000 to $199,999 | 35 | 7.8% |
| $200,000+ | 13 | 2.9% |
Family Income by Famaliy Size in Cherokee
5-person families (22 | 4.9%) account for the highest median family income in Cherokee with $100,909 per family, while 2-person families (212 | 47.2%) have the highest median income of $38,672 per family member.
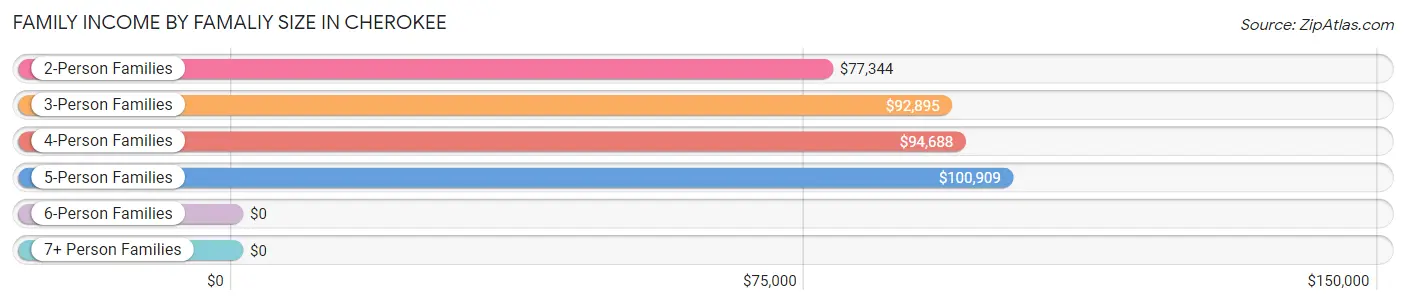
| Income Bracket | # Families | Median Income |
| 2-Person Families | 212 (47.2%) | $77,344 |
| 3-Person Families | 112 (24.9%) | $92,895 |
| 4-Person Families | 71 (15.8%) | $94,688 |
| 5-Person Families | 22 (4.9%) | $100,909 |
| 6-Person Families | 14 (3.1%) | $0 |
| 7+ Person Families | 18 (4.0%) | $0 |
| Total | 449 (100.0%) | $86,719 |
Family Income by Number of Earners in Cherokee
The median family income in Cherokee is $86,719, with families comprising 3+ earners (25) having the highest median family income of $125,917, while families with no earners (43) have the lowest median family income of $38,125, accounting for 5.6% and 9.6% of families, respectively.
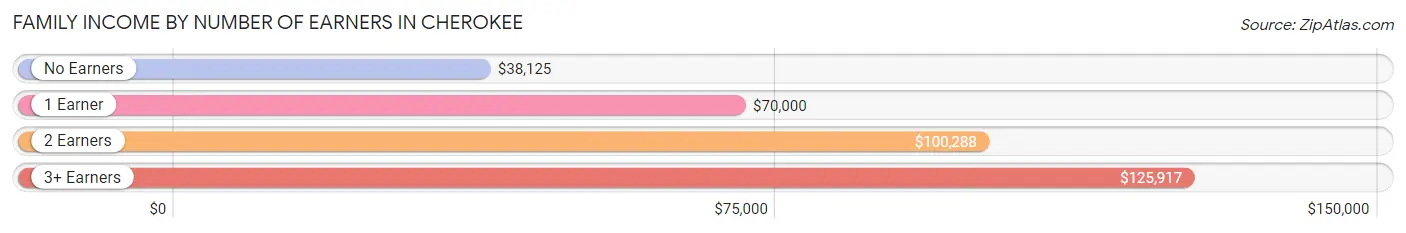
| Number of Earners | # Families | Median Income |
| No Earners | 43 (9.6%) | $38,125 |
| 1 Earner | 120 (26.7%) | $70,000 |
| 2 Earners | 261 (58.1%) | $100,288 |
| 3+ Earners | 25 (5.6%) | $125,917 |
| Total | 449 (100.0%) | $86,719 |
Household Income in Cherokee
Household Income Brackets in Cherokee
With 136 households falling in the category, the $100,000 to $149,999 income range is the most frequent in Cherokee, accounting for 21.5% of all households. In contrast, only 13 households (2.1%) fall into the $200,000+ income bracket, making it the least populous group.
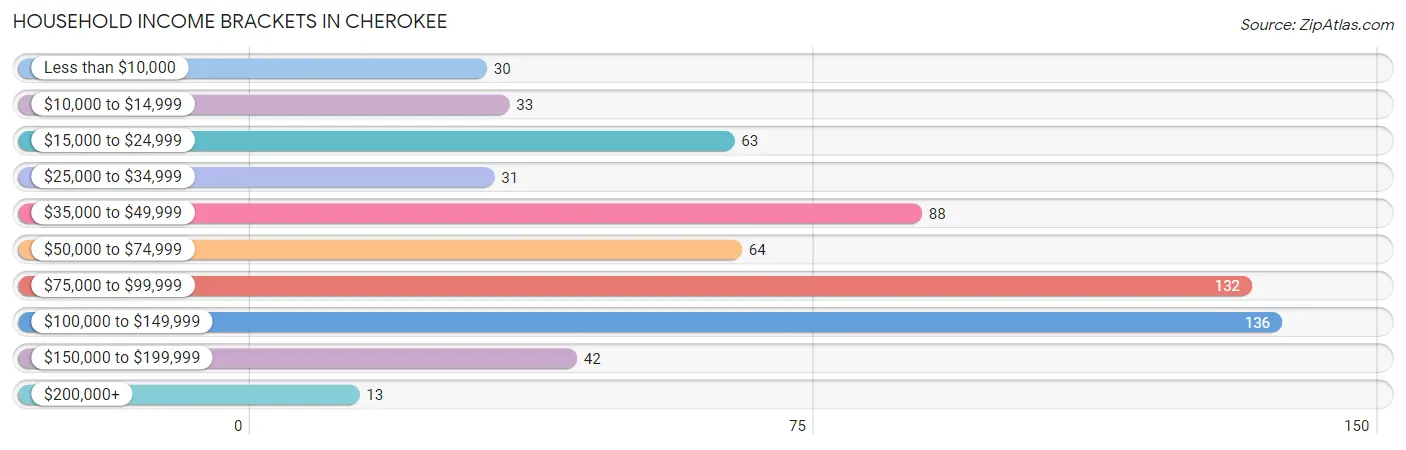
| Income Bracket | # Households | % Households |
| Less than $10,000 | 30 | 4.7% |
| $10,000 to $14,999 | 33 | 5.2% |
| $15,000 to $24,999 | 63 | 10.0% |
| $25,000 to $34,999 | 31 | 4.9% |
| $35,000 to $49,999 | 88 | 13.9% |
| $50,000 to $74,999 | 64 | 10.1% |
| $75,000 to $99,999 | 132 | 20.9% |
| $100,000 to $149,999 | 136 | 21.5% |
| $150,000 to $199,999 | 42 | 6.6% |
| $200,000+ | 13 | 2.1% |
Household Income by Householder Age in Cherokee
The median household income in Cherokee is $75,547, with the highest median household income of $83,750 found in the 25 to 44 years age bracket for the primary householder. A total of 170 households (26.9%) fall into this category. Meanwhile, the 65+ years age bracket for the primary householder has the lowest median household income of $49,844, with 203 households (32.1%) in this group.
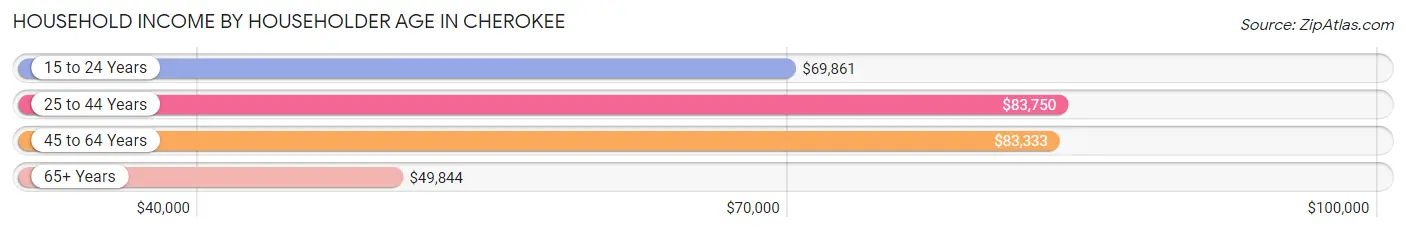
| Income Bracket | # Households | Median Income |
| 15 to 24 Years | 49 (7.7%) | $69,861 |
| 25 to 44 Years | 170 (26.9%) | $83,750 |
| 45 to 64 Years | 210 (33.2%) | $83,333 |
| 65+ Years | 203 (32.1%) | $49,844 |
| Total | 632 (100.0%) | $75,547 |
Poverty in Cherokee
Income Below Poverty by Sex and Age in Cherokee
With 17.0% poverty level for males and 16.4% for females among the residents of Cherokee, 5 year old males and 5 year old females are the most vulnerable to poverty, with 9 males (100.0%) and 9 females (69.2%) in their respective age groups living below the poverty level.
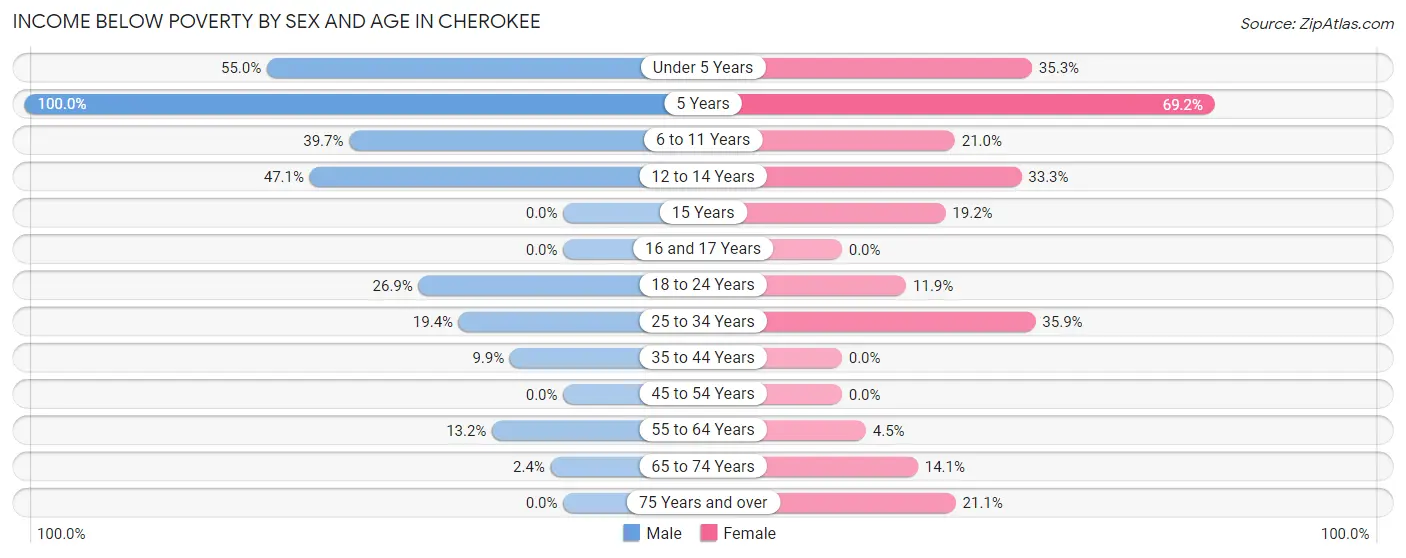
| Age Bracket | Male | Female |
| Under 5 Years | 22 (55.0%) | 18 (35.3%) |
| 5 Years | 9 (100.0%) | 9 (69.2%) |
| 6 to 11 Years | 31 (39.7%) | 13 (21.0%) |
| 12 to 14 Years | 8 (47.1%) | 12 (33.3%) |
| 15 Years | 0 (0.0%) | 5 (19.2%) |
| 16 and 17 Years | 0 (0.0%) | 0 (0.0%) |
| 18 to 24 Years | 18 (26.9%) | 8 (11.9%) |
| 25 to 34 Years | 19 (19.4%) | 23 (35.9%) |
| 35 to 44 Years | 9 (9.9%) | 0 (0.0%) |
| 45 to 54 Years | 0 (0.0%) | 0 (0.0%) |
| 55 to 64 Years | 14 (13.2%) | 5 (4.5%) |
| 65 to 74 Years | 2 (2.4%) | 11 (14.1%) |
| 75 Years and over | 0 (0.0%) | 15 (21.1%) |
| Total | 132 (17.0%) | 119 (16.4%) |
Income Above Poverty by Sex and Age in Cherokee
According to the poverty statistics in Cherokee, males aged 15 years and females aged 16 and 17 years are the age groups that are most secure financially, with 100.0% of males and 100.0% of females in these age groups living above the poverty line.
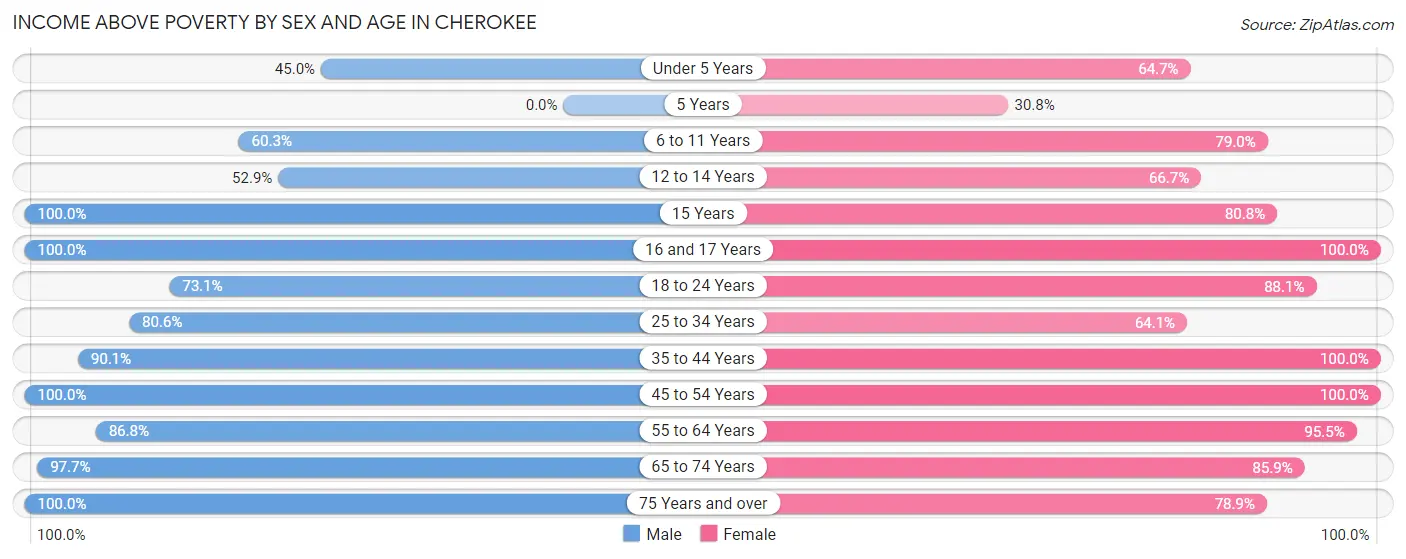
| Age Bracket | Male | Female |
| Under 5 Years | 18 (45.0%) | 33 (64.7%) |
| 5 Years | 0 (0.0%) | 4 (30.8%) |
| 6 to 11 Years | 47 (60.3%) | 49 (79.0%) |
| 12 to 14 Years | 9 (52.9%) | 24 (66.7%) |
| 15 Years | 19 (100.0%) | 21 (80.8%) |
| 16 and 17 Years | 17 (100.0%) | 8 (100.0%) |
| 18 to 24 Years | 49 (73.1%) | 59 (88.1%) |
| 25 to 34 Years | 79 (80.6%) | 41 (64.1%) |
| 35 to 44 Years | 82 (90.1%) | 69 (100.0%) |
| 45 to 54 Years | 100 (100.0%) | 69 (100.0%) |
| 55 to 64 Years | 92 (86.8%) | 107 (95.5%) |
| 65 to 74 Years | 83 (97.7%) | 67 (85.9%) |
| 75 Years and over | 51 (100.0%) | 56 (78.9%) |
| Total | 646 (83.0%) | 607 (83.6%) |
Income Below Poverty Among Married-Couple Families in Cherokee
The poverty statistics for married-couple families in Cherokee show that 2.7% or 10 of the total 375 families live below the poverty line. Families with 3 or 4 children have the highest poverty rate of 24.2%, comprising of 8 families. On the other hand, families with 1 or 2 children have the lowest poverty rate of 0.0%, which includes 0 families.
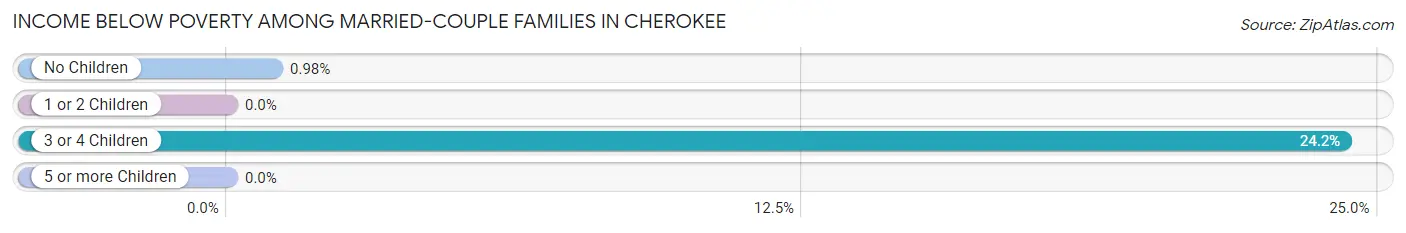
| Children | Above Poverty | Below Poverty |
| No Children | 202 (99.0%) | 2 (1.0%) |
| 1 or 2 Children | 138 (100.0%) | 0 (0.0%) |
| 3 or 4 Children | 25 (75.8%) | 8 (24.2%) |
| 5 or more Children | 0 (0.0%) | 0 (0.0%) |
| Total | 365 (97.3%) | 10 (2.7%) |
Income Below Poverty Among Single-Parent Households in Cherokee
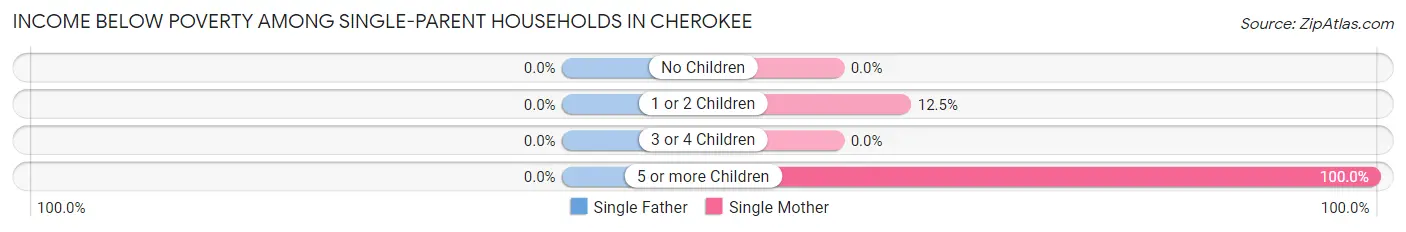
| Children | Single Father | Single Mother |
| No Children | 0 (0.0%) | 0 (0.0%) |
| 1 or 2 Children | 0 (0.0%) | 2 (12.5%) |
| 3 or 4 Children | 0 (0.0%) | 0 (0.0%) |
| 5 or more Children | 0 (0.0%) | 18 (100.0%) |
| Total | 0 (0.0%) | 20 (39.2%) |
Income Below Poverty Among Married-Couple vs Single-Parent Households in Cherokee
The poverty data for Cherokee shows that 10 of the married-couple family households (2.7%) and 20 of the single-parent households (27.0%) are living below the poverty level. Within the married-couple family households, those with 3 or 4 children have the highest poverty rate, with 8 households (24.2%) falling below the poverty line. Among the single-parent households, those with 5 or more children have the highest poverty rate, with 18 household (100.0%) living below poverty.
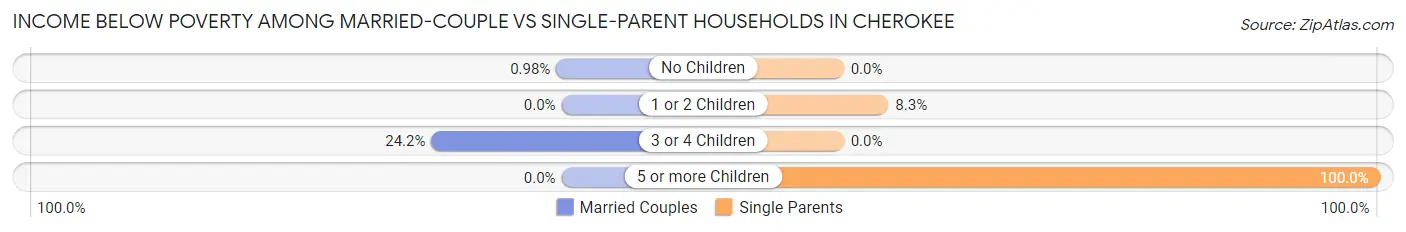
| Children | Married-Couple Families | Single-Parent Households |
| No Children | 2 (1.0%) | 0 (0.0%) |
| 1 or 2 Children | 0 (0.0%) | 2 (8.3%) |
| 3 or 4 Children | 8 (24.2%) | 0 (0.0%) |
| 5 or more Children | 0 (0.0%) | 18 (100.0%) |
| Total | 10 (2.7%) | 20 (27.0%) |
Race in Cherokee
The most populous races in Cherokee are White / Caucasian (1,344 | 86.4%), Two or more Races (128 | 8.2%), and Hispanic or Latino (109 | 7.0%).
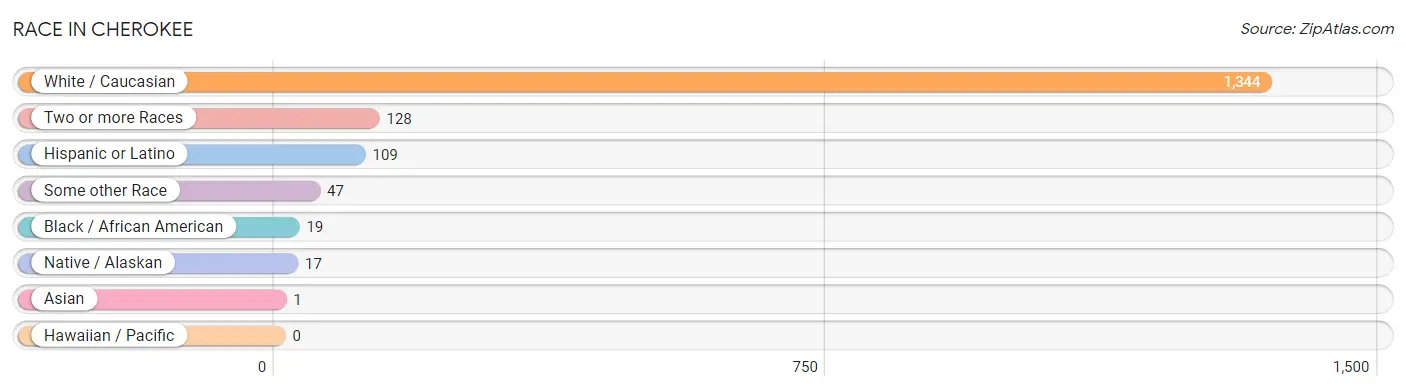
| Race | # Population | % Population |
| Asian | 1 | 0.1% |
| Black / African American | 19 | 1.2% |
| Hawaiian / Pacific | 0 | 0.0% |
| Hispanic or Latino | 109 | 7.0% |
| Native / Alaskan | 17 | 1.1% |
| White / Caucasian | 1,344 | 86.4% |
| Two or more Races | 128 | 8.2% |
| Some other Race | 47 | 3.0% |
| Total | 1,556 | 100.0% |
Ancestry in Cherokee
The most populous ancestries reported in Cherokee are German (347 | 22.3%), English (208 | 13.4%), Irish (139 | 8.9%), American (125 | 8.0%), and Mexican (108 | 6.9%), together accounting for 59.6% of all Cherokee residents.
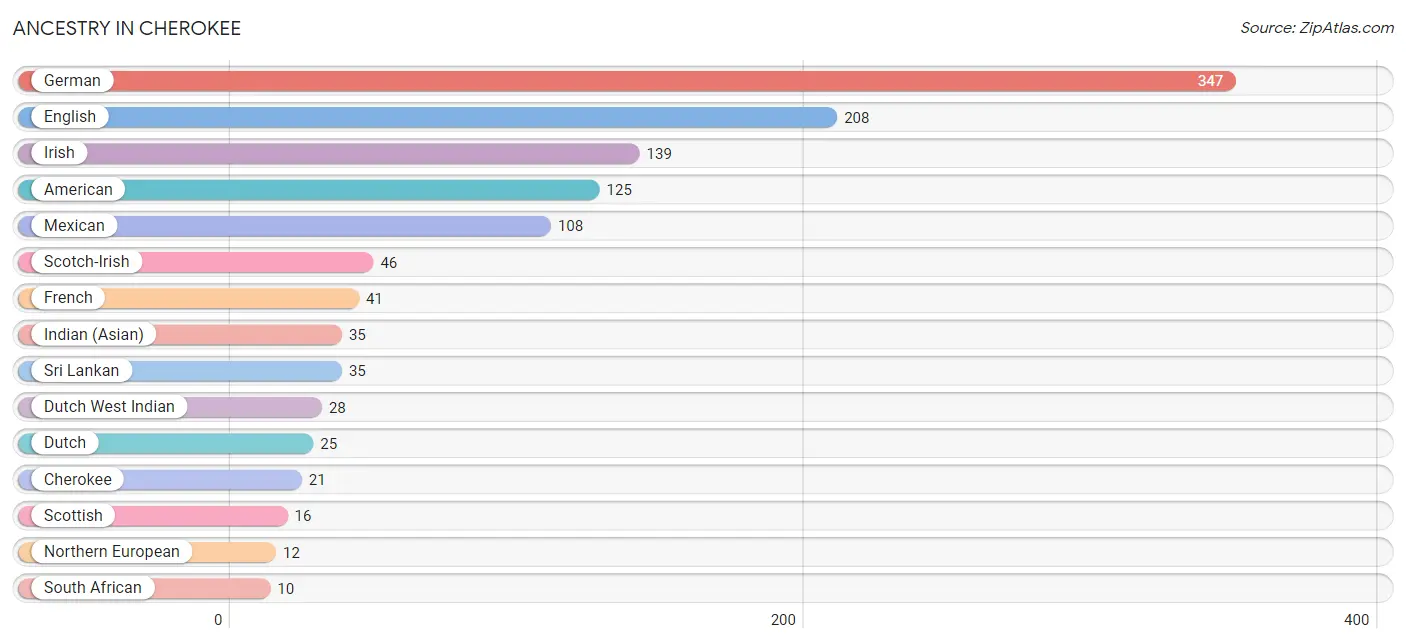
| Ancestry | # Population | % Population |
| American | 125 | 8.0% |
| British | 7 | 0.4% |
| Cherokee | 21 | 1.3% |
| Creek | 3 | 0.2% |
| Danish | 4 | 0.3% |
| Dutch | 25 | 1.6% |
| Dutch West Indian | 28 | 1.8% |
| English | 208 | 13.4% |
| European | 9 | 0.6% |
| French | 41 | 2.6% |
| German | 347 | 22.3% |
| Hungarian | 2 | 0.1% |
| Indian (Asian) | 35 | 2.2% |
| Irish | 139 | 8.9% |
| Korean | 1 | 0.1% |
| Lithuanian | 3 | 0.2% |
| Mexican | 108 | 6.9% |
| Northern European | 12 | 0.8% |
| Polish | 7 | 0.4% |
| Potawatomi | 1 | 0.1% |
| Russian | 9 | 0.6% |
| Scotch-Irish | 46 | 3.0% |
| Scottish | 16 | 1.0% |
| South African | 10 | 0.6% |
| Sri Lankan | 35 | 2.2% |
| Subsaharan African | 10 | 0.6% |
| Swiss | 6 | 0.4% |
| Welsh | 1 | 0.1% | View All 28 Rows |
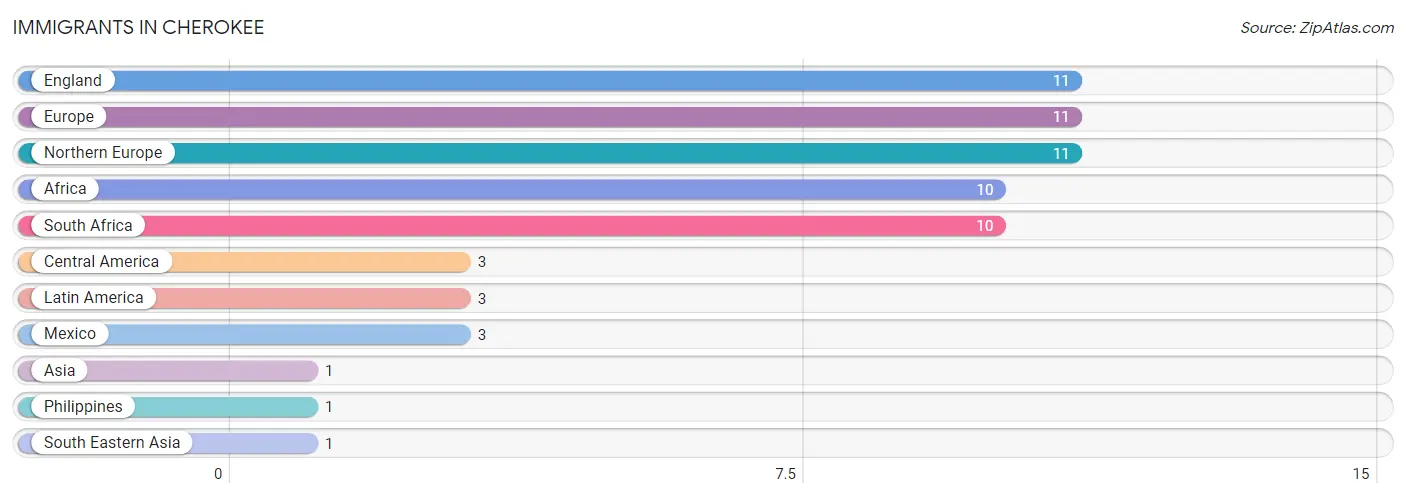
Immigrants in Cherokee
The most numerous immigrant groups reported in Cherokee came from England (11 | 0.7%), Europe (11 | 0.7%), Northern Europe (11 | 0.7%), Africa (10 | 0.6%), and South Africa (10 | 0.6%), together accounting for 3.4% of all Cherokee residents.
| Immigration Origin | # Population | % Population |
| Africa | 10 | 0.6% |
| Asia | 1 | 0.1% |
| Central America | 3 | 0.2% |
| England | 11 | 0.7% |
| Europe | 11 | 0.7% |
| Latin America | 3 | 0.2% |
| Mexico | 3 | 0.2% |
| Northern Europe | 11 | 0.7% |
| Philippines | 1 | 0.1% |
| South Africa | 10 | 0.6% |
| South Eastern Asia | 1 | 0.1% | View All 11 Rows |
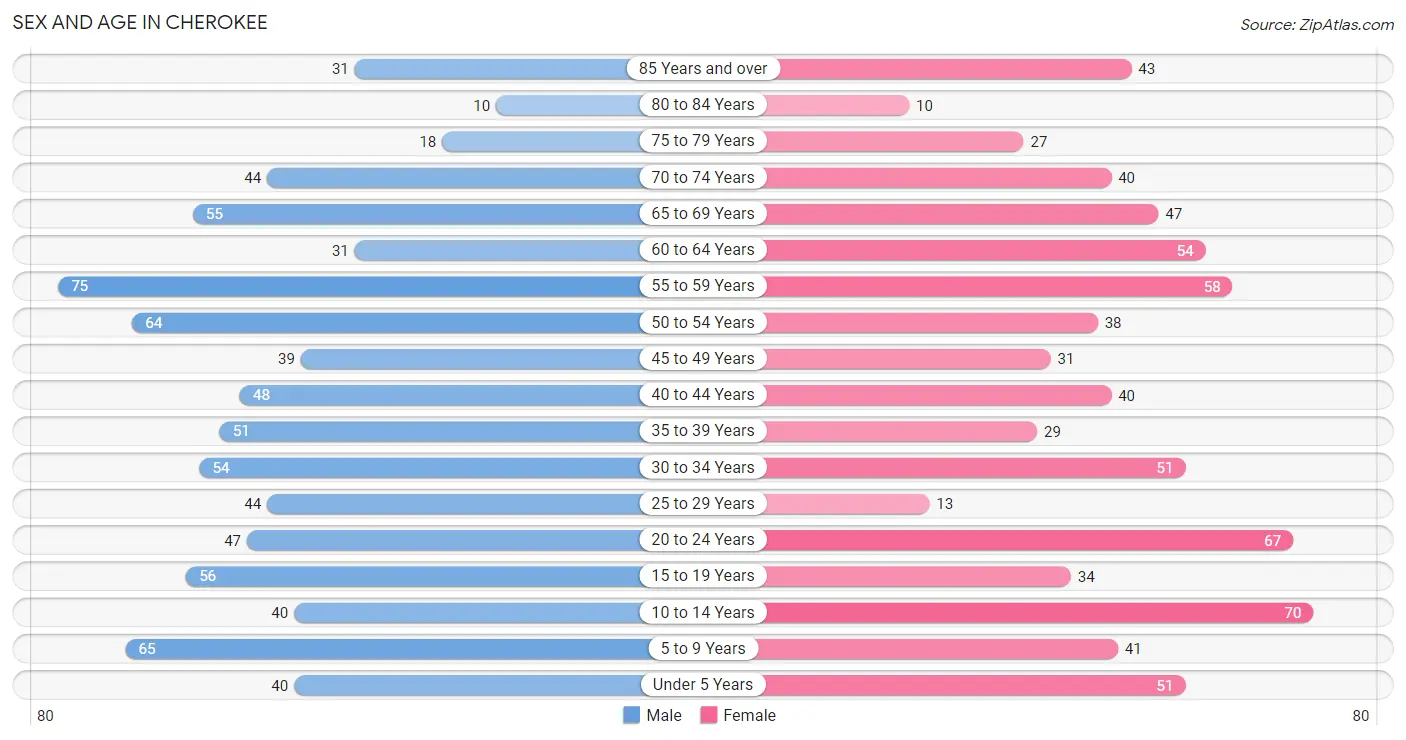
Sex and Age in Cherokee
Sex and Age in Cherokee
The most populous age groups in Cherokee are 55 to 59 Years (75 | 9.2%) for men and 10 to 14 Years (70 | 9.4%) for women.
| Age Bracket | Male | Female |
| Under 5 Years | 40 (4.9%) | 51 (6.9%) |
| 5 to 9 Years | 65 (8.0%) | 41 (5.5%) |
| 10 to 14 Years | 40 (4.9%) | 70 (9.4%) |
| 15 to 19 Years | 56 (6.9%) | 34 (4.6%) |
| 20 to 24 Years | 47 (5.8%) | 67 (9.0%) |
| 25 to 29 Years | 44 (5.4%) | 13 (1.8%) |
| 30 to 34 Years | 54 (6.7%) | 51 (6.9%) |
| 35 to 39 Years | 51 (6.3%) | 29 (3.9%) |
| 40 to 44 Years | 48 (5.9%) | 40 (5.4%) |
| 45 to 49 Years | 39 (4.8%) | 31 (4.2%) |
| 50 to 54 Years | 64 (7.9%) | 38 (5.1%) |
| 55 to 59 Years | 75 (9.2%) | 58 (7.8%) |
| 60 to 64 Years | 31 (3.8%) | 54 (7.3%) |
| 65 to 69 Years | 55 (6.8%) | 47 (6.3%) |
| 70 to 74 Years | 44 (5.4%) | 40 (5.4%) |
| 75 to 79 Years | 18 (2.2%) | 27 (3.6%) |
| 80 to 84 Years | 10 (1.2%) | 10 (1.3%) |
| 85 Years and over | 31 (3.8%) | 43 (5.8%) |
| Total | 812 (100.0%) | 744 (100.0%) |
Families and Households in Cherokee
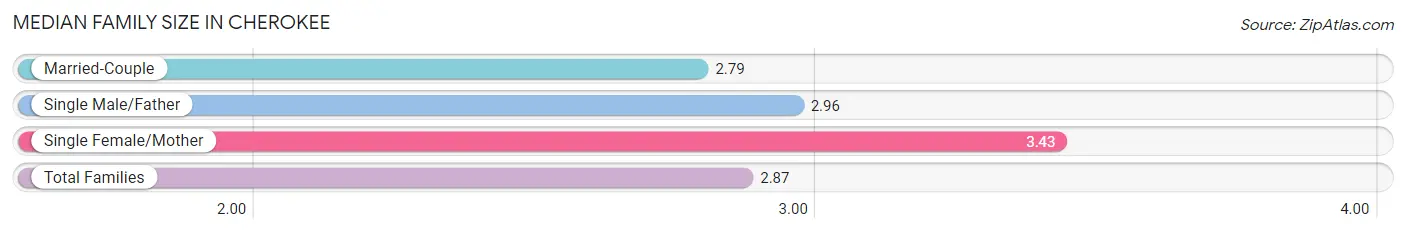
Median Family Size in Cherokee
The median family size in Cherokee is 2.87 persons per family, with single female/mother families (51 | 11.4%) accounting for the largest median family size of 3.43 persons per family. On the other hand, married-couple families (375 | 83.5%) represent the smallest median family size with 2.79 persons per family.
| Family Type | # Families | Family Size |
| Married-Couple | 375 (83.5%) | 2.79 |
| Single Male/Father | 23 (5.1%) | 2.96 |
| Single Female/Mother | 51 (11.4%) | 3.43 |
| Total Families | 449 (100.0%) | 2.87 |
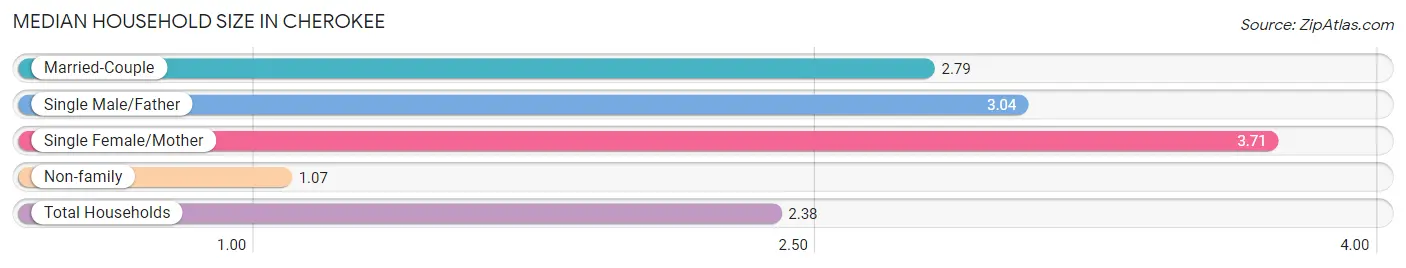
Median Household Size in Cherokee
The median household size in Cherokee is 2.38 persons per household, with single female/mother households (51 | 8.1%) accounting for the largest median household size of 3.71 persons per household. non-family households (183 | 29.0%) represent the smallest median household size with 1.07 persons per household.
| Household Type | # Households | Household Size |
| Married-Couple | 375 (59.3%) | 2.79 |
| Single Male/Father | 23 (3.6%) | 3.04 |
| Single Female/Mother | 51 (8.1%) | 3.71 |
| Non-family | 183 (29.0%) | 1.07 |
| Total Households | 632 (100.0%) | 2.38 |
Household Size by Marriage Status in Cherokee
Out of a total of 632 households in Cherokee, 449 (71.0%) are family households, while 183 (29.0%) are nonfamily households. The most numerous type of family households are 2-person households, comprising 212, and the most common type of nonfamily households are 1-person households, comprising 173.
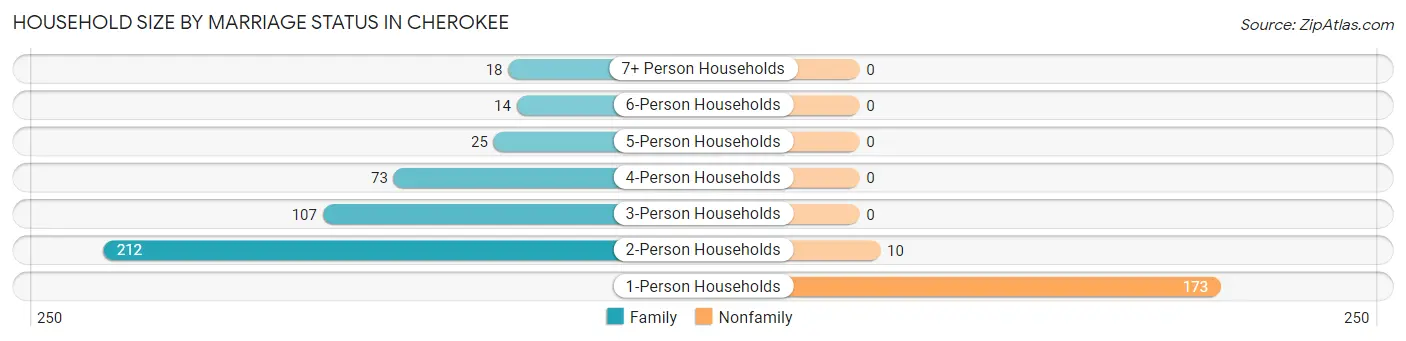
| Household Size | Family Households | Nonfamily Households |
| 1-Person Households | - | 173 (27.4%) |
| 2-Person Households | 212 (33.5%) | 10 (1.6%) |
| 3-Person Households | 107 (16.9%) | 0 (0.0%) |
| 4-Person Households | 73 (11.6%) | 0 (0.0%) |
| 5-Person Households | 25 (4.0%) | 0 (0.0%) |
| 6-Person Households | 14 (2.2%) | 0 (0.0%) |
| 7+ Person Households | 18 (2.9%) | 0 (0.0%) |
| Total | 449 (71.0%) | 183 (29.0%) |
Female Fertility in Cherokee
Fertility by Age in Cherokee
Average fertility rate in Cherokee is 115.0 births per 1,000 women. Women in the age bracket of 20 to 34 years have the highest fertility rate with 244.0 births per 1,000 women. Women in the age bracket of 20 to 34 years acount for 100.0% of all women with births.
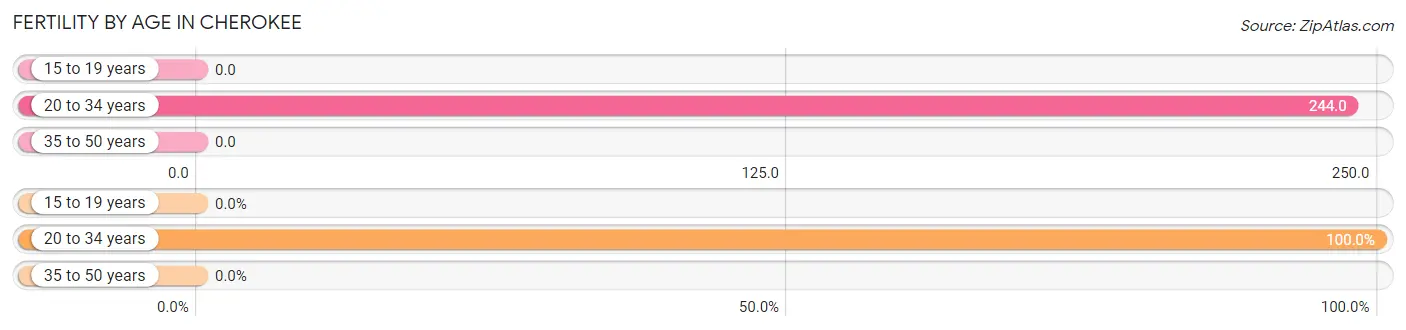
| Age Bracket | Women with Births | Births / 1,000 Women |
| 15 to 19 years | 0 (0.0%) | 0.0 |
| 20 to 34 years | 32 (100.0%) | 244.0 |
| 35 to 50 years | 0 (0.0%) | 0.0 |
| Total | 32 (100.0%) | 115.0 |
Fertility by Age by Marriage Status in Cherokee
21.9% of women with births (32) in Cherokee are married. The highest percentage of unmarried women with births falls into 20 to 34 years age bracket with 78.1% of them unmarried at the time of birth, while the lowest percentage of unmarried women with births belong to 20 to 34 years age bracket with 78.1% of them unmarried.
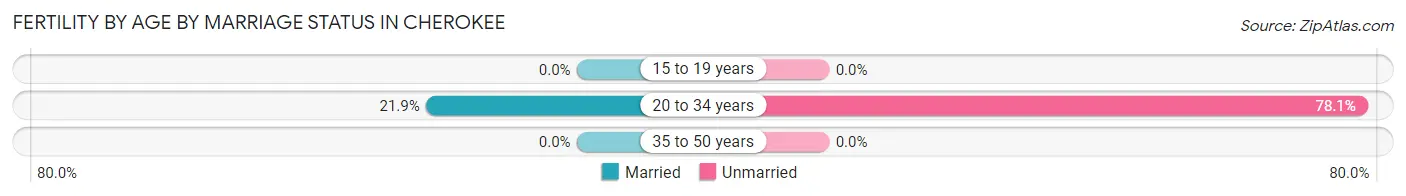
| Age Bracket | Married | Unmarried |
| 15 to 19 years | 0 (0.0%) | 0 (0.0%) |
| 20 to 34 years | 7 (21.9%) | 25 (78.1%) |
| 35 to 50 years | 0 (0.0%) | 0 (0.0%) |
| Total | 7 (21.9%) | 25 (78.1%) |
Fertility by Education in Cherokee
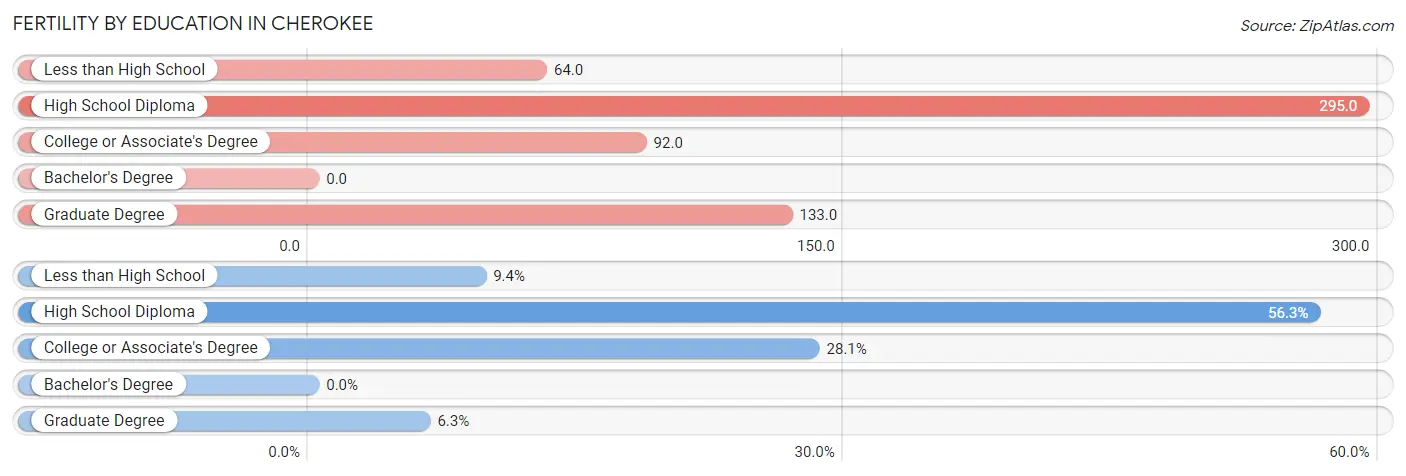
| Educational Attainment | Women with Births | Births / 1,000 Women |
| Less than High School | 3 (9.4%) | 64.0 |
| High School Diploma | 18 (56.2%) | 295.0 |
| College or Associate's Degree | 9 (28.1%) | 92.0 |
| Bachelor's Degree | 0 (0.0%) | 0.0 |
| Graduate Degree | 2 (6.2%) | 133.0 |
| Total | 32 (100.0%) | 115.0 |
Fertility by Education by Marriage Status in Cherokee
78.1% of women with births in Cherokee are unmarried. Women with the educational attainment of less than high school are most likely to be married with 100.0% of them married at childbirth, while women with the educational attainment of high school diploma are least likely to be married with 100.0% of them unmarried at childbirth.
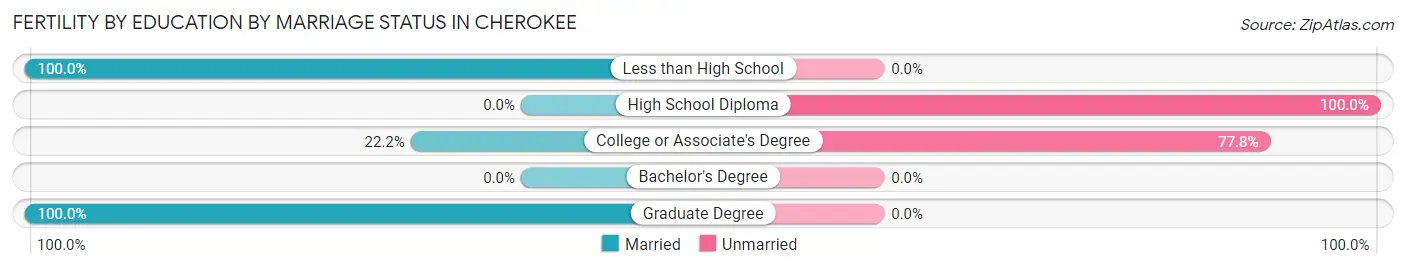
| Educational Attainment | Married | Unmarried |
| Less than High School | 3 (100.0%) | 0 (0.0%) |
| High School Diploma | 0 (0.0%) | 18 (100.0%) |
| College or Associate's Degree | 2 (22.2%) | 7 (77.8%) |
| Bachelor's Degree | 0 (0.0%) | 0 (0.0%) |
| Graduate Degree | 2 (100.0%) | 0 (0.0%) |
| Total | 7 (21.9%) | 25 (78.1%) |
Employment Characteristics in Cherokee
Employment by Class of Employer in Cherokee
Among the 688 employed individuals in Cherokee, private company employees (353 | 51.3%), state government employees (98 | 14.2%), and local government employees (82 | 11.9%) make up the most common classes of employment.
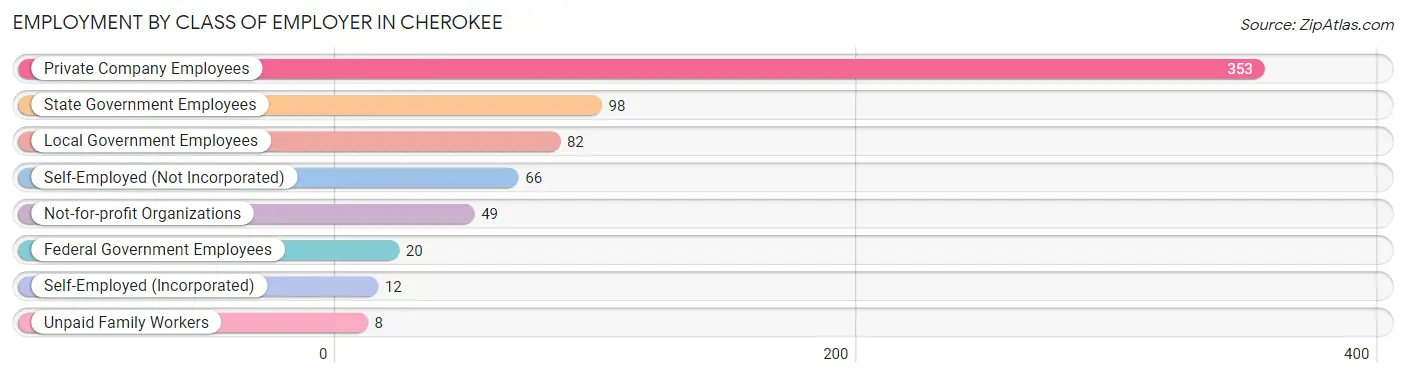
| Employer Class | # Employees | % Employees |
| Private Company Employees | 353 | 51.3% |
| Self-Employed (Incorporated) | 12 | 1.7% |
| Self-Employed (Not Incorporated) | 66 | 9.6% |
| Not-for-profit Organizations | 49 | 7.1% |
| Local Government Employees | 82 | 11.9% |
| State Government Employees | 98 | 14.2% |
| Federal Government Employees | 20 | 2.9% |
| Unpaid Family Workers | 8 | 1.2% |
| Total | 688 | 100.0% |
Employment Status by Age in Cherokee
According to the labor force statistics for Cherokee, out of the total population over 16 years of age (1,204), 61.6% or 742 individuals are in the labor force, with 6.9% or 51 of them unemployed. The age group with the highest labor force participation rate is 25 to 29 years, with 100.0% or 57 individuals in the labor force. Within the labor force, the 16 to 19 years age range has the highest percentage of unemployed individuals, with 55.2% or 16 of them being unemployed.
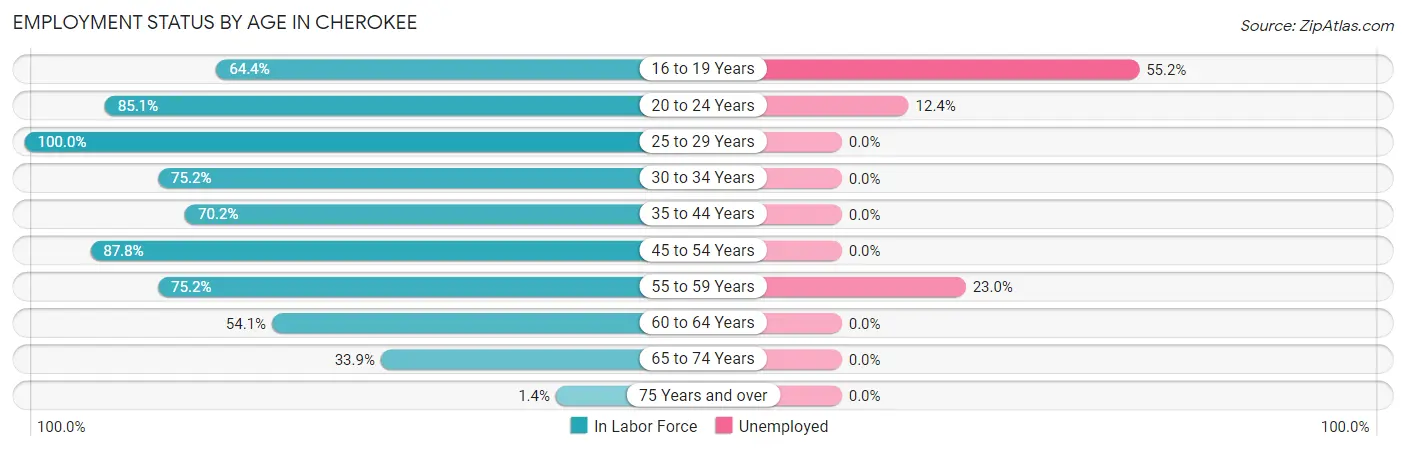
| Age Bracket | In Labor Force | Unemployed |
| 16 to 19 Years | 29 (64.4%) | 16 (55.2%) |
| 20 to 24 Years | 97 (85.1%) | 12 (12.4%) |
| 25 to 29 Years | 57 (100.0%) | 0 (0.0%) |
| 30 to 34 Years | 79 (75.2%) | 0 (0.0%) |
| 35 to 44 Years | 118 (70.2%) | 0 (0.0%) |
| 45 to 54 Years | 151 (87.8%) | 0 (0.0%) |
| 55 to 59 Years | 100 (75.2%) | 23 (23.0%) |
| 60 to 64 Years | 46 (54.1%) | 0 (0.0%) |
| 65 to 74 Years | 63 (33.9%) | 0 (0.0%) |
| 75 Years and over | 2 (1.4%) | 0 (0.0%) |
| Total | 742 (61.6%) | 51 (6.9%) |
Employment Status by Educational Attainment in Cherokee
According to labor force statistics for Cherokee, 76.5% of individuals (551) out of the total population between 25 and 64 years of age (720) are in the labor force, with 4.2% or 23 of them being unemployed. The group with the highest labor force participation rate are those with the educational attainment of high school diploma, with 81.1% or 167 individuals in the labor force. Within the labor force, individuals with bachelor's degree or higher education have the highest percentage of unemployment, with 14.2% or 23 of them being unemployed.
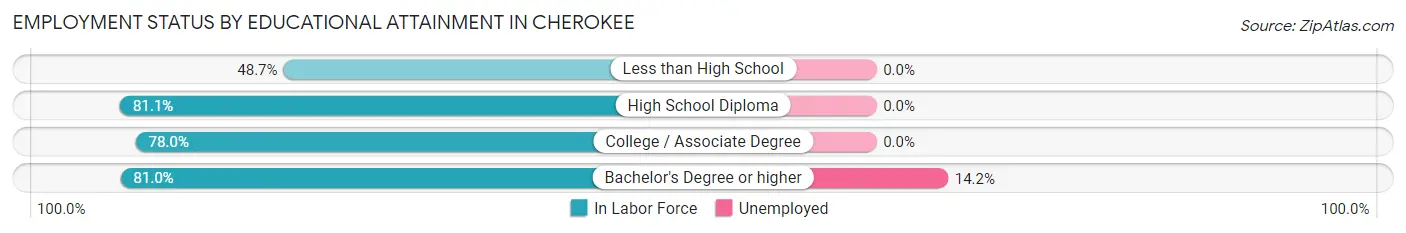
| Educational Attainment | In Labor Force | Unemployed |
| Less than High School | 38 (48.7%) | 0 (0.0%) |
| High School Diploma | 167 (81.1%) | 0 (0.0%) |
| College / Associate Degree | 184 (78.0%) | 0 (0.0%) |
| Bachelor's Degree or higher | 162 (81.0%) | 28 (14.2%) |
| Total | 551 (76.5%) | 30 (4.2%) |
Employment Occupations by Sex in Cherokee
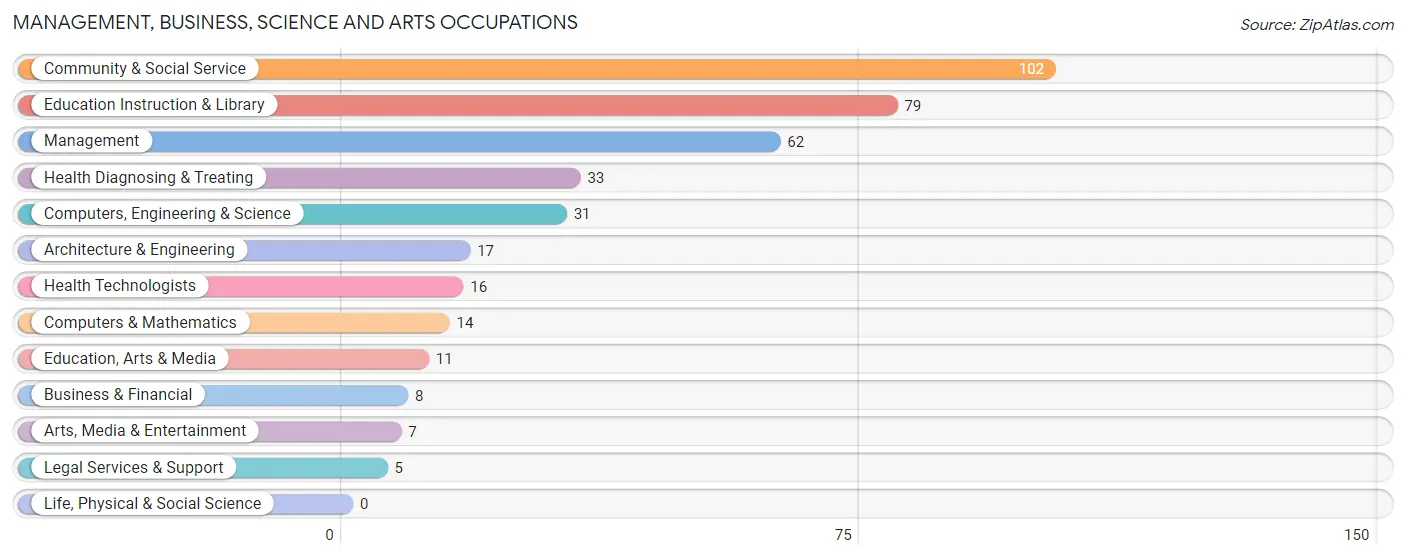
Management, Business, Science and Arts Occupations
The most common Management, Business, Science and Arts occupations in Cherokee are Community & Social Service (102 | 14.8%), Education Instruction & Library (79 | 11.4%), Management (62 | 9.0%), Health Diagnosing & Treating (33 | 4.8%), and Computers, Engineering & Science (31 | 4.5%).
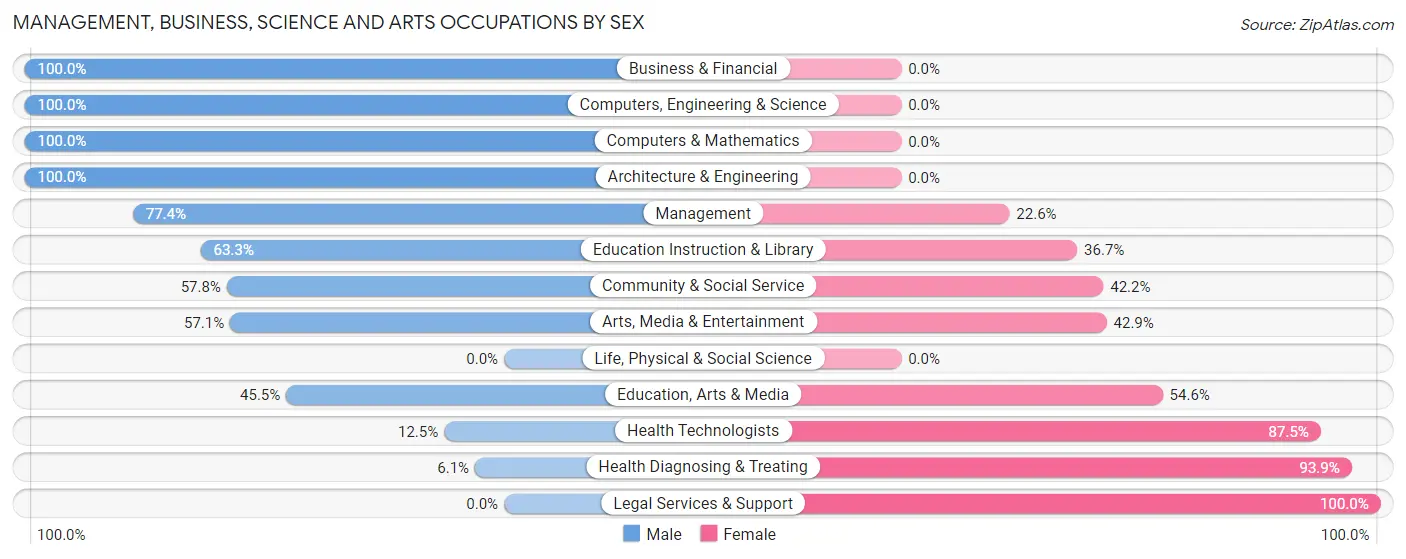
Management, Business, Science and Arts Occupations by Sex
Within the Management, Business, Science and Arts occupations in Cherokee, the most male-oriented occupations are Business & Financial (100.0%), Computers, Engineering & Science (100.0%), and Computers & Mathematics (100.0%), while the most female-oriented occupations are Legal Services & Support (100.0%), Health Diagnosing & Treating (93.9%), and Health Technologists (87.5%).
| Occupation | Male | Female |
| Management | 48 (77.4%) | 14 (22.6%) |
| Business & Financial | 8 (100.0%) | 0 (0.0%) |
| Computers, Engineering & Science | 31 (100.0%) | 0 (0.0%) |
| Computers & Mathematics | 14 (100.0%) | 0 (0.0%) |
| Architecture & Engineering | 17 (100.0%) | 0 (0.0%) |
| Life, Physical & Social Science | 0 (0.0%) | 0 (0.0%) |
| Community & Social Service | 59 (57.8%) | 43 (42.2%) |
| Education, Arts & Media | 5 (45.5%) | 6 (54.5%) |
| Legal Services & Support | 0 (0.0%) | 5 (100.0%) |
| Education Instruction & Library | 50 (63.3%) | 29 (36.7%) |
| Arts, Media & Entertainment | 4 (57.1%) | 3 (42.9%) |
| Health Diagnosing & Treating | 2 (6.1%) | 31 (93.9%) |
| Health Technologists | 2 (12.5%) | 14 (87.5%) |
| Total (Category) | 148 (62.7%) | 88 (37.3%) |
| Total (Overall) | 410 (59.3%) | 281 (40.7%) |
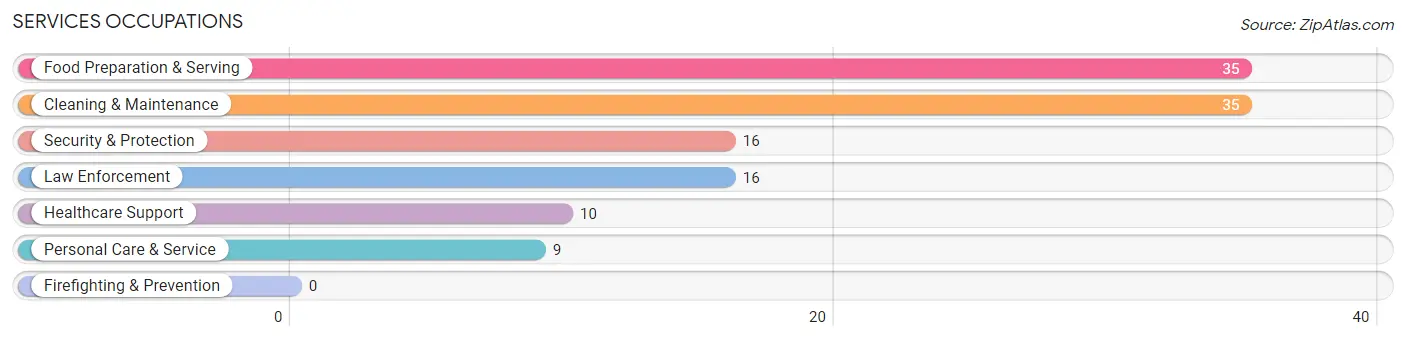
Services Occupations
The most common Services occupations in Cherokee are Food Preparation & Serving (35 | 5.1%), Cleaning & Maintenance (35 | 5.1%), Security & Protection (16 | 2.3%), Law Enforcement (16 | 2.3%), and Healthcare Support (10 | 1.5%).
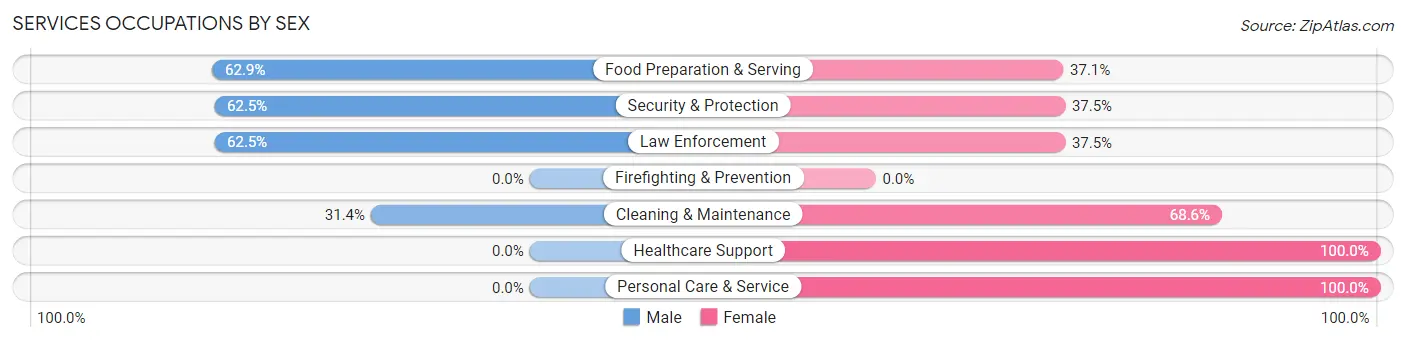
Services Occupations by Sex
Within the Services occupations in Cherokee, the most male-oriented occupations are Food Preparation & Serving (62.9%), Security & Protection (62.5%), and Law Enforcement (62.5%), while the most female-oriented occupations are Healthcare Support (100.0%), Personal Care & Service (100.0%), and Cleaning & Maintenance (68.6%).
| Occupation | Male | Female |
| Healthcare Support | 0 (0.0%) | 10 (100.0%) |
| Security & Protection | 10 (62.5%) | 6 (37.5%) |
| Firefighting & Prevention | 0 (0.0%) | 0 (0.0%) |
| Law Enforcement | 10 (62.5%) | 6 (37.5%) |
| Food Preparation & Serving | 22 (62.9%) | 13 (37.1%) |
| Cleaning & Maintenance | 11 (31.4%) | 24 (68.6%) |
| Personal Care & Service | 0 (0.0%) | 9 (100.0%) |
| Total (Category) | 43 (40.9%) | 62 (59.1%) |
| Total (Overall) | 410 (59.3%) | 281 (40.7%) |
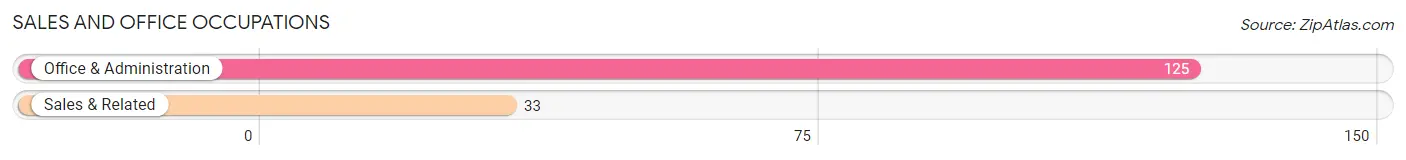
Sales and Office Occupations
The most common Sales and Office occupations in Cherokee are Office & Administration (125 | 18.1%), and Sales & Related (33 | 4.8%).
Sales and Office Occupations by Sex
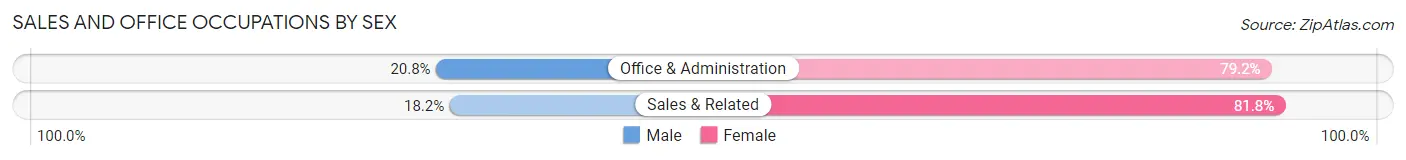
| Occupation | Male | Female |
| Sales & Related | 6 (18.2%) | 27 (81.8%) |
| Office & Administration | 26 (20.8%) | 99 (79.2%) |
| Total (Category) | 32 (20.3%) | 126 (79.7%) |
| Total (Overall) | 410 (59.3%) | 281 (40.7%) |
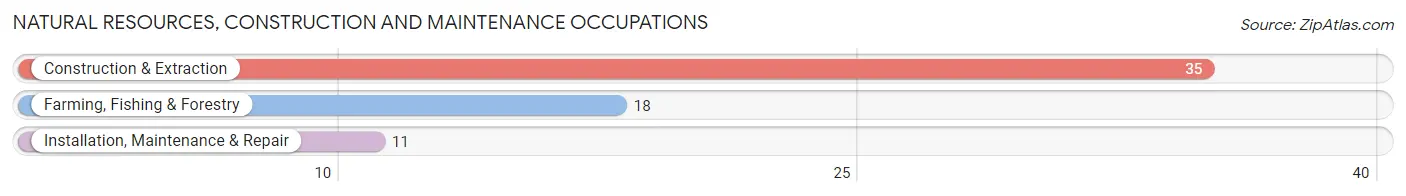
Natural Resources, Construction and Maintenance Occupations
The most common Natural Resources, Construction and Maintenance occupations in Cherokee are Construction & Extraction (35 | 5.1%), Farming, Fishing & Forestry (18 | 2.6%), and Installation, Maintenance & Repair (11 | 1.6%).
Natural Resources, Construction and Maintenance Occupations by Sex
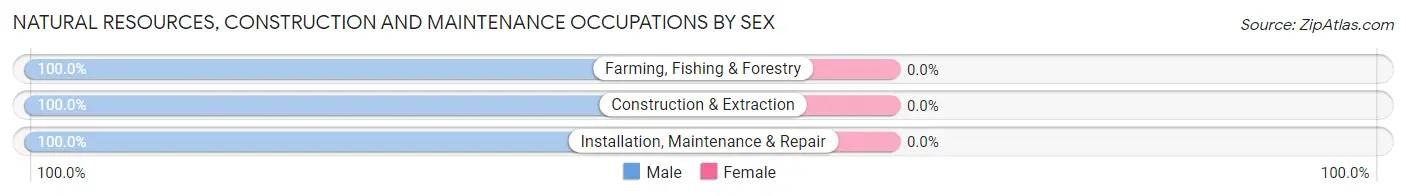
| Occupation | Male | Female |
| Farming, Fishing & Forestry | 18 (100.0%) | 0 (0.0%) |
| Construction & Extraction | 35 (100.0%) | 0 (0.0%) |
| Installation, Maintenance & Repair | 11 (100.0%) | 0 (0.0%) |
| Total (Category) | 64 (100.0%) | 0 (0.0%) |
| Total (Overall) | 410 (59.3%) | 281 (40.7%) |
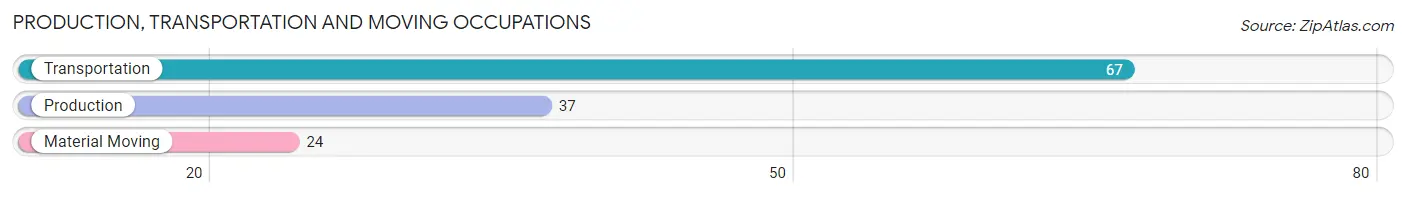
Production, Transportation and Moving Occupations
The most common Production, Transportation and Moving occupations in Cherokee are Transportation (67 | 9.7%), Production (37 | 5.3%), and Material Moving (24 | 3.5%).
Production, Transportation and Moving Occupations by Sex
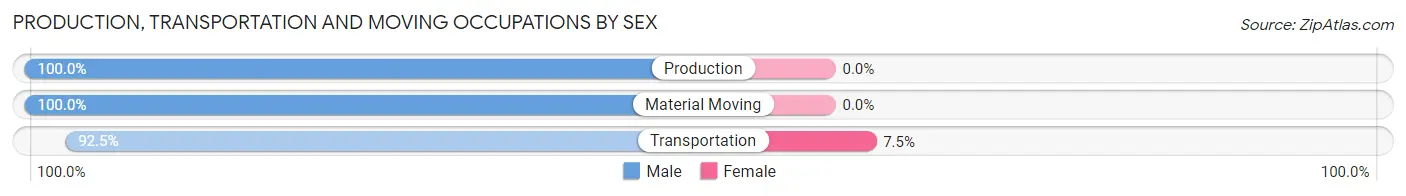
| Occupation | Male | Female |
| Production | 37 (100.0%) | 0 (0.0%) |
| Transportation | 62 (92.5%) | 5 (7.5%) |
| Material Moving | 24 (100.0%) | 0 (0.0%) |
| Total (Category) | 123 (96.1%) | 5 (3.9%) |
| Total (Overall) | 410 (59.3%) | 281 (40.7%) |
Employment Industries by Sex in Cherokee
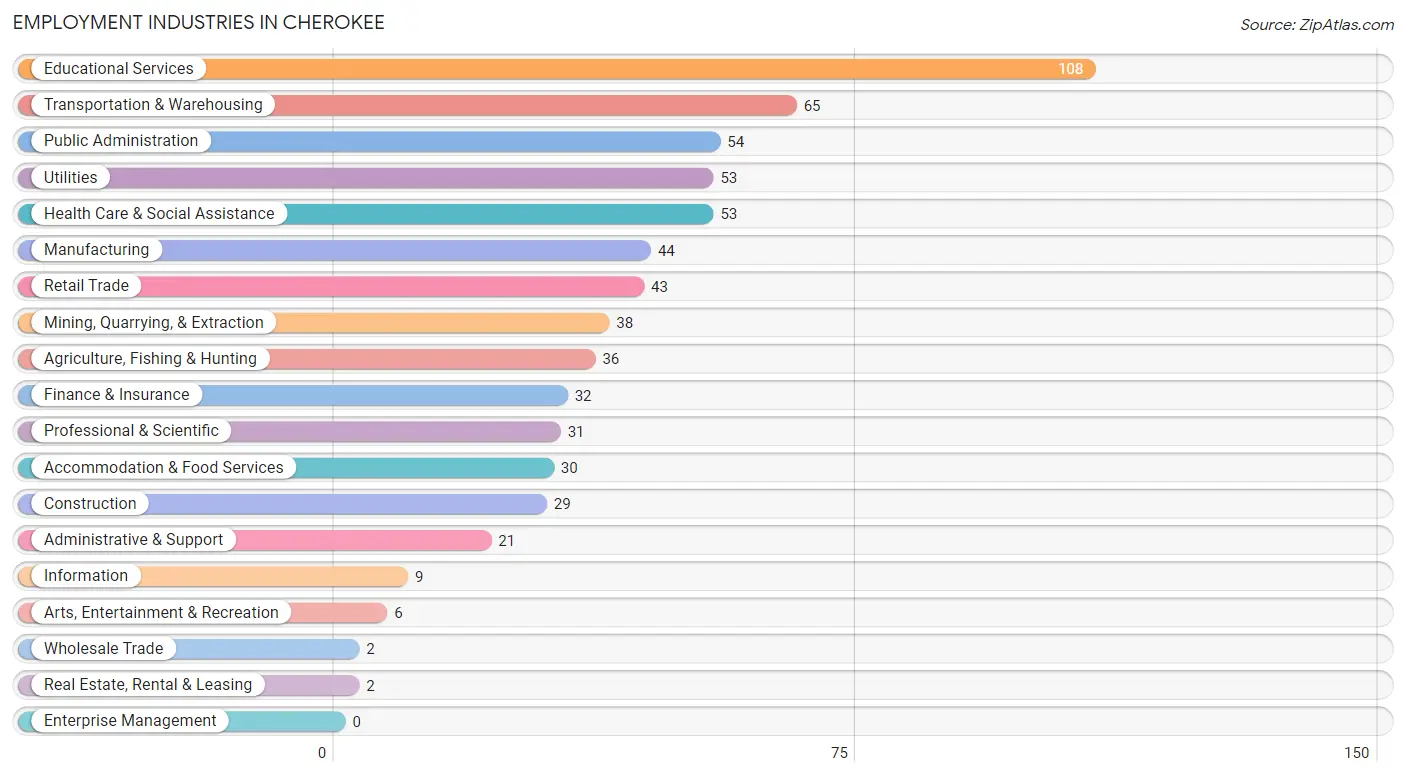
Employment Industries in Cherokee
The major employment industries in Cherokee include Educational Services (108 | 15.6%), Transportation & Warehousing (65 | 9.4%), Public Administration (54 | 7.8%), Utilities (53 | 7.7%), and Health Care & Social Assistance (53 | 7.7%).
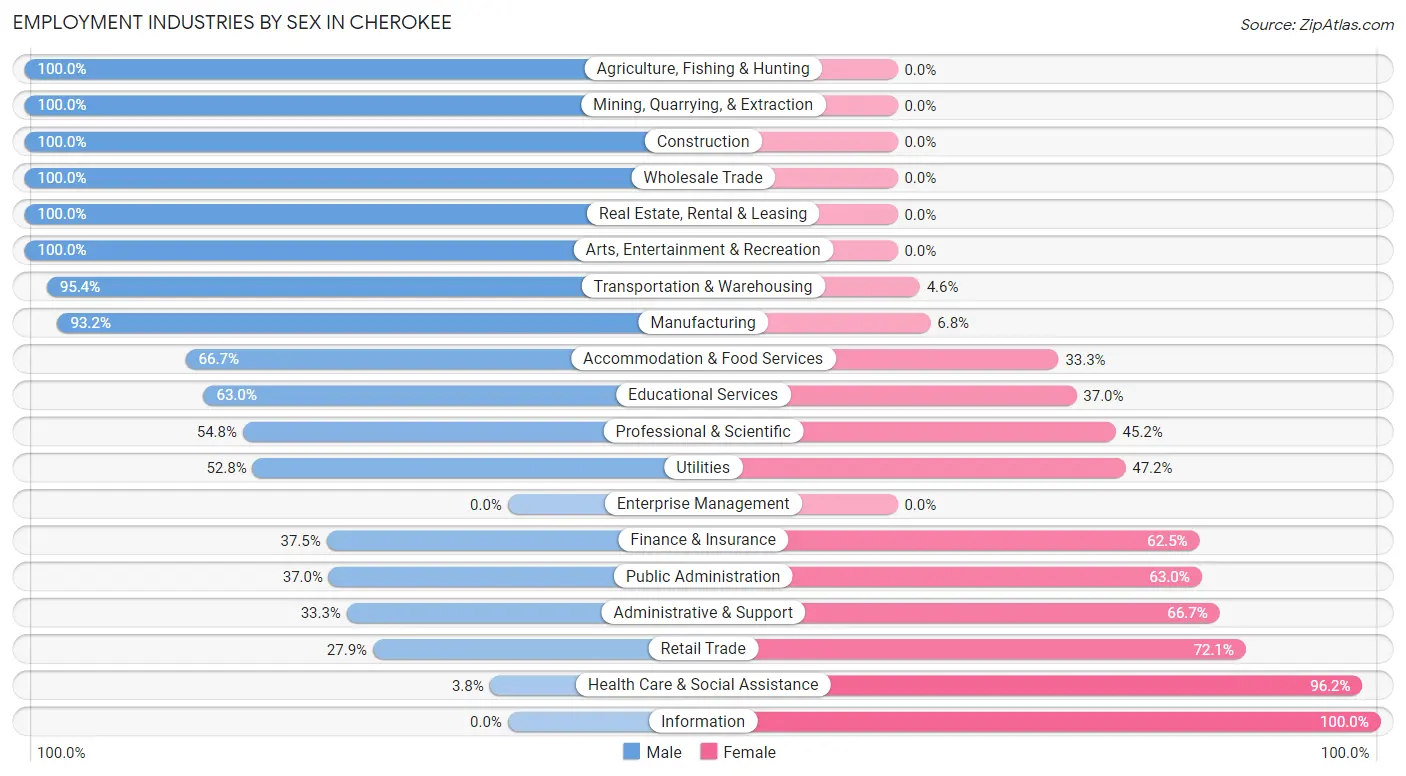
Employment Industries by Sex in Cherokee
The Cherokee industries that see more men than women are Agriculture, Fishing & Hunting (100.0%), Mining, Quarrying, & Extraction (100.0%), and Construction (100.0%), whereas the industries that tend to have a higher number of women are Information (100.0%), Health Care & Social Assistance (96.2%), and Retail Trade (72.1%).
| Industry | Male | Female |
| Agriculture, Fishing & Hunting | 36 (100.0%) | 0 (0.0%) |
| Mining, Quarrying, & Extraction | 38 (100.0%) | 0 (0.0%) |
| Construction | 29 (100.0%) | 0 (0.0%) |
| Manufacturing | 41 (93.2%) | 3 (6.8%) |
| Wholesale Trade | 2 (100.0%) | 0 (0.0%) |
| Retail Trade | 12 (27.9%) | 31 (72.1%) |
| Transportation & Warehousing | 62 (95.4%) | 3 (4.6%) |
| Utilities | 28 (52.8%) | 25 (47.2%) |
| Information | 0 (0.0%) | 9 (100.0%) |
| Finance & Insurance | 12 (37.5%) | 20 (62.5%) |
| Real Estate, Rental & Leasing | 2 (100.0%) | 0 (0.0%) |
| Professional & Scientific | 17 (54.8%) | 14 (45.2%) |
| Enterprise Management | 0 (0.0%) | 0 (0.0%) |
| Administrative & Support | 7 (33.3%) | 14 (66.7%) |
| Educational Services | 68 (63.0%) | 40 (37.0%) |
| Health Care & Social Assistance | 2 (3.8%) | 51 (96.2%) |
| Arts, Entertainment & Recreation | 6 (100.0%) | 0 (0.0%) |
| Accommodation & Food Services | 20 (66.7%) | 10 (33.3%) |
| Public Administration | 20 (37.0%) | 34 (63.0%) |
| Total | 410 (59.3%) | 281 (40.7%) |
Education in Cherokee
School Enrollment in Cherokee
The most common levels of schooling among the 312 students in Cherokee are middle school (106 | 34.0%), elementary school (90 | 28.8%), and high school (47 | 15.1%).
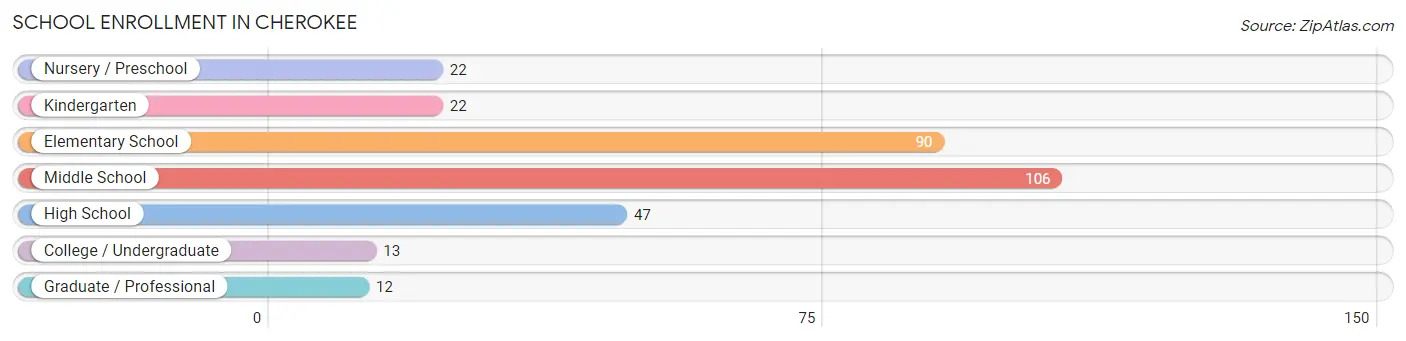
| School Level | # Students | % Students |
| Nursery / Preschool | 22 | 7.0% |
| Kindergarten | 22 | 7.0% |
| Elementary School | 90 | 28.8% |
| Middle School | 106 | 34.0% |
| High School | 47 | 15.1% |
| College / Undergraduate | 13 | 4.2% |
| Graduate / Professional | 12 | 3.8% |
| Total | 312 | 100.0% |
School Enrollment by Age by Funding Source in Cherokee
Out of a total of 312 students who are enrolled in schools in Cherokee, 16 (5.1%) attend a private institution, while the remaining 296 (94.9%) are enrolled in public schools. The age group of 10 to 14 year olds has the highest likelihood of being enrolled in private schools, with 12 (12.8% in the age bracket) enrolled. Conversely, the age group of 3 to 4 year olds has the lowest likelihood of being enrolled in a private school, with 20 (100.0% in the age bracket) attending a public institution.
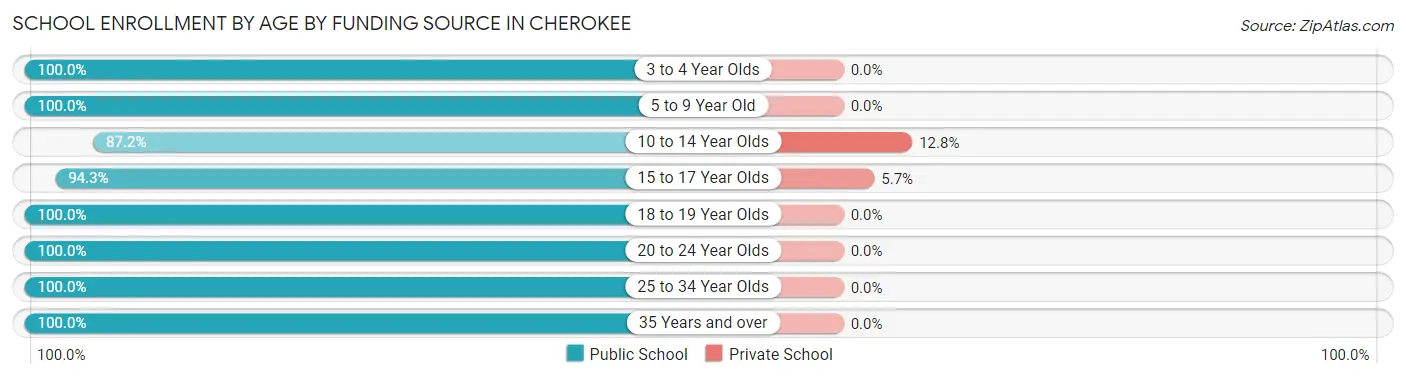
| Age Bracket | Public School | Private School |
| 3 to 4 Year Olds | 20 (100.0%) | 0 (0.0%) |
| 5 to 9 Year Old | 102 (100.0%) | 0 (0.0%) |
| 10 to 14 Year Olds | 82 (87.2%) | 12 (12.8%) |
| 15 to 17 Year Olds | 66 (94.3%) | 4 (5.7%) |
| 18 to 19 Year Olds | 4 (100.0%) | 0 (0.0%) |
| 20 to 24 Year Olds | 11 (100.0%) | 0 (0.0%) |
| 25 to 34 Year Olds | 5 (100.0%) | 0 (0.0%) |
| 35 Years and over | 6 (100.0%) | 0 (0.0%) |
| Total | 296 (94.9%) | 16 (5.1%) |
Educational Attainment by Field of Study in Cherokee
Education (108 | 38.4%), bio, nature & agricultural (43 | 15.3%), science & technology (39 | 13.9%), liberal arts & history (23 | 8.2%), and physical & health sciences (17 | 6.0%) are the most common fields of study among 281 individuals in Cherokee who have obtained a bachelor's degree or higher.
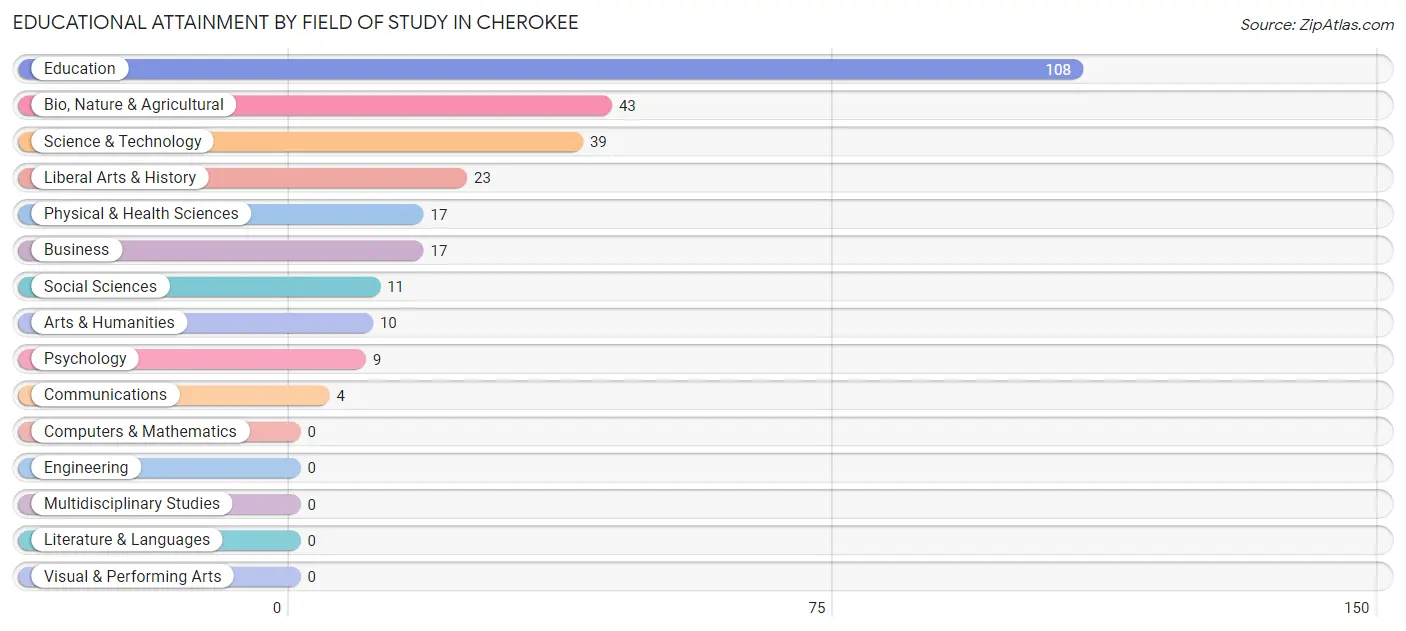
| Field of Study | # Graduates | % Graduates |
| Computers & Mathematics | 0 | 0.0% |
| Bio, Nature & Agricultural | 43 | 15.3% |
| Physical & Health Sciences | 17 | 6.0% |
| Psychology | 9 | 3.2% |
| Social Sciences | 11 | 3.9% |
| Engineering | 0 | 0.0% |
| Multidisciplinary Studies | 0 | 0.0% |
| Science & Technology | 39 | 13.9% |
| Business | 17 | 6.0% |
| Education | 108 | 38.4% |
| Literature & Languages | 0 | 0.0% |
| Liberal Arts & History | 23 | 8.2% |
| Visual & Performing Arts | 0 | 0.0% |
| Communications | 4 | 1.4% |
| Arts & Humanities | 10 | 3.6% |
| Total | 281 | 100.0% |
Transportation & Commute in Cherokee
Vehicle Availability by Sex in Cherokee
The most prevalent vehicle ownership categories in Cherokee are males with 2 vehicles (181, accounting for 44.2%) and females with 2 vehicles (153, making up 65.1%).
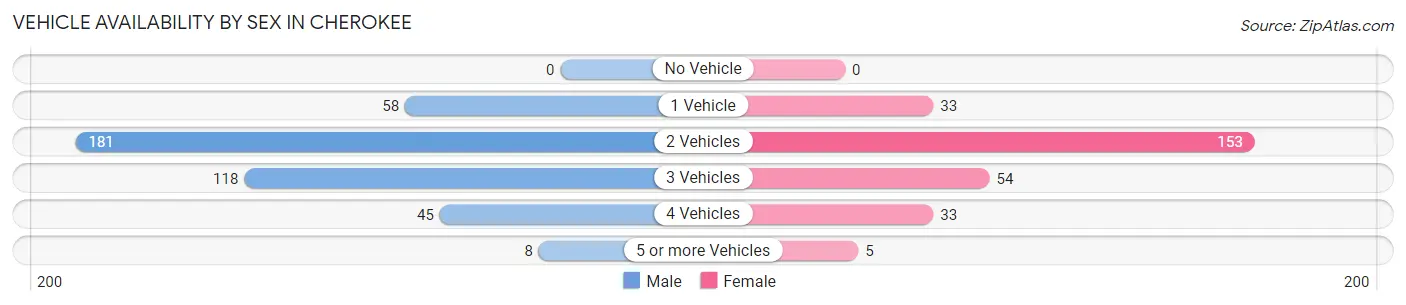
| Vehicles Available | Male | Female |
| No Vehicle | 0 (0.0%) | 0 (0.0%) |
| 1 Vehicle | 58 (14.1%) | 33 (11.9%) |
| 2 Vehicles | 181 (44.2%) | 153 (55.0%) |
| 3 Vehicles | 118 (28.8%) | 54 (19.4%) |
| 4 Vehicles | 45 (11.0%) | 33 (11.9%) |
| 5 or more Vehicles | 8 (1.9%) | 5 (1.8%) |
| Total | 410 (100.0%) | 278 (100.0%) |
Commute Time in Cherokee
The most frequently occuring commute durations in Cherokee are less than 5 minutes (143 commuters, 21.8%), 5 to 9 minutes (140 commuters, 21.4%), and 20 to 24 minutes (85 commuters, 13.0%).
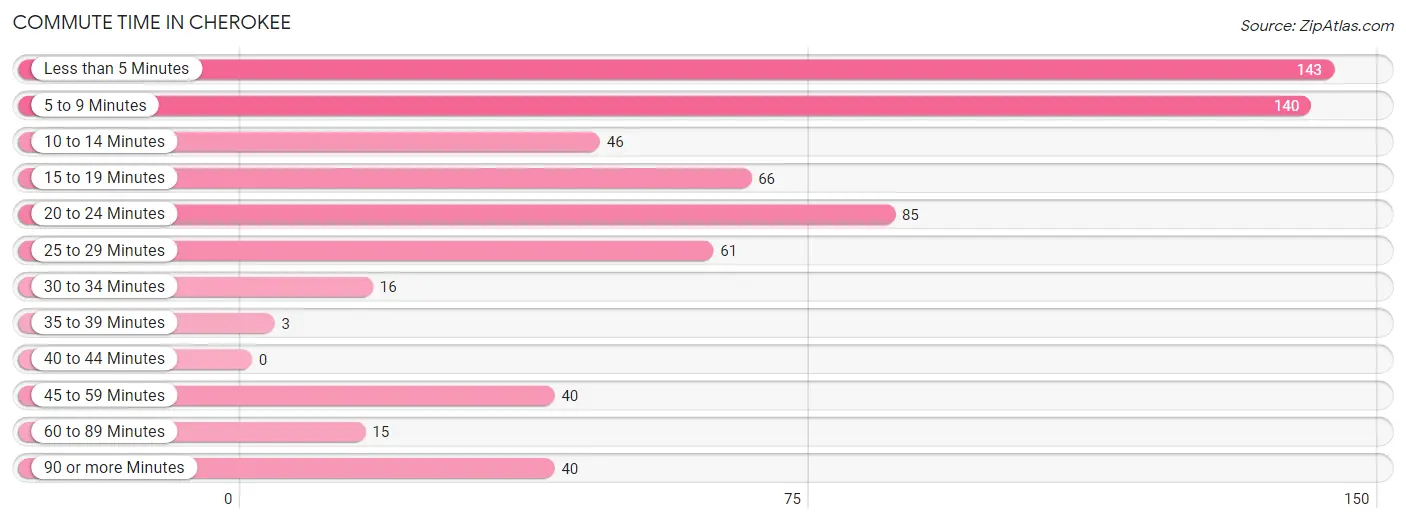
| Commute Time | # Commuters | % Commuters |
| Less than 5 Minutes | 143 | 21.8% |
| 5 to 9 Minutes | 140 | 21.4% |
| 10 to 14 Minutes | 46 | 7.0% |
| 15 to 19 Minutes | 66 | 10.1% |
| 20 to 24 Minutes | 85 | 13.0% |
| 25 to 29 Minutes | 61 | 9.3% |
| 30 to 34 Minutes | 16 | 2.4% |
| 35 to 39 Minutes | 3 | 0.5% |
| 40 to 44 Minutes | 0 | 0.0% |
| 45 to 59 Minutes | 40 | 6.1% |
| 60 to 89 Minutes | 15 | 2.3% |
| 90 or more Minutes | 40 | 6.1% |
Commute Time by Sex in Cherokee
The most common commute times in Cherokee are 5 to 9 minutes (69 commuters, 17.4%) for males and less than 5 minutes (101 commuters, 39.0%) for females.
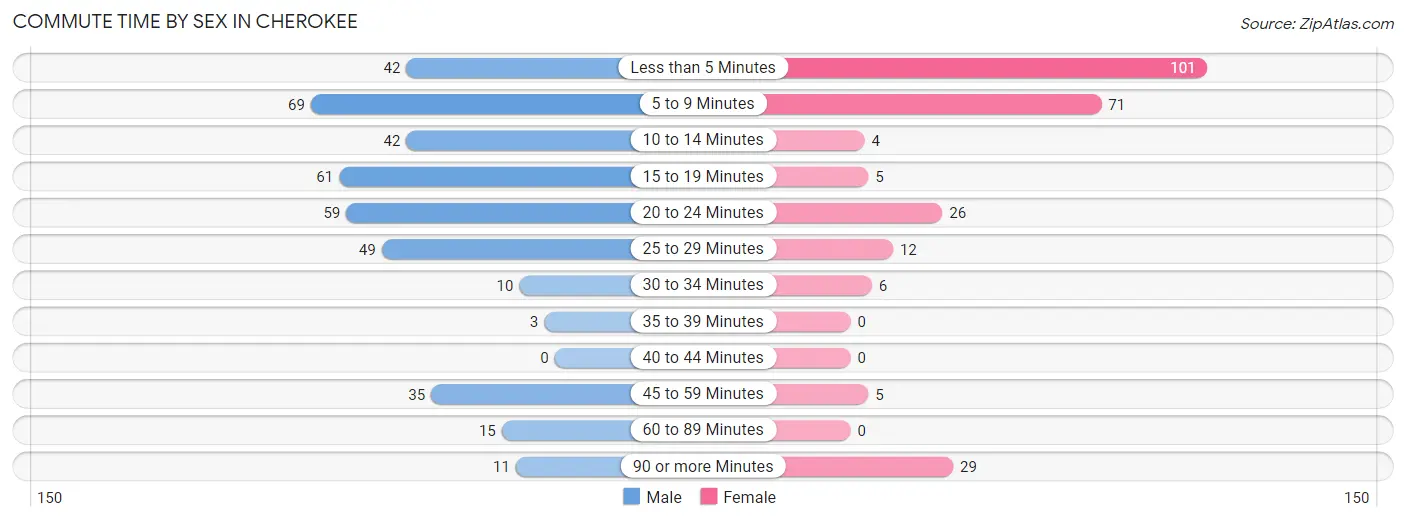
| Commute Time | Male | Female |
| Less than 5 Minutes | 42 (10.6%) | 101 (39.0%) |
| 5 to 9 Minutes | 69 (17.4%) | 71 (27.4%) |
| 10 to 14 Minutes | 42 (10.6%) | 4 (1.5%) |
| 15 to 19 Minutes | 61 (15.4%) | 5 (1.9%) |
| 20 to 24 Minutes | 59 (14.9%) | 26 (10.0%) |
| 25 to 29 Minutes | 49 (12.4%) | 12 (4.6%) |
| 30 to 34 Minutes | 10 (2.5%) | 6 (2.3%) |
| 35 to 39 Minutes | 3 (0.8%) | 0 (0.0%) |
| 40 to 44 Minutes | 0 (0.0%) | 0 (0.0%) |
| 45 to 59 Minutes | 35 (8.8%) | 5 (1.9%) |
| 60 to 89 Minutes | 15 (3.8%) | 0 (0.0%) |
| 90 or more Minutes | 11 (2.8%) | 29 (11.2%) |
Time of Departure to Work by Sex in Cherokee
The most frequent times of departure to work in Cherokee are 7:00 AM to 7:29 AM (82, 20.7%) for males and 7:30 AM to 7:59 AM (82, 31.7%) for females.
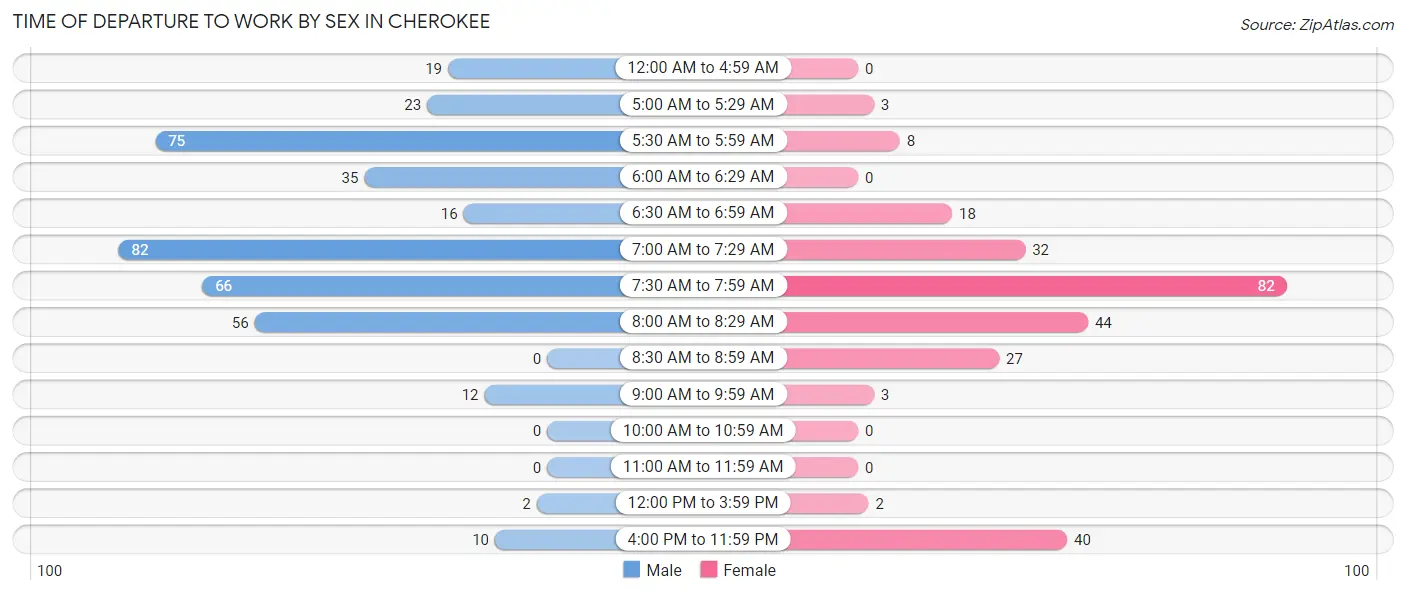
| Time of Departure | Male | Female |
| 12:00 AM to 4:59 AM | 19 (4.8%) | 0 (0.0%) |
| 5:00 AM to 5:29 AM | 23 (5.8%) | 3 (1.2%) |
| 5:30 AM to 5:59 AM | 75 (18.9%) | 8 (3.1%) |
| 6:00 AM to 6:29 AM | 35 (8.8%) | 0 (0.0%) |
| 6:30 AM to 6:59 AM | 16 (4.0%) | 18 (7.0%) |
| 7:00 AM to 7:29 AM | 82 (20.7%) | 32 (12.4%) |
| 7:30 AM to 7:59 AM | 66 (16.7%) | 82 (31.7%) |
| 8:00 AM to 8:29 AM | 56 (14.1%) | 44 (17.0%) |
| 8:30 AM to 8:59 AM | 0 (0.0%) | 27 (10.4%) |
| 9:00 AM to 9:59 AM | 12 (3.0%) | 3 (1.2%) |
| 10:00 AM to 10:59 AM | 0 (0.0%) | 0 (0.0%) |
| 11:00 AM to 11:59 AM | 0 (0.0%) | 0 (0.0%) |
| 12:00 PM to 3:59 PM | 2 (0.5%) | 2 (0.8%) |
| 4:00 PM to 11:59 PM | 10 (2.5%) | 40 (15.4%) |
| Total | 396 (100.0%) | 259 (100.0%) |
Housing Occupancy in Cherokee
Occupancy by Ownership in Cherokee
Of the total 632 dwellings in Cherokee, owner-occupied units account for 472 (74.7%), while renter-occupied units make up 160 (25.3%).
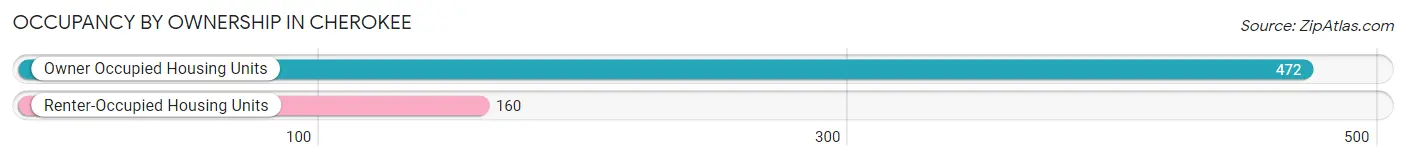
| Occupancy | # Housing Units | % Housing Units |
| Owner Occupied Housing Units | 472 | 74.7% |
| Renter-Occupied Housing Units | 160 | 25.3% |
| Total Occupied Housing Units | 632 | 100.0% |
Occupancy by Household Size in Cherokee
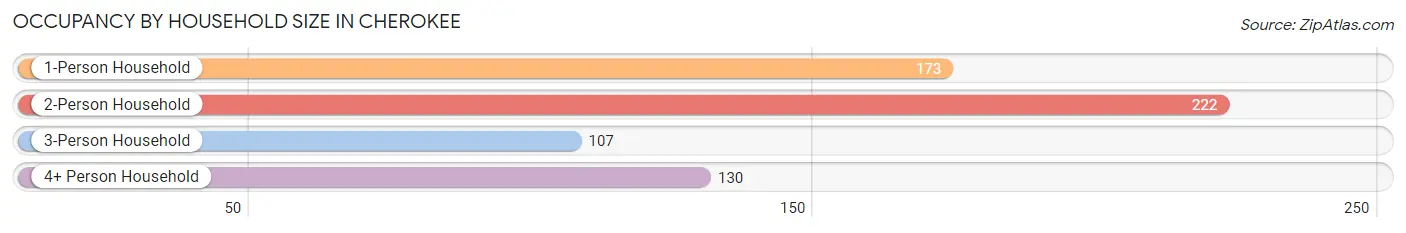
| Household Size | # Housing Units | % Housing Units |
| 1-Person Household | 173 | 27.4% |
| 2-Person Household | 222 | 35.1% |
| 3-Person Household | 107 | 16.9% |
| 4+ Person Household | 130 | 20.6% |
| Total Housing Units | 632 | 100.0% |
Occupancy by Ownership by Household Size in Cherokee
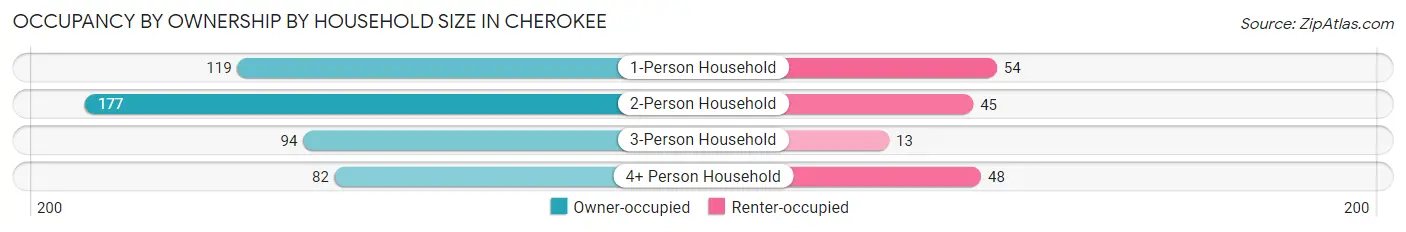
| Household Size | Owner-occupied | Renter-occupied |
| 1-Person Household | 119 (68.8%) | 54 (31.2%) |
| 2-Person Household | 177 (79.7%) | 45 (20.3%) |
| 3-Person Household | 94 (87.8%) | 13 (12.1%) |
| 4+ Person Household | 82 (63.1%) | 48 (36.9%) |
| Total Housing Units | 472 (74.7%) | 160 (25.3%) |
Occupancy by Educational Attainment in Cherokee
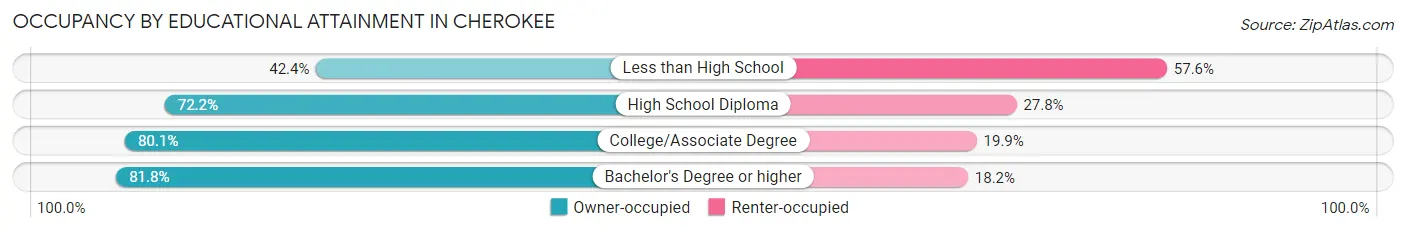
| Household Size | Owner-occupied | Renter-occupied |
| Less than High School | 25 (42.4%) | 34 (57.6%) |
| High School Diploma | 135 (72.2%) | 52 (27.8%) |
| College/Associate Degree | 177 (80.1%) | 44 (19.9%) |
| Bachelor's Degree or higher | 135 (81.8%) | 30 (18.2%) |
Occupancy by Age of Householder in Cherokee
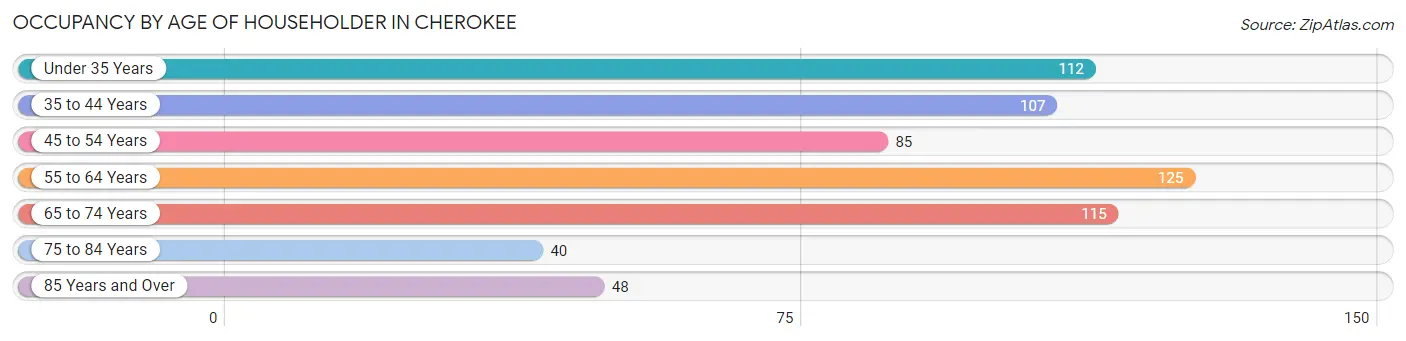
| Age Bracket | # Households | % Households |
| Under 35 Years | 112 | 17.7% |
| 35 to 44 Years | 107 | 16.9% |
| 45 to 54 Years | 85 | 13.5% |
| 55 to 64 Years | 125 | 19.8% |
| 65 to 74 Years | 115 | 18.2% |
| 75 to 84 Years | 40 | 6.3% |
| 85 Years and Over | 48 | 7.6% |
| Total | 632 | 100.0% |
Housing Finances in Cherokee
Median Income by Occupancy in Cherokee
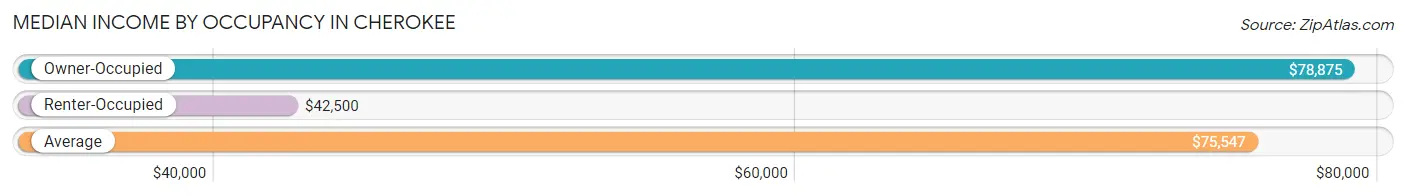
| Occupancy Type | # Households | Median Income |
| Owner-Occupied | 472 (74.7%) | $78,875 |
| Renter-Occupied | 160 (25.3%) | $42,500 |
| Average | 632 (100.0%) | $75,547 |
Occupancy by Householder Income Bracket in Cherokee
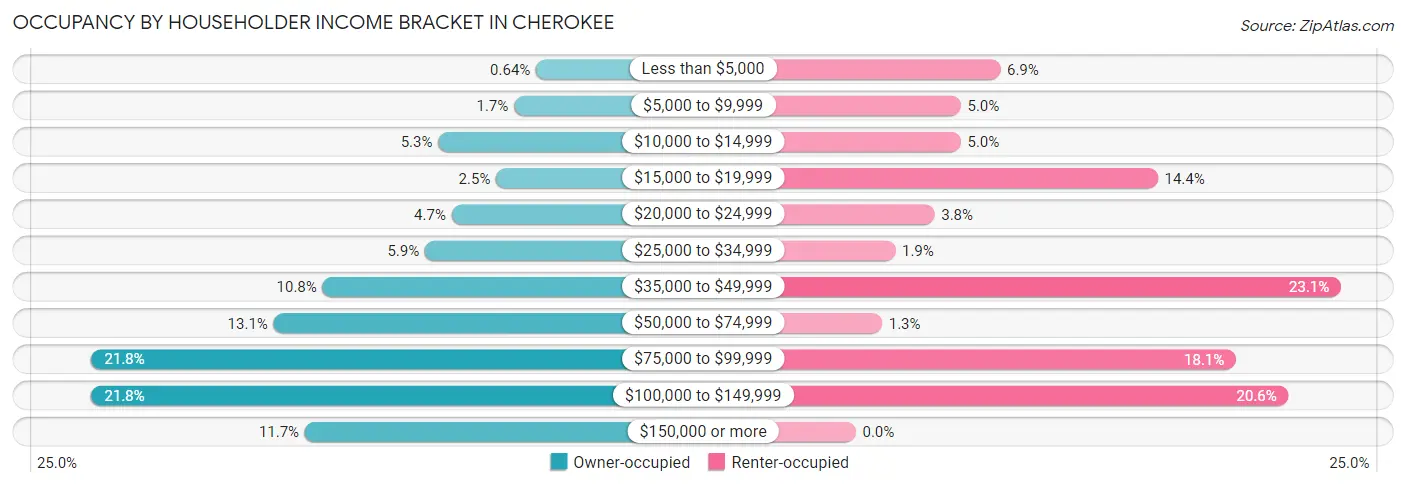
| Income Bracket | Owner-occupied | Renter-occupied |
| Less than $5,000 | 3 (0.6%) | 11 (6.9%) |
| $5,000 to $9,999 | 8 (1.7%) | 8 (5.0%) |
| $10,000 to $14,999 | 25 (5.3%) | 8 (5.0%) |
| $15,000 to $19,999 | 12 (2.5%) | 23 (14.4%) |
| $20,000 to $24,999 | 22 (4.7%) | 6 (3.7%) |
| $25,000 to $34,999 | 28 (5.9%) | 3 (1.9%) |
| $35,000 to $49,999 | 51 (10.8%) | 37 (23.1%) |
| $50,000 to $74,999 | 62 (13.1%) | 2 (1.3%) |
| $75,000 to $99,999 | 103 (21.8%) | 29 (18.1%) |
| $100,000 to $149,999 | 103 (21.8%) | 33 (20.6%) |
| $150,000 or more | 55 (11.7%) | 0 (0.0%) |
| Total | 472 (100.0%) | 160 (100.0%) |
Monthly Housing Cost Tiers in Cherokee
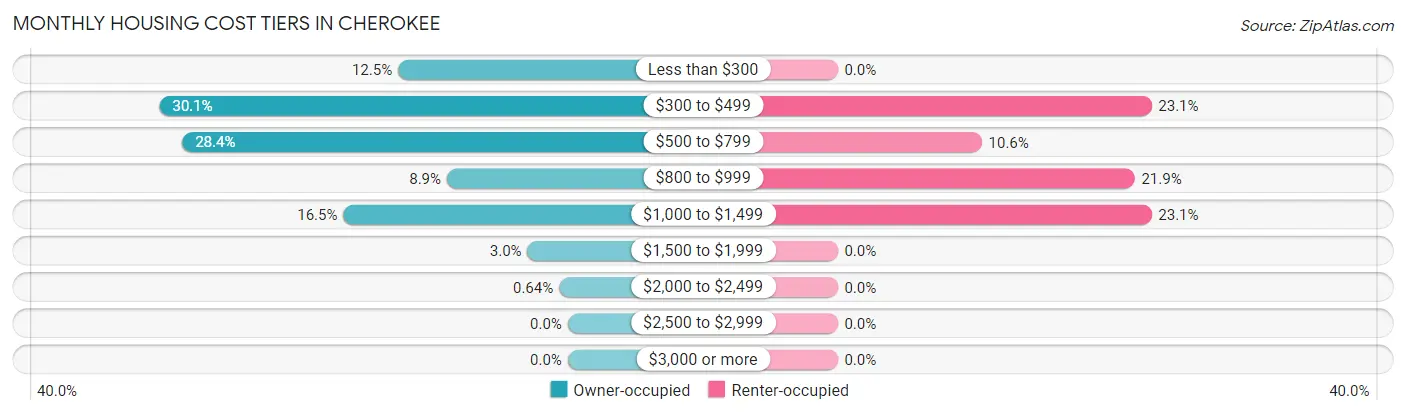
| Monthly Cost | Owner-occupied | Renter-occupied |
| Less than $300 | 59 (12.5%) | 0 (0.0%) |
| $300 to $499 | 142 (30.1%) | 37 (23.1%) |
| $500 to $799 | 134 (28.4%) | 17 (10.6%) |
| $800 to $999 | 42 (8.9%) | 35 (21.9%) |
| $1,000 to $1,499 | 78 (16.5%) | 37 (23.1%) |
| $1,500 to $1,999 | 14 (3.0%) | 0 (0.0%) |
| $2,000 to $2,499 | 3 (0.6%) | 0 (0.0%) |
| $2,500 to $2,999 | 0 (0.0%) | 0 (0.0%) |
| $3,000 or more | 0 (0.0%) | 0 (0.0%) |
| Total | 472 (100.0%) | 160 (100.0%) |
Physical Housing Characteristics in Cherokee
Housing Structures in Cherokee
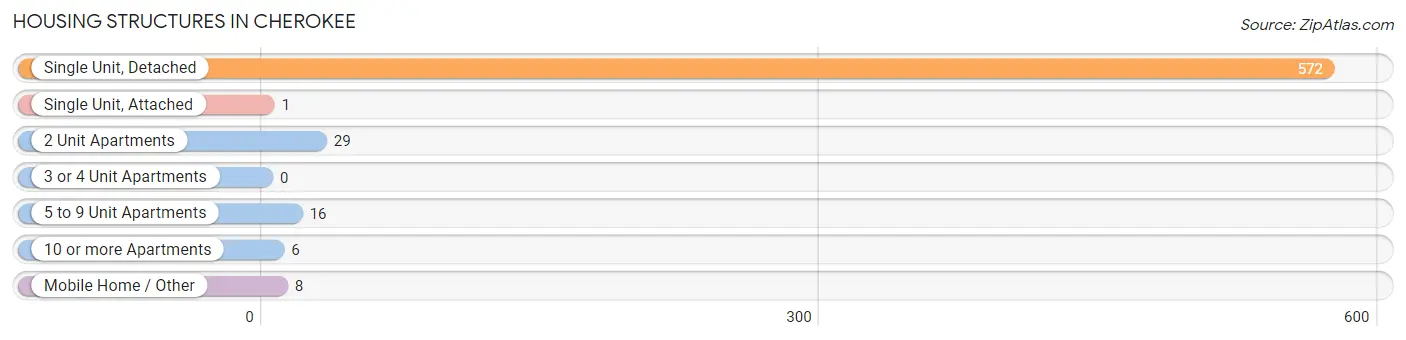
| Structure Type | # Housing Units | % Housing Units |
| Single Unit, Detached | 572 | 90.5% |
| Single Unit, Attached | 1 | 0.2% |
| 2 Unit Apartments | 29 | 4.6% |
| 3 or 4 Unit Apartments | 0 | 0.0% |
| 5 to 9 Unit Apartments | 16 | 2.5% |
| 10 or more Apartments | 6 | 0.9% |
| Mobile Home / Other | 8 | 1.3% |
| Total | 632 | 100.0% |
Housing Structures by Occupancy in Cherokee
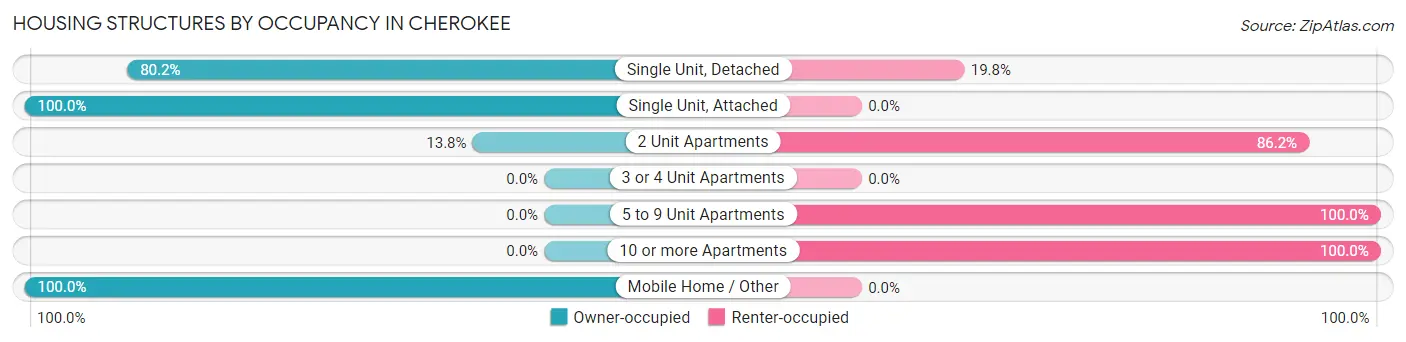
| Structure Type | Owner-occupied | Renter-occupied |
| Single Unit, Detached | 459 (80.2%) | 113 (19.8%) |
| Single Unit, Attached | 1 (100.0%) | 0 (0.0%) |
| 2 Unit Apartments | 4 (13.8%) | 25 (86.2%) |
| 3 or 4 Unit Apartments | 0 (0.0%) | 0 (0.0%) |
| 5 to 9 Unit Apartments | 0 (0.0%) | 16 (100.0%) |
| 10 or more Apartments | 0 (0.0%) | 6 (100.0%) |
| Mobile Home / Other | 8 (100.0%) | 0 (0.0%) |
| Total | 472 (74.7%) | 160 (25.3%) |
Housing Structures by Number of Rooms in Cherokee
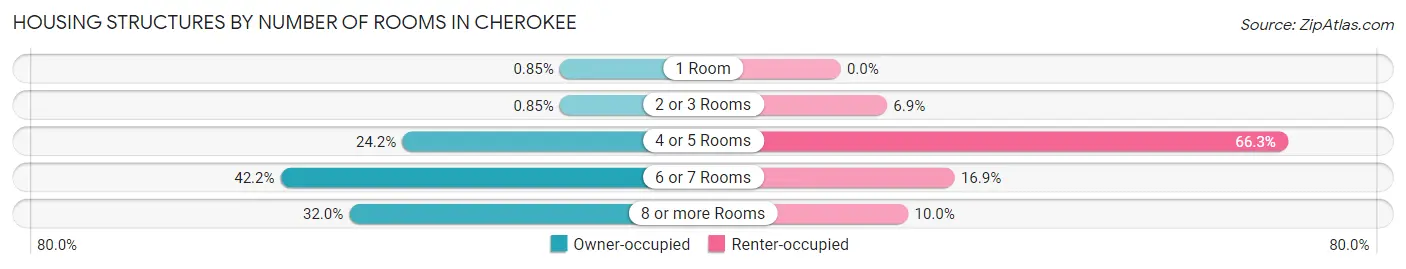
| Number of Rooms | Owner-occupied | Renter-occupied |
| 1 Room | 4 (0.9%) | 0 (0.0%) |
| 2 or 3 Rooms | 4 (0.9%) | 11 (6.9%) |
| 4 or 5 Rooms | 114 (24.1%) | 106 (66.2%) |
| 6 or 7 Rooms | 199 (42.2%) | 27 (16.9%) |
| 8 or more Rooms | 151 (32.0%) | 16 (10.0%) |
| Total | 472 (100.0%) | 160 (100.0%) |
Housing Structure by Heating Type in Cherokee
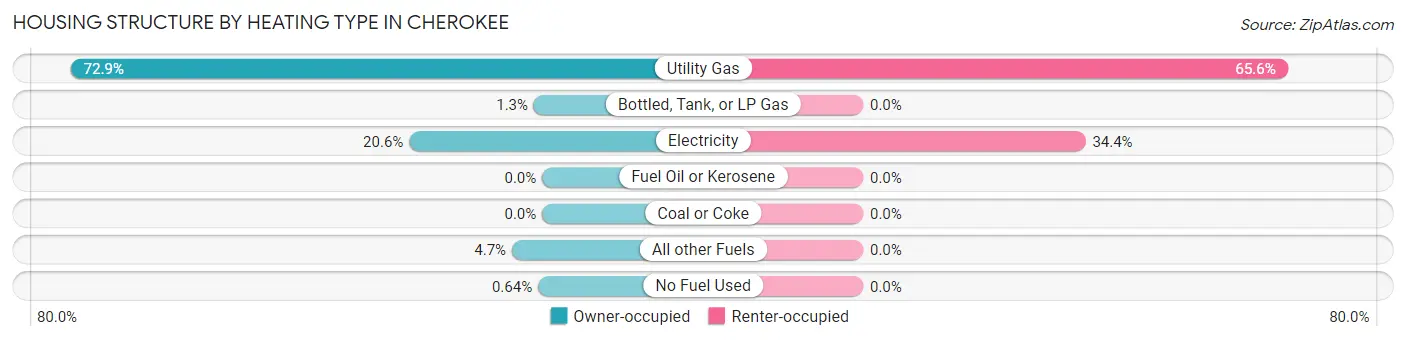
| Heating Type | Owner-occupied | Renter-occupied |
| Utility Gas | 344 (72.9%) | 105 (65.6%) |
| Bottled, Tank, or LP Gas | 6 (1.3%) | 0 (0.0%) |
| Electricity | 97 (20.5%) | 55 (34.4%) |
| Fuel Oil or Kerosene | 0 (0.0%) | 0 (0.0%) |
| Coal or Coke | 0 (0.0%) | 0 (0.0%) |
| All other Fuels | 22 (4.7%) | 0 (0.0%) |
| No Fuel Used | 3 (0.6%) | 0 (0.0%) |
| Total | 472 (100.0%) | 160 (100.0%) |
Household Vehicle Usage in Cherokee
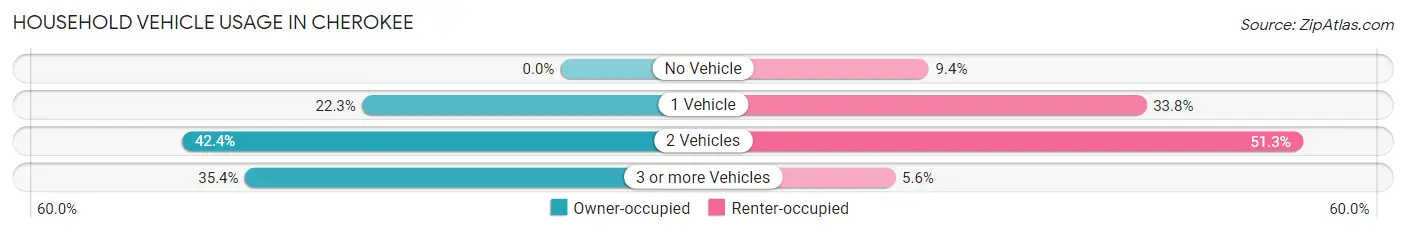
| Vehicles per Household | Owner-occupied | Renter-occupied |
| No Vehicle | 0 (0.0%) | 15 (9.4%) |
| 1 Vehicle | 105 (22.3%) | 54 (33.8%) |
| 2 Vehicles | 200 (42.4%) | 82 (51.2%) |
| 3 or more Vehicles | 167 (35.4%) | 9 (5.6%) |
| Total | 472 (100.0%) | 160 (100.0%) |
Real Estate & Mortgages in Cherokee
Real Estate and Mortgage Overview in Cherokee
| Characteristic | Without Mortgage | With Mortgage |
| Housing Units | 279 | 193 |
| Median Property Value | $88,400 | $107,800 |
| Median Household Income | $64,250 | $30 |
| Monthly Housing Costs | $410 | $0 |
| Real Estate Taxes | $821 | $7 |
Property Value by Mortgage Status in Cherokee
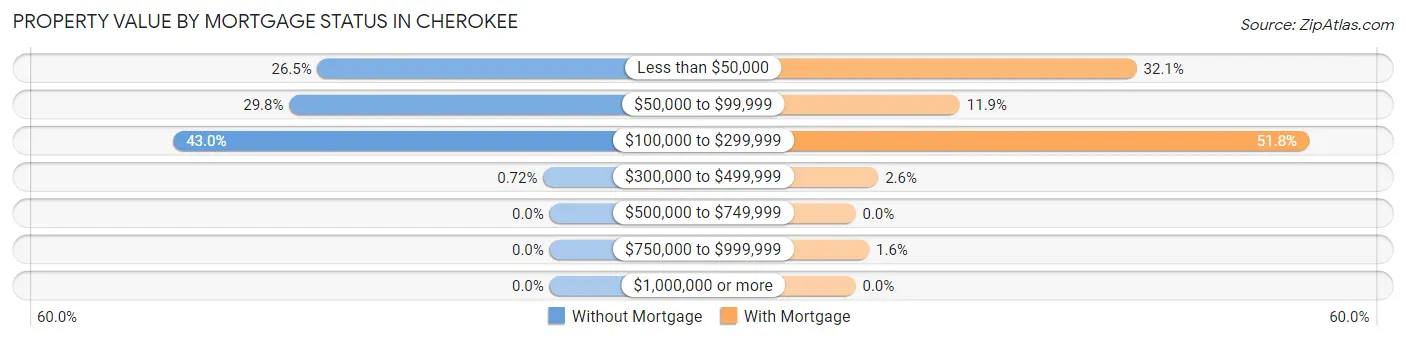
| Property Value | Without Mortgage | With Mortgage |
| Less than $50,000 | 74 (26.5%) | 62 (32.1%) |
| $50,000 to $99,999 | 83 (29.7%) | 23 (11.9%) |
| $100,000 to $299,999 | 120 (43.0%) | 100 (51.8%) |
| $300,000 to $499,999 | 2 (0.7%) | 5 (2.6%) |
| $500,000 to $749,999 | 0 (0.0%) | 0 (0.0%) |
| $750,000 to $999,999 | 0 (0.0%) | 3 (1.5%) |
| $1,000,000 or more | 0 (0.0%) | 0 (0.0%) |
| Total | 279 (100.0%) | 193 (100.0%) |
Household Income by Mortgage Status in Cherokee
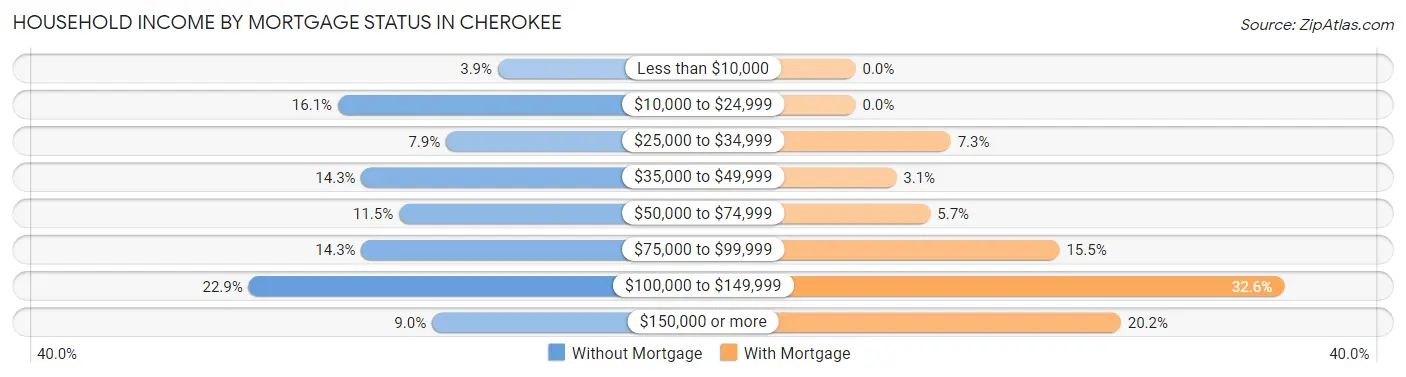
| Household Income | Without Mortgage | With Mortgage |
| Less than $10,000 | 11 (3.9%) | 0 (0.0%) |
| $10,000 to $24,999 | 45 (16.1%) | 0 (0.0%) |
| $25,000 to $34,999 | 22 (7.9%) | 14 (7.2%) |
| $35,000 to $49,999 | 40 (14.3%) | 6 (3.1%) |
| $50,000 to $74,999 | 32 (11.5%) | 11 (5.7%) |
| $75,000 to $99,999 | 40 (14.3%) | 30 (15.5%) |
| $100,000 to $149,999 | 64 (22.9%) | 63 (32.6%) |
| $150,000 or more | 25 (9.0%) | 39 (20.2%) |
| Total | 279 (100.0%) | 193 (100.0%) |
Property Value to Household Income Ratio in Cherokee
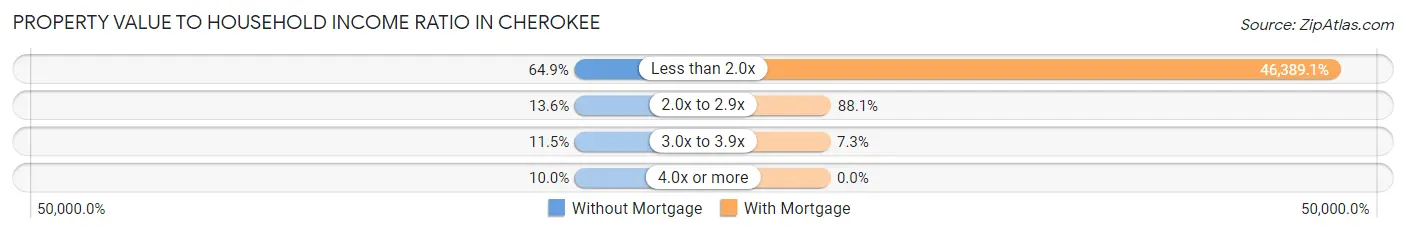
| Value-to-Income Ratio | Without Mortgage | With Mortgage |
| Less than 2.0x | 181 (64.9%) | 89,531 (46,389.1%) |
| 2.0x to 2.9x | 38 (13.6%) | 170 (88.1%) |
| 3.0x to 3.9x | 32 (11.5%) | 14 (7.2%) |
| 4.0x or more | 28 (10.0%) | 0 (0.0%) |
| Total | 279 (100.0%) | 193 (100.0%) |
Real Estate Taxes by Mortgage Status in Cherokee
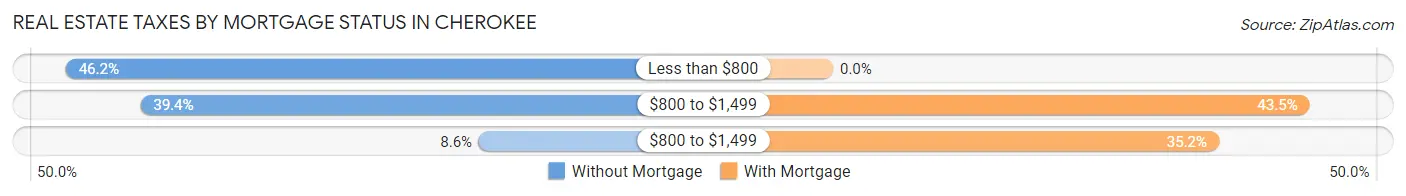
| Property Taxes | Without Mortgage | With Mortgage |
| Less than $800 | 129 (46.2%) | 0 (0.0%) |
| $800 to $1,499 | 110 (39.4%) | 84 (43.5%) |
| $800 to $1,499 | 24 (8.6%) | 68 (35.2%) |
| Total | 279 (100.0%) | 193 (100.0%) |
Health & Disability in Cherokee
Health Insurance Coverage by Age in Cherokee
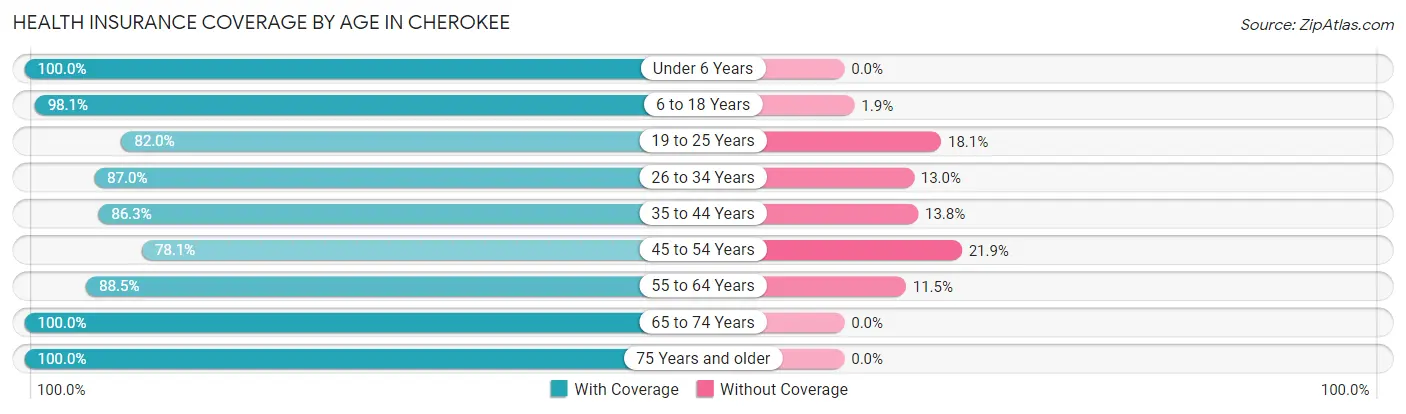
| Age Bracket | With Coverage | Without Coverage |
| Under 6 Years | 113 (100.0%) | 0 (0.0%) |
| 6 to 18 Years | 260 (98.1%) | 5 (1.9%) |
| 19 to 25 Years | 109 (82.0%) | 24 (18.0%) |
| 26 to 34 Years | 141 (87.0%) | 21 (13.0%) |
| 35 to 44 Years | 138 (86.3%) | 22 (13.8%) |
| 45 to 54 Years | 132 (78.1%) | 37 (21.9%) |
| 55 to 64 Years | 193 (88.5%) | 25 (11.5%) |
| 65 to 74 Years | 163 (100.0%) | 0 (0.0%) |
| 75 Years and older | 122 (100.0%) | 0 (0.0%) |
| Total | 1,371 (91.1%) | 134 (8.9%) |
Health Insurance Coverage by Citizenship Status in Cherokee
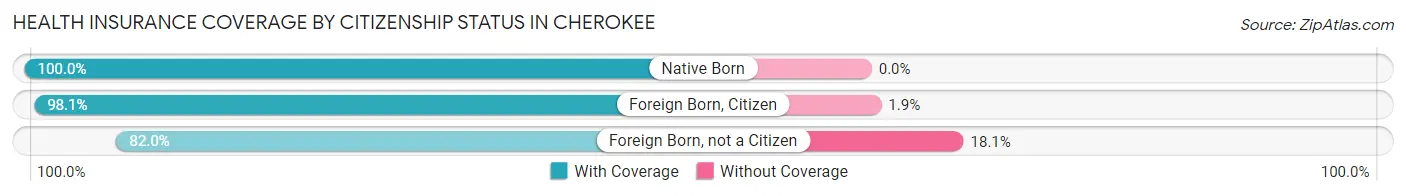
| Citizenship Status | With Coverage | Without Coverage |
| Native Born | 113 (100.0%) | 0 (0.0%) |
| Foreign Born, Citizen | 260 (98.1%) | 5 (1.9%) |
| Foreign Born, not a Citizen | 109 (82.0%) | 24 (18.0%) |
Health Insurance Coverage by Household Income in Cherokee
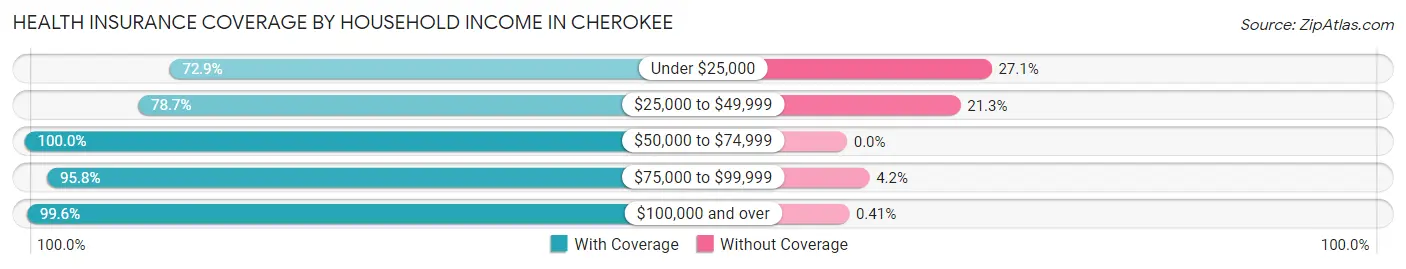
| Household Income | With Coverage | Without Coverage |
| Under $25,000 | 121 (72.9%) | 45 (27.1%) |
| $25,000 to $49,999 | 263 (78.7%) | 71 (21.3%) |
| $50,000 to $74,999 | 184 (100.0%) | 0 (0.0%) |
| $75,000 to $99,999 | 319 (95.8%) | 14 (4.2%) |
| $100,000 and over | 482 (99.6%) | 2 (0.4%) |
Public vs Private Health Insurance Coverage by Age in Cherokee
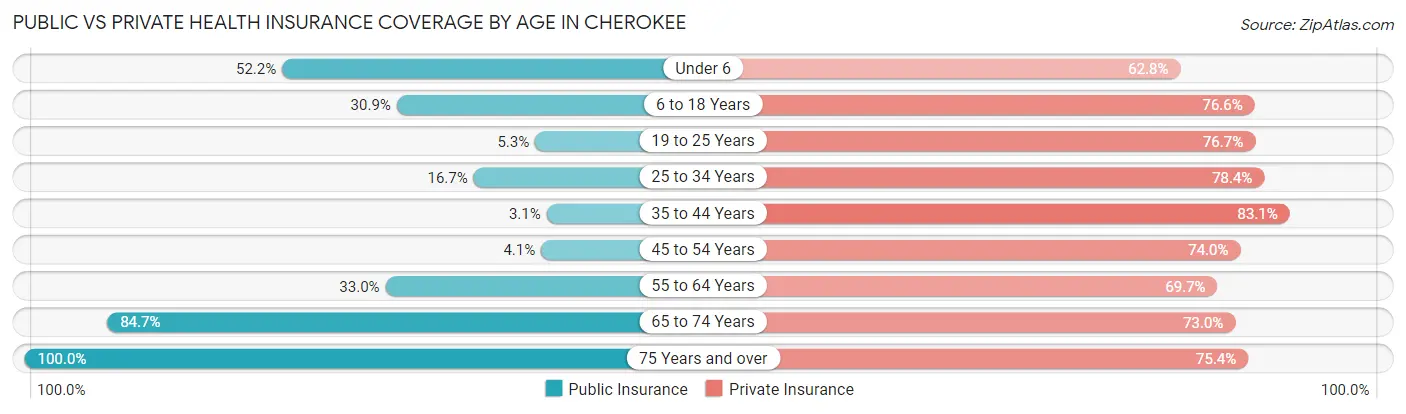
| Age Bracket | Public Insurance | Private Insurance |
| Under 6 | 59 (52.2%) | 71 (62.8%) |
| 6 to 18 Years | 82 (30.9%) | 203 (76.6%) |
| 19 to 25 Years | 7 (5.3%) | 102 (76.7%) |
| 25 to 34 Years | 27 (16.7%) | 127 (78.4%) |
| 35 to 44 Years | 5 (3.1%) | 133 (83.1%) |
| 45 to 54 Years | 7 (4.1%) | 125 (74.0%) |
| 55 to 64 Years | 72 (33.0%) | 152 (69.7%) |
| 65 to 74 Years | 138 (84.7%) | 119 (73.0%) |
| 75 Years and over | 122 (100.0%) | 92 (75.4%) |
| Total | 519 (34.5%) | 1,124 (74.7%) |
Disability Status by Sex by Age in Cherokee
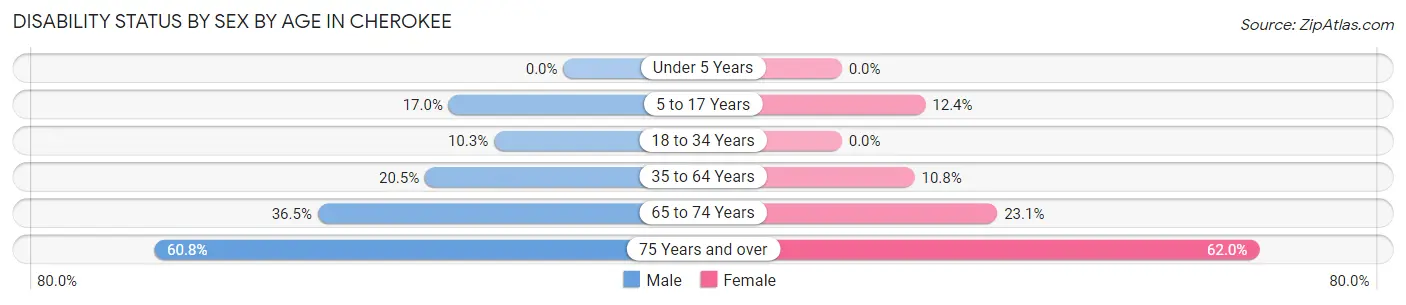
| Age Bracket | Male | Female |
| Under 5 Years | 0 (0.0%) | 0 (0.0%) |
| 5 to 17 Years | 24 (17.0%) | 18 (12.4%) |
| 18 to 34 Years | 17 (10.3%) | 0 (0.0%) |
| 35 to 64 Years | 61 (20.5%) | 27 (10.8%) |
| 65 to 74 Years | 31 (36.5%) | 18 (23.1%) |
| 75 Years and over | 31 (60.8%) | 44 (62.0%) |
Disability Class by Sex by Age in Cherokee
Disability Class: Hearing Difficulty
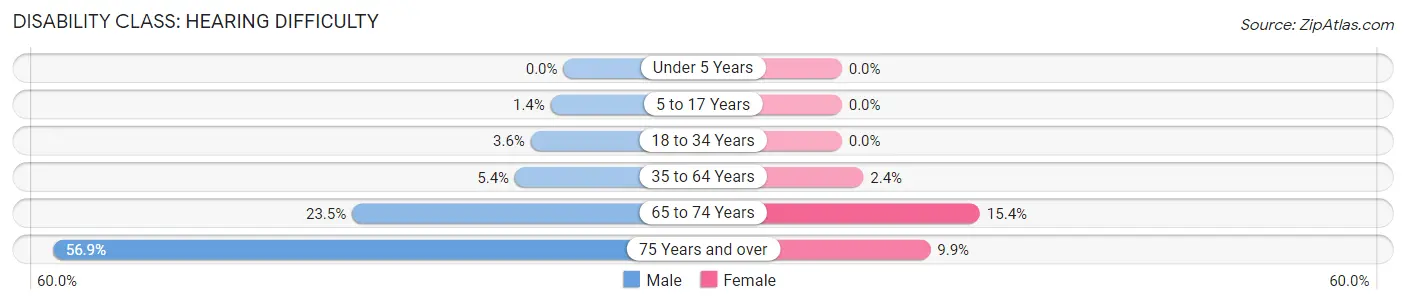
| Age Bracket | Male | Female |
| Under 5 Years | 0 (0.0%) | 0 (0.0%) |
| 5 to 17 Years | 2 (1.4%) | 0 (0.0%) |
| 18 to 34 Years | 6 (3.6%) | 0 (0.0%) |
| 35 to 64 Years | 16 (5.4%) | 6 (2.4%) |
| 65 to 74 Years | 20 (23.5%) | 12 (15.4%) |
| 75 Years and over | 29 (56.9%) | 7 (9.9%) |
Disability Class: Vision Difficulty
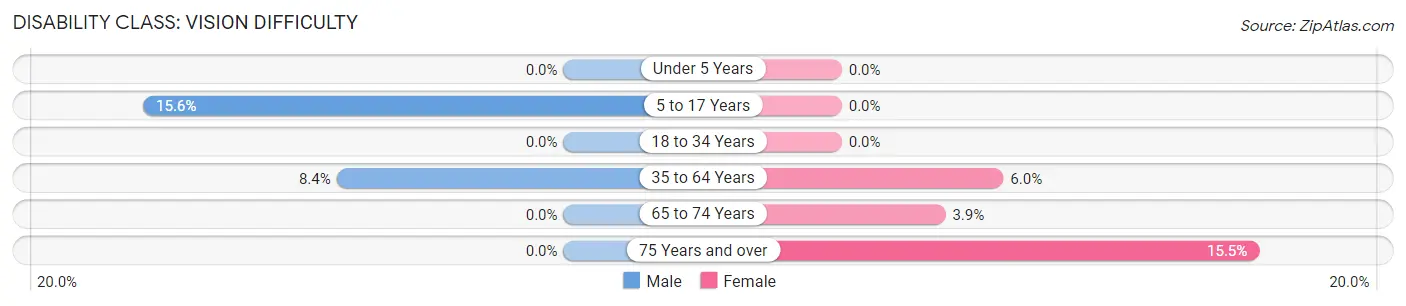
| Age Bracket | Male | Female |
| Under 5 Years | 0 (0.0%) | 0 (0.0%) |
| 5 to 17 Years | 22 (15.6%) | 0 (0.0%) |
| 18 to 34 Years | 0 (0.0%) | 0 (0.0%) |
| 35 to 64 Years | 25 (8.4%) | 15 (6.0%) |
| 65 to 74 Years | 0 (0.0%) | 3 (3.8%) |
| 75 Years and over | 0 (0.0%) | 11 (15.5%) |
Disability Class: Cognitive Difficulty
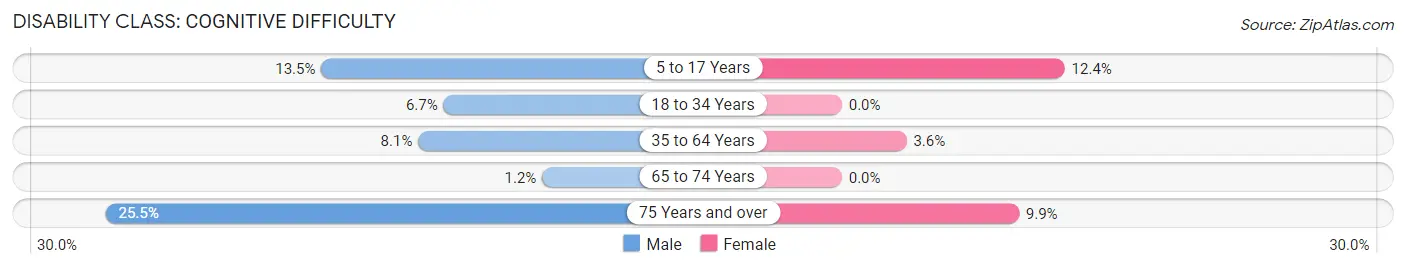
| Age Bracket | Male | Female |
| 5 to 17 Years | 19 (13.5%) | 18 (12.4%) |
| 18 to 34 Years | 11 (6.7%) | 0 (0.0%) |
| 35 to 64 Years | 24 (8.1%) | 9 (3.6%) |
| 65 to 74 Years | 1 (1.2%) | 0 (0.0%) |
| 75 Years and over | 13 (25.5%) | 7 (9.9%) |
Disability Class: Ambulatory Difficulty
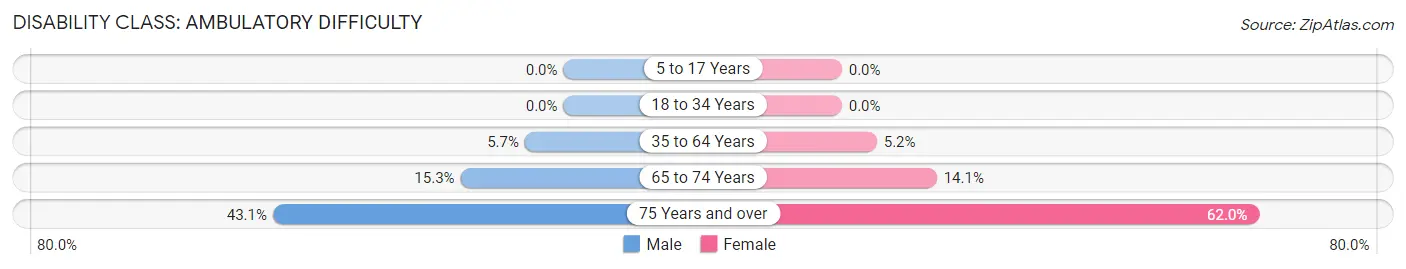
| Age Bracket | Male | Female |
| 5 to 17 Years | 0 (0.0%) | 0 (0.0%) |
| 18 to 34 Years | 0 (0.0%) | 0 (0.0%) |
| 35 to 64 Years | 17 (5.7%) | 13 (5.2%) |
| 65 to 74 Years | 13 (15.3%) | 11 (14.1%) |
| 75 Years and over | 22 (43.1%) | 44 (62.0%) |
Disability Class: Self-Care Difficulty
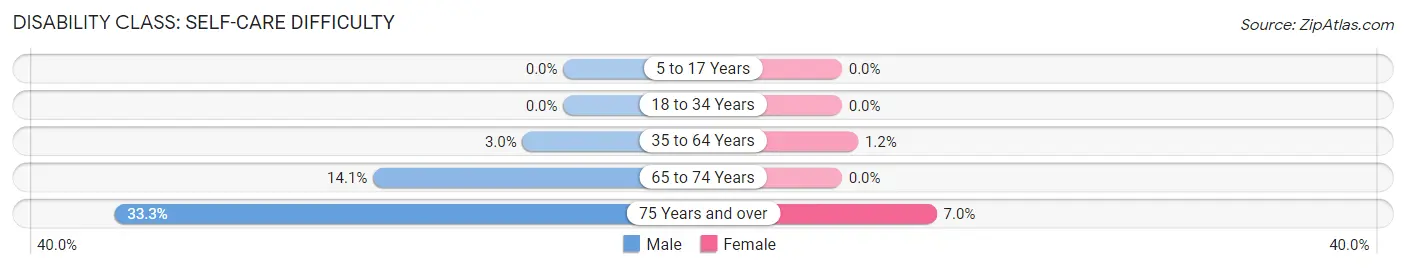
| Age Bracket | Male | Female |
| 5 to 17 Years | 0 (0.0%) | 0 (0.0%) |
| 18 to 34 Years | 0 (0.0%) | 0 (0.0%) |
| 35 to 64 Years | 9 (3.0%) | 3 (1.2%) |
| 65 to 74 Years | 12 (14.1%) | 0 (0.0%) |
| 75 Years and over | 17 (33.3%) | 5 (7.0%) |
Technology Access in Cherokee
Computing Device Access in Cherokee
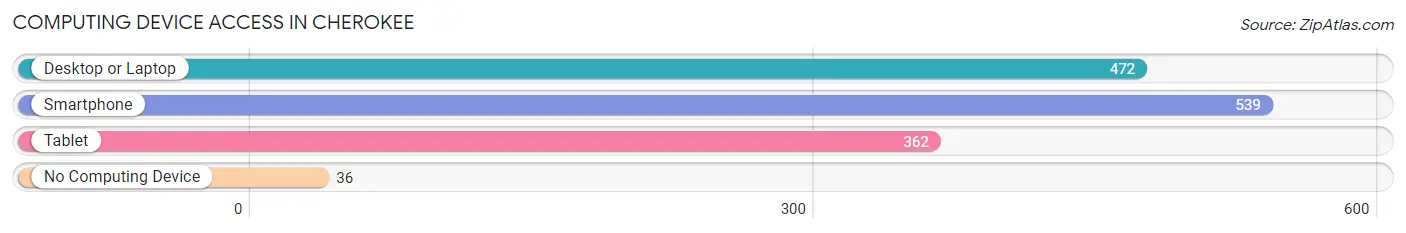
| Device Type | # Households | % Households |
| Desktop or Laptop | 472 | 74.7% |
| Smartphone | 539 | 85.3% |
| Tablet | 362 | 57.3% |
| No Computing Device | 36 | 5.7% |
| Total | 632 | 100.0% |
Internet Access in Cherokee
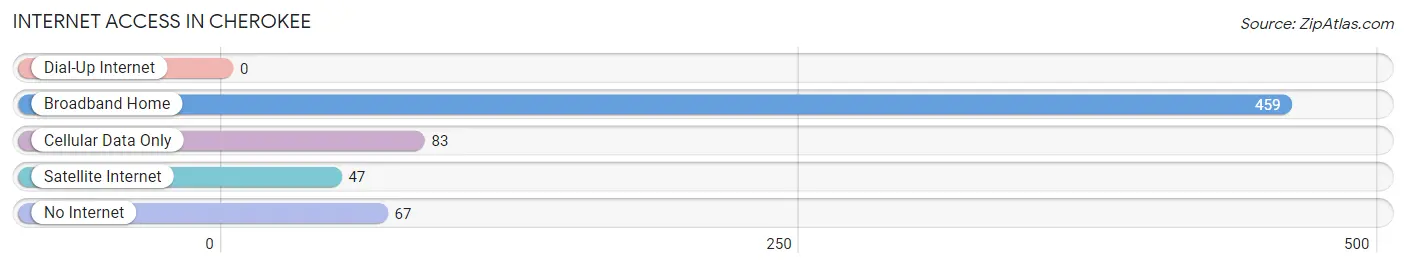
| Internet Type | # Households | % Households |
| Dial-Up Internet | 0 | 0.0% |
| Broadband Home | 459 | 72.6% |
| Cellular Data Only | 83 | 13.1% |
| Satellite Internet | 47 | 7.4% |
| No Internet | 67 | 10.6% |
| Total | 632 | 100.0% |
Cherokee Summary
Cherokee, Oklahoma is a small town located in the northeastern corner of Oklahoma, near the Arkansas border. It is part of the Cherokee Nation, the largest federally recognized Native American tribe in the United States. The town was founded in 1839 by the Cherokee Nation and was named after the tribe. It is the county seat of Adair County and is home to a population of approximately 1,500 people.
Geography
Cherokee is located in the foothills of the Ozark Mountains, in the northeastern corner of Oklahoma. It is situated at the intersection of U.S. Highway 59 and State Highway 10. The town is surrounded by rolling hills and wooded areas, and is located near the Illinois River. The climate in Cherokee is mild, with hot summers and cold winters.
Economy
The economy of Cherokee is largely based on agriculture and tourism. The town is home to several farms, which produce a variety of crops, including corn, soybeans, wheat, and hay. The town also has a thriving tourism industry, with visitors coming to enjoy the area’s natural beauty and outdoor activities. The town is home to several restaurants, hotels, and other businesses that cater to tourists.
Demographics
As of the 2010 census, the population of Cherokee was 1,521. The racial makeup of the town was 95.2% Native American, 2.2% White, 0.2% African American, 0.2% Asian, and 2.2% from other races. The median household income was $25,938, and the median family income was $30,938. The per capita income was $14,938.
History
Cherokee was founded in 1839 by the Cherokee Nation. The town was named after the tribe and served as the capital of the Cherokee Nation until 1866. During this time, the town was a major center of commerce and culture for the tribe. In the late 19th century, the town was home to several schools, churches, and businesses.
In the early 20th century, the town experienced a period of decline due to the displacement of the Cherokee Nation during the Trail of Tears. However, the town began to experience a resurgence in the mid-20th century, with the opening of several businesses and the construction of a new courthouse. Today, Cherokee is a small but vibrant town, with a strong sense of community and a commitment to preserving its history and culture.
Common Questions
What is Per Capita Income in Cherokee?
Per Capita income in Cherokee is $31,403.
What is the Median Family Income in Cherokee?
Median Family Income in Cherokee is $86,719.
What is the Median Household income in Cherokee?
Median Household Income in Cherokee is $75,547.
What is Income or Wage Gap in Cherokee?
Income or Wage Gap in Cherokee is 32.9%.
Women in Cherokee earn 67.1 cents for every dollar earned by a man.
What is Inequality or Gini Index in Cherokee?
Inequality or Gini Index in Cherokee is 0.38.
What is the Total Population of Cherokee?
Total Population of Cherokee is 1,556.
What is the Total Male Population of Cherokee?
Total Male Population of Cherokee is 812.
What is the Total Female Population of Cherokee?
Total Female Population of Cherokee is 744.
What is the Ratio of Males per 100 Females in Cherokee?
There are 109.14 Males per 100 Females in Cherokee.
What is the Ratio of Females per 100 Males in Cherokee?
There are 91.63 Females per 100 Males in Cherokee.
What is the Median Population Age in Cherokee?
Median Population Age in Cherokee is 42.4 Years.
What is the Average Family Size in Cherokee
Average Family Size in Cherokee is 2.9 People.
What is the Average Household Size in Cherokee
Average Household Size in Cherokee is 2.4 People.
How Large is the Labor Force in Cherokee?
There are 742 People in the Labor Forcein in Cherokee.
What is the Percentage of People in the Labor Force in Cherokee?
61.6% of People are in the Labor Force in Cherokee.
What is the Unemployment Rate in Cherokee?
Unemployment Rate in Cherokee is 6.9%.