Shawnee, OK Map & Demographics
Shawnee Map
Shawnee Overview
$26,577
PER CAPITA INCOME
$64,968
AVG FAMILY INCOME
$50,695
AVG HOUSEHOLD INCOME
33.3%
WAGE / INCOME GAP [ % ]
66.7¢/ $1
WAGE / INCOME GAP [ $ ]
$12,368
FAMILY INCOME DEFICIT
0.47
INEQUALITY / GINI INDEX
31,391
TOTAL POPULATION
14,898
MALE POPULATION
16,493
FEMALE POPULATION
90.33
MALES / 100 FEMALES
110.71
FEMALES / 100 MALES
34.9
MEDIAN AGE
3.1
AVG FAMILY SIZE
2.5
AVG HOUSEHOLD SIZE
13,842
LABOR FORCE [ PEOPLE ]
55.5%
PERCENT IN LABOR FORCE
6.8%
UNEMPLOYMENT RATE
Shawnee Area Codes
Income in Shawnee
Income Overview in Shawnee
Per Capita Income in Shawnee is $26,577, while median incomes of families and households are $64,968 and $50,695 respectively.
| Characteristic | Number | Measure |
| Per Capita Income | 31,391 | $26,577 |
| Median Family Income | 7,407 | $64,968 |
| Mean Family Income | 7,407 | $80,041 |
| Median Household Income | 11,900 | $50,695 |
| Mean Household Income | 11,900 | $67,174 |
| Income Deficit | 7,407 | $12,368 |
| Wage / Income Gap (%) | 31,391 | 33.29% |
| Wage / Income Gap ($) | 31,391 | 66.71¢ per $1 |
| Gini / Inequality Index | 31,391 | 0.47 |
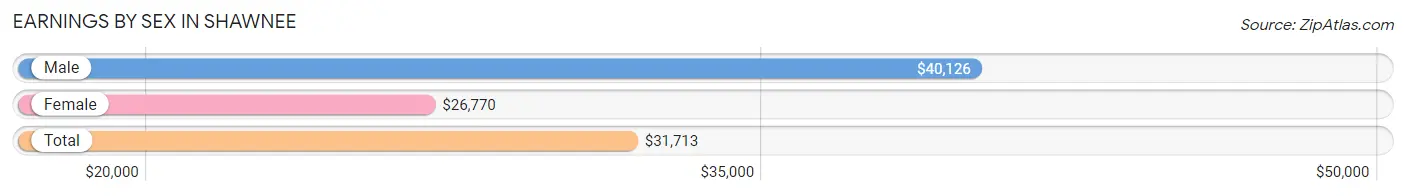
Earnings by Sex in Shawnee
Average Earnings in Shawnee are $31,713, $40,126 for men and $26,770 for women, a difference of 33.3%.
| Sex | Number | Average Earnings |
| Male | 7,468 (51.1%) | $40,126 |
| Female | 7,148 (48.9%) | $26,770 |
| Total | 14,616 (100.0%) | $31,713 |
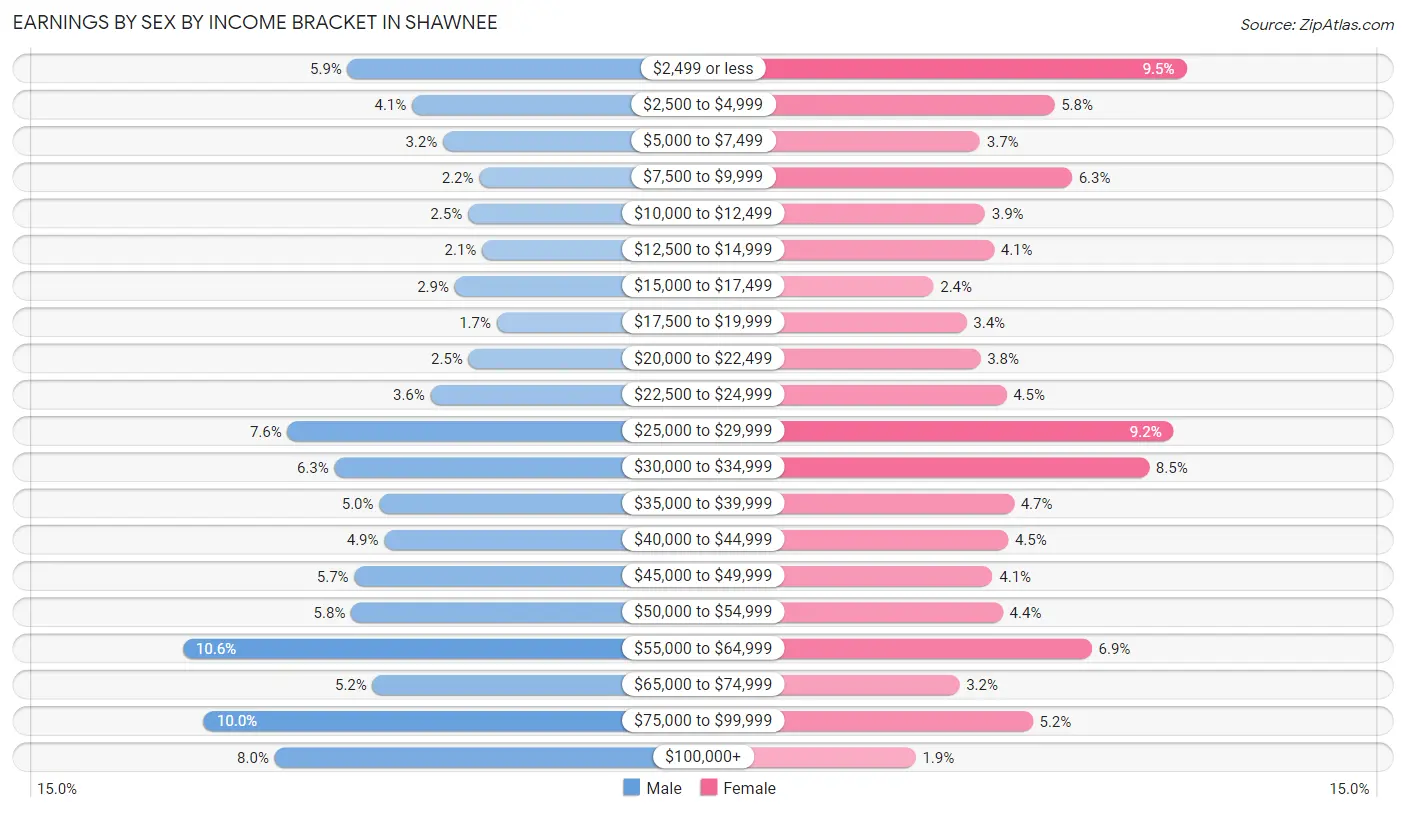
Earnings by Sex by Income Bracket in Shawnee
The most common earnings brackets in Shawnee are $55,000 to $64,999 for men (788 | 10.5%) and $2,499 or less for women (682 | 9.5%).
| Income | Male | Female |
| $2,499 or less | 442 (5.9%) | 682 (9.5%) |
| $2,500 to $4,999 | 307 (4.1%) | 417 (5.8%) |
| $5,000 to $7,499 | 242 (3.2%) | 267 (3.7%) |
| $7,500 to $9,999 | 166 (2.2%) | 452 (6.3%) |
| $10,000 to $12,499 | 190 (2.5%) | 277 (3.9%) |
| $12,500 to $14,999 | 160 (2.1%) | 295 (4.1%) |
| $15,000 to $17,499 | 217 (2.9%) | 174 (2.4%) |
| $17,500 to $19,999 | 129 (1.7%) | 240 (3.4%) |
| $20,000 to $22,499 | 188 (2.5%) | 268 (3.7%) |
| $22,500 to $24,999 | 268 (3.6%) | 320 (4.5%) |
| $25,000 to $29,999 | 568 (7.6%) | 656 (9.2%) |
| $30,000 to $34,999 | 470 (6.3%) | 607 (8.5%) |
| $35,000 to $39,999 | 376 (5.0%) | 335 (4.7%) |
| $40,000 to $44,999 | 365 (4.9%) | 324 (4.5%) |
| $45,000 to $49,999 | 428 (5.7%) | 292 (4.1%) |
| $50,000 to $54,999 | 435 (5.8%) | 313 (4.4%) |
| $55,000 to $64,999 | 788 (10.5%) | 492 (6.9%) |
| $65,000 to $74,999 | 390 (5.2%) | 226 (3.2%) |
| $75,000 to $99,999 | 744 (10.0%) | 373 (5.2%) |
| $100,000+ | 595 (8.0%) | 138 (1.9%) |
| Total | 7,468 (100.0%) | 7,148 (100.0%) |
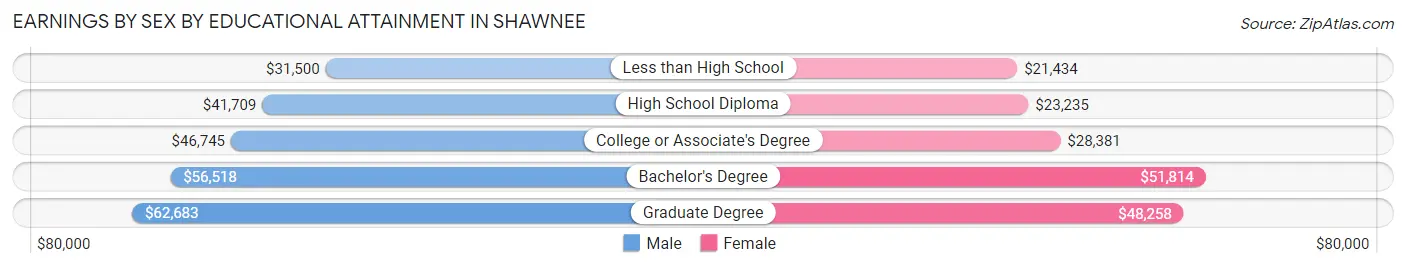
Earnings by Sex by Educational Attainment in Shawnee
Average earnings in Shawnee are $46,885 for men and $31,325 for women, a difference of 33.2%. Men with an educational attainment of graduate degree enjoy the highest average annual earnings of $62,683, while those with less than high school education earn the least with $31,500. Women with an educational attainment of bachelor's degree earn the most with the average annual earnings of $51,814, while those with less than high school education have the smallest earnings of $21,434.
| Educational Attainment | Male Income | Female Income |
| Less than High School | $31,500 | $21,434 |
| High School Diploma | $41,709 | $23,235 |
| College or Associate's Degree | $46,745 | $28,381 |
| Bachelor's Degree | $56,518 | $51,814 |
| Graduate Degree | $62,683 | $48,258 |
| Total | $46,885 | $31,325 |
Family Income in Shawnee
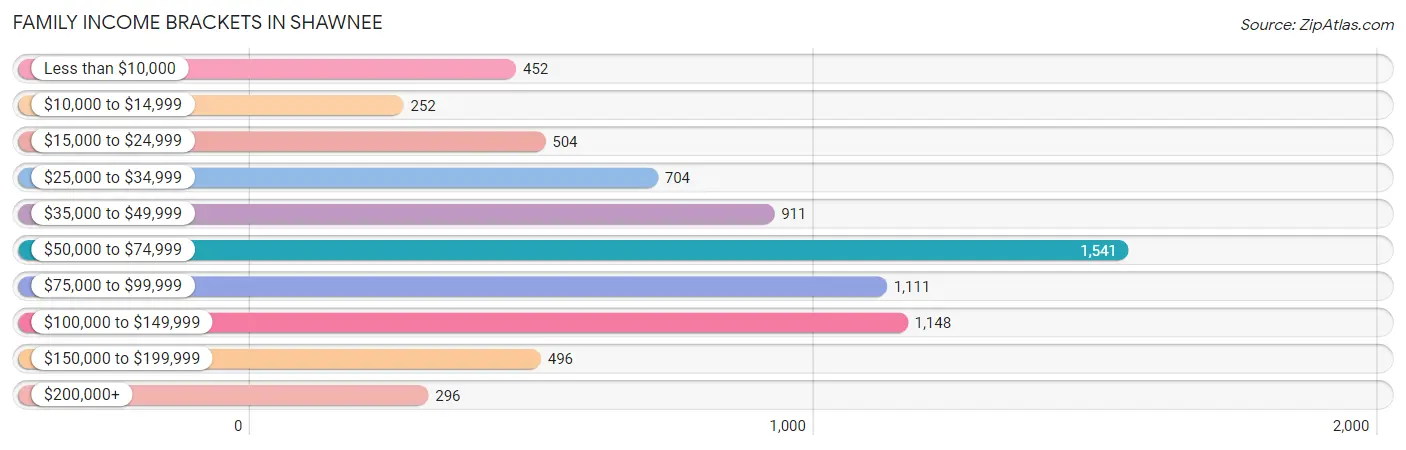
Family Income Brackets in Shawnee
According to the Shawnee family income data, there are 1,541 families falling into the $50,000 to $74,999 income range, which is the most common income bracket and makes up 20.8% of all families. Conversely, the $10,000 to $14,999 income bracket is the least frequent group with only 252 families (3.4%) belonging to this category.
| Income Bracket | # Families | % Families |
| Less than $10,000 | 452 | 6.1% |
| $10,000 to $14,999 | 252 | 3.4% |
| $15,000 to $24,999 | 504 | 6.8% |
| $25,000 to $34,999 | 704 | 9.5% |
| $35,000 to $49,999 | 911 | 12.3% |
| $50,000 to $74,999 | 1,541 | 20.8% |
| $75,000 to $99,999 | 1,111 | 15.0% |
| $100,000 to $149,999 | 1,148 | 15.5% |
| $150,000 to $199,999 | 496 | 6.7% |
| $200,000+ | 296 | 4.0% |
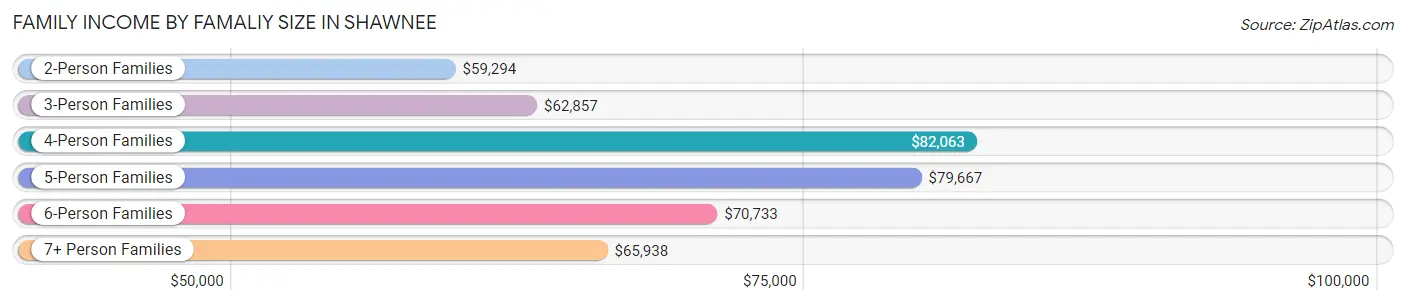
Family Income by Famaliy Size in Shawnee
4-person families (1,327 | 17.9%) account for the highest median family income in Shawnee with $82,063 per family, while 2-person families (3,720 | 50.2%) have the highest median income of $29,647 per family member.
| Income Bracket | # Families | Median Income |
| 2-Person Families | 3,720 (50.2%) | $59,294 |
| 3-Person Families | 1,620 (21.9%) | $62,857 |
| 4-Person Families | 1,327 (17.9%) | $82,063 |
| 5-Person Families | 426 (5.8%) | $79,667 |
| 6-Person Families | 155 (2.1%) | $70,733 |
| 7+ Person Families | 159 (2.1%) | $65,938 |
| Total | 7,407 (100.0%) | $64,968 |
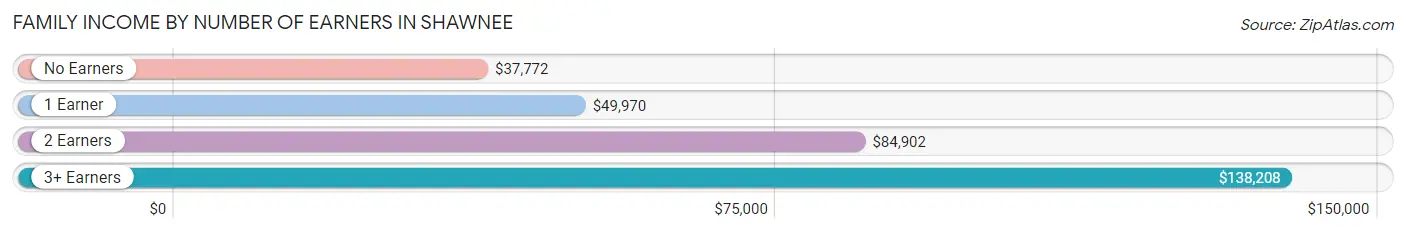
Family Income by Number of Earners in Shawnee
The median family income in Shawnee is $64,968, with families comprising 3+ earners (603) having the highest median family income of $138,208, while families with no earners (1,329) have the lowest median family income of $37,772, accounting for 8.1% and 17.9% of families, respectively.
| Number of Earners | # Families | Median Income |
| No Earners | 1,329 (17.9%) | $37,772 |
| 1 Earner | 2,825 (38.1%) | $49,970 |
| 2 Earners | 2,650 (35.8%) | $84,902 |
| 3+ Earners | 603 (8.1%) | $138,208 |
| Total | 7,407 (100.0%) | $64,968 |
Household Income in Shawnee
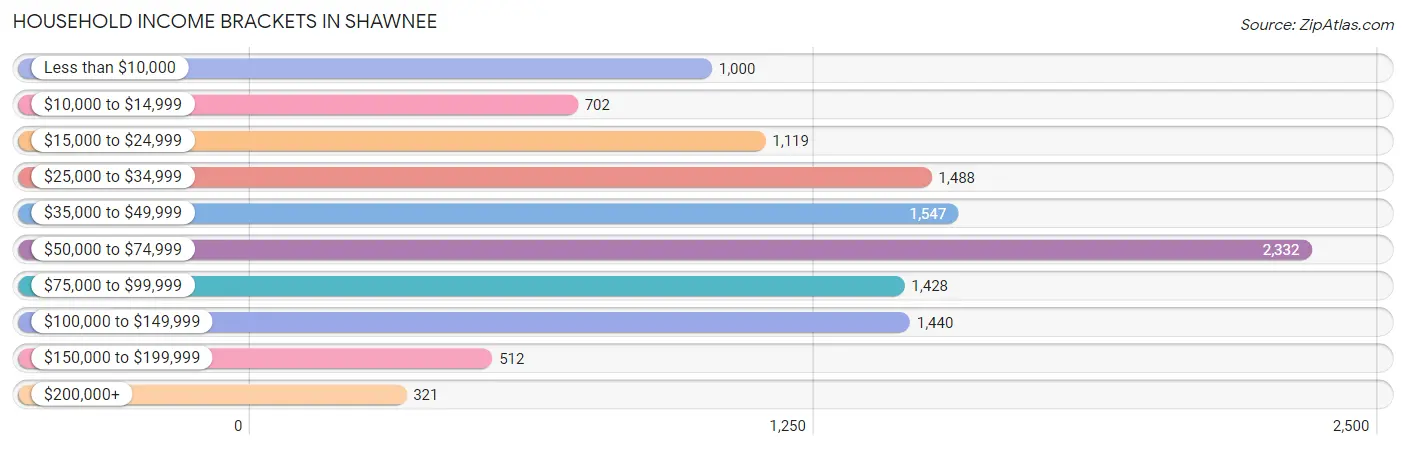
Household Income Brackets in Shawnee
With 2,332 households falling in the category, the $50,000 to $74,999 income range is the most frequent in Shawnee, accounting for 19.6% of all households. In contrast, only 321 households (2.7%) fall into the $200,000+ income bracket, making it the least populous group.
| Income Bracket | # Households | % Households |
| Less than $10,000 | 1,000 | 8.4% |
| $10,000 to $14,999 | 702 | 5.9% |
| $15,000 to $24,999 | 1,119 | 9.4% |
| $25,000 to $34,999 | 1,488 | 12.5% |
| $35,000 to $49,999 | 1,547 | 13.0% |
| $50,000 to $74,999 | 2,332 | 19.6% |
| $75,000 to $99,999 | 1,428 | 12.0% |
| $100,000 to $149,999 | 1,440 | 12.1% |
| $150,000 to $199,999 | 512 | 4.3% |
| $200,000+ | 321 | 2.7% |
Household Income by Householder Age in Shawnee
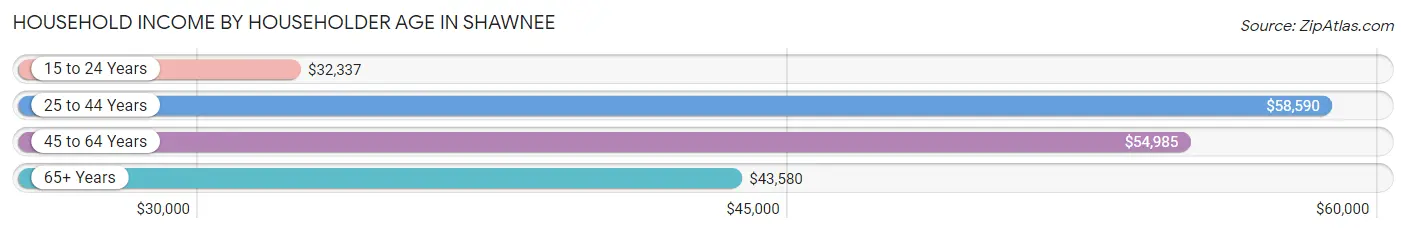
The median household income in Shawnee is $50,695, with the highest median household income of $58,590 found in the 25 to 44 years age bracket for the primary householder. A total of 3,651 households (30.7%) fall into this category. Meanwhile, the 15 to 24 years age bracket for the primary householder has the lowest median household income of $32,337, with 726 households (6.1%) in this group.
| Income Bracket | # Households | Median Income |
| 15 to 24 Years | 726 (6.1%) | $32,337 |
| 25 to 44 Years | 3,651 (30.7%) | $58,590 |
| 45 to 64 Years | 4,137 (34.8%) | $54,985 |
| 65+ Years | 3,386 (28.4%) | $43,580 |
| Total | 11,900 (100.0%) | $50,695 |
Poverty in Shawnee
Income Below Poverty by Sex and Age in Shawnee
With 17.5% poverty level for males and 22.7% for females among the residents of Shawnee, under 5 year old males and 18 to 24 year old females are the most vulnerable to poverty, with 365 males (36.6%) and 534 females (34.7%) in their respective age groups living below the poverty level.
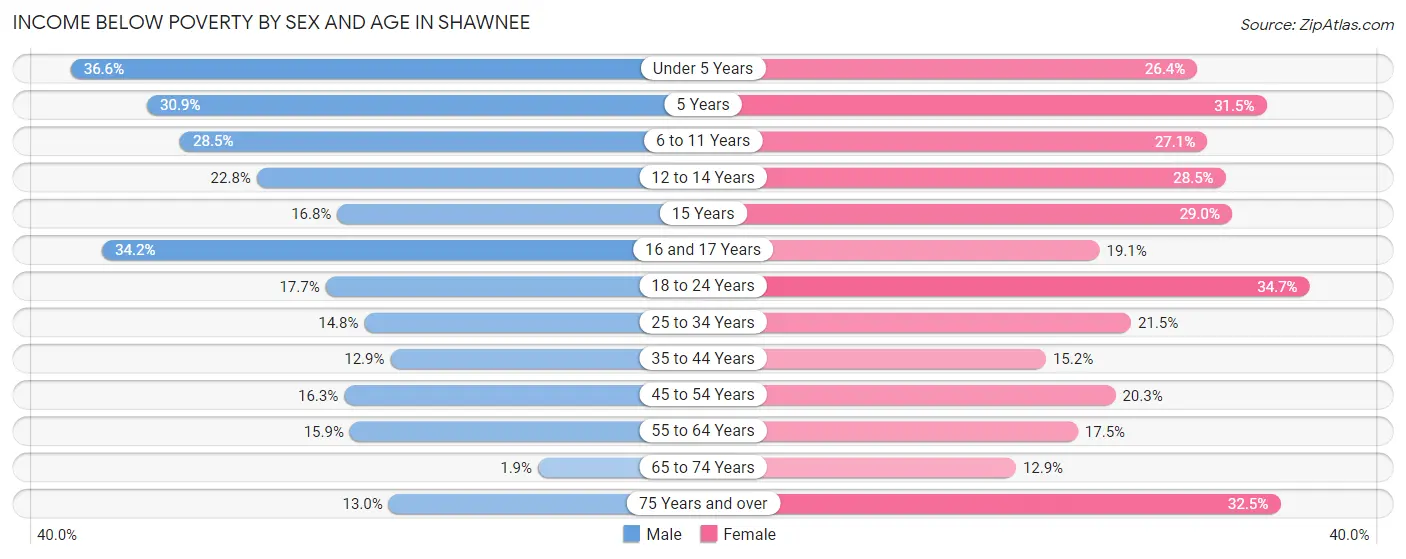
| Age Bracket | Male | Female |
| Under 5 Years | 365 (36.6%) | 292 (26.4%) |
| 5 Years | 55 (30.9%) | 46 (31.5%) |
| 6 to 11 Years | 338 (28.4%) | 343 (27.1%) |
| 12 to 14 Years | 156 (22.8%) | 135 (28.5%) |
| 15 Years | 22 (16.8%) | 44 (28.9%) |
| 16 and 17 Years | 113 (34.2%) | 89 (19.1%) |
| 18 to 24 Years | 251 (17.7%) | 534 (34.7%) |
| 25 to 34 Years | 303 (14.8%) | 443 (21.5%) |
| 35 to 44 Years | 207 (12.9%) | 249 (15.2%) |
| 45 to 54 Years | 264 (16.3%) | 332 (20.3%) |
| 55 to 64 Years | 277 (15.9%) | 372 (17.5%) |
| 65 to 74 Years | 26 (1.9%) | 187 (12.9%) |
| 75 Years and over | 104 (13.0%) | 425 (32.5%) |
| Total | 2,481 (17.5%) | 3,491 (22.7%) |
Income Above Poverty by Sex and Age in Shawnee
According to the poverty statistics in Shawnee, males aged 65 to 74 years and females aged 65 to 74 years are the age groups that are most secure financially, with 98.1% of males and 87.1% of females in these age groups living above the poverty line.
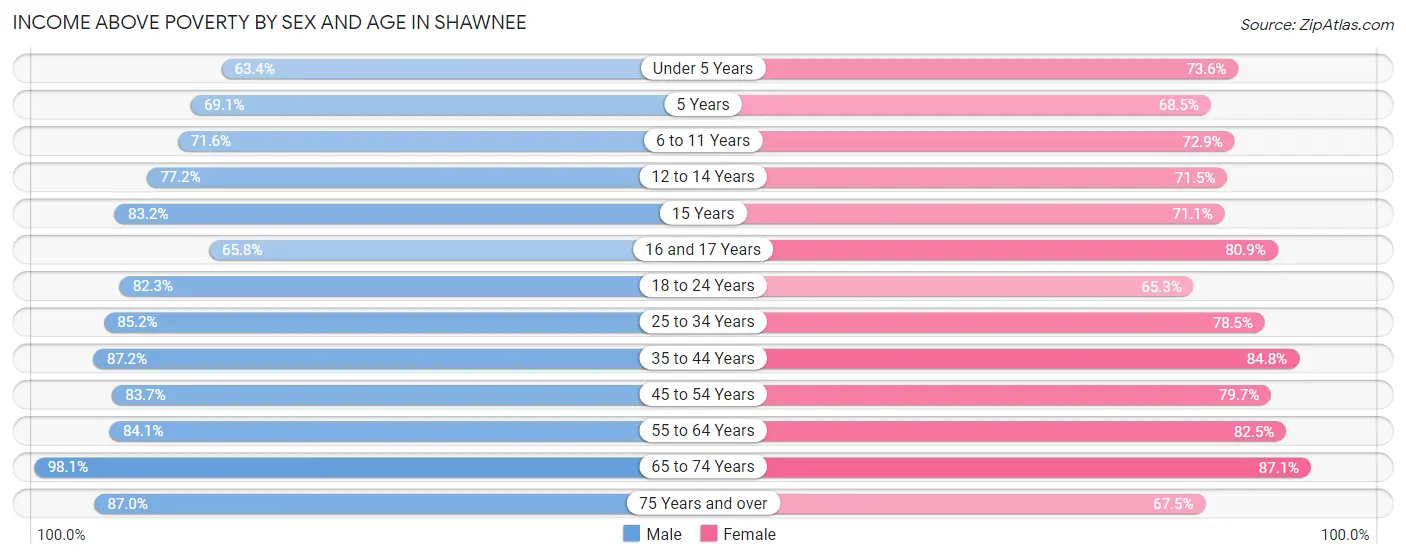
| Age Bracket | Male | Female |
| Under 5 Years | 633 (63.4%) | 815 (73.6%) |
| 5 Years | 123 (69.1%) | 100 (68.5%) |
| 6 to 11 Years | 850 (71.6%) | 922 (72.9%) |
| 12 to 14 Years | 529 (77.2%) | 339 (71.5%) |
| 15 Years | 109 (83.2%) | 108 (71.1%) |
| 16 and 17 Years | 217 (65.8%) | 376 (80.9%) |
| 18 to 24 Years | 1,170 (82.3%) | 1,004 (65.3%) |
| 25 to 34 Years | 1,747 (85.2%) | 1,619 (78.5%) |
| 35 to 44 Years | 1,404 (87.2%) | 1,394 (84.8%) |
| 45 to 54 Years | 1,358 (83.7%) | 1,302 (79.7%) |
| 55 to 64 Years | 1,470 (84.1%) | 1,750 (82.5%) |
| 65 to 74 Years | 1,352 (98.1%) | 1,259 (87.1%) |
| 75 Years and over | 697 (87.0%) | 881 (67.5%) |
| Total | 11,659 (82.5%) | 11,869 (77.3%) |
Income Below Poverty Among Married-Couple Families in Shawnee
The poverty statistics for married-couple families in Shawnee show that 7.4% or 371 of the total 4,996 families live below the poverty line. Families with 5 or more children have the highest poverty rate of 31.1%, comprising of 33 families. On the other hand, families with no children have the lowest poverty rate of 5.1%, which includes 157 families.
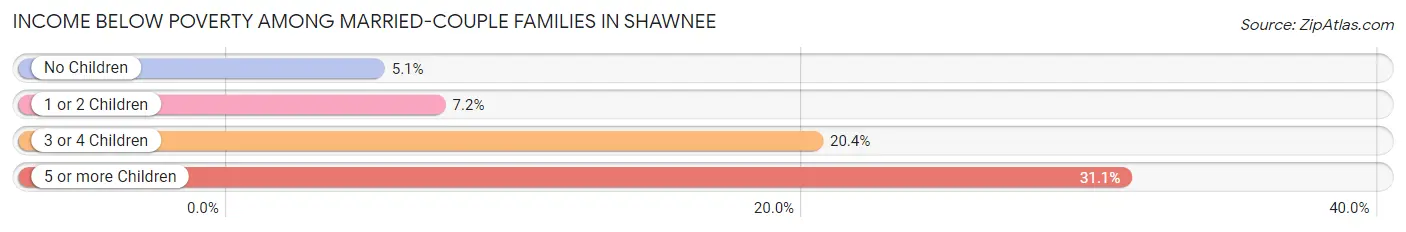
| Children | Above Poverty | Below Poverty |
| No Children | 2,916 (94.9%) | 157 (5.1%) |
| 1 or 2 Children | 1,335 (92.8%) | 104 (7.2%) |
| 3 or 4 Children | 301 (79.6%) | 77 (20.4%) |
| 5 or more Children | 73 (68.9%) | 33 (31.1%) |
| Total | 4,625 (92.6%) | 371 (7.4%) |
Income Below Poverty Among Single-Parent Households in Shawnee
According to the poverty data in Shawnee, 15.9% or 108 single-father households and 35.8% or 621 single-mother households are living below the poverty line. Among single-father households, those with 3 or 4 children have the highest poverty rate, with 41 households (91.1%) experiencing poverty. Likewise, among single-mother households, those with 5 or more children have the highest poverty rate, with 16 households (100.0%) falling below the poverty line.
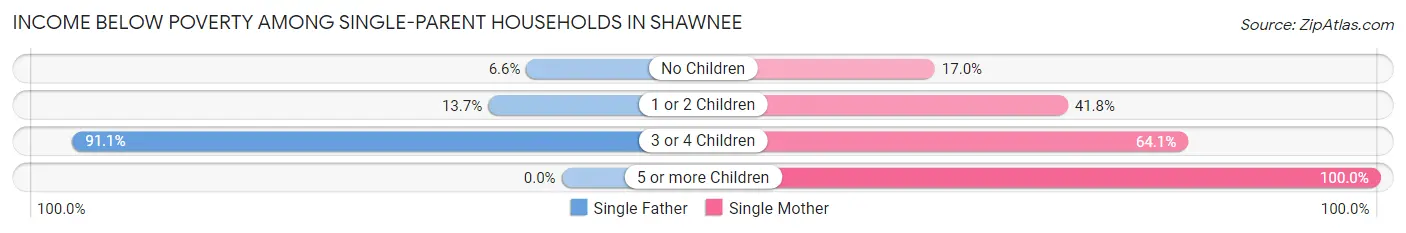
| Children | Single Father | Single Mother |
| No Children | 18 (6.6%) | 105 (17.0%) |
| 1 or 2 Children | 49 (13.7%) | 382 (41.7%) |
| 3 or 4 Children | 41 (91.1%) | 118 (64.1%) |
| 5 or more Children | 0 (0.0%) | 16 (100.0%) |
| Total | 108 (15.9%) | 621 (35.8%) |
Income Below Poverty Among Married-Couple vs Single-Parent Households in Shawnee
The poverty data for Shawnee shows that 371 of the married-couple family households (7.4%) and 729 of the single-parent households (30.2%) are living below the poverty level. Within the married-couple family households, those with 5 or more children have the highest poverty rate, with 33 households (31.1%) falling below the poverty line. Among the single-parent households, those with 5 or more children have the highest poverty rate, with 16 household (100.0%) living below poverty.
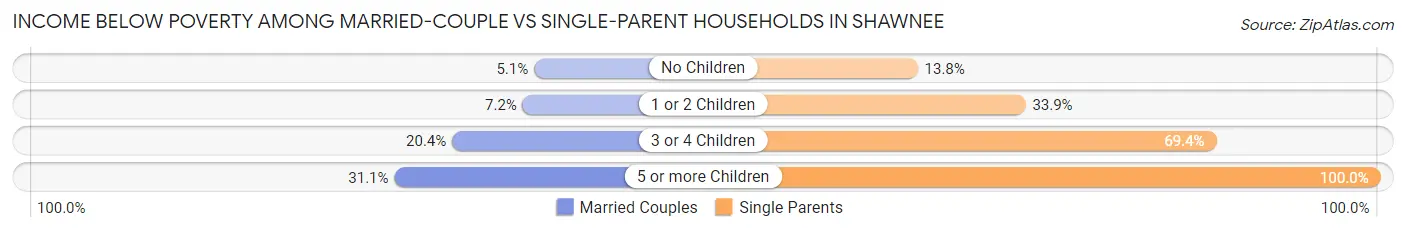
| Children | Married-Couple Families | Single-Parent Households |
| No Children | 157 (5.1%) | 123 (13.8%) |
| 1 or 2 Children | 104 (7.2%) | 431 (33.9%) |
| 3 or 4 Children | 77 (20.4%) | 159 (69.4%) |
| 5 or more Children | 33 (31.1%) | 16 (100.0%) |
| Total | 371 (7.4%) | 729 (30.2%) |
Race in Shawnee
The most populous races in Shawnee are White / Caucasian (22,312 | 71.1%), Native / Alaskan (4,325 | 13.8%), and Two or more Races (2,621 | 8.4%).
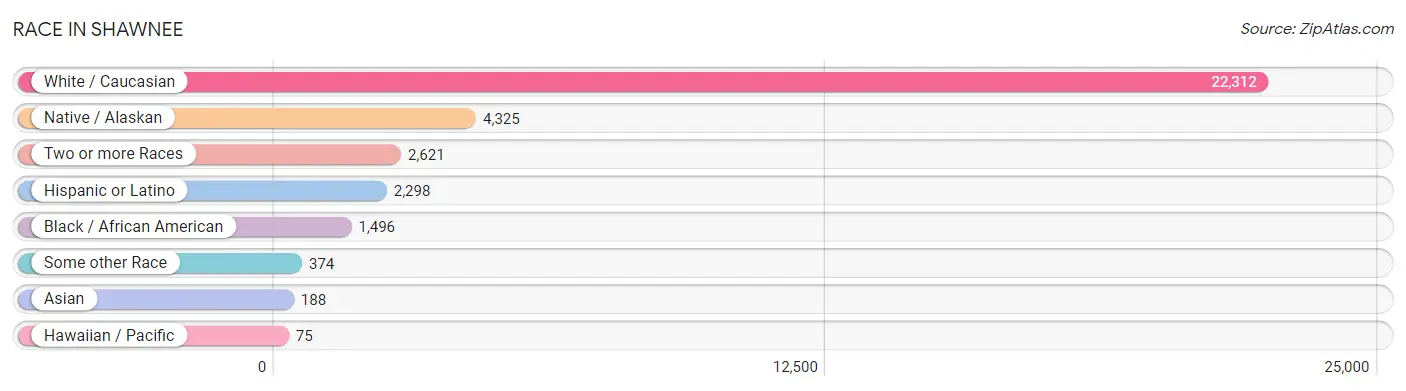
| Race | # Population | % Population |
| Asian | 188 | 0.6% |
| Black / African American | 1,496 | 4.8% |
| Hawaiian / Pacific | 75 | 0.2% |
| Hispanic or Latino | 2,298 | 7.3% |
| Native / Alaskan | 4,325 | 13.8% |
| White / Caucasian | 22,312 | 71.1% |
| Two or more Races | 2,621 | 8.4% |
| Some other Race | 374 | 1.2% |
| Total | 31,391 | 100.0% |
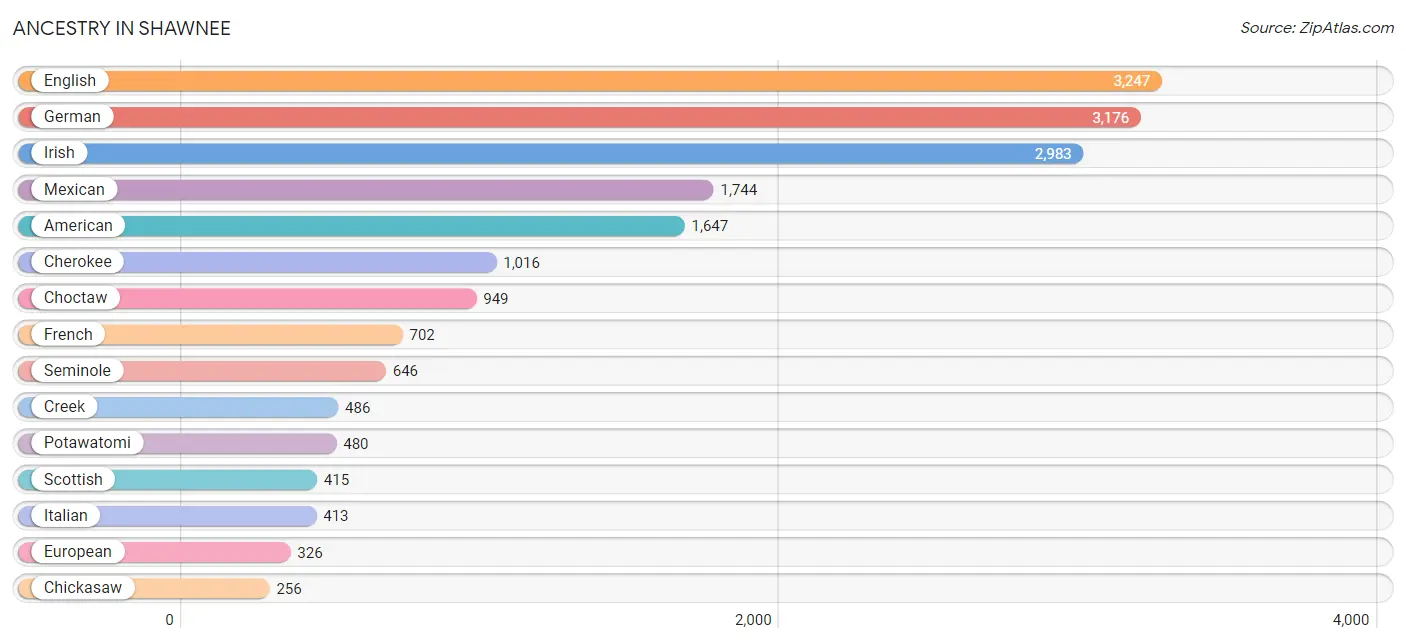
Ancestry in Shawnee
The most populous ancestries reported in Shawnee are English (3,247 | 10.3%), German (3,176 | 10.1%), Irish (2,983 | 9.5%), Mexican (1,744 | 5.6%), and American (1,647 | 5.2%), together accounting for 40.8% of all Shawnee residents.
| Ancestry | # Population | % Population |
| African | 51 | 0.2% |
| Albanian | 11 | 0.0% |
| American | 1,647 | 5.2% |
| Apache | 102 | 0.3% |
| Arab | 80 | 0.3% |
| Arapaho | 43 | 0.1% |
| Austrian | 15 | 0.1% |
| Belgian | 8 | 0.0% |
| Bhutanese | 17 | 0.1% |
| Blackfeet | 17 | 0.1% |
| British | 145 | 0.5% |
| Burmese | 77 | 0.3% |
| Celtic | 73 | 0.2% |
| Central American | 66 | 0.2% |
| Cherokee | 1,016 | 3.2% |
| Cheyenne | 76 | 0.2% |
| Chickasaw | 256 | 0.8% |
| Chippewa | 55 | 0.2% |
| Choctaw | 949 | 3.0% |
| Colombian | 11 | 0.0% |
| Comanche | 75 | 0.2% |
| Costa Rican | 26 | 0.1% |
| Creek | 486 | 1.5% |
| Croatian | 32 | 0.1% |
| Czech | 93 | 0.3% |
| Czechoslovakian | 17 | 0.1% |
| Danish | 103 | 0.3% |
| Delaware | 18 | 0.1% |
| Dominican | 5 | 0.0% |
| Dutch | 232 | 0.7% |
| Dutch West Indian | 64 | 0.2% |
| Eastern European | 12 | 0.0% |
| Egyptian | 12 | 0.0% |
| English | 3,247 | 10.3% |
| European | 326 | 1.0% |
| Fijian | 19 | 0.1% |
| Finnish | 4 | 0.0% |
| French | 702 | 2.2% |
| French Canadian | 32 | 0.1% |
| German | 3,176 | 10.1% |
| Guatemalan | 3 | 0.0% |
| Honduran | 12 | 0.0% |
| Hungarian | 13 | 0.0% |
| Indian (Asian) | 61 | 0.2% |
| Inupiat | 19 | 0.1% |
| Iranian | 74 | 0.2% |
| Irish | 2,983 | 9.5% |
| Italian | 413 | 1.3% |
| Jamaican | 76 | 0.2% |
| Kiowa | 24 | 0.1% |
| Korean | 122 | 0.4% |
| Laotian | 23 | 0.1% |
| Latvian | 10 | 0.0% |
| Lebanese | 68 | 0.2% |
| Lithuanian | 31 | 0.1% |
| Malaysian | 6 | 0.0% |
| Mexican | 1,744 | 5.6% |
| Native Hawaiian | 13 | 0.0% |
| Navajo | 10 | 0.0% |
| Northern European | 35 | 0.1% |
| Norwegian | 125 | 0.4% |
| Osage | 16 | 0.1% |
| Pakistani | 20 | 0.1% |
| Panamanian | 25 | 0.1% |
| Pennsylvania German | 5 | 0.0% |
| Polish | 135 | 0.4% |
| Portuguese | 25 | 0.1% |
| Potawatomi | 480 | 1.5% |
| Pueblo | 25 | 0.1% |
| Puerto Rican | 210 | 0.7% |
| Russian | 161 | 0.5% |
| Scandinavian | 141 | 0.4% |
| Scotch-Irish | 145 | 0.5% |
| Scottish | 415 | 1.3% |
| Seminole | 646 | 2.1% |
| Senegalese | 7 | 0.0% |
| Serbian | 11 | 0.0% |
| Shoshone | 10 | 0.0% |
| Sioux | 62 | 0.2% |
| Slavic | 16 | 0.1% |
| South American | 27 | 0.1% |
| Spaniard | 63 | 0.2% |
| Spanish | 106 | 0.3% |
| Sri Lankan | 23 | 0.1% |
| Subsaharan African | 58 | 0.2% |
| Swedish | 164 | 0.5% |
| Swiss | 20 | 0.1% |
| Thai | 9 | 0.0% |
| Tlingit-Haida | 11 | 0.0% |
| Trinidadian and Tobagonian | 6 | 0.0% |
| Venezuelan | 16 | 0.1% |
| Welsh | 161 | 0.5% |
| Yugoslavian | 15 | 0.1% | View All 93 Rows |
Immigrants in Shawnee
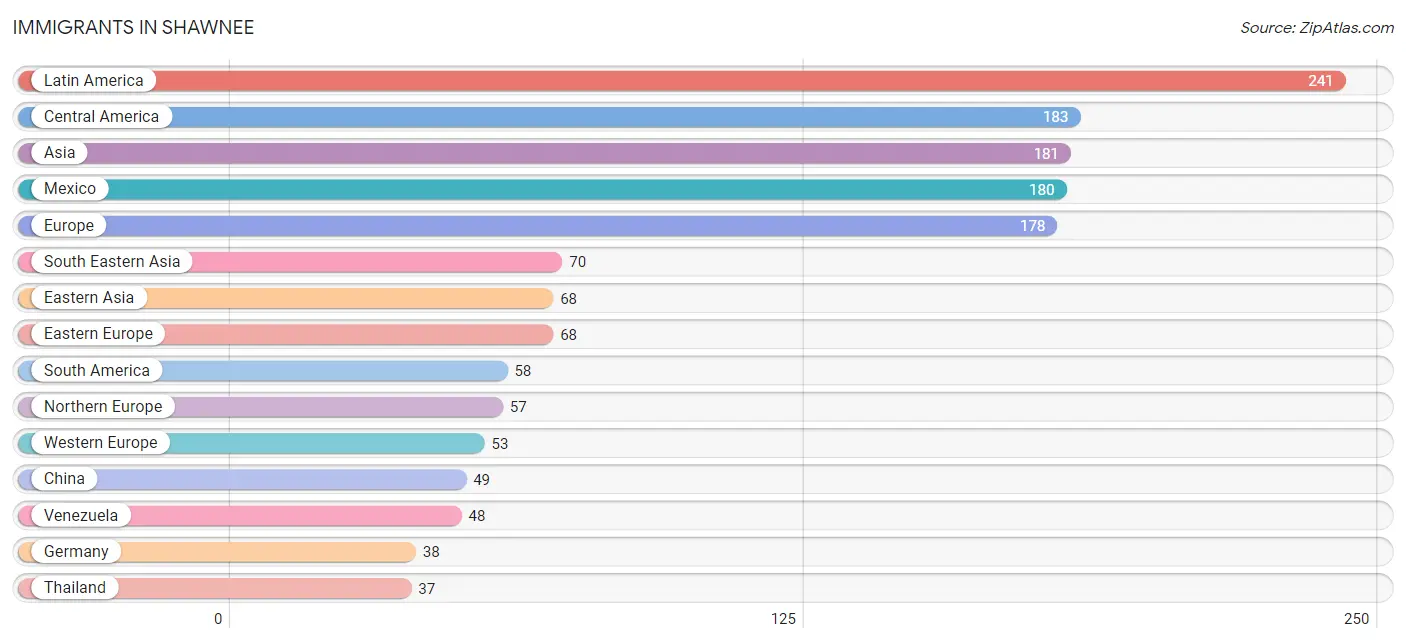
The most numerous immigrant groups reported in Shawnee came from Latin America (241 | 0.8%), Central America (183 | 0.6%), Asia (181 | 0.6%), Mexico (180 | 0.6%), and Europe (178 | 0.6%), together accounting for 3.1% of all Shawnee residents.
| Immigration Origin | # Population | % Population |
| Africa | 19 | 0.1% |
| Asia | 181 | 0.6% |
| Austria | 15 | 0.1% |
| Bosnia and Herzegovina | 15 | 0.1% |
| Canada | 32 | 0.1% |
| Central America | 183 | 0.6% |
| China | 49 | 0.2% |
| Colombia | 10 | 0.0% |
| Eastern Africa | 3 | 0.0% |
| Eastern Asia | 68 | 0.2% |
| Eastern Europe | 68 | 0.2% |
| Egypt | 12 | 0.0% |
| England | 20 | 0.1% |
| Europe | 178 | 0.6% |
| Germany | 38 | 0.1% |
| Guatemala | 3 | 0.0% |
| Hungary | 2 | 0.0% |
| Iran | 31 | 0.1% |
| Japan | 17 | 0.1% |
| Korea | 2 | 0.0% |
| Latin America | 241 | 0.8% |
| Latvia | 10 | 0.0% |
| Mexico | 180 | 0.6% |
| Micronesia | 30 | 0.1% |
| Northern Africa | 12 | 0.0% |
| Northern Europe | 57 | 0.2% |
| Oceania | 30 | 0.1% |
| Philippines | 10 | 0.0% |
| Russia | 16 | 0.1% |
| South Africa | 4 | 0.0% |
| South America | 58 | 0.2% |
| South Central Asia | 31 | 0.1% |
| South Eastern Asia | 70 | 0.2% |
| Thailand | 37 | 0.1% |
| Ukraine | 15 | 0.1% |
| Venezuela | 48 | 0.2% |
| Vietnam | 23 | 0.1% |
| Western Asia | 12 | 0.0% |
| Western Europe | 53 | 0.2% | View All 39 Rows |
Sex and Age in Shawnee
Sex and Age in Shawnee
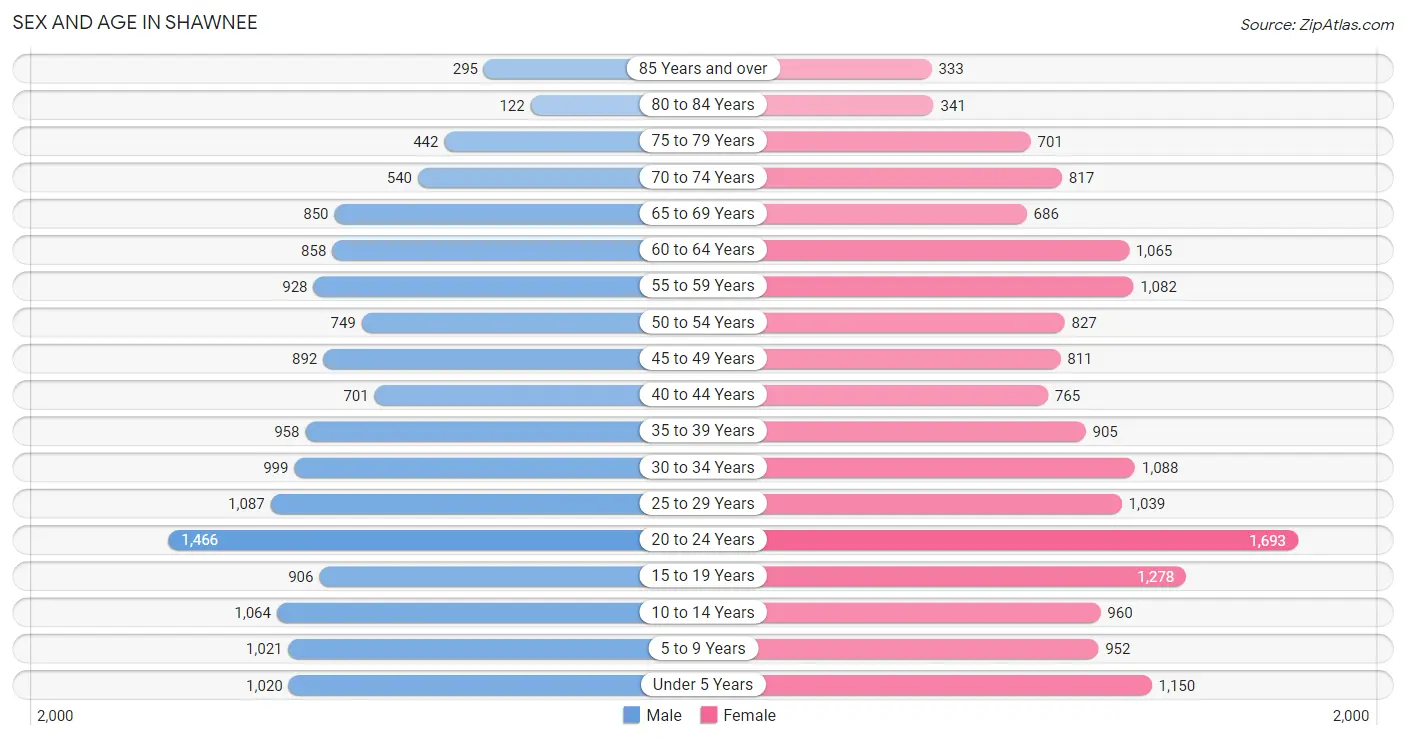
The most populous age groups in Shawnee are 20 to 24 Years (1,466 | 9.8%) for men and 20 to 24 Years (1,693 | 10.3%) for women.
| Age Bracket | Male | Female |
| Under 5 Years | 1,020 (6.9%) | 1,150 (7.0%) |
| 5 to 9 Years | 1,021 (6.9%) | 952 (5.8%) |
| 10 to 14 Years | 1,064 (7.1%) | 960 (5.8%) |
| 15 to 19 Years | 906 (6.1%) | 1,278 (7.7%) |
| 20 to 24 Years | 1,466 (9.8%) | 1,693 (10.3%) |
| 25 to 29 Years | 1,087 (7.3%) | 1,039 (6.3%) |
| 30 to 34 Years | 999 (6.7%) | 1,088 (6.6%) |
| 35 to 39 Years | 958 (6.4%) | 905 (5.5%) |
| 40 to 44 Years | 701 (4.7%) | 765 (4.6%) |
| 45 to 49 Years | 892 (6.0%) | 811 (4.9%) |
| 50 to 54 Years | 749 (5.0%) | 827 (5.0%) |
| 55 to 59 Years | 928 (6.2%) | 1,082 (6.6%) |
| 60 to 64 Years | 858 (5.8%) | 1,065 (6.5%) |
| 65 to 69 Years | 850 (5.7%) | 686 (4.2%) |
| 70 to 74 Years | 540 (3.6%) | 817 (5.0%) |
| 75 to 79 Years | 442 (3.0%) | 701 (4.3%) |
| 80 to 84 Years | 122 (0.8%) | 341 (2.1%) |
| 85 Years and over | 295 (2.0%) | 333 (2.0%) |
| Total | 14,898 (100.0%) | 16,493 (100.0%) |
Families and Households in Shawnee
Median Family Size in Shawnee
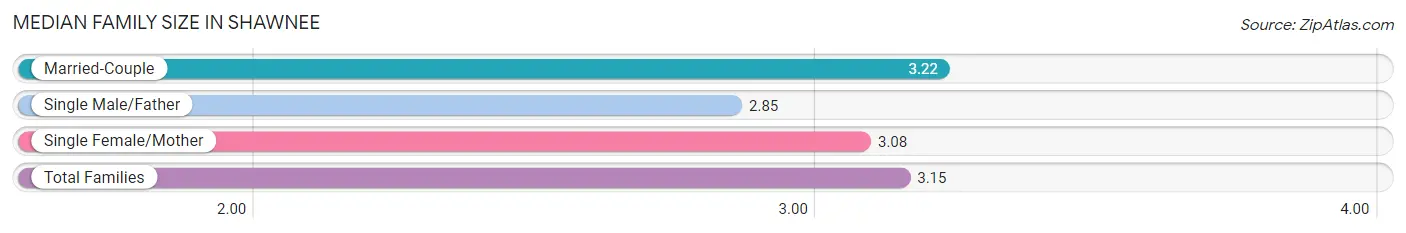
The median family size in Shawnee is 3.15 persons per family, with married-couple families (4,996 | 67.4%) accounting for the largest median family size of 3.22 persons per family. On the other hand, single male/father families (678 | 9.1%) represent the smallest median family size with 2.85 persons per family.
| Family Type | # Families | Family Size |
| Married-Couple | 4,996 (67.4%) | 3.22 |
| Single Male/Father | 678 (9.1%) | 2.85 |
| Single Female/Mother | 1,733 (23.4%) | 3.08 |
| Total Families | 7,407 (100.0%) | 3.15 |
Median Household Size in Shawnee
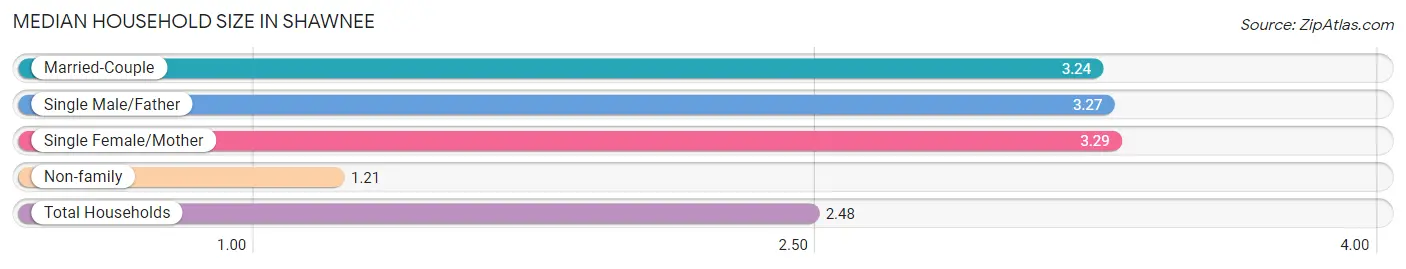
The median household size in Shawnee is 2.48 persons per household, with single female/mother households (1,733 | 14.6%) accounting for the largest median household size of 3.29 persons per household. non-family households (4,493 | 37.8%) represent the smallest median household size with 1.21 persons per household.
| Household Type | # Households | Household Size |
| Married-Couple | 4,996 (42.0%) | 3.24 |
| Single Male/Father | 678 (5.7%) | 3.27 |
| Single Female/Mother | 1,733 (14.6%) | 3.29 |
| Non-family | 4,493 (37.8%) | 1.21 |
| Total Households | 11,900 (100.0%) | 2.48 |
Household Size by Marriage Status in Shawnee
Out of a total of 11,900 households in Shawnee, 7,407 (62.2%) are family households, while 4,493 (37.8%) are nonfamily households. The most numerous type of family households are 2-person households, comprising 3,466, and the most common type of nonfamily households are 1-person households, comprising 3,878.
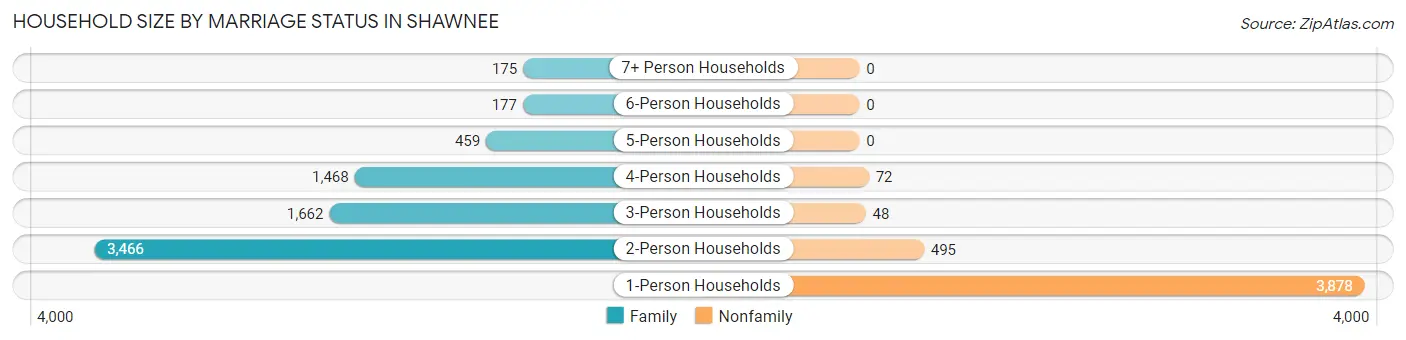
| Household Size | Family Households | Nonfamily Households |
| 1-Person Households | - | 3,878 (32.6%) |
| 2-Person Households | 3,466 (29.1%) | 495 (4.2%) |
| 3-Person Households | 1,662 (14.0%) | 48 (0.4%) |
| 4-Person Households | 1,468 (12.3%) | 72 (0.6%) |
| 5-Person Households | 459 (3.9%) | 0 (0.0%) |
| 6-Person Households | 177 (1.5%) | 0 (0.0%) |
| 7+ Person Households | 175 (1.5%) | 0 (0.0%) |
| Total | 7,407 (62.2%) | 4,493 (37.8%) |
Female Fertility in Shawnee
Fertility by Age in Shawnee
Average fertility rate in Shawnee is 52.0 births per 1,000 women. Women in the age bracket of 20 to 34 years have the highest fertility rate with 75.0 births per 1,000 women. Women in the age bracket of 20 to 34 years acount for 70.7% of all women with births.
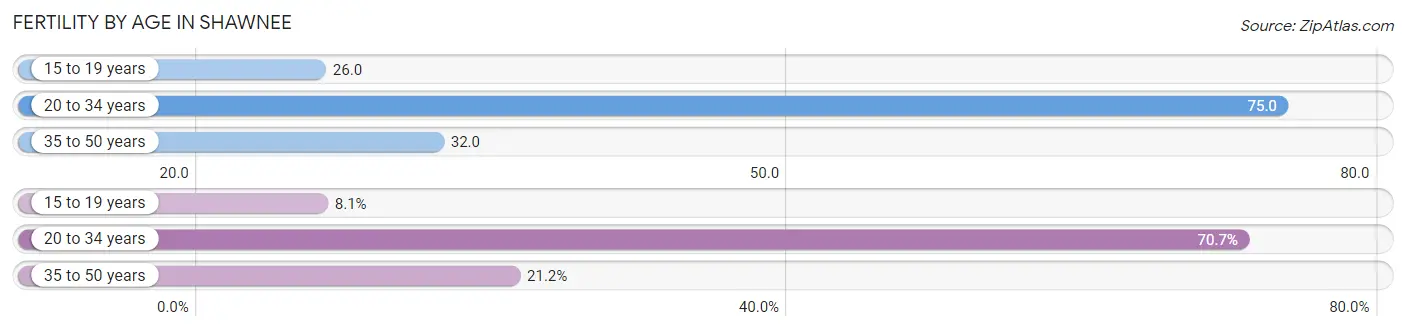
| Age Bracket | Women with Births | Births / 1,000 Women |
| 15 to 19 years | 33 (8.1%) | 26.0 |
| 20 to 34 years | 287 (70.7%) | 75.0 |
| 35 to 50 years | 86 (21.2%) | 32.0 |
| Total | 406 (100.0%) | 52.0 |
Fertility by Age by Marriage Status in Shawnee
55.9% of women with births (406) in Shawnee are married. The highest percentage of unmarried women with births falls into 15 to 19 years age bracket with 100.0% of them unmarried at the time of birth, while the lowest percentage of unmarried women with births belong to 20 to 34 years age bracket with 35.9% of them unmarried.
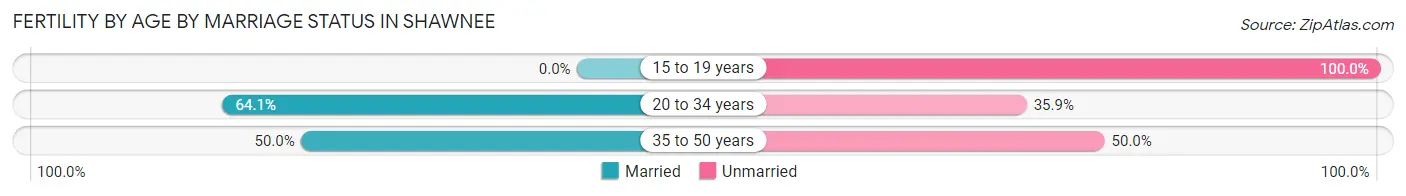
| Age Bracket | Married | Unmarried |
| 15 to 19 years | 0 (0.0%) | 33 (100.0%) |
| 20 to 34 years | 184 (64.1%) | 103 (35.9%) |
| 35 to 50 years | 43 (50.0%) | 43 (50.0%) |
| Total | 227 (55.9%) | 179 (44.1%) |
Fertility by Education in Shawnee
Average fertility rate in Shawnee is 52.0 births per 1,000 women. Women with the education attainment of high school diploma have the highest fertility rate of 85.0 births per 1,000 women, while women with the education attainment of bachelor's degree have the lowest fertility at 32.0 births per 1,000 women. Women with the education attainment of college or associate's degree represent 39.7% of all women with births.
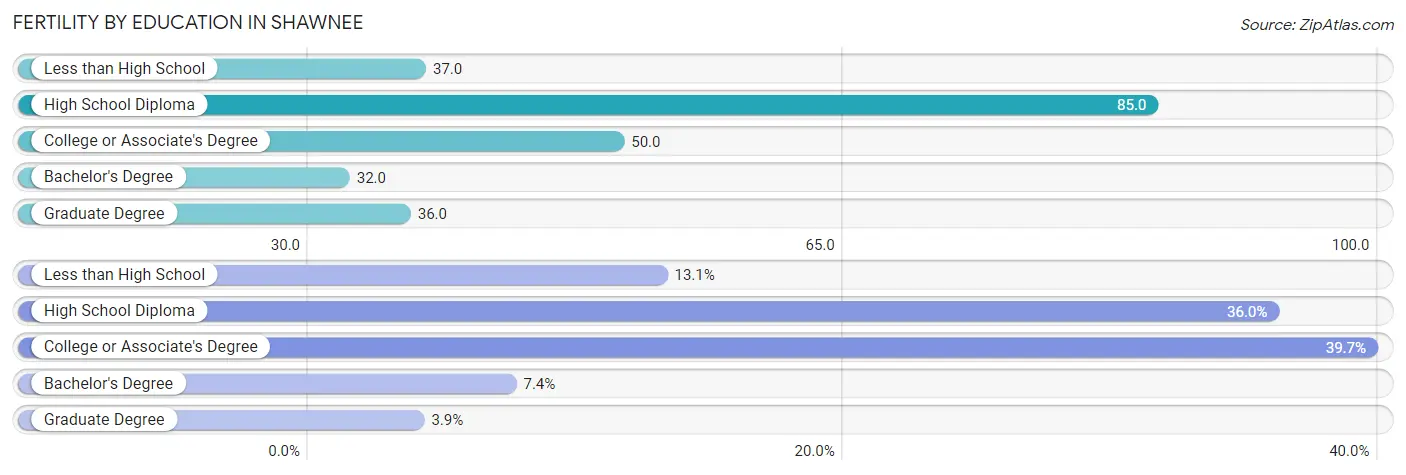
| Educational Attainment | Women with Births | Births / 1,000 Women |
| Less than High School | 53 (13.1%) | 37.0 |
| High School Diploma | 146 (36.0%) | 85.0 |
| College or Associate's Degree | 161 (39.7%) | 50.0 |
| Bachelor's Degree | 30 (7.4%) | 32.0 |
| Graduate Degree | 16 (3.9%) | 36.0 |
| Total | 406 (100.0%) | 52.0 |
Fertility by Education by Marriage Status in Shawnee
44.1% of women with births in Shawnee are unmarried. Women with the educational attainment of college or associate's degree are most likely to be married with 66.5% of them married at childbirth, while women with the educational attainment of graduate degree are least likely to be married with 56.2% of them unmarried at childbirth.
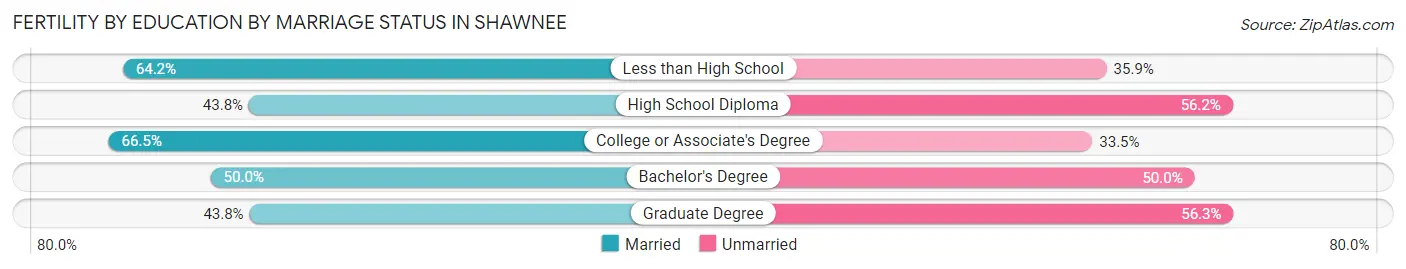
| Educational Attainment | Married | Unmarried |
| Less than High School | 34 (64.1%) | 19 (35.8%) |
| High School Diploma | 64 (43.8%) | 82 (56.2%) |
| College or Associate's Degree | 107 (66.5%) | 54 (33.5%) |
| Bachelor's Degree | 15 (50.0%) | 15 (50.0%) |
| Graduate Degree | 7 (43.8%) | 9 (56.2%) |
| Total | 227 (55.9%) | 179 (44.1%) |
Employment Characteristics in Shawnee
Employment by Class of Employer in Shawnee
Among the 12,634 employed individuals in Shawnee, private company employees (7,895 | 62.5%), local government employees (1,096 | 8.7%), and not-for-profit organizations (977 | 7.7%) make up the most common classes of employment.
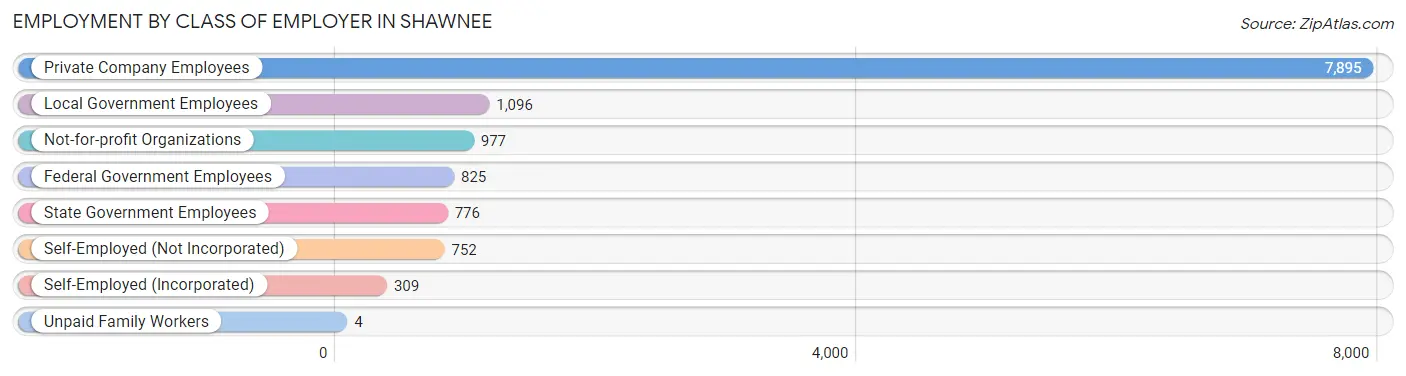
| Employer Class | # Employees | % Employees |
| Private Company Employees | 7,895 | 62.5% |
| Self-Employed (Incorporated) | 309 | 2.5% |
| Self-Employed (Not Incorporated) | 752 | 5.9% |
| Not-for-profit Organizations | 977 | 7.7% |
| Local Government Employees | 1,096 | 8.7% |
| State Government Employees | 776 | 6.1% |
| Federal Government Employees | 825 | 6.5% |
| Unpaid Family Workers | 4 | 0.0% |
| Total | 12,634 | 100.0% |
Employment Status by Age in Shawnee
According to the labor force statistics for Shawnee, out of the total population over 16 years of age (24,940), 55.5% or 13,842 individuals are in the labor force, with 6.8% or 941 of them unemployed. The age group with the highest labor force participation rate is 25 to 29 years, with 79.7% or 1,694 individuals in the labor force. Within the labor force, the 16 to 19 years age range has the highest percentage of unemployed individuals, with 22.5% or 141 of them being unemployed.
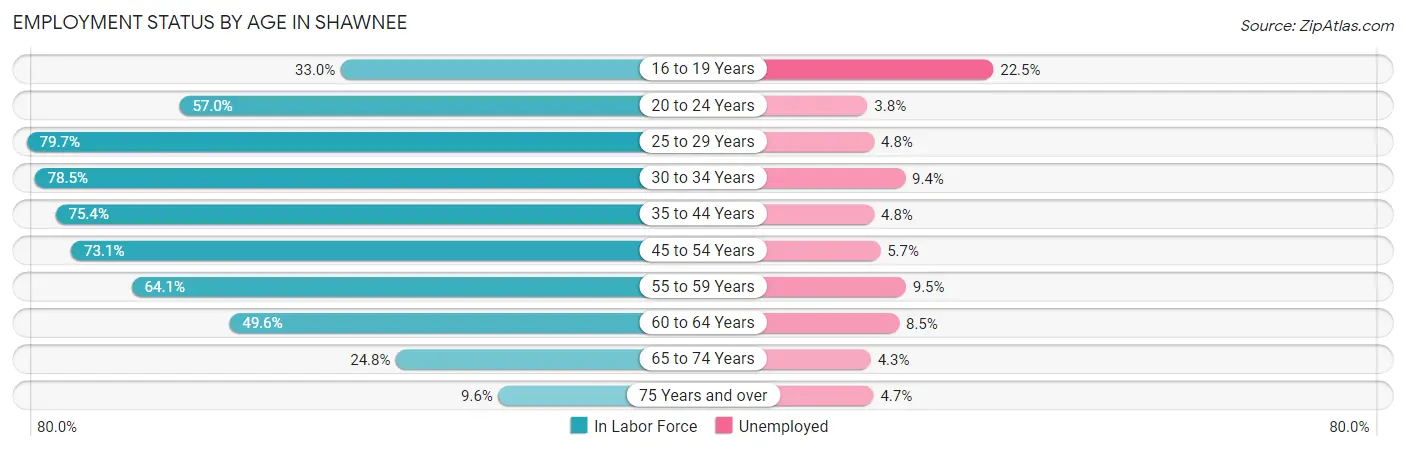
| Age Bracket | In Labor Force | Unemployed |
| 16 to 19 Years | 627 (33.0%) | 141 (22.5%) |
| 20 to 24 Years | 1,801 (57.0%) | 68 (3.8%) |
| 25 to 29 Years | 1,694 (79.7%) | 81 (4.8%) |
| 30 to 34 Years | 1,638 (78.5%) | 154 (9.4%) |
| 35 to 44 Years | 2,510 (75.4%) | 120 (4.8%) |
| 45 to 54 Years | 2,397 (73.1%) | 137 (5.7%) |
| 55 to 59 Years | 1,288 (64.1%) | 122 (9.5%) |
| 60 to 64 Years | 954 (49.6%) | 81 (8.5%) |
| 65 to 74 Years | 717 (24.8%) | 31 (4.3%) |
| 75 Years and over | 214 (9.6%) | 10 (4.7%) |
| Total | 13,842 (55.5%) | 941 (6.8%) |
Employment Status by Educational Attainment in Shawnee
According to labor force statistics for Shawnee, 71.0% of individuals (10,475) out of the total population between 25 and 64 years of age (14,754) are in the labor force, with 6.6% or 691 of them being unemployed. The group with the highest labor force participation rate are those with the educational attainment of bachelor's degree or higher, with 82.9% or 2,936 individuals in the labor force. Within the labor force, individuals with high school diploma education have the highest percentage of unemployment, with 9.7% or 294 of them being unemployed.
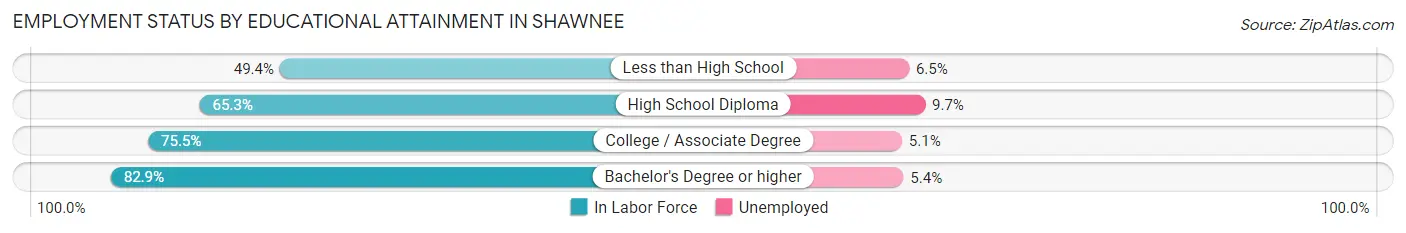
| Educational Attainment | In Labor Force | Unemployed |
| Less than High School | 844 (49.4%) | 111 (6.5%) |
| High School Diploma | 3,034 (65.3%) | 451 (9.7%) |
| College / Associate Degree | 3,667 (75.5%) | 248 (5.1%) |
| Bachelor's Degree or higher | 2,936 (82.9%) | 191 (5.4%) |
| Total | 10,475 (71.0%) | 974 (6.6%) |
Employment Occupations by Sex in Shawnee
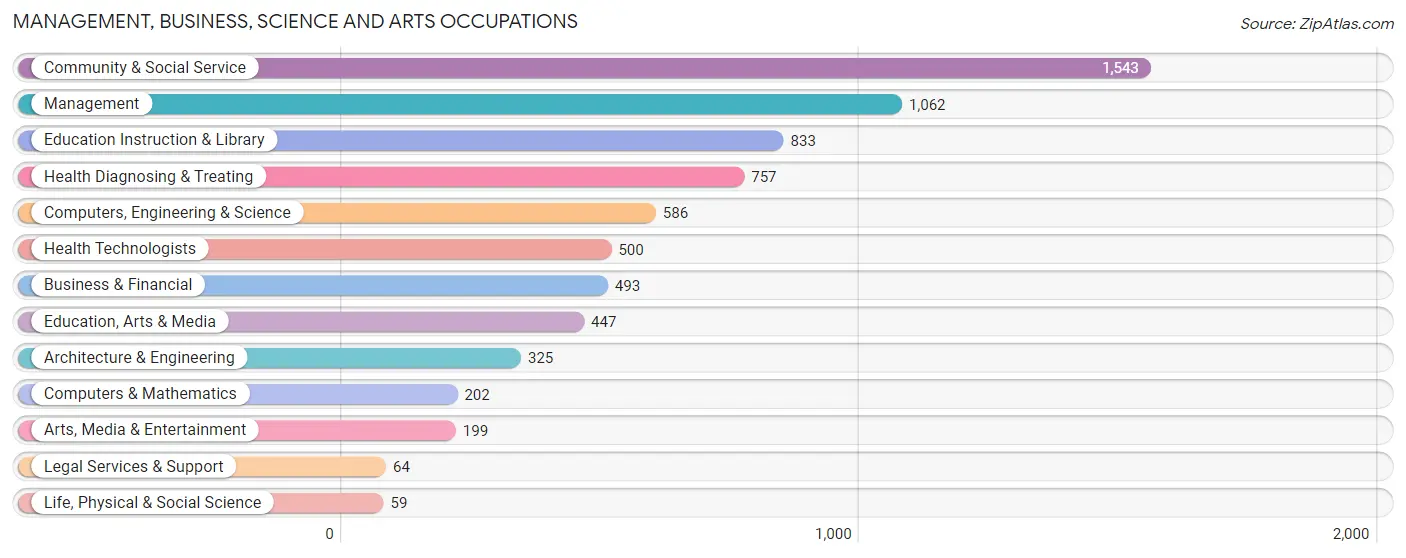
Management, Business, Science and Arts Occupations
The most common Management, Business, Science and Arts occupations in Shawnee are Community & Social Service (1,543 | 12.0%), Management (1,062 | 8.3%), Education Instruction & Library (833 | 6.5%), Health Diagnosing & Treating (757 | 5.9%), and Computers, Engineering & Science (586 | 4.5%).
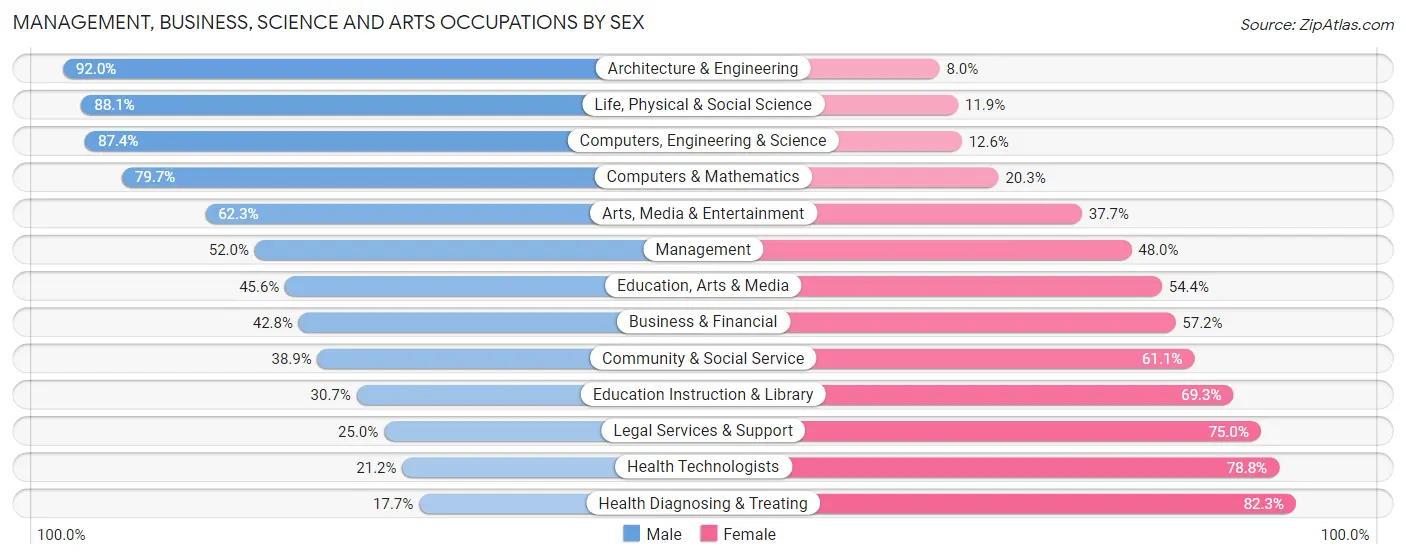
Management, Business, Science and Arts Occupations by Sex
Within the Management, Business, Science and Arts occupations in Shawnee, the most male-oriented occupations are Architecture & Engineering (92.0%), Life, Physical & Social Science (88.1%), and Computers, Engineering & Science (87.4%), while the most female-oriented occupations are Health Diagnosing & Treating (82.3%), Health Technologists (78.8%), and Legal Services & Support (75.0%).
| Occupation | Male | Female |
| Management | 552 (52.0%) | 510 (48.0%) |
| Business & Financial | 211 (42.8%) | 282 (57.2%) |
| Computers, Engineering & Science | 512 (87.4%) | 74 (12.6%) |
| Computers & Mathematics | 161 (79.7%) | 41 (20.3%) |
| Architecture & Engineering | 299 (92.0%) | 26 (8.0%) |
| Life, Physical & Social Science | 52 (88.1%) | 7 (11.9%) |
| Community & Social Service | 600 (38.9%) | 943 (61.1%) |
| Education, Arts & Media | 204 (45.6%) | 243 (54.4%) |
| Legal Services & Support | 16 (25.0%) | 48 (75.0%) |
| Education Instruction & Library | 256 (30.7%) | 577 (69.3%) |
| Arts, Media & Entertainment | 124 (62.3%) | 75 (37.7%) |
| Health Diagnosing & Treating | 134 (17.7%) | 623 (82.3%) |
| Health Technologists | 106 (21.2%) | 394 (78.8%) |
| Total (Category) | 2,009 (45.2%) | 2,432 (54.8%) |
| Total (Overall) | 6,688 (52.0%) | 6,179 (48.0%) |
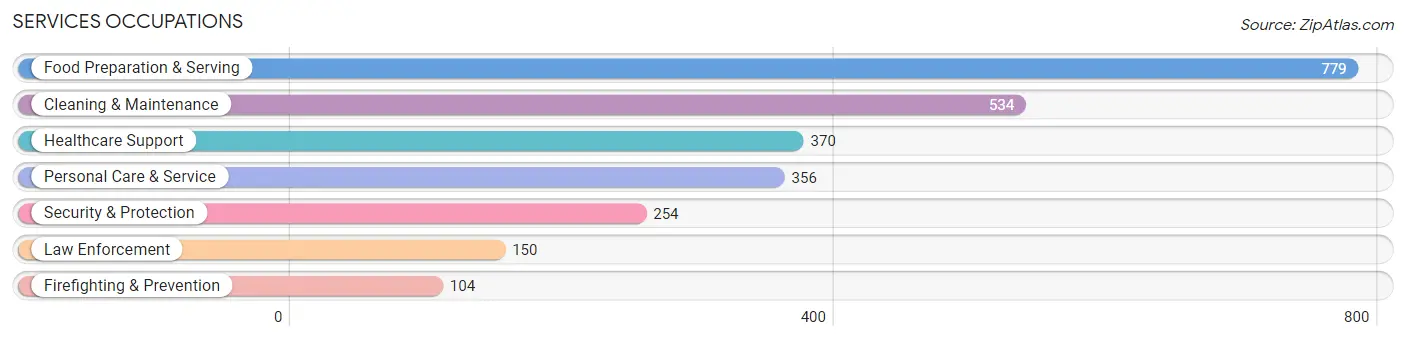
Services Occupations
The most common Services occupations in Shawnee are Food Preparation & Serving (779 | 6.0%), Cleaning & Maintenance (534 | 4.2%), Healthcare Support (370 | 2.9%), Personal Care & Service (356 | 2.8%), and Security & Protection (254 | 2.0%).
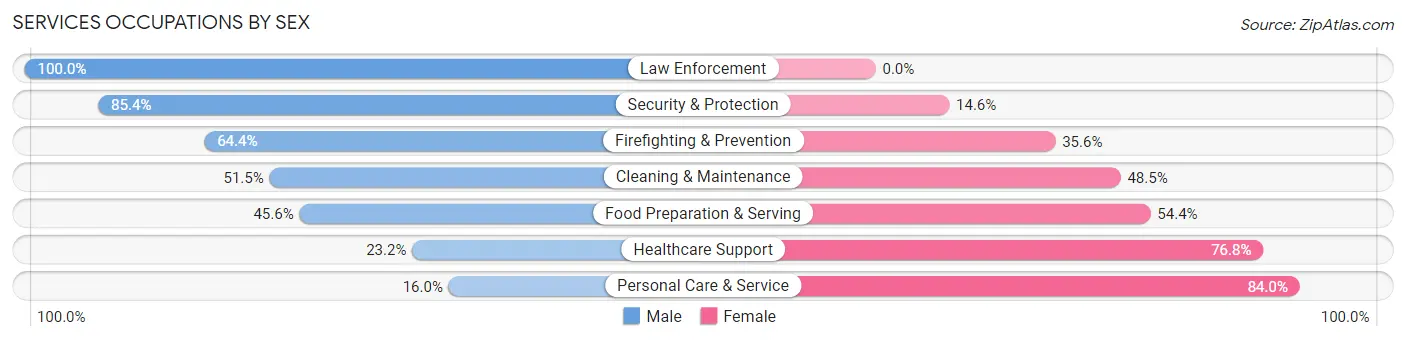
Services Occupations by Sex
Within the Services occupations in Shawnee, the most male-oriented occupations are Law Enforcement (100.0%), Security & Protection (85.4%), and Firefighting & Prevention (64.4%), while the most female-oriented occupations are Personal Care & Service (84.0%), Healthcare Support (76.8%), and Food Preparation & Serving (54.4%).
| Occupation | Male | Female |
| Healthcare Support | 86 (23.2%) | 284 (76.8%) |
| Security & Protection | 217 (85.4%) | 37 (14.6%) |
| Firefighting & Prevention | 67 (64.4%) | 37 (35.6%) |
| Law Enforcement | 150 (100.0%) | 0 (0.0%) |
| Food Preparation & Serving | 355 (45.6%) | 424 (54.4%) |
| Cleaning & Maintenance | 275 (51.5%) | 259 (48.5%) |
| Personal Care & Service | 57 (16.0%) | 299 (84.0%) |
| Total (Category) | 990 (43.2%) | 1,303 (56.8%) |
| Total (Overall) | 6,688 (52.0%) | 6,179 (48.0%) |
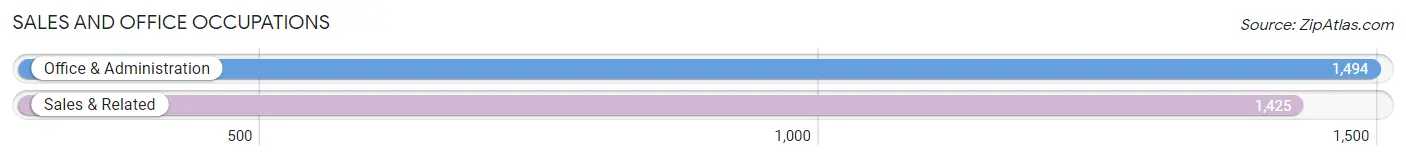
Sales and Office Occupations
The most common Sales and Office occupations in Shawnee are Office & Administration (1,494 | 11.6%), and Sales & Related (1,425 | 11.1%).
Sales and Office Occupations by Sex
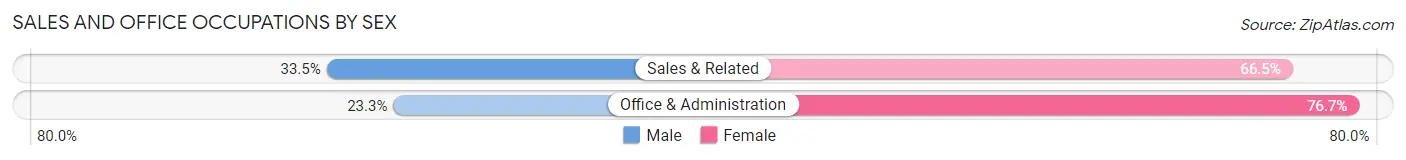
| Occupation | Male | Female |
| Sales & Related | 478 (33.5%) | 947 (66.5%) |
| Office & Administration | 348 (23.3%) | 1,146 (76.7%) |
| Total (Category) | 826 (28.3%) | 2,093 (71.7%) |
| Total (Overall) | 6,688 (52.0%) | 6,179 (48.0%) |
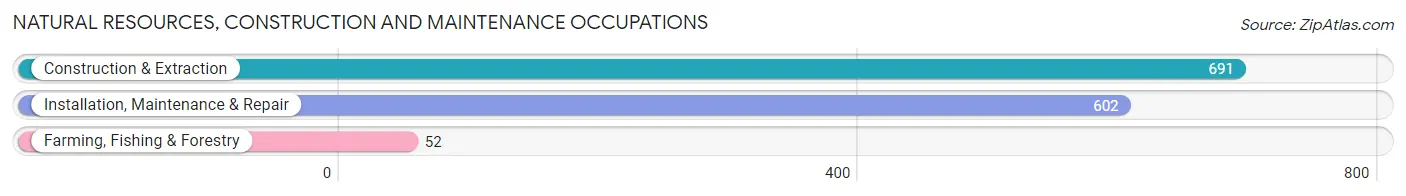
Natural Resources, Construction and Maintenance Occupations
The most common Natural Resources, Construction and Maintenance occupations in Shawnee are Construction & Extraction (691 | 5.4%), Installation, Maintenance & Repair (602 | 4.7%), and Farming, Fishing & Forestry (52 | 0.4%).
Natural Resources, Construction and Maintenance Occupations by Sex
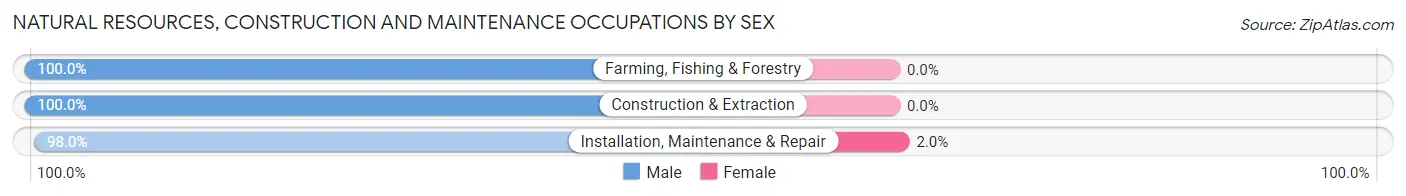
| Occupation | Male | Female |
| Farming, Fishing & Forestry | 52 (100.0%) | 0 (0.0%) |
| Construction & Extraction | 691 (100.0%) | 0 (0.0%) |
| Installation, Maintenance & Repair | 590 (98.0%) | 12 (2.0%) |
| Total (Category) | 1,333 (99.1%) | 12 (0.9%) |
| Total (Overall) | 6,688 (52.0%) | 6,179 (48.0%) |
Production, Transportation and Moving Occupations
The most common Production, Transportation and Moving occupations in Shawnee are Production (832 | 6.5%), Material Moving (595 | 4.6%), and Transportation (442 | 3.4%).
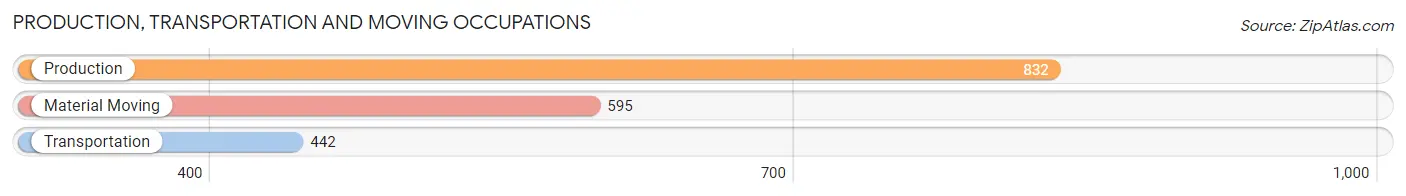
Production, Transportation and Moving Occupations by Sex
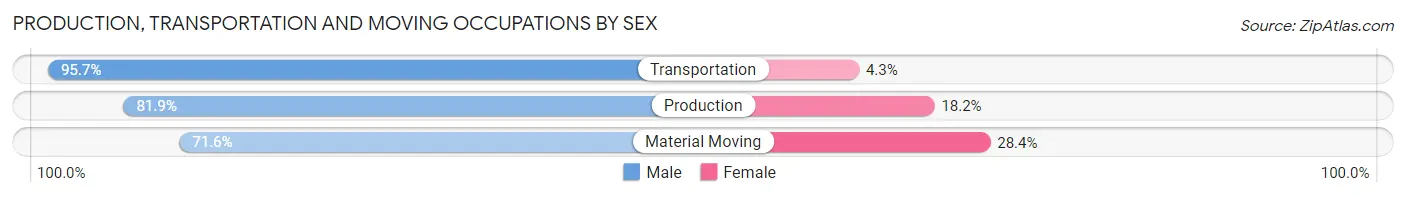
| Occupation | Male | Female |
| Production | 681 (81.9%) | 151 (18.1%) |
| Transportation | 423 (95.7%) | 19 (4.3%) |
| Material Moving | 426 (71.6%) | 169 (28.4%) |
| Total (Category) | 1,530 (81.9%) | 339 (18.1%) |
| Total (Overall) | 6,688 (52.0%) | 6,179 (48.0%) |
Employment Industries by Sex in Shawnee
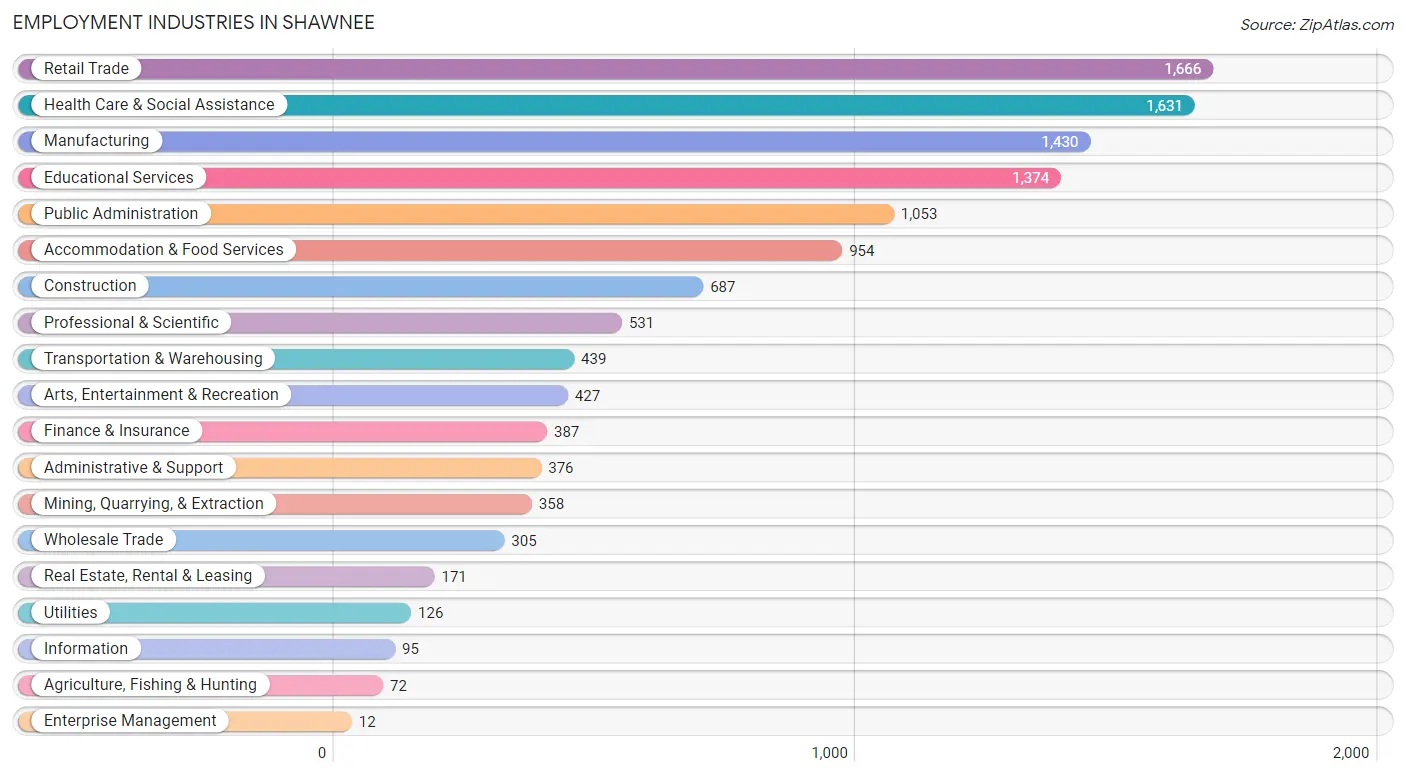
Employment Industries in Shawnee
The major employment industries in Shawnee include Retail Trade (1,666 | 13.0%), Health Care & Social Assistance (1,631 | 12.7%), Manufacturing (1,430 | 11.1%), Educational Services (1,374 | 10.7%), and Public Administration (1,053 | 8.2%).
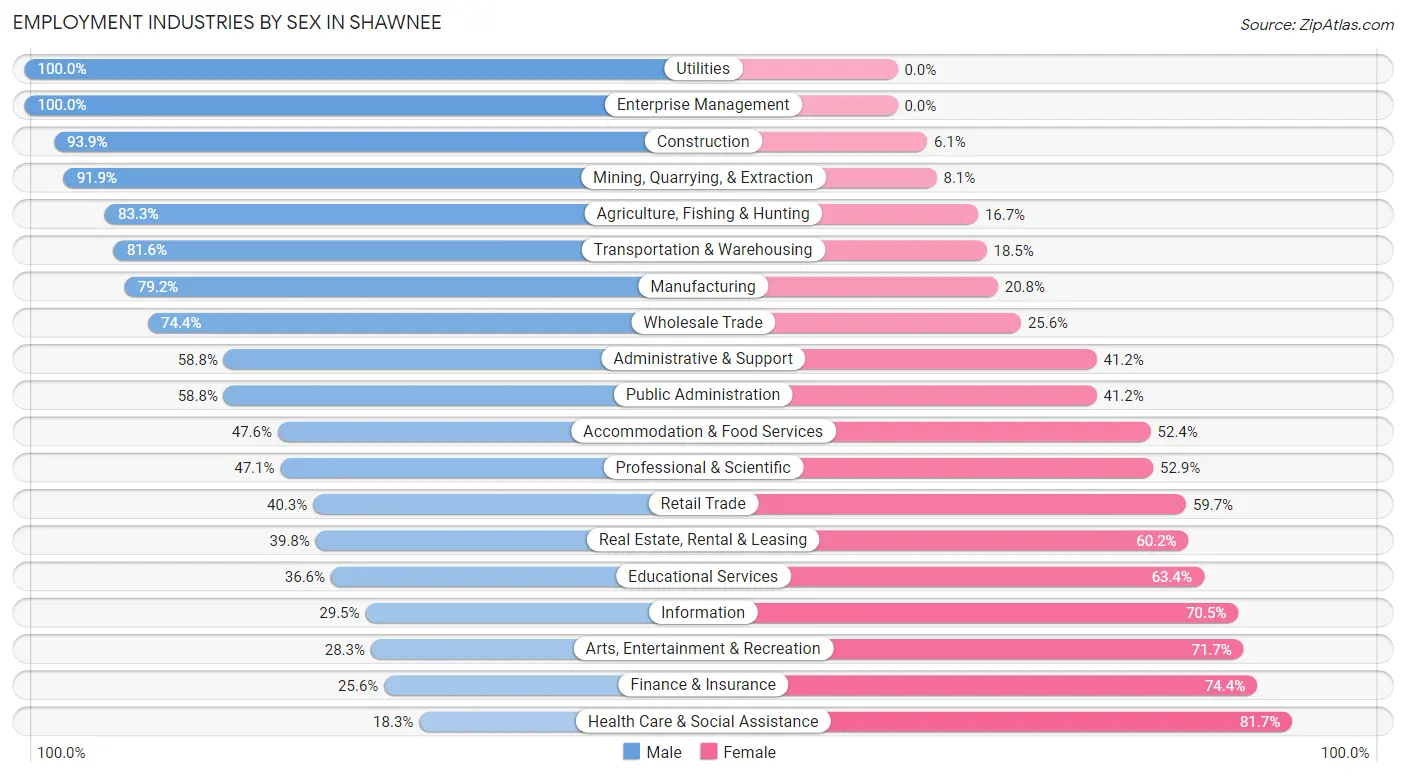
Employment Industries by Sex in Shawnee
The Shawnee industries that see more men than women are Utilities (100.0%), Enterprise Management (100.0%), and Construction (93.9%), whereas the industries that tend to have a higher number of women are Health Care & Social Assistance (81.7%), Finance & Insurance (74.4%), and Arts, Entertainment & Recreation (71.7%).
| Industry | Male | Female |
| Agriculture, Fishing & Hunting | 60 (83.3%) | 12 (16.7%) |
| Mining, Quarrying, & Extraction | 329 (91.9%) | 29 (8.1%) |
| Construction | 645 (93.9%) | 42 (6.1%) |
| Manufacturing | 1,133 (79.2%) | 297 (20.8%) |
| Wholesale Trade | 227 (74.4%) | 78 (25.6%) |
| Retail Trade | 671 (40.3%) | 995 (59.7%) |
| Transportation & Warehousing | 358 (81.6%) | 81 (18.4%) |
| Utilities | 126 (100.0%) | 0 (0.0%) |
| Information | 28 (29.5%) | 67 (70.5%) |
| Finance & Insurance | 99 (25.6%) | 288 (74.4%) |
| Real Estate, Rental & Leasing | 68 (39.8%) | 103 (60.2%) |
| Professional & Scientific | 250 (47.1%) | 281 (52.9%) |
| Enterprise Management | 12 (100.0%) | 0 (0.0%) |
| Administrative & Support | 221 (58.8%) | 155 (41.2%) |
| Educational Services | 503 (36.6%) | 871 (63.4%) |
| Health Care & Social Assistance | 299 (18.3%) | 1,332 (81.7%) |
| Arts, Entertainment & Recreation | 121 (28.3%) | 306 (71.7%) |
| Accommodation & Food Services | 454 (47.6%) | 500 (52.4%) |
| Public Administration | 619 (58.8%) | 434 (41.2%) |
| Total | 6,688 (52.0%) | 6,179 (48.0%) |
Education in Shawnee
School Enrollment in Shawnee
The most common levels of schooling among the 8,586 students in Shawnee are college / undergraduate (2,757 | 32.1%), elementary school (1,712 | 19.9%), and middle school (1,531 | 17.8%).
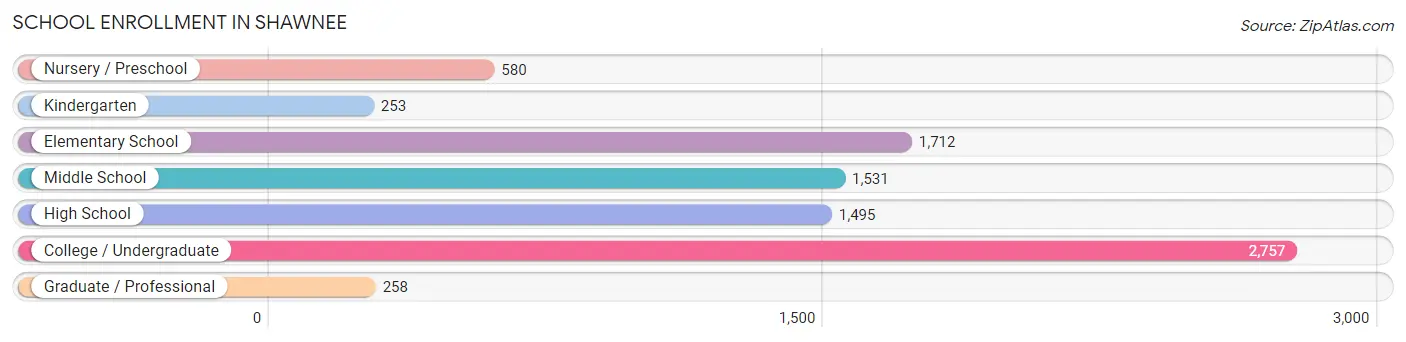
| School Level | # Students | % Students |
| Nursery / Preschool | 580 | 6.8% |
| Kindergarten | 253 | 2.9% |
| Elementary School | 1,712 | 19.9% |
| Middle School | 1,531 | 17.8% |
| High School | 1,495 | 17.4% |
| College / Undergraduate | 2,757 | 32.1% |
| Graduate / Professional | 258 | 3.0% |
| Total | 8,586 | 100.0% |
School Enrollment by Age by Funding Source in Shawnee
Out of a total of 8,586 students who are enrolled in schools in Shawnee, 1,923 (22.4%) attend a private institution, while the remaining 6,663 (77.6%) are enrolled in public schools. The age group of 20 to 24 year olds has the highest likelihood of being enrolled in private schools, with 927 (60.4% in the age bracket) enrolled. Conversely, the age group of 10 to 14 year olds has the lowest likelihood of being enrolled in a private school, with 1,816 (93.5% in the age bracket) attending a public institution.
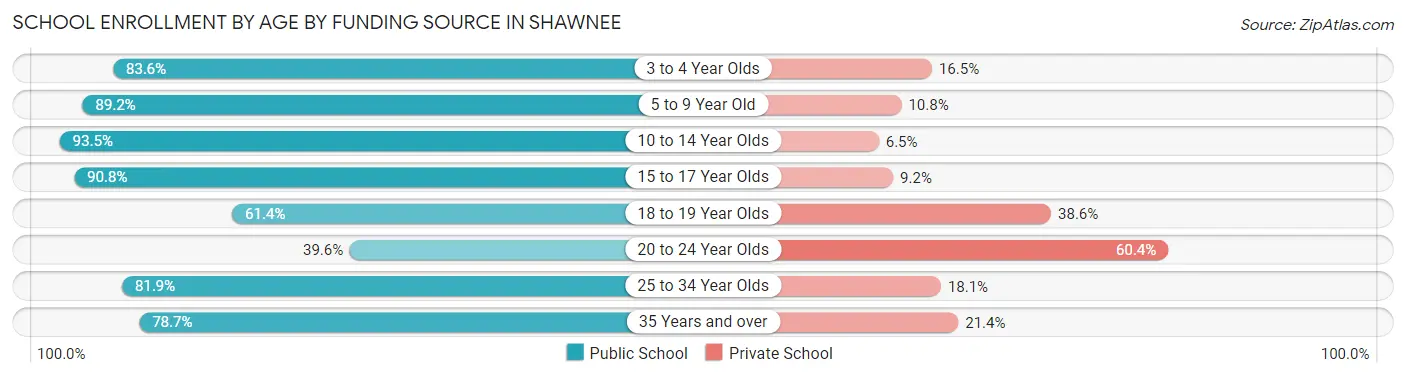
| Age Bracket | Public School | Private School |
| 3 to 4 Year Olds | 315 (83.6%) | 62 (16.5%) |
| 5 to 9 Year Old | 1,690 (89.2%) | 204 (10.8%) |
| 10 to 14 Year Olds | 1,816 (93.5%) | 127 (6.5%) |
| 15 to 17 Year Olds | 965 (90.8%) | 98 (9.2%) |
| 18 to 19 Year Olds | 513 (61.4%) | 323 (38.6%) |
| 20 to 24 Year Olds | 607 (39.6%) | 927 (60.4%) |
| 25 to 34 Year Olds | 393 (81.9%) | 87 (18.1%) |
| 35 Years and over | 361 (78.6%) | 98 (21.3%) |
| Total | 6,663 (77.6%) | 1,923 (22.4%) |
Educational Attainment by Field of Study in Shawnee
Business (1,376 | 25.1%), education (1,167 | 21.2%), science & technology (549 | 10.0%), liberal arts & history (440 | 8.0%), and arts & humanities (354 | 6.5%) are the most common fields of study among 5,492 individuals in Shawnee who have obtained a bachelor's degree or higher.
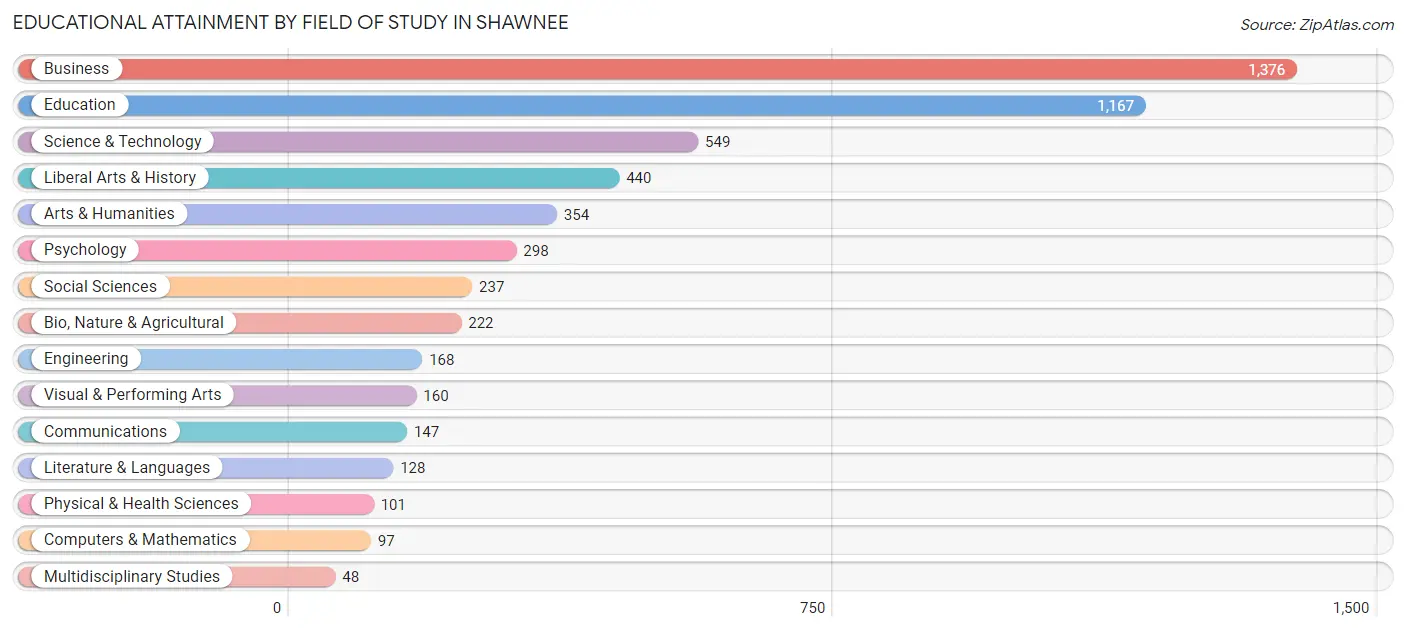
| Field of Study | # Graduates | % Graduates |
| Computers & Mathematics | 97 | 1.8% |
| Bio, Nature & Agricultural | 222 | 4.0% |
| Physical & Health Sciences | 101 | 1.8% |
| Psychology | 298 | 5.4% |
| Social Sciences | 237 | 4.3% |
| Engineering | 168 | 3.1% |
| Multidisciplinary Studies | 48 | 0.9% |
| Science & Technology | 549 | 10.0% |
| Business | 1,376 | 25.1% |
| Education | 1,167 | 21.2% |
| Literature & Languages | 128 | 2.3% |
| Liberal Arts & History | 440 | 8.0% |
| Visual & Performing Arts | 160 | 2.9% |
| Communications | 147 | 2.7% |
| Arts & Humanities | 354 | 6.5% |
| Total | 5,492 | 100.0% |
Transportation & Commute in Shawnee
Vehicle Availability by Sex in Shawnee
The most prevalent vehicle ownership categories in Shawnee are males with 2 vehicles (2,870, accounting for 44.2%) and females with 2 vehicles (2,399, making up 48.0%).
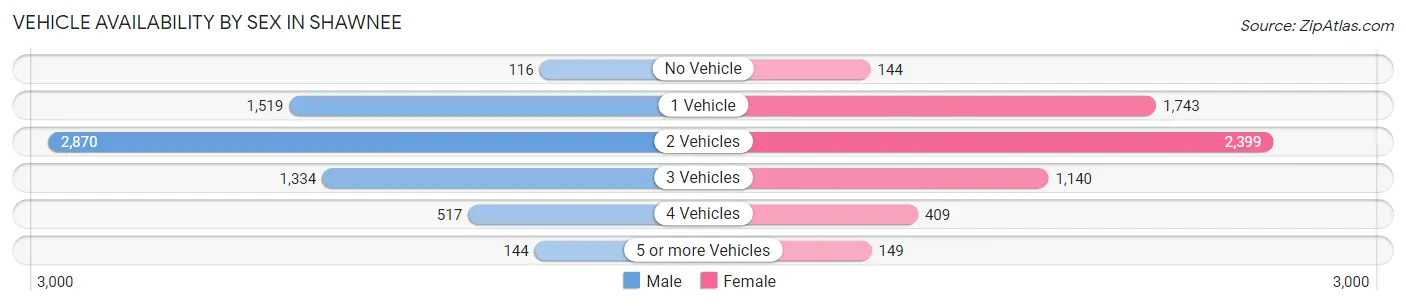
| Vehicles Available | Male | Female |
| No Vehicle | 116 (1.8%) | 144 (2.4%) |
| 1 Vehicle | 1,519 (23.4%) | 1,743 (29.1%) |
| 2 Vehicles | 2,870 (44.2%) | 2,399 (40.1%) |
| 3 Vehicles | 1,334 (20.5%) | 1,140 (19.1%) |
| 4 Vehicles | 517 (8.0%) | 409 (6.8%) |
| 5 or more Vehicles | 144 (2.2%) | 149 (2.5%) |
| Total | 6,500 (100.0%) | 5,984 (100.0%) |
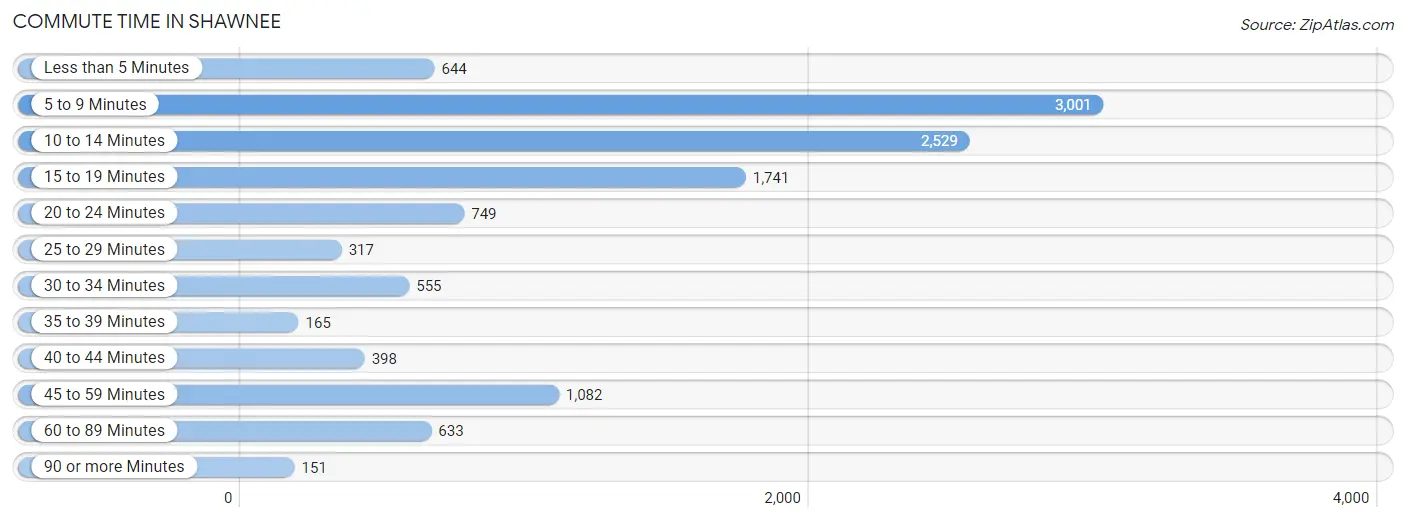
Commute Time in Shawnee
The most frequently occuring commute durations in Shawnee are 5 to 9 minutes (3,001 commuters, 25.1%), 10 to 14 minutes (2,529 commuters, 21.1%), and 15 to 19 minutes (1,741 commuters, 14.5%).
| Commute Time | # Commuters | % Commuters |
| Less than 5 Minutes | 644 | 5.4% |
| 5 to 9 Minutes | 3,001 | 25.1% |
| 10 to 14 Minutes | 2,529 | 21.1% |
| 15 to 19 Minutes | 1,741 | 14.5% |
| 20 to 24 Minutes | 749 | 6.3% |
| 25 to 29 Minutes | 317 | 2.6% |
| 30 to 34 Minutes | 555 | 4.6% |
| 35 to 39 Minutes | 165 | 1.4% |
| 40 to 44 Minutes | 398 | 3.3% |
| 45 to 59 Minutes | 1,082 | 9.0% |
| 60 to 89 Minutes | 633 | 5.3% |
| 90 or more Minutes | 151 | 1.3% |
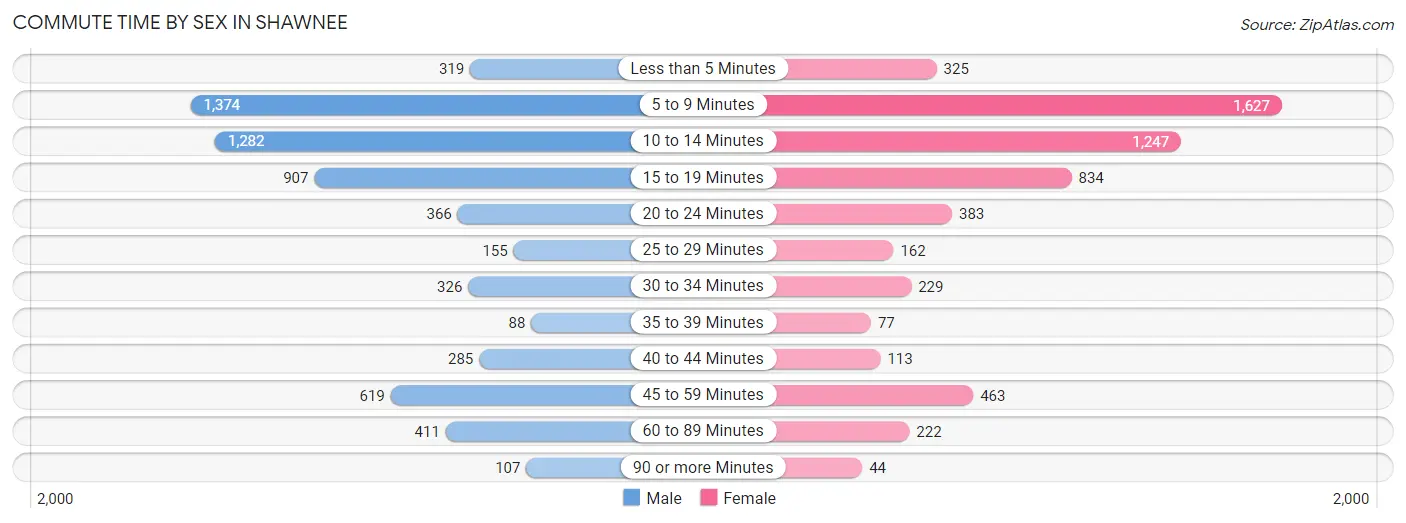
Commute Time by Sex in Shawnee
The most common commute times in Shawnee are 5 to 9 minutes (1,374 commuters, 22.0%) for males and 5 to 9 minutes (1,627 commuters, 28.4%) for females.
| Commute Time | Male | Female |
| Less than 5 Minutes | 319 (5.1%) | 325 (5.7%) |
| 5 to 9 Minutes | 1,374 (22.0%) | 1,627 (28.4%) |
| 10 to 14 Minutes | 1,282 (20.5%) | 1,247 (21.8%) |
| 15 to 19 Minutes | 907 (14.5%) | 834 (14.6%) |
| 20 to 24 Minutes | 366 (5.9%) | 383 (6.7%) |
| 25 to 29 Minutes | 155 (2.5%) | 162 (2.8%) |
| 30 to 34 Minutes | 326 (5.2%) | 229 (4.0%) |
| 35 to 39 Minutes | 88 (1.4%) | 77 (1.3%) |
| 40 to 44 Minutes | 285 (4.6%) | 113 (2.0%) |
| 45 to 59 Minutes | 619 (9.9%) | 463 (8.1%) |
| 60 to 89 Minutes | 411 (6.6%) | 222 (3.9%) |
| 90 or more Minutes | 107 (1.7%) | 44 (0.8%) |
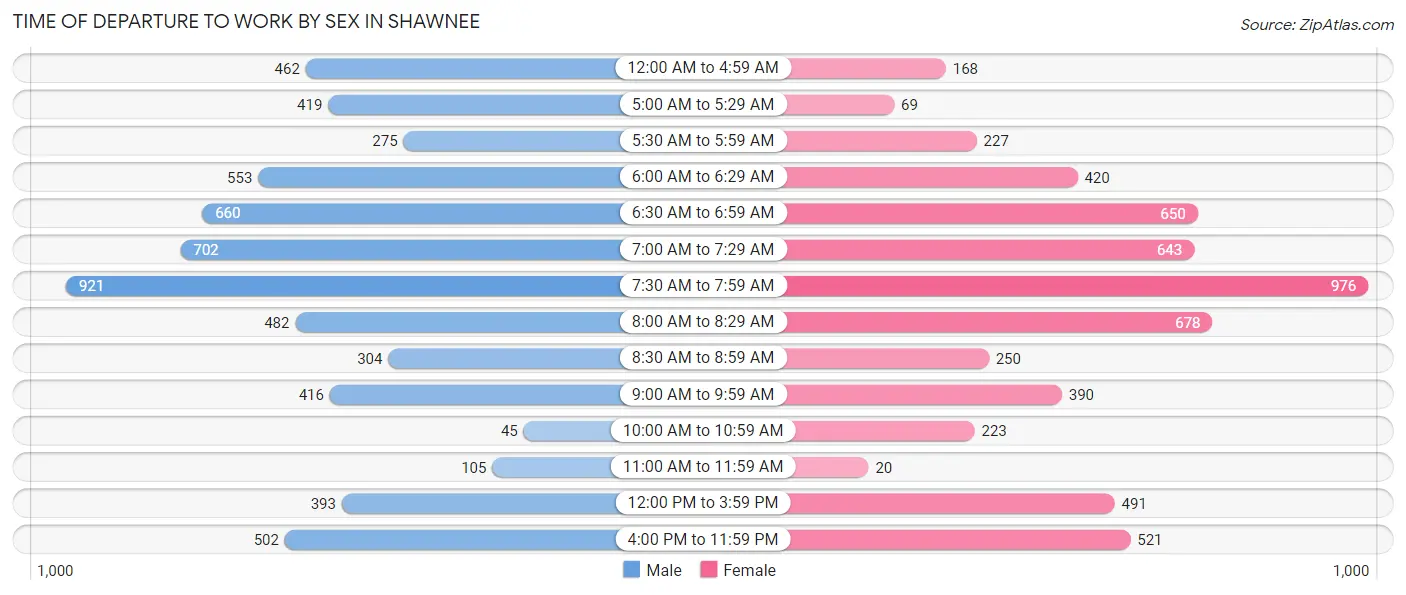
Time of Departure to Work by Sex in Shawnee
The most frequent times of departure to work in Shawnee are 7:30 AM to 7:59 AM (921, 14.8%) for males and 7:30 AM to 7:59 AM (976, 17.1%) for females.
| Time of Departure | Male | Female |
| 12:00 AM to 4:59 AM | 462 (7.4%) | 168 (2.9%) |
| 5:00 AM to 5:29 AM | 419 (6.7%) | 69 (1.2%) |
| 5:30 AM to 5:59 AM | 275 (4.4%) | 227 (4.0%) |
| 6:00 AM to 6:29 AM | 553 (8.9%) | 420 (7.3%) |
| 6:30 AM to 6:59 AM | 660 (10.6%) | 650 (11.4%) |
| 7:00 AM to 7:29 AM | 702 (11.3%) | 643 (11.2%) |
| 7:30 AM to 7:59 AM | 921 (14.8%) | 976 (17.1%) |
| 8:00 AM to 8:29 AM | 482 (7.7%) | 678 (11.8%) |
| 8:30 AM to 8:59 AM | 304 (4.9%) | 250 (4.4%) |
| 9:00 AM to 9:59 AM | 416 (6.7%) | 390 (6.8%) |
| 10:00 AM to 10:59 AM | 45 (0.7%) | 223 (3.9%) |
| 11:00 AM to 11:59 AM | 105 (1.7%) | 20 (0.4%) |
| 12:00 PM to 3:59 PM | 393 (6.3%) | 491 (8.6%) |
| 4:00 PM to 11:59 PM | 502 (8.1%) | 521 (9.1%) |
| Total | 6,239 (100.0%) | 5,726 (100.0%) |
Housing Occupancy in Shawnee
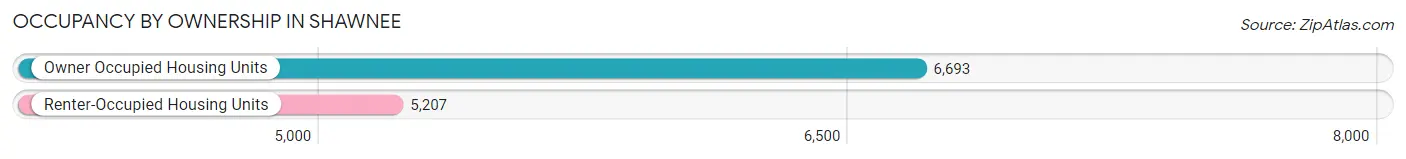
Occupancy by Ownership in Shawnee
Of the total 11,900 dwellings in Shawnee, owner-occupied units account for 6,693 (56.2%), while renter-occupied units make up 5,207 (43.8%).
| Occupancy | # Housing Units | % Housing Units |
| Owner Occupied Housing Units | 6,693 | 56.2% |
| Renter-Occupied Housing Units | 5,207 | 43.8% |
| Total Occupied Housing Units | 11,900 | 100.0% |
Occupancy by Household Size in Shawnee
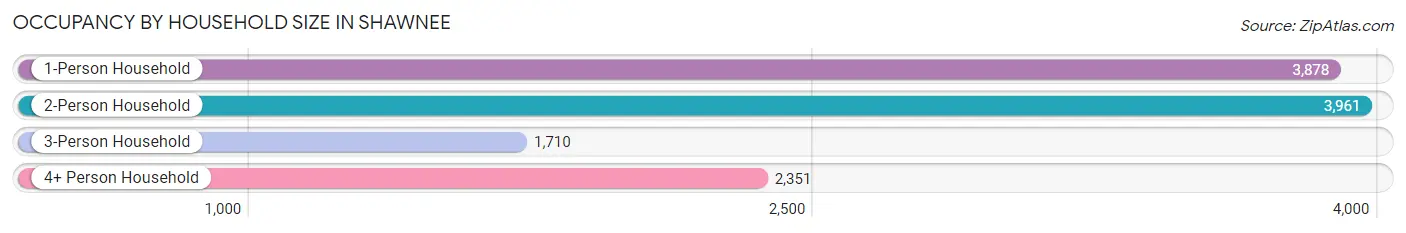
| Household Size | # Housing Units | % Housing Units |
| 1-Person Household | 3,878 | 32.6% |
| 2-Person Household | 3,961 | 33.3% |
| 3-Person Household | 1,710 | 14.4% |
| 4+ Person Household | 2,351 | 19.8% |
| Total Housing Units | 11,900 | 100.0% |
Occupancy by Ownership by Household Size in Shawnee
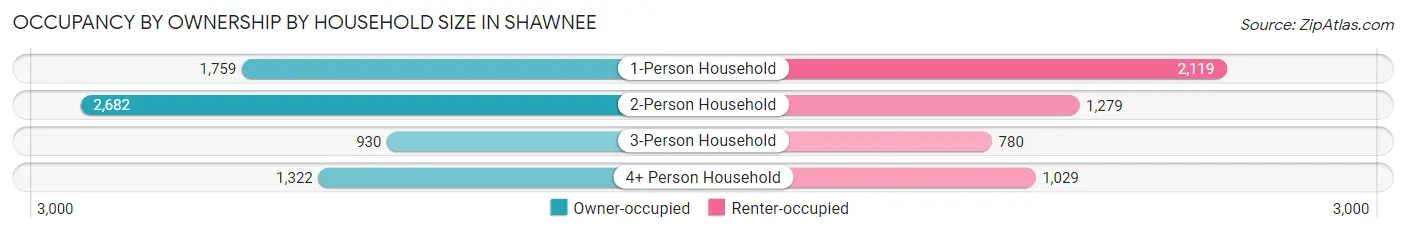
| Household Size | Owner-occupied | Renter-occupied |
| 1-Person Household | 1,759 (45.4%) | 2,119 (54.6%) |
| 2-Person Household | 2,682 (67.7%) | 1,279 (32.3%) |
| 3-Person Household | 930 (54.4%) | 780 (45.6%) |
| 4+ Person Household | 1,322 (56.2%) | 1,029 (43.8%) |
| Total Housing Units | 6,693 (56.2%) | 5,207 (43.8%) |
Occupancy by Educational Attainment in Shawnee
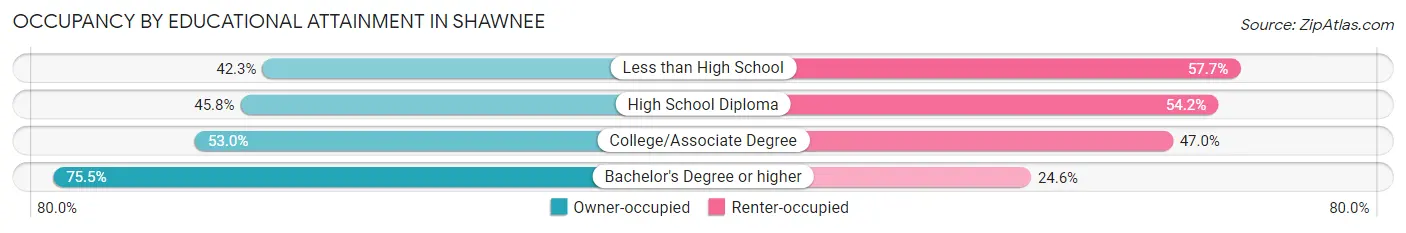
| Household Size | Owner-occupied | Renter-occupied |
| Less than High School | 478 (42.3%) | 652 (57.7%) |
| High School Diploma | 1,605 (45.8%) | 1,900 (54.2%) |
| College/Associate Degree | 2,053 (53.0%) | 1,823 (47.0%) |
| Bachelor's Degree or higher | 2,557 (75.4%) | 832 (24.5%) |
Occupancy by Age of Householder in Shawnee
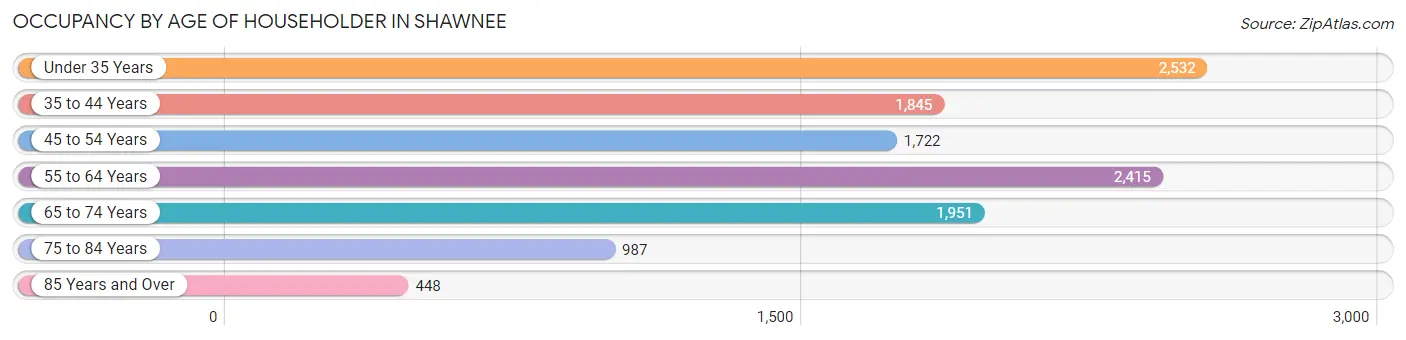
| Age Bracket | # Households | % Households |
| Under 35 Years | 2,532 | 21.3% |
| 35 to 44 Years | 1,845 | 15.5% |
| 45 to 54 Years | 1,722 | 14.5% |
| 55 to 64 Years | 2,415 | 20.3% |
| 65 to 74 Years | 1,951 | 16.4% |
| 75 to 84 Years | 987 | 8.3% |
| 85 Years and Over | 448 | 3.8% |
| Total | 11,900 | 100.0% |
Housing Finances in Shawnee
Median Income by Occupancy in Shawnee
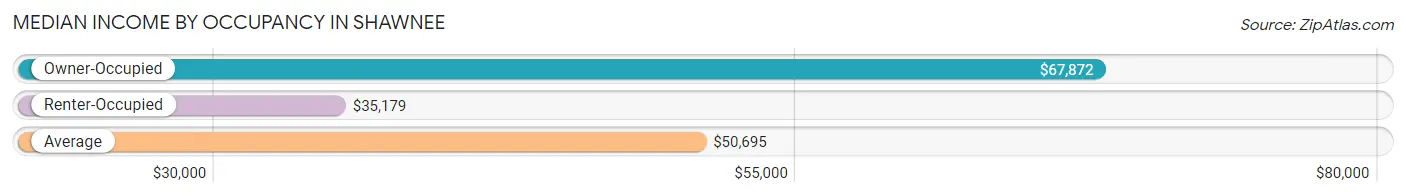
| Occupancy Type | # Households | Median Income |
| Owner-Occupied | 6,693 (56.2%) | $67,872 |
| Renter-Occupied | 5,207 (43.8%) | $35,179 |
| Average | 11,900 (100.0%) | $50,695 |
Occupancy by Householder Income Bracket in Shawnee
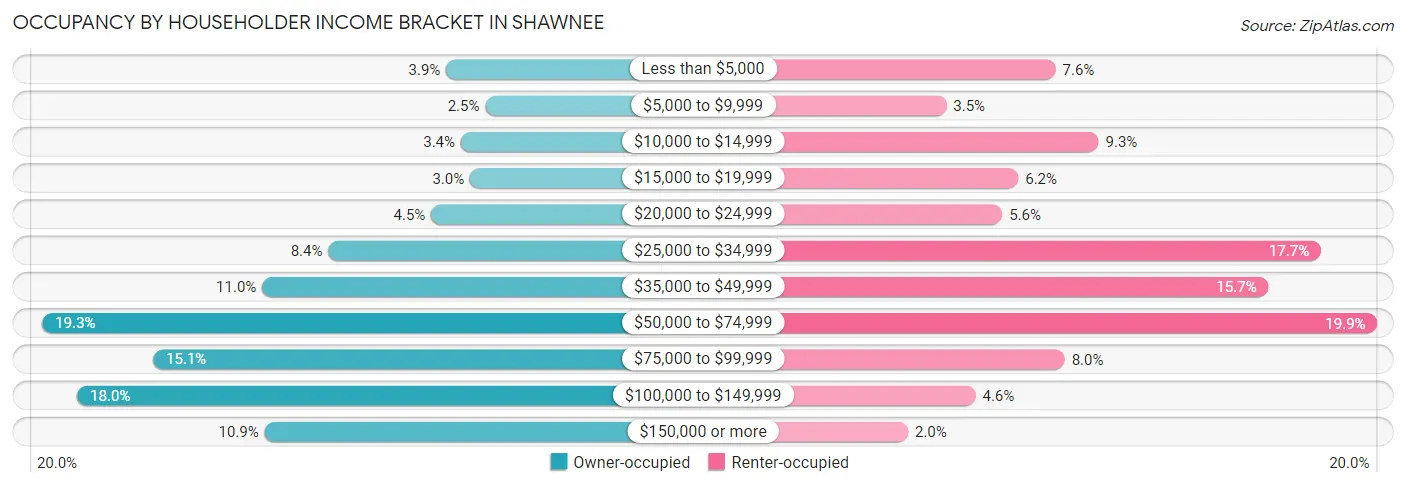
| Income Bracket | Owner-occupied | Renter-occupied |
| Less than $5,000 | 264 (3.9%) | 397 (7.6%) |
| $5,000 to $9,999 | 164 (2.5%) | 180 (3.5%) |
| $10,000 to $14,999 | 226 (3.4%) | 482 (9.3%) |
| $15,000 to $19,999 | 203 (3.0%) | 323 (6.2%) |
| $20,000 to $24,999 | 302 (4.5%) | 291 (5.6%) |
| $25,000 to $34,999 | 564 (8.4%) | 923 (17.7%) |
| $35,000 to $49,999 | 733 (11.0%) | 819 (15.7%) |
| $50,000 to $74,999 | 1,294 (19.3%) | 1,035 (19.9%) |
| $75,000 to $99,999 | 1,011 (15.1%) | 415 (8.0%) |
| $100,000 to $149,999 | 1,205 (18.0%) | 238 (4.6%) |
| $150,000 or more | 727 (10.9%) | 104 (2.0%) |
| Total | 6,693 (100.0%) | 5,207 (100.0%) |
Monthly Housing Cost Tiers in Shawnee
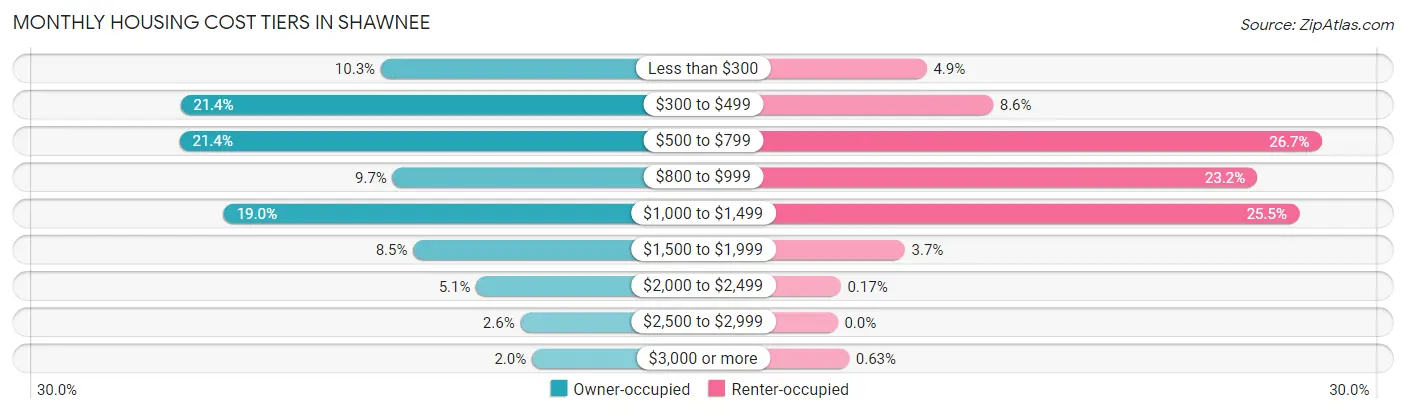
| Monthly Cost | Owner-occupied | Renter-occupied |
| Less than $300 | 691 (10.3%) | 256 (4.9%) |
| $300 to $499 | 1,432 (21.4%) | 447 (8.6%) |
| $500 to $799 | 1,435 (21.4%) | 1,392 (26.7%) |
| $800 to $999 | 647 (9.7%) | 1,207 (23.2%) |
| $1,000 to $1,499 | 1,272 (19.0%) | 1,327 (25.5%) |
| $1,500 to $1,999 | 571 (8.5%) | 193 (3.7%) |
| $2,000 to $2,499 | 338 (5.1%) | 9 (0.2%) |
| $2,500 to $2,999 | 175 (2.6%) | 0 (0.0%) |
| $3,000 or more | 132 (2.0%) | 33 (0.6%) |
| Total | 6,693 (100.0%) | 5,207 (100.0%) |
Physical Housing Characteristics in Shawnee
Housing Structures in Shawnee
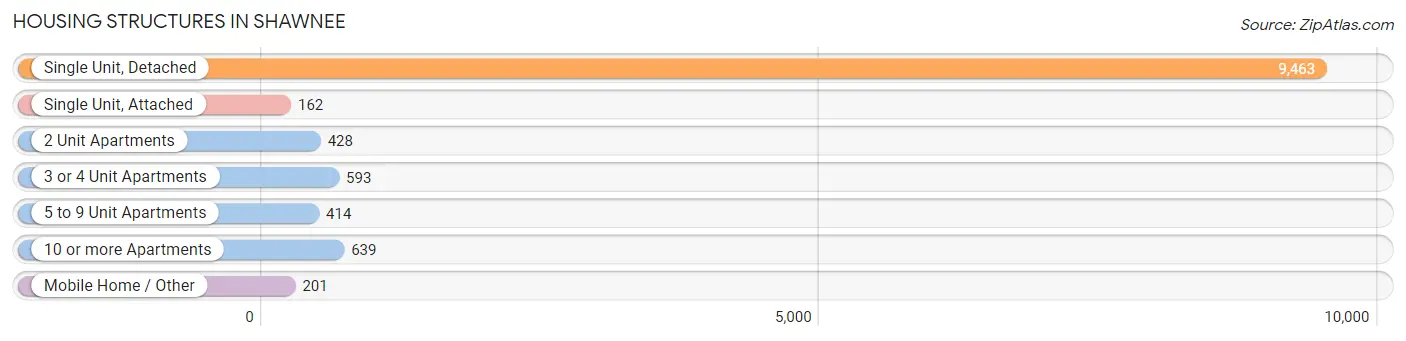
| Structure Type | # Housing Units | % Housing Units |
| Single Unit, Detached | 9,463 | 79.5% |
| Single Unit, Attached | 162 | 1.4% |
| 2 Unit Apartments | 428 | 3.6% |
| 3 or 4 Unit Apartments | 593 | 5.0% |
| 5 to 9 Unit Apartments | 414 | 3.5% |
| 10 or more Apartments | 639 | 5.4% |
| Mobile Home / Other | 201 | 1.7% |
| Total | 11,900 | 100.0% |
Housing Structures by Occupancy in Shawnee
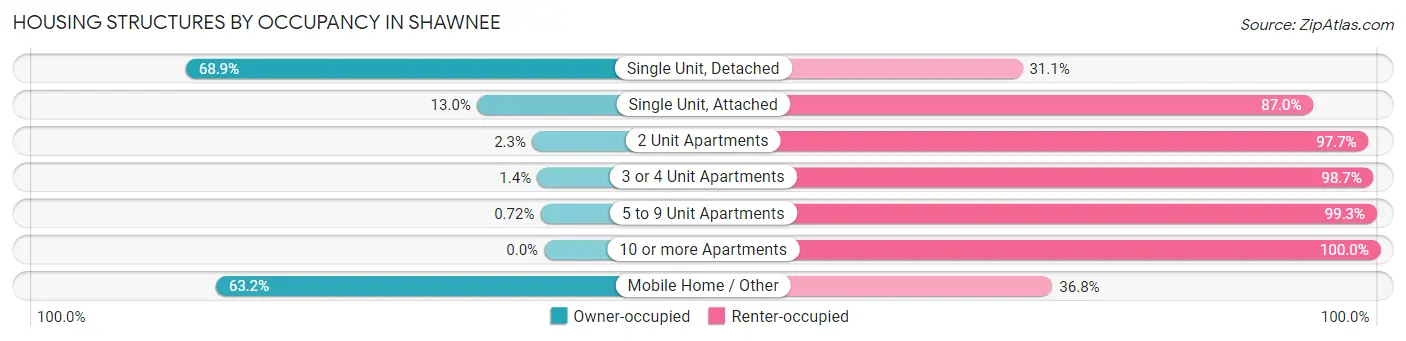
| Structure Type | Owner-occupied | Renter-occupied |
| Single Unit, Detached | 6,524 (68.9%) | 2,939 (31.1%) |
| Single Unit, Attached | 21 (13.0%) | 141 (87.0%) |
| 2 Unit Apartments | 10 (2.3%) | 418 (97.7%) |
| 3 or 4 Unit Apartments | 8 (1.3%) | 585 (98.7%) |
| 5 to 9 Unit Apartments | 3 (0.7%) | 411 (99.3%) |
| 10 or more Apartments | 0 (0.0%) | 639 (100.0%) |
| Mobile Home / Other | 127 (63.2%) | 74 (36.8%) |
| Total | 6,693 (56.2%) | 5,207 (43.8%) |
Housing Structures by Number of Rooms in Shawnee
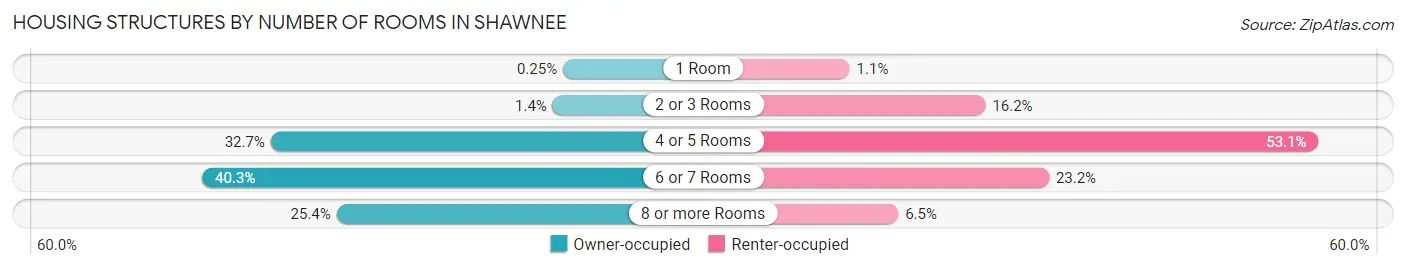
| Number of Rooms | Owner-occupied | Renter-occupied |
| 1 Room | 17 (0.3%) | 56 (1.1%) |
| 2 or 3 Rooms | 93 (1.4%) | 841 (16.2%) |
| 4 or 5 Rooms | 2,188 (32.7%) | 2,765 (53.1%) |
| 6 or 7 Rooms | 2,697 (40.3%) | 1,208 (23.2%) |
| 8 or more Rooms | 1,698 (25.4%) | 337 (6.5%) |
| Total | 6,693 (100.0%) | 5,207 (100.0%) |
Housing Structure by Heating Type in Shawnee
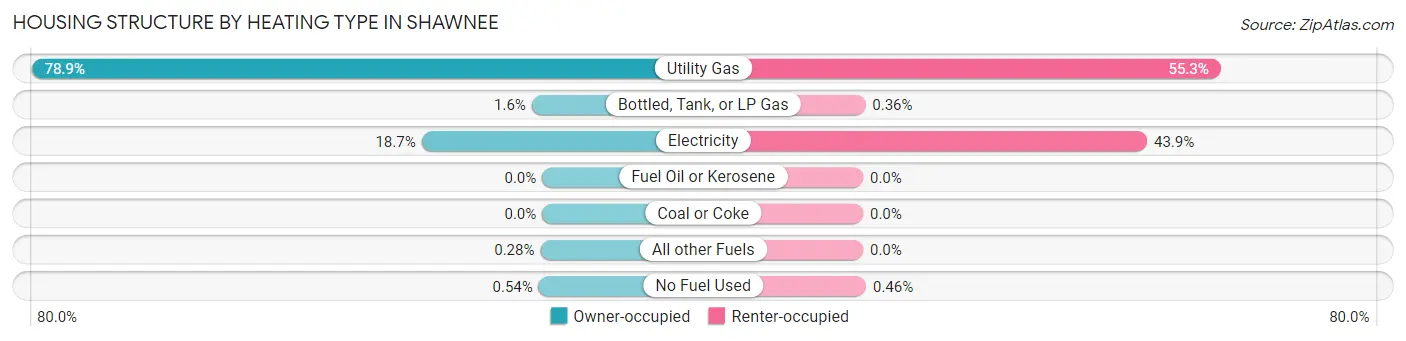
| Heating Type | Owner-occupied | Renter-occupied |
| Utility Gas | 5,282 (78.9%) | 2,878 (55.3%) |
| Bottled, Tank, or LP Gas | 108 (1.6%) | 19 (0.4%) |
| Electricity | 1,248 (18.6%) | 2,286 (43.9%) |
| Fuel Oil or Kerosene | 0 (0.0%) | 0 (0.0%) |
| Coal or Coke | 0 (0.0%) | 0 (0.0%) |
| All other Fuels | 19 (0.3%) | 0 (0.0%) |
| No Fuel Used | 36 (0.5%) | 24 (0.5%) |
| Total | 6,693 (100.0%) | 5,207 (100.0%) |
Household Vehicle Usage in Shawnee
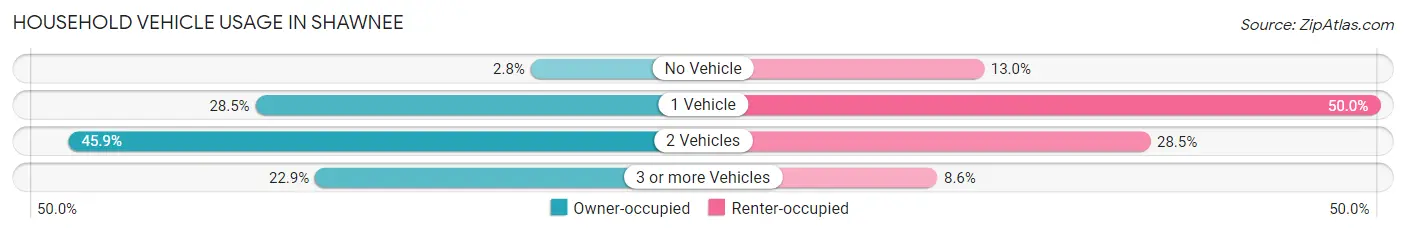
| Vehicles per Household | Owner-occupied | Renter-occupied |
| No Vehicle | 185 (2.8%) | 675 (13.0%) |
| 1 Vehicle | 1,904 (28.4%) | 2,601 (49.9%) |
| 2 Vehicles | 3,072 (45.9%) | 1,483 (28.5%) |
| 3 or more Vehicles | 1,532 (22.9%) | 448 (8.6%) |
| Total | 6,693 (100.0%) | 5,207 (100.0%) |
Real Estate & Mortgages in Shawnee
Real Estate and Mortgage Overview in Shawnee
| Characteristic | Without Mortgage | With Mortgage |
| Housing Units | 3,235 | 3,458 |
| Median Property Value | $125,300 | $158,900 |
| Median Household Income | $52,340 | $493 |
| Monthly Housing Costs | $429 | $132 |
| Real Estate Taxes | $874 | $330 |
Property Value by Mortgage Status in Shawnee
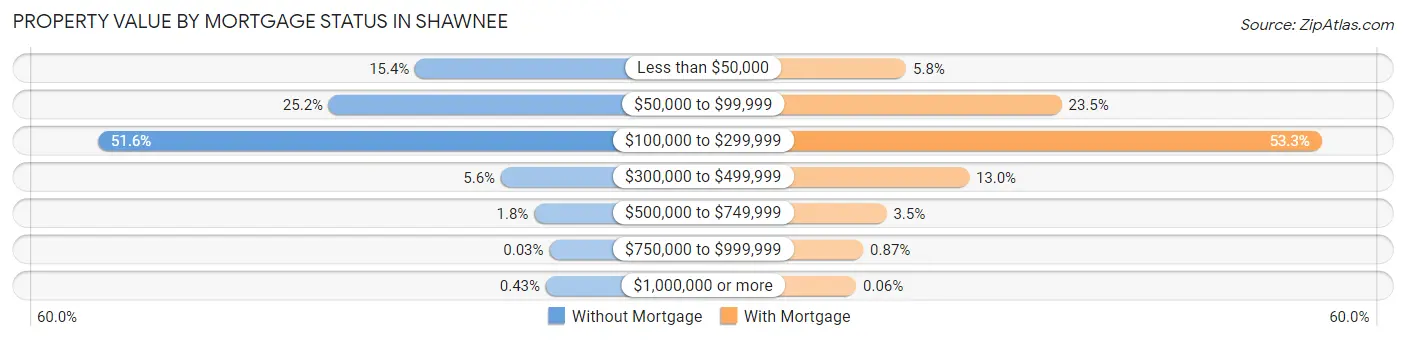
| Property Value | Without Mortgage | With Mortgage |
| Less than $50,000 | 497 (15.4%) | 200 (5.8%) |
| $50,000 to $99,999 | 816 (25.2%) | 814 (23.5%) |
| $100,000 to $299,999 | 1,670 (51.6%) | 1,842 (53.3%) |
| $300,000 to $499,999 | 180 (5.6%) | 448 (13.0%) |
| $500,000 to $749,999 | 57 (1.8%) | 122 (3.5%) |
| $750,000 to $999,999 | 1 (0.0%) | 30 (0.9%) |
| $1,000,000 or more | 14 (0.4%) | 2 (0.1%) |
| Total | 3,235 (100.0%) | 3,458 (100.0%) |
Household Income by Mortgage Status in Shawnee
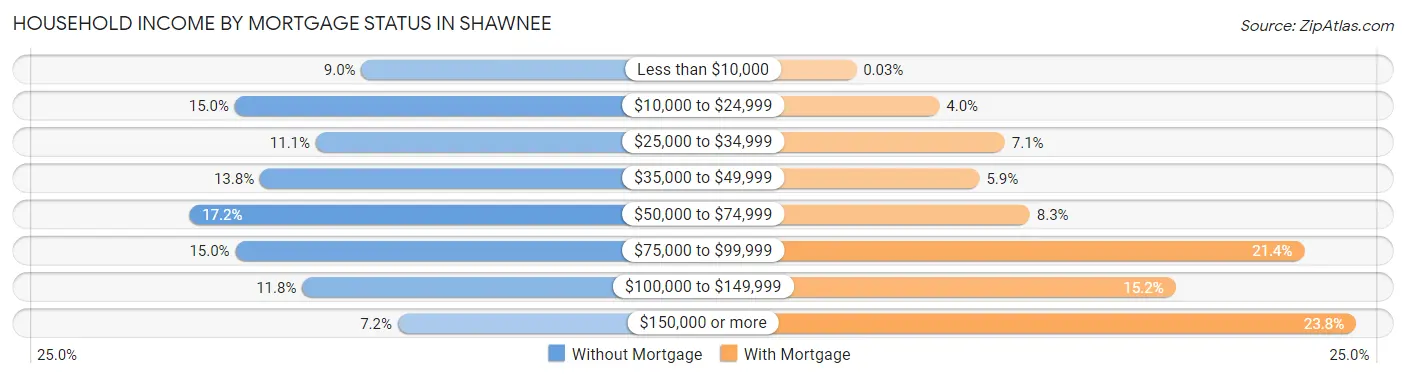
| Household Income | Without Mortgage | With Mortgage |
| Less than $10,000 | 290 (9.0%) | 1 (0.0%) |
| $10,000 to $24,999 | 485 (15.0%) | 138 (4.0%) |
| $25,000 to $34,999 | 360 (11.1%) | 246 (7.1%) |
| $35,000 to $49,999 | 446 (13.8%) | 204 (5.9%) |
| $50,000 to $74,999 | 555 (17.2%) | 287 (8.3%) |
| $75,000 to $99,999 | 484 (15.0%) | 739 (21.4%) |
| $100,000 to $149,999 | 381 (11.8%) | 527 (15.2%) |
| $150,000 or more | 234 (7.2%) | 824 (23.8%) |
| Total | 3,235 (100.0%) | 3,458 (100.0%) |
Property Value to Household Income Ratio in Shawnee
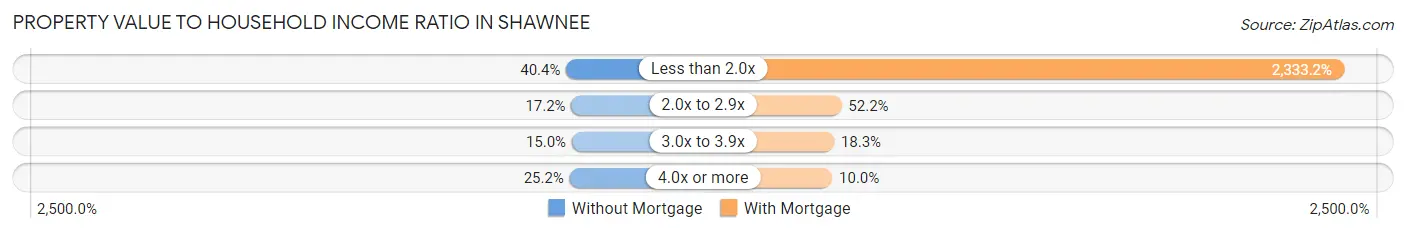
| Value-to-Income Ratio | Without Mortgage | With Mortgage |
| Less than 2.0x | 1,307 (40.4%) | 80,682 (2,333.2%) |
| 2.0x to 2.9x | 555 (17.2%) | 1,805 (52.2%) |
| 3.0x to 3.9x | 484 (15.0%) | 633 (18.3%) |
| 4.0x or more | 814 (25.2%) | 346 (10.0%) |
| Total | 3,235 (100.0%) | 3,458 (100.0%) |
Real Estate Taxes by Mortgage Status in Shawnee
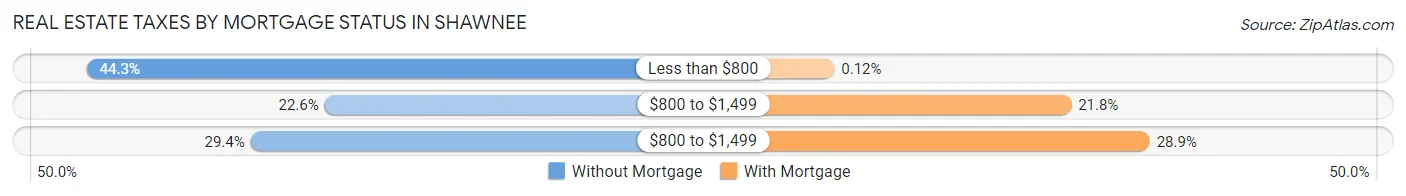
| Property Taxes | Without Mortgage | With Mortgage |
| Less than $800 | 1,434 (44.3%) | 4 (0.1%) |
| $800 to $1,499 | 731 (22.6%) | 752 (21.7%) |
| $800 to $1,499 | 950 (29.4%) | 1,000 (28.9%) |
| Total | 3,235 (100.0%) | 3,458 (100.0%) |
Health & Disability in Shawnee
Health Insurance Coverage by Age in Shawnee
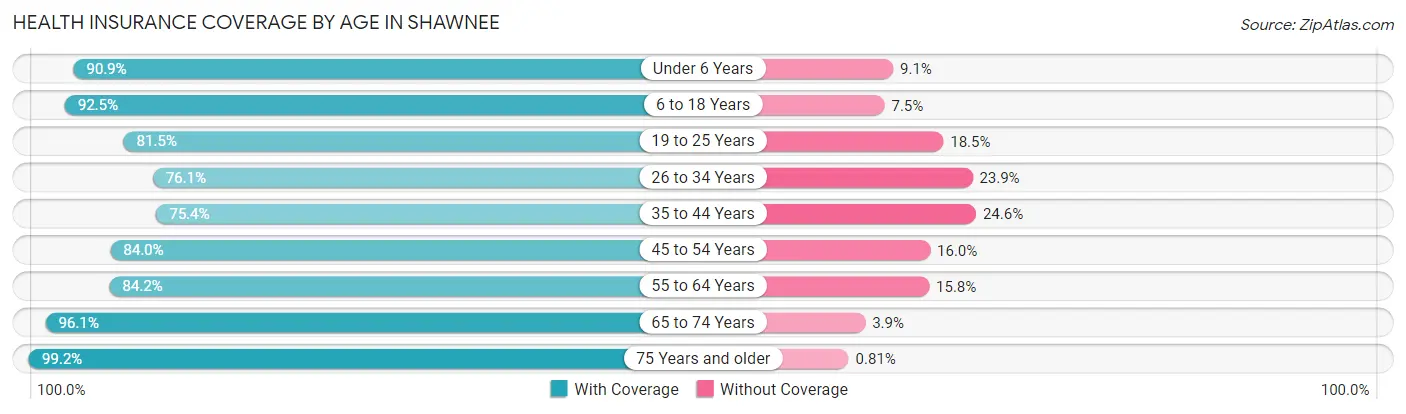
| Age Bracket | With Coverage | Without Coverage |
| Under 6 Years | 2,277 (90.9%) | 228 (9.1%) |
| 6 to 18 Years | 4,782 (92.5%) | 388 (7.5%) |
| 19 to 25 Years | 3,436 (81.5%) | 778 (18.5%) |
| 26 to 34 Years | 2,795 (76.1%) | 878 (23.9%) |
| 35 to 44 Years | 2,457 (75.4%) | 800 (24.6%) |
| 45 to 54 Years | 2,735 (84.0%) | 521 (16.0%) |
| 55 to 64 Years | 3,257 (84.2%) | 612 (15.8%) |
| 65 to 74 Years | 2,714 (96.1%) | 110 (3.9%) |
| 75 Years and older | 2,090 (99.2%) | 17 (0.8%) |
| Total | 26,543 (86.0%) | 4,332 (14.0%) |
Health Insurance Coverage by Citizenship Status in Shawnee
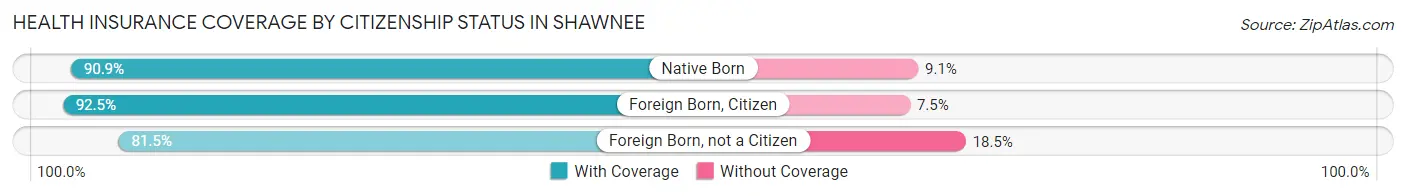
| Citizenship Status | With Coverage | Without Coverage |
| Native Born | 2,277 (90.9%) | 228 (9.1%) |
| Foreign Born, Citizen | 4,782 (92.5%) | 388 (7.5%) |
| Foreign Born, not a Citizen | 3,436 (81.5%) | 778 (18.5%) |
Health Insurance Coverage by Household Income in Shawnee
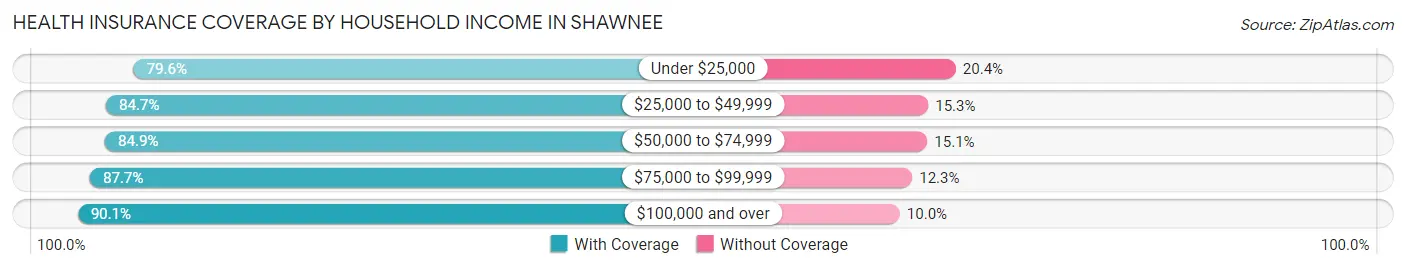
| Household Income | With Coverage | Without Coverage |
| Under $25,000 | 4,407 (79.6%) | 1,132 (20.4%) |
| $25,000 to $49,999 | 5,499 (84.7%) | 991 (15.3%) |
| $50,000 to $74,999 | 5,048 (84.9%) | 898 (15.1%) |
| $75,000 to $99,999 | 3,411 (87.7%) | 477 (12.3%) |
| $100,000 and over | 6,888 (90.0%) | 761 (10.0%) |
Public vs Private Health Insurance Coverage by Age in Shawnee
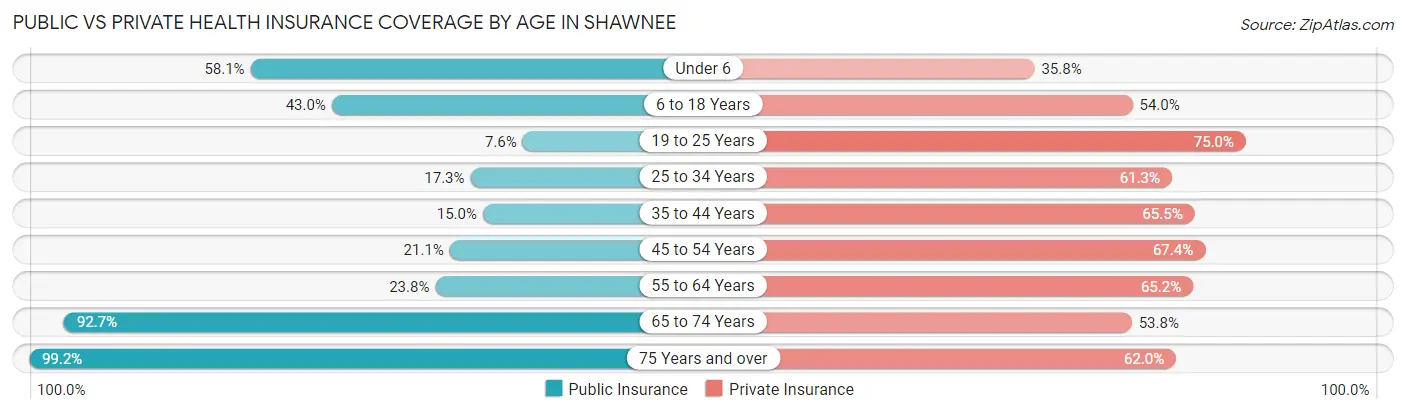
| Age Bracket | Public Insurance | Private Insurance |
| Under 6 | 1,455 (58.1%) | 896 (35.8%) |
| 6 to 18 Years | 2,223 (43.0%) | 2,790 (54.0%) |
| 19 to 25 Years | 319 (7.6%) | 3,160 (75.0%) |
| 25 to 34 Years | 634 (17.3%) | 2,250 (61.3%) |
| 35 to 44 Years | 487 (14.9%) | 2,132 (65.5%) |
| 45 to 54 Years | 687 (21.1%) | 2,195 (67.4%) |
| 55 to 64 Years | 920 (23.8%) | 2,522 (65.2%) |
| 65 to 74 Years | 2,618 (92.7%) | 1,520 (53.8%) |
| 75 Years and over | 2,090 (99.2%) | 1,307 (62.0%) |
| Total | 11,433 (37.0%) | 18,772 (60.8%) |
Disability Status by Sex by Age in Shawnee
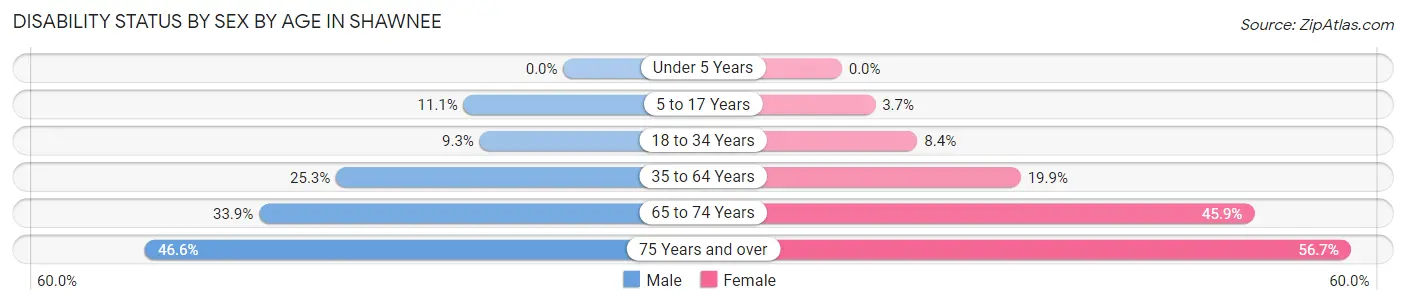
| Age Bracket | Male | Female |
| Under 5 Years | 0 (0.0%) | 0 (0.0%) |
| 5 to 17 Years | 282 (11.1%) | 94 (3.7%) |
| 18 to 34 Years | 364 (9.3%) | 372 (8.4%) |
| 35 to 64 Years | 1,261 (25.3%) | 1,076 (19.9%) |
| 65 to 74 Years | 467 (33.9%) | 664 (45.9%) |
| 75 Years and over | 373 (46.6%) | 740 (56.7%) |
Disability Class by Sex by Age in Shawnee
Disability Class: Hearing Difficulty
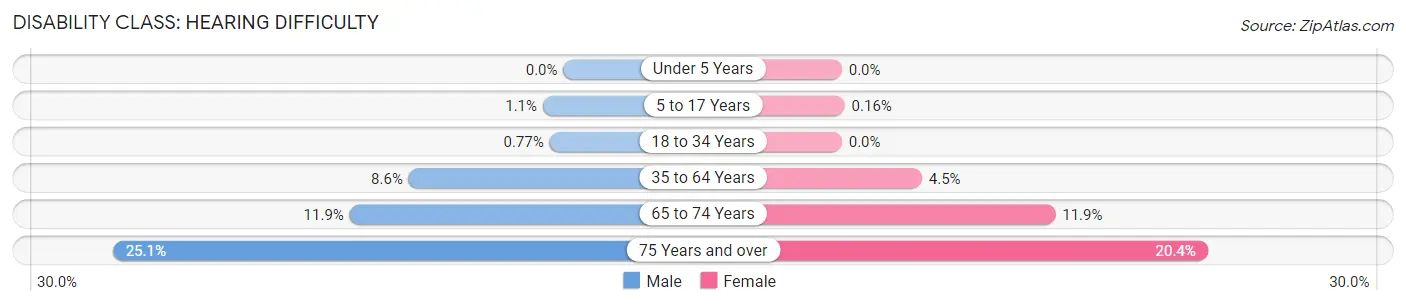
| Age Bracket | Male | Female |
| Under 5 Years | 0 (0.0%) | 0 (0.0%) |
| 5 to 17 Years | 29 (1.1%) | 4 (0.2%) |
| 18 to 34 Years | 30 (0.8%) | 0 (0.0%) |
| 35 to 64 Years | 429 (8.6%) | 241 (4.5%) |
| 65 to 74 Years | 164 (11.9%) | 172 (11.9%) |
| 75 Years and over | 201 (25.1%) | 266 (20.4%) |
Disability Class: Vision Difficulty
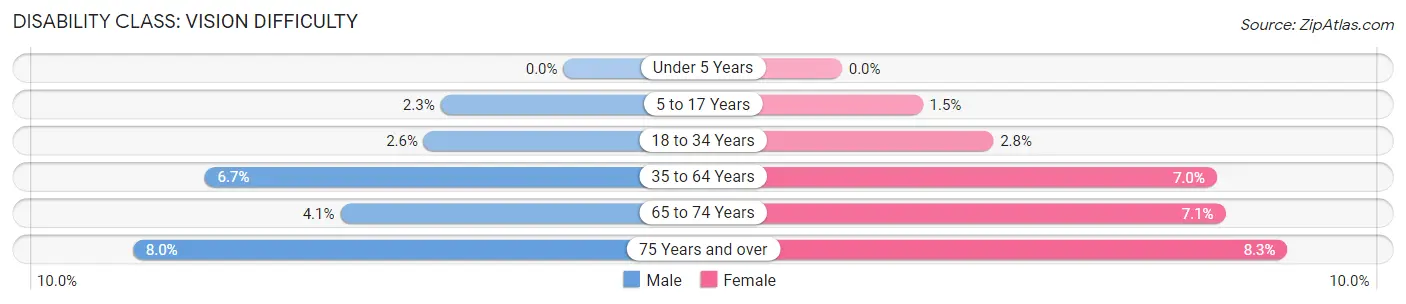
| Age Bracket | Male | Female |
| Under 5 Years | 0 (0.0%) | 0 (0.0%) |
| 5 to 17 Years | 58 (2.3%) | 38 (1.5%) |
| 18 to 34 Years | 101 (2.6%) | 124 (2.8%) |
| 35 to 64 Years | 332 (6.7%) | 376 (7.0%) |
| 65 to 74 Years | 57 (4.1%) | 103 (7.1%) |
| 75 Years and over | 64 (8.0%) | 108 (8.3%) |
Disability Class: Cognitive Difficulty
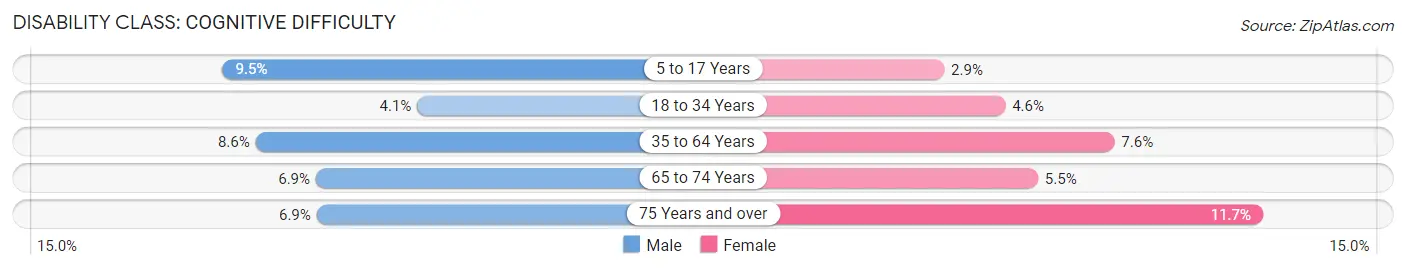
| Age Bracket | Male | Female |
| 5 to 17 Years | 241 (9.5%) | 72 (2.9%) |
| 18 to 34 Years | 159 (4.1%) | 201 (4.5%) |
| 35 to 64 Years | 427 (8.6%) | 410 (7.6%) |
| 65 to 74 Years | 95 (6.9%) | 79 (5.5%) |
| 75 Years and over | 55 (6.9%) | 153 (11.7%) |
Disability Class: Ambulatory Difficulty
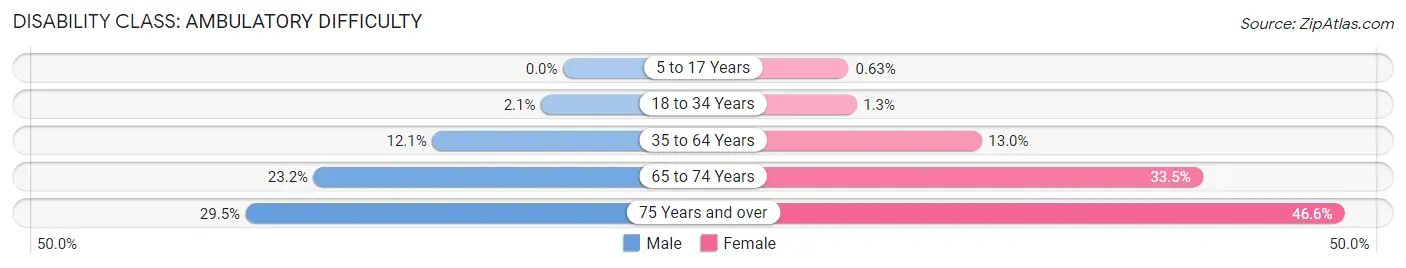
| Age Bracket | Male | Female |
| 5 to 17 Years | 0 (0.0%) | 16 (0.6%) |
| 18 to 34 Years | 80 (2.1%) | 59 (1.3%) |
| 35 to 64 Years | 605 (12.1%) | 699 (13.0%) |
| 65 to 74 Years | 319 (23.2%) | 484 (33.5%) |
| 75 Years and over | 236 (29.5%) | 609 (46.6%) |
Disability Class: Self-Care Difficulty
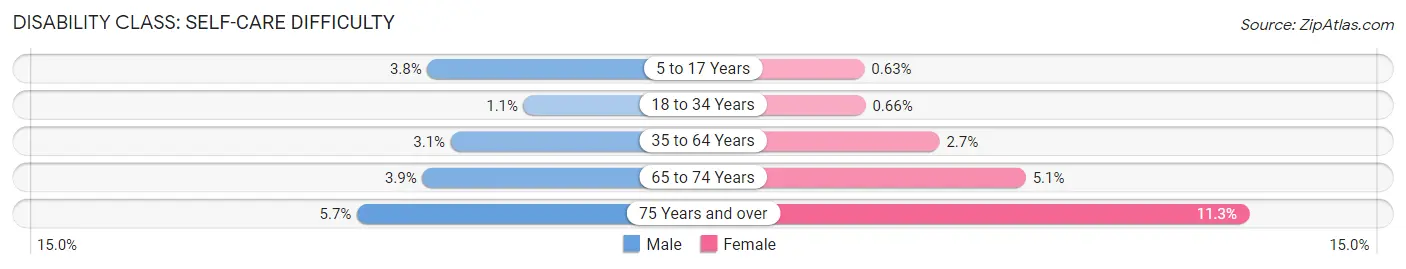
| Age Bracket | Male | Female |
| 5 to 17 Years | 96 (3.8%) | 16 (0.6%) |
| 18 to 34 Years | 43 (1.1%) | 29 (0.7%) |
| 35 to 64 Years | 156 (3.1%) | 147 (2.7%) |
| 65 to 74 Years | 54 (3.9%) | 74 (5.1%) |
| 75 Years and over | 46 (5.7%) | 148 (11.3%) |
Technology Access in Shawnee
Computing Device Access in Shawnee
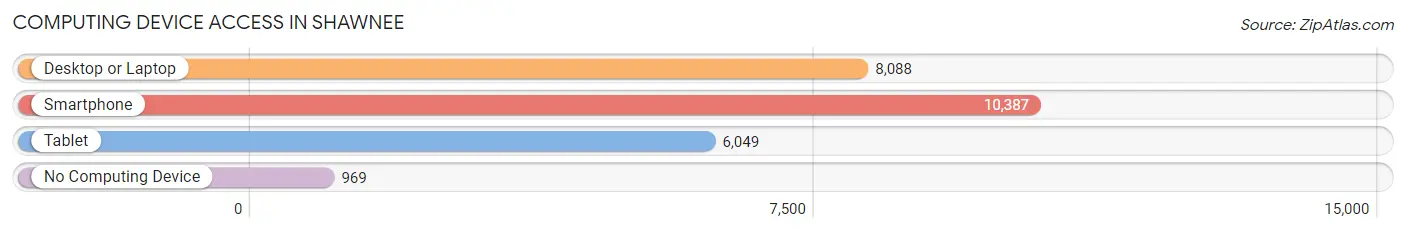
| Device Type | # Households | % Households |
| Desktop or Laptop | 8,088 | 68.0% |
| Smartphone | 10,387 | 87.3% |
| Tablet | 6,049 | 50.8% |
| No Computing Device | 969 | 8.1% |
| Total | 11,900 | 100.0% |
Internet Access in Shawnee
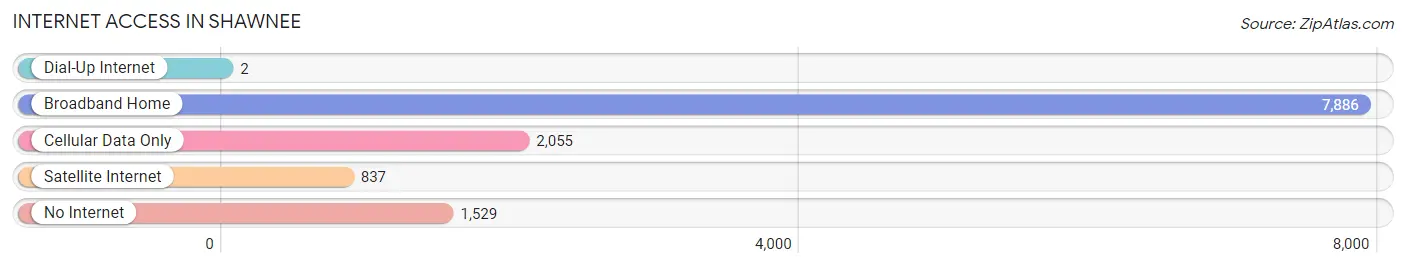
| Internet Type | # Households | % Households |
| Dial-Up Internet | 2 | 0.0% |
| Broadband Home | 7,886 | 66.3% |
| Cellular Data Only | 2,055 | 17.3% |
| Satellite Internet | 837 | 7.0% |
| No Internet | 1,529 | 12.9% |
| Total | 11,900 | 100.0% |
Shawnee Summary
Shawnee, Oklahoma is a city located in Pottawatomie County, Oklahoma. It is the county seat of Pottawatomie County and is located in the central part of the state. The city is situated on the North Canadian River and is approximately 40 miles east of Oklahoma City. As of the 2010 census, the population of Shawnee was 29,857, making it the fourth largest city in the state.
History
The area that is now Shawnee was originally inhabited by the Shawnee Native American tribe. The tribe was forced to move to the area in the early 1800s after being displaced from their original homeland in the Ohio Valley. The tribe was eventually forced to move again in 1832, this time to the Indian Territory.
In 1838, the first white settlers arrived in the area and established a trading post. The town was officially founded in 1872 and was named after the Shawnee tribe. The town quickly grew and by the early 1900s, it had become a major agricultural center.
In the early 20th century, Shawnee became a major oil and gas producer. The city was also home to several major manufacturing plants, including a glass factory and a brick factory.
Geography
Shawnee is located in the central part of Oklahoma, approximately 40 miles east of Oklahoma City. The city is situated on the North Canadian River and is surrounded by rolling hills and wooded areas. The city has a total area of 24.3 square miles, of which 24.2 square miles is land and 0.1 square miles is water.
Economy
Shawnee is a major economic center in the state of Oklahoma. The city is home to several major employers, including the Shawnee Public School District, the Citizen Potawatomi Nation, and the Tinker Air Force Base. The city is also home to several major manufacturing plants, including a glass factory and a brick factory.
The city is also home to several major retail stores, including Walmart, Target, and Lowe’s. The city is also home to several major restaurants, including Applebee’s, Chili’s, and Olive Garden.
Demographics
As of the 2010 census, the population of Shawnee was 29,857. The racial makeup of the city was 73.3% White, 11.2% African American, 8.2% Native American, 1.2% Asian, 0.1% Pacific Islander, and 5.9% from other races. Hispanic or Latino of any race were 8.7% of the population.
The median income for a household in the city was $37,945, and the median income for a family was $45,945. The per capita income for the city was $19,945. About 16.2% of families and 19.3% of the population were below the poverty line, including 28.2% of those under age 18 and 10.2% of those age 65 or over.
Common Questions
What is Per Capita Income in Shawnee?
Per Capita income in Shawnee is $26,577.
What is the Median Family Income in Shawnee?
Median Family Income in Shawnee is $64,968.
What is the Median Household income in Shawnee?
Median Household Income in Shawnee is $50,695.
What is Income or Wage Gap in Shawnee?
Income or Wage Gap in Shawnee is 33.3%.
Women in Shawnee earn 66.7 cents for every dollar earned by a man.
What is Family Income Deficit in Shawnee?
Family Income Deficit in Shawnee is $12,368.
Families that are below poverty line in Shawnee earn $12,368 less on average than the poverty threshold level.
What is Inequality or Gini Index in Shawnee?
Inequality or Gini Index in Shawnee is 0.47.
What is the Total Population of Shawnee?
Total Population of Shawnee is 31,391.
What is the Total Male Population of Shawnee?
Total Male Population of Shawnee is 14,898.
What is the Total Female Population of Shawnee?
Total Female Population of Shawnee is 16,493.
What is the Ratio of Males per 100 Females in Shawnee?
There are 90.33 Males per 100 Females in Shawnee.
What is the Ratio of Females per 100 Males in Shawnee?
There are 110.71 Females per 100 Males in Shawnee.
What is the Median Population Age in Shawnee?
Median Population Age in Shawnee is 34.9 Years.
What is the Average Family Size in Shawnee
Average Family Size in Shawnee is 3.1 People.
What is the Average Household Size in Shawnee
Average Household Size in Shawnee is 2.5 People.
How Large is the Labor Force in Shawnee?
There are 13,842 People in the Labor Forcein in Shawnee.
What is the Percentage of People in the Labor Force in Shawnee?
55.5% of People are in the Labor Force in Shawnee.
What is the Unemployment Rate in Shawnee?
Unemployment Rate in Shawnee is 6.8%.