Kenneth, MN Map & Demographics
Kenneth Map
Kenneth Overview
$21,705
PER CAPITA INCOME
$29,375
AVG FAMILY INCOME
$28,750
AVG HOUSEHOLD INCOME
0.64
INEQUALITY / GINI INDEX
66
TOTAL POPULATION
50
MALE POPULATION
16
FEMALE POPULATION
312.50
MALES / 100 FEMALES
32.00
FEMALES / 100 MALES
9.5
MEDIAN AGE
7.7
AVG FAMILY SIZE
3.7
AVG HOUSEHOLD SIZE
11
LABOR FORCE [ PEOPLE ]
42.3%
PERCENT IN LABOR FORCE
27.3%
UNEMPLOYMENT RATE
Kenneth Zip Codes
Kenneth Area Codes
Income in Kenneth
Income Overview in Kenneth
Per Capita Income in Kenneth is $21,705, while median incomes of families and households are $29,375 and $28,750 respectively.
| Characteristic | Number | Measure |
| Per Capita Income | 66 | $21,705 |
| Median Family Income | 7 | $29,375 |
| Mean Family Income | 7 | $26,614 |
| Median Household Income | 18 | $28,750 |
| Mean Household Income | 18 | $80,206 |
| Income Deficit | 7 | $0 |
| Wage / Income Gap (%) | 66 | 0.00% |
| Wage / Income Gap ($) | 66 | 100.00¢ per $1 |
| Gini / Inequality Index | 66 | 0.64 |
Earnings by Sex in Kenneth
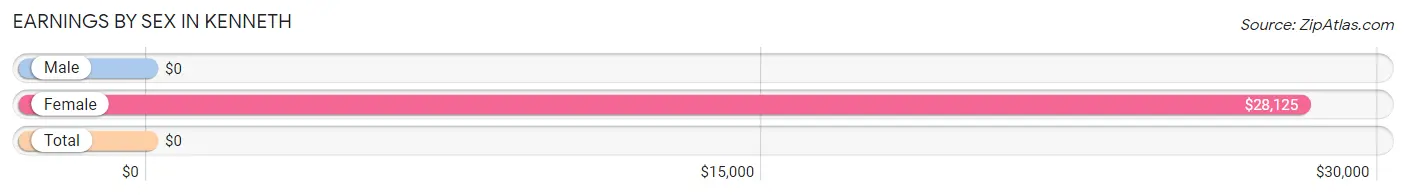
| Sex | Number | Average Earnings |
| Male | 11 (68.8%) | $0 |
| Female | 5 (31.2%) | $28,125 |
| Total | 16 (100.0%) | $0 |
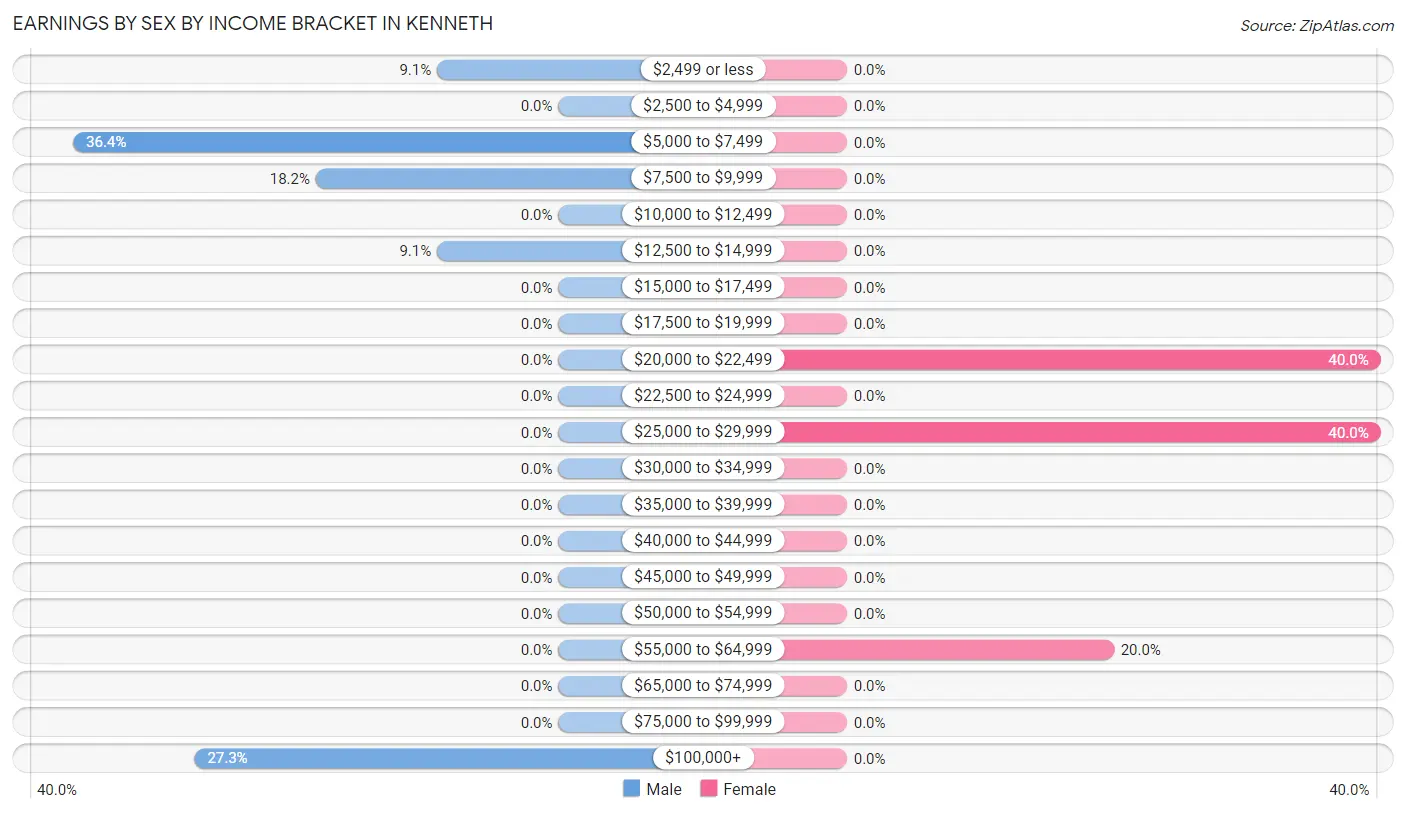
Earnings by Sex by Income Bracket in Kenneth
The most common earnings brackets in Kenneth are $5,000 to $7,499 for men (4 | 36.4%) and $20,000 to $22,499 for women (2 | 40.0%).
| Income | Male | Female |
| $2,499 or less | 1 (9.1%) | 0 (0.0%) |
| $2,500 to $4,999 | 0 (0.0%) | 0 (0.0%) |
| $5,000 to $7,499 | 4 (36.4%) | 0 (0.0%) |
| $7,500 to $9,999 | 2 (18.2%) | 0 (0.0%) |
| $10,000 to $12,499 | 0 (0.0%) | 0 (0.0%) |
| $12,500 to $14,999 | 1 (9.1%) | 0 (0.0%) |
| $15,000 to $17,499 | 0 (0.0%) | 0 (0.0%) |
| $17,500 to $19,999 | 0 (0.0%) | 0 (0.0%) |
| $20,000 to $22,499 | 0 (0.0%) | 2 (40.0%) |
| $22,500 to $24,999 | 0 (0.0%) | 0 (0.0%) |
| $25,000 to $29,999 | 0 (0.0%) | 2 (40.0%) |
| $30,000 to $34,999 | 0 (0.0%) | 0 (0.0%) |
| $35,000 to $39,999 | 0 (0.0%) | 0 (0.0%) |
| $40,000 to $44,999 | 0 (0.0%) | 0 (0.0%) |
| $45,000 to $49,999 | 0 (0.0%) | 0 (0.0%) |
| $50,000 to $54,999 | 0 (0.0%) | 0 (0.0%) |
| $55,000 to $64,999 | 0 (0.0%) | 1 (20.0%) |
| $65,000 to $74,999 | 0 (0.0%) | 0 (0.0%) |
| $75,000 to $99,999 | 0 (0.0%) | 0 (0.0%) |
| $100,000+ | 3 (27.3%) | 0 (0.0%) |
| Total | 11 (100.0%) | 5 (100.0%) |
Earnings by Sex by Educational Attainment in Kenneth
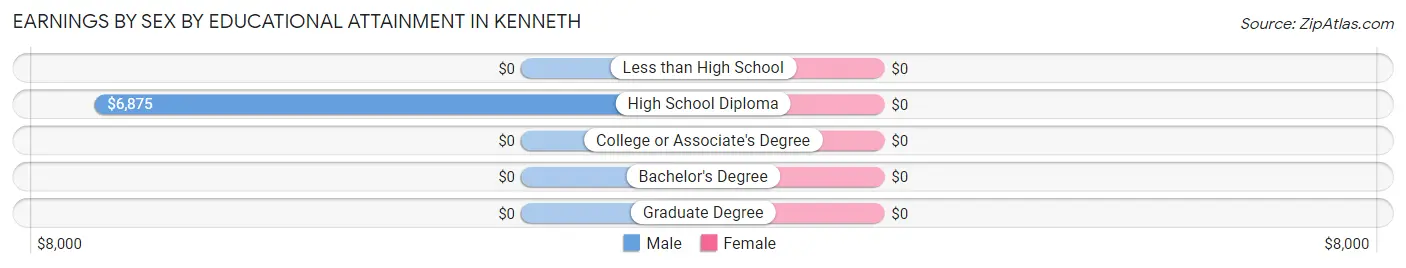
| Educational Attainment | Male Income | Female Income |
| Less than High School | - | - |
| High School Diploma | $6,875 | $0 |
| College or Associate's Degree | - | - |
| Bachelor's Degree | - | - |
| Graduate Degree | - | - |
| Total | - | - |
Family Income in Kenneth
Family Income Brackets in Kenneth
According to the Kenneth family income data, there are 4 families falling into the $25,000 to $34,999 income range, which is the most common income bracket and makes up 57.1% of all families.
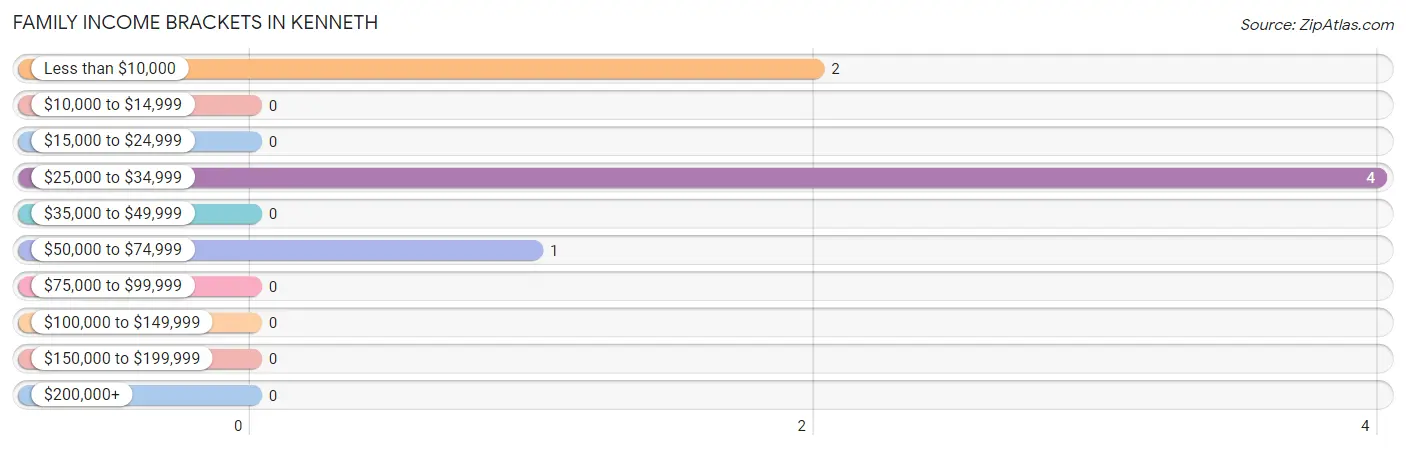
| Income Bracket | # Families | % Families |
| Less than $10,000 | 2 | 28.6% |
| $10,000 to $14,999 | 0 | 0.0% |
| $15,000 to $24,999 | 0 | 0.0% |
| $25,000 to $34,999 | 4 | 57.1% |
| $35,000 to $49,999 | 0 | 0.0% |
| $50,000 to $74,999 | 1 | 14.3% |
| $75,000 to $99,999 | 0 | 0.0% |
| $100,000 to $149,999 | 0 | 0.0% |
| $150,000 to $199,999 | 0 | 0.0% |
| $200,000+ | 0 | 0.0% |
Family Income by Famaliy Size in Kenneth
2-person families (5 | 71.4%) account for the highest median family income in Kenneth with $30,625 per family, while 2-person families (5 | 71.4%) have the highest median income of $15,312 per family member.
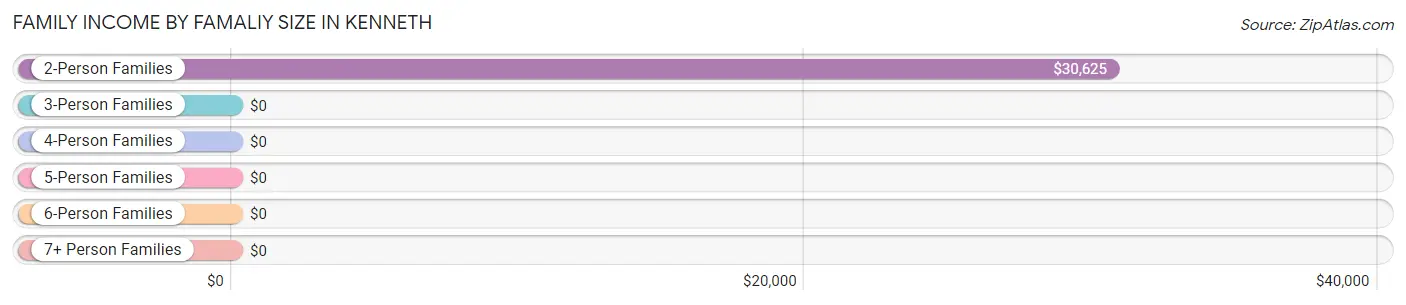
| Income Bracket | # Families | Median Income |
| 2-Person Families | 5 (71.4%) | $30,625 |
| 3-Person Families | 0 (0.0%) | $0 |
| 4-Person Families | 0 (0.0%) | $0 |
| 5-Person Families | 0 (0.0%) | $0 |
| 6-Person Families | 2 (28.6%) | $0 |
| 7+ Person Families | 0 (0.0%) | $0 |
| Total | 7 (100.0%) | $29,375 |
Family Income by Number of Earners in Kenneth
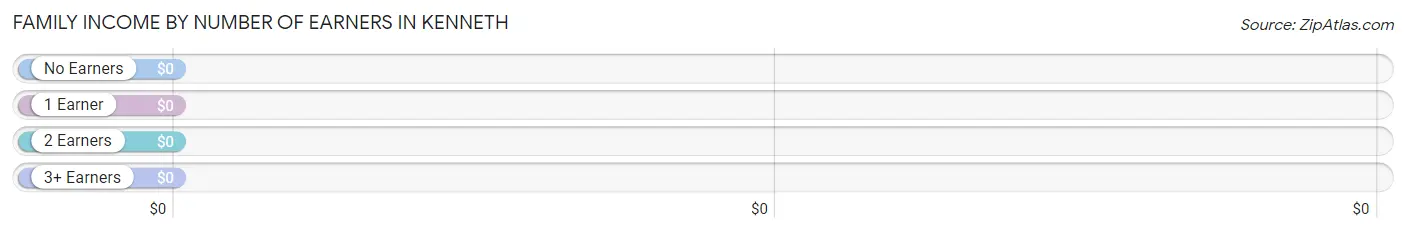
| Number of Earners | # Families | Median Income |
| No Earners | 4 (57.1%) | $0 |
| 1 Earner | 0 (0.0%) | $0 |
| 2 Earners | 3 (42.9%) | $0 |
| 3+ Earners | 0 (0.0%) | $0 |
| Total | 7 (100.0%) | $29,375 |
Household Income in Kenneth
Household Income Brackets in Kenneth
With 8 households falling in the category, the $25,000 to $34,999 income range is the most frequent in Kenneth, accounting for 44.4% of all households.
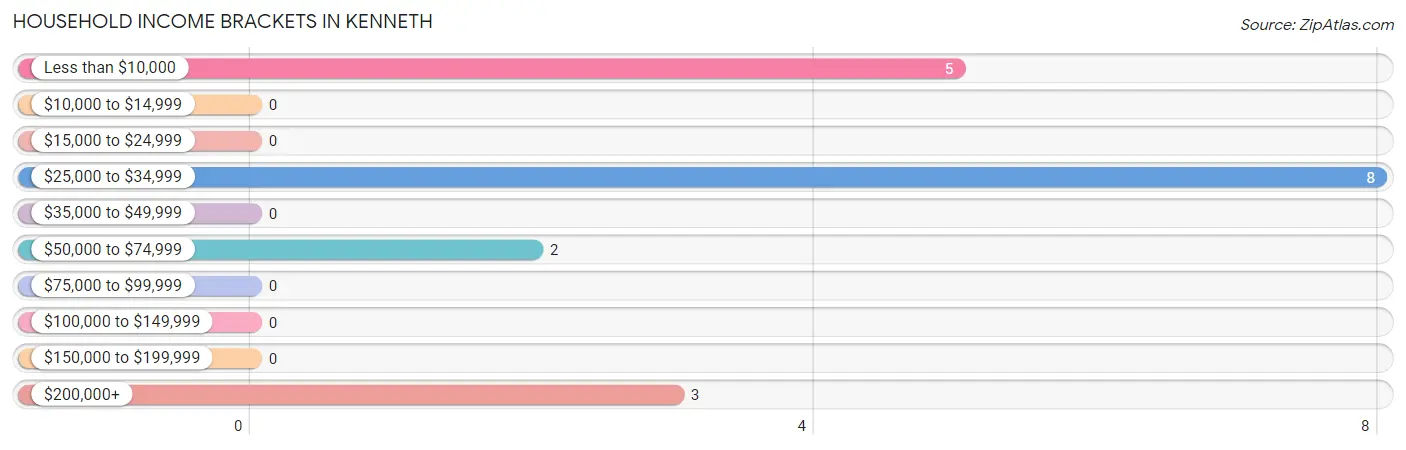
| Income Bracket | # Households | % Households |
| Less than $10,000 | 5 | 27.8% |
| $10,000 to $14,999 | 0 | 0.0% |
| $15,000 to $24,999 | 0 | 0.0% |
| $25,000 to $34,999 | 8 | 44.4% |
| $35,000 to $49,999 | 0 | 0.0% |
| $50,000 to $74,999 | 2 | 11.1% |
| $75,000 to $99,999 | 0 | 0.0% |
| $100,000 to $149,999 | 0 | 0.0% |
| $150,000 to $199,999 | 0 | 0.0% |
| $200,000+ | 3 | 16.7% |
Household Income by Householder Age in Kenneth
| Income Bracket | # Households | Median Income |
| 15 to 24 Years | 0 (0.0%) | $0 |
| 25 to 44 Years | 1 (5.6%) | $0 |
| 45 to 64 Years | 8 (44.4%) | $0 |
| 65+ Years | 9 (50.0%) | $0 |
| Total | 18 (100.0%) | $28,750 |
Poverty in Kenneth
Income Below Poverty by Sex and Age in Kenneth
With 80.0% poverty level for males and 50.0% for females among the residents of Kenneth, under 5 year old males and 12 to 14 year old females are the most vulnerable to poverty, with 29 males (100.0%) and 4 females (100.0%) in their respective age groups living below the poverty level.
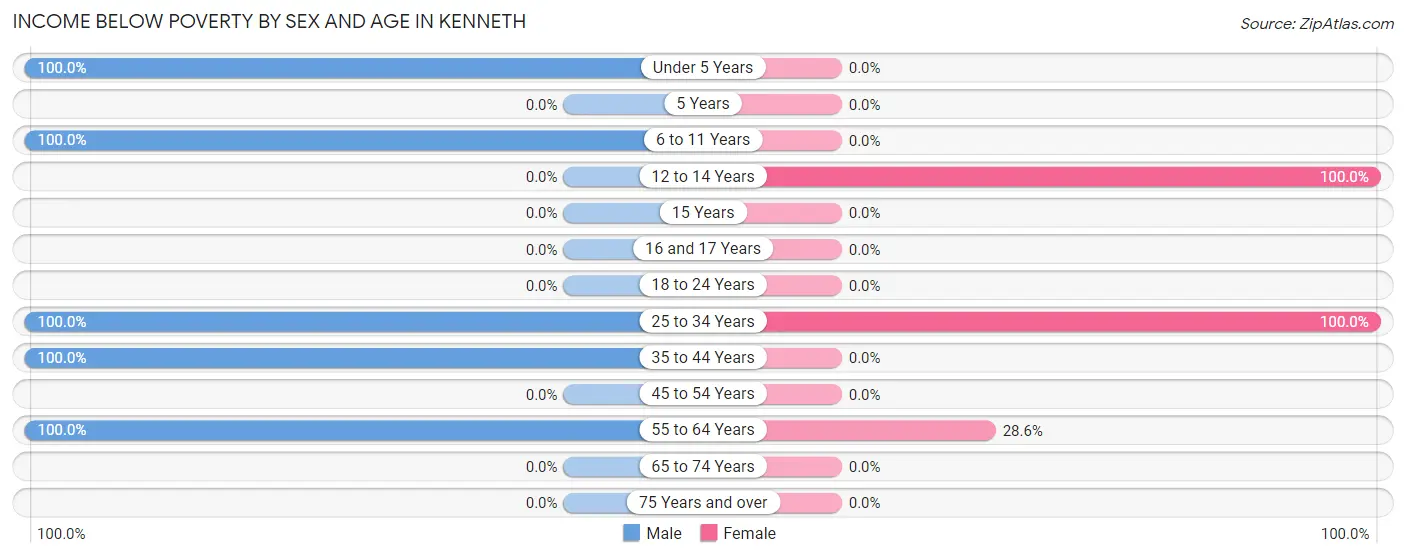
| Age Bracket | Male | Female |
| Under 5 Years | 29 (100.0%) | 0 (0.0%) |
| 5 Years | 0 (0.0%) | 0 (0.0%) |
| 6 to 11 Years | 7 (100.0%) | 0 (0.0%) |
| 12 to 14 Years | 0 (0.0%) | 4 (100.0%) |
| 15 Years | 0 (0.0%) | 0 (0.0%) |
| 16 and 17 Years | 0 (0.0%) | 0 (0.0%) |
| 18 to 24 Years | 0 (0.0%) | 0 (0.0%) |
| 25 to 34 Years | 1 (100.0%) | 2 (100.0%) |
| 35 to 44 Years | 1 (100.0%) | 0 (0.0%) |
| 45 to 54 Years | 0 (0.0%) | 0 (0.0%) |
| 55 to 64 Years | 2 (100.0%) | 2 (28.6%) |
| 65 to 74 Years | 0 (0.0%) | 0 (0.0%) |
| 75 Years and over | 0 (0.0%) | 0 (0.0%) |
| Total | 40 (80.0%) | 8 (50.0%) |
Income Above Poverty by Sex and Age in Kenneth
According to the poverty statistics in Kenneth, males aged 65 to 74 years and females aged 75 years and over are the age groups that are most secure financially, with 100.0% of males and 100.0% of females in these age groups living above the poverty line.
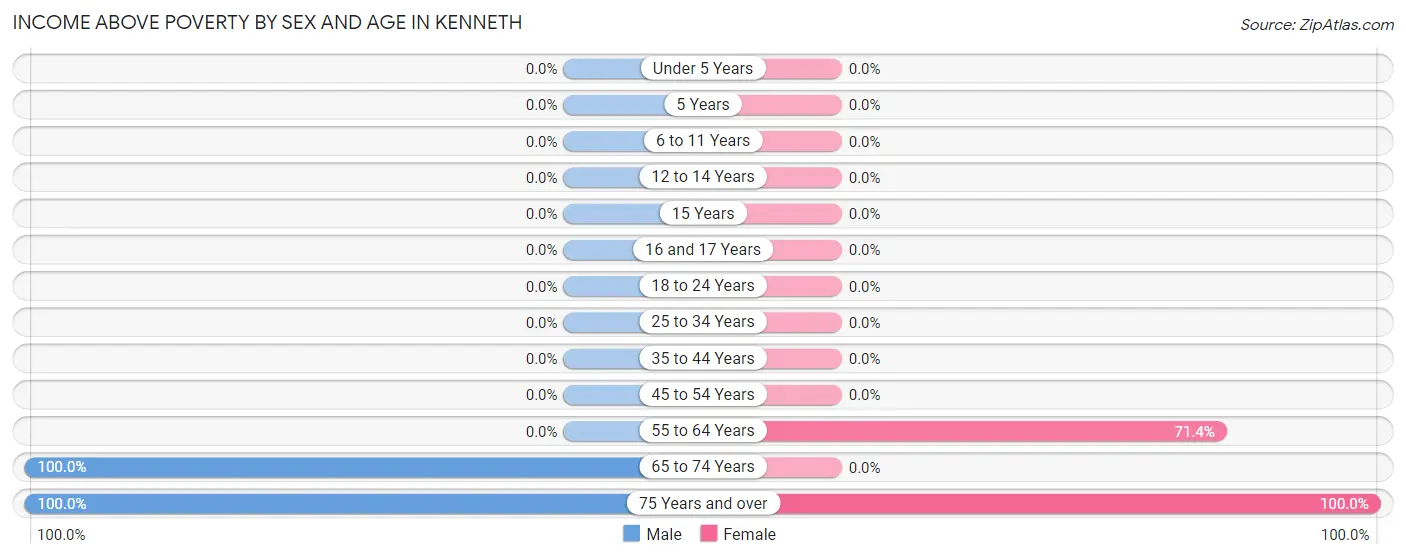
| Age Bracket | Male | Female |
| Under 5 Years | 0 (0.0%) | 0 (0.0%) |
| 5 Years | 0 (0.0%) | 0 (0.0%) |
| 6 to 11 Years | 0 (0.0%) | 0 (0.0%) |
| 12 to 14 Years | 0 (0.0%) | 0 (0.0%) |
| 15 Years | 0 (0.0%) | 0 (0.0%) |
| 16 and 17 Years | 0 (0.0%) | 0 (0.0%) |
| 18 to 24 Years | 0 (0.0%) | 0 (0.0%) |
| 25 to 34 Years | 0 (0.0%) | 0 (0.0%) |
| 35 to 44 Years | 0 (0.0%) | 0 (0.0%) |
| 45 to 54 Years | 0 (0.0%) | 0 (0.0%) |
| 55 to 64 Years | 0 (0.0%) | 5 (71.4%) |
| 65 to 74 Years | 8 (100.0%) | 0 (0.0%) |
| 75 Years and over | 2 (100.0%) | 3 (100.0%) |
| Total | 10 (20.0%) | 8 (50.0%) |
Income Below Poverty Among Married-Couple Families in Kenneth
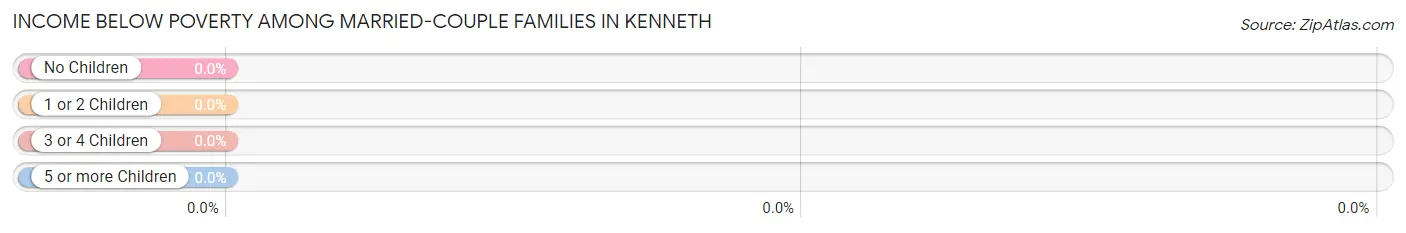
| Children | Above Poverty | Below Poverty |
| No Children | 5 (100.0%) | 0 (0.0%) |
| 1 or 2 Children | 0 (0.0%) | 0 (0.0%) |
| 3 or 4 Children | 0 (0.0%) | 0 (0.0%) |
| 5 or more Children | 0 (0.0%) | 0 (0.0%) |
| Total | 5 (100.0%) | 0 (0.0%) |
Income Below Poverty Among Single-Parent Households in Kenneth
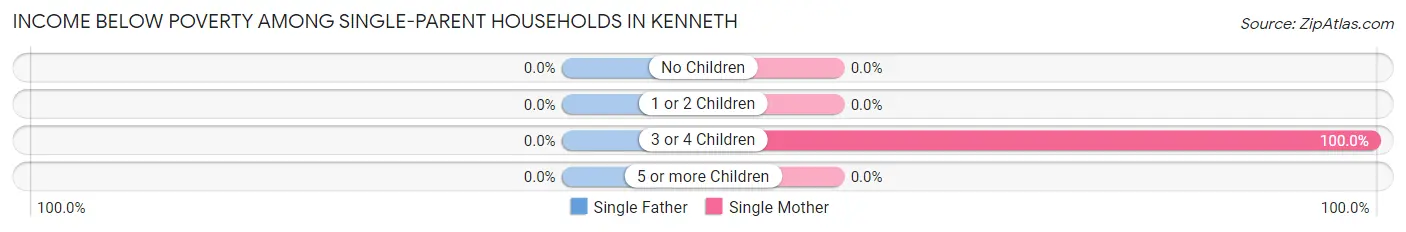
| Children | Single Father | Single Mother |
| No Children | 0 (0.0%) | 0 (0.0%) |
| 1 or 2 Children | 0 (0.0%) | 0 (0.0%) |
| 3 or 4 Children | 0 (0.0%) | 2 (100.0%) |
| 5 or more Children | 0 (0.0%) | 0 (0.0%) |
| Total | 0 (0.0%) | 2 (100.0%) |
Income Below Poverty Among Married-Couple vs Single-Parent Households in Kenneth
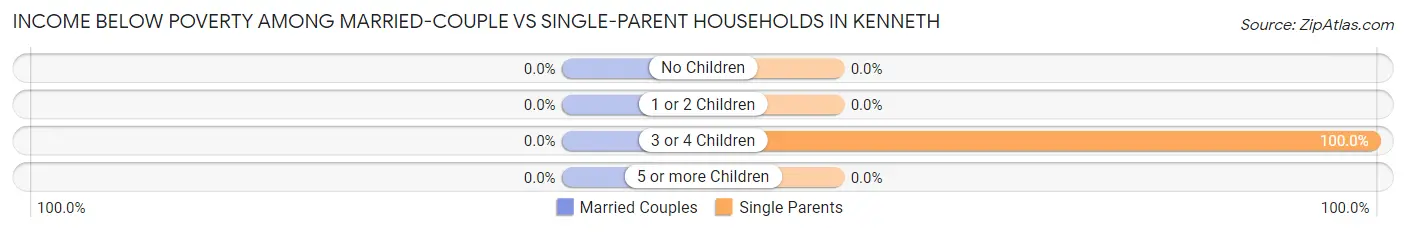
| Children | Married-Couple Families | Single-Parent Households |
| No Children | 0 (0.0%) | 0 (0.0%) |
| 1 or 2 Children | 0 (0.0%) | 0 (0.0%) |
| 3 or 4 Children | 0 (0.0%) | 2 (100.0%) |
| 5 or more Children | 0 (0.0%) | 0 (0.0%) |
| Total | 0 (0.0%) | 2 (100.0%) |
Race in Kenneth
The most populous races in Kenneth are Native / Alaskan (44 | 66.7%), and White / Caucasian (22 | 33.3%).
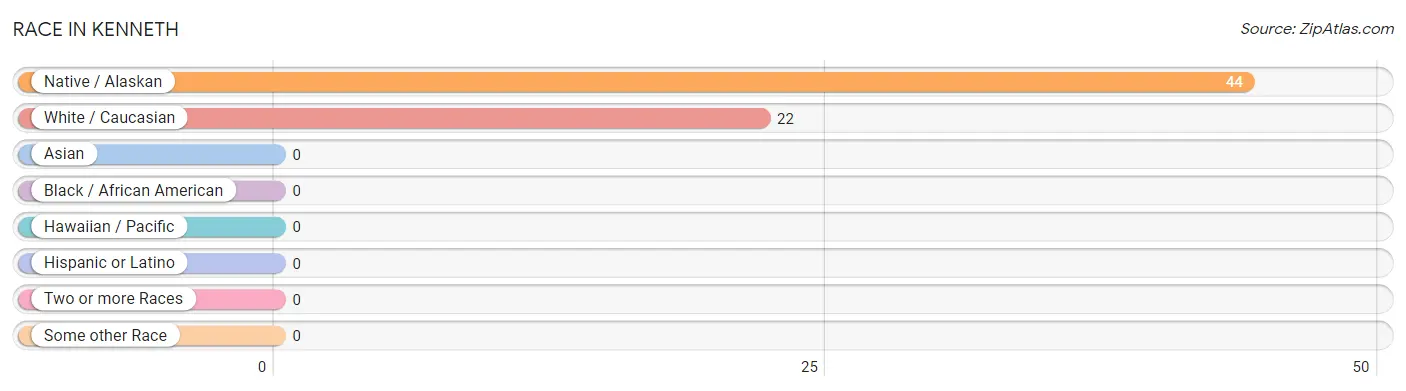
| Race | # Population | % Population |
| Asian | 0 | 0.0% |
| Black / African American | 0 | 0.0% |
| Hawaiian / Pacific | 0 | 0.0% |
| Hispanic or Latino | 0 | 0.0% |
| Native / Alaskan | 44 | 66.7% |
| White / Caucasian | 22 | 33.3% |
| Two or more Races | 0 | 0.0% |
| Some other Race | 0 | 0.0% |
| Total | 66 | 100.0% |
Ancestry in Kenneth
The most populous ancestries reported in Kenneth are Sioux (44 | 66.7%), German (9 | 13.6%), Dutch (6 | 9.1%), English (5 | 7.6%), and Irish (3 | 4.5%), together accounting for 101.5% of all Kenneth residents.
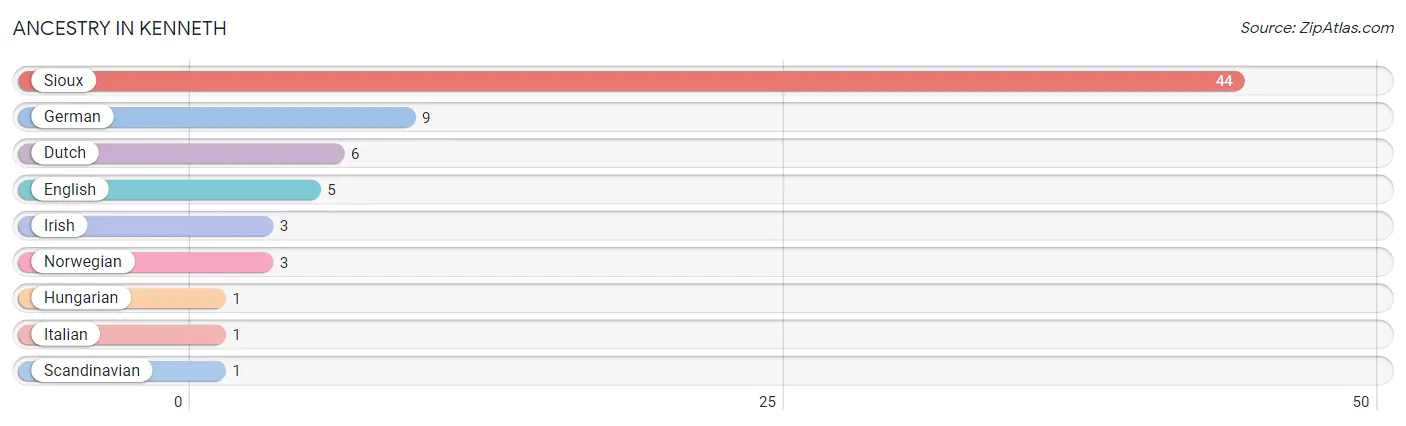
| Ancestry | # Population | % Population |
| Dutch | 6 | 9.1% |
| English | 5 | 7.6% |
| German | 9 | 13.6% |
| Hungarian | 1 | 1.5% |
| Irish | 3 | 4.5% |
| Italian | 1 | 1.5% |
| Norwegian | 3 | 4.5% |
| Scandinavian | 1 | 1.5% |
| Sioux | 44 | 66.7% | View All 9 Rows |
Immigrants in Kenneth

| Immigration Origin | # Population | % Population | View All 0 Rows |
Sex and Age in Kenneth
Sex and Age in Kenneth
The most populous age groups in Kenneth are Under 5 Years (29 | 58.0%) for men and 60 to 64 Years (5 | 31.2%) for women.
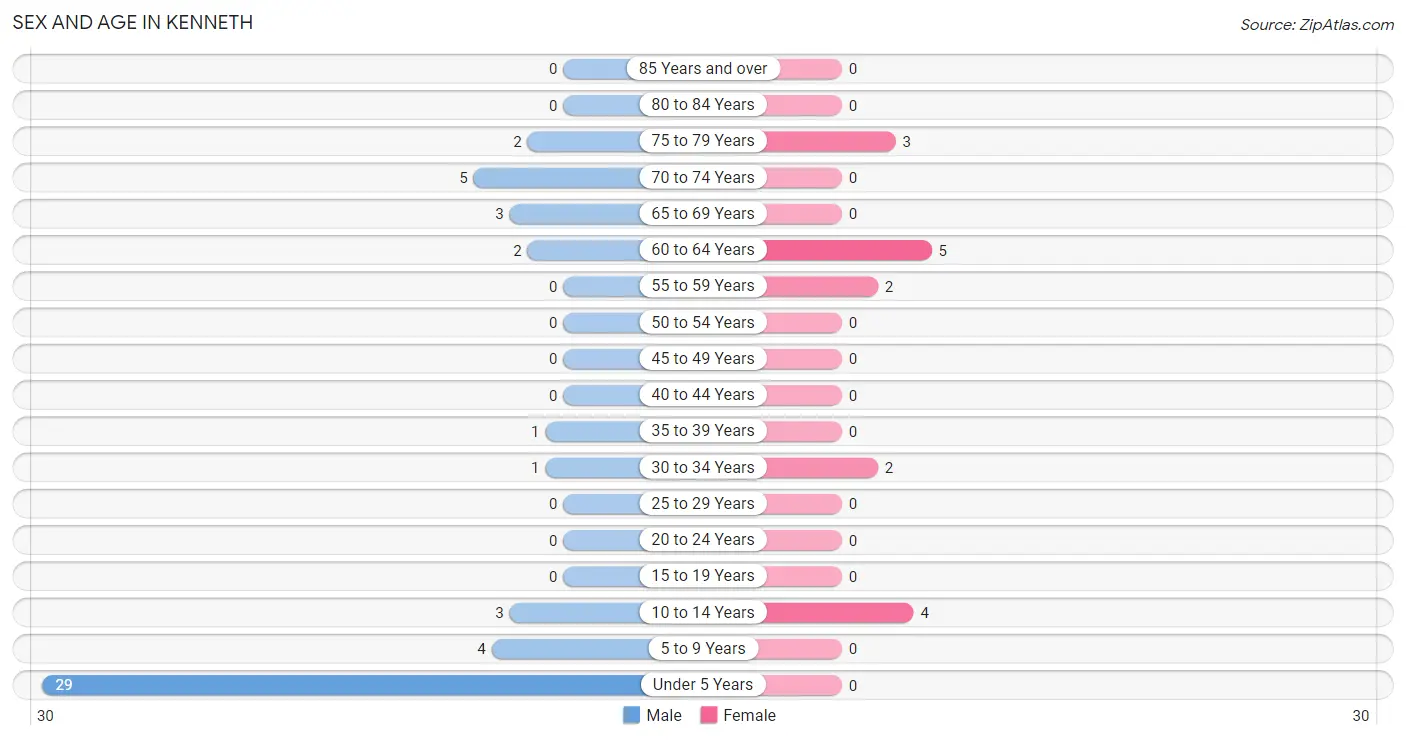
| Age Bracket | Male | Female |
| Under 5 Years | 29 (58.0%) | 0 (0.0%) |
| 5 to 9 Years | 4 (8.0%) | 0 (0.0%) |
| 10 to 14 Years | 3 (6.0%) | 4 (25.0%) |
| 15 to 19 Years | 0 (0.0%) | 0 (0.0%) |
| 20 to 24 Years | 0 (0.0%) | 0 (0.0%) |
| 25 to 29 Years | 0 (0.0%) | 0 (0.0%) |
| 30 to 34 Years | 1 (2.0%) | 2 (12.5%) |
| 35 to 39 Years | 1 (2.0%) | 0 (0.0%) |
| 40 to 44 Years | 0 (0.0%) | 0 (0.0%) |
| 45 to 49 Years | 0 (0.0%) | 0 (0.0%) |
| 50 to 54 Years | 0 (0.0%) | 0 (0.0%) |
| 55 to 59 Years | 0 (0.0%) | 2 (12.5%) |
| 60 to 64 Years | 2 (4.0%) | 5 (31.2%) |
| 65 to 69 Years | 3 (6.0%) | 0 (0.0%) |
| 70 to 74 Years | 5 (10.0%) | 0 (0.0%) |
| 75 to 79 Years | 2 (4.0%) | 3 (18.8%) |
| 80 to 84 Years | 0 (0.0%) | 0 (0.0%) |
| 85 Years and over | 0 (0.0%) | 0 (0.0%) |
| Total | 50 (100.0%) | 16 (100.0%) |
Families and Households in Kenneth
Median Family Size in Kenneth
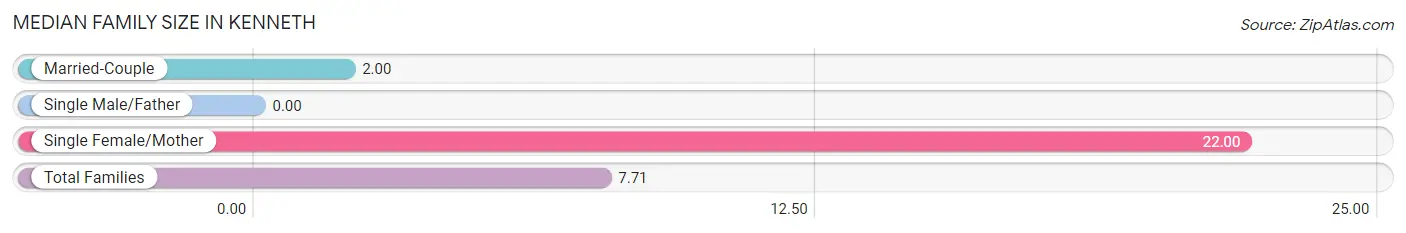
| Family Type | # Families | Family Size |
| Married-Couple | 5 (71.4%) | 2.00 |
| Single Male/Father | 0 (0.0%) | - |
| Single Female/Mother | 2 (28.6%) | 22.00 |
| Total Families | 7 (100.0%) | 7.71 |
Median Household Size in Kenneth
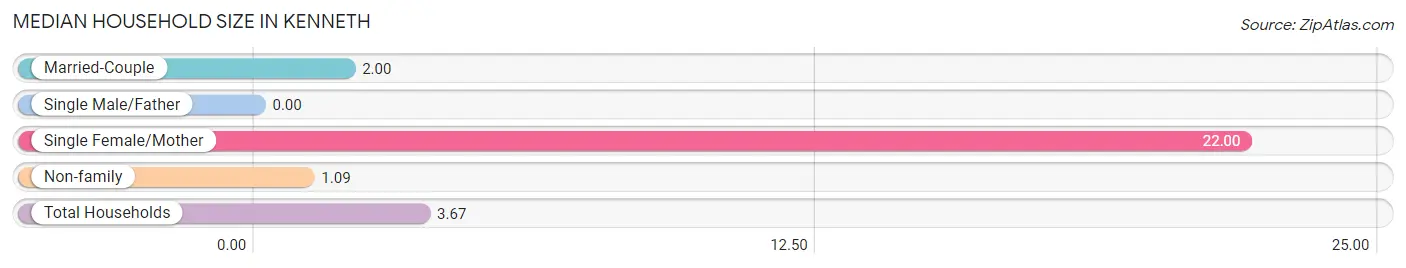
| Household Type | # Households | Household Size |
| Married-Couple | 5 (27.8%) | 2.00 |
| Single Male/Father | 0 (0.0%) | - |
| Single Female/Mother | 2 (11.1%) | 22.00 |
| Non-family | 11 (61.1%) | 1.09 |
| Total Households | 18 (100.0%) | 3.67 |
Household Size by Marriage Status in Kenneth
Out of a total of 18 households in Kenneth, 7 (38.9%) are family households, while 11 (61.1%) are nonfamily households. The most numerous type of family households are 2-person households, comprising 5, and the most common type of nonfamily households are 1-person households, comprising 10.
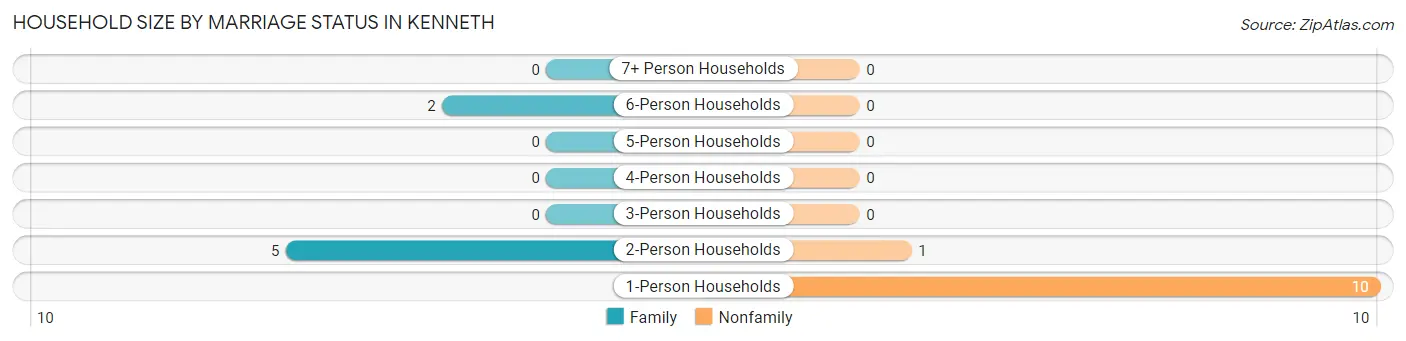
| Household Size | Family Households | Nonfamily Households |
| 1-Person Households | - | 10 (55.6%) |
| 2-Person Households | 5 (27.8%) | 1 (5.6%) |
| 3-Person Households | 0 (0.0%) | 0 (0.0%) |
| 4-Person Households | 0 (0.0%) | 0 (0.0%) |
| 5-Person Households | 0 (0.0%) | 0 (0.0%) |
| 6-Person Households | 2 (11.1%) | 0 (0.0%) |
| 7+ Person Households | 0 (0.0%) | 0 (0.0%) |
| Total | 7 (38.9%) | 11 (61.1%) |
Female Fertility in Kenneth
Fertility by Age in Kenneth
Average fertility rate in Kenneth is 1,000.0 births per 1,000 women. Women in the age bracket of 20 to 34 years have the highest fertility rate with 1,000.0 births per 1,000 women. Women in the age bracket of 20 to 34 years acount for 100.0% of all women with births.
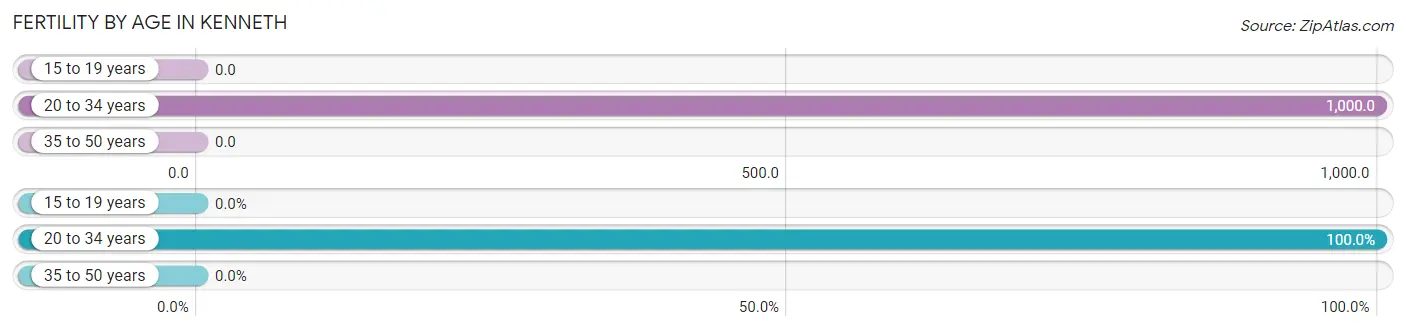
| Age Bracket | Women with Births | Births / 1,000 Women |
| 15 to 19 years | 0 (0.0%) | 0.0 |
| 20 to 34 years | 2 (100.0%) | 1,000.0 |
| 35 to 50 years | 0 (0.0%) | 0.0 |
| Total | 2 (100.0%) | 1,000.0 |
Fertility by Age by Marriage Status in Kenneth
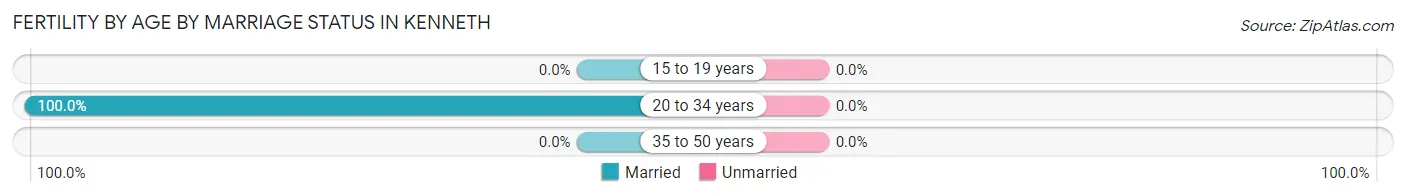
| Age Bracket | Married | Unmarried |
| 15 to 19 years | 0 (0.0%) | 0 (0.0%) |
| 20 to 34 years | 2 (100.0%) | 0 (0.0%) |
| 35 to 50 years | 0 (0.0%) | 0 (0.0%) |
| Total | 2 (100.0%) | 0 (0.0%) |
Fertility by Education in Kenneth
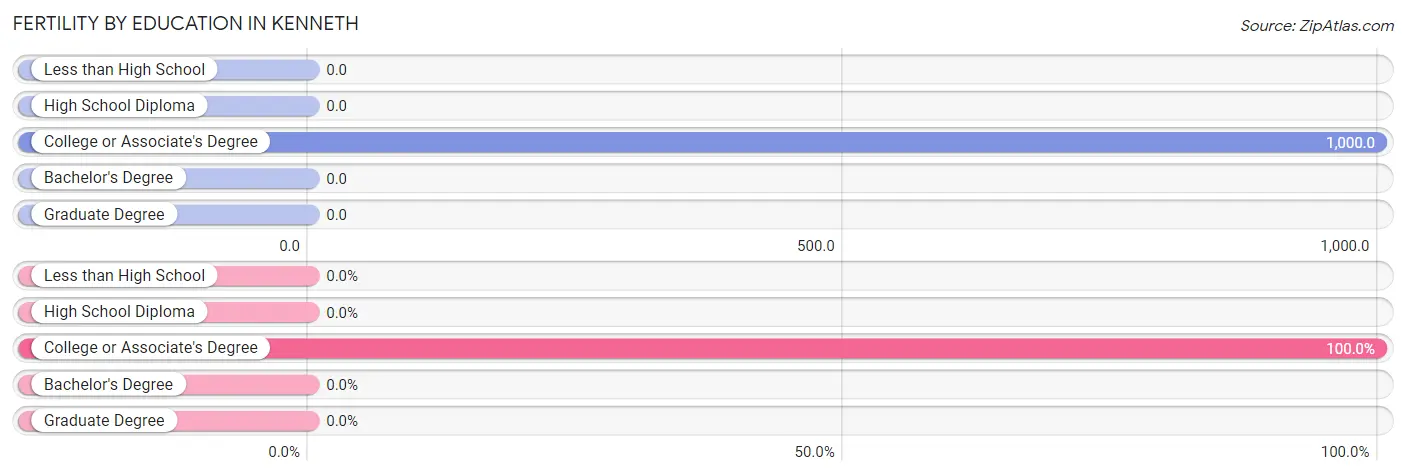
| Educational Attainment | Women with Births | Births / 1,000 Women |
| Less than High School | 0 (0.0%) | 0.0 |
| High School Diploma | 0 (0.0%) | 0.0 |
| College or Associate's Degree | 2 (100.0%) | 1,000.0 |
| Bachelor's Degree | 0 (0.0%) | 0.0 |
| Graduate Degree | 0 (0.0%) | 0.0 |
| Total | 2 (100.0%) | 1,000.0 |
Fertility by Education by Marriage Status in Kenneth
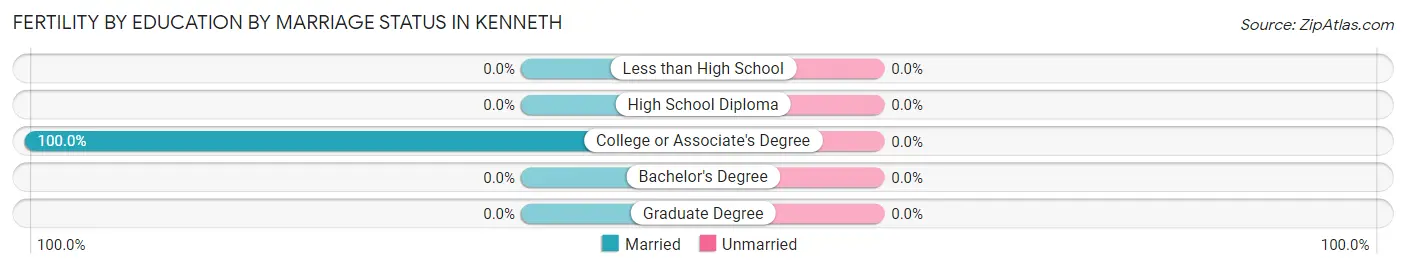
| Educational Attainment | Married | Unmarried |
| Less than High School | 0 (0.0%) | 0 (0.0%) |
| High School Diploma | 0 (0.0%) | 0 (0.0%) |
| College or Associate's Degree | 2 (100.0%) | 0 (0.0%) |
| Bachelor's Degree | 0 (0.0%) | 0 (0.0%) |
| Graduate Degree | 0 (0.0%) | 0 (0.0%) |
| Total | 2 (100.0%) | 0 (0.0%) |
Employment Characteristics in Kenneth
Employment by Class of Employer in Kenneth
Among the 8 employed individuals in Kenneth, private company employees (4 | 50.0%), self-employed (not incorporated) (3 | 37.5%), and local government employees (1 | 12.5%) make up the most common classes of employment.
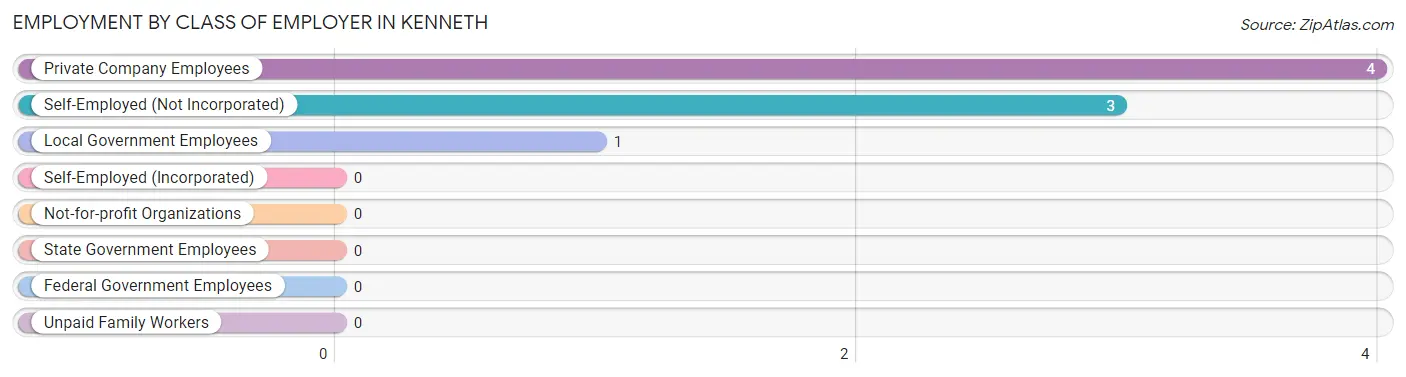
| Employer Class | # Employees | % Employees |
| Private Company Employees | 4 | 50.0% |
| Self-Employed (Incorporated) | 0 | 0.0% |
| Self-Employed (Not Incorporated) | 3 | 37.5% |
| Not-for-profit Organizations | 0 | 0.0% |
| Local Government Employees | 1 | 12.5% |
| State Government Employees | 0 | 0.0% |
| Federal Government Employees | 0 | 0.0% |
| Unpaid Family Workers | 0 | 0.0% |
| Total | 8 | 100.0% |
Employment Status by Age in Kenneth
According to the labor force statistics for Kenneth, out of the total population over 16 years of age (26), 42.3% or 11 individuals are in the labor force, with 27.3% or 3 of them unemployed. The age group with the highest labor force participation rate is 35 to 44 years, with 100.0% or 1 individuals in the labor force. Within the labor force, the 35 to 44 years age range has the highest percentage of unemployed individuals, with 100.0% or 1 of them being unemployed.
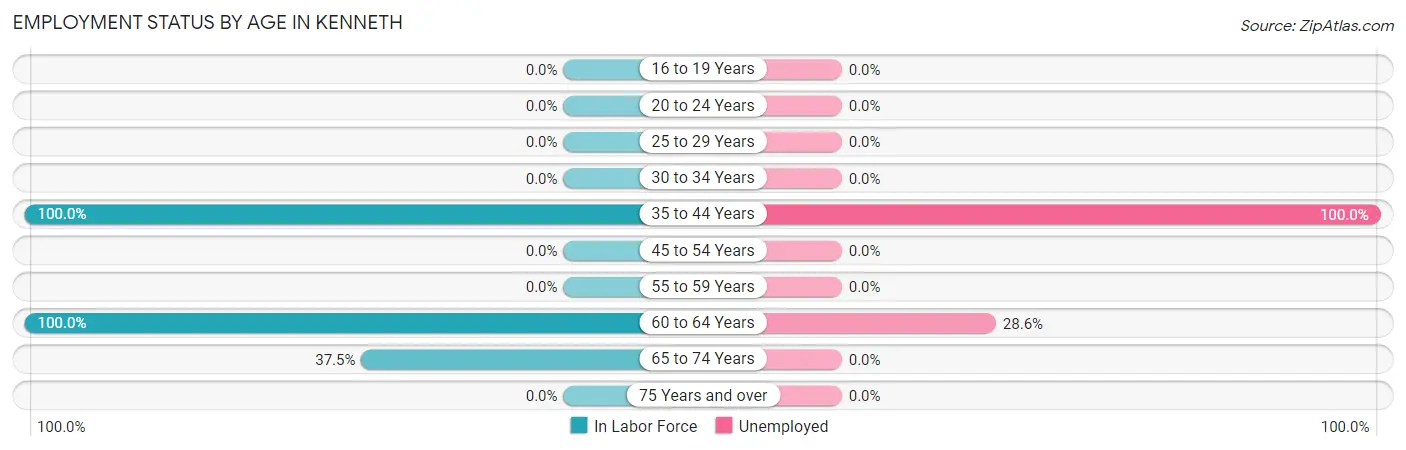
| Age Bracket | In Labor Force | Unemployed |
| 16 to 19 Years | 0 (0.0%) | 0 (0.0%) |
| 20 to 24 Years | 0 (0.0%) | 0 (0.0%) |
| 25 to 29 Years | 0 (0.0%) | 0 (0.0%) |
| 30 to 34 Years | 0 (0.0%) | 0 (0.0%) |
| 35 to 44 Years | 1 (100.0%) | 1 (100.0%) |
| 45 to 54 Years | 0 (0.0%) | 0 (0.0%) |
| 55 to 59 Years | 0 (0.0%) | 0 (0.0%) |
| 60 to 64 Years | 7 (100.0%) | 2 (28.6%) |
| 65 to 74 Years | 3 (37.5%) | 0 (0.0%) |
| 75 Years and over | 0 (0.0%) | 0 (0.0%) |
| Total | 11 (42.3%) | 3 (27.3%) |
Employment Status by Educational Attainment in Kenneth
According to labor force statistics for Kenneth, 61.5% of individuals (8) out of the total population between 25 and 64 years of age (13) are in the labor force, with 37.5% or 3 of them being unemployed. The group with the highest labor force participation rate are those with the educational attainment of bachelor's degree or higher, with 100.0% or 1 individuals in the labor force. Within the labor force, individuals with high school diploma education have the highest percentage of unemployment, with 60.0% or 3 of them being unemployed.
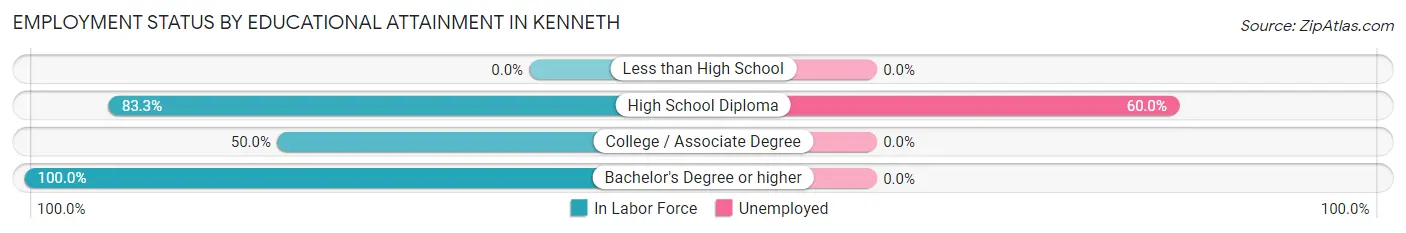
| Educational Attainment | In Labor Force | Unemployed |
| Less than High School | 0 (0.0%) | 0 (0.0%) |
| High School Diploma | 5 (83.3%) | 4 (60.0%) |
| College / Associate Degree | 2 (50.0%) | 0 (0.0%) |
| Bachelor's Degree or higher | 1 (100.0%) | 0 (0.0%) |
| Total | 8 (61.5%) | 5 (37.5%) |
Employment Occupations by Sex in Kenneth
Management, Business, Science and Arts Occupations
The most common Management, Business, Science and Arts occupations in Kenneth are , and Management (3 | 37.5%).
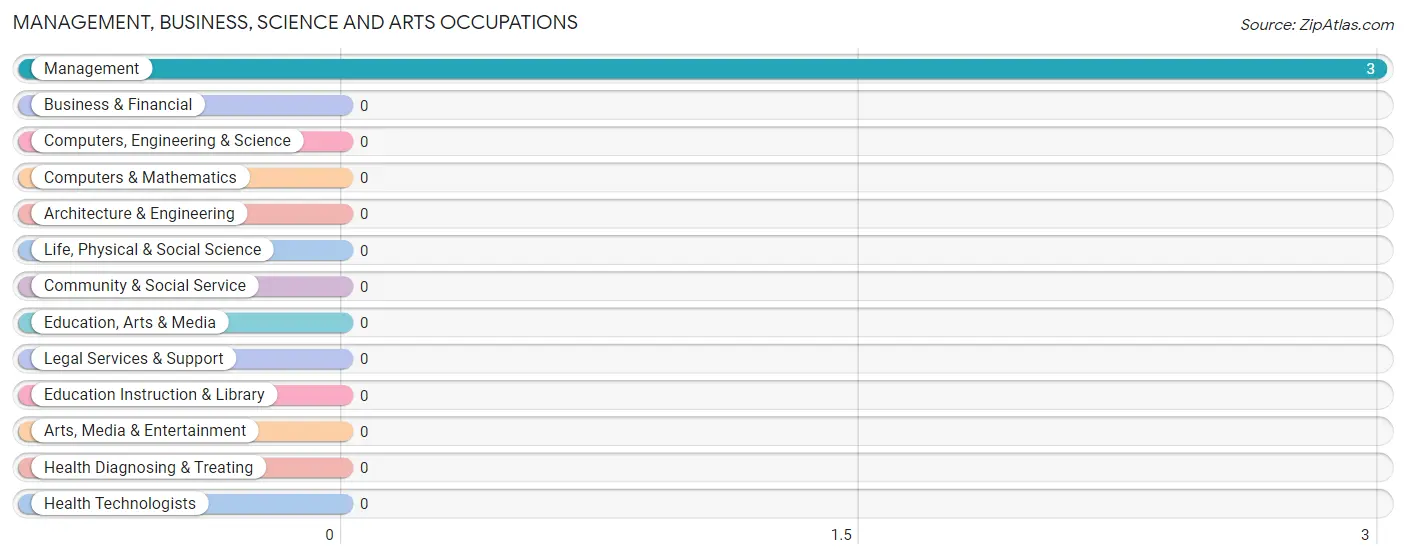
Management, Business, Science and Arts Occupations by Sex
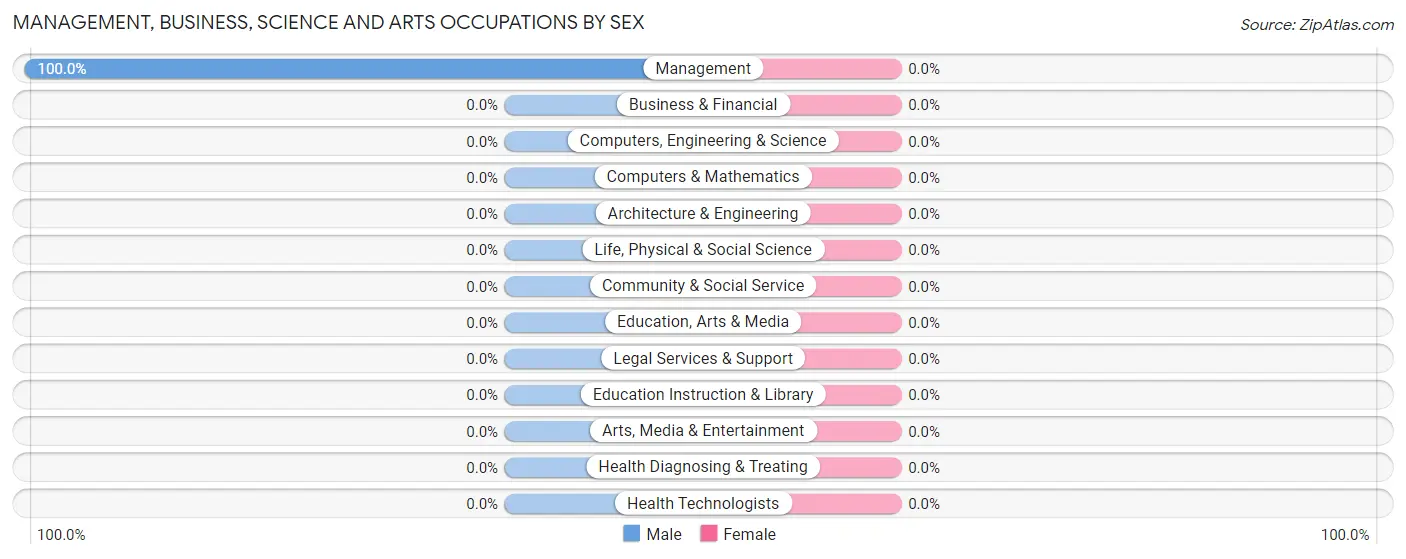
| Occupation | Male | Female |
| Management | 3 (100.0%) | 0 (0.0%) |
| Business & Financial | 0 (0.0%) | 0 (0.0%) |
| Computers, Engineering & Science | 0 (0.0%) | 0 (0.0%) |
| Computers & Mathematics | 0 (0.0%) | 0 (0.0%) |
| Architecture & Engineering | 0 (0.0%) | 0 (0.0%) |
| Life, Physical & Social Science | 0 (0.0%) | 0 (0.0%) |
| Community & Social Service | 0 (0.0%) | 0 (0.0%) |
| Education, Arts & Media | 0 (0.0%) | 0 (0.0%) |
| Legal Services & Support | 0 (0.0%) | 0 (0.0%) |
| Education Instruction & Library | 0 (0.0%) | 0 (0.0%) |
| Arts, Media & Entertainment | 0 (0.0%) | 0 (0.0%) |
| Health Diagnosing & Treating | 0 (0.0%) | 0 (0.0%) |
| Health Technologists | 0 (0.0%) | 0 (0.0%) |
| Total (Category) | 3 (100.0%) | 0 (0.0%) |
| Total (Overall) | 3 (37.5%) | 5 (62.5%) |
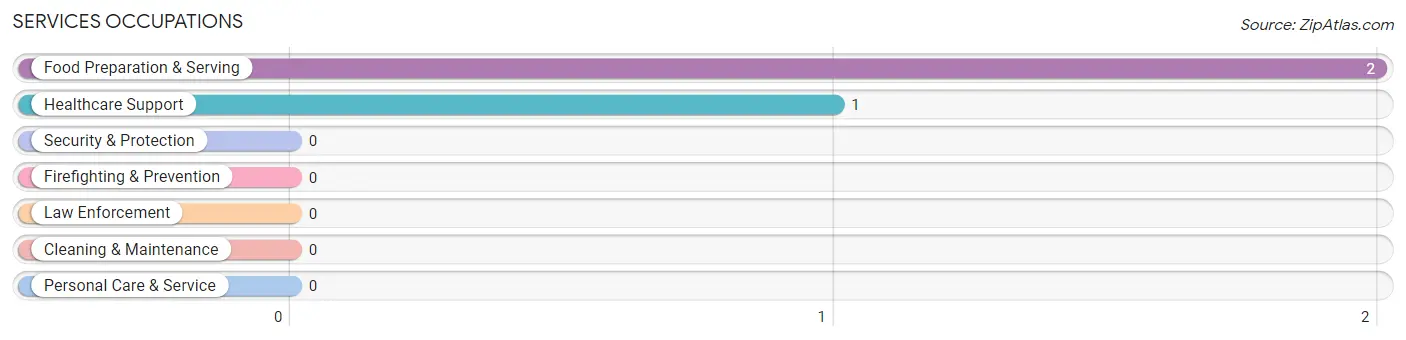
Services Occupations
The most common Services occupations in Kenneth are Food Preparation & Serving (2 | 25.0%), and Healthcare Support (1 | 12.5%).
Services Occupations by Sex
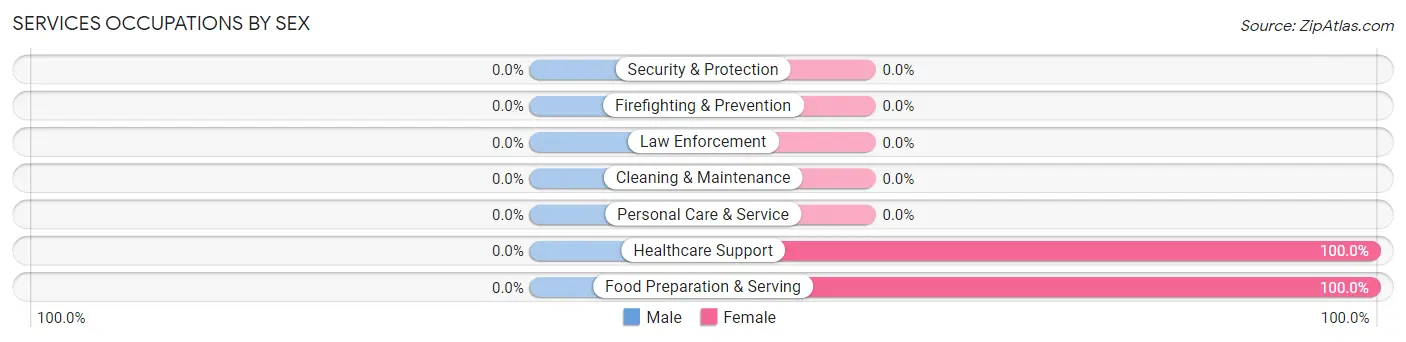
| Occupation | Male | Female |
| Healthcare Support | 0 (0.0%) | 1 (100.0%) |
| Security & Protection | 0 (0.0%) | 0 (0.0%) |
| Firefighting & Prevention | 0 (0.0%) | 0 (0.0%) |
| Law Enforcement | 0 (0.0%) | 0 (0.0%) |
| Food Preparation & Serving | 0 (0.0%) | 2 (100.0%) |
| Cleaning & Maintenance | 0 (0.0%) | 0 (0.0%) |
| Personal Care & Service | 0 (0.0%) | 0 (0.0%) |
| Total (Category) | 0 (0.0%) | 3 (100.0%) |
| Total (Overall) | 3 (37.5%) | 5 (62.5%) |
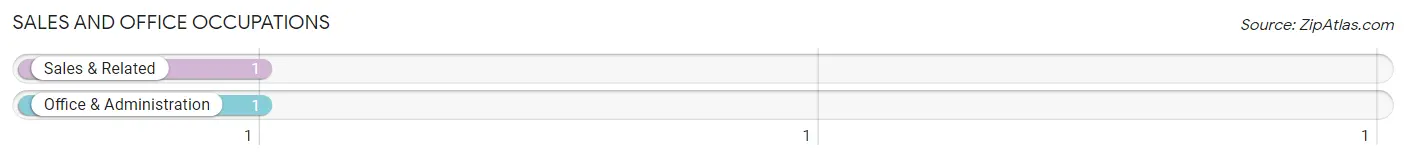
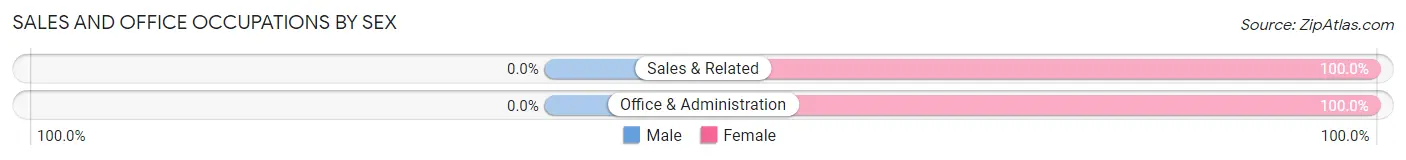
Sales and Office Occupations
The most common Sales and Office occupations in Kenneth are Sales & Related (1 | 12.5%), and Office & Administration (1 | 12.5%).
Sales and Office Occupations by Sex
| Occupation | Male | Female |
| Sales & Related | 0 (0.0%) | 1 (100.0%) |
| Office & Administration | 0 (0.0%) | 1 (100.0%) |
| Total (Category) | 0 (0.0%) | 2 (100.0%) |
| Total (Overall) | 3 (37.5%) | 5 (62.5%) |
Natural Resources, Construction and Maintenance Occupations
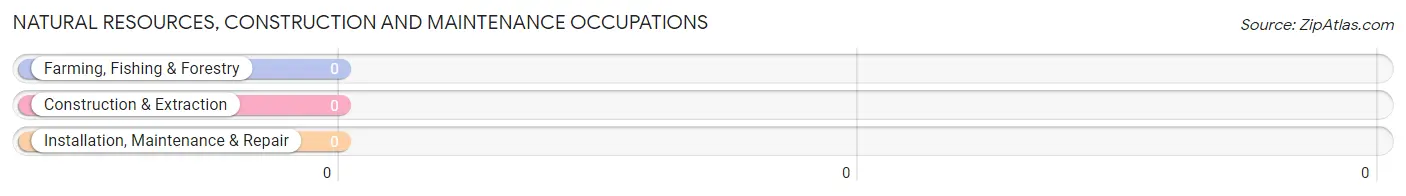
Natural Resources, Construction and Maintenance Occupations by Sex
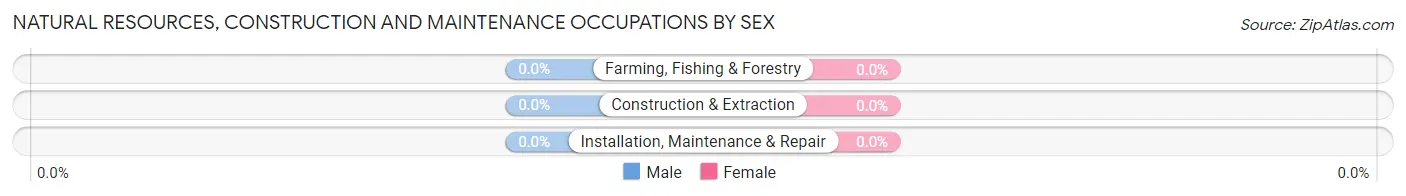
| Occupation | Male | Female |
| Farming, Fishing & Forestry | 0 (0.0%) | 0 (0.0%) |
| Construction & Extraction | 0 (0.0%) | 0 (0.0%) |
| Installation, Maintenance & Repair | 0 (0.0%) | 0 (0.0%) |
| Total (Category) | 0 (0.0%) | 0 (0.0%) |
| Total (Overall) | 3 (37.5%) | 5 (62.5%) |
Production, Transportation and Moving Occupations
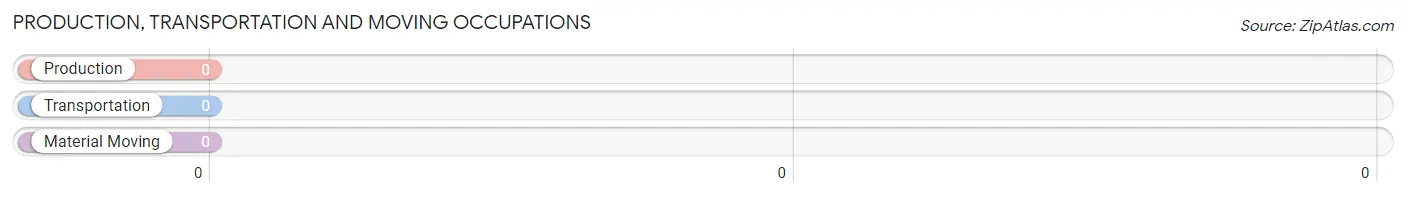
Production, Transportation and Moving Occupations by Sex
| Occupation | Male | Female |
| Production | 0 (0.0%) | 0 (0.0%) |
| Transportation | 0 (0.0%) | 0 (0.0%) |
| Material Moving | 0 (0.0%) | 0 (0.0%) |
| Total (Category) | 0 (0.0%) | 0 (0.0%) |
| Total (Overall) | 3 (37.5%) | 5 (62.5%) |
Employment Industries by Sex in Kenneth
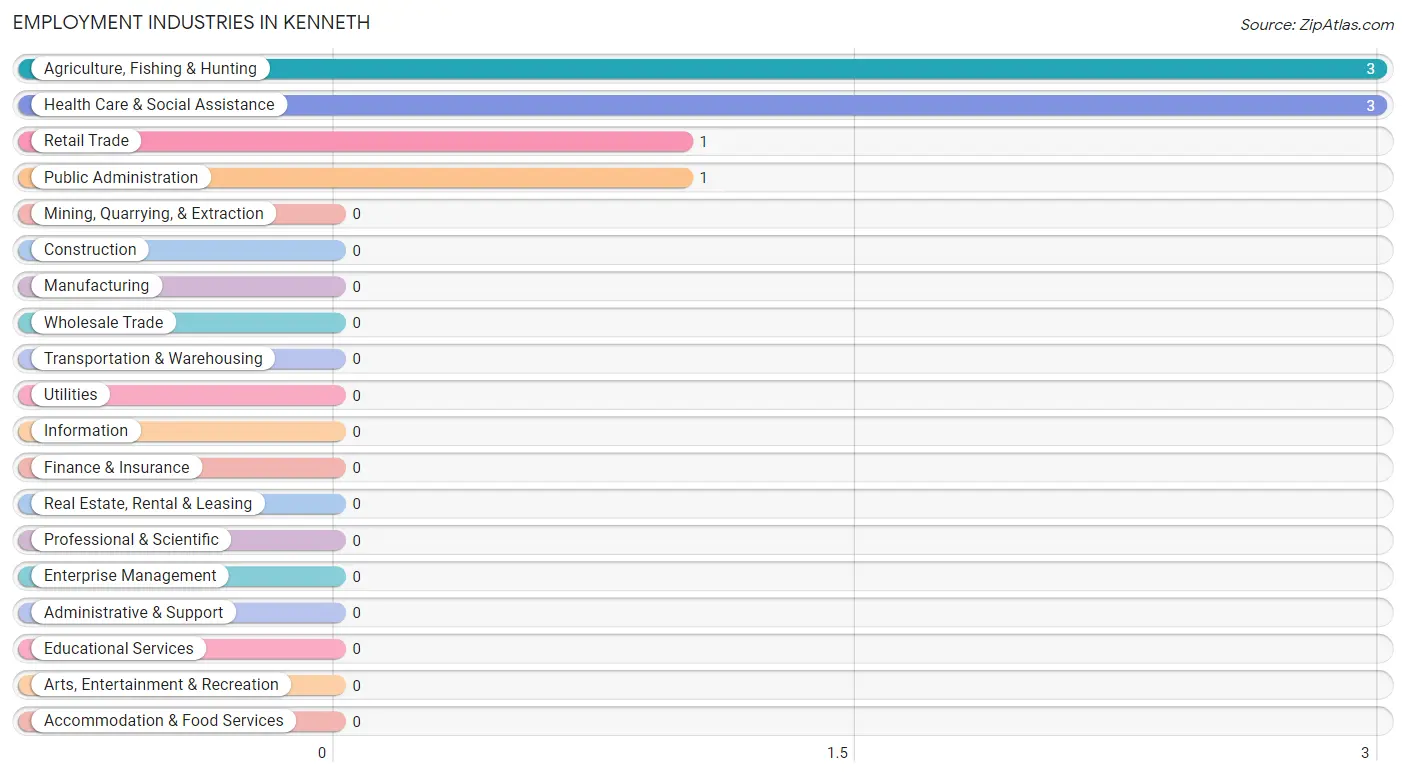
Employment Industries in Kenneth
The major employment industries in Kenneth include Agriculture, Fishing & Hunting (3 | 37.5%), Health Care & Social Assistance (3 | 37.5%), Retail Trade (1 | 12.5%), and Public Administration (1 | 12.5%).
Employment Industries by Sex in Kenneth
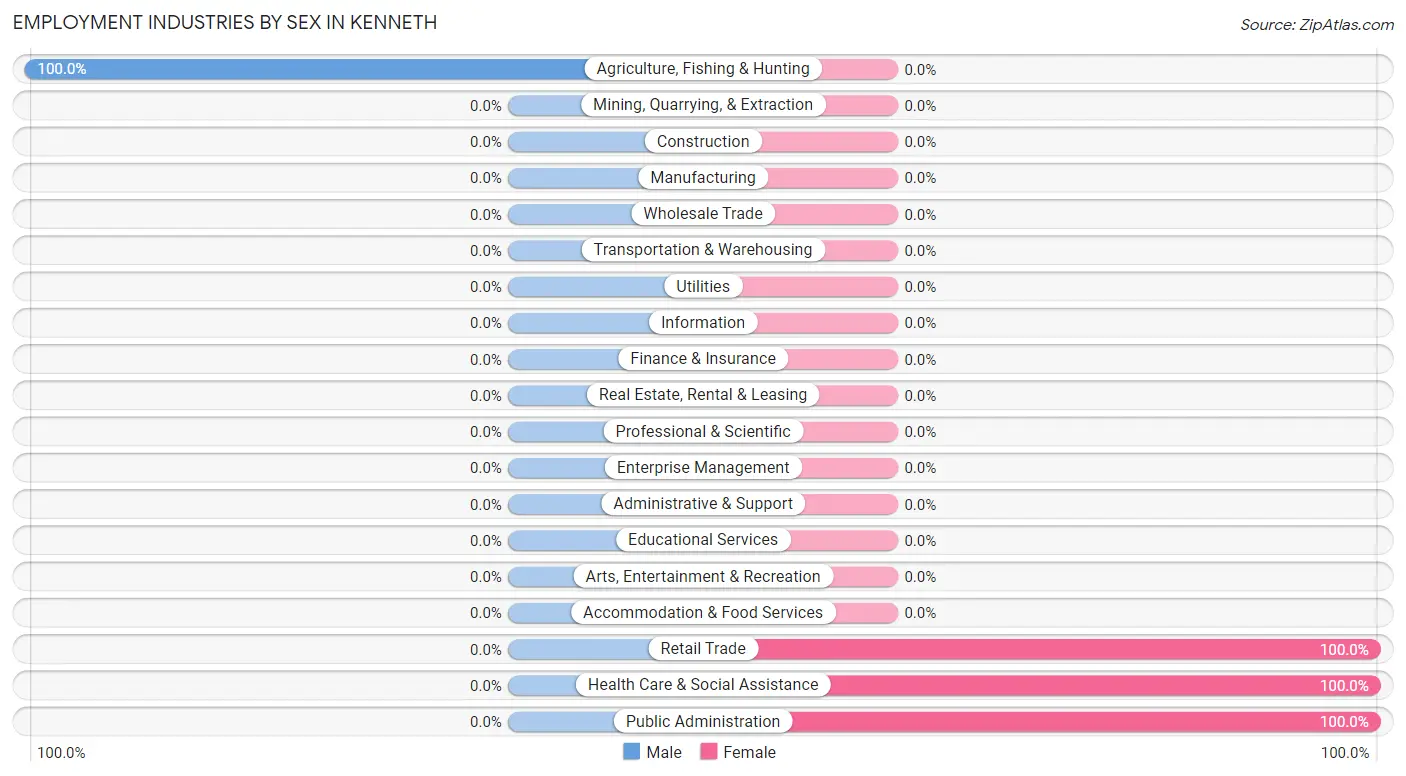
| Industry | Male | Female |
| Agriculture, Fishing & Hunting | 3 (100.0%) | 0 (0.0%) |
| Mining, Quarrying, & Extraction | 0 (0.0%) | 0 (0.0%) |
| Construction | 0 (0.0%) | 0 (0.0%) |
| Manufacturing | 0 (0.0%) | 0 (0.0%) |
| Wholesale Trade | 0 (0.0%) | 0 (0.0%) |
| Retail Trade | 0 (0.0%) | 1 (100.0%) |
| Transportation & Warehousing | 0 (0.0%) | 0 (0.0%) |
| Utilities | 0 (0.0%) | 0 (0.0%) |
| Information | 0 (0.0%) | 0 (0.0%) |
| Finance & Insurance | 0 (0.0%) | 0 (0.0%) |
| Real Estate, Rental & Leasing | 0 (0.0%) | 0 (0.0%) |
| Professional & Scientific | 0 (0.0%) | 0 (0.0%) |
| Enterprise Management | 0 (0.0%) | 0 (0.0%) |
| Administrative & Support | 0 (0.0%) | 0 (0.0%) |
| Educational Services | 0 (0.0%) | 0 (0.0%) |
| Health Care & Social Assistance | 0 (0.0%) | 3 (100.0%) |
| Arts, Entertainment & Recreation | 0 (0.0%) | 0 (0.0%) |
| Accommodation & Food Services | 0 (0.0%) | 0 (0.0%) |
| Public Administration | 0 (0.0%) | 1 (100.0%) |
| Total | 3 (37.5%) | 5 (62.5%) |
Education in Kenneth
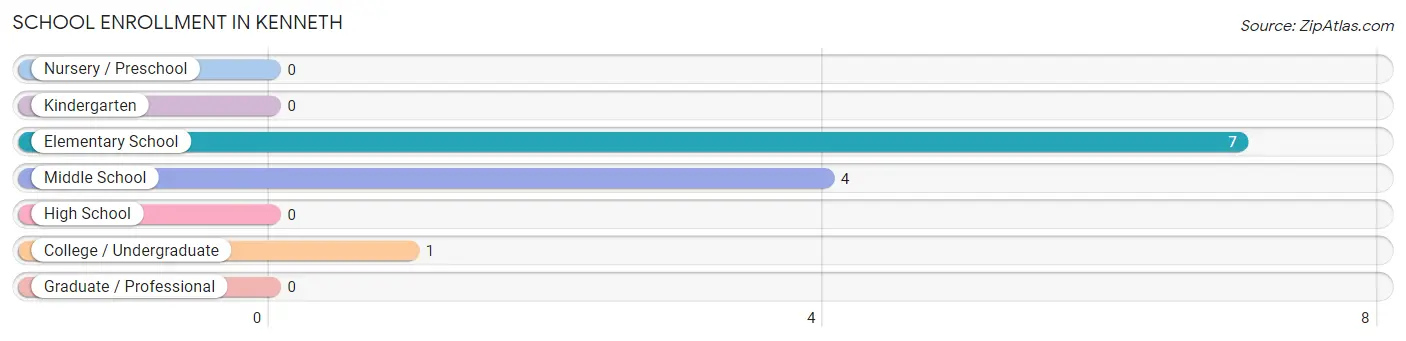
School Enrollment in Kenneth
The most common levels of schooling among the 12 students in Kenneth are elementary school (7 | 58.3%), middle school (4 | 33.3%), and college / undergraduate (1 | 8.3%).
| School Level | # Students | % Students |
| Nursery / Preschool | 0 | 0.0% |
| Kindergarten | 0 | 0.0% |
| Elementary School | 7 | 58.3% |
| Middle School | 4 | 33.3% |
| High School | 0 | 0.0% |
| College / Undergraduate | 1 | 8.3% |
| Graduate / Professional | 0 | 0.0% |
| Total | 12 | 100.0% |
School Enrollment by Age by Funding Source in Kenneth
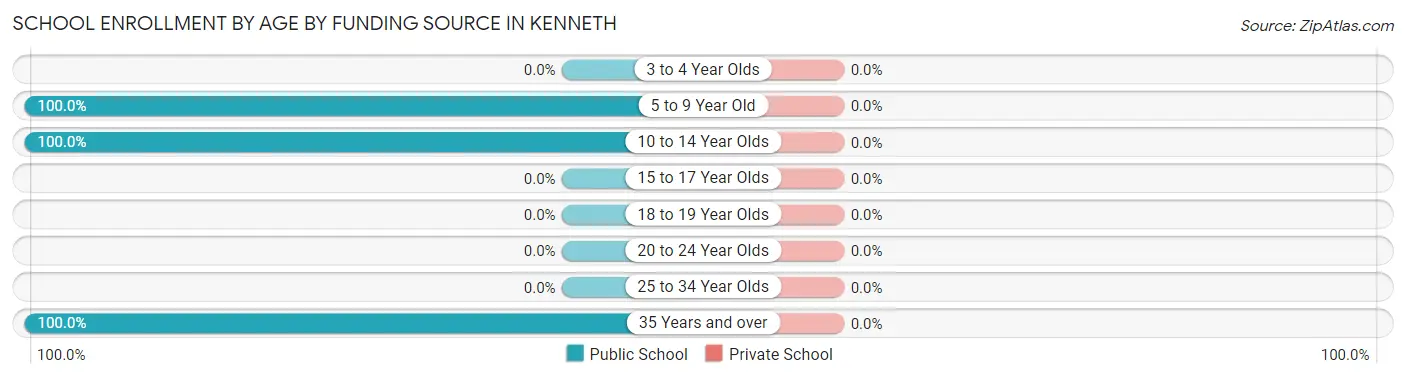
| Age Bracket | Public School | Private School |
| 3 to 4 Year Olds | 0 (0.0%) | 0 (0.0%) |
| 5 to 9 Year Old | 4 (100.0%) | 0 (0.0%) |
| 10 to 14 Year Olds | 7 (100.0%) | 0 (0.0%) |
| 15 to 17 Year Olds | 0 (0.0%) | 0 (0.0%) |
| 18 to 19 Year Olds | 0 (0.0%) | 0 (0.0%) |
| 20 to 24 Year Olds | 0 (0.0%) | 0 (0.0%) |
| 25 to 34 Year Olds | 0 (0.0%) | 0 (0.0%) |
| 35 Years and over | 1 (100.0%) | 0 (0.0%) |
| Total | 12 (100.0%) | 0 (0.0%) |
Educational Attainment by Field of Study in Kenneth
, and bio, nature & agricultural (1 | 100.0%) are the most common fields of study among 1 individuals in Kenneth who have obtained a bachelor's degree or higher.
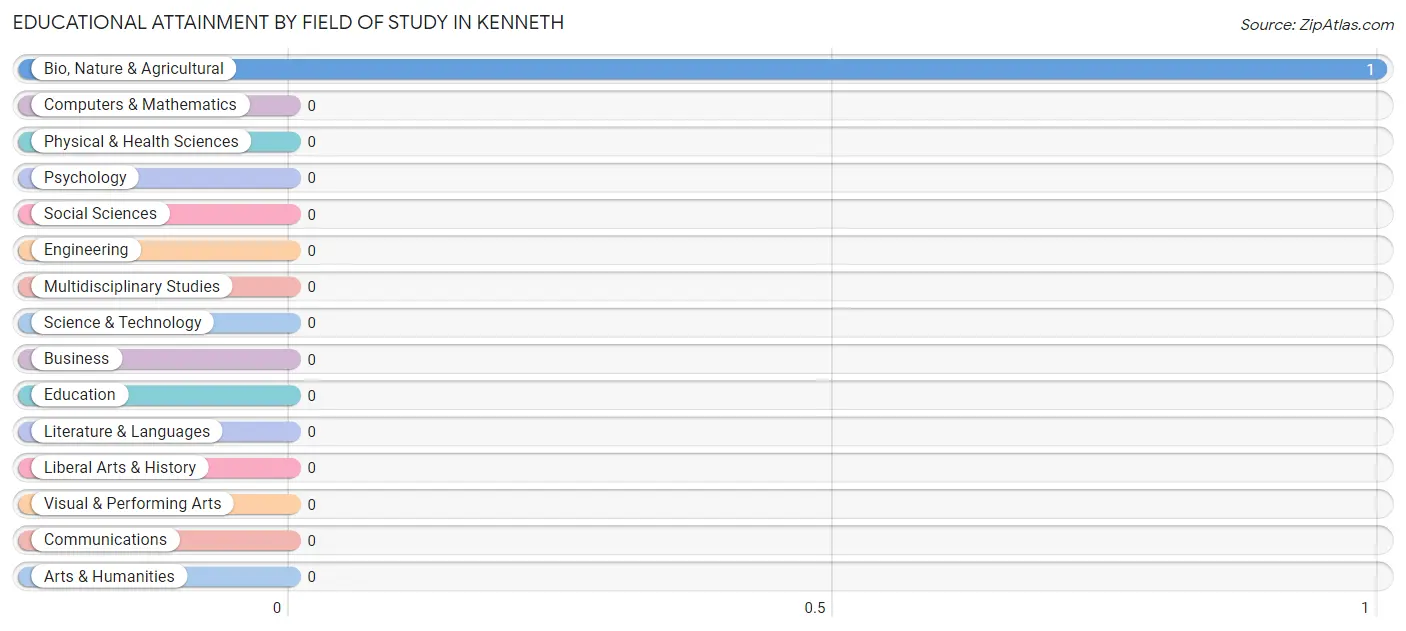
| Field of Study | # Graduates | % Graduates |
| Computers & Mathematics | 0 | 0.0% |
| Bio, Nature & Agricultural | 1 | 100.0% |
| Physical & Health Sciences | 0 | 0.0% |
| Psychology | 0 | 0.0% |
| Social Sciences | 0 | 0.0% |
| Engineering | 0 | 0.0% |
| Multidisciplinary Studies | 0 | 0.0% |
| Science & Technology | 0 | 0.0% |
| Business | 0 | 0.0% |
| Education | 0 | 0.0% |
| Literature & Languages | 0 | 0.0% |
| Liberal Arts & History | 0 | 0.0% |
| Visual & Performing Arts | 0 | 0.0% |
| Communications | 0 | 0.0% |
| Arts & Humanities | 0 | 0.0% |
| Total | 1 | 100.0% |
Transportation & Commute in Kenneth
Vehicle Availability by Sex in Kenneth
The most prevalent vehicle ownership categories in Kenneth are males with 4 vehicles (3, accounting for 100.0%) and females with 4 vehicles (2, making up 60.0%).
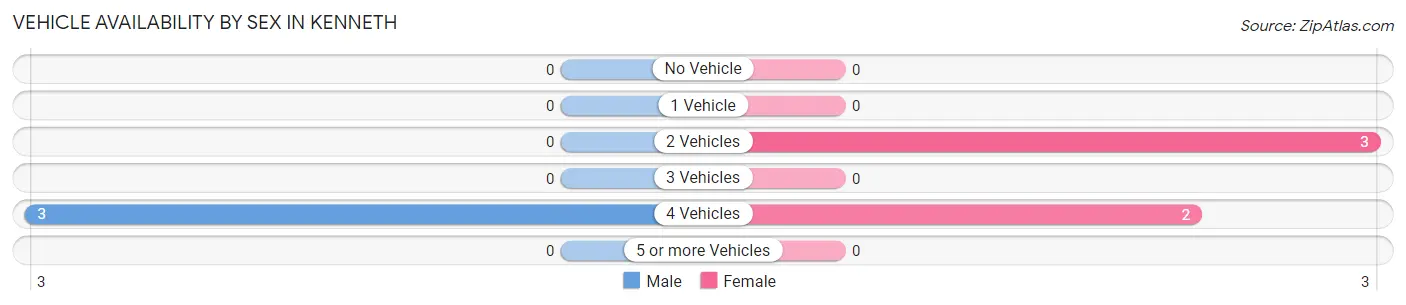
| Vehicles Available | Male | Female |
| No Vehicle | 0 (0.0%) | 0 (0.0%) |
| 1 Vehicle | 0 (0.0%) | 0 (0.0%) |
| 2 Vehicles | 0 (0.0%) | 3 (60.0%) |
| 3 Vehicles | 0 (0.0%) | 0 (0.0%) |
| 4 Vehicles | 3 (100.0%) | 2 (40.0%) |
| 5 or more Vehicles | 0 (0.0%) | 0 (0.0%) |
| Total | 3 (100.0%) | 5 (100.0%) |
Commute Time in Kenneth
The most frequently occuring commute durations in Kenneth are 10 to 14 minutes (3 commuters, 37.5%), 15 to 19 minutes (2 commuters, 25.0%), and less than 5 minutes (1 commuters, 12.5%).
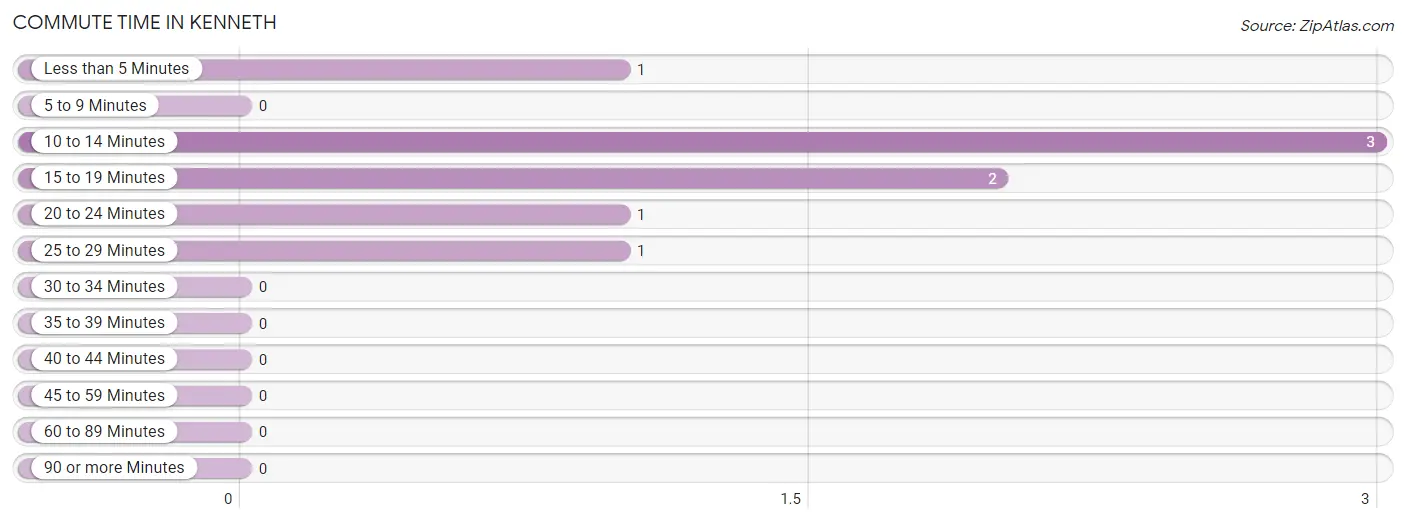
| Commute Time | # Commuters | % Commuters |
| Less than 5 Minutes | 1 | 12.5% |
| 5 to 9 Minutes | 0 | 0.0% |
| 10 to 14 Minutes | 3 | 37.5% |
| 15 to 19 Minutes | 2 | 25.0% |
| 20 to 24 Minutes | 1 | 12.5% |
| 25 to 29 Minutes | 1 | 12.5% |
| 30 to 34 Minutes | 0 | 0.0% |
| 35 to 39 Minutes | 0 | 0.0% |
| 40 to 44 Minutes | 0 | 0.0% |
| 45 to 59 Minutes | 0 | 0.0% |
| 60 to 89 Minutes | 0 | 0.0% |
| 90 or more Minutes | 0 | 0.0% |
Commute Time by Sex in Kenneth
The most common commute times in Kenneth are 10 to 14 minutes (3 commuters, 100.0%) for males and 15 to 19 minutes (2 commuters, 40.0%) for females.
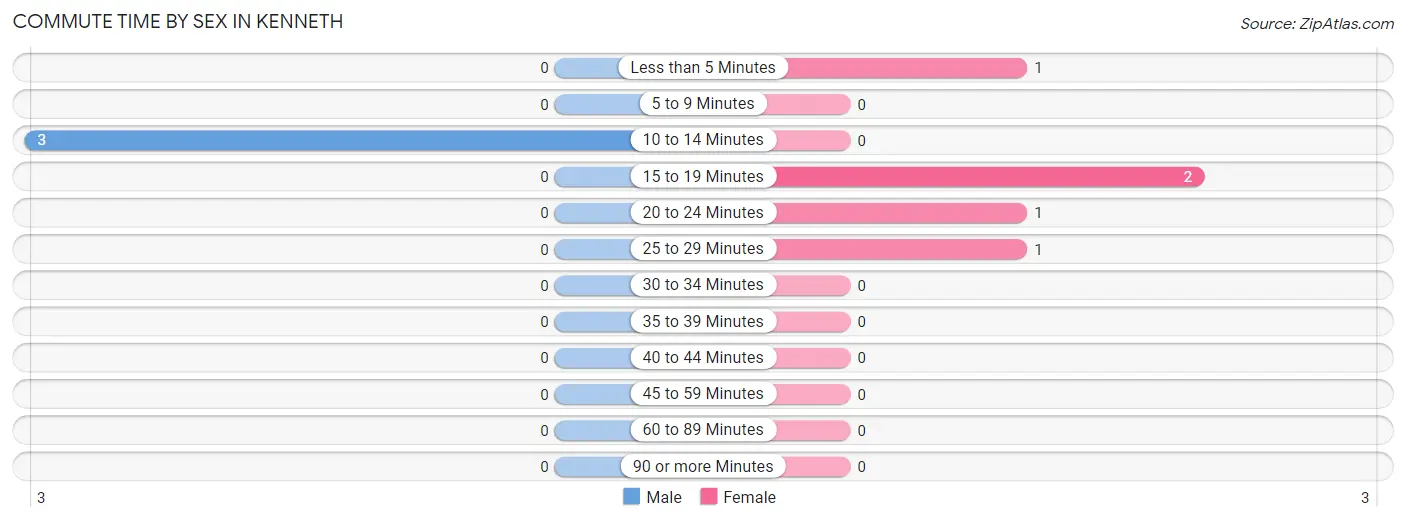
| Commute Time | Male | Female |
| Less than 5 Minutes | 0 (0.0%) | 1 (20.0%) |
| 5 to 9 Minutes | 0 (0.0%) | 0 (0.0%) |
| 10 to 14 Minutes | 3 (100.0%) | 0 (0.0%) |
| 15 to 19 Minutes | 0 (0.0%) | 2 (40.0%) |
| 20 to 24 Minutes | 0 (0.0%) | 1 (20.0%) |
| 25 to 29 Minutes | 0 (0.0%) | 1 (20.0%) |
| 30 to 34 Minutes | 0 (0.0%) | 0 (0.0%) |
| 35 to 39 Minutes | 0 (0.0%) | 0 (0.0%) |
| 40 to 44 Minutes | 0 (0.0%) | 0 (0.0%) |
| 45 to 59 Minutes | 0 (0.0%) | 0 (0.0%) |
| 60 to 89 Minutes | 0 (0.0%) | 0 (0.0%) |
| 90 or more Minutes | 0 (0.0%) | 0 (0.0%) |
Time of Departure to Work by Sex in Kenneth
The most frequent times of departure to work in Kenneth are 8:00 AM to 8:29 AM (2, 66.7%) for males and 10:00 AM to 10:59 AM (2, 40.0%) for females.
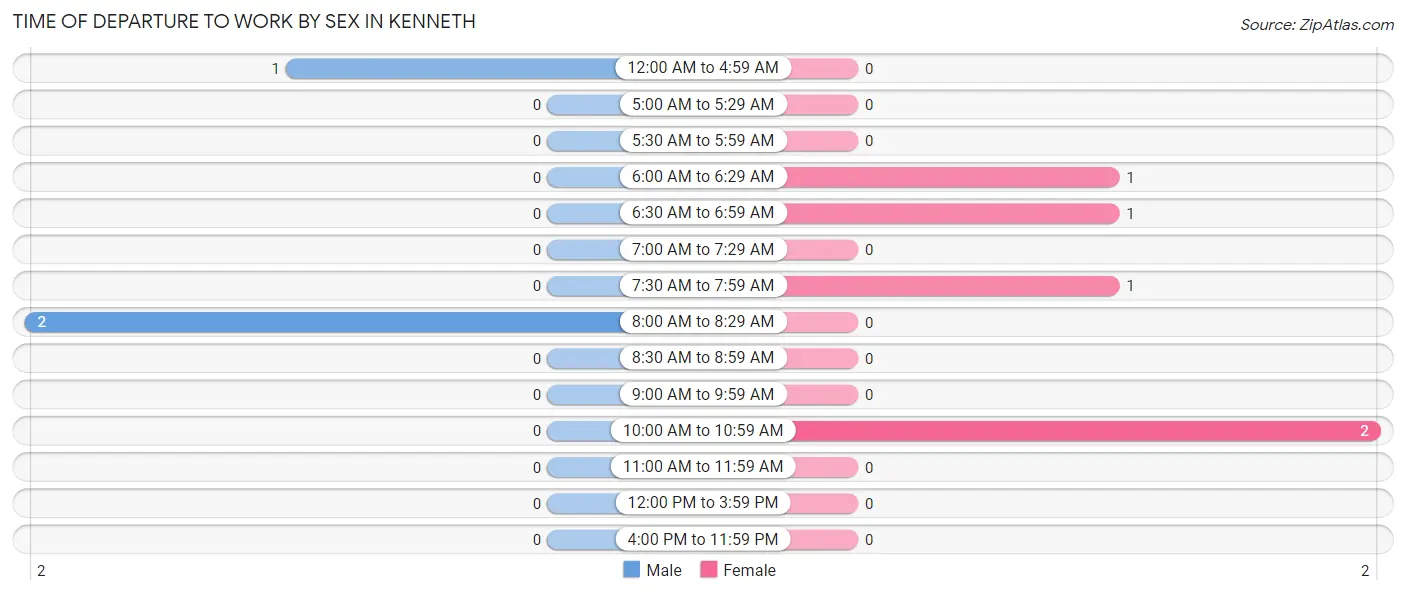
| Time of Departure | Male | Female |
| 12:00 AM to 4:59 AM | 1 (33.3%) | 0 (0.0%) |
| 5:00 AM to 5:29 AM | 0 (0.0%) | 0 (0.0%) |
| 5:30 AM to 5:59 AM | 0 (0.0%) | 0 (0.0%) |
| 6:00 AM to 6:29 AM | 0 (0.0%) | 1 (20.0%) |
| 6:30 AM to 6:59 AM | 0 (0.0%) | 1 (20.0%) |
| 7:00 AM to 7:29 AM | 0 (0.0%) | 0 (0.0%) |
| 7:30 AM to 7:59 AM | 0 (0.0%) | 1 (20.0%) |
| 8:00 AM to 8:29 AM | 2 (66.7%) | 0 (0.0%) |
| 8:30 AM to 8:59 AM | 0 (0.0%) | 0 (0.0%) |
| 9:00 AM to 9:59 AM | 0 (0.0%) | 0 (0.0%) |
| 10:00 AM to 10:59 AM | 0 (0.0%) | 2 (40.0%) |
| 11:00 AM to 11:59 AM | 0 (0.0%) | 0 (0.0%) |
| 12:00 PM to 3:59 PM | 0 (0.0%) | 0 (0.0%) |
| 4:00 PM to 11:59 PM | 0 (0.0%) | 0 (0.0%) |
| Total | 3 (100.0%) | 5 (100.0%) |
Housing Occupancy in Kenneth
Occupancy by Ownership in Kenneth
Of the total 18 dwellings in Kenneth, owner-occupied units account for 18 (100.0%), while renter-occupied units make up 0 (0.0%).
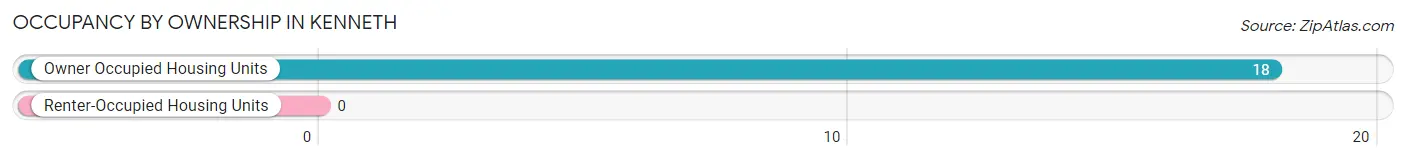
| Occupancy | # Housing Units | % Housing Units |
| Owner Occupied Housing Units | 18 | 100.0% |
| Renter-Occupied Housing Units | 0 | 0.0% |
| Total Occupied Housing Units | 18 | 100.0% |
Occupancy by Household Size in Kenneth
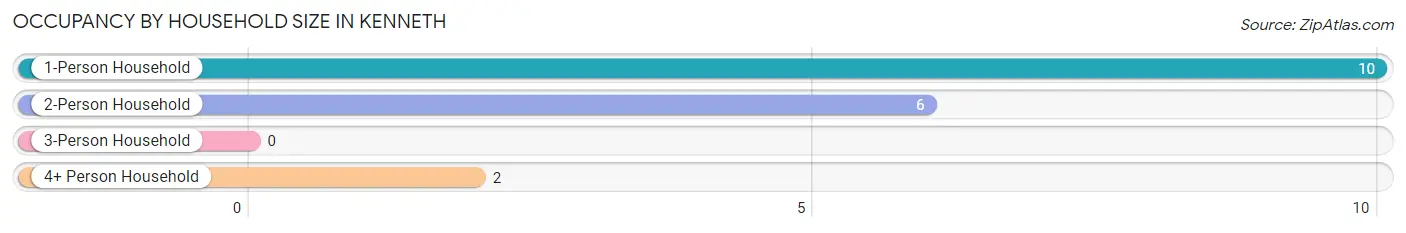
| Household Size | # Housing Units | % Housing Units |
| 1-Person Household | 10 | 55.6% |
| 2-Person Household | 6 | 33.3% |
| 3-Person Household | 0 | 0.0% |
| 4+ Person Household | 2 | 11.1% |
| Total Housing Units | 18 | 100.0% |
Occupancy by Ownership by Household Size in Kenneth
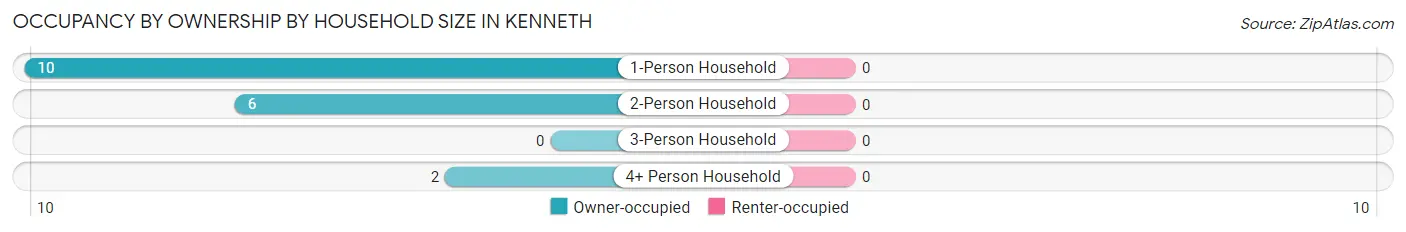
| Household Size | Owner-occupied | Renter-occupied |
| 1-Person Household | 10 (100.0%) | 0 (0.0%) |
| 2-Person Household | 6 (100.0%) | 0 (0.0%) |
| 3-Person Household | 0 (0.0%) | 0 (0.0%) |
| 4+ Person Household | 2 (100.0%) | 0 (0.0%) |
| Total Housing Units | 18 (100.0%) | 0 (0.0%) |
Occupancy by Educational Attainment in Kenneth
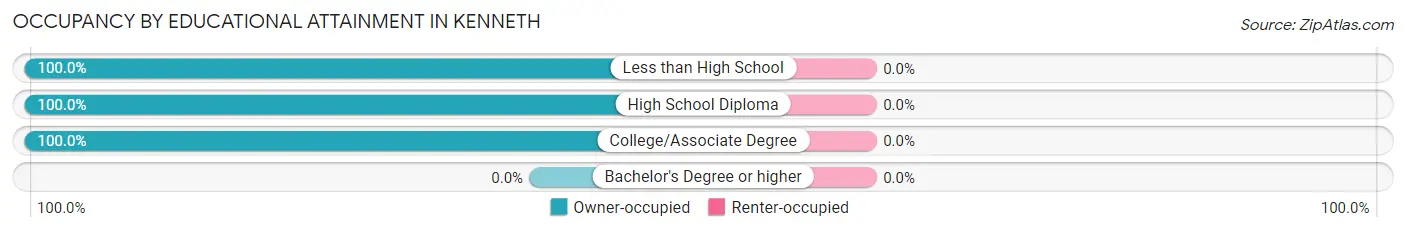
| Household Size | Owner-occupied | Renter-occupied |
| Less than High School | 5 (100.0%) | 0 (0.0%) |
| High School Diploma | 11 (100.0%) | 0 (0.0%) |
| College/Associate Degree | 2 (100.0%) | 0 (0.0%) |
| Bachelor's Degree or higher | 0 (0.0%) | 0 (0.0%) |
Occupancy by Age of Householder in Kenneth
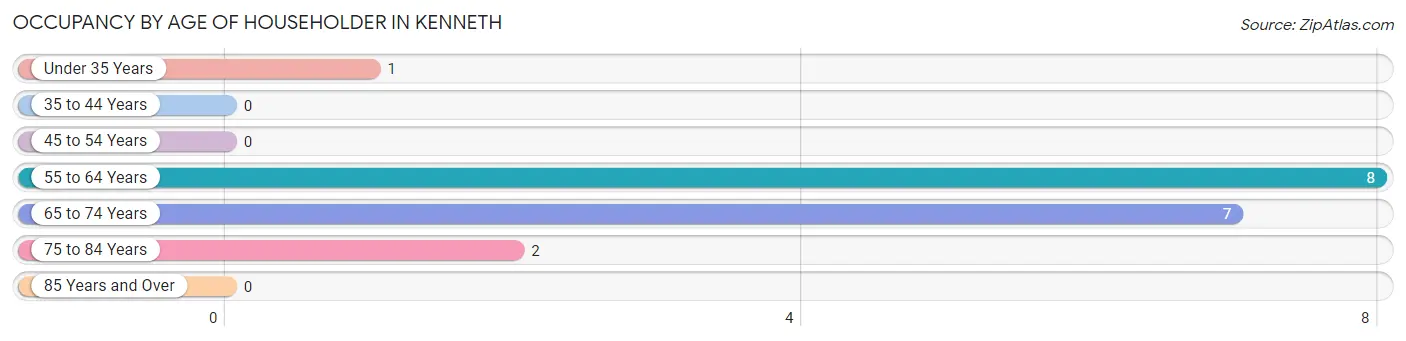
| Age Bracket | # Households | % Households |
| Under 35 Years | 1 | 5.6% |
| 35 to 44 Years | 0 | 0.0% |
| 45 to 54 Years | 0 | 0.0% |
| 55 to 64 Years | 8 | 44.4% |
| 65 to 74 Years | 7 | 38.9% |
| 75 to 84 Years | 2 | 11.1% |
| 85 Years and Over | 0 | 0.0% |
| Total | 18 | 100.0% |
Housing Finances in Kenneth
Median Income by Occupancy in Kenneth
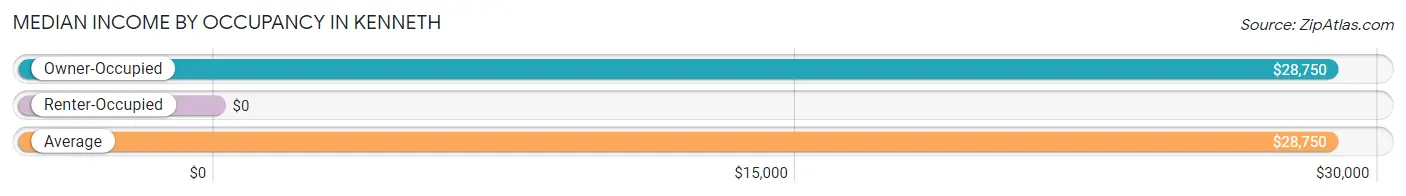
| Occupancy Type | # Households | Median Income |
| Owner-Occupied | 18 (100.0%) | $28,750 |
| Renter-Occupied | 0 (0.0%) | $0 |
| Average | 18 (100.0%) | $28,750 |
Occupancy by Householder Income Bracket in Kenneth
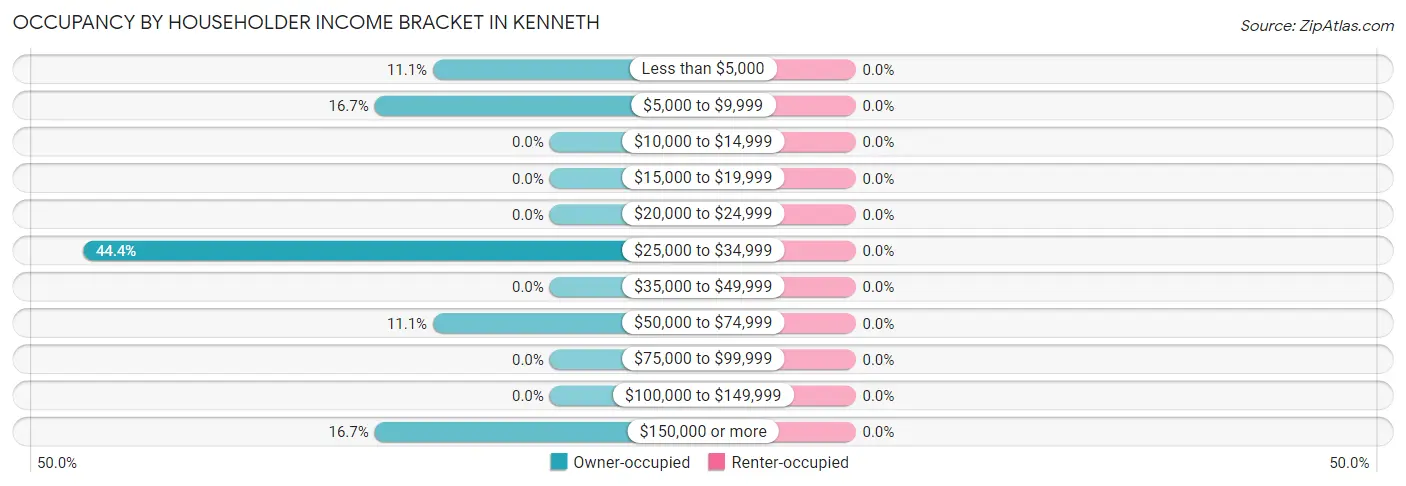
| Income Bracket | Owner-occupied | Renter-occupied |
| Less than $5,000 | 2 (11.1%) | 0 (0.0%) |
| $5,000 to $9,999 | 3 (16.7%) | 0 (0.0%) |
| $10,000 to $14,999 | 0 (0.0%) | 0 (0.0%) |
| $15,000 to $19,999 | 0 (0.0%) | 0 (0.0%) |
| $20,000 to $24,999 | 0 (0.0%) | 0 (0.0%) |
| $25,000 to $34,999 | 8 (44.4%) | 0 (0.0%) |
| $35,000 to $49,999 | 0 (0.0%) | 0 (0.0%) |
| $50,000 to $74,999 | 2 (11.1%) | 0 (0.0%) |
| $75,000 to $99,999 | 0 (0.0%) | 0 (0.0%) |
| $100,000 to $149,999 | 0 (0.0%) | 0 (0.0%) |
| $150,000 or more | 3 (16.7%) | 0 (0.0%) |
| Total | 18 (100.0%) | 0 (0.0%) |
Monthly Housing Cost Tiers in Kenneth
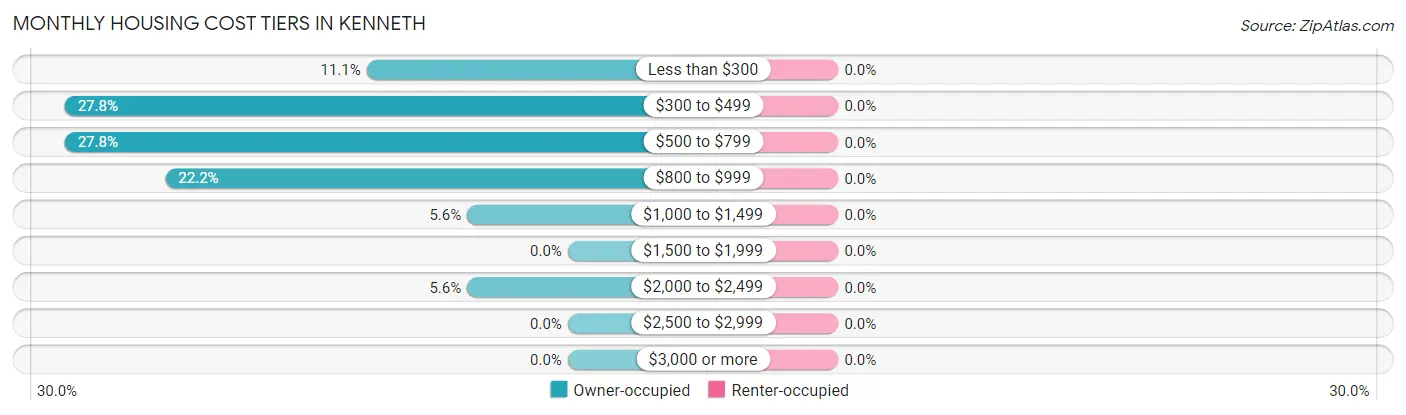
| Monthly Cost | Owner-occupied | Renter-occupied |
| Less than $300 | 2 (11.1%) | 0 (0.0%) |
| $300 to $499 | 5 (27.8%) | 0 (0.0%) |
| $500 to $799 | 5 (27.8%) | 0 (0.0%) |
| $800 to $999 | 4 (22.2%) | 0 (0.0%) |
| $1,000 to $1,499 | 1 (5.6%) | 0 (0.0%) |
| $1,500 to $1,999 | 0 (0.0%) | 0 (0.0%) |
| $2,000 to $2,499 | 1 (5.6%) | 0 (0.0%) |
| $2,500 to $2,999 | 0 (0.0%) | 0 (0.0%) |
| $3,000 or more | 0 (0.0%) | 0 (0.0%) |
| Total | 18 (100.0%) | 0 (0.0%) |
Physical Housing Characteristics in Kenneth
Housing Structures in Kenneth
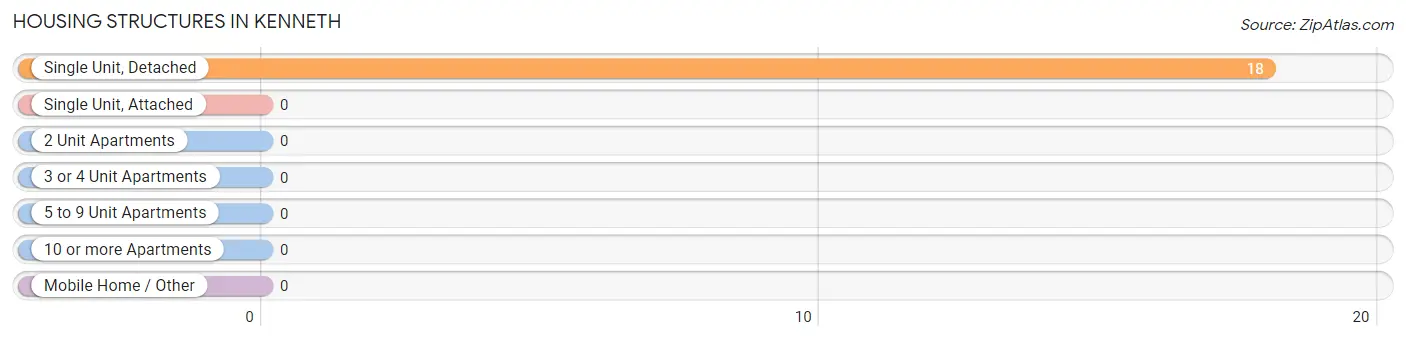
| Structure Type | # Housing Units | % Housing Units |
| Single Unit, Detached | 18 | 100.0% |
| Single Unit, Attached | 0 | 0.0% |
| 2 Unit Apartments | 0 | 0.0% |
| 3 or 4 Unit Apartments | 0 | 0.0% |
| 5 to 9 Unit Apartments | 0 | 0.0% |
| 10 or more Apartments | 0 | 0.0% |
| Mobile Home / Other | 0 | 0.0% |
| Total | 18 | 100.0% |
Housing Structures by Occupancy in Kenneth
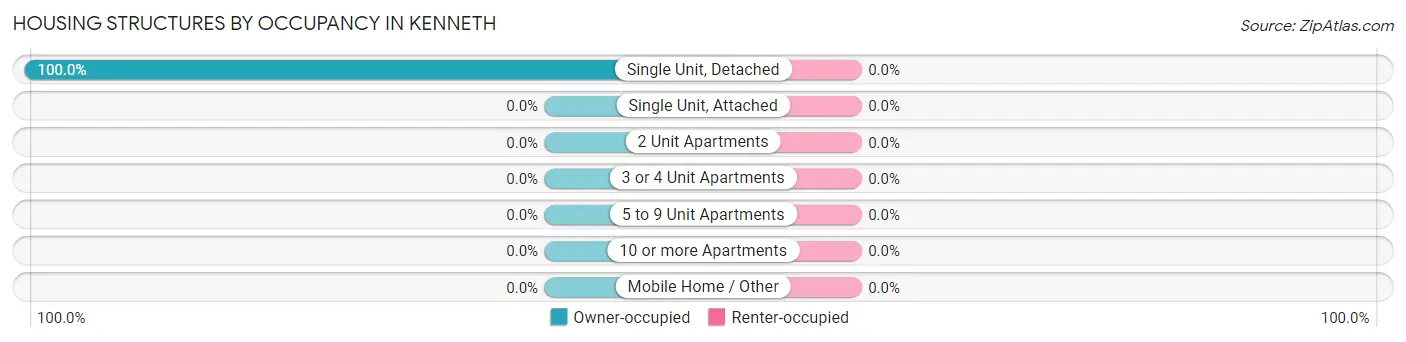
| Structure Type | Owner-occupied | Renter-occupied |
| Single Unit, Detached | 18 (100.0%) | 0 (0.0%) |
| Single Unit, Attached | 0 (0.0%) | 0 (0.0%) |
| 2 Unit Apartments | 0 (0.0%) | 0 (0.0%) |
| 3 or 4 Unit Apartments | 0 (0.0%) | 0 (0.0%) |
| 5 to 9 Unit Apartments | 0 (0.0%) | 0 (0.0%) |
| 10 or more Apartments | 0 (0.0%) | 0 (0.0%) |
| Mobile Home / Other | 0 (0.0%) | 0 (0.0%) |
| Total | 18 (100.0%) | 0 (0.0%) |
Housing Structures by Number of Rooms in Kenneth
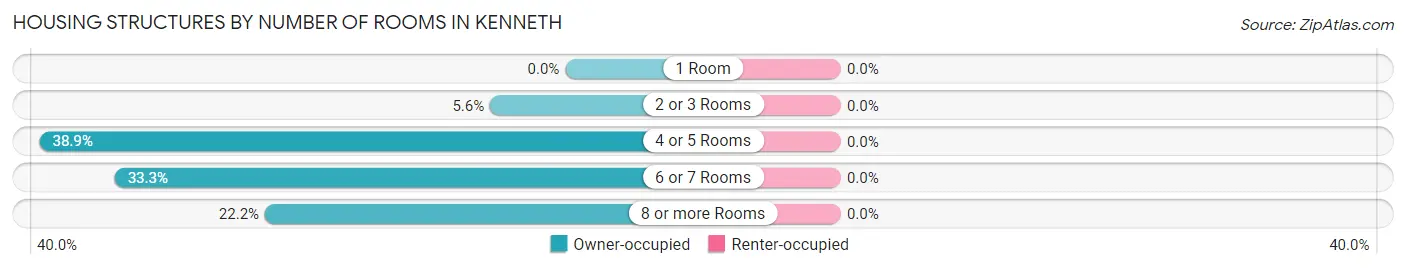
| Number of Rooms | Owner-occupied | Renter-occupied |
| 1 Room | 0 (0.0%) | 0 (0.0%) |
| 2 or 3 Rooms | 1 (5.6%) | 0 (0.0%) |
| 4 or 5 Rooms | 7 (38.9%) | 0 (0.0%) |
| 6 or 7 Rooms | 6 (33.3%) | 0 (0.0%) |
| 8 or more Rooms | 4 (22.2%) | 0 (0.0%) |
| Total | 18 (100.0%) | 0 (0.0%) |
Housing Structure by Heating Type in Kenneth
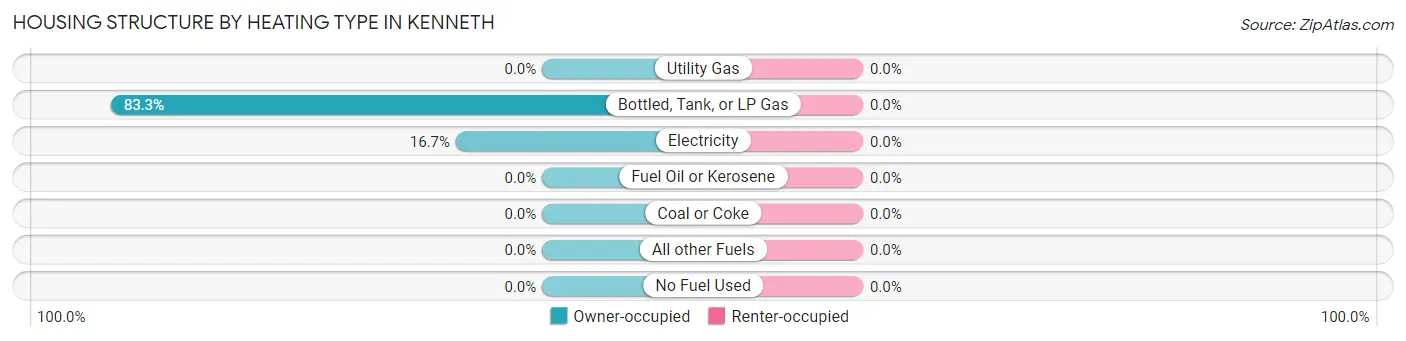
| Heating Type | Owner-occupied | Renter-occupied |
| Utility Gas | 0 (0.0%) | 0 (0.0%) |
| Bottled, Tank, or LP Gas | 15 (83.3%) | 0 (0.0%) |
| Electricity | 3 (16.7%) | 0 (0.0%) |
| Fuel Oil or Kerosene | 0 (0.0%) | 0 (0.0%) |
| Coal or Coke | 0 (0.0%) | 0 (0.0%) |
| All other Fuels | 0 (0.0%) | 0 (0.0%) |
| No Fuel Used | 0 (0.0%) | 0 (0.0%) |
| Total | 18 (100.0%) | 0 (0.0%) |
Household Vehicle Usage in Kenneth
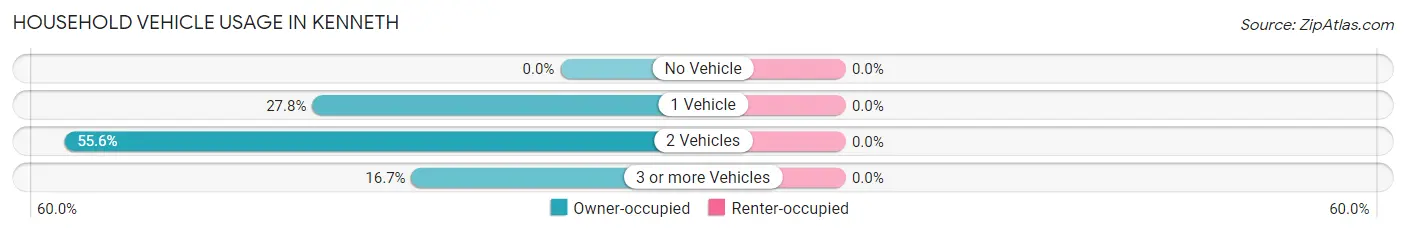
| Vehicles per Household | Owner-occupied | Renter-occupied |
| No Vehicle | 0 (0.0%) | 0 (0.0%) |
| 1 Vehicle | 5 (27.8%) | 0 (0.0%) |
| 2 Vehicles | 10 (55.6%) | 0 (0.0%) |
| 3 or more Vehicles | 3 (16.7%) | 0 (0.0%) |
| Total | 18 (100.0%) | 0 (0.0%) |
Real Estate & Mortgages in Kenneth
Real Estate and Mortgage Overview in Kenneth
| Characteristic | Without Mortgage | With Mortgage |
| Housing Units | 14 | 4 |
| Median Property Value | $42,000 | $0 |
| Median Household Income | $29,375 | $0 |
| Monthly Housing Costs | $567 | $0 |
| Real Estate Taxes | $333 | $1 |
Property Value by Mortgage Status in Kenneth
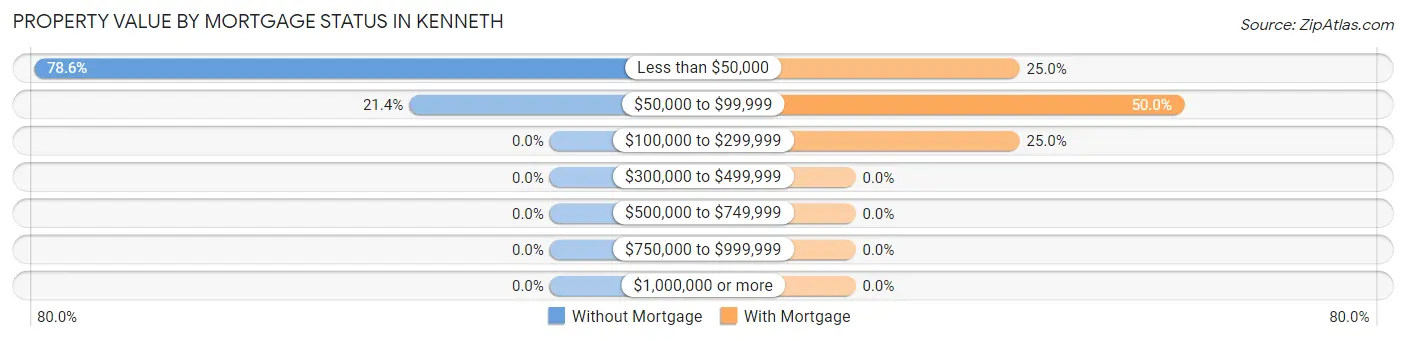
| Property Value | Without Mortgage | With Mortgage |
| Less than $50,000 | 11 (78.6%) | 1 (25.0%) |
| $50,000 to $99,999 | 3 (21.4%) | 2 (50.0%) |
| $100,000 to $299,999 | 0 (0.0%) | 1 (25.0%) |
| $300,000 to $499,999 | 0 (0.0%) | 0 (0.0%) |
| $500,000 to $749,999 | 0 (0.0%) | 0 (0.0%) |
| $750,000 to $999,999 | 0 (0.0%) | 0 (0.0%) |
| $1,000,000 or more | 0 (0.0%) | 0 (0.0%) |
| Total | 14 (100.0%) | 4 (100.0%) |
Household Income by Mortgage Status in Kenneth
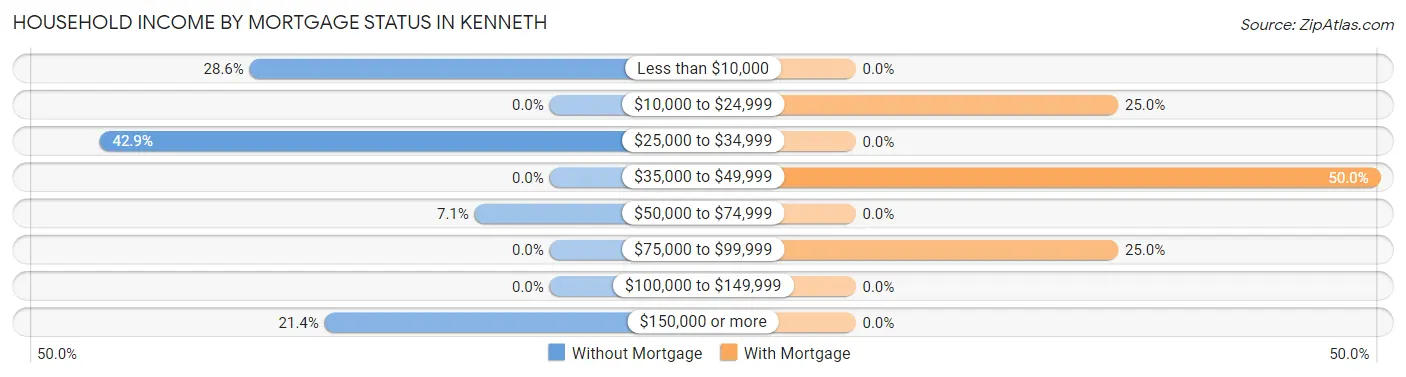
| Household Income | Without Mortgage | With Mortgage |
| Less than $10,000 | 4 (28.6%) | 0 (0.0%) |
| $10,000 to $24,999 | 0 (0.0%) | 1 (25.0%) |
| $25,000 to $34,999 | 6 (42.9%) | 0 (0.0%) |
| $35,000 to $49,999 | 0 (0.0%) | 2 (50.0%) |
| $50,000 to $74,999 | 1 (7.1%) | 0 (0.0%) |
| $75,000 to $99,999 | 0 (0.0%) | 1 (25.0%) |
| $100,000 to $149,999 | 0 (0.0%) | 0 (0.0%) |
| $150,000 or more | 3 (21.4%) | 0 (0.0%) |
| Total | 14 (100.0%) | 4 (100.0%) |
Property Value to Household Income Ratio in Kenneth
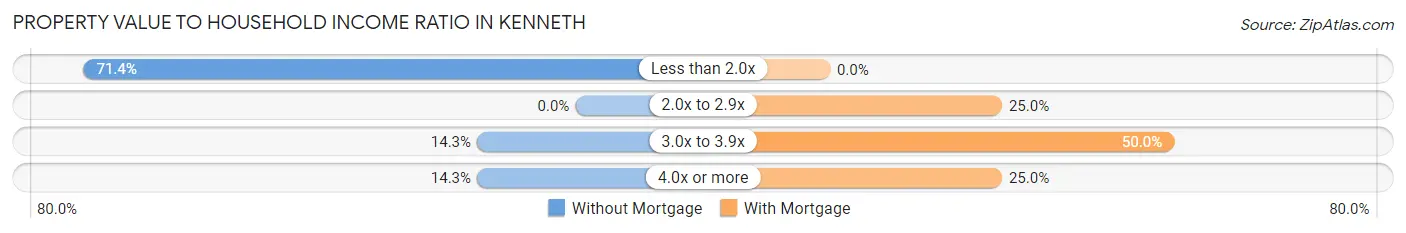
| Value-to-Income Ratio | Without Mortgage | With Mortgage |
| Less than 2.0x | 10 (71.4%) | 0 (0.0%) |
| 2.0x to 2.9x | 0 (0.0%) | 1 (25.0%) |
| 3.0x to 3.9x | 2 (14.3%) | 2 (50.0%) |
| 4.0x or more | 2 (14.3%) | 1 (25.0%) |
| Total | 14 (100.0%) | 4 (100.0%) |
Real Estate Taxes by Mortgage Status in Kenneth
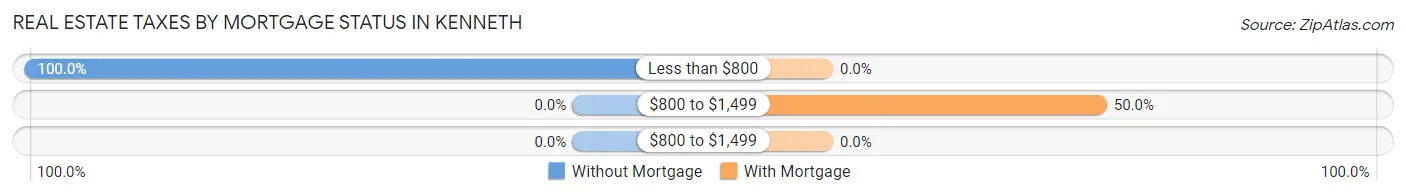
| Property Taxes | Without Mortgage | With Mortgage |
| Less than $800 | 14 (100.0%) | 0 (0.0%) |
| $800 to $1,499 | 0 (0.0%) | 2 (50.0%) |
| $800 to $1,499 | 0 (0.0%) | 0 (0.0%) |
| Total | 14 (100.0%) | 4 (100.0%) |
Health & Disability in Kenneth
Health Insurance Coverage by Age in Kenneth
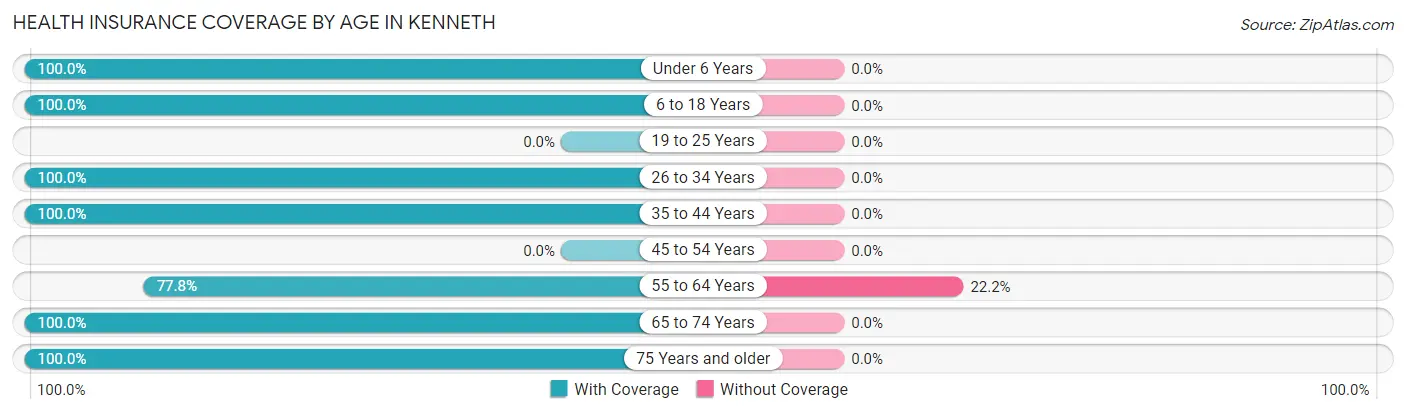
| Age Bracket | With Coverage | Without Coverage |
| Under 6 Years | 29 (100.0%) | 0 (0.0%) |
| 6 to 18 Years | 11 (100.0%) | 0 (0.0%) |
| 19 to 25 Years | 0 (0.0%) | 0 (0.0%) |
| 26 to 34 Years | 3 (100.0%) | 0 (0.0%) |
| 35 to 44 Years | 1 (100.0%) | 0 (0.0%) |
| 45 to 54 Years | 0 (0.0%) | 0 (0.0%) |
| 55 to 64 Years | 7 (77.8%) | 2 (22.2%) |
| 65 to 74 Years | 8 (100.0%) | 0 (0.0%) |
| 75 Years and older | 5 (100.0%) | 0 (0.0%) |
| Total | 64 (97.0%) | 2 (3.0%) |
Health Insurance Coverage by Citizenship Status in Kenneth
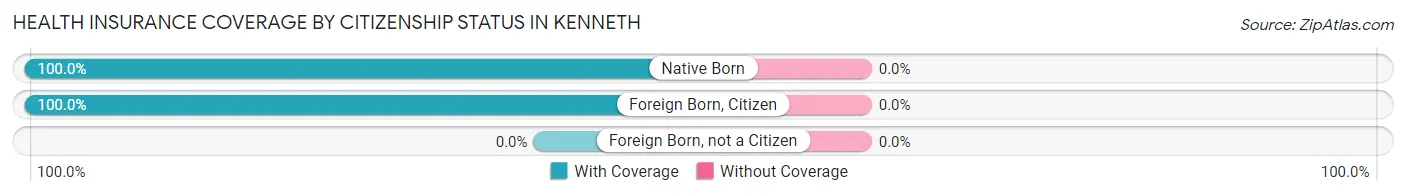
| Citizenship Status | With Coverage | Without Coverage |
| Native Born | 29 (100.0%) | 0 (0.0%) |
| Foreign Born, Citizen | 11 (100.0%) | 0 (0.0%) |
| Foreign Born, not a Citizen | 0 (0.0%) | 0 (0.0%) |
Health Insurance Coverage by Household Income in Kenneth
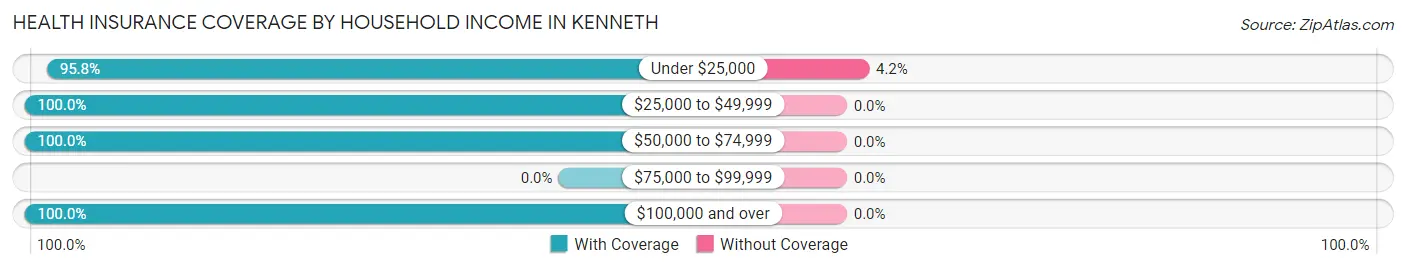
| Household Income | With Coverage | Without Coverage |
| Under $25,000 | 46 (95.8%) | 2 (4.2%) |
| $25,000 to $49,999 | 12 (100.0%) | 0 (0.0%) |
| $50,000 to $74,999 | 3 (100.0%) | 0 (0.0%) |
| $75,000 to $99,999 | 0 (0.0%) | 0 (0.0%) |
| $100,000 and over | 3 (100.0%) | 0 (0.0%) |
Public vs Private Health Insurance Coverage by Age in Kenneth
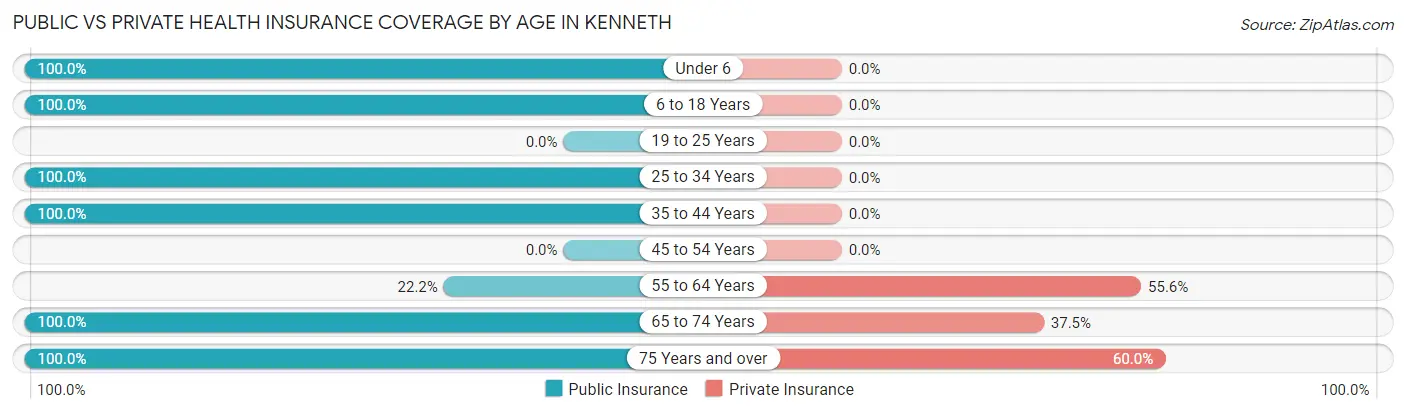
| Age Bracket | Public Insurance | Private Insurance |
| Under 6 | 29 (100.0%) | 0 (0.0%) |
| 6 to 18 Years | 11 (100.0%) | 0 (0.0%) |
| 19 to 25 Years | 0 (0.0%) | 0 (0.0%) |
| 25 to 34 Years | 3 (100.0%) | 0 (0.0%) |
| 35 to 44 Years | 1 (100.0%) | 0 (0.0%) |
| 45 to 54 Years | 0 (0.0%) | 0 (0.0%) |
| 55 to 64 Years | 2 (22.2%) | 5 (55.6%) |
| 65 to 74 Years | 8 (100.0%) | 3 (37.5%) |
| 75 Years and over | 5 (100.0%) | 3 (60.0%) |
| Total | 59 (89.4%) | 11 (16.7%) |
Disability Status by Sex by Age in Kenneth
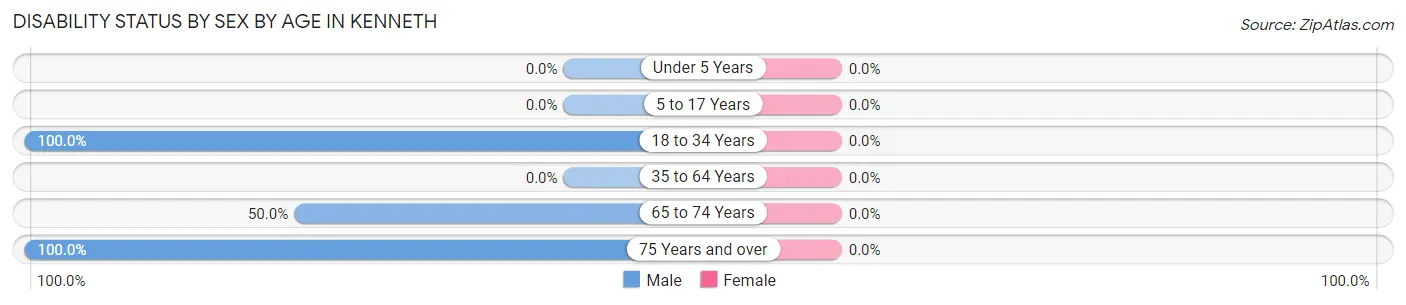
| Age Bracket | Male | Female |
| Under 5 Years | 0 (0.0%) | 0 (0.0%) |
| 5 to 17 Years | 0 (0.0%) | 0 (0.0%) |
| 18 to 34 Years | 1 (100.0%) | 0 (0.0%) |
| 35 to 64 Years | 0 (0.0%) | 0 (0.0%) |
| 65 to 74 Years | 4 (50.0%) | 0 (0.0%) |
| 75 Years and over | 2 (100.0%) | 0 (0.0%) |
Disability Class by Sex by Age in Kenneth
Disability Class: Hearing Difficulty

| Age Bracket | Male | Female |
| Under 5 Years | 0 (0.0%) | 0 (0.0%) |
| 5 to 17 Years | 0 (0.0%) | 0 (0.0%) |
| 18 to 34 Years | 0 (0.0%) | 0 (0.0%) |
| 35 to 64 Years | 0 (0.0%) | 0 (0.0%) |
| 65 to 74 Years | 4 (50.0%) | 0 (0.0%) |
| 75 Years and over | 0 (0.0%) | 0 (0.0%) |
Disability Class: Vision Difficulty
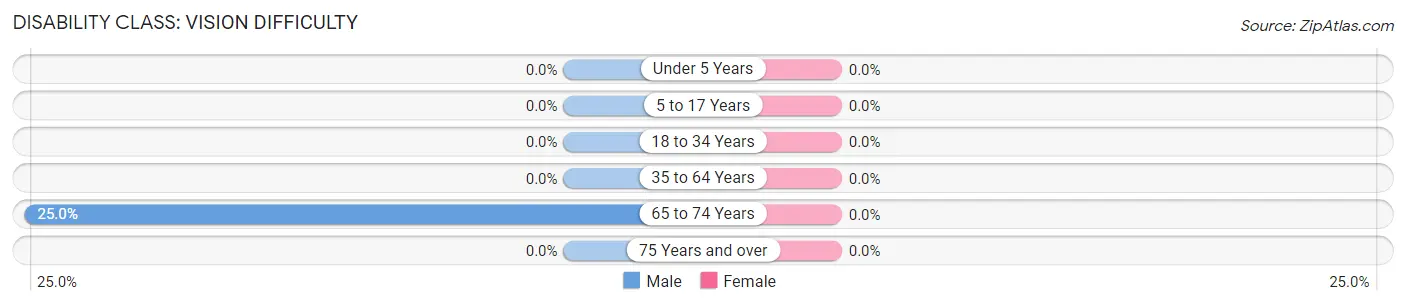
| Age Bracket | Male | Female |
| Under 5 Years | 0 (0.0%) | 0 (0.0%) |
| 5 to 17 Years | 0 (0.0%) | 0 (0.0%) |
| 18 to 34 Years | 0 (0.0%) | 0 (0.0%) |
| 35 to 64 Years | 0 (0.0%) | 0 (0.0%) |
| 65 to 74 Years | 2 (25.0%) | 0 (0.0%) |
| 75 Years and over | 0 (0.0%) | 0 (0.0%) |
Disability Class: Cognitive Difficulty
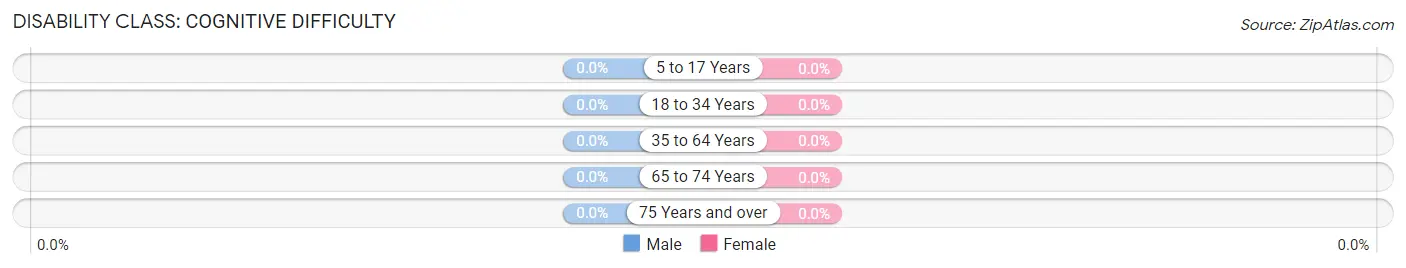
| Age Bracket | Male | Female |
| 5 to 17 Years | 0 (0.0%) | 0 (0.0%) |
| 18 to 34 Years | 0 (0.0%) | 0 (0.0%) |
| 35 to 64 Years | 0 (0.0%) | 0 (0.0%) |
| 65 to 74 Years | 0 (0.0%) | 0 (0.0%) |
| 75 Years and over | 0 (0.0%) | 0 (0.0%) |
Disability Class: Ambulatory Difficulty
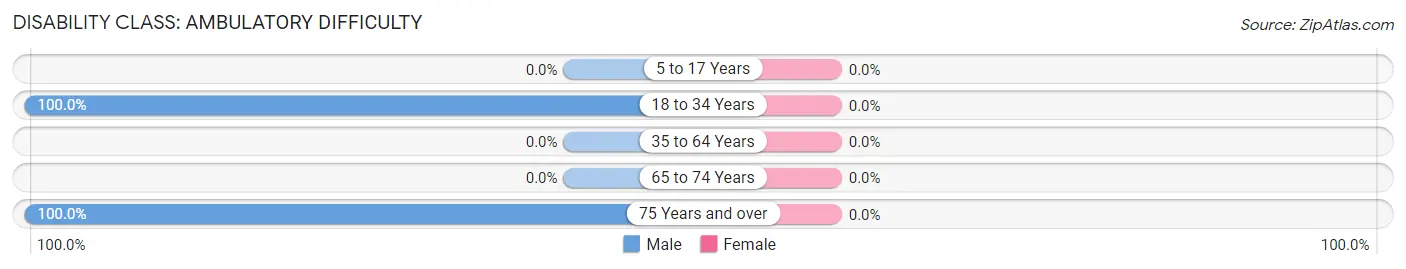
| Age Bracket | Male | Female |
| 5 to 17 Years | 0 (0.0%) | 0 (0.0%) |
| 18 to 34 Years | 1 (100.0%) | 0 (0.0%) |
| 35 to 64 Years | 0 (0.0%) | 0 (0.0%) |
| 65 to 74 Years | 0 (0.0%) | 0 (0.0%) |
| 75 Years and over | 2 (100.0%) | 0 (0.0%) |
Disability Class: Self-Care Difficulty
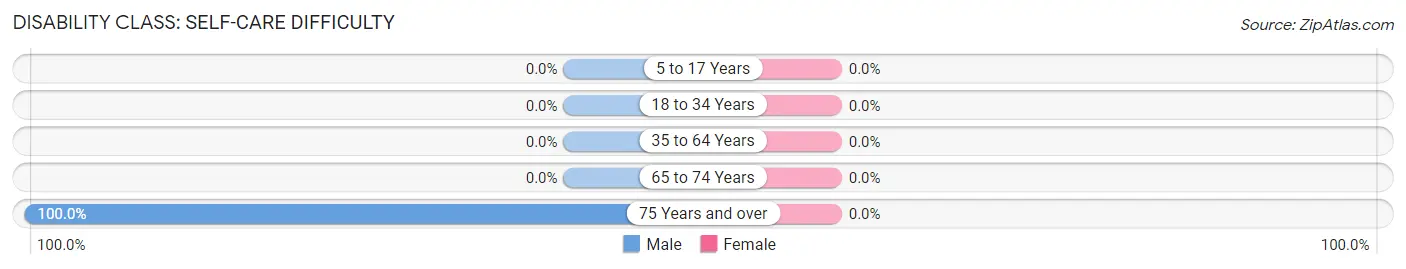
| Age Bracket | Male | Female |
| 5 to 17 Years | 0 (0.0%) | 0 (0.0%) |
| 18 to 34 Years | 0 (0.0%) | 0 (0.0%) |
| 35 to 64 Years | 0 (0.0%) | 0 (0.0%) |
| 65 to 74 Years | 0 (0.0%) | 0 (0.0%) |
| 75 Years and over | 2 (100.0%) | 0 (0.0%) |
Technology Access in Kenneth
Computing Device Access in Kenneth
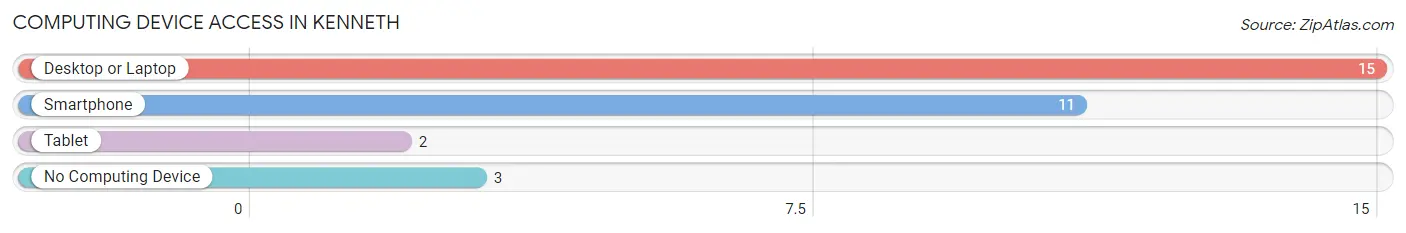
| Device Type | # Households | % Households |
| Desktop or Laptop | 15 | 83.3% |
| Smartphone | 11 | 61.1% |
| Tablet | 2 | 11.1% |
| No Computing Device | 3 | 16.7% |
| Total | 18 | 100.0% |
Internet Access in Kenneth
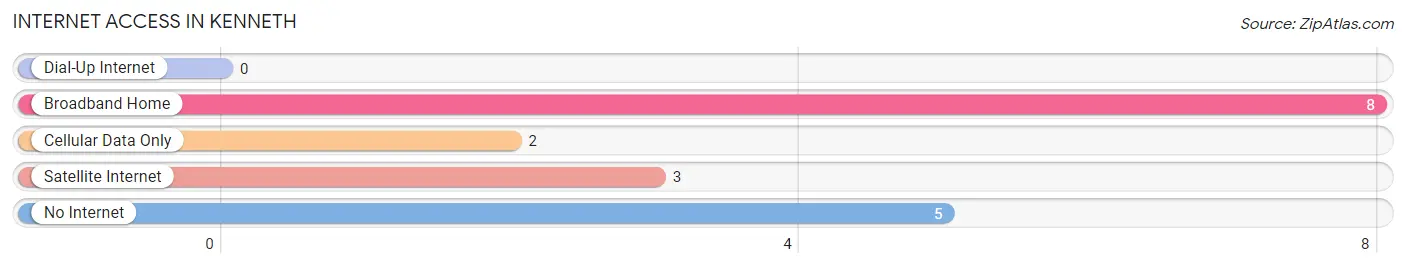
| Internet Type | # Households | % Households |
| Dial-Up Internet | 0 | 0.0% |
| Broadband Home | 8 | 44.4% |
| Cellular Data Only | 2 | 11.1% |
| Satellite Internet | 3 | 16.7% |
| No Internet | 5 | 27.8% |
| Total | 18 | 100.0% |
Kenneth Summary
Minnesota is a state located in the Midwestern United States. It is bordered by Wisconsin to the east, Iowa to the south, North Dakota and South Dakota to the west, and the Canadian provinces of Ontario and Manitoba to the north. Minnesota is the 12th largest state in the United States, with an area of 86,943 square miles (225,181 km2). It is the 21st most populous state, with a population of 5.6 million people as of 2020.
History
The area that is now Minnesota was first inhabited by Native American tribes, including the Dakota, Ojibwe, and Sioux. The first Europeans to explore the area were French fur traders, who arrived in the late 17th century. The area was part of the French colony of New France until 1763, when it was ceded to Great Britain after the French and Indian War. The area was then part of the British colony of Canada until the War of 1812, when it was ceded to the United States.
In 1819, the United States established the Minnesota Territory, which included the present-day states of Minnesota, North Dakota, South Dakota, and parts of Montana and Wyoming. The territory was organized as a state in 1858, and was admitted to the Union as the 32nd state in 1858.
Geography
Minnesota is located in the Midwestern United States, bordered by Wisconsin to the east, Iowa to the south, North Dakota and South Dakota to the west, and the Canadian provinces of Ontario and Manitoba to the north. The state has a total area of 86,943 square miles (225,181 km2), making it the 12th largest state in the United States.
The state is divided into 87 counties and contains 87 state parks. The state is home to the Boundary Waters Canoe Area Wilderness, the largest wilderness area east of the Mississippi River. The state also contains the Mississippi National River and Recreation Area, a 72-mile (116 km) stretch of the Mississippi River that is managed by the National Park Service.
The state has a humid continental climate, with cold winters and hot summers. The average annual temperature is 40°F (4°C). The state receives an average of 28 inches (71 cm) of precipitation per year.
Economy
Minnesota has a diversified economy, with a mix of industries including agriculture, manufacturing, finance, and technology. The state is a major producer of corn, soybeans, and hogs. It is also a major producer of iron ore, and is home to the world’s largest iron ore mining operation.
The state is home to several major corporations, including 3M, Target, Best Buy, General Mills, and UnitedHealth Group. The state is also home to several major universities, including the University of Minnesota, the University of St. Thomas, and the University of Minnesota Duluth.
Demographics
As of 2020, the population of Minnesota was 5.6 million people. The state is home to a diverse population, with the largest ethnic groups being German (25.3%), Norwegian (17.2%), and Irish (13.2%). The state also has a large population of Native Americans, with the largest tribes being the Ojibwe, Dakota, and Sioux.
The state has a median household income of $68,945, and a poverty rate of 10.2%. The state has a high rate of educational attainment, with 91.2% of adults over the age of 25 having at least a high school diploma. The state also has a high rate of health insurance coverage, with 95.2% of residents having health insurance.
Common Questions
What is Per Capita Income in Kenneth?
Per Capita income in Kenneth is $21,705.
What is the Median Family Income in Kenneth?
Median Family Income in Kenneth is $29,375.
What is the Median Household income in Kenneth?
Median Household Income in Kenneth is $28,750.
What is Inequality or Gini Index in Kenneth?
Inequality or Gini Index in Kenneth is 0.64.
What is the Total Population of Kenneth?
Total Population of Kenneth is 66.
What is the Total Male Population of Kenneth?
Total Male Population of Kenneth is 50.
What is the Total Female Population of Kenneth?
Total Female Population of Kenneth is 16.
What is the Ratio of Males per 100 Females in Kenneth?
There are 312.50 Males per 100 Females in Kenneth.
What is the Ratio of Females per 100 Males in Kenneth?
There are 32.00 Females per 100 Males in Kenneth.
What is the Median Population Age in Kenneth?
Median Population Age in Kenneth is 9.5 Years.
What is the Average Family Size in Kenneth
Average Family Size in Kenneth is 7.7 People.
What is the Average Household Size in Kenneth
Average Household Size in Kenneth is 3.7 People.
How Large is the Labor Force in Kenneth?
There are 11 People in the Labor Forcein in Kenneth.
What is the Percentage of People in the Labor Force in Kenneth?
42.3% of People are in the Labor Force in Kenneth.
What is the Unemployment Rate in Kenneth?
Unemployment Rate in Kenneth is 27.3%.