Area Code 857 Map & Demographics
Area Code 857 Map
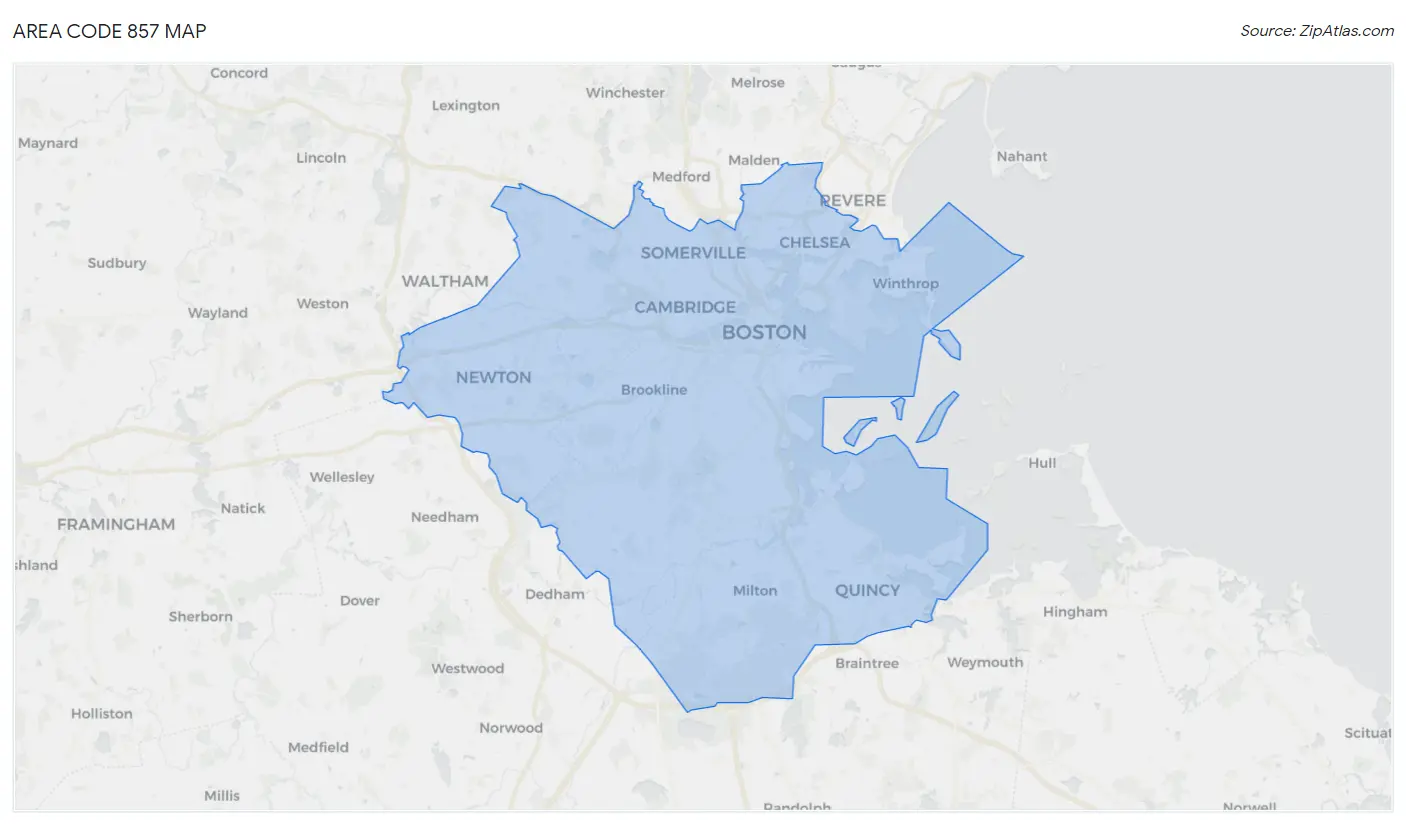
Area Code 857 Overview
$71,409
PER CAPITA INCOME
$144,318
AVG FAMILY INCOME
$110,390
AVG HOUSEHOLD INCOME
27.5%
WAGE / INCOME GAP [ % ]
72.5¢/ $1
WAGE / INCOME GAP [ $ ]
$10,451
FAMILY INCOME DEFICIT
22.77
INEQUALITY / GINI INDEX
1,128,838
TOTAL POPULATION
553,232
MALE POPULATION
575,606
FEMALE POPULATION
96.11
MALES / 100 FEMALES
104.04
FEMALES / 100 MALES
35.1
MEDIAN AGE
2.9
AVG FAMILY SIZE
2.3
AVG HOUSEHOLD SIZE
675,478
LABOR FORCE [ PEOPLE ]
69.8%
PERCENT IN LABOR FORCE
5.5%
UNEMPLOYMENT RATE
Income in Area Code 857
Income Overview in Area Code 857
Per Capita Income in Area Code 857 is $71,409, while median incomes of families and households are $144,318 and $110,390 respectively.
| Characteristic | Number | Measure |
| Per Capita Income | 1,128,838 | $71,409 |
| Median Family Income | 227,864 | $144,318 |
| Mean Family Income | 227,864 | $9,354,613 |
| Median Household Income | 468,895 | $110,390 |
| Mean Household Income | 468,895 | $7,376,739 |
| Income Deficit | 227,864 | $10,451 |
| Wage / Income Gap (%) | 1,128,838 | 27.53% |
| Wage / Income Gap ($) | 1,128,838 | 72.47¢ per $1 |
| Gini / Inequality Index | 1,128,838 | 22.77 |
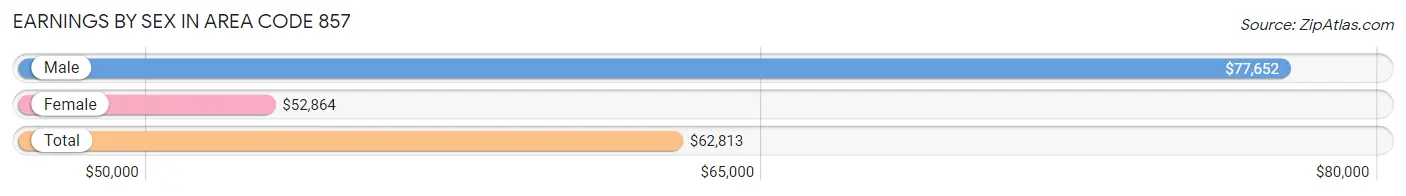
Earnings by Sex in Area Code 857
Average Earnings in Area Code 857 are $62,813, $77,652 for men and $52,864 for women, a difference of 31.9%.
| Sex | Number | Average Earnings |
| Male | 360,950 (50.5%) | $77,652 |
| Female | 354,208 (49.5%) | $52,864 |
| Total | 715,158 (100.0%) | $62,813 |
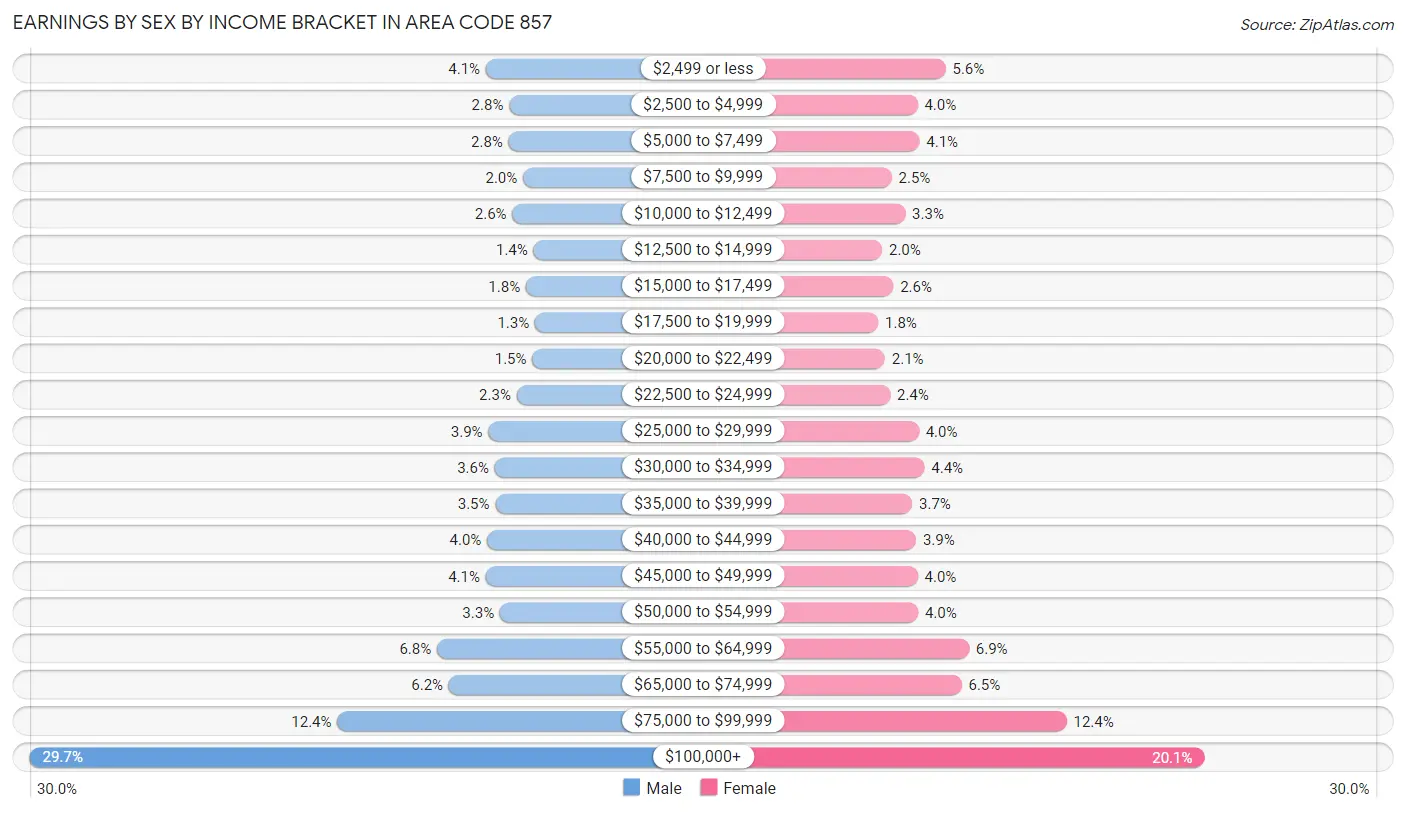
Earnings by Sex by Income Bracket in Area Code 857
The most common earnings brackets in Area Code 857 are $100,000+ for men (107,290 | 29.7%) and $100,000+ for women (71,170 | 20.1%).
| Income | Male | Female |
| $2,499 or less | 14,683 (4.1%) | 19,643 (5.6%) |
| $2,500 to $4,999 | 9,952 (2.8%) | 14,058 (4.0%) |
| $5,000 to $7,499 | 10,069 (2.8%) | 14,442 (4.1%) |
| $7,500 to $9,999 | 7,135 (2.0%) | 8,912 (2.5%) |
| $10,000 to $12,499 | 9,308 (2.6%) | 11,618 (3.3%) |
| $12,500 to $14,999 | 5,009 (1.4%) | 7,006 (2.0%) |
| $15,000 to $17,499 | 6,558 (1.8%) | 9,235 (2.6%) |
| $17,500 to $19,999 | 4,715 (1.3%) | 6,241 (1.8%) |
| $20,000 to $22,499 | 5,287 (1.5%) | 7,563 (2.1%) |
| $22,500 to $24,999 | 8,440 (2.3%) | 8,621 (2.4%) |
| $25,000 to $29,999 | 14,186 (3.9%) | 14,298 (4.0%) |
| $30,000 to $34,999 | 12,883 (3.6%) | 15,458 (4.4%) |
| $35,000 to $39,999 | 12,790 (3.5%) | 12,986 (3.7%) |
| $40,000 to $44,999 | 14,454 (4.0%) | 13,788 (3.9%) |
| $45,000 to $49,999 | 14,727 (4.1%) | 14,096 (4.0%) |
| $50,000 to $54,999 | 11,825 (3.3%) | 14,153 (4.0%) |
| $55,000 to $64,999 | 24,627 (6.8%) | 24,306 (6.9%) |
| $65,000 to $74,999 | 22,194 (6.1%) | 22,861 (6.5%) |
| $75,000 to $99,999 | 44,818 (12.4%) | 43,753 (12.3%) |
| $100,000+ | 107,290 (29.7%) | 71,170 (20.1%) |
| Total | 360,950 (100.0%) | 354,208 (100.0%) |
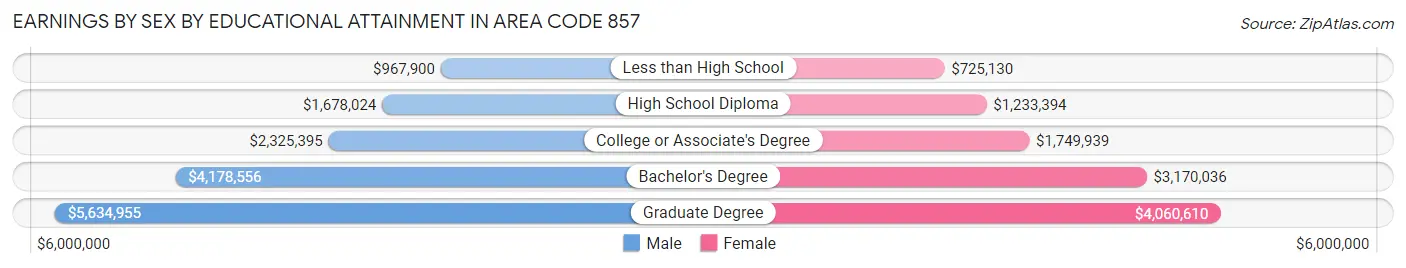
Earnings by Sex by Educational Attainment in Area Code 857
Average earnings in Area Code 857 are $4,209,211 for men and $2,928,150 for women, a difference of 30.4%. Men with an educational attainment of graduate degree enjoy the highest average annual earnings of $5,634,955, while those with less than high school education earn the least with $967,900. Women with an educational attainment of graduate degree earn the most with the average annual earnings of $4,060,610, while those with less than high school education have the smallest earnings of $725,130.
| Educational Attainment | Male Income | Female Income |
| Less than High School | $967,900 | $725,130 |
| High School Diploma | $1,678,024 | $1,233,394 |
| College or Associate's Degree | $2,325,395 | $1,749,939 |
| Bachelor's Degree | $4,178,556 | $3,170,036 |
| Graduate Degree | $5,634,955 | $4,060,610 |
| Total | $4,209,211 | $2,928,150 |
Family Income in Area Code 857
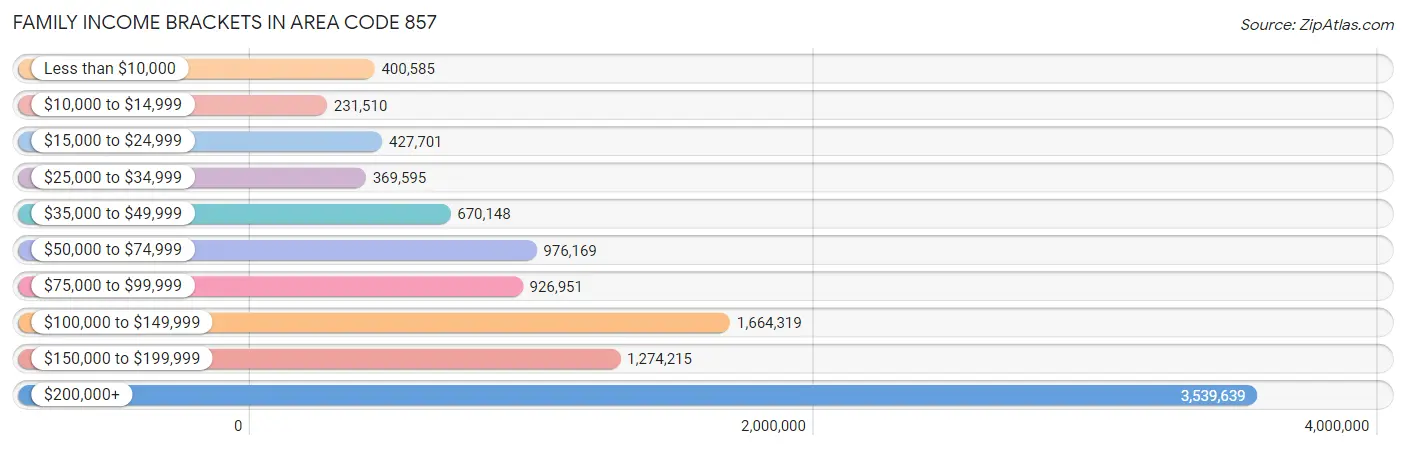
Family Income Brackets in Area Code 857
According to the Area Code 857 family income data, there are 3,539,639 families falling into the $200,000+ income range, which is the most common income bracket and makes up 1,553.4% of all families. Conversely, the $10,000 to $14,999 income bracket is the least frequent group with only 231,510 families (101.6%) belonging to this category.
| Income Bracket | # Families | % Families |
| Less than $10,000 | 400,585 | 175.8% |
| $10,000 to $14,999 | 231,510 | 101.6% |
| $15,000 to $24,999 | 427,701 | 187.7% |
| $25,000 to $34,999 | 369,595 | 162.2% |
| $35,000 to $49,999 | 670,148 | 294.1% |
| $50,000 to $74,999 | 976,169 | 428.4% |
| $75,000 to $99,999 | 926,951 | 406.8% |
| $100,000 to $149,999 | 1,664,319 | 730.4% |
| $150,000 to $199,999 | 1,274,215 | 559.2% |
| $200,000+ | 3,539,639 | 1,553.4% |
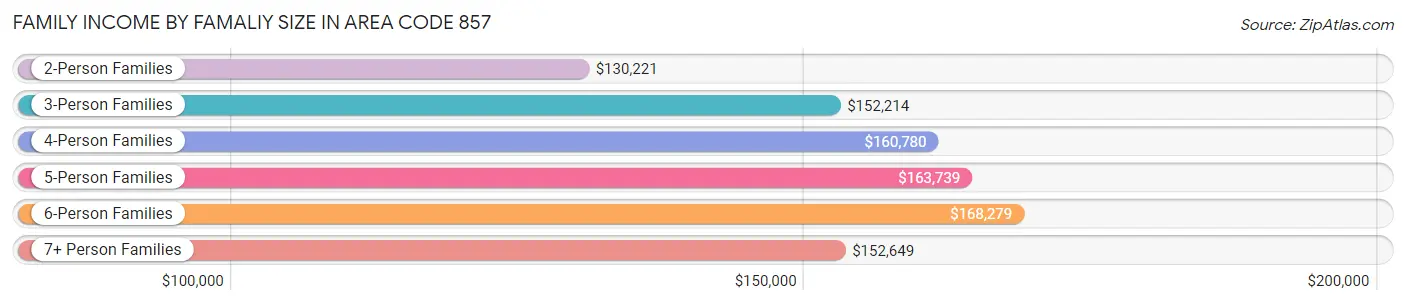
Family Income by Famaliy Size in Area Code 857
6-person families (5,191 | 2.3%) account for the highest median family income in Area Code 857 with $168,279 per family, while 2-person families (106,870 | 46.9%) have the highest median income of $65,110 per family member.
| Income Bracket | # Families | Median Income |
| 2-Person Families | 106,870 (46.9%) | $130,221 |
| 3-Person Families | 55,151 (24.2%) | $152,214 |
| 4-Person Families | 42,023 (18.4%) | $160,780 |
| 5-Person Families | 15,367 (6.7%) | $163,739 |
| 6-Person Families | 5,191 (2.3%) | $168,279 |
| 7+ Person Families | 3,262 (1.4%) | $152,649 |
| Total | 227,864 (100.0%) | $144,318 |
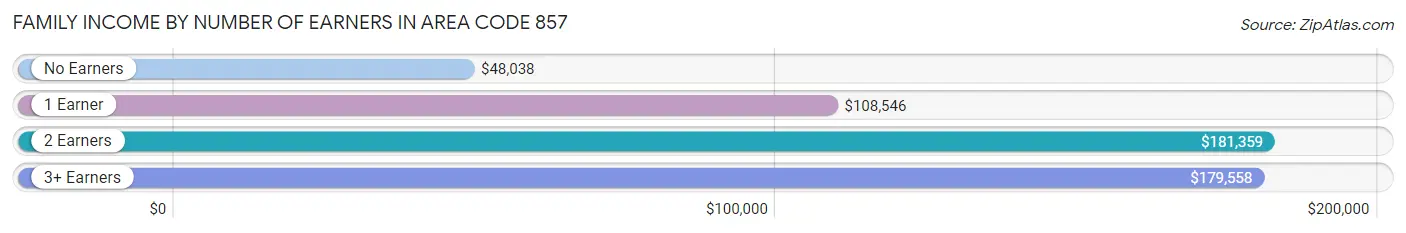
Family Income by Number of Earners in Area Code 857
The median family income in Area Code 857 is $144,318, with families comprising 2 earners (112,802) having the highest median family income of $181,359, while families with no earners (23,419) have the lowest median family income of $48,038, accounting for 49.5% and 10.3% of families, respectively.
| Number of Earners | # Families | Median Income |
| No Earners | 23,419 (10.3%) | $48,038 |
| 1 Earner | 62,985 (27.6%) | $108,546 |
| 2 Earners | 112,802 (49.5%) | $181,359 |
| 3+ Earners | 28,658 (12.6%) | $179,558 |
| Total | 227,864 (100.0%) | $144,318 |
Household Income in Area Code 857
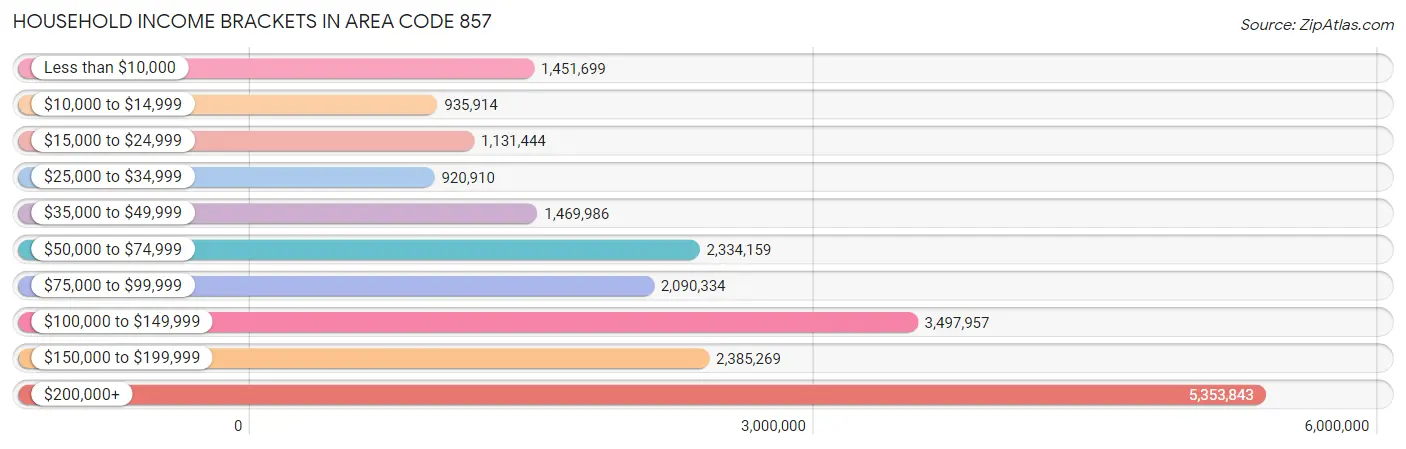
Household Income Brackets in Area Code 857
With 5,353,843 households falling in the category, the $200,000+ income range is the most frequent in Area Code 857, accounting for 1,141.8% of all households. In contrast, only 920,910 households (196.4%) fall into the $25,000 to $34,999 income bracket, making it the least populous group.
| Income Bracket | # Households | % Households |
| Less than $10,000 | 1,451,699 | 309.6% |
| $10,000 to $14,999 | 935,914 | 199.6% |
| $15,000 to $24,999 | 1,131,444 | 241.3% |
| $25,000 to $34,999 | 920,910 | 196.4% |
| $35,000 to $49,999 | 1,469,986 | 313.5% |
| $50,000 to $74,999 | 2,334,159 | 497.8% |
| $75,000 to $99,999 | 2,090,334 | 445.8% |
| $100,000 to $149,999 | 3,497,957 | 746.0% |
| $150,000 to $199,999 | 2,385,269 | 508.7% |
| $200,000+ | 5,353,843 | 1,141.8% |
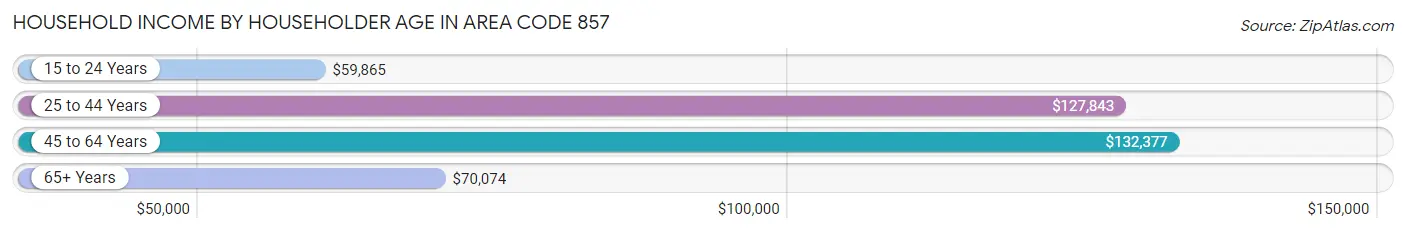
Household Income by Householder Age in Area Code 857
The median household income in Area Code 857 is $110,390, with the highest median household income of $132,377 found in the 45 to 64 years age bracket for the primary householder. A total of 141,656 households (30.2%) fall into this category. Meanwhile, the 15 to 24 years age bracket for the primary householder has the lowest median household income of $59,865, with 27,490 households (5.9%) in this group.
| Income Bracket | # Households | Median Income |
| 15 to 24 Years | 27,490 (5.9%) | $59,865 |
| 25 to 44 Years | 204,042 (43.5%) | $127,843 |
| 45 to 64 Years | 141,656 (30.2%) | $132,377 |
| 65+ Years | 95,707 (20.4%) | $70,074 |
| Total | 468,895 (100.0%) | $110,390 |
Poverty in Area Code 857
Income Below Poverty by Sex and Age in Area Code 857
With 13.1% poverty level for males and 15.3% for females among the residents of Area Code 857, 18 to 24 year old males and 18 to 24 year old females are the most vulnerable to poverty, with 14,703 males (28.0%) and 16,976 females (31.0%) in their respective age groups living below the poverty level.
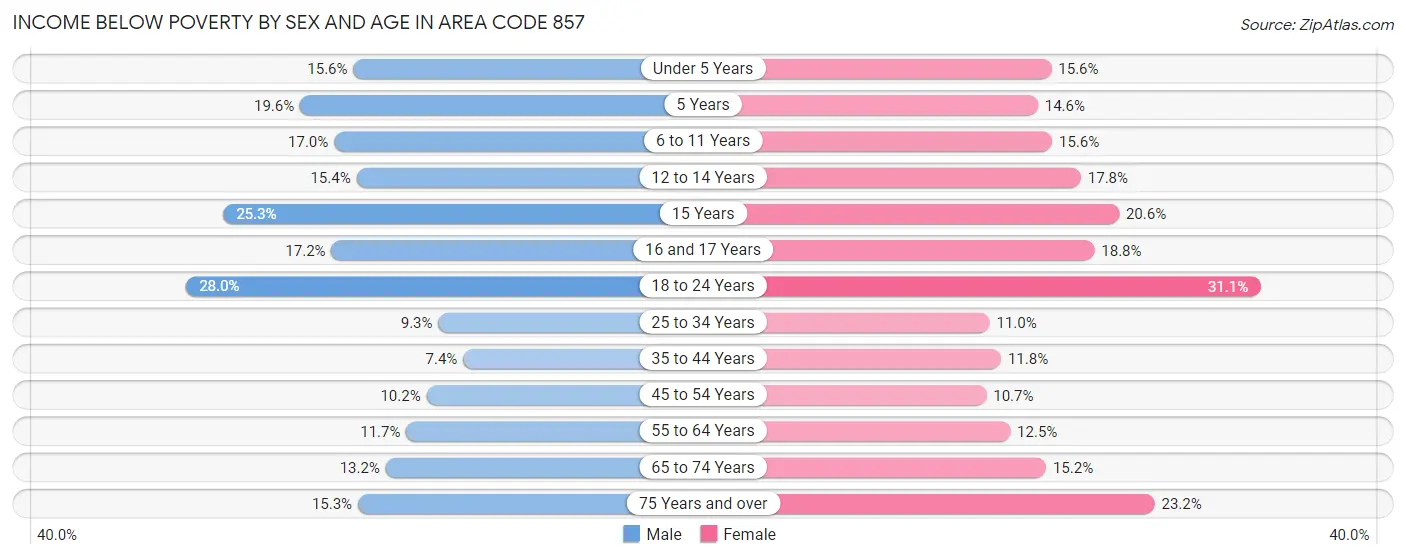
| Age Bracket | Male | Female |
| Under 5 Years | 4,283 (15.6%) | 4,103 (15.6%) |
| 5 Years | 997 (19.6%) | 513 (14.5%) |
| 6 to 11 Years | 4,921 (17.0%) | 4,369 (15.6%) |
| 12 to 14 Years | 2,443 (15.4%) | 2,542 (17.7%) |
| 15 Years | 1,237 (25.3%) | 881 (20.6%) |
| 16 and 17 Years | 1,781 (17.2%) | 1,672 (18.8%) |
| 18 to 24 Years | 14,703 (28.0%) | 16,976 (31.0%) |
| 25 to 34 Years | 11,741 (9.3%) | 13,762 (11.0%) |
| 35 to 44 Years | 5,816 (7.4%) | 9,045 (11.8%) |
| 45 to 54 Years | 6,225 (10.2%) | 6,511 (10.7%) |
| 55 to 64 Years | 6,497 (11.7%) | 7,620 (12.5%) |
| 65 to 74 Years | 5,155 (13.2%) | 6,929 (15.2%) |
| 75 Years and over | 3,534 (15.2%) | 8,584 (23.2%) |
| Total | 69,333 (13.1%) | 83,507 (15.3%) |
Income Above Poverty by Sex and Age in Area Code 857
According to the poverty statistics in Area Code 857, males aged 35 to 44 years and females aged 45 to 54 years are the age groups that are most secure financially, with 92.6% of males and 89.3% of females in these age groups living above the poverty line.
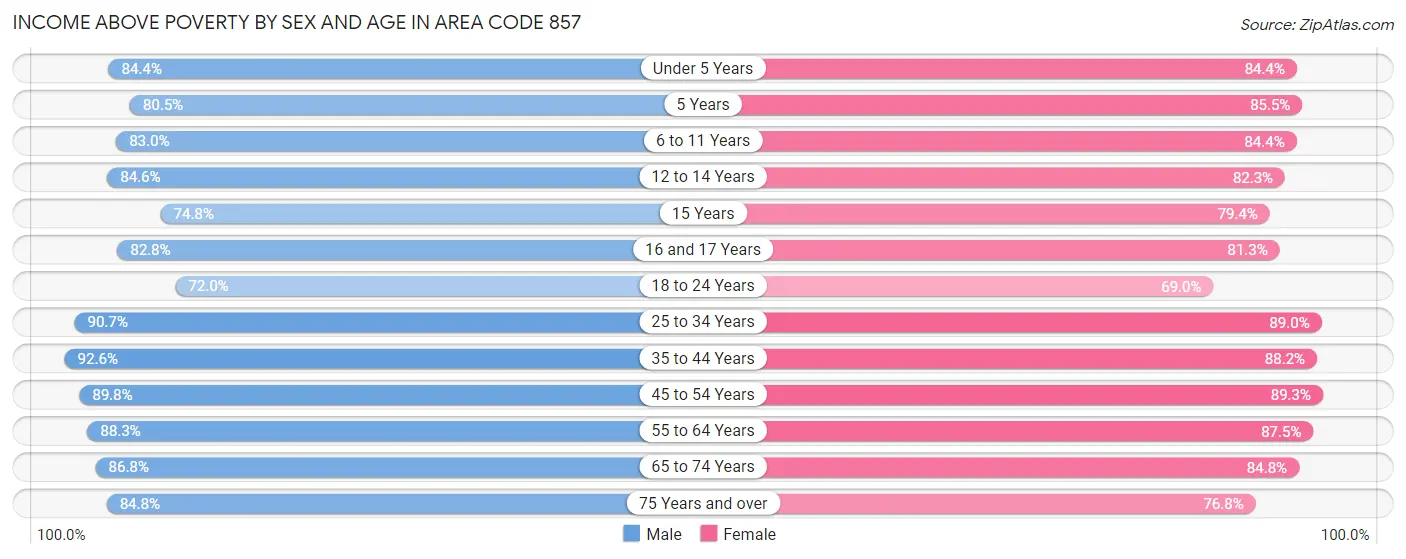
| Age Bracket | Male | Female |
| Under 5 Years | 23,197 (84.4%) | 22,261 (84.4%) |
| 5 Years | 4,103 (80.4%) | 3,013 (85.5%) |
| 6 to 11 Years | 23,992 (83.0%) | 23,615 (84.4%) |
| 12 to 14 Years | 13,457 (84.6%) | 11,783 (82.3%) |
| 15 Years | 3,662 (74.8%) | 3,400 (79.4%) |
| 16 and 17 Years | 8,563 (82.8%) | 7,247 (81.2%) |
| 18 to 24 Years | 37,803 (72.0%) | 37,699 (69.0%) |
| 25 to 34 Years | 114,790 (90.7%) | 111,718 (89.0%) |
| 35 to 44 Years | 72,371 (92.6%) | 67,480 (88.2%) |
| 45 to 54 Years | 55,030 (89.8%) | 54,143 (89.3%) |
| 55 to 64 Years | 49,228 (88.3%) | 53,345 (87.5%) |
| 65 to 74 Years | 33,914 (86.8%) | 38,766 (84.8%) |
| 75 Years and over | 19,644 (84.8%) | 28,382 (76.8%) |
| Total | 459,754 (86.9%) | 462,852 (84.7%) |
Income Below Poverty Among Married-Couple Families in Area Code 857
The poverty statistics for married-couple families in Area Code 857 show that 4.9% or 7,814 of the total 160,672 families live below the poverty line. Families with 5 or more children have the highest poverty rate of 36.3%, comprising of 185 families. On the other hand, families with no children have the lowest poverty rate of 4.3%, which includes 4,028 families.
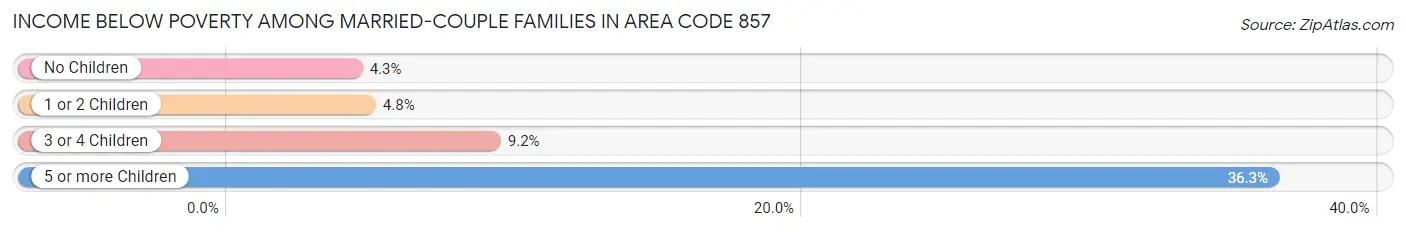
| Children | Above Poverty | Below Poverty |
| No Children | 88,816 (95.7%) | 4,028 (4.3%) |
| 1 or 2 Children | 55,957 (95.2%) | 2,819 (4.8%) |
| 3 or 4 Children | 7,760 (90.8%) | 782 (9.1%) |
| 5 or more Children | 325 (63.7%) | 185 (36.3%) |
| Total | 152,858 (95.1%) | 7,814 (4.9%) |
Income Below Poverty Among Single-Parent Households in Area Code 857
According to the poverty data in Area Code 857, 13.7% or 2,450 single-father households and 22.4% or 11,059 single-mother households are living below the poverty line. Among single-father households, those with 3 or 4 children have the highest poverty rate, with 379 households (42.6%) experiencing poverty. Likewise, among single-mother households, those with 5 or more children have the highest poverty rate, with 68 households (66.7%) falling below the poverty line.
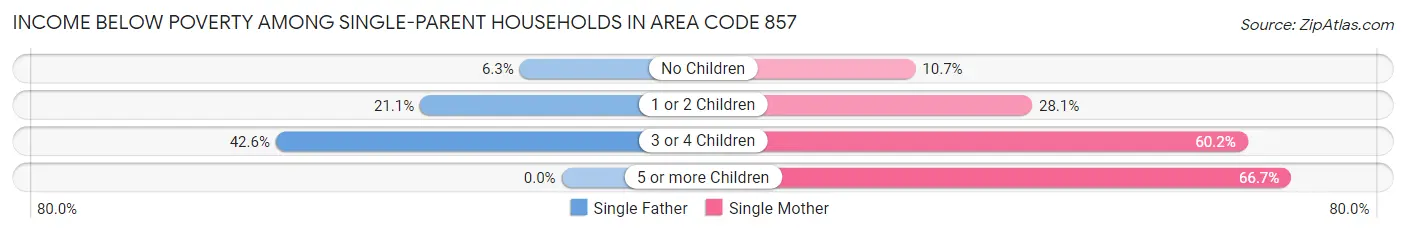
| Children | Single Father | Single Mother |
| No Children | 639 (6.2%) | 2,329 (10.7%) |
| 1 or 2 Children | 1,432 (21.1%) | 6,840 (28.1%) |
| 3 or 4 Children | 379 (42.6%) | 1,822 (60.2%) |
| 5 or more Children | 0 (0.0%) | 68 (66.7%) |
| Total | 2,450 (13.7%) | 11,059 (22.4%) |
Income Below Poverty Among Married-Couple vs Single-Parent Households in Area Code 857
The poverty data for Area Code 857 shows that 7,814 of the married-couple family households (4.9%) and 13,509 of the single-parent households (20.1%) are living below the poverty level. Within the married-couple family households, those with 5 or more children have the highest poverty rate, with 185 households (36.3%) falling below the poverty line. Among the single-parent households, those with 5 or more children have the highest poverty rate, with 68 household (66.7%) living below poverty.
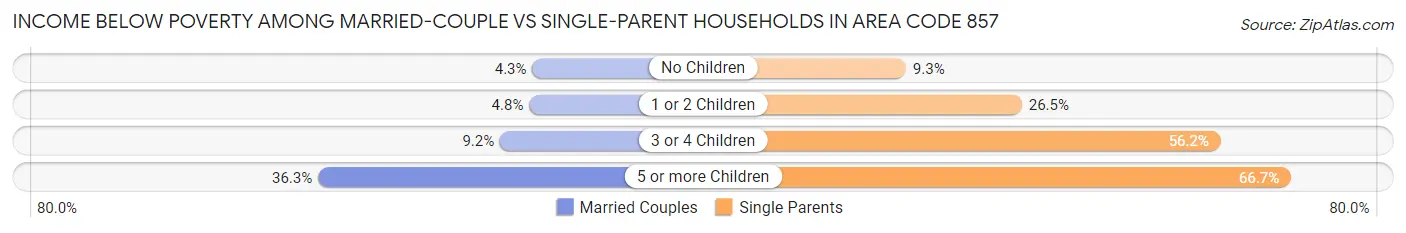
| Children | Married-Couple Families | Single-Parent Households |
| No Children | 4,028 (4.3%) | 2,968 (9.3%) |
| 1 or 2 Children | 2,819 (4.8%) | 8,272 (26.5%) |
| 3 or 4 Children | 782 (9.1%) | 2,201 (56.2%) |
| 5 or more Children | 185 (36.3%) | 68 (66.7%) |
| Total | 7,814 (4.9%) | 13,509 (20.1%) |
Race in Area Code 857
The most populous races in Area Code 857 are White / Caucasian (645,941 | 57.2%), Hispanic or Latino (184,714 | 16.4%), and Asian (158,887 | 14.1%).
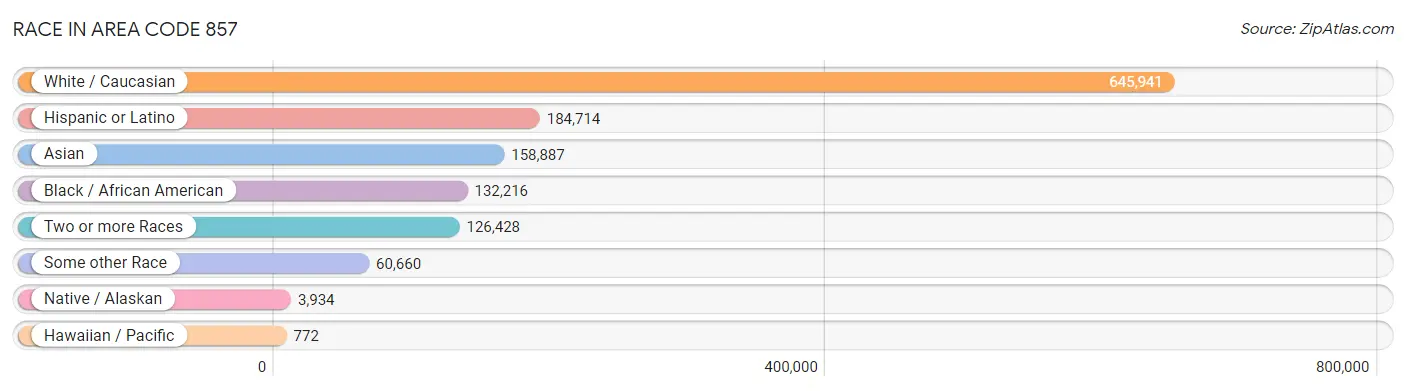
| Race | # Population | % Population |
| Asian | 158,887 | 14.1% |
| Black / African American | 132,216 | 11.7% |
| Hawaiian / Pacific | 772 | 0.1% |
| Hispanic or Latino | 184,714 | 16.4% |
| Native / Alaskan | 3,934 | 0.4% |
| White / Caucasian | 645,941 | 57.2% |
| Two or more Races | 126,428 | 11.2% |
| Some other Race | 60,660 | 5.4% |
| Total | 1,128,838 | 100.0% |
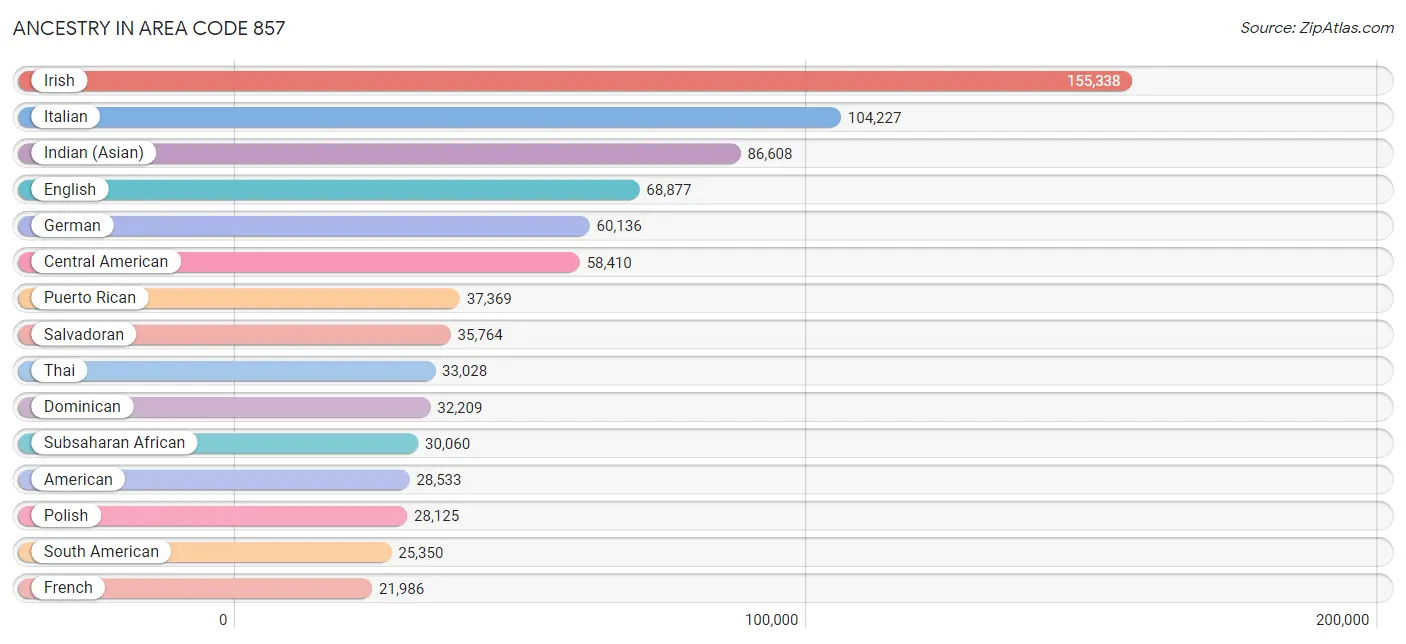
Ancestry in Area Code 857
The most populous ancestries reported in Area Code 857 are Irish (155,338 | 13.8%), Italian (104,227 | 9.2%), Indian (Asian) (86,608 | 7.7%), English (68,877 | 6.1%), and German (60,136 | 5.3%), together accounting for 42.1% of all Area Code 857 residents.
| Ancestry | # Population | % Population |
| Afghan | 238 | 0.0% |
| African | 7,075 | 0.6% |
| Alaska Native | 41 | 0.0% |
| Alaskan Athabascan | 27 | 0.0% |
| Albanian | 5,354 | 0.5% |
| Alsatian | 119 | 0.0% |
| American | 28,533 | 2.5% |
| Apache | 92 | 0.0% |
| Arab | 16,879 | 1.5% |
| Argentinean | 1,224 | 0.1% |
| Armenian | 5,597 | 0.5% |
| Assyrian / Chaldean / Syriac | 113 | 0.0% |
| Australian | 526 | 0.1% |
| Austrian | 2,145 | 0.2% |
| Bahamian | 94 | 0.0% |
| Bangladeshi | 59 | 0.0% |
| Barbadian | 1,291 | 0.1% |
| Basque | 167 | 0.0% |
| Belgian | 1,089 | 0.1% |
| Belizean | 75 | 0.0% |
| Bermudan | 29 | 0.0% |
| Bhutanese | 6,157 | 0.5% |
| Blackfeet | 530 | 0.1% |
| Bolivian | 503 | 0.0% |
| Brazilian | 15,904 | 1.4% |
| British | 5,811 | 0.5% |
| British West Indian | 649 | 0.1% |
| Bulgarian | 1,104 | 0.1% |
| Burmese | 11,654 | 1.0% |
| Cajun | 105 | 0.0% |
| Cambodian | 157 | 0.0% |
| Canadian | 4,360 | 0.4% |
| Cape Verdean | 9,834 | 0.9% |
| Carpatho Rusyn | 64 | 0.0% |
| Celtic | 114 | 0.0% |
| Central American | 58,410 | 5.2% |
| Central American Indian | 1,777 | 0.2% |
| Cherokee | 836 | 0.1% |
| Cheyenne | 115 | 0.0% |
| Chickasaw | 21 | 0.0% |
| Chilean | 1,049 | 0.1% |
| Chippewa | 55 | 0.0% |
| Choctaw | 147 | 0.0% |
| Colombian | 13,162 | 1.2% |
| Comanche | 6 | 0.0% |
| Costa Rican | 1,376 | 0.1% |
| Cree | 18 | 0.0% |
| Creek | 49 | 0.0% |
| Croatian | 1,100 | 0.1% |
| Crow | 15 | 0.0% |
| Cuban | 3,534 | 0.3% |
| Cypriot | 158 | 0.0% |
| Czech | 2,644 | 0.2% |
| Czechoslovakian | 226 | 0.0% |
| Danish | 2,333 | 0.2% |
| Dominican | 32,209 | 2.9% |
| Dutch | 5,150 | 0.5% |
| Dutch West Indian | 55 | 0.0% |
| Eastern European | 10,477 | 0.9% |
| Ecuadorian | 2,588 | 0.2% |
| Egyptian | 1,292 | 0.1% |
| English | 68,877 | 6.1% |
| Estonian | 240 | 0.0% |
| Ethiopian | 3,296 | 0.3% |
| European | 14,894 | 1.3% |
| Filipino | 2,565 | 0.2% |
| Finnish | 2,038 | 0.2% |
| French | 21,986 | 1.9% |
| French American Indian | 51 | 0.0% |
| French Canadian | 14,911 | 1.3% |
| German | 60,136 | 5.3% |
| German Russian | 40 | 0.0% |
| Ghanaian | 966 | 0.1% |
| Greek | 10,076 | 0.9% |
| Guamanian / Chamorro | 170 | 0.0% |
| Guatemalan | 9,913 | 0.9% |
| Guyanese | 782 | 0.1% |
| Haitian | 20,489 | 1.8% |
| Honduran | 7,978 | 0.7% |
| Hungarian | 4,154 | 0.4% |
| Icelander | 70 | 0.0% |
| Indian (Asian) | 86,608 | 7.7% |
| Indonesian | 780 | 0.1% |
| Inupiat | 35 | 0.0% |
| Iranian | 3,228 | 0.3% |
| Iraqi | 736 | 0.1% |
| Irish | 155,338 | 13.8% |
| Iroquois | 114 | 0.0% |
| Israeli | 2,462 | 0.2% |
| Italian | 104,227 | 9.2% |
| Jamaican | 7,088 | 0.6% |
| Japanese | 1,296 | 0.1% |
| Jordanian | 332 | 0.0% |
| Kenyan | 1,204 | 0.1% |
| Korean | 6,705 | 0.6% |
| Laotian | 960 | 0.1% |
| Latvian | 669 | 0.1% |
| Lebanese | 4,316 | 0.4% |
| Liberian | 296 | 0.0% |
| Lithuanian | 4,920 | 0.4% |
| Lumbee | 14 | 0.0% |
| Luxembourger | 44 | 0.0% |
| Macedonian | 150 | 0.0% |
| Malaysian | 242 | 0.0% |
| Maltese | 99 | 0.0% |
| Mexican | 11,730 | 1.0% |
| Mexican American Indian | 514 | 0.1% |
| Mongolian | 539 | 0.1% |
| Moroccan | 2,858 | 0.3% |
| Native Hawaiian | 710 | 0.1% |
| Navajo | 245 | 0.0% |
| New Zealander | 259 | 0.0% |
| Nicaraguan | 817 | 0.1% |
| Nigerian | 3,679 | 0.3% |
| Northern European | 1,849 | 0.2% |
| Norwegian | 5,585 | 0.5% |
| Okinawan | 227 | 0.0% |
| Osage | 86 | 0.0% |
| Paiute | 12 | 0.0% |
| Pakistani | 1,402 | 0.1% |
| Palestinian | 521 | 0.1% |
| Panamanian | 901 | 0.1% |
| Paraguayan | 243 | 0.0% |
| Pennsylvania German | 37 | 0.0% |
| Peruvian | 3,703 | 0.3% |
| Polish | 28,125 | 2.5% |
| Portuguese | 14,465 | 1.3% |
| Potawatomi | 21 | 0.0% |
| Pueblo | 17 | 0.0% |
| Puerto Rican | 37,369 | 3.3% |
| Romanian | 2,214 | 0.2% |
| Russian | 19,102 | 1.7% |
| Salvadoran | 35,764 | 3.2% |
| Samoan | 148 | 0.0% |
| Scandinavian | 1,623 | 0.1% |
| Scotch-Irish | 4,897 | 0.4% |
| Scottish | 15,021 | 1.3% |
| Seminole | 11 | 0.0% |
| Senegalese | 23 | 0.0% |
| Serbian | 875 | 0.1% |
| Sierra Leonean | 401 | 0.0% |
| Sioux | 148 | 0.0% |
| Slavic | 242 | 0.0% |
| Slovak | 1,167 | 0.1% |
| Slovene | 296 | 0.0% |
| Somali | 793 | 0.1% |
| South African | 423 | 0.0% |
| South American | 25,350 | 2.2% |
| South American Indian | 398 | 0.0% |
| Spaniard | 2,969 | 0.3% |
| Spanish | 2,047 | 0.2% |
| Spanish American | 105 | 0.0% |
| Spanish American Indian | 12 | 0.0% |
| Sri Lankan | 20,186 | 1.8% |
| Subsaharan African | 30,060 | 2.7% |
| Sudanese | 473 | 0.0% |
| Swedish | 10,672 | 0.9% |
| Swiss | 2,703 | 0.2% |
| Syrian | 851 | 0.1% |
| Taiwanese | 10 | 0.0% |
| Thai | 33,028 | 2.9% |
| Tlingit-Haida | 76 | 0.0% |
| Tohono O'Odham | 8 | 0.0% |
| Tongan | 48 | 0.0% |
| Trinidadian and Tobagonian | 3,422 | 0.3% |
| Turkish | 3,042 | 0.3% |
| U.S. Virgin Islander | 90 | 0.0% |
| Ugandan | 373 | 0.0% |
| Ukrainian | 5,153 | 0.5% |
| Uruguayan | 257 | 0.0% |
| Venezuelan | 2,463 | 0.2% |
| Vietnamese | 951 | 0.1% |
| Welsh | 3,555 | 0.3% |
| West Indian | 1,447 | 0.1% |
| Yaqui | 13 | 0.0% |
| Yugoslavian | 781 | 0.1% |
| Zimbabwean | 101 | 0.0% | View All 177 Rows |
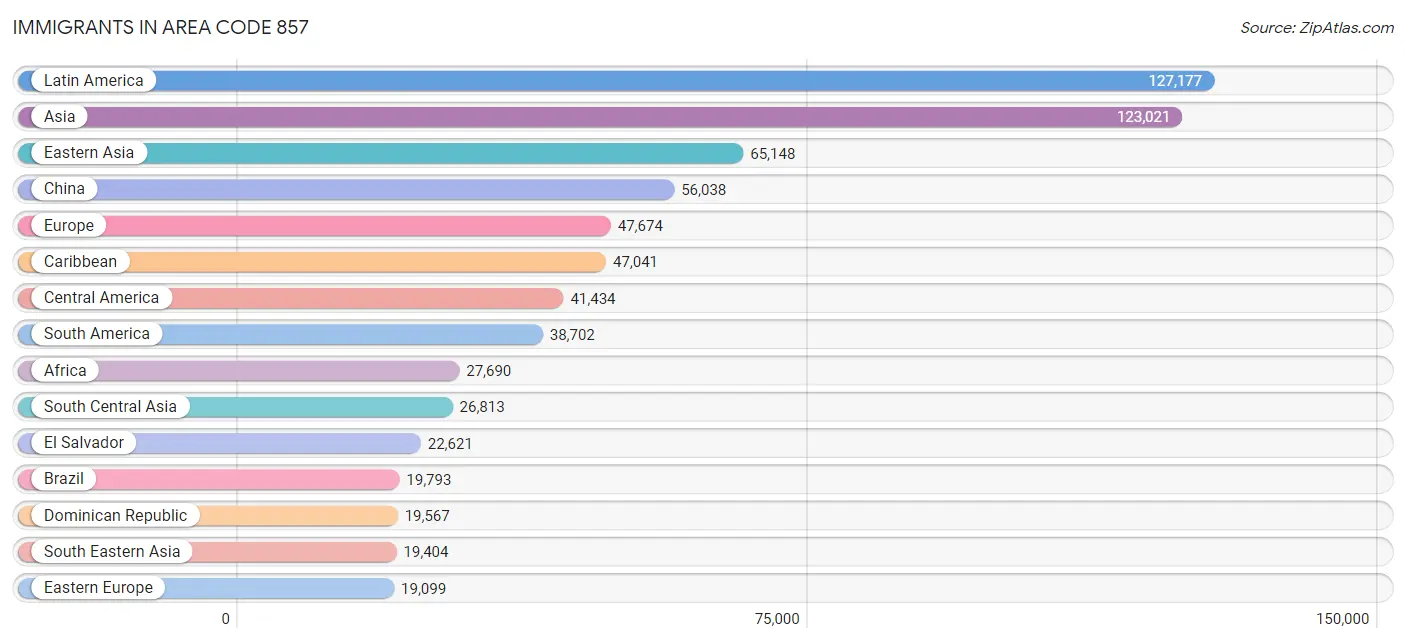
Immigrants in Area Code 857
The most numerous immigrant groups reported in Area Code 857 came from Latin America (127,177 | 11.3%), Asia (123,021 | 10.9%), Eastern Asia (65,148 | 5.8%), China (56,038 | 5.0%), and Europe (47,674 | 4.2%), together accounting for 37.1% of all Area Code 857 residents.
| Immigration Origin | # Population | % Population |
| Afghanistan | 167 | 0.0% |
| Africa | 27,690 | 2.5% |
| Albania | 3,989 | 0.4% |
| Argentina | 931 | 0.1% |
| Armenia | 555 | 0.1% |
| Asia | 123,021 | 10.9% |
| Australia | 887 | 0.1% |
| Austria | 201 | 0.0% |
| Azores | 419 | 0.0% |
| Bahamas | 66 | 0.0% |
| Bangladesh | 911 | 0.1% |
| Barbados | 856 | 0.1% |
| Belarus | 510 | 0.1% |
| Belgium | 231 | 0.0% |
| Belize | 37 | 0.0% |
| Bolivia | 262 | 0.0% |
| Bosnia and Herzegovina | 783 | 0.1% |
| Brazil | 19,793 | 1.8% |
| Bulgaria | 825 | 0.1% |
| Cabo Verde | 7,169 | 0.6% |
| Cambodia | 686 | 0.1% |
| Cameroon | 395 | 0.0% |
| Canada | 6,061 | 0.5% |
| Caribbean | 47,041 | 4.2% |
| Central America | 41,434 | 3.7% |
| Chile | 902 | 0.1% |
| China | 56,038 | 5.0% |
| Colombia | 10,463 | 0.9% |
| Congo | 12 | 0.0% |
| Costa Rica | 787 | 0.1% |
| Croatia | 269 | 0.0% |
| Cuba | 1,045 | 0.1% |
| Czechoslovakia | 636 | 0.1% |
| Denmark | 347 | 0.0% |
| Dominica | 810 | 0.1% |
| Dominican Republic | 19,567 | 1.7% |
| Eastern Africa | 6,695 | 0.6% |
| Eastern Asia | 65,148 | 5.8% |
| Eastern Europe | 19,099 | 1.7% |
| Ecuador | 1,421 | 0.1% |
| Egypt | 1,189 | 0.1% |
| El Salvador | 22,621 | 2.0% |
| England | 1,534 | 0.1% |
| Eritrea | 359 | 0.0% |
| Ethiopia | 3,154 | 0.3% |
| Europe | 47,674 | 4.2% |
| Fiji | 14 | 0.0% |
| France | 2,567 | 0.2% |
| Germany | 2,934 | 0.3% |
| Ghana | 1,328 | 0.1% |
| Greece | 1,518 | 0.1% |
| Grenada | 311 | 0.0% |
| Guatemala | 6,150 | 0.5% |
| Guyana | 564 | 0.1% |
| Haiti | 16,039 | 1.4% |
| Honduras | 5,469 | 0.5% |
| Hong Kong | 3,665 | 0.3% |
| Hungary | 683 | 0.1% |
| India | 18,480 | 1.6% |
| Indonesia | 656 | 0.1% |
| Iran | 2,524 | 0.2% |
| Iraq | 644 | 0.1% |
| Ireland | 3,431 | 0.3% |
| Israel | 2,970 | 0.3% |
| Italy | 4,520 | 0.4% |
| Jamaica | 4,456 | 0.4% |
| Japan | 2,796 | 0.3% |
| Jordan | 448 | 0.0% |
| Kazakhstan | 164 | 0.0% |
| Kenya | 1,432 | 0.1% |
| Korea | 6,169 | 0.5% |
| Kuwait | 714 | 0.1% |
| Laos | 49 | 0.0% |
| Latin America | 127,177 | 11.3% |
| Latvia | 286 | 0.0% |
| Lebanon | 932 | 0.1% |
| Liberia | 214 | 0.0% |
| Lithuania | 157 | 0.0% |
| Malaysia | 638 | 0.1% |
| Mexico | 3,685 | 0.3% |
| Middle Africa | 909 | 0.1% |
| Moldova | 279 | 0.0% |
| Morocco | 3,543 | 0.3% |
| Nepal | 2,160 | 0.2% |
| Netherlands | 915 | 0.1% |
| Nicaragua | 391 | 0.0% |
| Nigeria | 1,987 | 0.2% |
| North Macedonia | 31 | 0.0% |
| Northern Africa | 5,938 | 0.5% |
| Northern Europe | 9,780 | 0.9% |
| Norway | 65 | 0.0% |
| Oceania | 1,168 | 0.1% |
| Pakistan | 1,653 | 0.2% |
| Panama | 425 | 0.0% |
| Peru | 2,287 | 0.2% |
| Philippines | 2,437 | 0.2% |
| Poland | 1,328 | 0.1% |
| Portugal | 3,206 | 0.3% |
| Romania | 887 | 0.1% |
| Russia | 4,499 | 0.4% |
| Saudi Arabia | 948 | 0.1% |
| Scotland | 215 | 0.0% |
| Senegal | 59 | 0.0% |
| Serbia | 566 | 0.1% |
| Sierra Leone | 544 | 0.1% |
| Singapore | 662 | 0.1% |
| Somalia | 695 | 0.1% |
| South Africa | 922 | 0.1% |
| South America | 38,702 | 3.4% |
| South Central Asia | 26,813 | 2.4% |
| South Eastern Asia | 19,404 | 1.7% |
| Southern Europe | 11,191 | 1.0% |
| Spain | 1,940 | 0.2% |
| Sri Lanka | 363 | 0.0% |
| St. Vincent and the Grenadines | 18 | 0.0% |
| Sudan | 240 | 0.0% |
| Sweden | 424 | 0.0% |
| Switzerland | 625 | 0.1% |
| Syria | 438 | 0.0% |
| Taiwan | 2,672 | 0.2% |
| Thailand | 967 | 0.1% |
| Trinidad and Tobago | 2,667 | 0.2% |
| Turkey | 2,224 | 0.2% |
| Uganda | 444 | 0.0% |
| Ukraine | 2,231 | 0.2% |
| Uruguay | 87 | 0.0% |
| Uzbekistan | 207 | 0.0% |
| Venezuela | 1,789 | 0.2% |
| Vietnam | 12,658 | 1.1% |
| West Indies | 361 | 0.0% |
| Western Africa | 12,072 | 1.1% |
| Western Asia | 11,401 | 1.0% |
| Western Europe | 7,484 | 0.7% |
| Yemen | 223 | 0.0% |
| Zaire | 152 | 0.0% |
| Zimbabwe | 140 | 0.0% | View All 136 Rows |
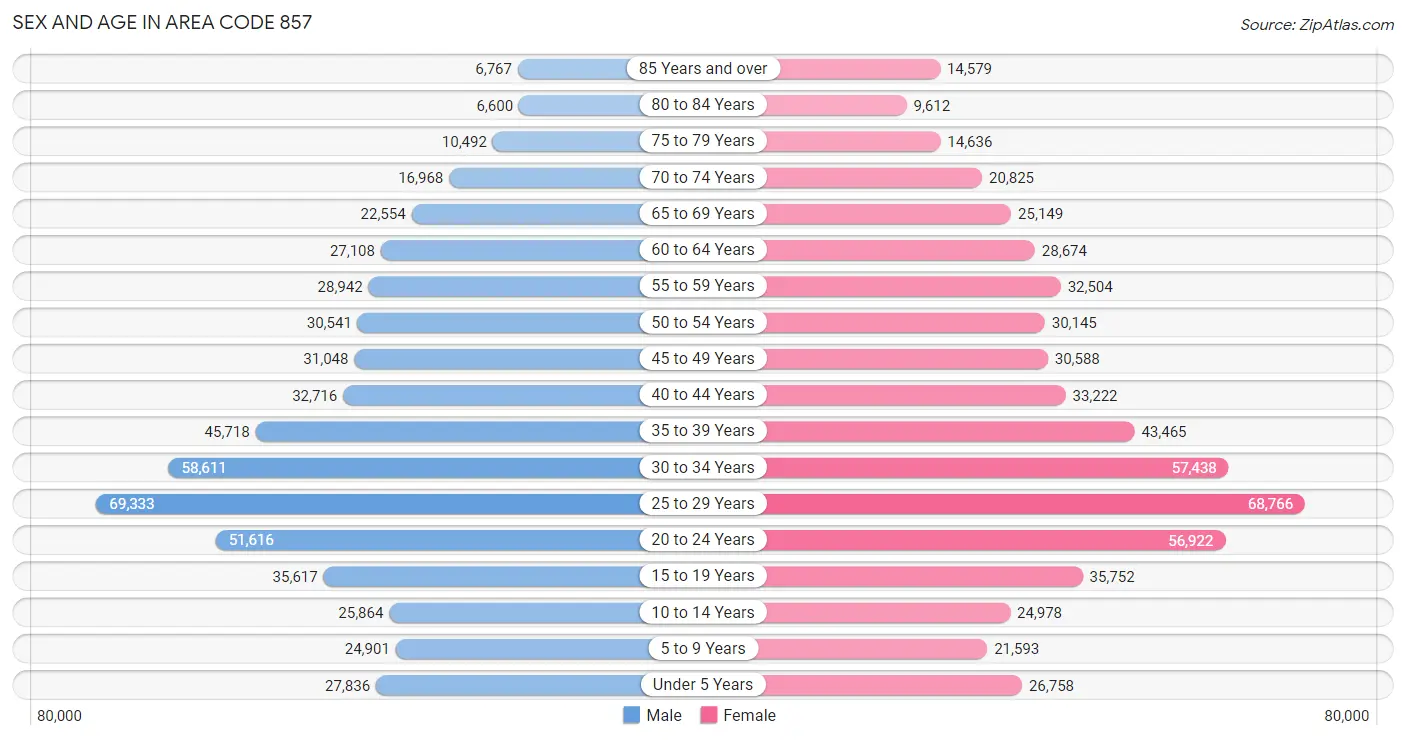
Sex and Age in Area Code 857
Sex and Age in Area Code 857
The most populous age groups in Area Code 857 are 25 to 29 Years (69,333 | 12.5%) for men and 25 to 29 Years (68,766 | 11.9%) for women.
| Age Bracket | Male | Female |
| Under 5 Years | 27,836 (5.0%) | 26,758 (4.6%) |
| 5 to 9 Years | 24,901 (4.5%) | 21,593 (3.7%) |
| 10 to 14 Years | 25,864 (4.7%) | 24,978 (4.3%) |
| 15 to 19 Years | 35,617 (6.4%) | 35,752 (6.2%) |
| 20 to 24 Years | 51,616 (9.3%) | 56,922 (9.9%) |
| 25 to 29 Years | 69,333 (12.5%) | 68,766 (11.9%) |
| 30 to 34 Years | 58,611 (10.6%) | 57,438 (10.0%) |
| 35 to 39 Years | 45,718 (8.3%) | 43,465 (7.5%) |
| 40 to 44 Years | 32,716 (5.9%) | 33,222 (5.8%) |
| 45 to 49 Years | 31,048 (5.6%) | 30,588 (5.3%) |
| 50 to 54 Years | 30,541 (5.5%) | 30,145 (5.2%) |
| 55 to 59 Years | 28,942 (5.2%) | 32,504 (5.7%) |
| 60 to 64 Years | 27,108 (4.9%) | 28,674 (5.0%) |
| 65 to 69 Years | 22,554 (4.1%) | 25,149 (4.4%) |
| 70 to 74 Years | 16,968 (3.1%) | 20,825 (3.6%) |
| 75 to 79 Years | 10,492 (1.9%) | 14,636 (2.5%) |
| 80 to 84 Years | 6,600 (1.2%) | 9,612 (1.7%) |
| 85 Years and over | 6,767 (1.2%) | 14,579 (2.5%) |
| Total | 553,232 (100.0%) | 575,606 (100.0%) |
Families and Households in Area Code 857
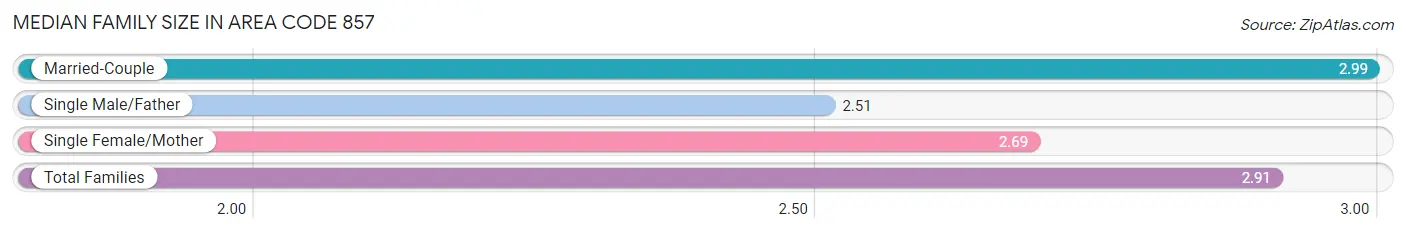
Median Family Size in Area Code 857
The median family size in Area Code 857 is 2.91 persons per family, with married-couple families (160,672 | 70.5%) accounting for the largest median family size of 2.99369 persons per family. On the other hand, single male/father families (17,911 | 7.9%) represent the smallest median family size with 2.51 persons per family.
| Family Type | # Families | Family Size |
| Married-Couple | 160,672 (70.5%) | 2.99 |
| Single Male/Father | 17,911 (7.9%) | 2.51 |
| Single Female/Mother | 49,281 (21.6%) | 2.69 |
| Total Families | 227,864 (100.0%) | 2.91 |
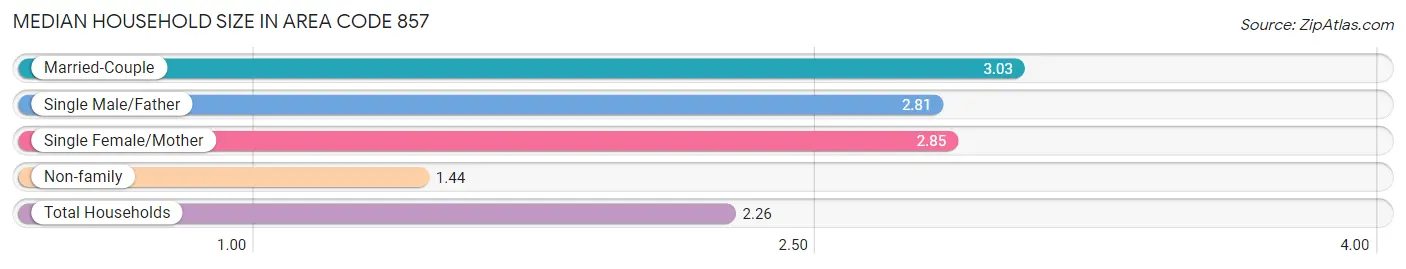
Median Household Size in Area Code 857
The median household size in Area Code 857 is 2.26 persons per household, with married-couple households (160,672 | 34.3%) accounting for the largest median household size of 3.03043 persons per household. non-family households (241,031 | 51.4%) represent the smallest median household size with 1.44 persons per household.
| Household Type | # Households | Household Size |
| Married-Couple | 160,672 (34.3%) | 3.03 |
| Single Male/Father | 17,911 (3.8%) | 2.81 |
| Single Female/Mother | 49,281 (10.5%) | 2.85 |
| Non-family | 241,031 (51.4%) | 1.44 |
| Total Households | 468,895 (100.0%) | 2.26 |
Household Size by Marriage Status in Area Code 857
Out of a total of 468,895 households in Area Code 857, 227,864 (48.6%) are family households, while 241,031 (51.4%) are nonfamily households. The most numerous type of family households are 2-person households, comprising 98,698, and the most common type of nonfamily households are 1-person households, comprising 162,302.
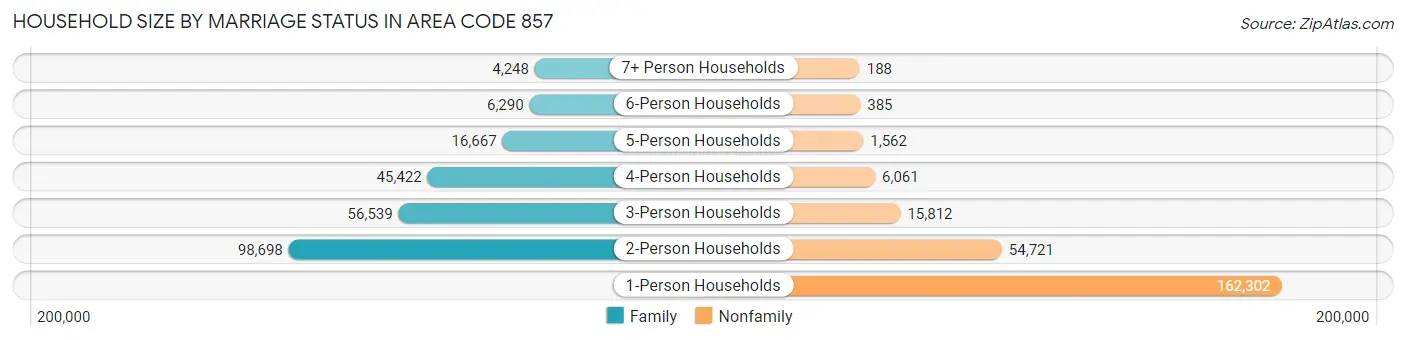
| Household Size | Family Households | Nonfamily Households |
| 1-Person Households | - | 162,302 (34.6%) |
| 2-Person Households | 98,698 (21.0%) | 54,721 (11.7%) |
| 3-Person Households | 56,539 (12.1%) | 15,812 (3.4%) |
| 4-Person Households | 45,422 (9.7%) | 6,061 (1.3%) |
| 5-Person Households | 16,667 (3.5%) | 1,562 (0.3%) |
| 6-Person Households | 6,290 (1.3%) | 385 (0.1%) |
| 7+ Person Households | 4,248 (0.9%) | 188 (0.0%) |
| Total | 227,864 (48.6%) | 241,031 (51.4%) |
Female Fertility in Area Code 857
Fertility by Age in Area Code 857
Average fertility rate in Area Code 857 is 32.5 births per 1,000 women. Women in the age bracket of 35 to 50 years have the highest fertility rate with 44.4 births per 1,000 women. Women in the age bracket of 20 to 34 years acount for 55.9% of all women with births.
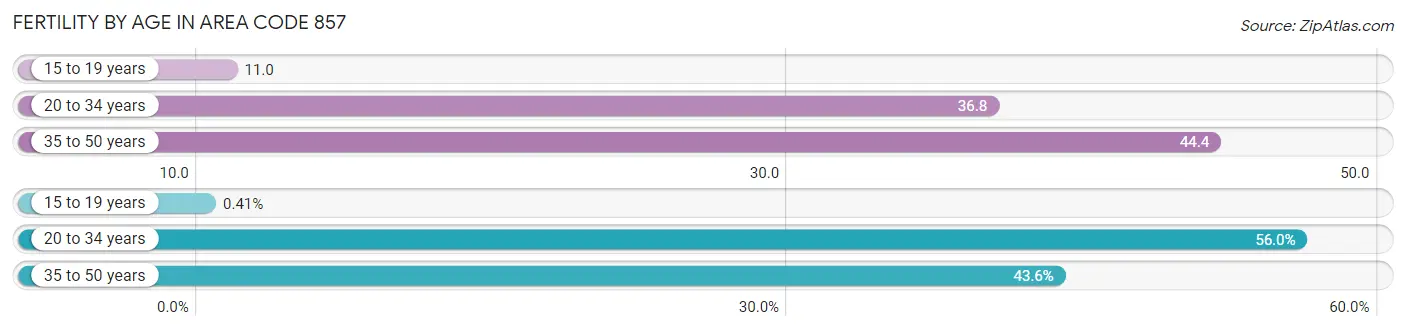
| Age Bracket | Women with Births | Births / 1,000 Women |
| 15 to 19 years | 47 (0.4%) | 11.0 |
| 20 to 34 years | 6,367 (55.9%) | 36.8 |
| 35 to 50 years | 4,966 (43.6%) | 44.4 |
| Total | 11,380 (100.0%) | 32.5 |
Fertility by Age by Marriage Status in Area Code 857
76.3% of women with births (11,380) in Area Code 857 are married. The highest percentage of unmarried women with births falls into 15 to 19 years age bracket with 100.0% of them unmarried at the time of birth, while the lowest percentage of unmarried women with births belong to 20 to 34 years age bracket with 29.6% of them unmarried.
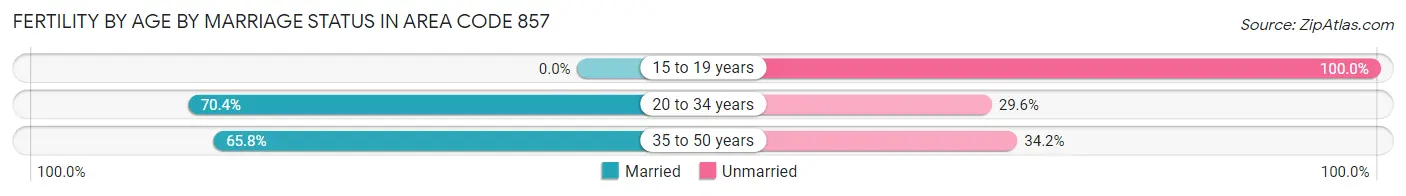
| Age Bracket | Married | Unmarried |
| 15 to 19 years | 0 (0.0%) | 47 (100.0%) |
| 20 to 34 years | 4,485 (70.4%) | 1,882 (29.6%) |
| 35 to 50 years | 3,268 (65.8%) | 1,698 (34.2%) |
| Total | 8,680 (76.3%) | 2,700 (23.7%) |
Fertility by Education in Area Code 857
Average fertility rate in Area Code 857 is 32.5 births per 1,000 women. Women with the education attainment of graduate degree have the highest fertility rate of 51.7 births per 1,000 women, while women with the education attainment of bachelor's degree have the lowest fertility at 33.6 births per 1,000 women. Women with the education attainment of graduate degree represent 38.1% of all women with births.
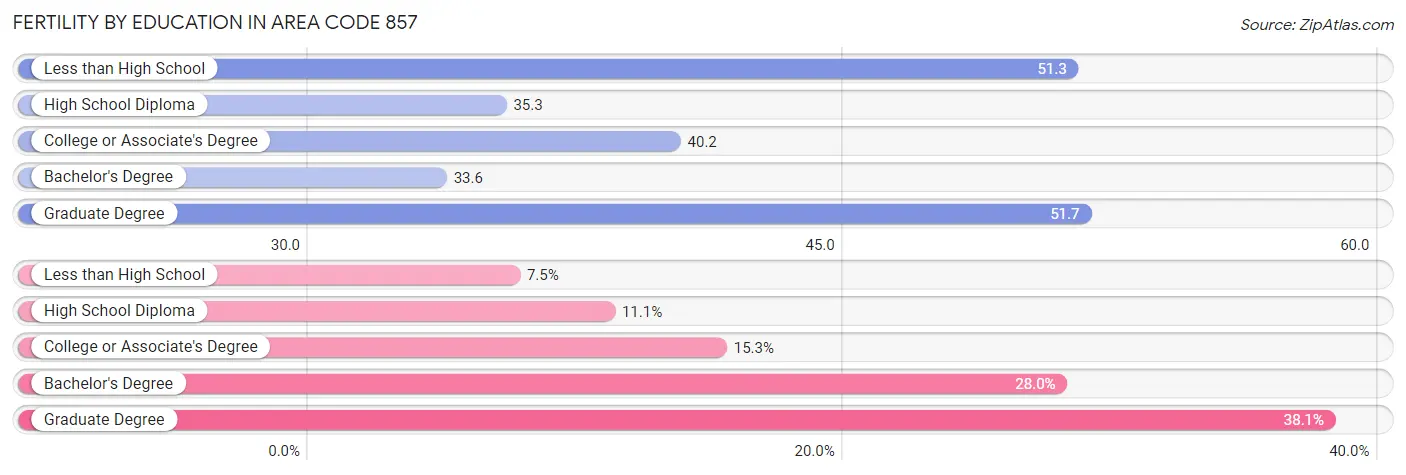
| Educational Attainment | Women with Births | Births / 1,000 Women |
| Less than High School | 856 (7.5%) | 51.3 |
| High School Diploma | 1,261 (11.1%) | 35.3 |
| College or Associate's Degree | 1,738 (15.3%) | 40.2 |
| Bachelor's Degree | 3,190 (28.0%) | 33.6 |
| Graduate Degree | 4,335 (38.1%) | 51.7 |
| Total | 11,380 (100.0%) | 32.5 |
Fertility by Education by Marriage Status in Area Code 857
23.7% of women with births in Area Code 857 are unmarried. Women with the educational attainment of graduate degree are most likely to be married with 82.4% of them married at childbirth, while women with the educational attainment of college or associate's degree are least likely to be married with 61.2% of them unmarried at childbirth.
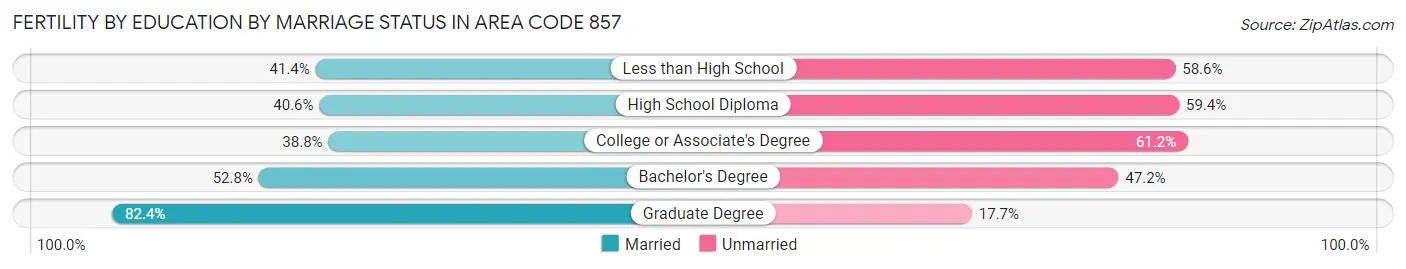
| Educational Attainment | Married | Unmarried |
| Less than High School | 354 (41.4%) | 502 (58.6%) |
| High School Diploma | 512 (40.6%) | 749 (59.4%) |
| College or Associate's Degree | 674 (38.8%) | 1,064 (61.2%) |
| Bachelor's Degree | 1,685 (52.8%) | 1,505 (47.2%) |
| Graduate Degree | 3,570 (82.4%) | 765 (17.6%) |
| Total | 8,680 (76.3%) | 2,700 (23.7%) |
Employment Characteristics in Area Code 857
Employment by Class of Employer in Area Code 857
Among the 628,512 employed individuals in Area Code 857, private company employees (401,279 | 63.8%), not-for-profit organizations (121,354 | 19.3%), and local government employees (31,386 | 5.0%) make up the most common classes of employment.
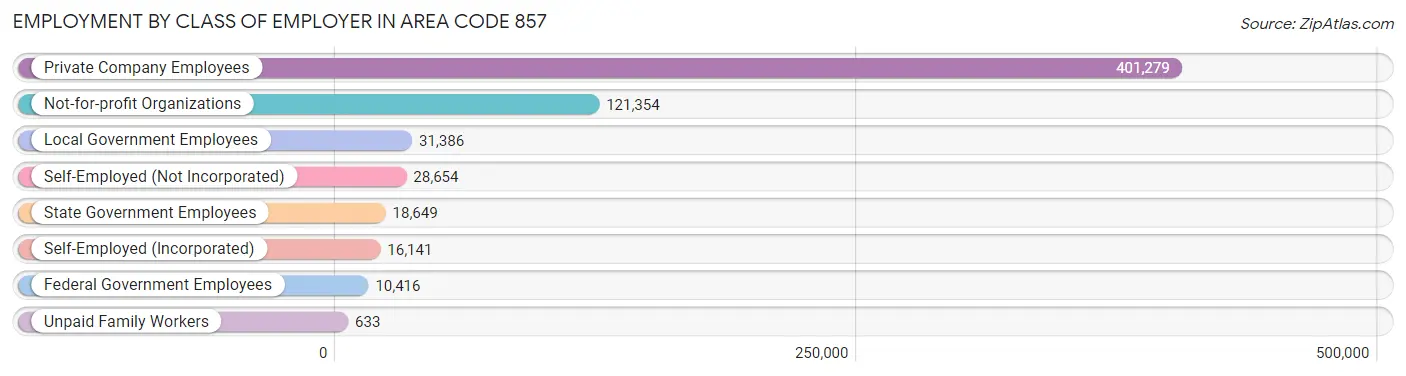
| Employer Class | # Employees | % Employees |
| Private Company Employees | 401,279 | 63.8% |
| Self-Employed (Incorporated) | 16,141 | 2.6% |
| Self-Employed (Not Incorporated) | 28,654 | 4.6% |
| Not-for-profit Organizations | 121,354 | 19.3% |
| Local Government Employees | 31,386 | 5.0% |
| State Government Employees | 18,649 | 3.0% |
| Federal Government Employees | 10,416 | 1.7% |
| Unpaid Family Workers | 633 | 0.1% |
| Total | 628,512 | 100.0% |
Employment Status by Age in Area Code 857
According to the labor force statistics for Area Code 857, out of the total population over 16 years of age (967,703), 69.8% or 675,457 individuals are in the labor force, with 5.5% or 37,353 of them unemployed. The age group with the highest labor force participation rate is 30 to 34 years, with 89.6% or 104,026 individuals in the labor force. Within the labor force, the 16 to 19 years age range has the highest percentage of unemployed individuals, with 805.7% or 191,628 of them being unemployed.
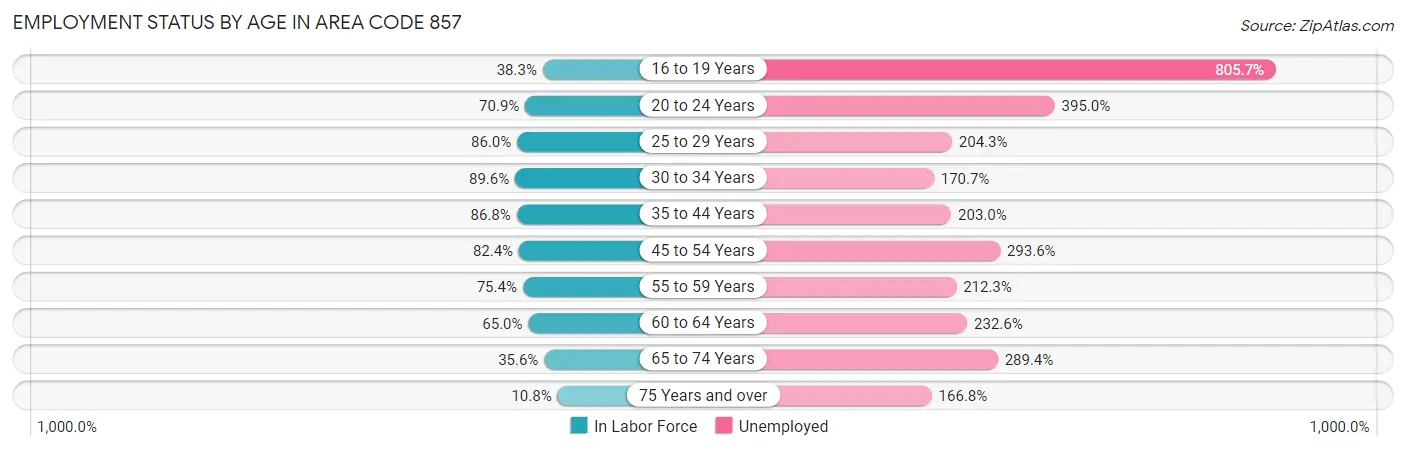
| Age Bracket | In Labor Force | Unemployed |
| 16 to 19 Years | 23,782 (38.3%) | 191,628 (805.7%) |
| 20 to 24 Years | 76,932 (70.9%) | 303,881 (395.0%) |
| 25 to 29 Years | 118,759 (86.0%) | 242,637 (204.3%) |
| 30 to 34 Years | 104,030 (89.6%) | 177,572 (170.7%) |
| 35 to 44 Years | 134,611 (86.8%) | 273,266 (203.0%) |
| 45 to 54 Years | 100,820 (82.4%) | 296,002 (293.6%) |
| 55 to 59 Years | 46,312 (75.4%) | 98,320 (212.3%) |
| 60 to 64 Years | 36,250 (65.0%) | 84,311 (232.6%) |
| 65 to 74 Years | 30,425 (35.6%) | 88,059 (289.4%) |
| 75 Years and over | 6,796 (10.8%) | 11,334 (166.8%) |
| Total | 675,478 (69.8%) | 37,341 (5.5%) |
Employment Status by Educational Attainment in Area Code 857
According to labor force statistics for Area Code 857, 83.5% of individuals (541,959) out of the total population between 25 and 64 years of age (648,819) are in the labor force, with 212.1% or 1,149,495 of them being unemployed. The group with the highest labor force participation rate are those with the educational attainment of bachelor's degree or higher, with 88.4% or 352,631 individuals in the labor force. Within the labor force, individuals with high school diploma education have the highest percentage of unemployment, with 516.6% or 357,353 of them being unemployed.
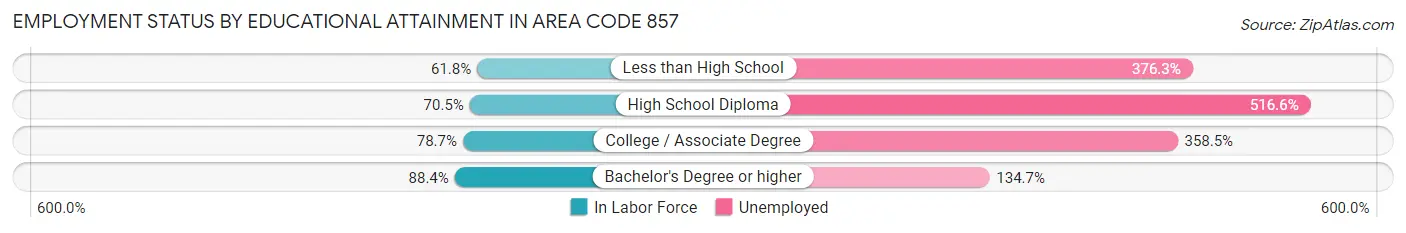
| Educational Attainment | In Labor Force | Unemployed |
| Less than High School | 33,243 (61.8%) | 202,585 (376.3%) |
| High School Diploma | 69,175 (70.5%) | 506,593 (516.6%) |
| College / Associate Degree | 77,252 (78.7%) | 351,875 (358.5%) |
| Bachelor's Degree or higher | 352,615 (88.4%) | 537,140 (134.7%) |
| Total | 541,947 (83.5%) | 1,376,145 (212.1%) |
Employment Occupations by Sex in Area Code 857
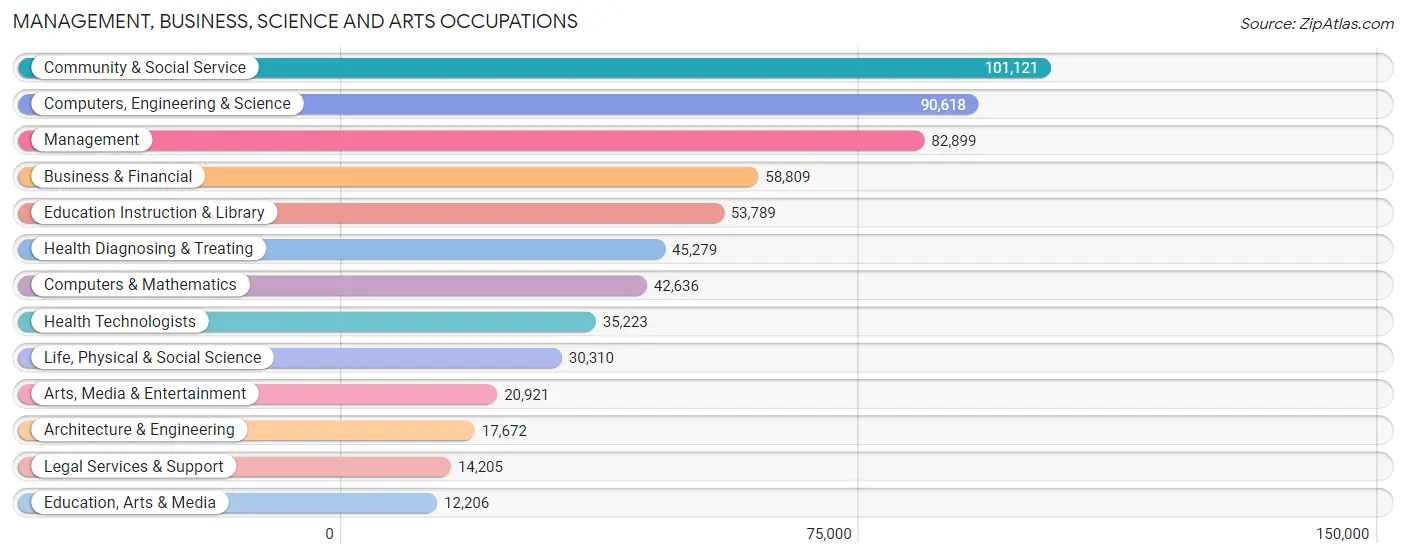
Management, Business, Science and Arts Occupations
The most common Management, Business, Science and Arts occupations in Area Code 857 are Community & Social Service (101,121 | 15.8%), Computers, Engineering & Science (90,618 | 14.1%), Management (82,899 | 13.0%), Business & Financial (58,809 | 9.2%), and Education Instruction & Library (53,789 | 8.4%).
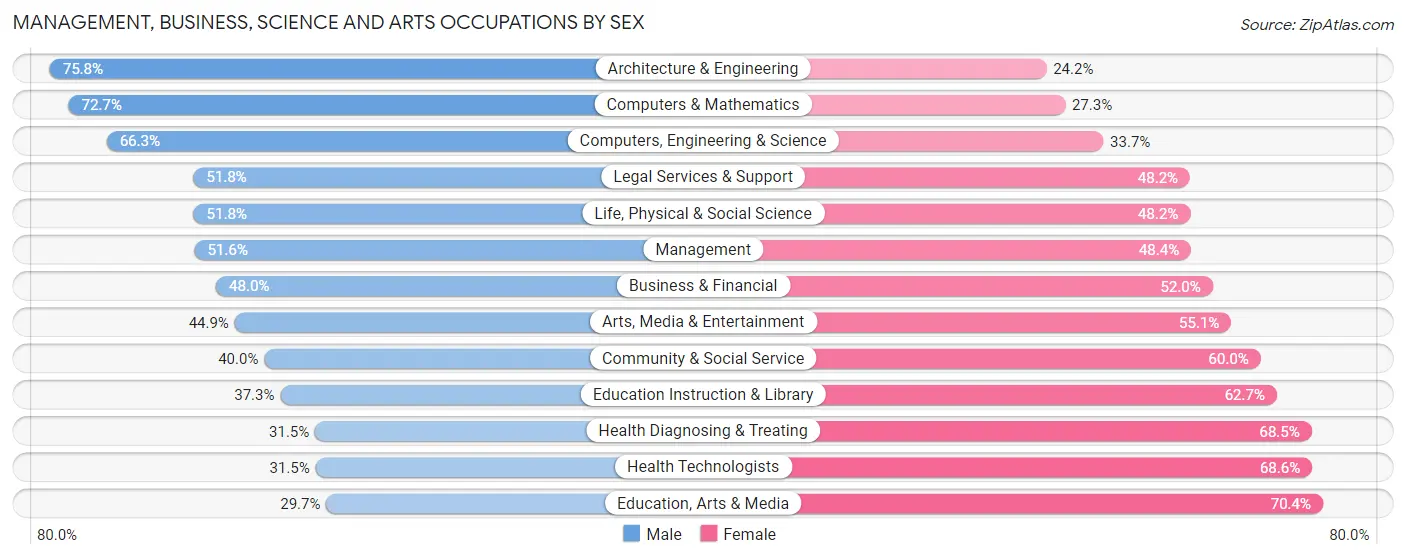
Management, Business, Science and Arts Occupations by Sex
Within the Management, Business, Science and Arts occupations in Area Code 857, the most male-oriented occupations are Architecture & Engineering (75.8%), Computers & Mathematics (72.7%), and Computers, Engineering & Science (66.3%), while the most female-oriented occupations are Education, Arts & Media (70.4%), Health Technologists (68.5%), and Health Diagnosing & Treating (68.5%).
| Occupation | Male | Female |
| Management | 42,810 (51.6%) | 40,089 (48.4%) |
| Business & Financial | 28,246 (48.0%) | 30,563 (52.0%) |
| Computers, Engineering & Science | 60,069 (66.3%) | 30,549 (33.7%) |
| Computers & Mathematics | 30,980 (72.7%) | 11,656 (27.3%) |
| Architecture & Engineering | 13,393 (75.8%) | 4,279 (24.2%) |
| Life, Physical & Social Science | 15,696 (51.8%) | 14,614 (48.2%) |
| Community & Social Service | 40,463 (40.0%) | 60,658 (60.0%) |
| Education, Arts & Media | 3,619 (29.6%) | 8,587 (70.4%) |
| Legal Services & Support | 7,361 (51.8%) | 6,844 (48.2%) |
| Education Instruction & Library | 20,082 (37.3%) | 33,707 (62.7%) |
| Arts, Media & Entertainment | 9,401 (44.9%) | 11,520 (55.1%) |
| Health Diagnosing & Treating | 14,274 (31.5%) | 31,005 (68.5%) |
| Health Technologists | 11,077 (31.5%) | 24,146 (68.5%) |
| Total (Category) | 185,862 (49.1%) | 192,864 (50.9%) |
| Total (Overall) | 323,136 (50.5%) | 317,220 (49.5%) |
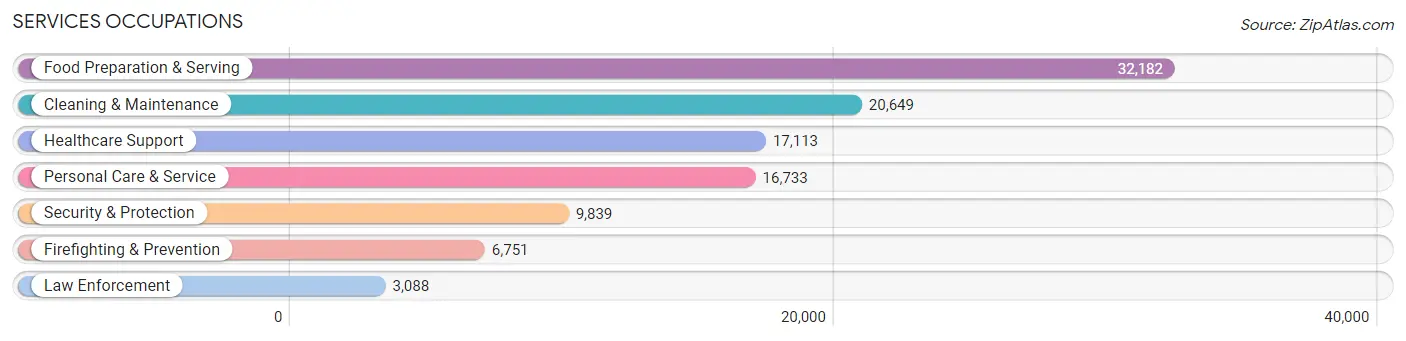
Services Occupations
The most common Services occupations in Area Code 857 are Food Preparation & Serving (32,182 | 5.0%), Cleaning & Maintenance (20,649 | 3.2%), Healthcare Support (17,113 | 2.7%), Personal Care & Service (16,733 | 2.6%), and Security & Protection (9,839 | 1.5%).
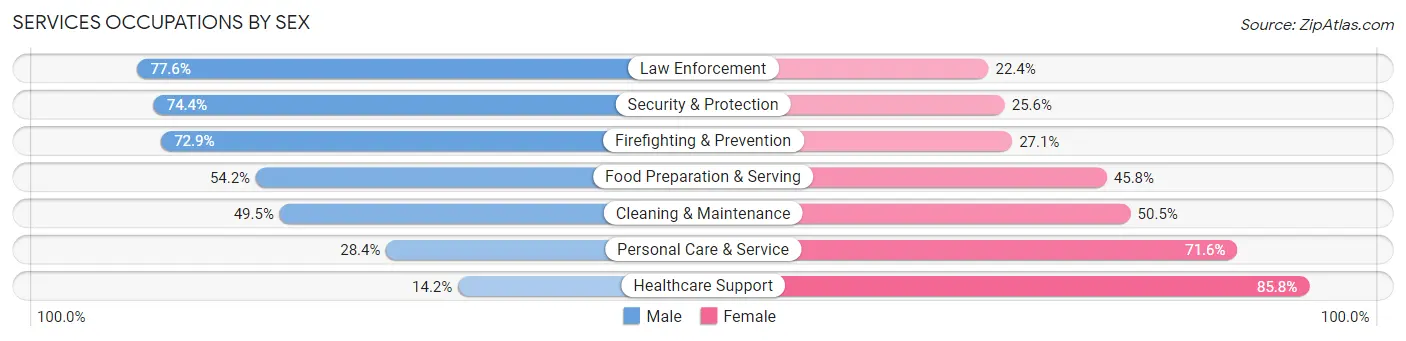
Services Occupations by Sex
Within the Services occupations in Area Code 857, the most male-oriented occupations are Law Enforcement (77.6%), Security & Protection (74.4%), and Firefighting & Prevention (72.9%), while the most female-oriented occupations are Healthcare Support (85.8%), Personal Care & Service (71.6%), and Cleaning & Maintenance (50.5%).
| Occupation | Male | Female |
| Healthcare Support | 2,423 (14.2%) | 14,690 (85.8%) |
| Security & Protection | 7,321 (74.4%) | 2,518 (25.6%) |
| Firefighting & Prevention | 4,924 (72.9%) | 1,827 (27.1%) |
| Law Enforcement | 2,397 (77.6%) | 691 (22.4%) |
| Food Preparation & Serving | 17,441 (54.2%) | 14,741 (45.8%) |
| Cleaning & Maintenance | 10,218 (49.5%) | 10,431 (50.5%) |
| Personal Care & Service | 4,748 (28.4%) | 11,985 (71.6%) |
| Total (Category) | 42,151 (43.7%) | 54,365 (56.3%) |
| Total (Overall) | 323,136 (50.5%) | 317,220 (49.5%) |
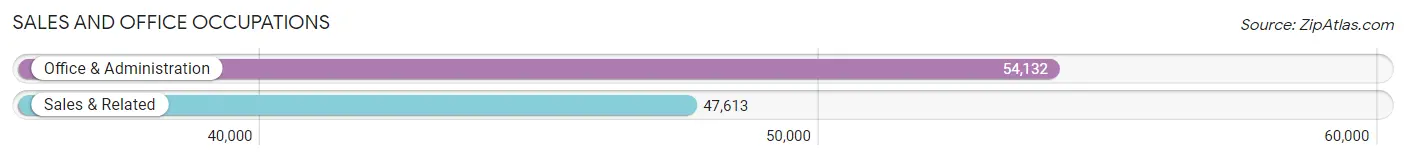
Sales and Office Occupations
The most common Sales and Office occupations in Area Code 857 are Office & Administration (54,132 | 8.5%), and Sales & Related (47,613 | 7.4%).
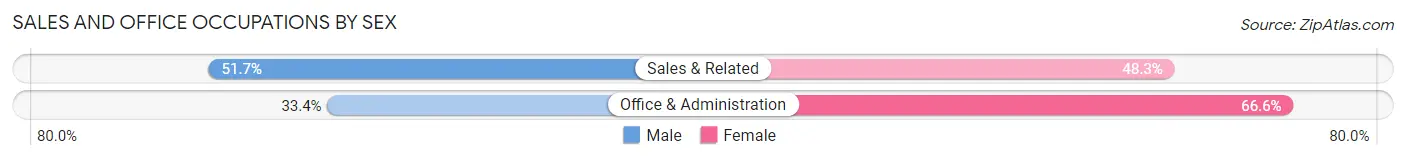
Sales and Office Occupations by Sex
| Occupation | Male | Female |
| Sales & Related | 24,607 (51.7%) | 23,006 (48.3%) |
| Office & Administration | 18,085 (33.4%) | 36,047 (66.6%) |
| Total (Category) | 42,692 (42.0%) | 59,053 (58.0%) |
| Total (Overall) | 323,136 (50.5%) | 317,220 (49.5%) |
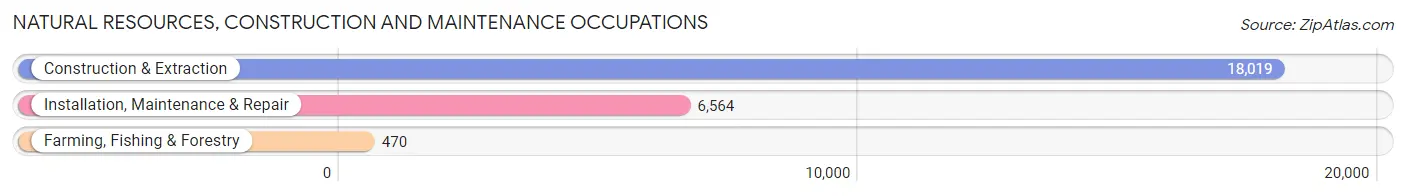
Natural Resources, Construction and Maintenance Occupations
The most common Natural Resources, Construction and Maintenance occupations in Area Code 857 are Construction & Extraction (18,019 | 2.8%), Installation, Maintenance & Repair (6,564 | 1.0%), and Farming, Fishing & Forestry (470 | 0.1%).
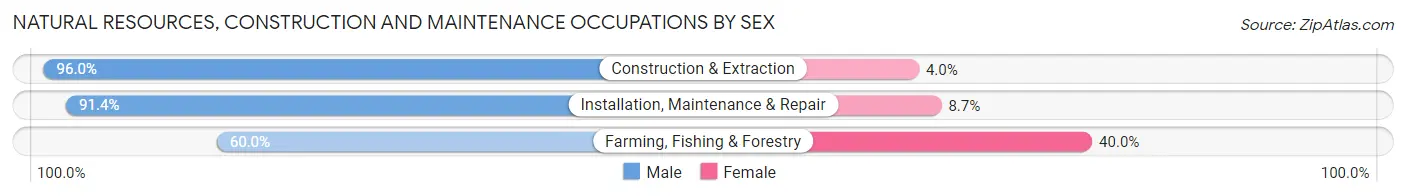
Natural Resources, Construction and Maintenance Occupations by Sex
| Occupation | Male | Female |
| Farming, Fishing & Forestry | 282 (60.0%) | 188 (40.0%) |
| Construction & Extraction | 17,304 (96.0%) | 715 (4.0%) |
| Installation, Maintenance & Repair | 5,996 (91.3%) | 568 (8.6%) |
| Total (Category) | 23,582 (94.1%) | 1,471 (5.9%) |
| Total (Overall) | 323,136 (50.5%) | 317,220 (49.5%) |
Production, Transportation and Moving Occupations
The most common Production, Transportation and Moving occupations in Area Code 857 are Transportation (15,033 | 2.4%), Production (13,035 | 2.0%), and Material Moving (10,248 | 1.6%).
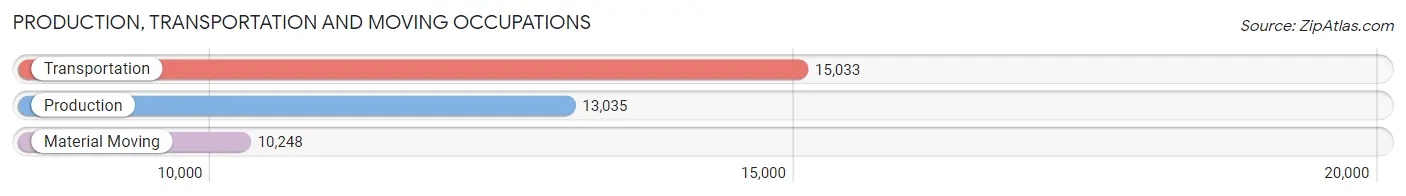
Production, Transportation and Moving Occupations by Sex
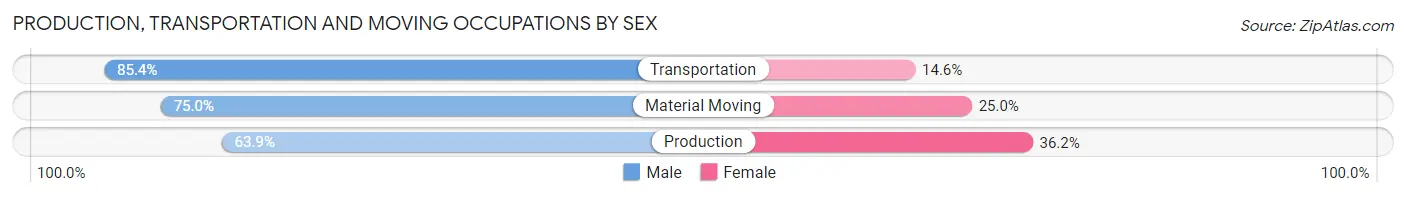
| Occupation | Male | Female |
| Production | 8,323 (63.8%) | 4,712 (36.1%) |
| Transportation | 12,838 (85.4%) | 2,195 (14.6%) |
| Material Moving | 7,688 (75.0%) | 2,560 (25.0%) |
| Total (Category) | 28,849 (75.3%) | 9,467 (24.7%) |
| Total (Overall) | 323,136 (50.5%) | 317,220 (49.5%) |
Employment Industries by Sex in Area Code 857
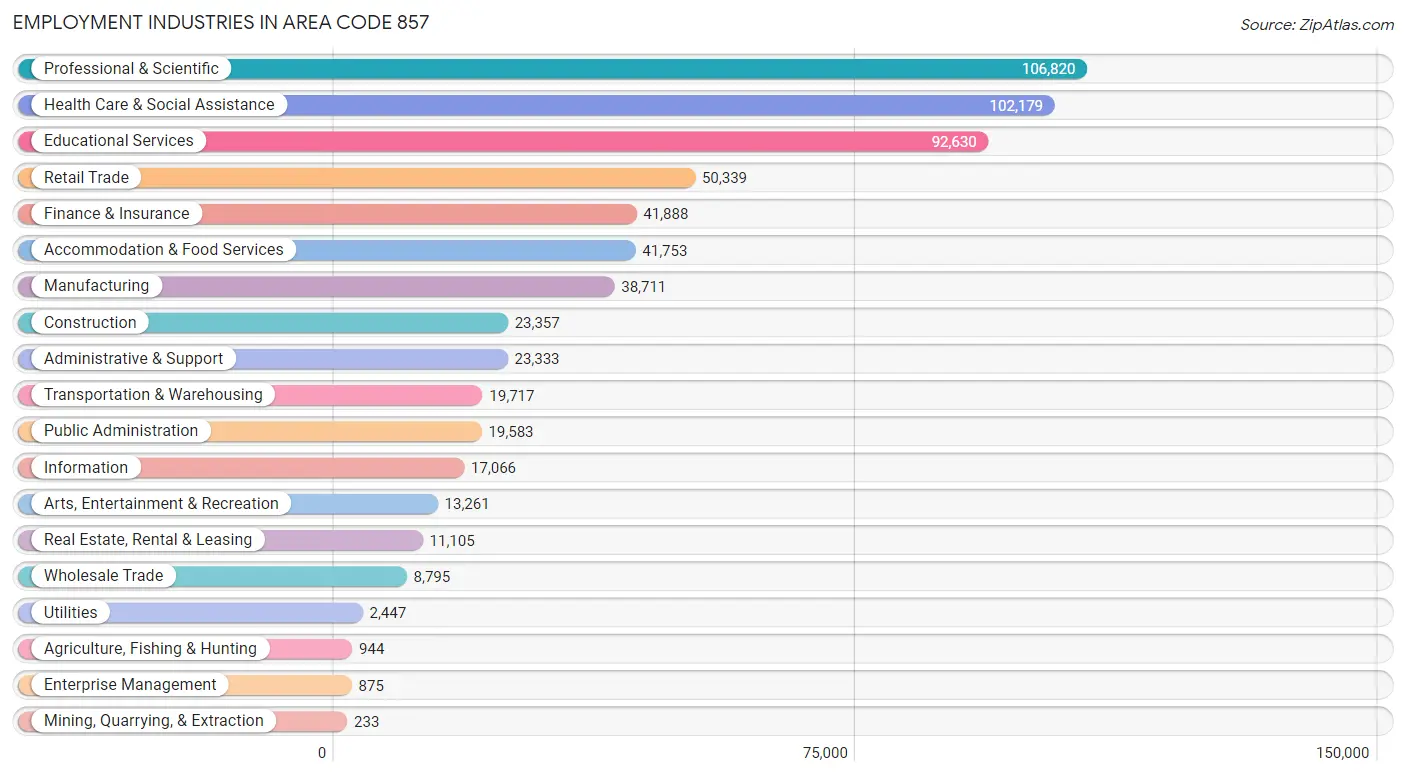
Employment Industries in Area Code 857
The major employment industries in Area Code 857 include Professional & Scientific (106,820 | 16.7%), Health Care & Social Assistance (102,179 | 16.0%), Educational Services (92,630 | 14.5%), Retail Trade (50,339 | 7.9%), and Finance & Insurance (41,888 | 6.5%).
Employment Industries by Sex in Area Code 857
The Area Code 857 industries that see more men than women are Mining, Quarrying, & Extraction (93.1%), Construction (89.1%), and Transportation & Warehousing (76.8%), whereas the industries that tend to have a higher number of women are Health Care & Social Assistance (72.1%), Educational Services (60.0%), and Enterprise Management (55.4%).
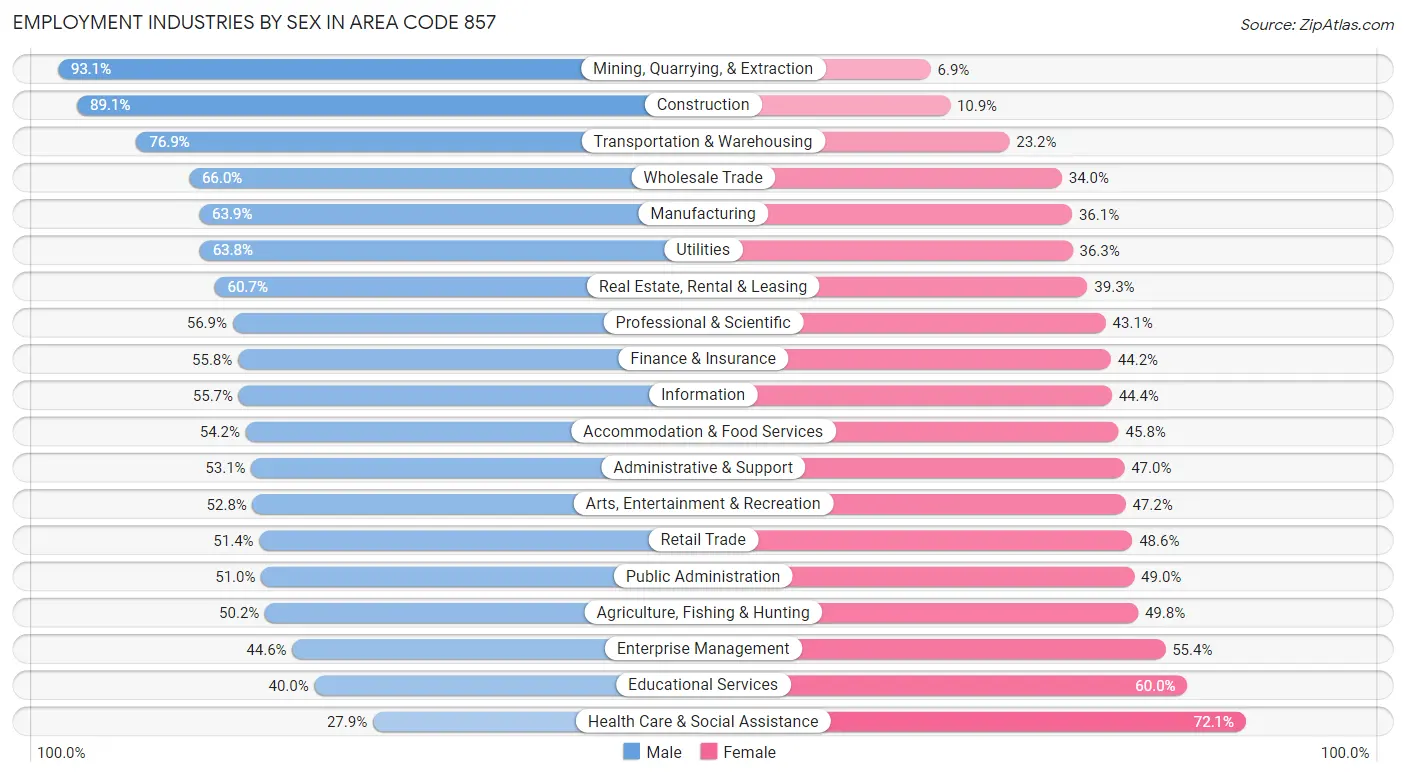
| Industry | Male | Female |
| Agriculture, Fishing & Hunting | 474 (50.2%) | 470 (49.8%) |
| Mining, Quarrying, & Extraction | 217 (93.1%) | 16 (6.9%) |
| Construction | 20,818 (89.1%) | 2,539 (10.9%) |
| Manufacturing | 24,726 (63.9%) | 13,985 (36.1%) |
| Wholesale Trade | 5,803 (66.0%) | 2,992 (34.0%) |
| Retail Trade | 25,873 (51.4%) | 24,466 (48.6%) |
| Transportation & Warehousing | 15,152 (76.8%) | 4,565 (23.2%) |
| Utilities | 1,560 (63.7%) | 887 (36.2%) |
| Information | 9,497 (55.6%) | 7,569 (44.4%) |
| Finance & Insurance | 23,377 (55.8%) | 18,511 (44.2%) |
| Real Estate, Rental & Leasing | 6,739 (60.7%) | 4,366 (39.3%) |
| Professional & Scientific | 60,778 (56.9%) | 46,042 (43.1%) |
| Enterprise Management | 390 (44.6%) | 485 (55.4%) |
| Administrative & Support | 12,377 (53.0%) | 10,956 (46.9%) |
| Educational Services | 37,043 (40.0%) | 55,587 (60.0%) |
| Health Care & Social Assistance | 28,498 (27.9%) | 73,681 (72.1%) |
| Arts, Entertainment & Recreation | 7,000 (52.8%) | 6,261 (47.2%) |
| Accommodation & Food Services | 22,633 (54.2%) | 19,120 (45.8%) |
| Public Administration | 9,988 (51.0%) | 9,595 (49.0%) |
| Total | 323,136 (50.5%) | 317,220 (49.5%) |
Education in Area Code 857
School Enrollment in Area Code 857
The most common levels of schooling among the 296,739 students in Area Code 857 are college / undergraduate (99,842 | 33.7%), graduate / professional (52,780 | 17.8%), and high school (41,147 | 13.9%).
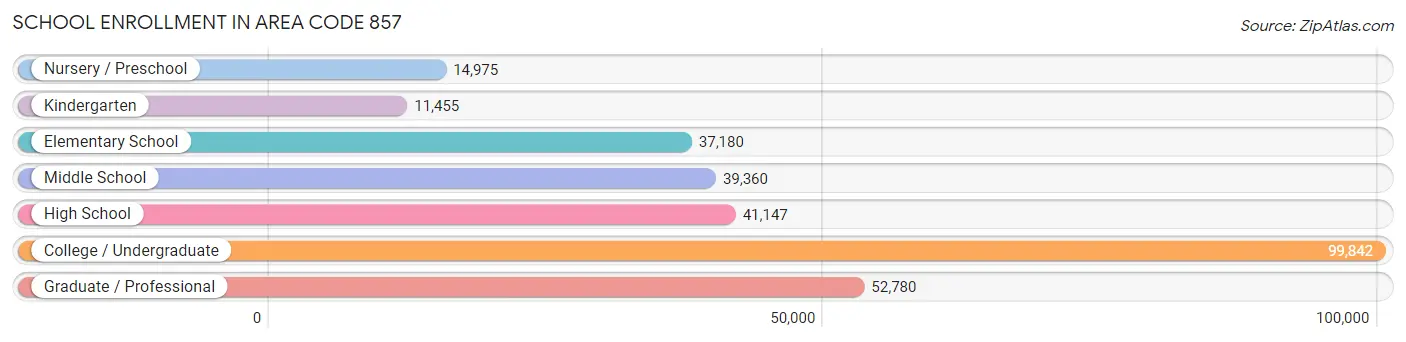
| School Level | # Students | % Students |
| Nursery / Preschool | 14,975 | 5.1% |
| Kindergarten | 11,455 | 3.9% |
| Elementary School | 37,180 | 12.5% |
| Middle School | 39,360 | 13.3% |
| High School | 41,147 | 13.9% |
| College / Undergraduate | 99,842 | 33.7% |
| Graduate / Professional | 52,780 | 17.8% |
| Total | 296,739 | 100.0% |
School Enrollment by Age by Funding Source in Area Code 857
Out of a total of 296,739 students who are enrolled in schools in Area Code 857, 140,600 (47.4%) attend a private institution, while the remaining 156,139 (52.6%) are enrolled in public schools. The age group of 20 to 24 year olds has the highest likelihood of being enrolled in private schools, with 48,705 (76.4% in the age bracket) enrolled. Conversely, the age group of 10 to 14 year olds has the lowest likelihood of being enrolled in a private school, with 43,423 (87.6% in the age bracket) attending a public institution.
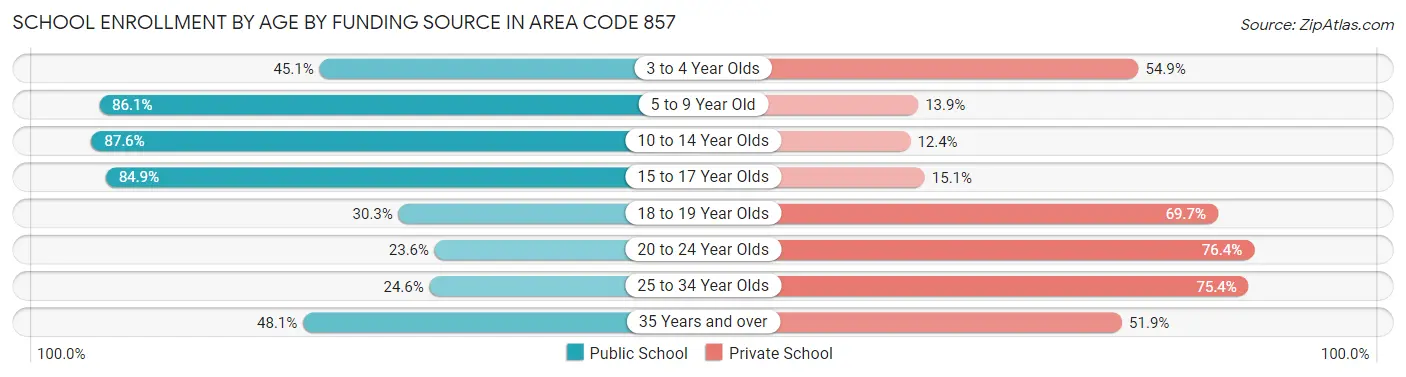
| Age Bracket | Public School | Private School |
| 3 to 4 Year Olds | 6,187 (45.1%) | 7,541 (54.9%) |
| 5 to 9 Year Old | 37,985 (86.1%) | 6,123 (13.9%) |
| 10 to 14 Year Olds | 43,423 (87.6%) | 6,168 (12.4%) |
| 15 to 17 Year Olds | 23,693 (84.9%) | 4,219 (15.1%) |
| 18 to 19 Year Olds | 11,890 (30.3%) | 27,313 (69.7%) |
| 20 to 24 Year Olds | 15,025 (23.6%) | 48,705 (76.4%) |
| 25 to 34 Year Olds | 10,622 (24.6%) | 32,585 (75.4%) |
| 35 Years and over | 7,344 (48.1%) | 7,916 (51.9%) |
| Total | 156,139 (52.6%) | 140,600 (47.4%) |
Educational Attainment by Field of Study in Area Code 857
Business (76,339 | 15.0%), social sciences (62,844 | 12.4%), bio, nature & agricultural (45,362 | 8.9%), engineering (45,159 | 8.9%), and science & technology (35,763 | 7.0%) are the most common fields of study among 508,560 individuals in Area Code 857 who have obtained a bachelor's degree or higher.
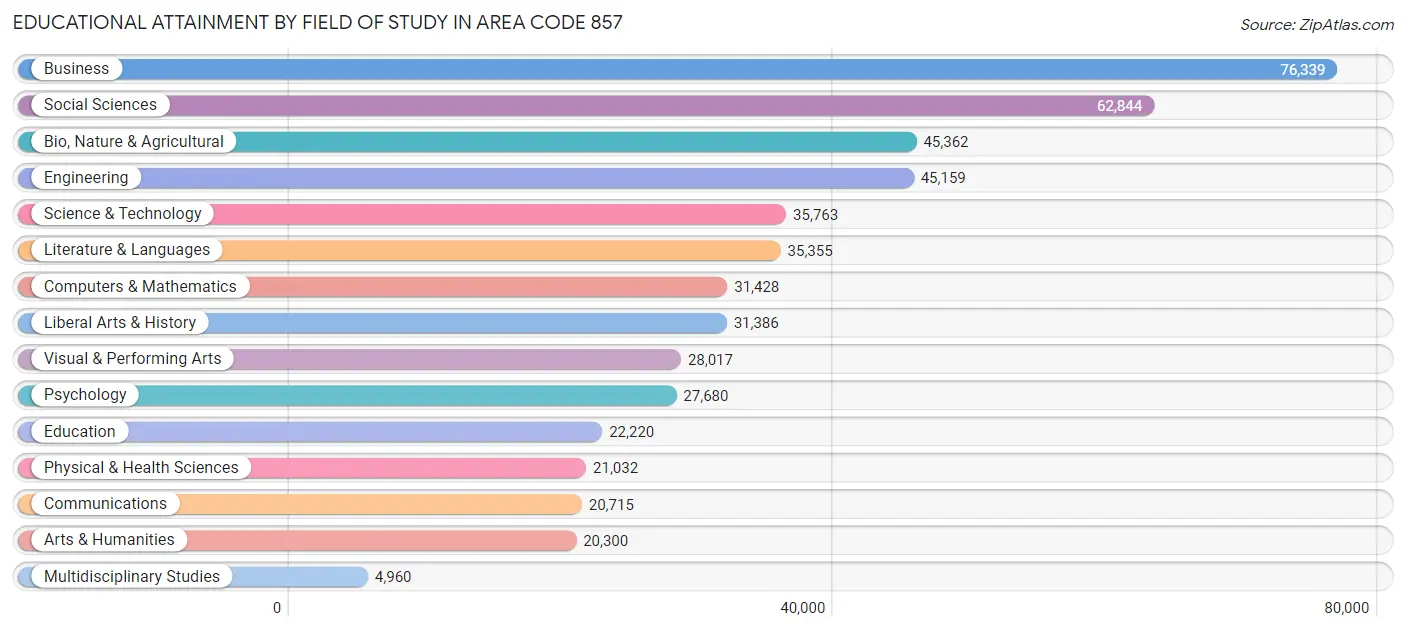
| Field of Study | # Graduates | % Graduates |
| Computers & Mathematics | 31,428 | 6.2% |
| Bio, Nature & Agricultural | 45,362 | 8.9% |
| Physical & Health Sciences | 21,032 | 4.1% |
| Psychology | 27,680 | 5.4% |
| Social Sciences | 62,844 | 12.4% |
| Engineering | 45,159 | 8.9% |
| Multidisciplinary Studies | 4,960 | 1.0% |
| Science & Technology | 35,763 | 7.0% |
| Business | 76,339 | 15.0% |
| Education | 22,220 | 4.4% |
| Literature & Languages | 35,355 | 7.0% |
| Liberal Arts & History | 31,386 | 6.2% |
| Visual & Performing Arts | 28,017 | 5.5% |
| Communications | 20,715 | 4.1% |
| Arts & Humanities | 20,300 | 4.0% |
| Total | 508,560 | 100.0% |
Transportation & Commute in Area Code 857
Vehicle Availability by Sex in Area Code 857
The most prevalent vehicle ownership categories in Area Code 857 are males with 1 vehicle (124,260, accounting for 40.0%) and females with 1 vehicle (122,980, making up 41.6%).
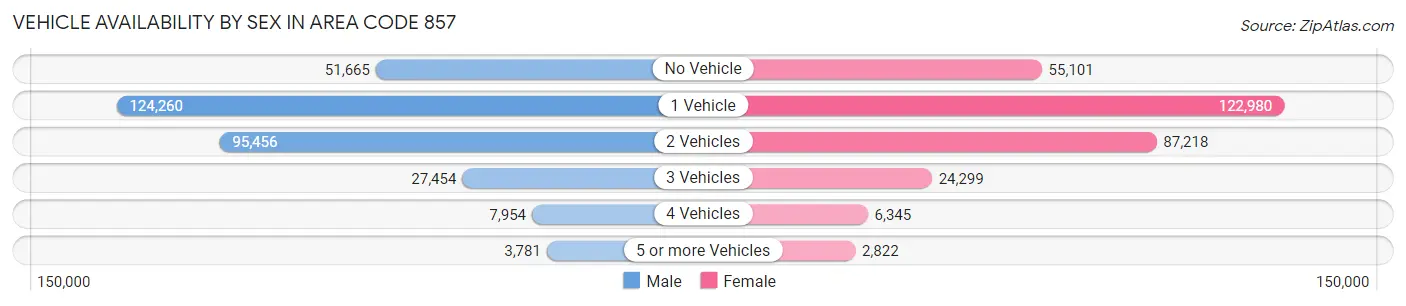
| Vehicles Available | Male | Female |
| No Vehicle | 51,665 (16.6%) | 55,101 (18.4%) |
| 1 Vehicle | 124,260 (40.0%) | 122,980 (41.2%) |
| 2 Vehicles | 95,456 (30.7%) | 87,218 (29.2%) |
| 3 Vehicles | 27,454 (8.8%) | 24,299 (8.1%) |
| 4 Vehicles | 7,954 (2.6%) | 6,345 (2.1%) |
| 5 or more Vehicles | 3,781 (1.2%) | 2,822 (0.9%) |
| Total | 310,570 (100.0%) | 298,765 (100.0%) |
Commute Time in Area Code 857
The most frequently occuring commute durations in Area Code 857 are 30 to 34 minutes (94,752 commuters, 18.4%), 20 to 24 minutes (66,389 commuters, 12.9%), and 45 to 59 minutes (65,059 commuters, 12.6%).
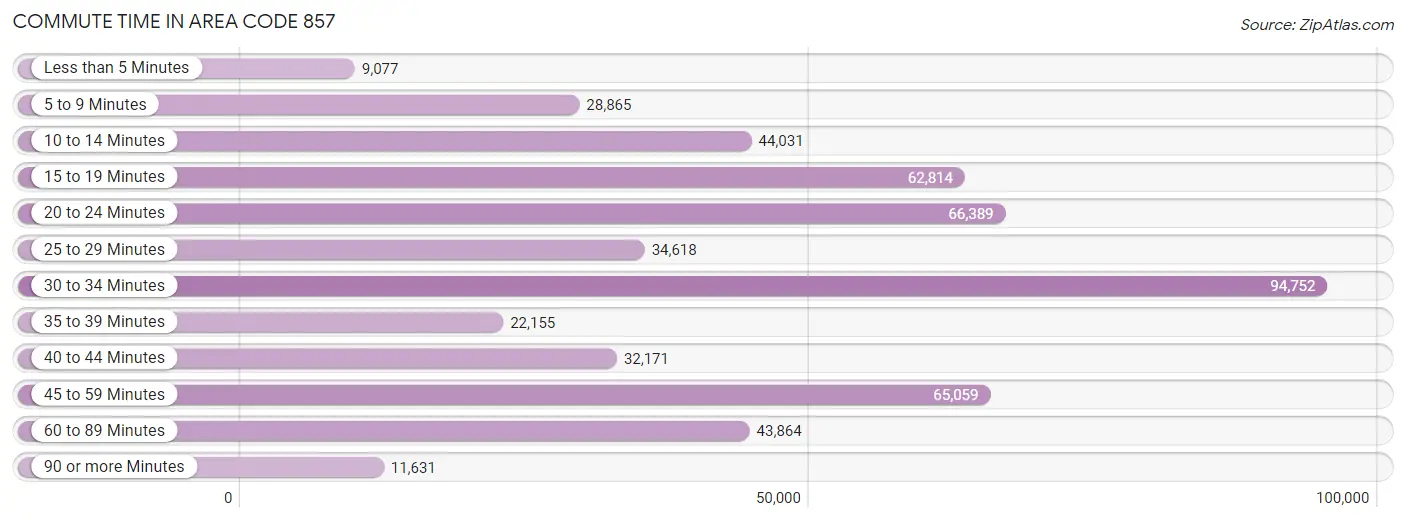
| Commute Time | # Commuters | % Commuters |
| Less than 5 Minutes | 9,077 | 1.8% |
| 5 to 9 Minutes | 28,865 | 5.6% |
| 10 to 14 Minutes | 44,031 | 8.5% |
| 15 to 19 Minutes | 62,814 | 12.2% |
| 20 to 24 Minutes | 66,389 | 12.9% |
| 25 to 29 Minutes | 34,618 | 6.7% |
| 30 to 34 Minutes | 94,752 | 18.4% |
| 35 to 39 Minutes | 22,155 | 4.3% |
| 40 to 44 Minutes | 32,171 | 6.2% |
| 45 to 59 Minutes | 65,059 | 12.6% |
| 60 to 89 Minutes | 43,864 | 8.5% |
| 90 or more Minutes | 11,631 | 2.3% |
Commute Time by Sex in Area Code 857
The most common commute times in Area Code 857 are 30 to 34 minutes (50,120 commuters, 19.2%) for males and 30 to 34 minutes (44,632 commuters, 17.6%) for females.
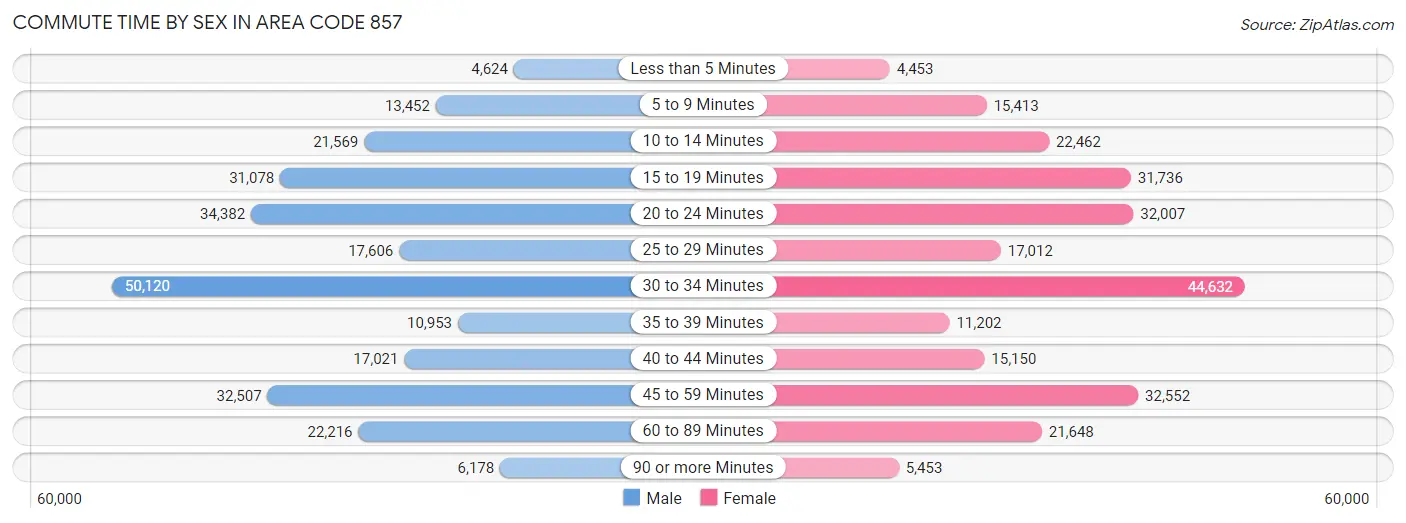
| Commute Time | Male | Female |
| Less than 5 Minutes | 4,624 (1.8%) | 4,453 (1.8%) |
| 5 to 9 Minutes | 13,452 (5.1%) | 15,413 (6.1%) |
| 10 to 14 Minutes | 21,569 (8.2%) | 22,462 (8.8%) |
| 15 to 19 Minutes | 31,078 (11.9%) | 31,736 (12.5%) |
| 20 to 24 Minutes | 34,382 (13.1%) | 32,007 (12.6%) |
| 25 to 29 Minutes | 17,606 (6.7%) | 17,012 (6.7%) |
| 30 to 34 Minutes | 50,120 (19.2%) | 44,632 (17.6%) |
| 35 to 39 Minutes | 10,953 (4.2%) | 11,202 (4.4%) |
| 40 to 44 Minutes | 17,021 (6.5%) | 15,150 (6.0%) |
| 45 to 59 Minutes | 32,507 (12.4%) | 32,552 (12.8%) |
| 60 to 89 Minutes | 22,216 (8.5%) | 21,648 (8.5%) |
| 90 or more Minutes | 6,178 (2.4%) | 5,453 (2.1%) |
Time of Departure to Work by Sex in Area Code 857
The most frequent times of departure to work in Area Code 857 are 8:00 AM to 8:29 AM (41,357, 15.8%) for males and 8:00 AM to 8:29 AM (45,033, 17.7%) for females.
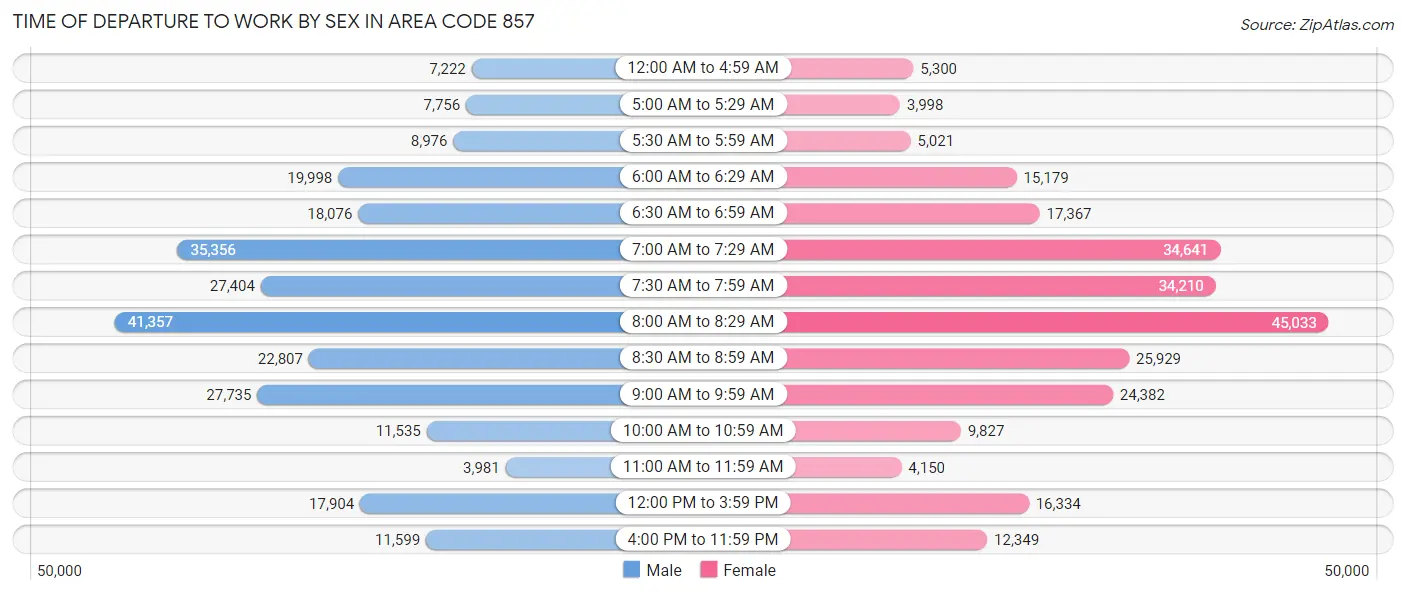
| Time of Departure | Male | Female |
| 12:00 AM to 4:59 AM | 7,222 (2.8%) | 5,300 (2.1%) |
| 5:00 AM to 5:29 AM | 7,756 (3.0%) | 3,998 (1.6%) |
| 5:30 AM to 5:59 AM | 8,976 (3.4%) | 5,021 (2.0%) |
| 6:00 AM to 6:29 AM | 19,998 (7.6%) | 15,179 (6.0%) |
| 6:30 AM to 6:59 AM | 18,076 (6.9%) | 17,367 (6.8%) |
| 7:00 AM to 7:29 AM | 35,356 (13.5%) | 34,641 (13.7%) |
| 7:30 AM to 7:59 AM | 27,404 (10.5%) | 34,210 (13.5%) |
| 8:00 AM to 8:29 AM | 41,357 (15.8%) | 45,033 (17.7%) |
| 8:30 AM to 8:59 AM | 22,807 (8.7%) | 25,929 (10.2%) |
| 9:00 AM to 9:59 AM | 27,735 (10.6%) | 24,382 (9.6%) |
| 10:00 AM to 10:59 AM | 11,535 (4.4%) | 9,827 (3.9%) |
| 11:00 AM to 11:59 AM | 3,981 (1.5%) | 4,150 (1.6%) |
| 12:00 PM to 3:59 PM | 17,904 (6.8%) | 16,334 (6.4%) |
| 4:00 PM to 11:59 PM | 11,599 (4.4%) | 12,349 (4.9%) |
| Total | 261,706 (100.0%) | 253,720 (100.0%) |
Housing Occupancy in Area Code 857
Occupancy by Ownership in Area Code 857
Of the total 468,895 dwellings in Area Code 857, owner-occupied units account for 181,736 (38.8%), while renter-occupied units make up 287,159 (61.2%).
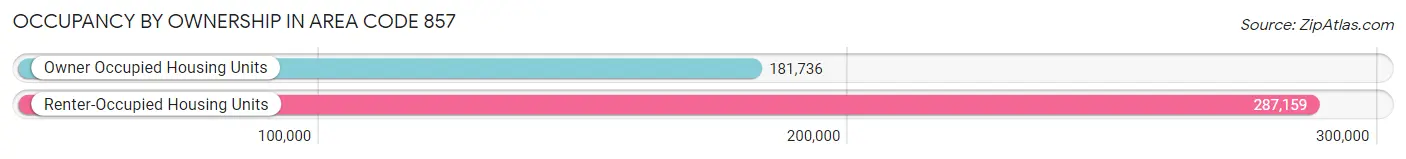
| Occupancy | # Housing Units | % Housing Units |
| Owner Occupied Housing Units | 181,736 | 38.8% |
| Renter-Occupied Housing Units | 287,159 | 61.2% |
| Total Occupied Housing Units | 468,895 | 100.0% |
Occupancy by Household Size in Area Code 857
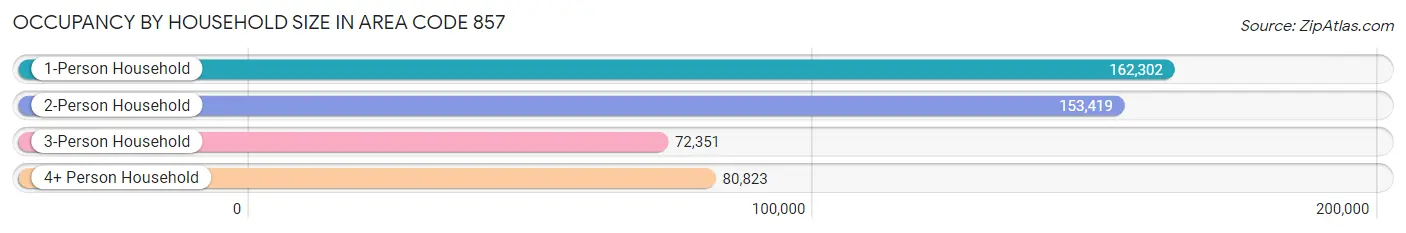
| Household Size | # Housing Units | % Housing Units |
| 1-Person Household | 162,302 | 34.6% |
| 2-Person Household | 153,419 | 32.7% |
| 3-Person Household | 72,351 | 15.4% |
| 4+ Person Household | 80,823 | 17.2% |
| Total Housing Units | 468,895 | 100.0% |
Occupancy by Ownership by Household Size in Area Code 857
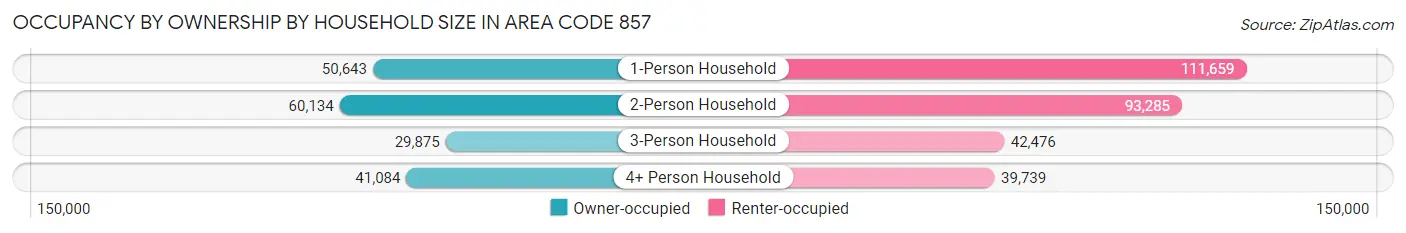
| Household Size | Owner-occupied | Renter-occupied |
| 1-Person Household | 50,643 (31.2%) | 111,659 (68.8%) |
| 2-Person Household | 60,134 (39.2%) | 93,285 (60.8%) |
| 3-Person Household | 29,875 (41.3%) | 42,476 (58.7%) |
| 4+ Person Household | 41,084 (50.8%) | 39,739 (49.2%) |
| Total Housing Units | 181,736 (38.8%) | 287,159 (61.2%) |
Occupancy by Educational Attainment in Area Code 857
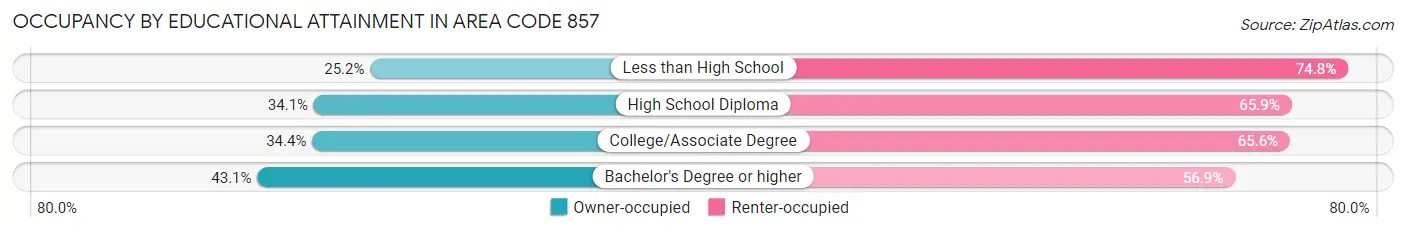
| Household Size | Owner-occupied | Renter-occupied |
| Less than High School | 10,330 (25.2%) | 30,706 (74.8%) |
| High School Diploma | 23,951 (34.1%) | 46,259 (65.9%) |
| College/Associate Degree | 26,111 (34.4%) | 49,842 (65.6%) |
| Bachelor's Degree or higher | 121,344 (43.1%) | 160,352 (56.9%) |
Occupancy by Age of Householder in Area Code 857
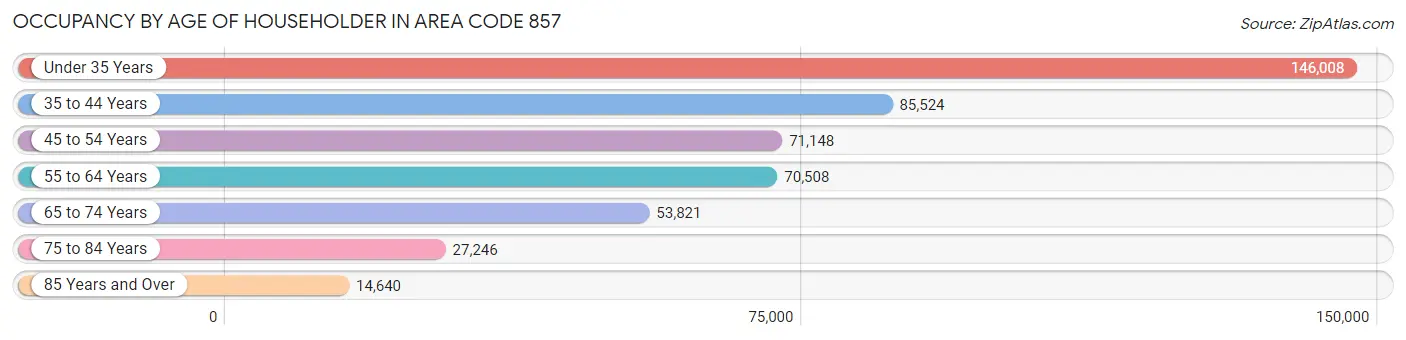
| Age Bracket | # Households | % Households |
| Under 35 Years | 146,008 | 31.1% |
| 35 to 44 Years | 85,524 | 18.2% |
| 45 to 54 Years | 71,148 | 15.2% |
| 55 to 64 Years | 70,508 | 15.0% |
| 65 to 74 Years | 53,821 | 11.5% |
| 75 to 84 Years | 27,246 | 5.8% |
| 85 Years and Over | 14,640 | 3.1% |
| Total | 468,895 | 100.0% |
Housing Finances in Area Code 857
Median Income by Occupancy in Area Code 857
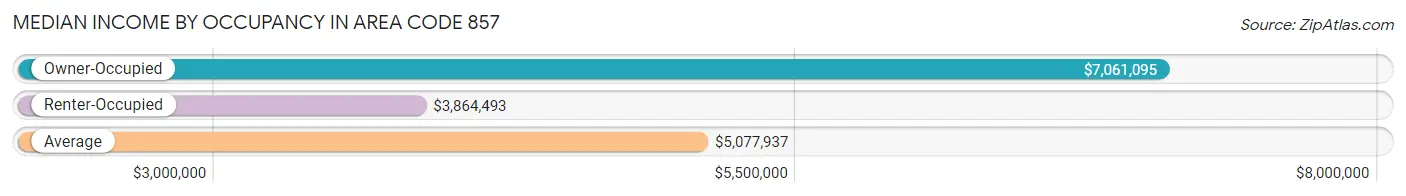
| Occupancy Type | # Households | Median Income |
| Owner-Occupied | 181,736 (38.8%) | $7,061,095 |
| Renter-Occupied | 287,159 (61.2%) | $3,864,493 |
| Average | 468,895 (100.0%) | $5,077,937 |
Occupancy by Householder Income Bracket in Area Code 857
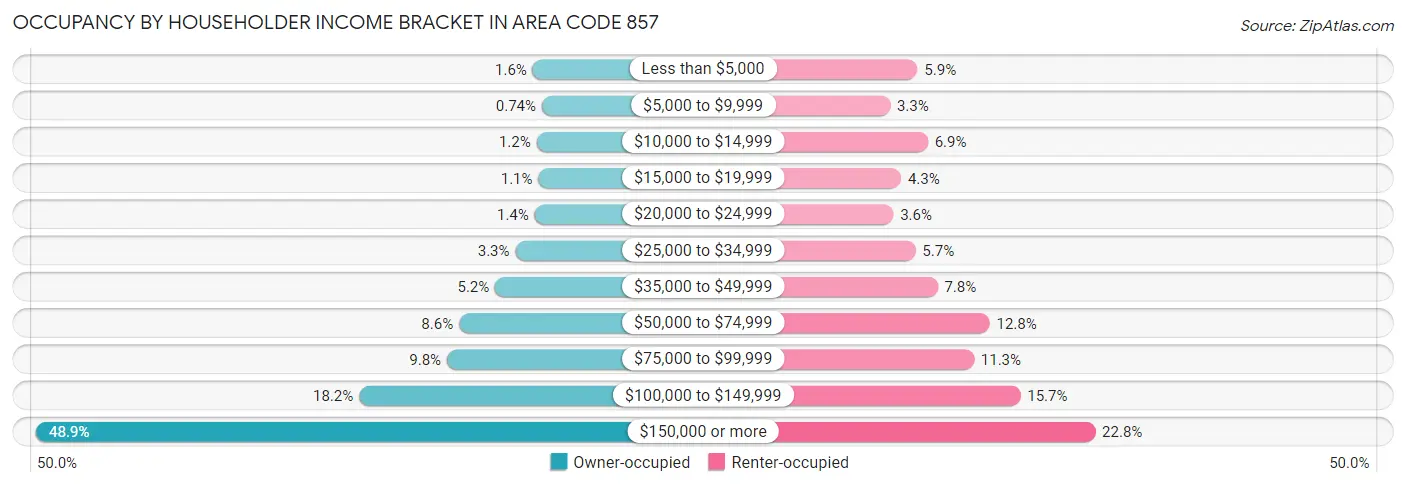
| Income Bracket | Owner-occupied | Renter-occupied |
| Less than $5,000 | 2,929 (1.6%) | 16,911 (5.9%) |
| $5,000 to $9,999 | 1,348 (0.7%) | 9,411 (3.3%) |
| $10,000 to $14,999 | 2,255 (1.2%) | 19,729 (6.9%) |
| $15,000 to $19,999 | 1,945 (1.1%) | 12,423 (4.3%) |
| $20,000 to $24,999 | 2,590 (1.4%) | 10,313 (3.6%) |
| $25,000 to $34,999 | 5,925 (3.3%) | 16,359 (5.7%) |
| $35,000 to $49,999 | 9,430 (5.2%) | 22,387 (7.8%) |
| $50,000 to $74,999 | 15,680 (8.6%) | 36,646 (12.8%) |
| $75,000 to $99,999 | 17,780 (9.8%) | 32,373 (11.3%) |
| $100,000 to $149,999 | 32,994 (18.1%) | 45,064 (15.7%) |
| $150,000 or more | 88,860 (48.9%) | 65,543 (22.8%) |
| Total | 181,736 (100.0%) | 287,159 (100.0%) |
Monthly Housing Cost Tiers in Area Code 857
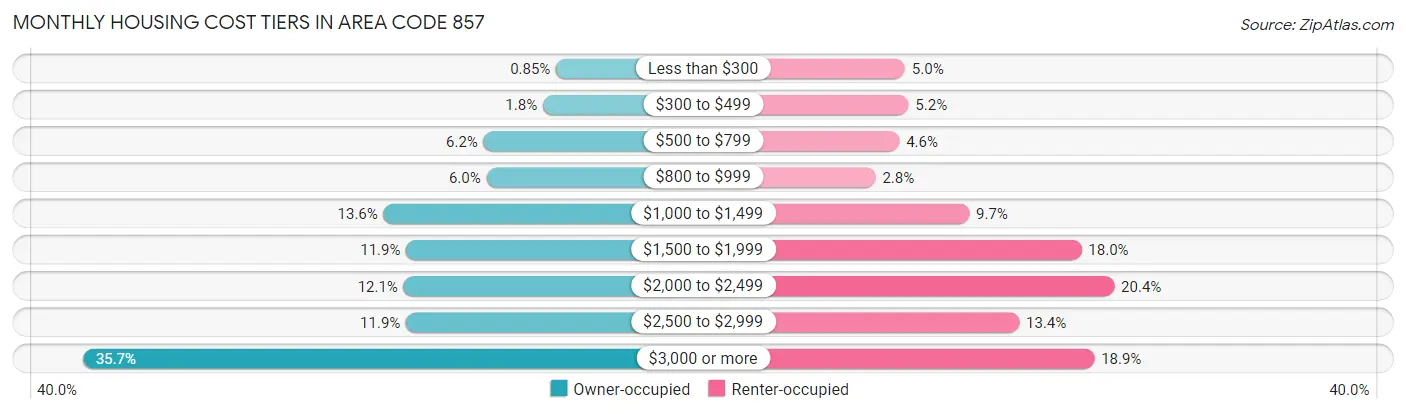
| Monthly Cost | Owner-occupied | Renter-occupied |
| Less than $300 | 1,544 (0.9%) | 14,279 (5.0%) |
| $300 to $499 | 3,300 (1.8%) | 15,009 (5.2%) |
| $500 to $799 | 11,254 (6.2%) | 13,052 (4.5%) |
| $800 to $999 | 10,873 (6.0%) | 8,045 (2.8%) |
| $1,000 to $1,499 | 24,641 (13.6%) | 27,846 (9.7%) |
| $1,500 to $1,999 | 21,614 (11.9%) | 51,595 (18.0%) |
| $2,000 to $2,499 | 21,961 (12.1%) | 58,522 (20.4%) |
| $2,500 to $2,999 | 21,634 (11.9%) | 38,412 (13.4%) |
| $3,000 or more | 64,915 (35.7%) | 54,306 (18.9%) |
| Total | 181,736 (100.0%) | 287,159 (100.0%) |
Physical Housing Characteristics in Area Code 857
Housing Structures in Area Code 857
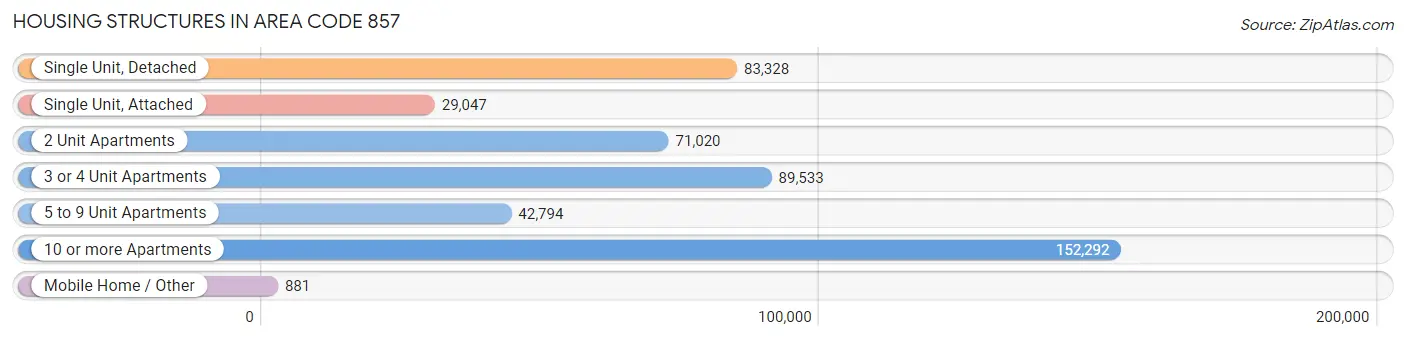
| Structure Type | # Housing Units | % Housing Units |
| Single Unit, Detached | 83,328 | 17.8% |
| Single Unit, Attached | 29,047 | 6.2% |
| 2 Unit Apartments | 71,020 | 15.1% |
| 3 or 4 Unit Apartments | 89,533 | 19.1% |
| 5 to 9 Unit Apartments | 42,794 | 9.1% |
| 10 or more Apartments | 152,292 | 32.5% |
| Mobile Home / Other | 881 | 0.2% |
| Total | 468,895 | 100.0% |
Housing Structures by Occupancy in Area Code 857
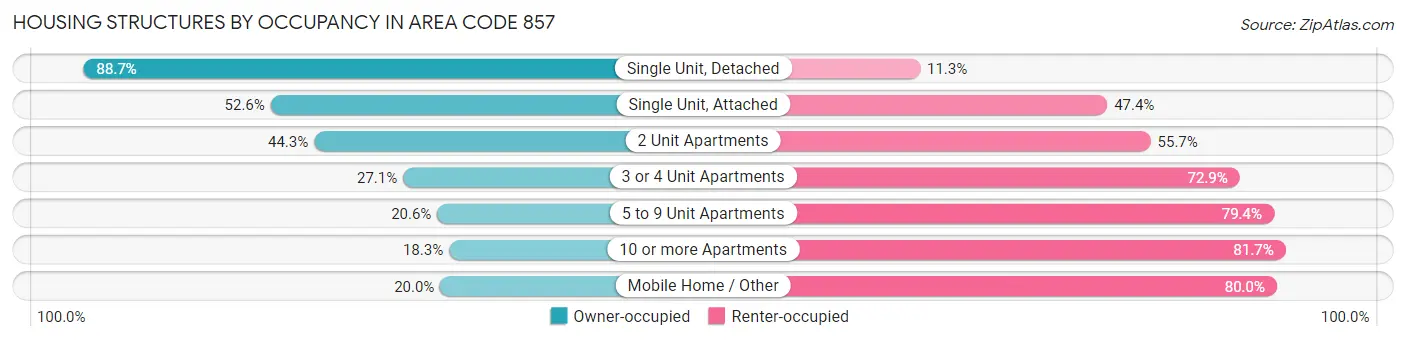
| Structure Type | Owner-occupied | Renter-occupied |
| Single Unit, Detached | 73,883 (88.7%) | 9,445 (11.3%) |
| Single Unit, Attached | 15,288 (52.6%) | 13,759 (47.4%) |
| 2 Unit Apartments | 31,443 (44.3%) | 39,577 (55.7%) |
| 3 or 4 Unit Apartments | 24,298 (27.1%) | 65,235 (72.9%) |
| 5 to 9 Unit Apartments | 8,800 (20.6%) | 33,994 (79.4%) |
| 10 or more Apartments | 27,848 (18.3%) | 124,444 (81.7%) |
| Mobile Home / Other | 176 (20.0%) | 705 (80.0%) |
| Total | 181,736 (38.8%) | 287,159 (61.2%) |
Housing Structures by Number of Rooms in Area Code 857
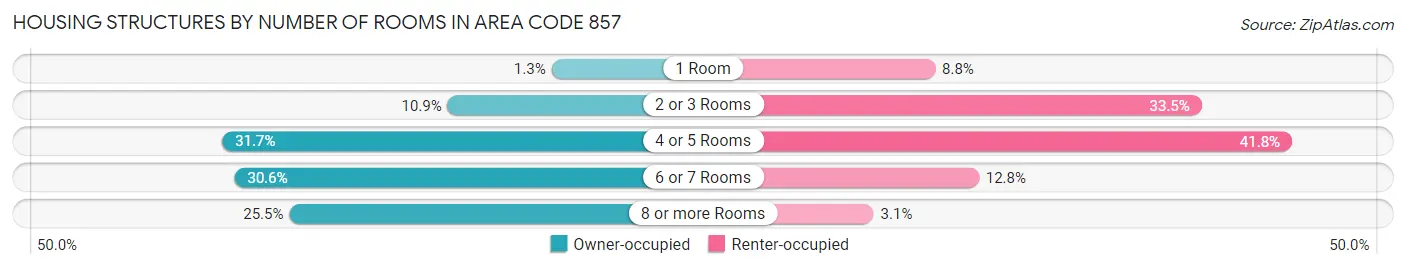
| Number of Rooms | Owner-occupied | Renter-occupied |
| 1 Room | 2,314 (1.3%) | 25,261 (8.8%) |
| 2 or 3 Rooms | 19,778 (10.9%) | 96,045 (33.5%) |
| 4 or 5 Rooms | 57,657 (31.7%) | 120,030 (41.8%) |
| 6 or 7 Rooms | 55,603 (30.6%) | 36,869 (12.8%) |
| 8 or more Rooms | 46,384 (25.5%) | 8,954 (3.1%) |
| Total | 181,736 (100.0%) | 287,159 (100.0%) |
Housing Structure by Heating Type in Area Code 857
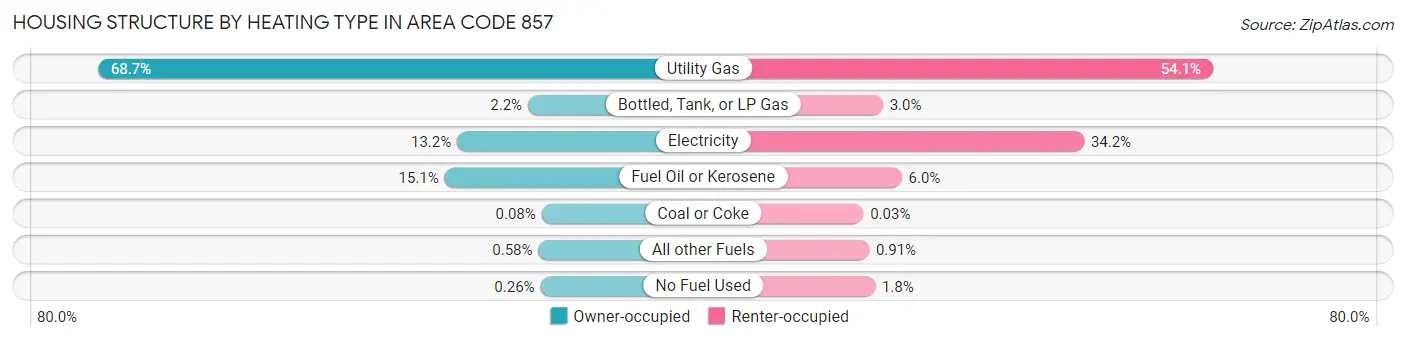
| Heating Type | Owner-occupied | Renter-occupied |
| Utility Gas | 124,797 (68.7%) | 155,305 (54.1%) |
| Bottled, Tank, or LP Gas | 3,976 (2.2%) | 8,717 (3.0%) |
| Electricity | 23,899 (13.2%) | 98,054 (34.2%) |
| Fuel Oil or Kerosene | 27,388 (15.1%) | 17,105 (6.0%) |
| Coal or Coke | 148 (0.1%) | 85 (0.0%) |
| All other Fuels | 1,055 (0.6%) | 2,610 (0.9%) |
| No Fuel Used | 473 (0.3%) | 5,283 (1.8%) |
| Total | 181,736 (100.0%) | 287,159 (100.0%) |
Household Vehicle Usage in Area Code 857
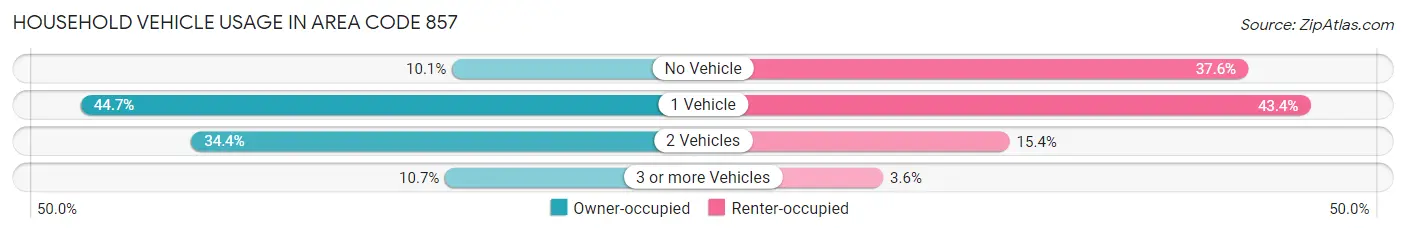
| Vehicles per Household | Owner-occupied | Renter-occupied |
| No Vehicle | 18,338 (10.1%) | 108,025 (37.6%) |
| 1 Vehicle | 81,310 (44.7%) | 124,702 (43.4%) |
| 2 Vehicles | 62,566 (34.4%) | 44,171 (15.4%) |
| 3 or more Vehicles | 19,522 (10.7%) | 10,261 (3.6%) |
| Total | 181,736 (100.0%) | 287,159 (100.0%) |
Real Estate & Mortgages in Area Code 857
Real Estate and Mortgage Overview in Area Code 857
| Characteristic | Without Mortgage | With Mortgage |
| Housing Units | 60,706 | 121,030 |
| Median Property Value | $38,836,701 | $38,298,600 |
| Median Household Income | $5,345,643 | $66,827 |
| Monthly Housing Costs | $51,474 | $61,905 |
| Real Estate Taxes | $292,428 | $1,721 |
Property Value by Mortgage Status in Area Code 857
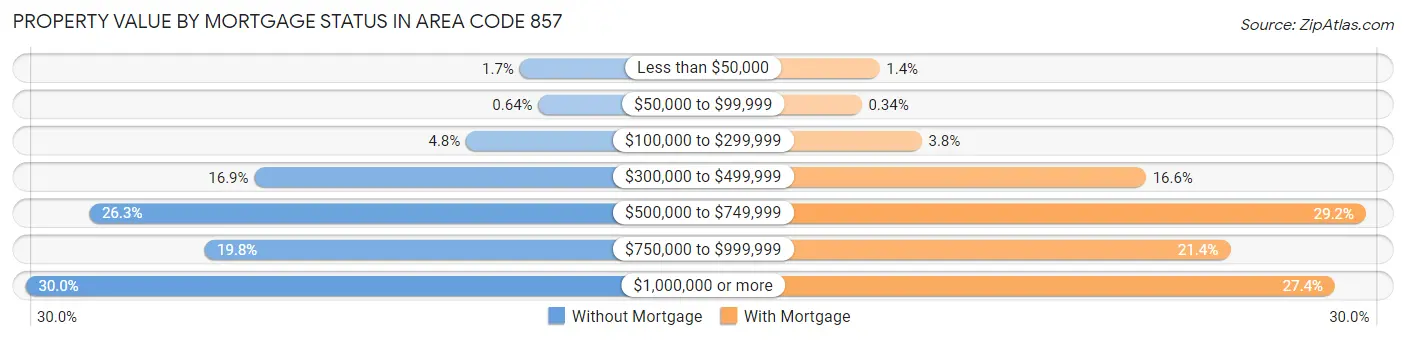
| Property Value | Without Mortgage | With Mortgage |
| Less than $50,000 | 1,037 (1.7%) | 1,642 (1.4%) |
| $50,000 to $99,999 | 388 (0.6%) | 415 (0.3%) |
| $100,000 to $299,999 | 2,897 (4.8%) | 4,567 (3.8%) |
| $300,000 to $499,999 | 10,239 (16.9%) | 20,062 (16.6%) |
| $500,000 to $749,999 | 15,975 (26.3%) | 35,292 (29.2%) |
| $750,000 to $999,999 | 11,989 (19.8%) | 25,900 (21.4%) |
| $1,000,000 or more | 18,181 (29.9%) | 33,152 (27.4%) |
| Total | 60,706 (100.0%) | 121,030 (100.0%) |
Household Income by Mortgage Status in Area Code 857
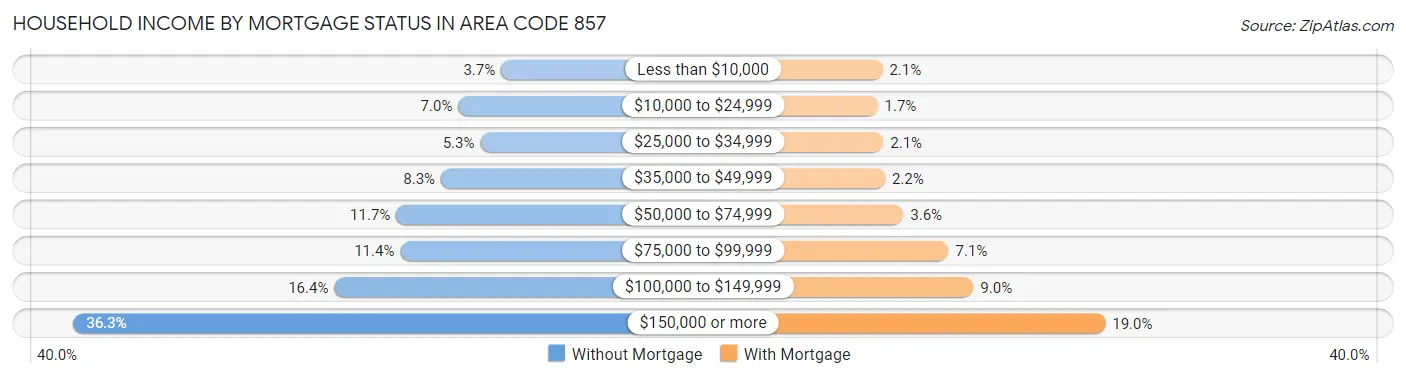
| Household Income | Without Mortgage | With Mortgage |
| Less than $10,000 | 2,246 (3.7%) | 2,486 (2.1%) |
| $10,000 to $24,999 | 4,223 (7.0%) | 2,031 (1.7%) |
| $25,000 to $34,999 | 3,208 (5.3%) | 2,567 (2.1%) |
| $35,000 to $49,999 | 5,029 (8.3%) | 2,717 (2.2%) |
| $50,000 to $74,999 | 7,098 (11.7%) | 4,401 (3.6%) |
| $75,000 to $99,999 | 6,910 (11.4%) | 8,582 (7.1%) |
| $100,000 to $149,999 | 9,959 (16.4%) | 10,870 (9.0%) |
| $150,000 or more | 22,033 (36.3%) | 23,035 (19.0%) |
| Total | 60,706 (100.0%) | 121,030 (100.0%) |
Property Value to Household Income Ratio in Area Code 857
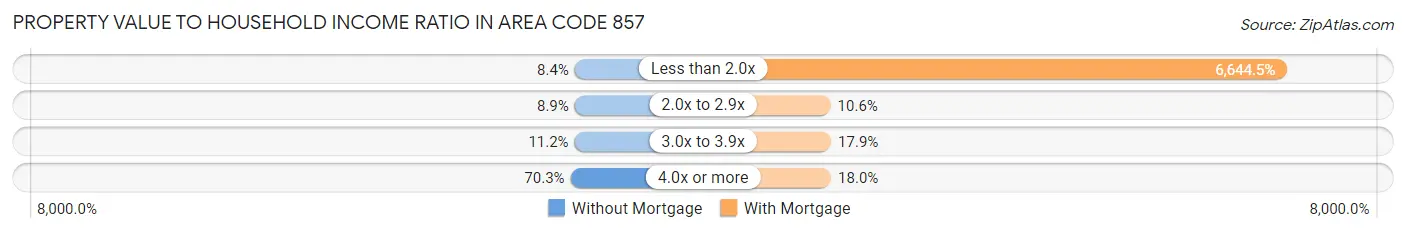
| Value-to-Income Ratio | Without Mortgage | With Mortgage |
| Less than 2.0x | 5,125 (8.4%) | 8,041,823 (6,644.5%) |
| 2.0x to 2.9x | 5,425 (8.9%) | 12,795 (10.6%) |
| 3.0x to 3.9x | 6,824 (11.2%) | 21,613 (17.9%) |
| 4.0x or more | 42,659 (70.3%) | 21,835 (18.0%) |
| Total | 60,706 (100.0%) | 121,030 (100.0%) |
Real Estate Taxes by Mortgage Status in Area Code 857
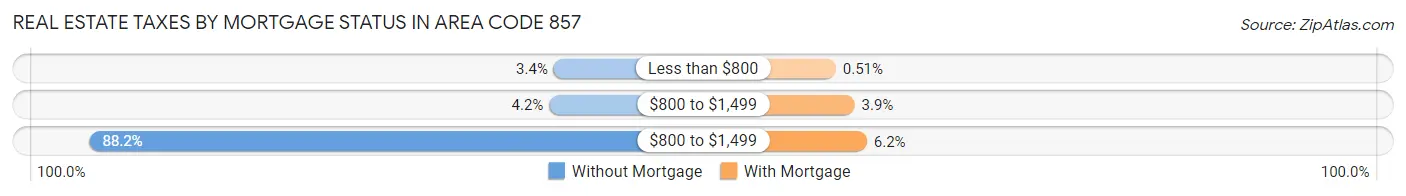
| Property Taxes | Without Mortgage | With Mortgage |
| Less than $800 | 2,034 (3.4%) | 614 (0.5%) |
| $800 to $1,499 | 2,545 (4.2%) | 4,766 (3.9%) |
| $800 to $1,499 | 53,513 (88.1%) | 7,467 (6.2%) |
| Total | 60,706 (100.0%) | 121,030 (100.0%) |
Health & Disability in Area Code 857
Health Insurance Coverage by Age in Area Code 857
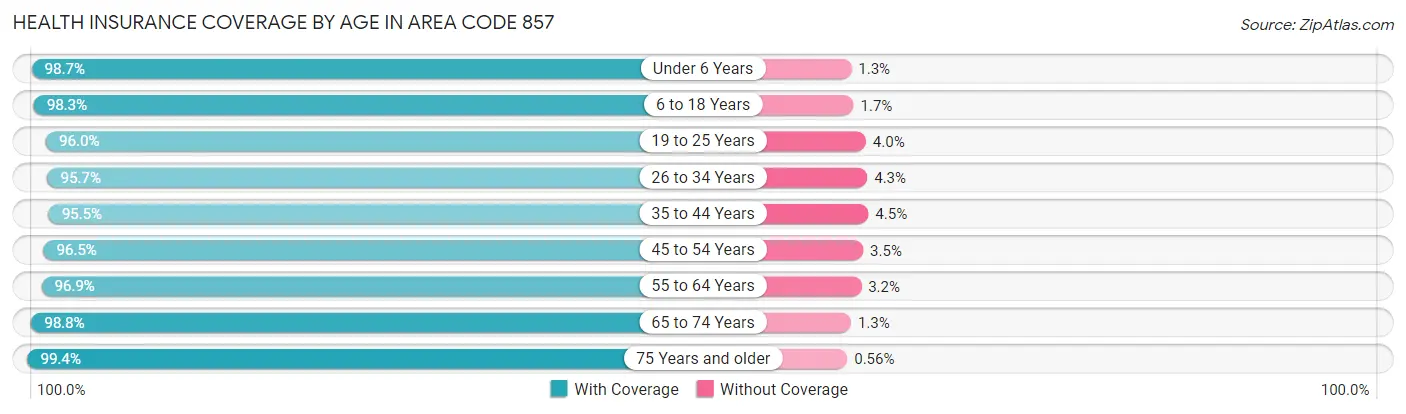
| Age Bracket | With Coverage | Without Coverage |
| Under 6 Years | 62,605 (98.7%) | 830 (1.3%) |
| 6 to 18 Years | 134,536 (98.3%) | 2,364 (1.7%) |
| 19 to 25 Years | 153,534 (96.0%) | 6,440 (4.0%) |
| 26 to 34 Years | 214,086 (95.7%) | 9,586 (4.3%) |
| 35 to 44 Years | 147,507 (95.5%) | 6,951 (4.5%) |
| 45 to 54 Years | 117,625 (96.5%) | 4,291 (3.5%) |
| 55 to 64 Years | 113,017 (96.9%) | 3,674 (3.2%) |
| 65 to 74 Years | 83,704 (98.8%) | 1,060 (1.3%) |
| 75 Years and older | 59,809 (99.4%) | 335 (0.6%) |
| Total | 1,086,423 (96.8%) | 35,531 (3.2%) |
Health Insurance Coverage by Citizenship Status in Area Code 857
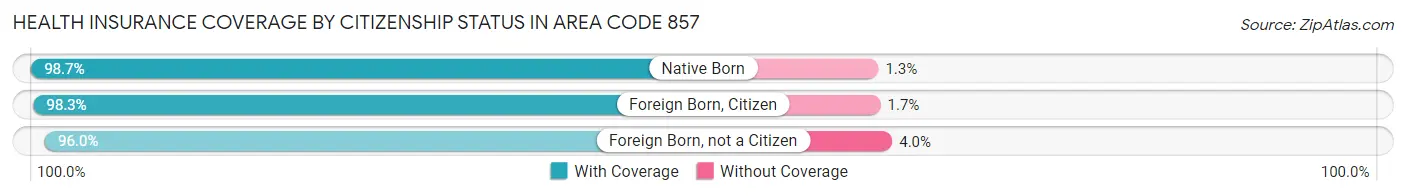
| Citizenship Status | With Coverage | Without Coverage |
| Native Born | 62,605 (98.7%) | 830 (1.3%) |
| Foreign Born, Citizen | 134,536 (98.3%) | 2,364 (1.7%) |
| Foreign Born, not a Citizen | 153,534 (96.0%) | 6,440 (4.0%) |
Health Insurance Coverage by Household Income in Area Code 857
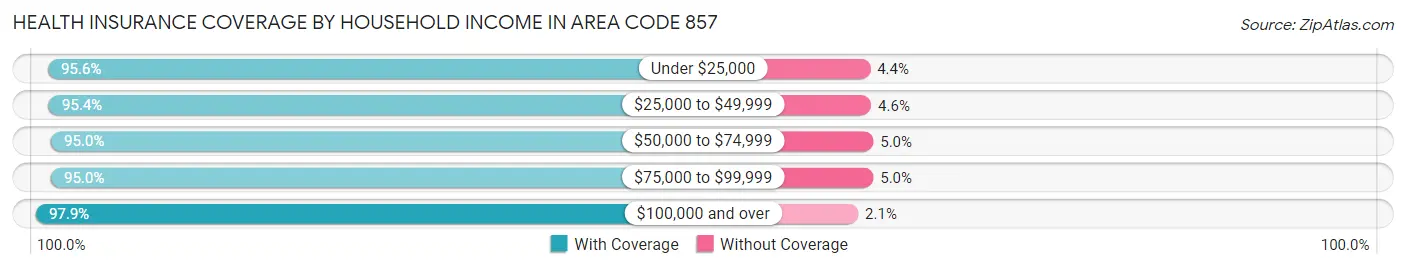
| Household Income | With Coverage | Without Coverage |
| Under $25,000 | 123,214 (95.6%) | 5,656 (4.4%) |
| $25,000 to $49,999 | 104,777 (95.4%) | 5,010 (4.6%) |
| $50,000 to $74,999 | 103,249 (95.0%) | 5,388 (5.0%) |
| $75,000 to $99,999 | 104,717 (95.0%) | 5,462 (5.0%) |
| $100,000 and over | 597,733 (97.9%) | 13,015 (2.1%) |
Public vs Private Health Insurance Coverage by Age in Area Code 857
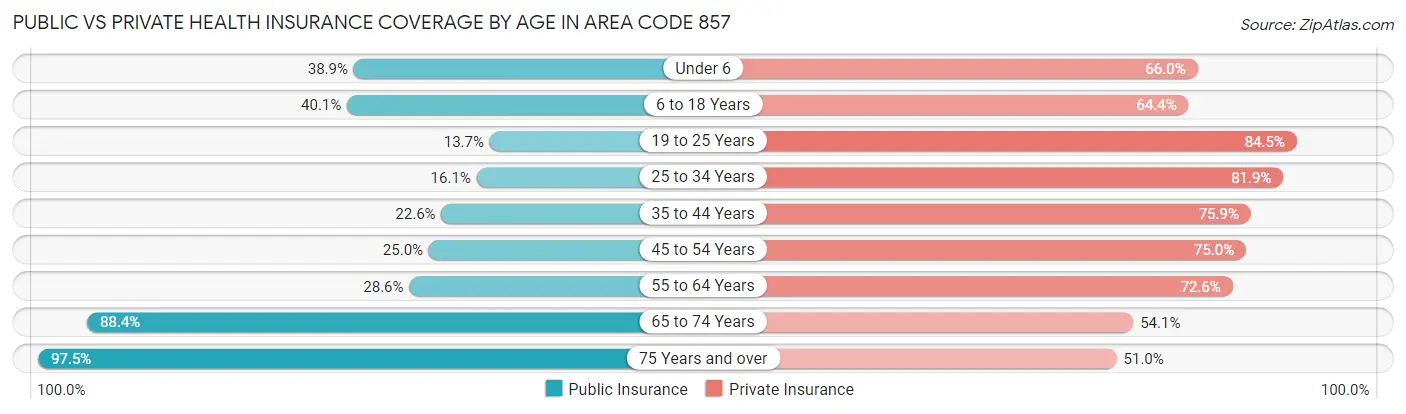
| Age Bracket | Public Insurance | Private Insurance |
| Under 6 | 24,668 (38.9%) | 41,873 (66.0%) |
| 6 to 18 Years | 54,949 (40.1%) | 88,128 (64.4%) |
| 19 to 25 Years | 21,848 (13.7%) | 135,093 (84.5%) |
| 25 to 34 Years | 35,983 (16.1%) | 183,265 (81.9%) |
| 35 to 44 Years | 34,951 (22.6%) | 117,228 (75.9%) |
| 45 to 54 Years | 30,435 (25.0%) | 91,471 (75.0%) |
| 55 to 64 Years | 33,356 (28.6%) | 84,658 (72.6%) |
| 65 to 74 Years | 74,952 (88.4%) | 45,857 (54.1%) |
| 75 Years and over | 58,655 (97.5%) | 30,680 (51.0%) |
| Total | 369,797 (33.0%) | 818,253 (72.9%) |
Disability Status by Sex by Age in Area Code 857
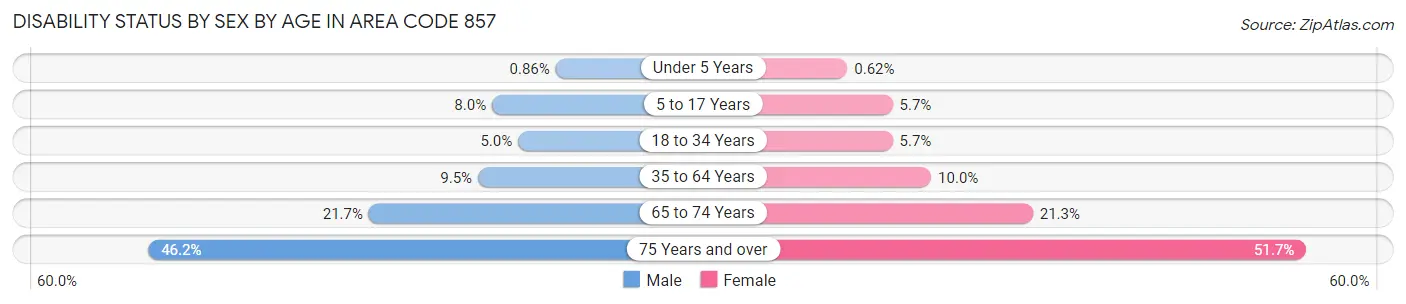
| Age Bracket | Male | Female |
| Under 5 Years | 239 (0.9%) | 165 (0.6%) |
| 5 to 17 Years | 5,250 (8.0%) | 3,395 (5.7%) |
| 18 to 34 Years | 9,993 (5.0%) | 11,602 (5.7%) |
| 35 to 64 Years | 18,537 (9.5%) | 19,705 (10.0%) |
| 65 to 74 Years | 8,468 (21.7%) | 9,718 (21.3%) |
| 75 Years and over | 10,716 (46.2%) | 19,114 (51.7%) |
Disability Class by Sex by Age in Area Code 857
Disability Class: Hearing Difficulty
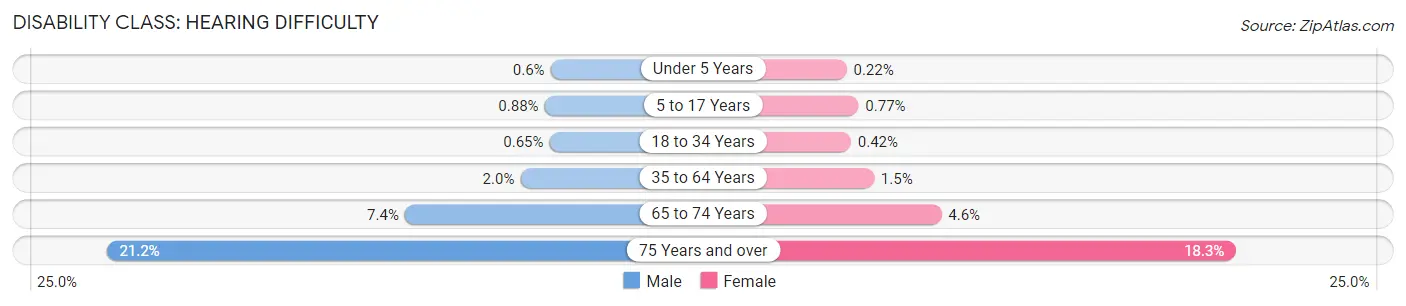
| Age Bracket | Male | Female |
| Under 5 Years | 166 (0.6%) | 60 (0.2%) |
| 5 to 17 Years | 581 (0.9%) | 462 (0.8%) |
| 18 to 34 Years | 1,287 (0.6%) | 868 (0.4%) |
| 35 to 64 Years | 3,908 (2.0%) | 2,960 (1.5%) |
| 65 to 74 Years | 2,874 (7.4%) | 2,109 (4.6%) |
| 75 Years and over | 4,913 (21.2%) | 6,763 (18.3%) |
Disability Class: Vision Difficulty
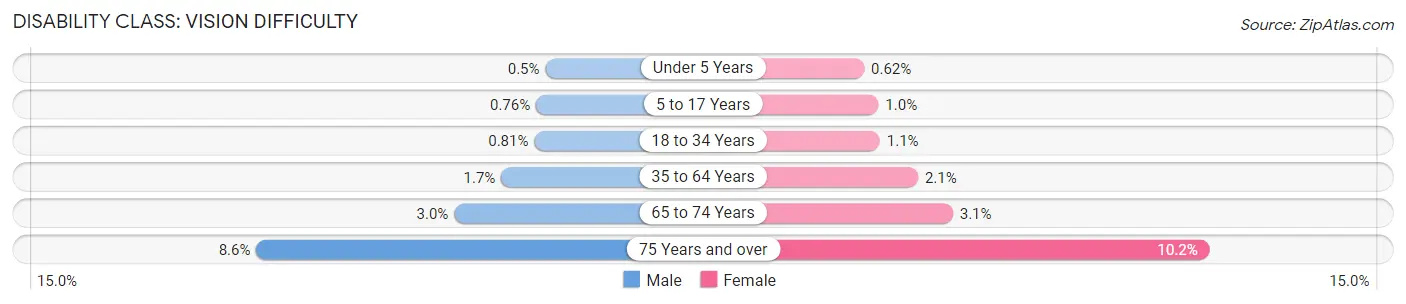
| Age Bracket | Male | Female |
| Under 5 Years | 138 (0.5%) | 165 (0.6%) |
| 5 to 17 Years | 502 (0.8%) | 611 (1.0%) |
| 18 to 34 Years | 1,606 (0.8%) | 2,180 (1.1%) |
| 35 to 64 Years | 3,377 (1.7%) | 4,198 (2.1%) |
| 65 to 74 Years | 1,186 (3.0%) | 1,412 (3.1%) |
| 75 Years and over | 1,982 (8.6%) | 3,786 (10.2%) |
Disability Class: Cognitive Difficulty
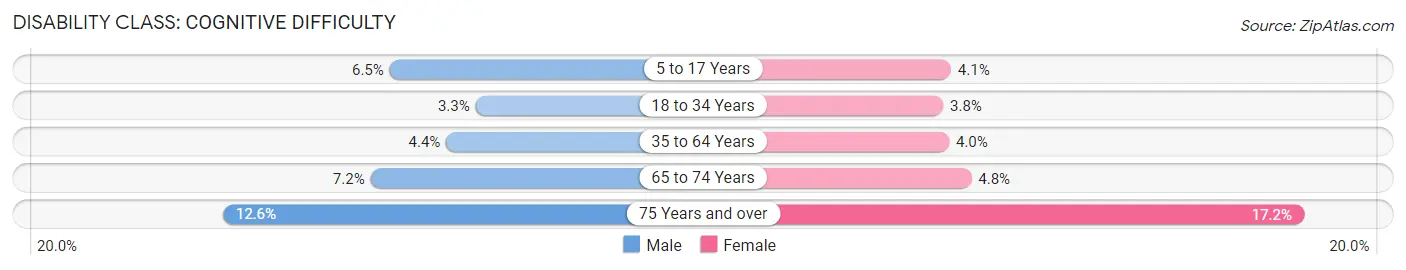
| Age Bracket | Male | Female |
| 5 to 17 Years | 4,261 (6.5%) | 2,425 (4.1%) |
| 18 to 34 Years | 6,473 (3.3%) | 7,710 (3.8%) |
| 35 to 64 Years | 8,471 (4.3%) | 7,879 (4.0%) |
| 65 to 74 Years | 2,798 (7.2%) | 2,199 (4.8%) |
| 75 Years and over | 2,929 (12.6%) | 6,339 (17.2%) |
Disability Class: Ambulatory Difficulty
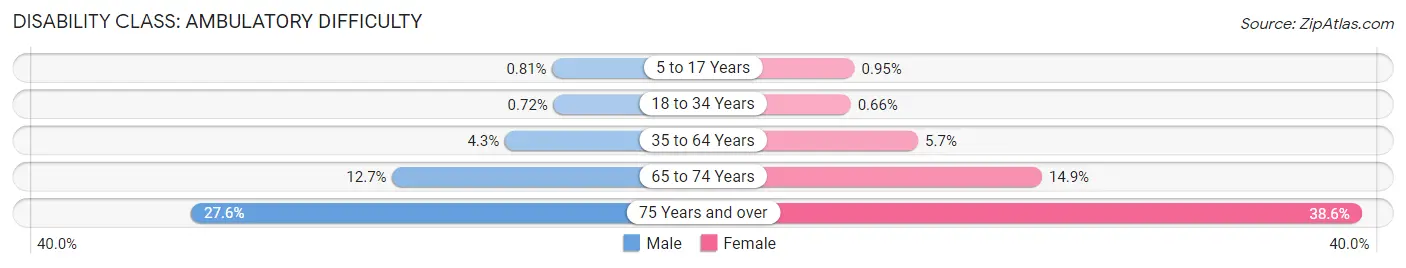
| Age Bracket | Male | Female |
| 5 to 17 Years | 537 (0.8%) | 569 (0.9%) |
| 18 to 34 Years | 1,418 (0.7%) | 1,362 (0.7%) |
| 35 to 64 Years | 8,433 (4.3%) | 11,235 (5.7%) |
| 65 to 74 Years | 4,958 (12.7%) | 6,789 (14.9%) |
| 75 Years and over | 6,406 (27.6%) | 14,264 (38.6%) |
Disability Class: Self-Care Difficulty
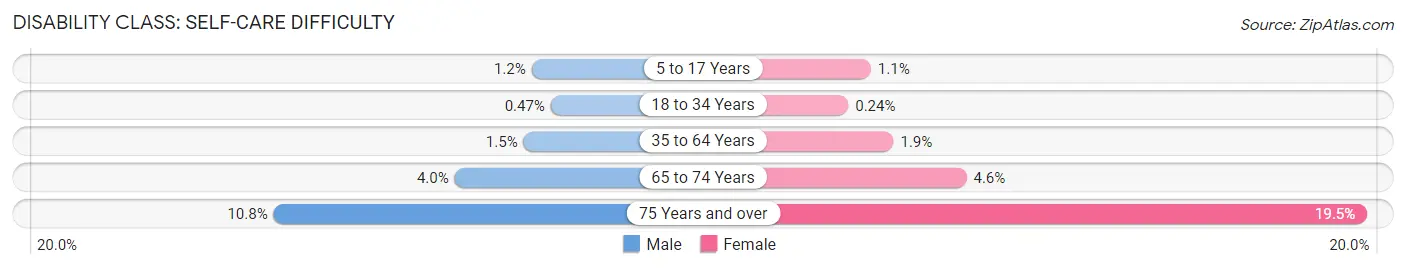
| Age Bracket | Male | Female |
| 5 to 17 Years | 779 (1.2%) | 649 (1.1%) |
| 18 to 34 Years | 927 (0.5%) | 493 (0.2%) |
| 35 to 64 Years | 2,892 (1.5%) | 3,807 (1.9%) |
| 65 to 74 Years | 1,579 (4.0%) | 2,117 (4.6%) |
| 75 Years and over | 2,493 (10.8%) | 7,207 (19.5%) |
Technology Access in Area Code 857
Computing Device Access in Area Code 857
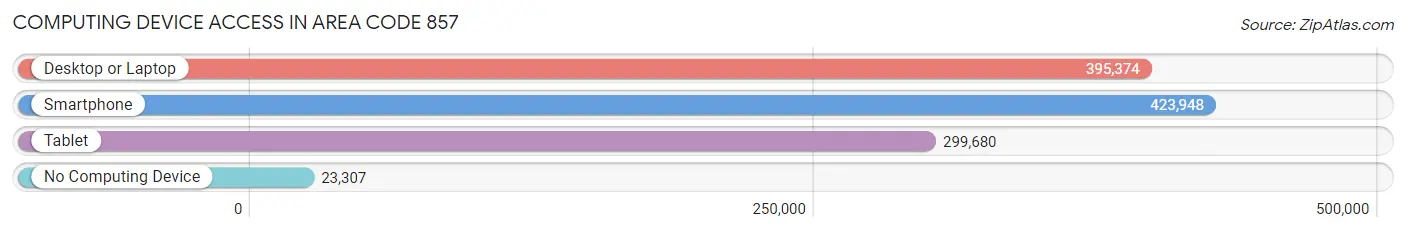
| Device Type | # Households | % Households |
| Desktop or Laptop | 395,374 | 84.3% |
| Smartphone | 423,948 | 90.4% |
| Tablet | 299,680 | 63.9% |
| No Computing Device | 23,307 | 5.0% |
| Total | 468,895 | 100.0% |
Internet Access in Area Code 857
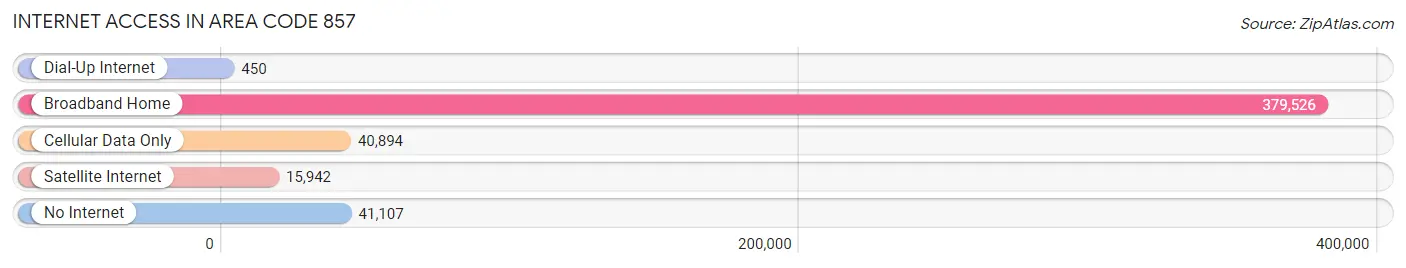
| Internet Type | # Households | % Households |
| Dial-Up Internet | 450 | 0.1% |
| Broadband Home | 379,526 | 80.9% |
| Cellular Data Only | 40,894 | 8.7% |
| Satellite Internet | 15,942 | 3.4% |
| No Internet | 41,107 | 8.8% |
| Total | 468,895 | 100.0% |
Area Code 857 Summary
Geography
Area code 857 is located in the state of Massachusetts. It covers the eastern and northern parts of the state, including the cities of Boston, Cambridge, and Somerville.
Social
Area code 857 is home to a diverse population of people from all walks of life. The area is known for its vibrant culture, with a variety of restaurants, bars, and entertainment venues.
Economics
Area code 857 is home to a thriving economy. The area is home to many major corporations, including Microsoft, Amazon, and Google. The area also has a strong technology sector, with many startups and established companies.
Demographics
Area code 857 is home to a diverse population. The area is home to a large number of immigrants, with a large percentage of the population being of Hispanic or Latino origin. The area also has a large number of college students, due to its proximity to several universities.
Common Questions
What is Per Capita Income in Area Code 857?
Per Capita income in Area Code 857 is $71,409.
What is the Median Family Income in Area Code 857?
Median Family Income in Area Code 857 is $144,318.
What is the Median Household income in Area Code 857?
Median Household Income in Area Code 857 is $110,390.
What is Income or Wage Gap in Area Code 857?
Income or Wage Gap in Area Code 857 is 27.5%.
Women in Area Code 857 earn 72.5 cents for every dollar earned by a man.
What is Family Income Deficit in Area Code 857?
Family Income Deficit in Area Code 857 is $10,451.
Families that are below poverty line in Area Code 857 earn $10,451 less on average than the poverty threshold level.
What is Inequality or Gini Index in Area Code 857?
Inequality or Gini Index in Area Code 857 is 22.77.
What is the Total Population of Area Code 857?
Total Population of Area Code 857 is 1,128,838.
What is the Total Male Population of Area Code 857?
Total Male Population of Area Code 857 is 553,232.
What is the Total Female Population of Area Code 857?
Total Female Population of Area Code 857 is 575,606.
What is the Ratio of Males per 100 Females in Area Code 857?
There are 96.11 Males per 100 Females in Area Code 857.
What is the Ratio of Females per 100 Males in Area Code 857?
There are 104.04 Females per 100 Males in Area Code 857.
What is the Median Population Age in Area Code 857?
Median Population Age in Area Code 857 is 35.1 Years.
What is the Average Family Size in Area Code 857
Average Family Size in Area Code 857 is 2.9 People.
What is the Average Household Size in Area Code 857
Average Household Size in Area Code 857 is 2.3 People.
How Large is the Labor Force in Area Code 857?
There are 675,478 People in the Labor Forcein in Area Code 857.
What is the Percentage of People in the Labor Force in Area Code 857?
69.8% of People are in the Labor Force in Area Code 857.
What is the Unemployment Rate in Area Code 857?
Unemployment Rate in Area Code 857 is 5.5%.