Area Code 339 Map & Demographics
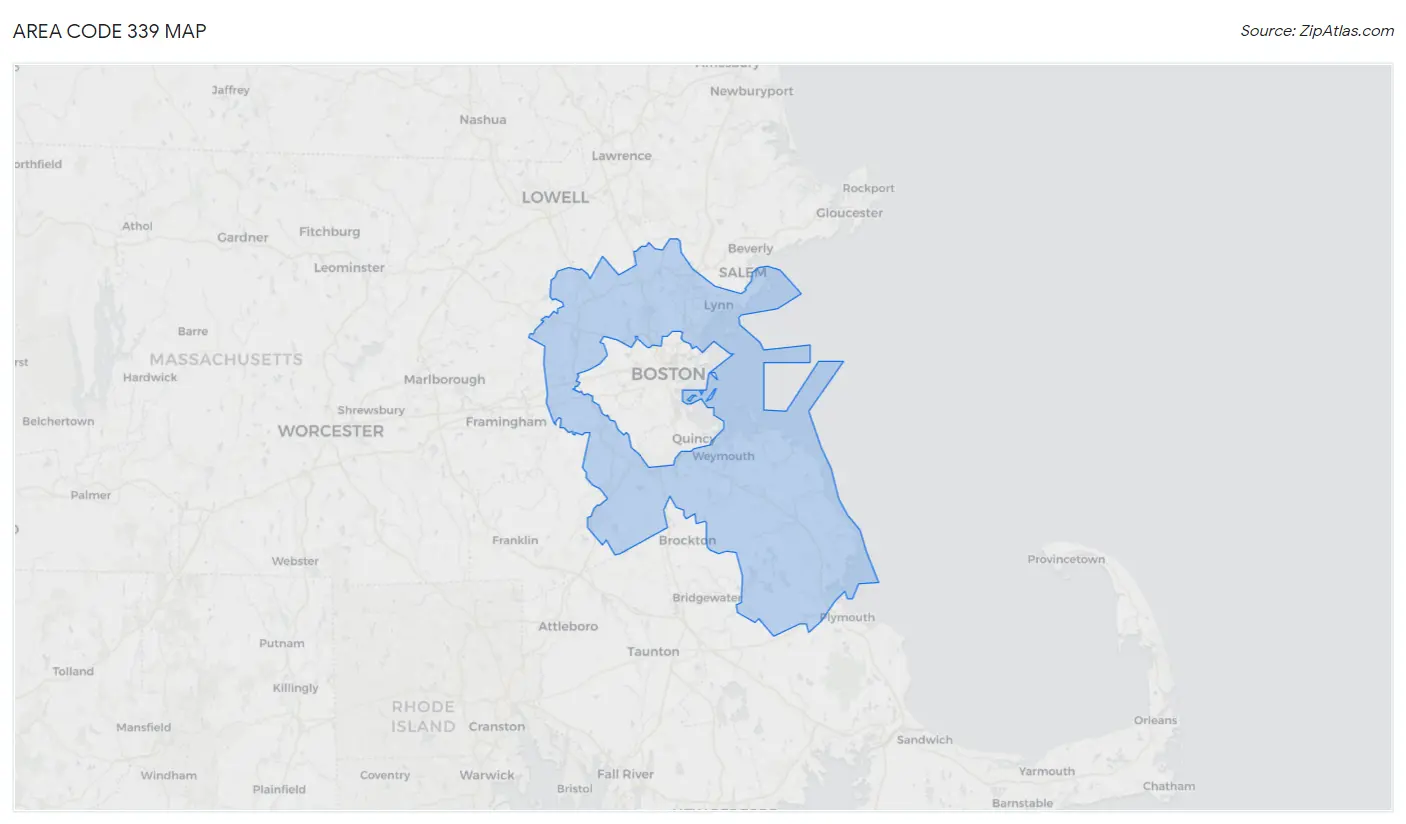
Area Code 339 Map
Area Code 339 Overview
$68,460
PER CAPITA INCOME
$161,463
AVG FAMILY INCOME
$129,999
AVG HOUSEHOLD INCOME
32.3%
WAGE / INCOME GAP [ % ]
67.7¢/ $1
WAGE / INCOME GAP [ $ ]
$11,820
FAMILY INCOME DEFICIT
23.40
INEQUALITY / GINI INDEX
1,081,009
TOTAL POPULATION
530,619
MALE POPULATION
550,390
FEMALE POPULATION
96.41
MALES / 100 FEMALES
103.73
FEMALES / 100 MALES
40.1
MEDIAN AGE
3.0
AVG FAMILY SIZE
2.4
AVG HOUSEHOLD SIZE
600,519
LABOR FORCE [ PEOPLE ]
67.0%
PERCENT IN LABOR FORCE
4.4%
UNEMPLOYMENT RATE
Income in Area Code 339
Income Overview in Area Code 339
Per Capita Income in Area Code 339 is $68,460, while median incomes of families and households are $161,463 and $129,999 respectively.
| Characteristic | Number | Measure |
| Per Capita Income | 1,081,009 | $68,460 |
| Median Family Income | 262,692 | $161,463 |
| Mean Family Income | 262,692 | $10,658,134 |
| Median Household Income | 418,963 | $129,999 |
| Mean Household Income | 418,963 | $8,870,468 |
| Income Deficit | 262,692 | $11,820 |
| Wage / Income Gap (%) | 1,081,009 | 32.31% |
| Wage / Income Gap ($) | 1,081,009 | 67.69¢ per $1 |
| Gini / Inequality Index | 1,081,009 | 23.40 |
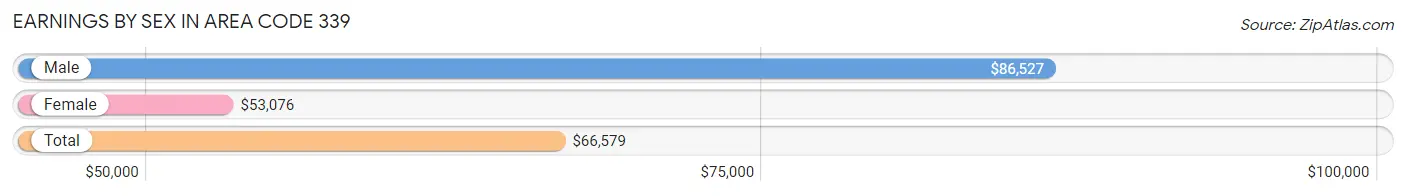
Earnings by Sex in Area Code 339
Average Earnings in Area Code 339 are $66,579, $86,527 for men and $53,076 for women, a difference of 38.7%.
| Sex | Number | Average Earnings |
| Male | 333,930 (51.9%) | $86,527 |
| Female | 309,150 (48.1%) | $53,076 |
| Total | 643,080 (100.0%) | $66,579 |
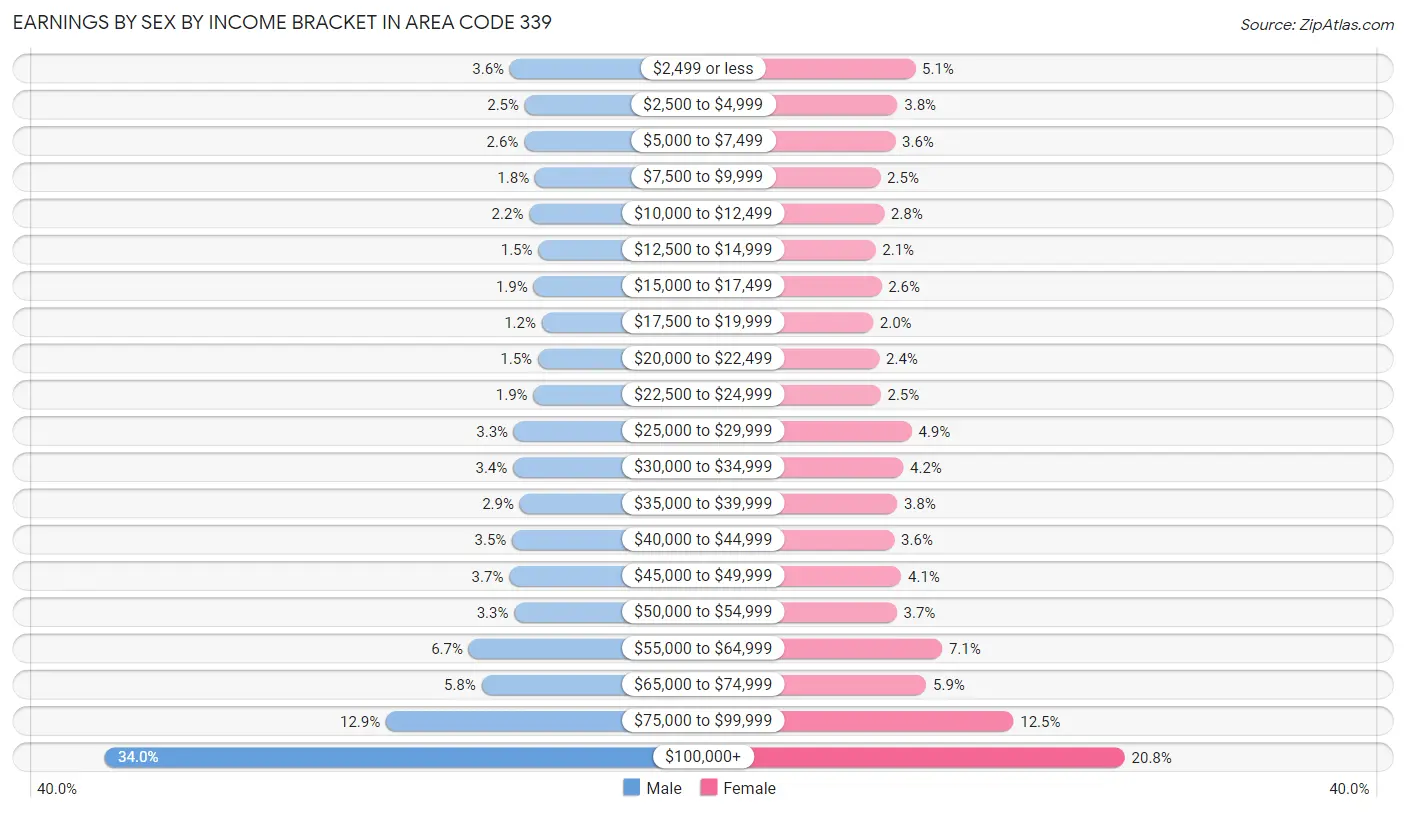
Earnings by Sex by Income Bracket in Area Code 339
The most common earnings brackets in Area Code 339 are $100,000+ for men (113,414 | 34.0%) and $100,000+ for women (64,371 | 20.8%).
| Income | Male | Female |
| $2,499 or less | 12,124 (3.6%) | 15,824 (5.1%) |
| $2,500 to $4,999 | 8,377 (2.5%) | 11,730 (3.8%) |
| $5,000 to $7,499 | 8,536 (2.6%) | 11,205 (3.6%) |
| $7,500 to $9,999 | 5,850 (1.8%) | 7,736 (2.5%) |
| $10,000 to $12,499 | 7,266 (2.2%) | 8,602 (2.8%) |
| $12,500 to $14,999 | 5,010 (1.5%) | 6,622 (2.1%) |
| $15,000 to $17,499 | 6,211 (1.9%) | 7,984 (2.6%) |
| $17,500 to $19,999 | 4,154 (1.2%) | 6,015 (1.9%) |
| $20,000 to $22,499 | 5,097 (1.5%) | 7,482 (2.4%) |
| $22,500 to $24,999 | 6,246 (1.9%) | 7,823 (2.5%) |
| $25,000 to $29,999 | 11,121 (3.3%) | 15,006 (4.9%) |
| $30,000 to $34,999 | 11,318 (3.4%) | 13,057 (4.2%) |
| $35,000 to $39,999 | 9,659 (2.9%) | 11,614 (3.8%) |
| $40,000 to $44,999 | 11,544 (3.5%) | 10,965 (3.5%) |
| $45,000 to $49,999 | 12,278 (3.7%) | 12,581 (4.1%) |
| $50,000 to $54,999 | 11,011 (3.3%) | 11,537 (3.7%) |
| $55,000 to $64,999 | 22,393 (6.7%) | 22,052 (7.1%) |
| $65,000 to $74,999 | 19,198 (5.8%) | 18,365 (5.9%) |
| $75,000 to $99,999 | 43,123 (12.9%) | 38,579 (12.5%) |
| $100,000+ | 113,414 (34.0%) | 64,371 (20.8%) |
| Total | 333,930 (100.0%) | 309,150 (100.0%) |
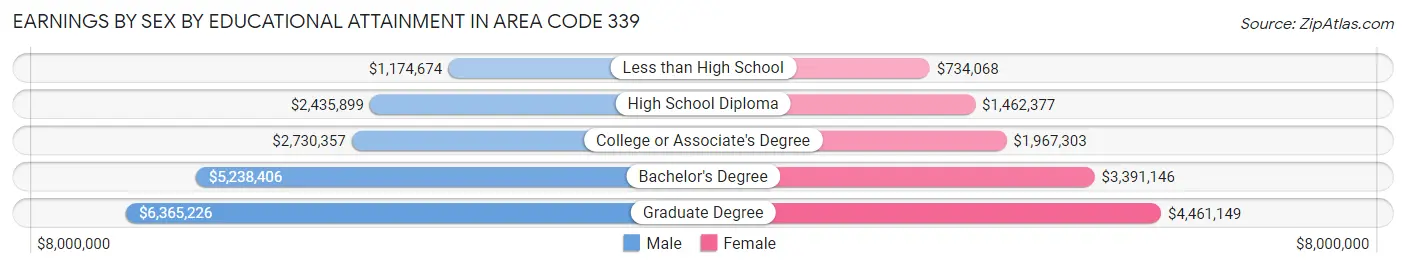
Earnings by Sex by Educational Attainment in Area Code 339
Average earnings in Area Code 339 are $5,008,150 for men and $3,213,192 for women, a difference of 35.8%. Men with an educational attainment of graduate degree enjoy the highest average annual earnings of $6,365,226, while those with less than high school education earn the least with $1,174,674. Women with an educational attainment of graduate degree earn the most with the average annual earnings of $4,461,149, while those with less than high school education have the smallest earnings of $734,068.
| Educational Attainment | Male Income | Female Income |
| Less than High School | $1,174,674 | $734,068 |
| High School Diploma | $2,435,899 | $1,462,377 |
| College or Associate's Degree | $2,730,357 | $1,967,303 |
| Bachelor's Degree | $5,238,406 | $3,391,146 |
| Graduate Degree | $6,365,226 | $4,461,149 |
| Total | $5,008,150 | $3,213,192 |
Family Income in Area Code 339
Family Income Brackets in Area Code 339
According to the Area Code 339 family income data, there are 4,912,078 families falling into the $200,000+ income range, which is the most common income bracket and makes up 1,869.9% of all families. Conversely, the $10,000 to $14,999 income bracket is the least frequent group with only 151,311 families (57.6%) belonging to this category.
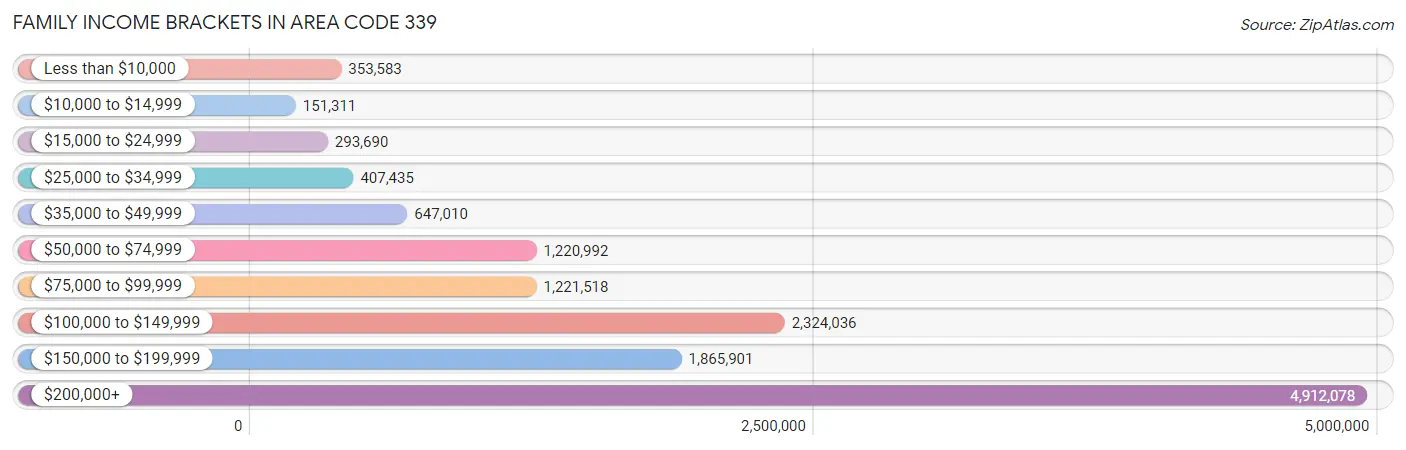
| Income Bracket | # Families | % Families |
| Less than $10,000 | 353,583 | 134.6% |
| $10,000 to $14,999 | 151,311 | 57.6% |
| $15,000 to $24,999 | 293,690 | 111.8% |
| $25,000 to $34,999 | 407,435 | 155.1% |
| $35,000 to $49,999 | 647,010 | 246.3% |
| $50,000 to $74,999 | 1,220,992 | 464.8% |
| $75,000 to $99,999 | 1,221,518 | 465.0% |
| $100,000 to $149,999 | 2,324,036 | 884.7% |
| $150,000 to $199,999 | 1,865,901 | 710.3% |
| $200,000+ | 4,912,078 | 1,869.9% |
Family Income by Famaliy Size in Area Code 339
7+ person families (2,807 | 1.1%) account for the highest median family income in Area Code 339 with $202,752 per family, while 2-person families (111,903 | 42.6%) have the highest median income of $66,433 per family member.
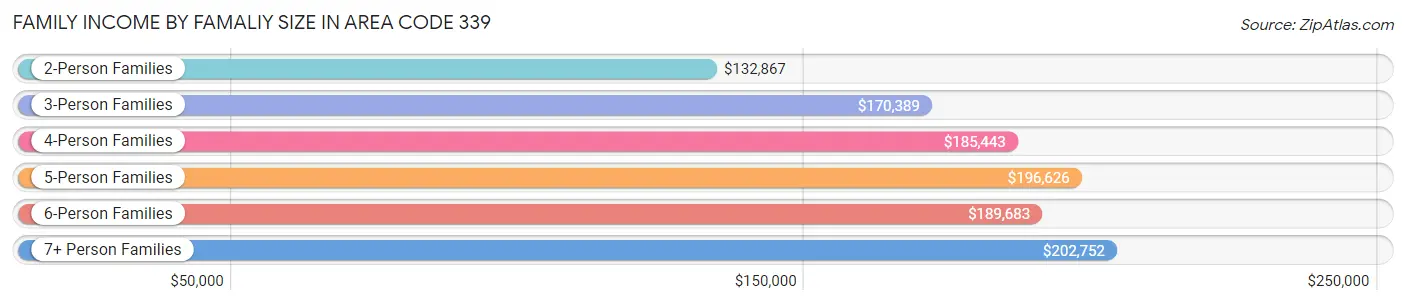
| Income Bracket | # Families | Median Income |
| 2-Person Families | 111,903 (42.6%) | $132,867 |
| 3-Person Families | 61,755 (23.5%) | $170,389 |
| 4-Person Families | 56,909 (21.7%) | $185,443 |
| 5-Person Families | 21,902 (8.3%) | $196,626 |
| 6-Person Families | 7,416 (2.8%) | $189,683 |
| 7+ Person Families | 2,807 (1.1%) | $202,752 |
| Total | 262,692 (100.0%) | $161,463 |
Family Income by Number of Earners in Area Code 339
The median family income in Area Code 339 is $161,463, with families comprising 3+ earners (42,356) having the highest median family income of $206,875, while families with no earners (27,381) have the lowest median family income of $68,881, accounting for 16.1% and 10.4% of families, respectively.
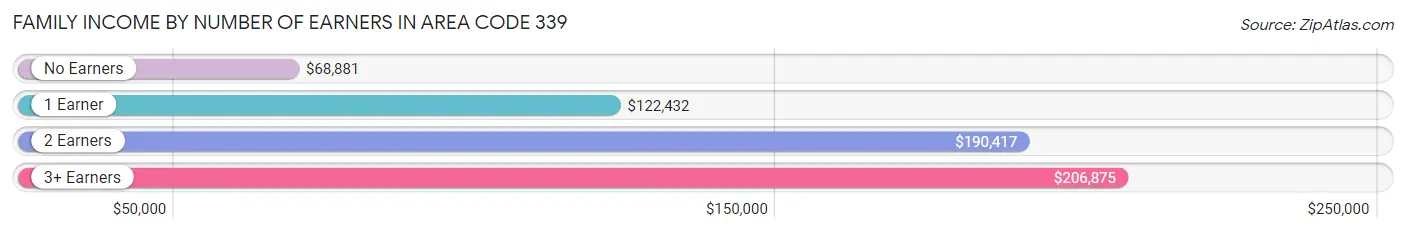
| Number of Earners | # Families | Median Income |
| No Earners | 27,381 (10.4%) | $68,881 |
| 1 Earner | 67,807 (25.8%) | $122,432 |
| 2 Earners | 125,148 (47.6%) | $190,417 |
| 3+ Earners | 42,356 (16.1%) | $206,875 |
| Total | 262,692 (100.0%) | $161,463 |
Household Income in Area Code 339
Household Income Brackets in Area Code 339
With 6,094,655 households falling in the category, the $200,000+ income range is the most frequent in Area Code 339, accounting for 1,454.7% of all households. In contrast, only 617,132 households (147.3%) fall into the $10,000 to $14,999 income bracket, making it the least populous group.
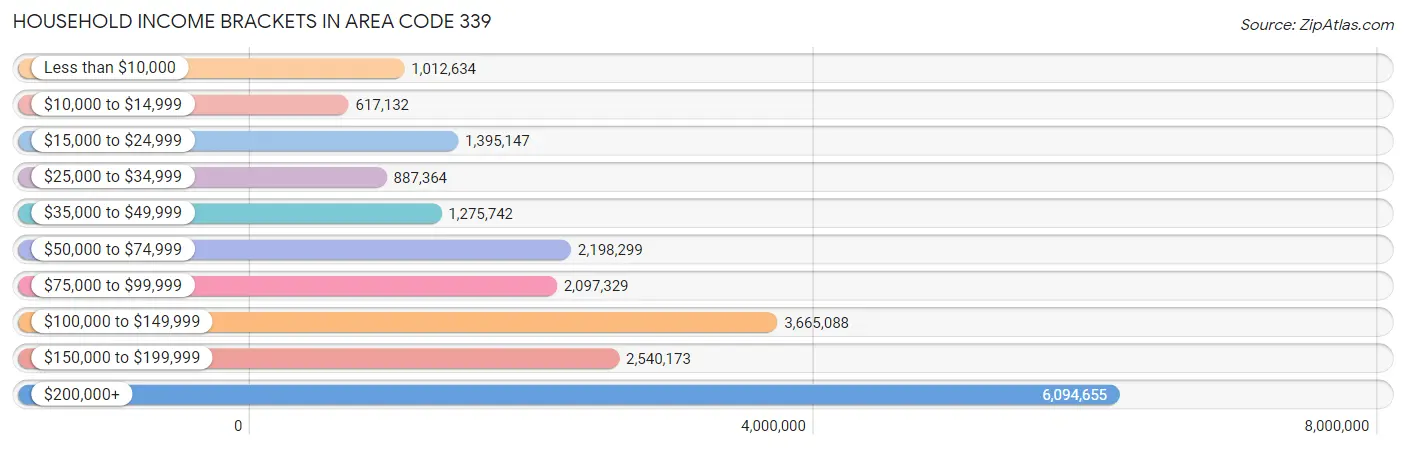
| Income Bracket | # Households | % Households |
| Less than $10,000 | 1,012,634 | 241.7% |
| $10,000 to $14,999 | 617,132 | 147.3% |
| $15,000 to $24,999 | 1,395,147 | 333.0% |
| $25,000 to $34,999 | 887,364 | 211.8% |
| $35,000 to $49,999 | 1,275,742 | 304.5% |
| $50,000 to $74,999 | 2,198,299 | 524.7% |
| $75,000 to $99,999 | 2,097,329 | 500.6% |
| $100,000 to $149,999 | 3,665,088 | 874.8% |
| $150,000 to $199,999 | 2,540,173 | 606.3% |
| $200,000+ | 6,094,655 | 1,454.7% |
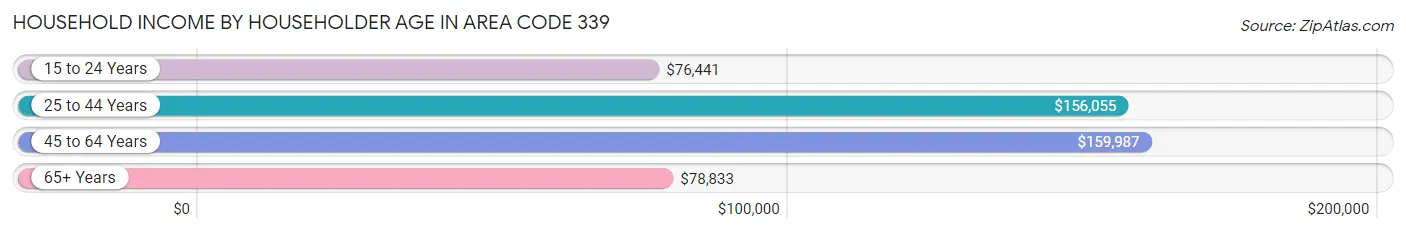
Household Income by Householder Age in Area Code 339
The median household income in Area Code 339 is $129,999, with the highest median household income of $159,987 found in the 45 to 64 years age bracket for the primary householder. A total of 156,469 households (37.3%) fall into this category. Meanwhile, the 15 to 24 years age bracket for the primary householder has the lowest median household income of $76,441, with 12,680 households (3.0%) in this group.
| Income Bracket | # Households | Median Income |
| 15 to 24 Years | 12,680 (3.0%) | $76,441 |
| 25 to 44 Years | 139,272 (33.2%) | $156,055 |
| 45 to 64 Years | 156,469 (37.3%) | $159,987 |
| 65+ Years | 110,542 (26.4%) | $78,833 |
| Total | 418,963 (100.0%) | $129,999 |
Poverty in Area Code 339
Income Below Poverty by Sex and Age in Area Code 339
With 7.2% poverty level for males and 8.7% for females among the residents of Area Code 339, 18 to 24 year old males and 75 year old and over females are the most vulnerable to poverty, with 6,760 males (14.8%) and 6,634 females (14.4%) in their respective age groups living below the poverty level.
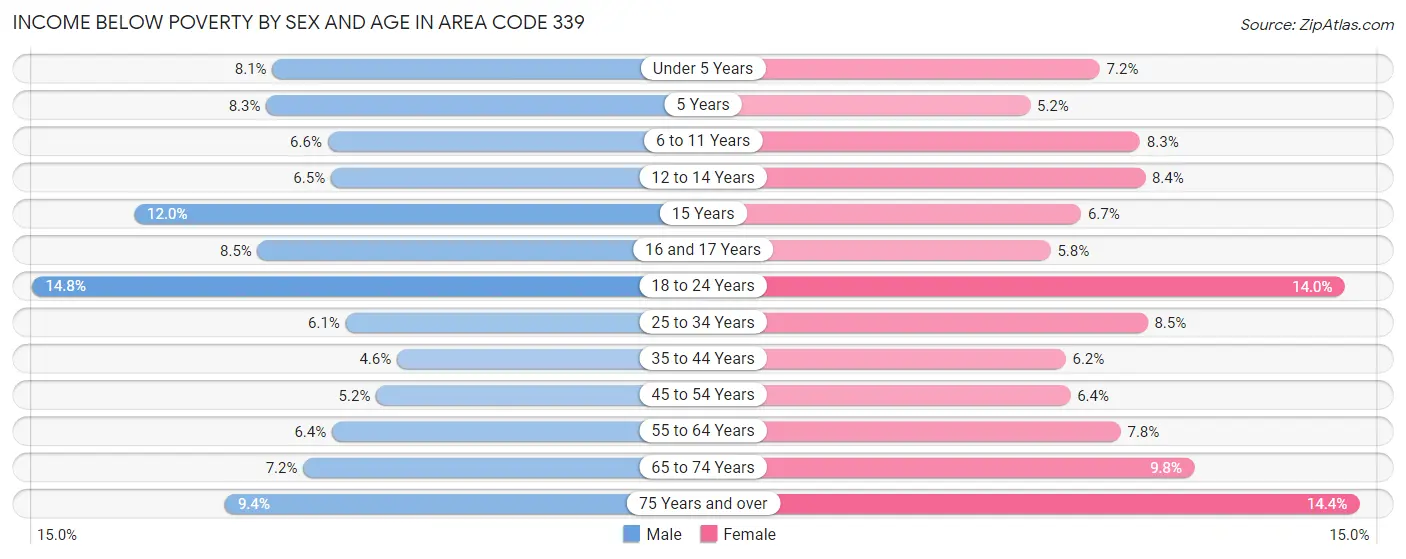
| Age Bracket | Male | Female |
| Under 5 Years | 2,440 (8.1%) | 1,841 (7.2%) |
| 5 Years | 461 (8.3%) | 245 (5.2%) |
| 6 to 11 Years | 2,202 (6.6%) | 2,956 (8.3%) |
| 12 to 14 Years | 1,108 (6.5%) | 1,559 (8.4%) |
| 15 Years | 685 (11.9%) | 403 (6.7%) |
| 16 and 17 Years | 1,149 (8.5%) | 703 (5.8%) |
| 18 to 24 Years | 6,760 (14.8%) | 5,872 (14.0%) |
| 25 to 34 Years | 4,950 (6.1%) | 6,530 (8.5%) |
| 35 to 44 Years | 3,308 (4.6%) | 4,409 (6.2%) |
| 45 to 54 Years | 3,623 (5.2%) | 4,521 (6.4%) |
| 55 to 64 Years | 4,437 (6.4%) | 5,479 (7.8%) |
| 65 to 74 Years | 3,258 (7.2%) | 5,183 (9.8%) |
| 75 Years and over | 2,707 (9.4%) | 6,634 (14.4%) |
| Total | 37,088 (7.2%) | 46,335 (8.7%) |
Income Above Poverty by Sex and Age in Area Code 339
According to the poverty statistics in Area Code 339, males aged 35 to 44 years and females aged 5 years are the age groups that are most secure financially, with 95.4% of males and 94.8% of females in these age groups living above the poverty line.
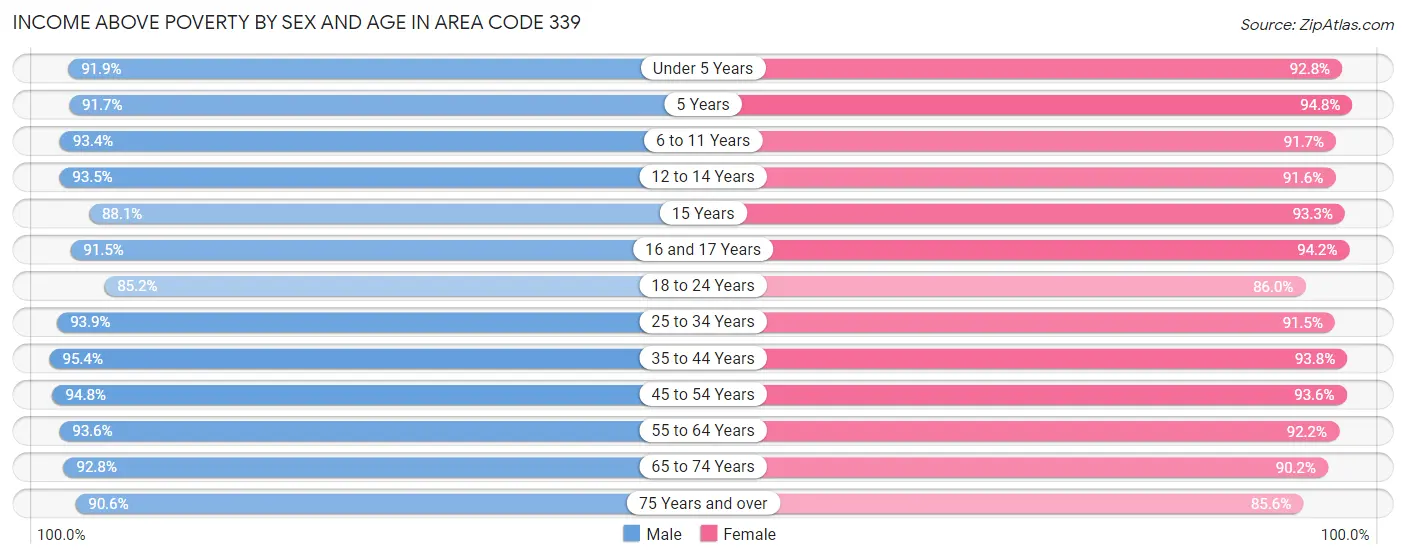
| Age Bracket | Male | Female |
| Under 5 Years | 27,669 (91.9%) | 23,801 (92.8%) |
| 5 Years | 5,114 (91.7%) | 4,431 (94.8%) |
| 6 to 11 Years | 31,385 (93.4%) | 32,670 (91.7%) |
| 12 to 14 Years | 16,019 (93.5%) | 16,908 (91.6%) |
| 15 Years | 5,047 (88.0%) | 5,644 (93.3%) |
| 16 and 17 Years | 12,345 (91.5%) | 11,400 (94.2%) |
| 18 to 24 Years | 38,982 (85.2%) | 36,110 (86.0%) |
| 25 to 34 Years | 76,675 (93.9%) | 70,221 (91.5%) |
| 35 to 44 Years | 68,149 (95.4%) | 66,391 (93.8%) |
| 45 to 54 Years | 65,897 (94.8%) | 66,570 (93.6%) |
| 55 to 64 Years | 64,455 (93.6%) | 65,088 (92.2%) |
| 65 to 74 Years | 41,712 (92.8%) | 47,681 (90.2%) |
| 75 Years and over | 26,017 (90.6%) | 39,424 (85.6%) |
| Total | 479,466 (92.8%) | 486,339 (91.3%) |
Income Below Poverty Among Married-Couple Families in Area Code 339
The poverty statistics for married-couple families in Area Code 339 show that 2.8% or 5,710 of the total 202,666 families live below the poverty line. Families with 5 or more children have the highest poverty rate of 14.7%, comprising of 55 families. On the other hand, families with 1 or 2 children have the lowest poverty rate of 2.6%, which includes 2,021 families.
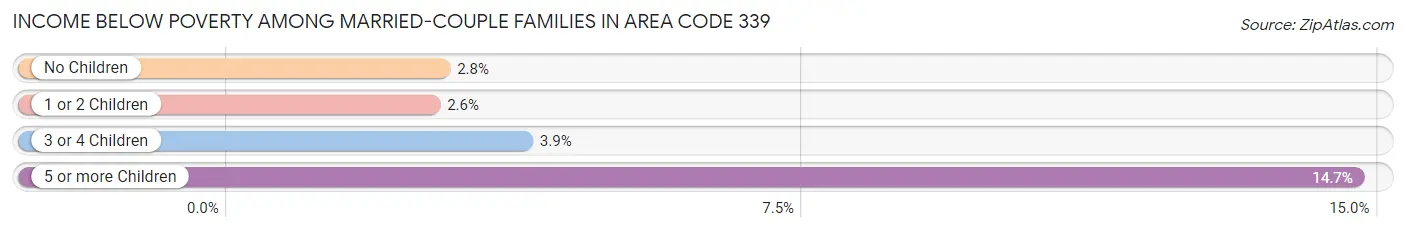
| Children | Above Poverty | Below Poverty |
| No Children | 108,892 (97.2%) | 3,099 (2.8%) |
| 1 or 2 Children | 74,388 (97.4%) | 2,021 (2.6%) |
| 3 or 4 Children | 13,357 (96.2%) | 535 (3.8%) |
| 5 or more Children | 319 (85.3%) | 55 (14.7%) |
| Total | 196,956 (97.2%) | 5,710 (2.8%) |
Income Below Poverty Among Single-Parent Households in Area Code 339
According to the poverty data in Area Code 339, 8.1% or 1,490 single-father households and 13.9% or 5,781 single-mother households are living below the poverty line. Among single-father households, those with 1 or 2 children have the highest poverty rate, with 879 households (12.3%) experiencing poverty. Likewise, among single-mother households, those with 5 or more children have the highest poverty rate, with 121 households (64.4%) falling below the poverty line.
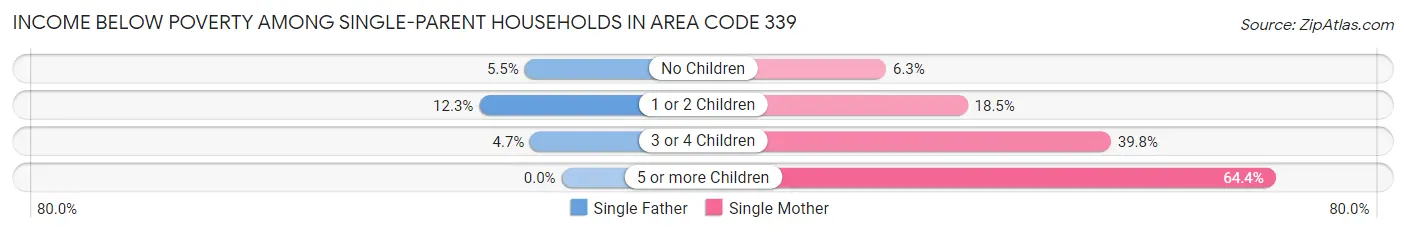
| Children | Single Father | Single Mother |
| No Children | 571 (5.5%) | 1,280 (6.3%) |
| 1 or 2 Children | 879 (12.3%) | 3,484 (18.5%) |
| 3 or 4 Children | 40 (4.7%) | 896 (39.8%) |
| 5 or more Children | 0 (0.0%) | 121 (64.4%) |
| Total | 1,490 (8.1%) | 5,781 (13.9%) |
Income Below Poverty Among Married-Couple vs Single-Parent Households in Area Code 339
The poverty data for Area Code 339 shows that 5,710 of the married-couple family households (2.8%) and 7,271 of the single-parent households (12.1%) are living below the poverty level. Within the married-couple family households, those with 5 or more children have the highest poverty rate, with 55 households (14.7%) falling below the poverty line. Among the single-parent households, those with 5 or more children have the highest poverty rate, with 121 household (56.8%) living below poverty.
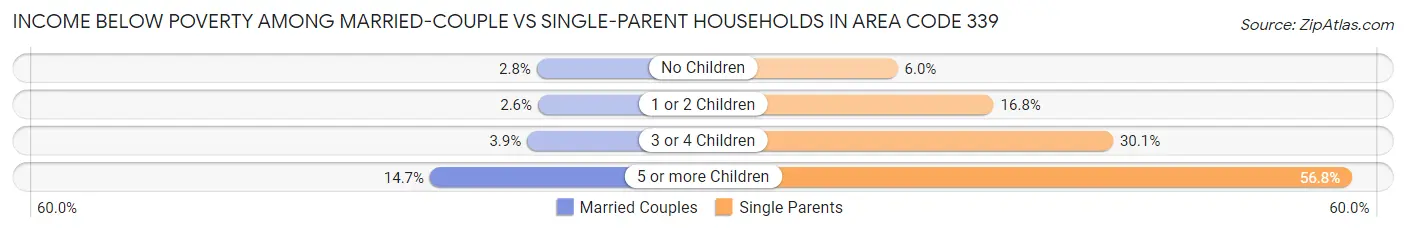
| Children | Married-Couple Families | Single-Parent Households |
| No Children | 3,099 (2.8%) | 1,851 (6.0%) |
| 1 or 2 Children | 2,021 (2.6%) | 4,363 (16.8%) |
| 3 or 4 Children | 535 (3.8%) | 936 (30.1%) |
| 5 or more Children | 55 (14.7%) | 121 (56.8%) |
| Total | 5,710 (2.8%) | 7,271 (12.1%) |
Race in Area Code 339
The most populous races in Area Code 339 are White / Caucasian (752,766 | 69.6%), Asian (124,255 | 11.5%), and Hispanic or Latino (122,419 | 11.3%).
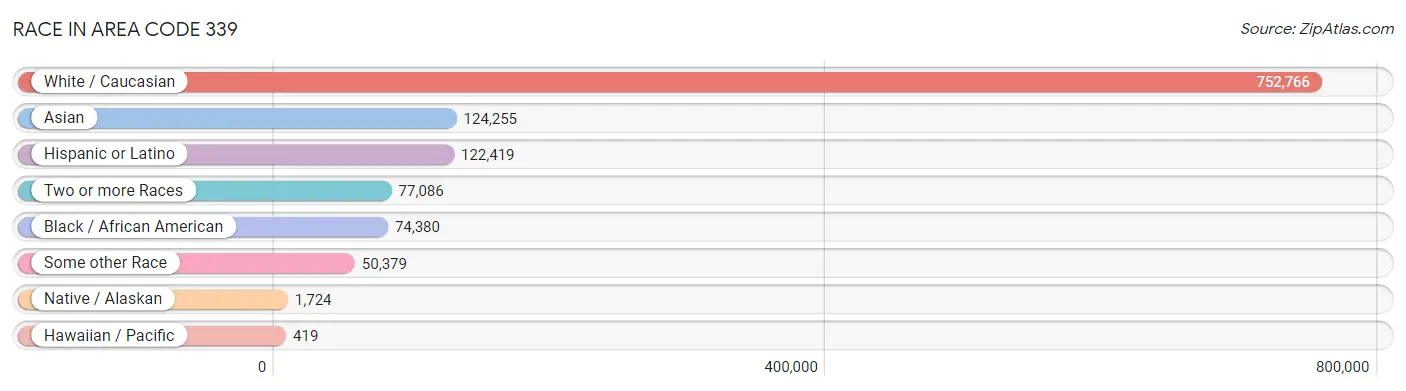
| Race | # Population | % Population |
| Asian | 124,255 | 11.5% |
| Black / African American | 74,380 | 6.9% |
| Hawaiian / Pacific | 419 | 0.0% |
| Hispanic or Latino | 122,419 | 11.3% |
| Native / Alaskan | 1,724 | 0.2% |
| White / Caucasian | 752,766 | 69.6% |
| Two or more Races | 77,086 | 7.1% |
| Some other Race | 50,379 | 4.7% |
| Total | 1,081,009 | 100.0% |
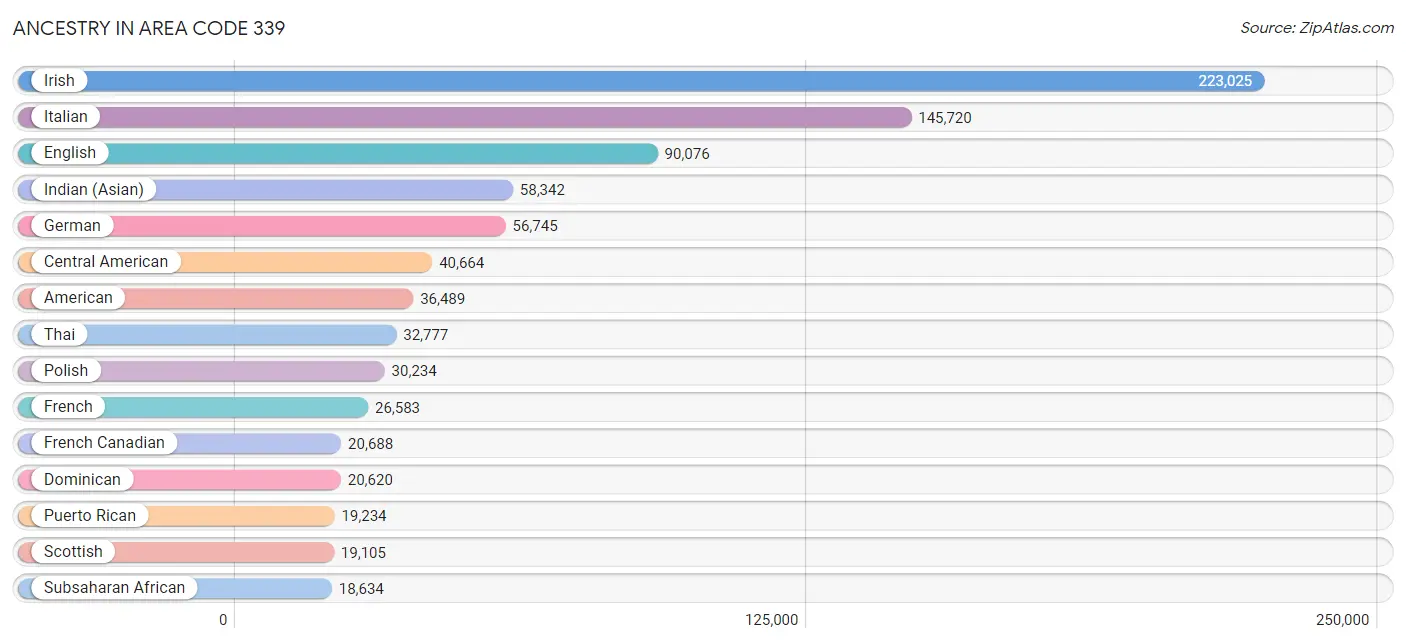
Ancestry in Area Code 339
The most populous ancestries reported in Area Code 339 are Irish (223,025 | 20.6%), Italian (145,720 | 13.5%), English (90,076 | 8.3%), Indian (Asian) (58,342 | 5.4%), and German (56,745 | 5.2%), together accounting for 53.1% of all Area Code 339 residents.
| Ancestry | # Population | % Population |
| Afghan | 255 | 0.0% |
| African | 5,661 | 0.5% |
| Alaska Native | 8 | 0.0% |
| Albanian | 3,608 | 0.3% |
| American | 36,489 | 3.4% |
| Apache | 24 | 0.0% |
| Arab | 14,468 | 1.3% |
| Argentinean | 1,310 | 0.1% |
| Armenian | 5,894 | 0.5% |
| Assyrian / Chaldean / Syriac | 68 | 0.0% |
| Australian | 232 | 0.0% |
| Austrian | 2,463 | 0.2% |
| Bahamian | 206 | 0.0% |
| Bangladeshi | 20 | 0.0% |
| Barbadian | 700 | 0.1% |
| Basque | 67 | 0.0% |
| Belgian | 933 | 0.1% |
| Belizean | 7 | 0.0% |
| Bermudan | 23 | 0.0% |
| Bhutanese | 4,211 | 0.4% |
| Blackfeet | 398 | 0.0% |
| Bolivian | 261 | 0.0% |
| Brazilian | 13,312 | 1.2% |
| British | 5,619 | 0.5% |
| British West Indian | 693 | 0.1% |
| Bulgarian | 1,530 | 0.1% |
| Burmese | 8,661 | 0.8% |
| Cajun | 53 | 0.0% |
| Cambodian | 36 | 0.0% |
| Canadian | 7,385 | 0.7% |
| Cape Verdean | 3,156 | 0.3% |
| Carpatho Rusyn | 34 | 0.0% |
| Celtic | 184 | 0.0% |
| Central American | 40,664 | 3.8% |
| Central American Indian | 1,383 | 0.1% |
| Cherokee | 606 | 0.1% |
| Chilean | 888 | 0.1% |
| Chippewa | 50 | 0.0% |
| Choctaw | 84 | 0.0% |
| Colombian | 11,210 | 1.0% |
| Costa Rican | 378 | 0.0% |
| Cree | 71 | 0.0% |
| Creek | 49 | 0.0% |
| Croatian | 764 | 0.1% |
| Crow | 15 | 0.0% |
| Cuban | 2,590 | 0.2% |
| Cypriot | 50 | 0.0% |
| Czech | 1,626 | 0.2% |
| Czechoslovakian | 243 | 0.0% |
| Danish | 2,503 | 0.2% |
| Delaware | 73 | 0.0% |
| Dominican | 20,620 | 1.9% |
| Dutch | 4,550 | 0.4% |
| Dutch West Indian | 20 | 0.0% |
| Eastern European | 8,315 | 0.8% |
| Ecuadorian | 1,112 | 0.1% |
| Egyptian | 1,018 | 0.1% |
| English | 90,076 | 8.3% |
| Estonian | 191 | 0.0% |
| Ethiopian | 2,309 | 0.2% |
| European | 12,668 | 1.2% |
| Fijian | 16 | 0.0% |
| Filipino | 2,251 | 0.2% |
| Finnish | 2,521 | 0.2% |
| French | 26,583 | 2.5% |
| French American Indian | 450 | 0.0% |
| French Canadian | 20,688 | 1.9% |
| German | 56,745 | 5.2% |
| German Russian | 12 | 0.0% |
| Ghanaian | 490 | 0.1% |
| Greek | 14,663 | 1.4% |
| Guamanian / Chamorro | 211 | 0.0% |
| Guatemalan | 17,159 | 1.6% |
| Guyanese | 224 | 0.0% |
| Haitian | 17,668 | 1.6% |
| Honduran | 3,485 | 0.3% |
| Hopi | 22 | 0.0% |
| Houma | 16 | 0.0% |
| Hungarian | 2,982 | 0.3% |
| Icelander | 137 | 0.0% |
| Indian (Asian) | 58,342 | 5.4% |
| Indonesian | 220 | 0.0% |
| Inupiat | 68 | 0.0% |
| Iranian | 2,564 | 0.2% |
| Iraqi | 362 | 0.0% |
| Irish | 223,025 | 20.6% |
| Iroquois | 79 | 0.0% |
| Israeli | 780 | 0.1% |
| Italian | 145,720 | 13.5% |
| Jamaican | 4,035 | 0.4% |
| Japanese | 4,803 | 0.4% |
| Jordanian | 281 | 0.0% |
| Kenyan | 1,433 | 0.1% |
| Korean | 5,356 | 0.5% |
| Laotian | 1,013 | 0.1% |
| Latvian | 1,017 | 0.1% |
| Lebanese | 4,211 | 0.4% |
| Liberian | 738 | 0.1% |
| Lithuanian | 5,847 | 0.5% |
| Lumbee | 14 | 0.0% |
| Luxembourger | 63 | 0.0% |
| Macedonian | 57 | 0.0% |
| Malaysian | 303 | 0.0% |
| Maltese | 42 | 0.0% |
| Mexican | 9,028 | 0.8% |
| Mexican American Indian | 183 | 0.0% |
| Mongolian | 140 | 0.0% |
| Moroccan | 3,365 | 0.3% |
| Native Hawaiian | 256 | 0.0% |
| Navajo | 145 | 0.0% |
| New Zealander | 183 | 0.0% |
| Nicaraguan | 189 | 0.0% |
| Nigerian | 2,053 | 0.2% |
| Northern European | 2,137 | 0.2% |
| Norwegian | 5,117 | 0.5% |
| Okinawan | 155 | 0.0% |
| Pakistani | 1,070 | 0.1% |
| Palestinian | 550 | 0.1% |
| Panamanian | 358 | 0.0% |
| Paraguayan | 220 | 0.0% |
| Pennsylvania German | 128 | 0.0% |
| Peruvian | 1,897 | 0.2% |
| Polish | 30,234 | 2.8% |
| Portuguese | 15,920 | 1.5% |
| Potawatomi | 10 | 0.0% |
| Pueblo | 5 | 0.0% |
| Puerto Rican | 19,234 | 1.8% |
| Romanian | 1,788 | 0.2% |
| Russian | 17,652 | 1.6% |
| Salvadoran | 17,797 | 1.7% |
| Samoan | 88 | 0.0% |
| Scandinavian | 1,411 | 0.1% |
| Scotch-Irish | 6,059 | 0.6% |
| Scottish | 19,105 | 1.8% |
| Seminole | 33 | 0.0% |
| Serbian | 597 | 0.1% |
| Sierra Leonean | 53 | 0.0% |
| Sioux | 165 | 0.0% |
| Slavic | 475 | 0.0% |
| Slovak | 1,184 | 0.1% |
| Slovene | 207 | 0.0% |
| Somali | 37 | 0.0% |
| South African | 295 | 0.0% |
| South American | 18,510 | 1.7% |
| South American Indian | 264 | 0.0% |
| Soviet Union | 25 | 0.0% |
| Spaniard | 2,434 | 0.2% |
| Spanish | 1,443 | 0.1% |
| Sri Lankan | 13,448 | 1.2% |
| Subsaharan African | 18,634 | 1.7% |
| Sudanese | 371 | 0.0% |
| Swedish | 12,646 | 1.2% |
| Swiss | 1,589 | 0.2% |
| Syrian | 1,380 | 0.1% |
| Taiwanese | 10 | 0.0% |
| Thai | 32,777 | 3.0% |
| Tlingit-Haida | 34 | 0.0% |
| Tongan | 11 | 0.0% |
| Trinidadian and Tobagonian | 829 | 0.1% |
| Turkish | 1,466 | 0.1% |
| U.S. Virgin Islander | 120 | 0.0% |
| Ugandan | 1,377 | 0.1% |
| Ukrainian | 4,826 | 0.4% |
| Uruguayan | 110 | 0.0% |
| Venezuelan | 1,292 | 0.1% |
| Vietnamese | 1,330 | 0.1% |
| Welsh | 3,703 | 0.3% |
| West Indian | 587 | 0.1% |
| Yugoslavian | 1,040 | 0.1% |
| Yup'ik | 12 | 0.0% |
| Zimbabwean | 8 | 0.0% | View All 171 Rows |
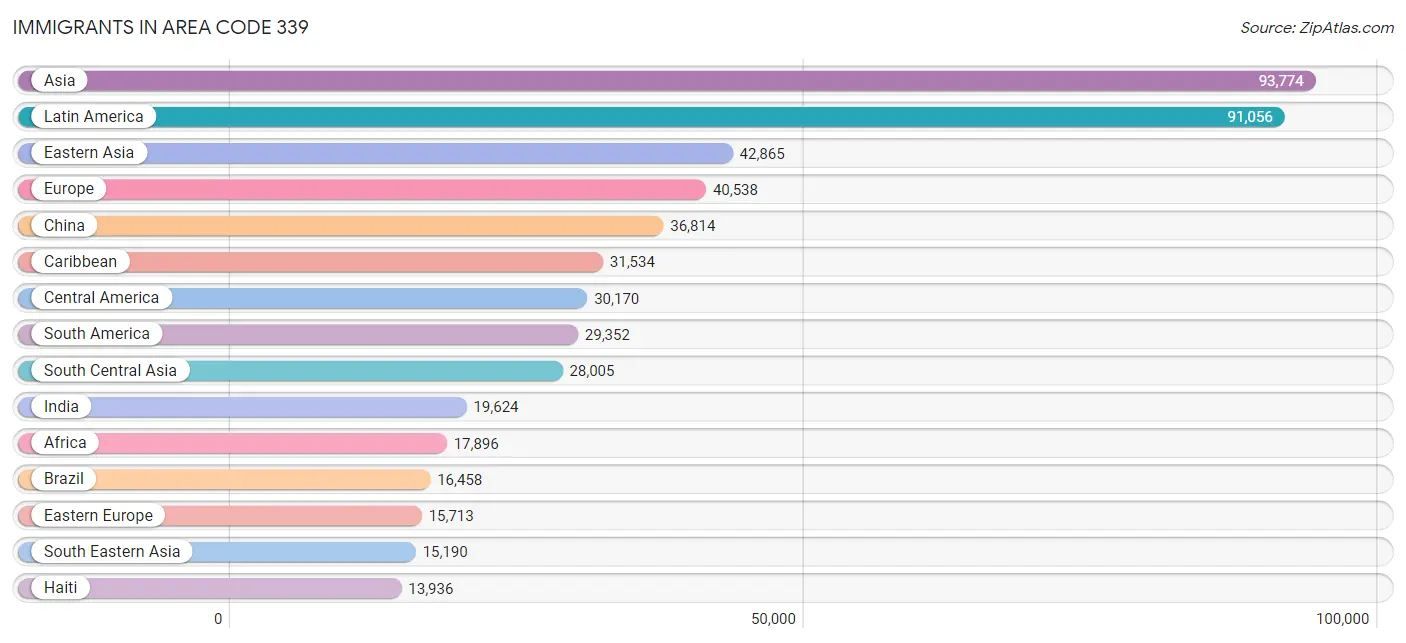
Immigrants in Area Code 339
The most numerous immigrant groups reported in Area Code 339 came from Asia (93,774 | 8.7%), Latin America (91,056 | 8.4%), Eastern Asia (42,865 | 4.0%), Europe (40,538 | 3.7%), and China (36,814 | 3.4%), together accounting for 28.2% of all Area Code 339 residents.
| Immigration Origin | # Population | % Population |
| Afghanistan | 281 | 0.0% |
| Africa | 17,896 | 1.7% |
| Albania | 2,262 | 0.2% |
| Argentina | 992 | 0.1% |
| Armenia | 538 | 0.1% |
| Asia | 93,774 | 8.7% |
| Australia | 426 | 0.0% |
| Austria | 42 | 0.0% |
| Azores | 433 | 0.0% |
| Bahamas | 10 | 0.0% |
| Bangladesh | 1,160 | 0.1% |
| Barbados | 620 | 0.1% |
| Belarus | 496 | 0.1% |
| Belgium | 176 | 0.0% |
| Bolivia | 91 | 0.0% |
| Bosnia and Herzegovina | 951 | 0.1% |
| Brazil | 16,458 | 1.5% |
| Bulgaria | 1,020 | 0.1% |
| Cabo Verde | 1,932 | 0.2% |
| Cambodia | 1,716 | 0.2% |
| Cameroon | 249 | 0.0% |
| Canada | 4,855 | 0.4% |
| Caribbean | 31,534 | 2.9% |
| Central America | 30,170 | 2.8% |
| Chile | 560 | 0.1% |
| China | 36,814 | 3.4% |
| Colombia | 7,606 | 0.7% |
| Costa Rica | 167 | 0.0% |
| Croatia | 116 | 0.0% |
| Cuba | 372 | 0.0% |
| Czechoslovakia | 189 | 0.0% |
| Denmark | 427 | 0.0% |
| Dominica | 141 | 0.0% |
| Dominican Republic | 12,993 | 1.2% |
| Eastern Africa | 5,442 | 0.5% |
| Eastern Asia | 42,865 | 4.0% |
| Eastern Europe | 15,713 | 1.5% |
| Ecuador | 766 | 0.1% |
| Egypt | 798 | 0.1% |
| El Salvador | 13,068 | 1.2% |
| England | 1,671 | 0.2% |
| Eritrea | 275 | 0.0% |
| Ethiopia | 1,789 | 0.2% |
| Europe | 40,538 | 3.7% |
| Fiji | 43 | 0.0% |
| France | 1,966 | 0.2% |
| Germany | 2,171 | 0.2% |
| Ghana | 747 | 0.1% |
| Greece | 2,525 | 0.2% |
| Grenada | 152 | 0.0% |
| Guatemala | 11,245 | 1.0% |
| Guyana | 133 | 0.0% |
| Haiti | 13,936 | 1.3% |
| Honduras | 2,822 | 0.3% |
| Hong Kong | 2,662 | 0.3% |
| Hungary | 325 | 0.0% |
| India | 19,624 | 1.8% |
| Indonesia | 557 | 0.1% |
| Iran | 1,799 | 0.2% |
| Iraq | 396 | 0.0% |
| Ireland | 2,730 | 0.3% |
| Israel | 1,084 | 0.1% |
| Italy | 5,085 | 0.5% |
| Jamaica | 2,367 | 0.2% |
| Japan | 1,715 | 0.2% |
| Jordan | 478 | 0.0% |
| Kazakhstan | 250 | 0.0% |
| Kenya | 1,301 | 0.1% |
| Korea | 4,290 | 0.4% |
| Kuwait | 256 | 0.0% |
| Laos | 235 | 0.0% |
| Latin America | 91,056 | 8.4% |
| Latvia | 211 | 0.0% |
| Lebanon | 1,691 | 0.2% |
| Liberia | 842 | 0.1% |
| Lithuania | 216 | 0.0% |
| Malaysia | 479 | 0.0% |
| Mexico | 2,278 | 0.2% |
| Middle Africa | 434 | 0.0% |
| Moldova | 574 | 0.1% |
| Morocco | 3,113 | 0.3% |
| Nepal | 2,241 | 0.2% |
| Netherlands | 304 | 0.0% |
| Nicaragua | 74 | 0.0% |
| Nigeria | 1,581 | 0.2% |
| North Macedonia | 9 | 0.0% |
| Northern Africa | 4,800 | 0.4% |
| Northern Europe | 8,460 | 0.8% |
| Norway | 114 | 0.0% |
| Oceania | 760 | 0.1% |
| Pakistan | 1,869 | 0.2% |
| Panama | 201 | 0.0% |
| Peru | 1,613 | 0.2% |
| Philippines | 2,472 | 0.2% |
| Poland | 1,526 | 0.1% |
| Portugal | 2,439 | 0.2% |
| Romania | 469 | 0.0% |
| Russia | 3,991 | 0.4% |
| Saudi Arabia | 496 | 0.1% |
| Scotland | 137 | 0.0% |
| Senegal | 77 | 0.0% |
| Serbia | 339 | 0.0% |
| Sierra Leone | 263 | 0.0% |
| Singapore | 275 | 0.0% |
| Somalia | 12 | 0.0% |
| South Africa | 518 | 0.1% |
| South America | 29,352 | 2.7% |
| South Central Asia | 28,005 | 2.6% |
| South Eastern Asia | 15,190 | 1.4% |
| Southern Europe | 11,145 | 1.0% |
| Spain | 1,090 | 0.1% |
| Sri Lanka | 549 | 0.1% |
| St. Vincent and the Grenadines | 95 | 0.0% |
| Sudan | 167 | 0.0% |
| Sweden | 312 | 0.0% |
| Switzerland | 461 | 0.0% |
| Syria | 900 | 0.1% |
| Taiwan | 2,598 | 0.2% |
| Thailand | 1,232 | 0.1% |
| Trinidad and Tobago | 555 | 0.1% |
| Turkey | 1,104 | 0.1% |
| Uganda | 1,559 | 0.1% |
| Ukraine | 2,022 | 0.2% |
| Uruguay | 137 | 0.0% |
| Uzbekistan | 93 | 0.0% |
| Venezuela | 901 | 0.1% |
| Vietnam | 7,833 | 0.7% |
| West Indies | 94 | 0.0% |
| Western Africa | 6,146 | 0.6% |
| Western Asia | 7,591 | 0.7% |
| Western Europe | 5,120 | 0.5% |
| Yemen | 46 | 0.0% |
| Zaire | 33 | 0.0% |
| Zimbabwe | 135 | 0.0% | View All 134 Rows |
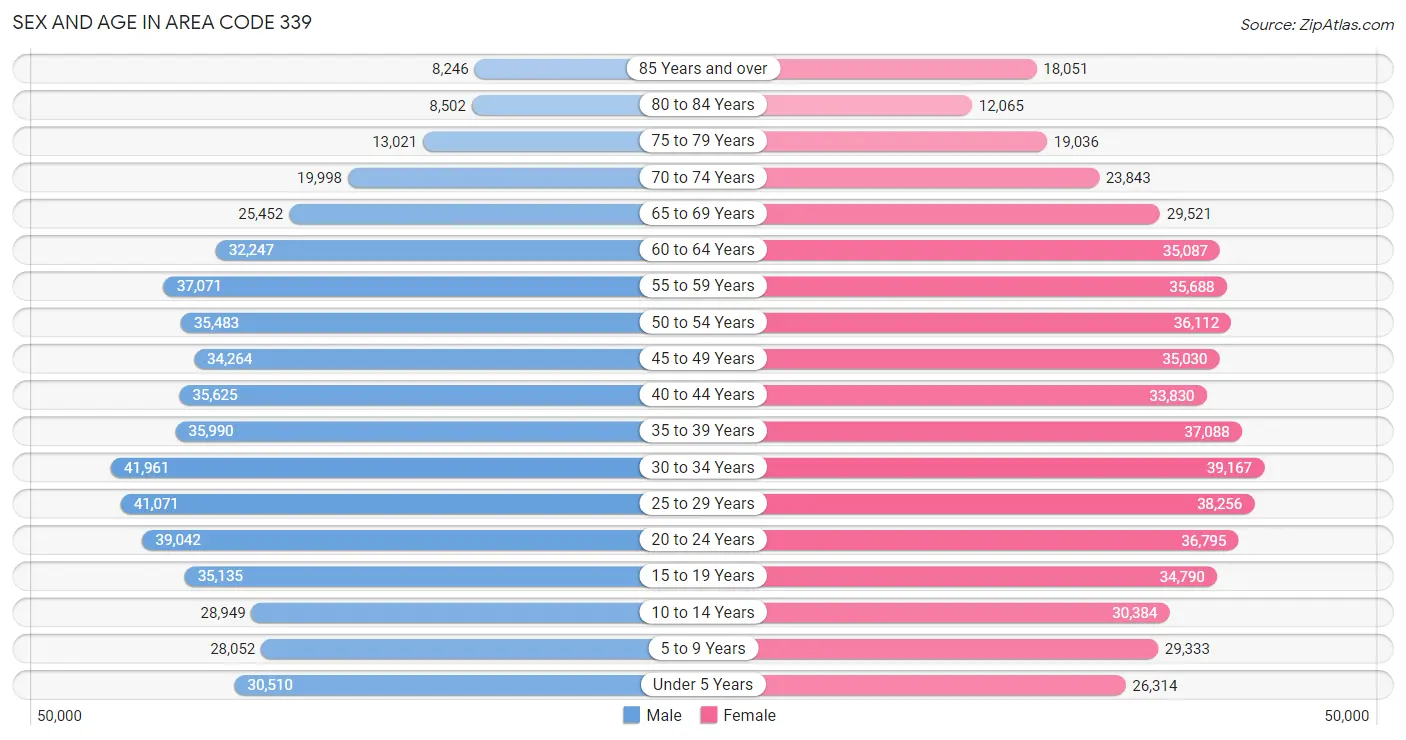
Sex and Age in Area Code 339
Sex and Age in Area Code 339
The most populous age groups in Area Code 339 are 30 to 34 Years (41,961 | 7.9%) for men and 30 to 34 Years (39,167 | 7.1%) for women.
| Age Bracket | Male | Female |
| Under 5 Years | 30,510 (5.8%) | 26,314 (4.8%) |
| 5 to 9 Years | 28,052 (5.3%) | 29,333 (5.3%) |
| 10 to 14 Years | 28,949 (5.5%) | 30,384 (5.5%) |
| 15 to 19 Years | 35,135 (6.6%) | 34,790 (6.3%) |
| 20 to 24 Years | 39,042 (7.4%) | 36,795 (6.7%) |
| 25 to 29 Years | 41,071 (7.7%) | 38,256 (7.0%) |
| 30 to 34 Years | 41,961 (7.9%) | 39,167 (7.1%) |
| 35 to 39 Years | 35,990 (6.8%) | 37,088 (6.7%) |
| 40 to 44 Years | 35,625 (6.7%) | 33,830 (6.1%) |
| 45 to 49 Years | 34,264 (6.5%) | 35,030 (6.4%) |
| 50 to 54 Years | 35,483 (6.7%) | 36,112 (6.6%) |
| 55 to 59 Years | 37,071 (7.0%) | 35,688 (6.5%) |
| 60 to 64 Years | 32,247 (6.1%) | 35,087 (6.4%) |
| 65 to 69 Years | 25,452 (4.8%) | 29,521 (5.4%) |
| 70 to 74 Years | 19,998 (3.8%) | 23,843 (4.3%) |
| 75 to 79 Years | 13,021 (2.5%) | 19,036 (3.5%) |
| 80 to 84 Years | 8,502 (1.6%) | 12,065 (2.2%) |
| 85 Years and over | 8,246 (1.5%) | 18,051 (3.3%) |
| Total | 530,619 (100.0%) | 550,390 (100.0%) |
Families and Households in Area Code 339
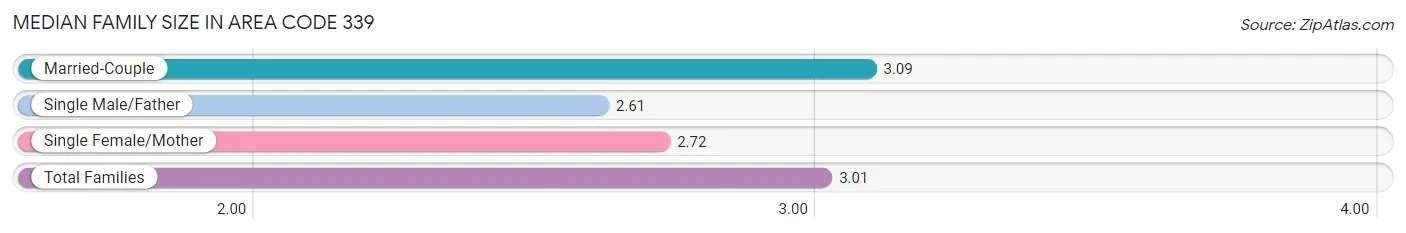
Median Family Size in Area Code 339
The median family size in Area Code 339 is 3.01 persons per family, with married-couple families (202,666 | 77.1%) accounting for the largest median family size of 3.0898 persons per family. On the other hand, single male/father families (18,433 | 7.0%) represent the smallest median family size with 2.61 persons per family.
| Family Type | # Families | Family Size |
| Married-Couple | 202,666 (77.1%) | 3.09 |
| Single Male/Father | 18,433 (7.0%) | 2.61 |
| Single Female/Mother | 41,593 (15.8%) | 2.72 |
| Total Families | 262,692 (100.0%) | 3.01 |
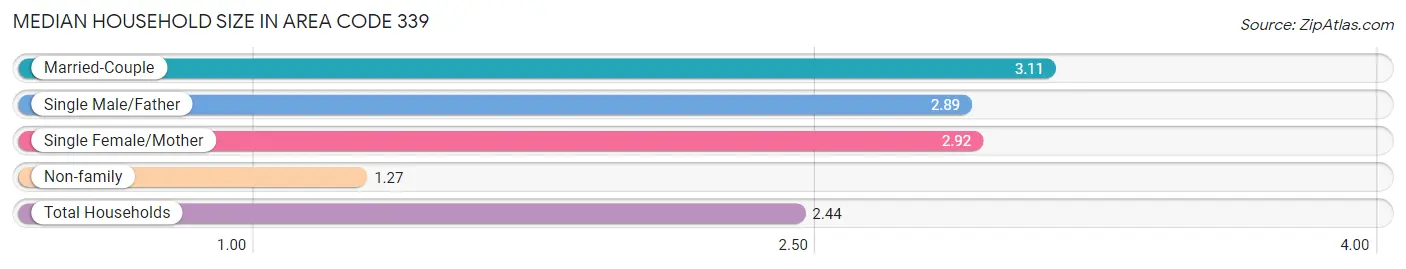
Median Household Size in Area Code 339
The median household size in Area Code 339 is 2.44 persons per household, with married-couple households (202,666 | 48.4%) accounting for the largest median household size of 3.11431 persons per household. non-family households (156,271 | 37.3%) represent the smallest median household size with 1.27 persons per household.
| Household Type | # Households | Household Size |
| Married-Couple | 202,666 (48.4%) | 3.11 |
| Single Male/Father | 18,433 (4.4%) | 2.89 |
| Single Female/Mother | 41,593 (9.9%) | 2.92 |
| Non-family | 156,271 (37.3%) | 1.27 |
| Total Households | 418,963 (100.0%) | 2.44 |
Household Size by Marriage Status in Area Code 339
Out of a total of 418,963 households in Area Code 339, 262,692 (62.7%) are family households, while 156,271 (37.3%) are nonfamily households. The most numerous type of family households are 2-person households, comprising 105,176, and the most common type of nonfamily households are 1-person households, comprising 117,834.
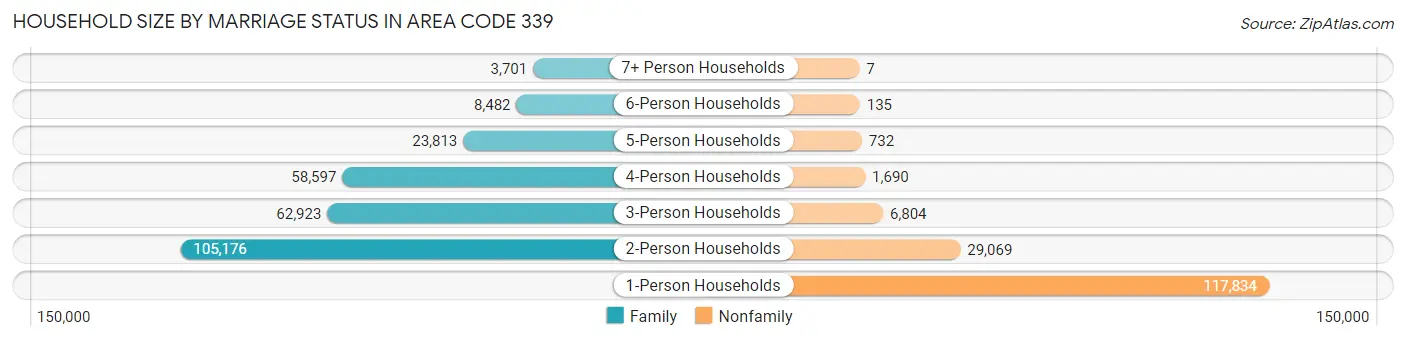
| Household Size | Family Households | Nonfamily Households |
| 1-Person Households | - | 117,834 (28.1%) |
| 2-Person Households | 105,176 (25.1%) | 29,069 (6.9%) |
| 3-Person Households | 62,923 (15.0%) | 6,804 (1.6%) |
| 4-Person Households | 58,597 (14.0%) | 1,690 (0.4%) |
| 5-Person Households | 23,813 (5.7%) | 732 (0.2%) |
| 6-Person Households | 8,482 (2.0%) | 135 (0.0%) |
| 7+ Person Households | 3,701 (0.9%) | 7 (0.0%) |
| Total | 262,692 (62.7%) | 156,271 (37.3%) |
Female Fertility in Area Code 339
Fertility by Age in Area Code 339
Average fertility rate in Area Code 339 is 41.7 births per 1,000 women. Women in the age bracket of 20 to 34 years have the highest fertility rate with 59.6 births per 1,000 women. Women in the age bracket of 20 to 34 years acount for 52.2% of all women with births.
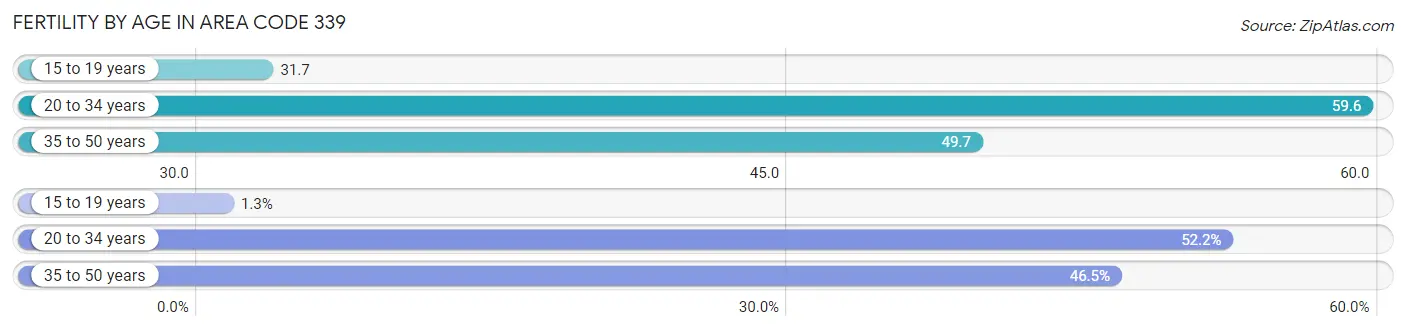
| Age Bracket | Women with Births | Births / 1,000 Women |
| 15 to 19 years | 145 (1.3%) | 31.7 |
| 20 to 34 years | 5,749 (52.2%) | 59.6 |
| 35 to 50 years | 5,124 (46.5%) | 49.7 |
| Total | 11,018 (100.0%) | 41.7 |
Fertility by Age by Marriage Status in Area Code 339
80.3% of women with births (11,018) in Area Code 339 are married. The highest percentage of unmarried women with births falls into 15 to 19 years age bracket with 100.0% of them unmarried at the time of birth, while the lowest percentage of unmarried women with births belong to 35 to 50 years age bracket with 24.4% of them unmarried.
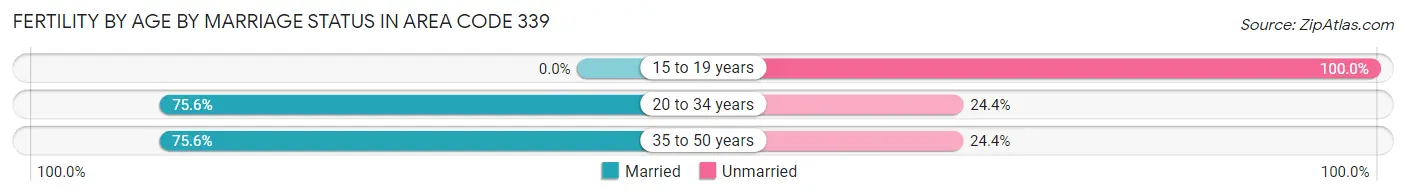
| Age Bracket | Married | Unmarried |
| 15 to 19 years | 0 (0.0%) | 145 (100.0%) |
| 20 to 34 years | 4,346 (75.6%) | 1,403 (24.4%) |
| 35 to 50 years | 3,876 (75.6%) | 1,248 (24.4%) |
| Total | 8,850 (80.3%) | 2,168 (19.7%) |
Fertility by Education in Area Code 339
Average fertility rate in Area Code 339 is 41.7 births per 1,000 women. Women with the education attainment of graduate degree have the highest fertility rate of 69.9 births per 1,000 women, while women with the education attainment of less than high school have the lowest fertility at 33.3 births per 1,000 women. Women with the education attainment of graduate degree represent 37.9% of all women with births.
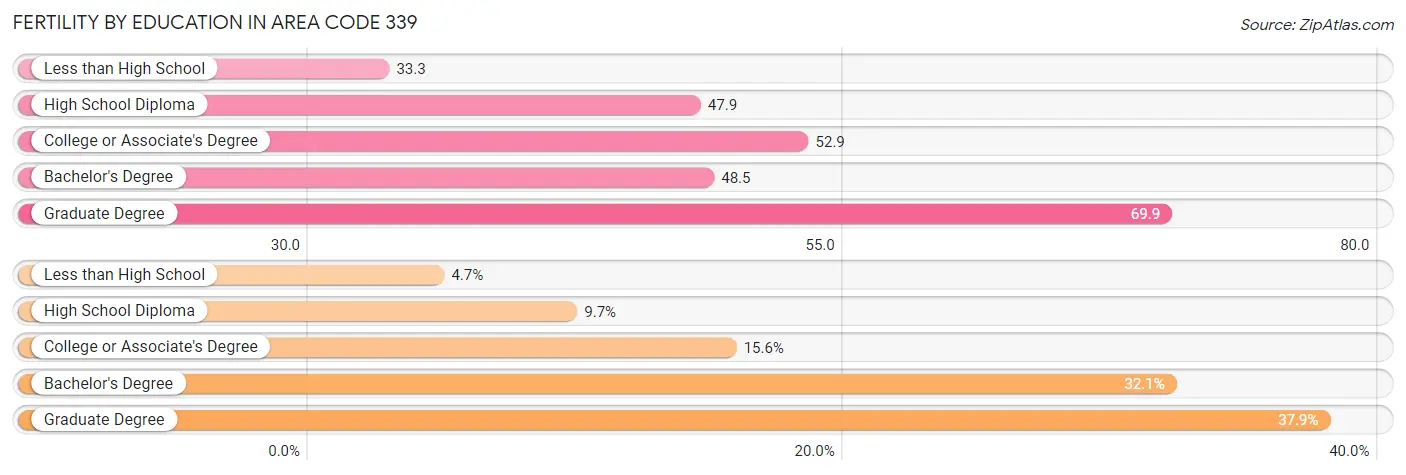
| Educational Attainment | Women with Births | Births / 1,000 Women |
| Less than High School | 517 (4.7%) | 33.3 |
| High School Diploma | 1,065 (9.7%) | 47.9 |
| College or Associate's Degree | 1,723 (15.6%) | 52.9 |
| Bachelor's Degree | 3,539 (32.1%) | 48.5 |
| Graduate Degree | 4,174 (37.9%) | 69.9 |
| Total | 11,018 (100.0%) | 41.7 |
Fertility by Education by Marriage Status in Area Code 339
19.7% of women with births in Area Code 339 are unmarried. Women with the educational attainment of graduate degree are most likely to be married with 75.3% of them married at childbirth, while women with the educational attainment of college or associate's degree are least likely to be married with 70.5% of them unmarried at childbirth.
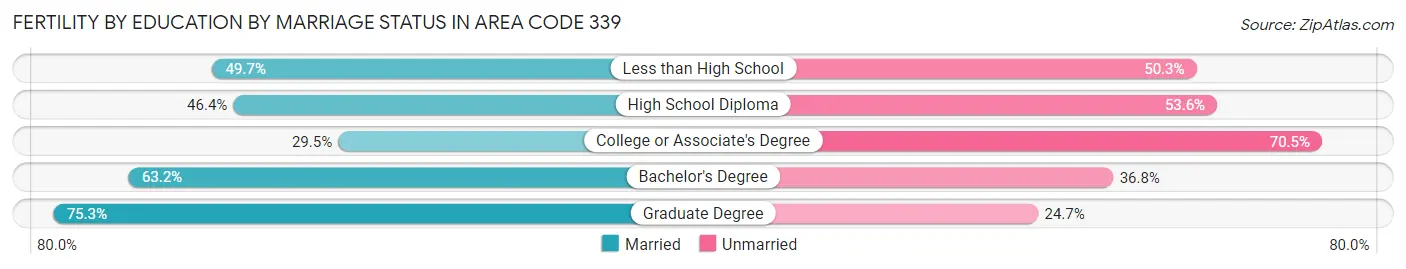
| Educational Attainment | Married | Unmarried |
| Less than High School | 257 (49.7%) | 260 (50.3%) |
| High School Diploma | 494 (46.4%) | 571 (53.6%) |
| College or Associate's Degree | 508 (29.5%) | 1,215 (70.5%) |
| Bachelor's Degree | 2,236 (63.2%) | 1,303 (36.8%) |
| Graduate Degree | 3,143 (75.3%) | 1,031 (24.7%) |
| Total | 8,850 (80.3%) | 2,168 (19.7%) |
Employment Characteristics in Area Code 339
Employment by Class of Employer in Area Code 339
Among the 573,333 employed individuals in Area Code 339, private company employees (377,135 | 65.8%), not-for-profit organizations (83,294 | 14.5%), and local government employees (37,047 | 6.5%) make up the most common classes of employment.
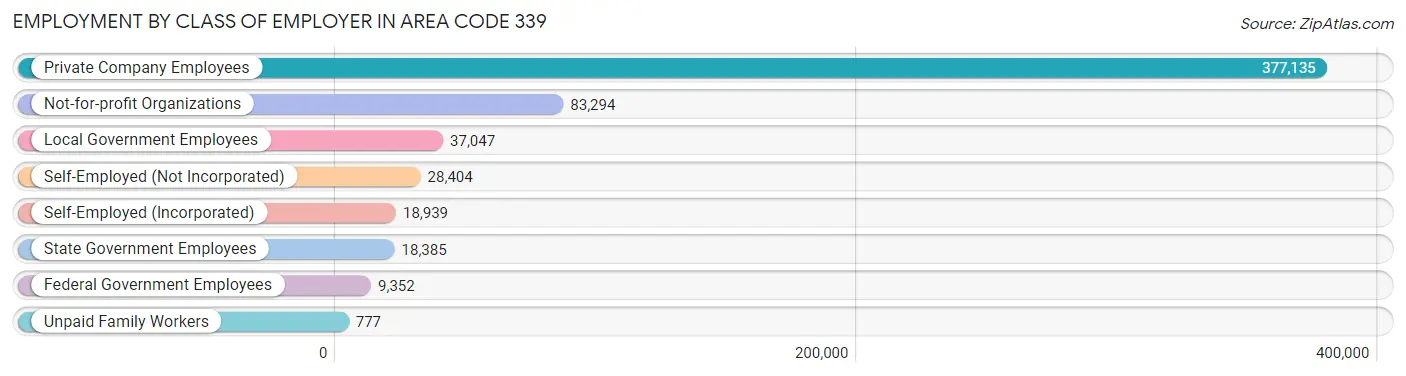
| Employer Class | # Employees | % Employees |
| Private Company Employees | 377,135 | 65.8% |
| Self-Employed (Incorporated) | 18,939 | 3.3% |
| Self-Employed (Not Incorporated) | 28,404 | 5.0% |
| Not-for-profit Organizations | 83,294 | 14.5% |
| Local Government Employees | 37,047 | 6.5% |
| State Government Employees | 18,385 | 3.2% |
| Federal Government Employees | 9,352 | 1.6% |
| Unpaid Family Workers | 777 | 0.1% |
| Total | 573,333 | 100.0% |
Employment Status by Age in Area Code 339
According to the labor force statistics for Area Code 339, out of the total population over 16 years of age (895,655), 67.0% or 600,537 individuals are in the labor force, with 4.4% or 26,183 of them unemployed. The age group with the highest labor force participation rate is 30 to 34 years, with 88.7% or 72,001 individuals in the labor force. Within the labor force, the 16 to 19 years age range has the highest percentage of unemployed individuals, with 637.0% or 145,554 of them being unemployed.
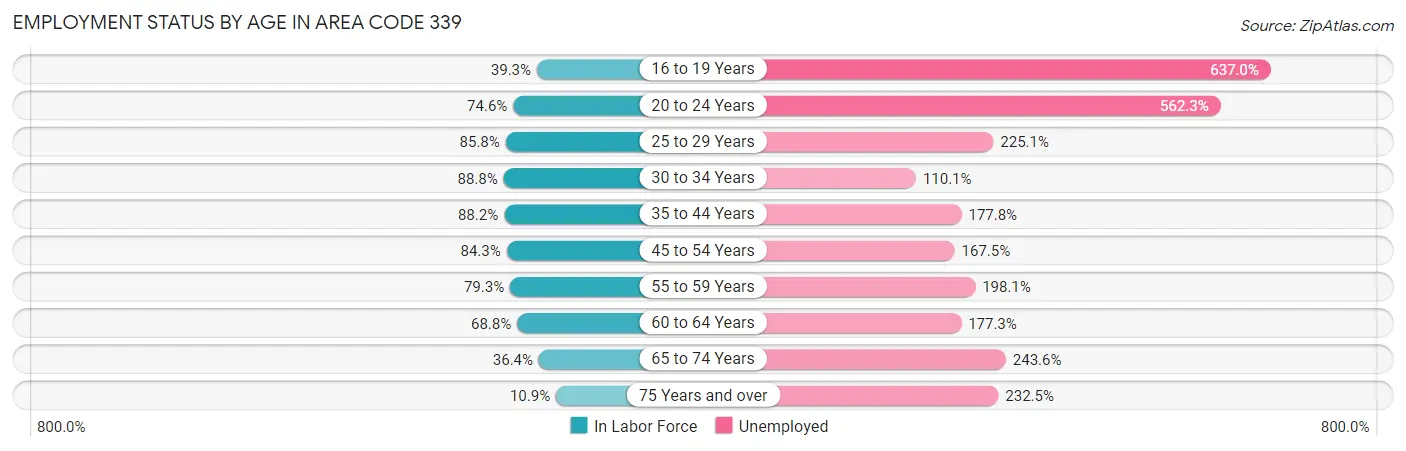
| Age Bracket | In Labor Force | Unemployed |
| 16 to 19 Years | 22,850 (39.3%) | 145,554 (637.0%) |
| 20 to 24 Years | 56,536 (74.6%) | 317,902 (562.3%) |
| 25 to 29 Years | 68,028 (85.8%) | 153,138 (225.1%) |
| 30 to 34 Years | 72,003 (88.7%) | 79,273 (110.1%) |
| 35 to 44 Years | 125,636 (88.1%) | 223,393 (177.8%) |
| 45 to 54 Years | 118,784 (84.3%) | 198,963 (167.5%) |
| 55 to 59 Years | 57,667 (79.3%) | 114,242 (198.1%) |
| 60 to 64 Years | 46,294 (68.8%) | 82,076 (177.3%) |
| 65 to 74 Years | 35,962 (36.4%) | 87,594 (243.6%) |
| 75 Years and over | 8,627 (10.9%) | 20,055 (232.5%) |
| Total | 600,519 (67.0%) | 26,165 (4.4%) |
Employment Status by Educational Attainment in Area Code 339
According to labor force statistics for Area Code 339, 82.7% of individuals (483,060) out of the total population between 25 and 64 years of age (583,970) are in the labor force, with 169.4% or 818,304 of them being unemployed. The group with the highest labor force participation rate are those with the educational attainment of bachelor's degree or higher, with 87.6% or 294,991 individuals in the labor force. Within the labor force, individuals with less than high school education have the highest percentage of unemployment, with 384.5% or 92,192 of them being unemployed.
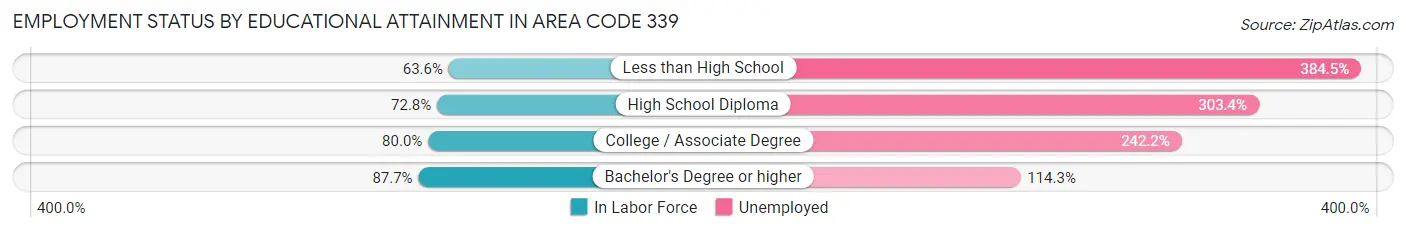
| Educational Attainment | In Labor Force | Unemployed |
| Less than High School | 23,976 (63.6%) | 144,956 (384.5%) |
| High School Diploma | 74,085 (72.8%) | 308,585 (303.4%) |
| College / Associate Degree | 86,346 (79.9%) | 261,588 (242.2%) |
| Bachelor's Degree or higher | 294,991 (87.6%) | 384,684 (114.3%) |
| Total | 483,033 (82.7%) | 989,245 (169.4%) |
Employment Occupations by Sex in Area Code 339
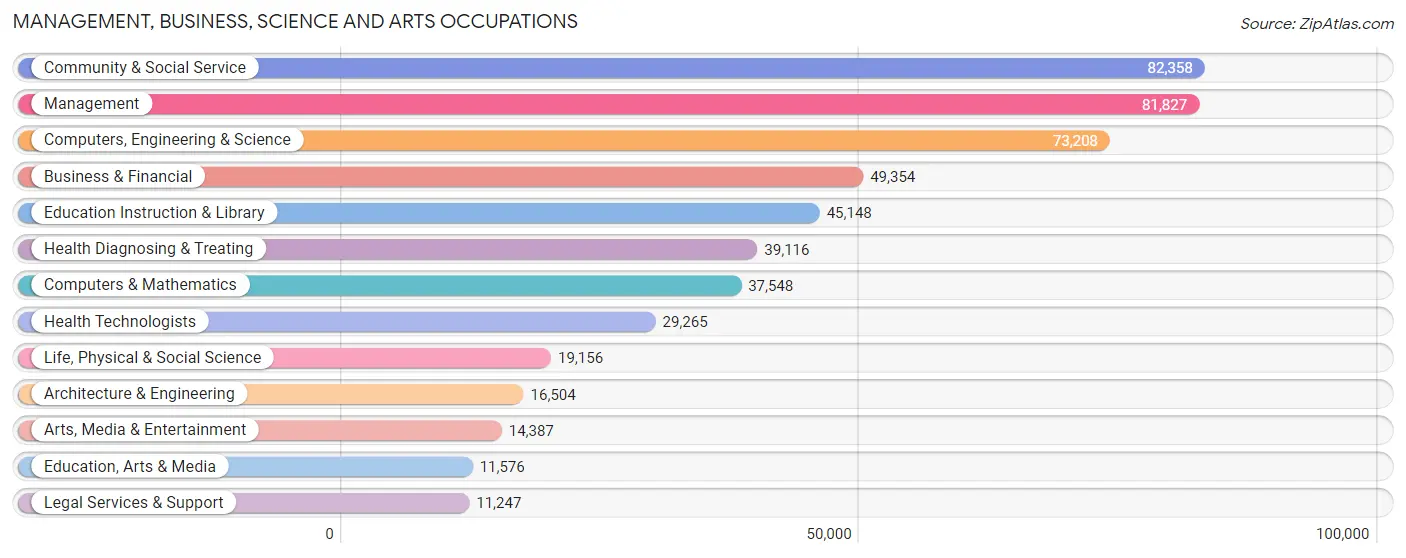
Management, Business, Science and Arts Occupations
The most common Management, Business, Science and Arts occupations in Area Code 339 are Community & Social Service (82,358 | 14.1%), Management (81,827 | 14.0%), Computers, Engineering & Science (73,208 | 12.5%), Business & Financial (49,354 | 8.4%), and Education Instruction & Library (45,148 | 7.7%).
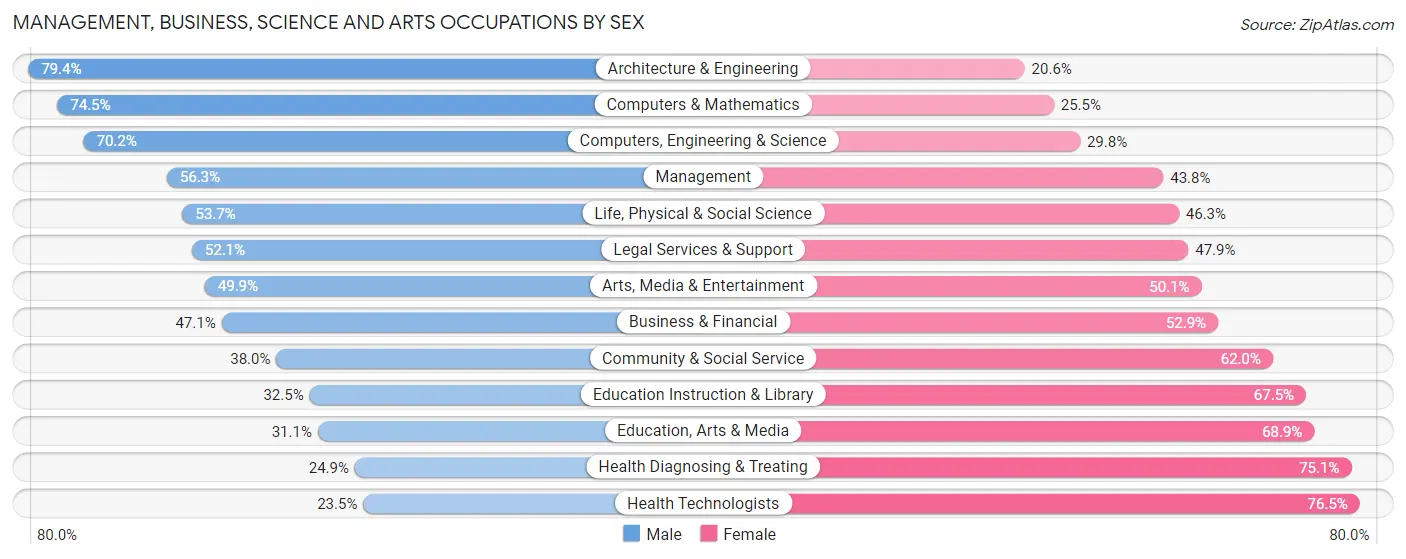
Management, Business, Science and Arts Occupations by Sex
Within the Management, Business, Science and Arts occupations in Area Code 339, the most male-oriented occupations are Architecture & Engineering (79.4%), Computers & Mathematics (74.5%), and Computers, Engineering & Science (70.2%), while the most female-oriented occupations are Health Technologists (76.5%), Health Diagnosing & Treating (75.1%), and Education, Arts & Media (68.9%).
| Occupation | Male | Female |
| Management | 46,024 (56.2%) | 35,803 (43.8%) |
| Business & Financial | 23,266 (47.1%) | 26,088 (52.9%) |
| Computers, Engineering & Science | 51,366 (70.2%) | 21,842 (29.8%) |
| Computers & Mathematics | 27,984 (74.5%) | 9,564 (25.5%) |
| Architecture & Engineering | 13,102 (79.4%) | 3,402 (20.6%) |
| Life, Physical & Social Science | 10,280 (53.7%) | 8,876 (46.3%) |
| Community & Social Service | 31,289 (38.0%) | 51,069 (62.0%) |
| Education, Arts & Media | 3,598 (31.1%) | 7,978 (68.9%) |
| Legal Services & Support | 5,857 (52.1%) | 5,390 (47.9%) |
| Education Instruction & Library | 14,654 (32.5%) | 30,494 (67.5%) |
| Arts, Media & Entertainment | 7,180 (49.9%) | 7,207 (50.1%) |
| Health Diagnosing & Treating | 9,738 (24.9%) | 29,378 (75.1%) |
| Health Technologists | 6,874 (23.5%) | 22,391 (76.5%) |
| Total (Category) | 161,683 (49.6%) | 164,180 (50.4%) |
| Total (Overall) | 304,156 (52.0%) | 280,598 (48.0%) |
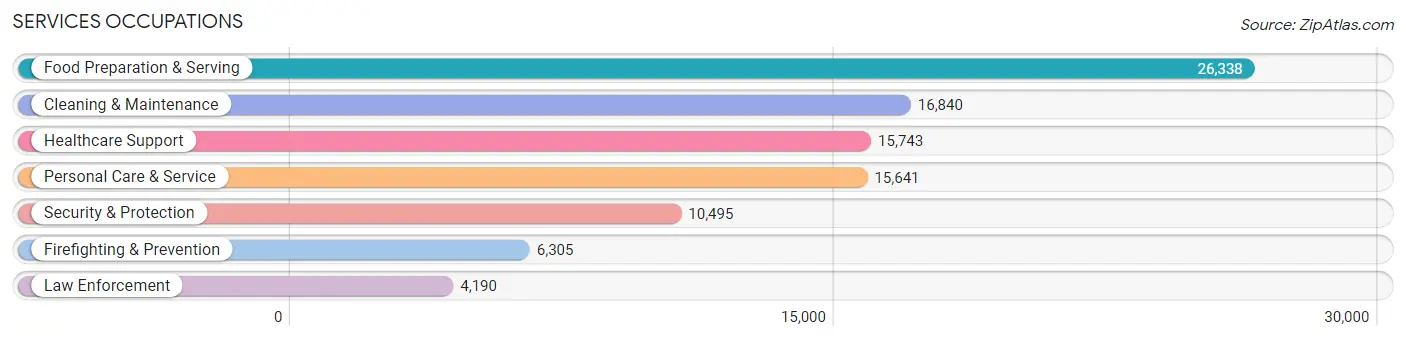
Services Occupations
The most common Services occupations in Area Code 339 are Food Preparation & Serving (26,338 | 4.5%), Cleaning & Maintenance (16,840 | 2.9%), Healthcare Support (15,743 | 2.7%), Personal Care & Service (15,641 | 2.7%), and Security & Protection (10,495 | 1.8%).
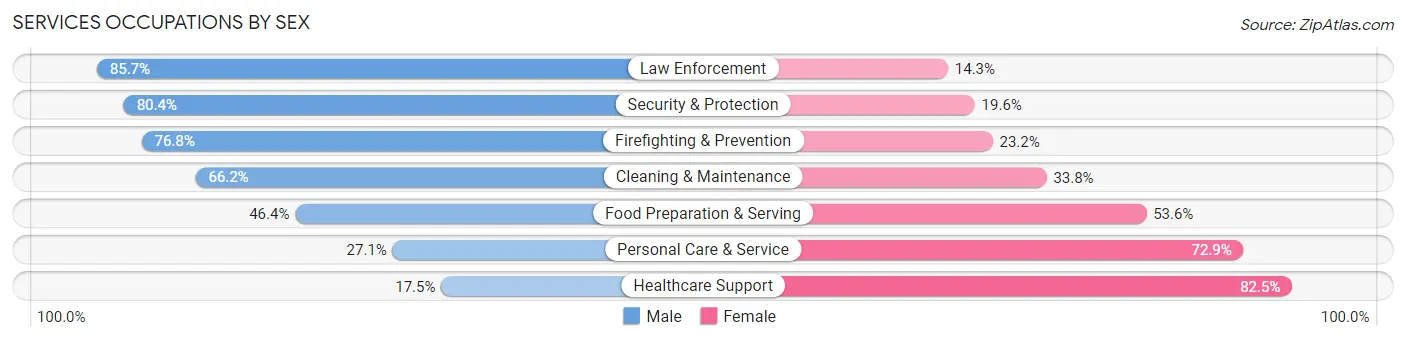
Services Occupations by Sex
Within the Services occupations in Area Code 339, the most male-oriented occupations are Law Enforcement (85.7%), Security & Protection (80.4%), and Firefighting & Prevention (76.8%), while the most female-oriented occupations are Healthcare Support (82.5%), Personal Care & Service (72.9%), and Food Preparation & Serving (53.6%).
| Occupation | Male | Female |
| Healthcare Support | 2,754 (17.5%) | 12,989 (82.5%) |
| Security & Protection | 8,435 (80.4%) | 2,060 (19.6%) |
| Firefighting & Prevention | 4,845 (76.8%) | 1,460 (23.2%) |
| Law Enforcement | 3,590 (85.7%) | 600 (14.3%) |
| Food Preparation & Serving | 12,223 (46.4%) | 14,115 (53.6%) |
| Cleaning & Maintenance | 11,141 (66.2%) | 5,699 (33.8%) |
| Personal Care & Service | 4,242 (27.1%) | 11,399 (72.9%) |
| Total (Category) | 38,795 (45.6%) | 46,262 (54.4%) |
| Total (Overall) | 304,156 (52.0%) | 280,598 (48.0%) |
Sales and Office Occupations
The most common Sales and Office occupations in Area Code 339 are Office & Administration (51,506 | 8.8%), and Sales & Related (48,789 | 8.3%).
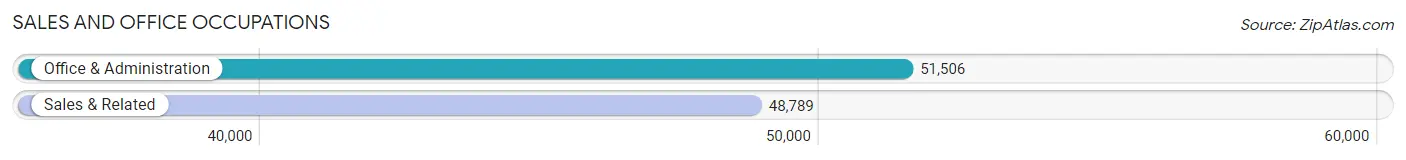
Sales and Office Occupations by Sex

| Occupation | Male | Female |
| Sales & Related | 26,036 (53.4%) | 22,753 (46.6%) |
| Office & Administration | 14,909 (28.9%) | 36,597 (71.1%) |
| Total (Category) | 40,945 (40.8%) | 59,350 (59.2%) |
| Total (Overall) | 304,156 (52.0%) | 280,598 (48.0%) |
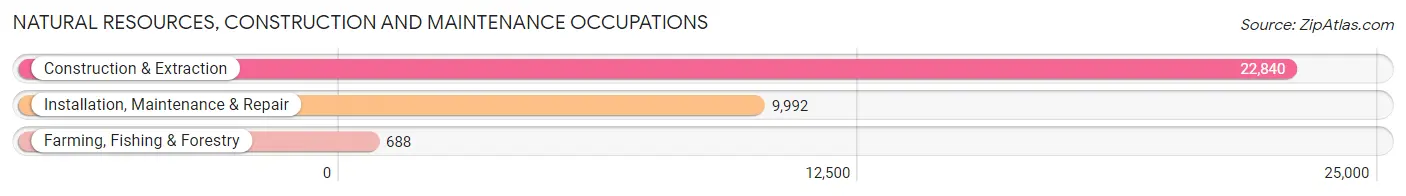
Natural Resources, Construction and Maintenance Occupations
The most common Natural Resources, Construction and Maintenance occupations in Area Code 339 are Construction & Extraction (22,840 | 3.9%), Installation, Maintenance & Repair (9,992 | 1.7%), and Farming, Fishing & Forestry (688 | 0.1%).
Natural Resources, Construction and Maintenance Occupations by Sex
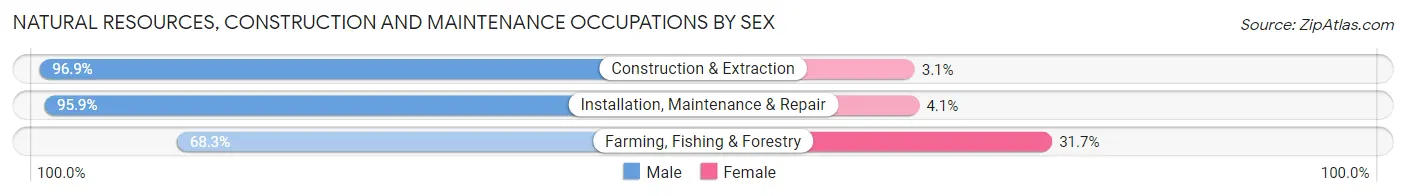
| Occupation | Male | Female |
| Farming, Fishing & Forestry | 470 (68.3%) | 218 (31.7%) |
| Construction & Extraction | 22,135 (96.9%) | 705 (3.1%) |
| Installation, Maintenance & Repair | 9,586 (95.9%) | 406 (4.1%) |
| Total (Category) | 32,191 (96.0%) | 1,329 (4.0%) |
| Total (Overall) | 304,156 (52.0%) | 280,598 (48.0%) |
Production, Transportation and Moving Occupations
The most common Production, Transportation and Moving occupations in Area Code 339 are Transportation (15,160 | 2.6%), Production (14,841 | 2.5%), and Material Moving (10,018 | 1.7%).
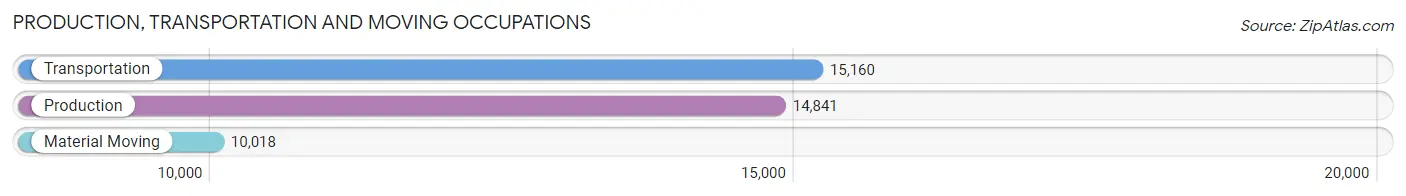
Production, Transportation and Moving Occupations by Sex
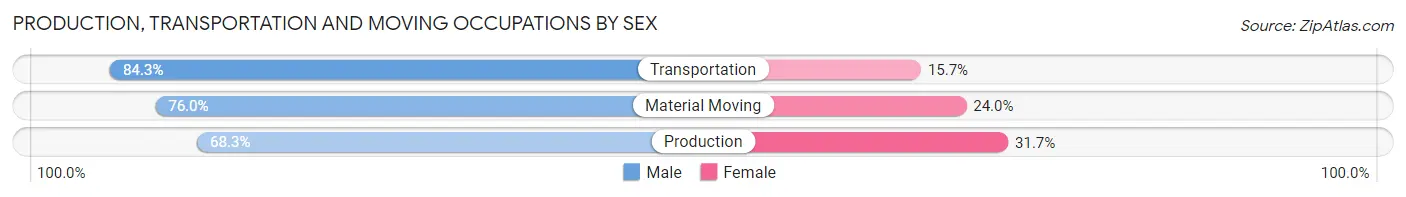
| Occupation | Male | Female |
| Production | 10,143 (68.3%) | 4,698 (31.7%) |
| Transportation | 12,784 (84.3%) | 2,376 (15.7%) |
| Material Moving | 7,615 (76.0%) | 2,403 (24.0%) |
| Total (Category) | 30,542 (76.3%) | 9,477 (23.7%) |
| Total (Overall) | 304,156 (52.0%) | 280,598 (48.0%) |
Employment Industries by Sex in Area Code 339
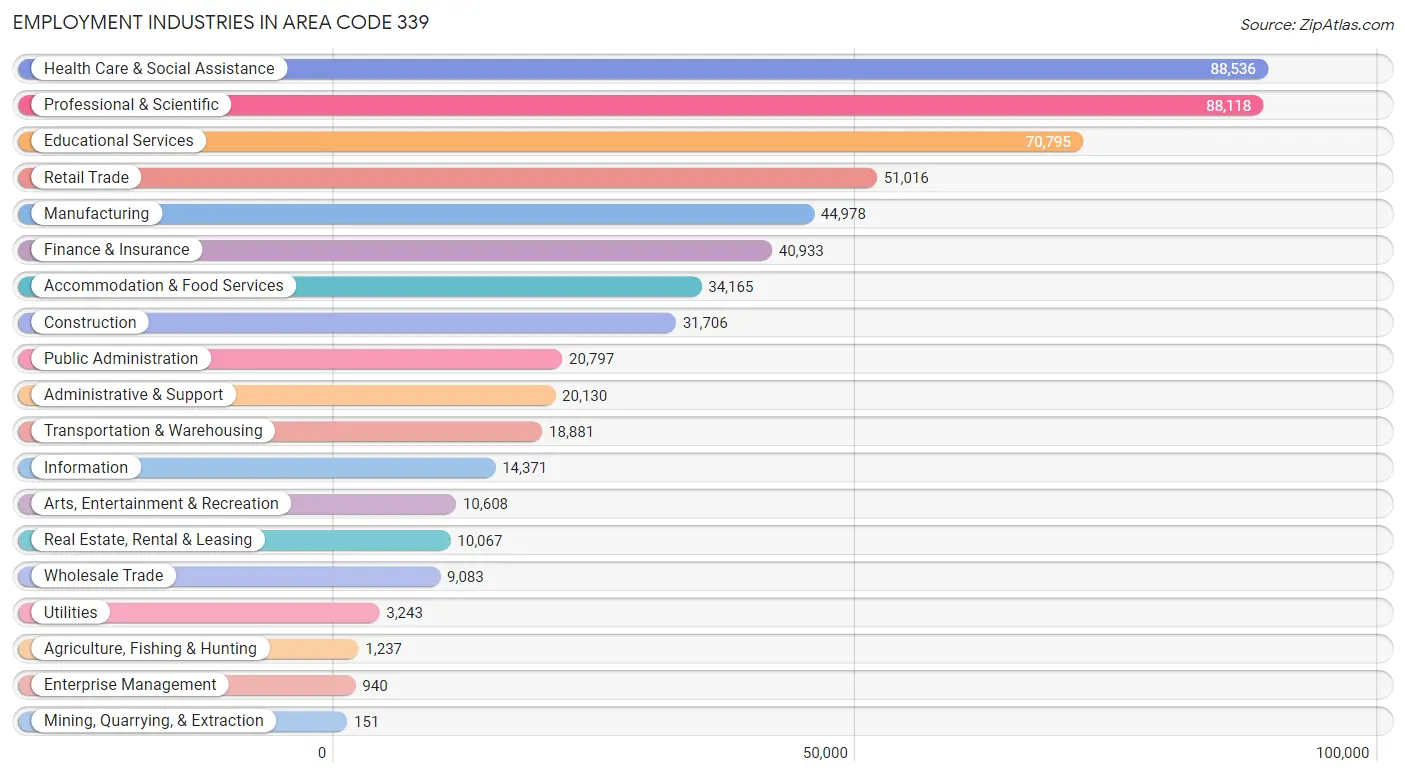
Employment Industries in Area Code 339
The major employment industries in Area Code 339 include Health Care & Social Assistance (88,536 | 15.1%), Professional & Scientific (88,118 | 15.1%), Educational Services (70,795 | 12.1%), Retail Trade (51,016 | 8.7%), and Manufacturing (44,978 | 7.7%).
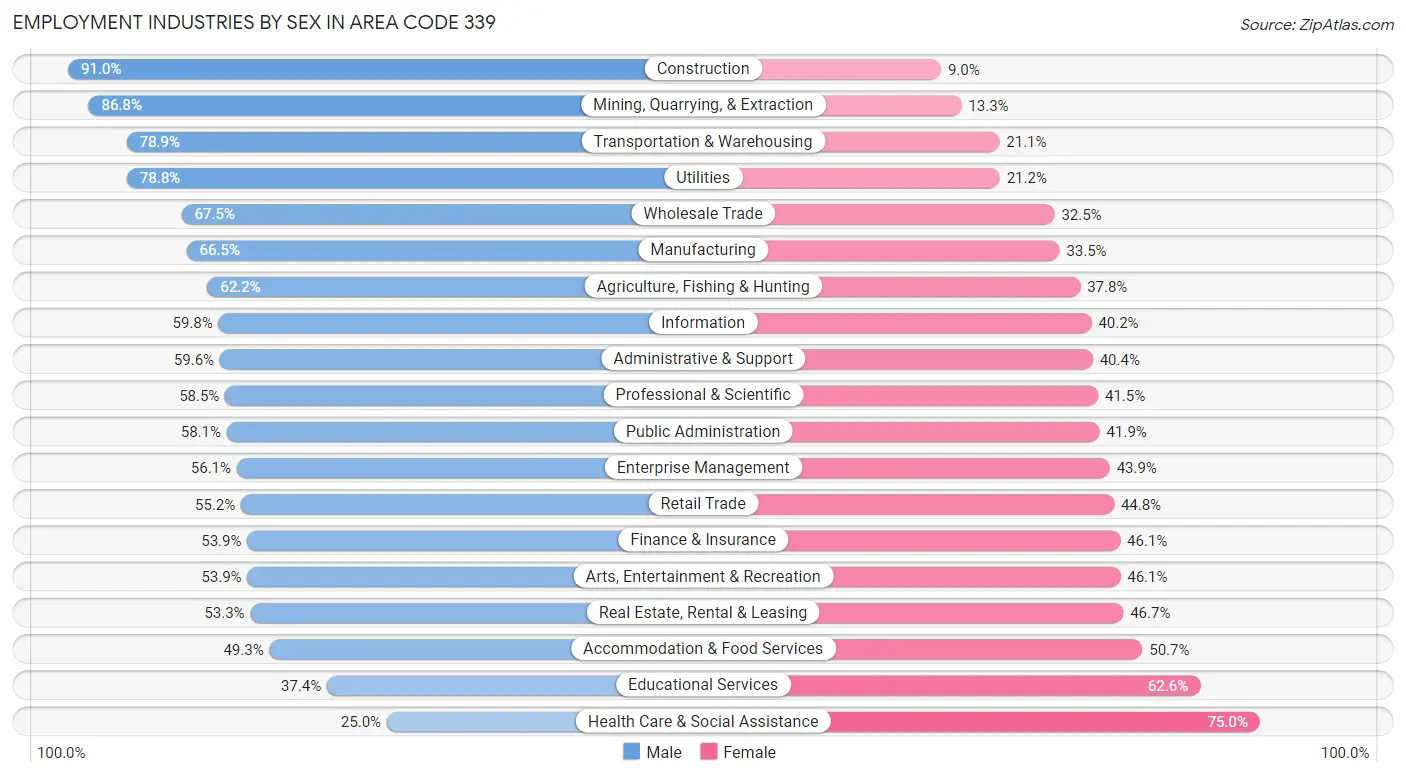
Employment Industries by Sex in Area Code 339
The Area Code 339 industries that see more men than women are Construction (91.0%), Mining, Quarrying, & Extraction (86.8%), and Transportation & Warehousing (78.9%), whereas the industries that tend to have a higher number of women are Health Care & Social Assistance (75.0%), Educational Services (62.6%), and Accommodation & Food Services (50.7%).
| Industry | Male | Female |
| Agriculture, Fishing & Hunting | 769 (62.2%) | 468 (37.8%) |
| Mining, Quarrying, & Extraction | 131 (86.8%) | 20 (13.3%) |
| Construction | 28,850 (91.0%) | 2,856 (9.0%) |
| Manufacturing | 29,892 (66.5%) | 15,086 (33.5%) |
| Wholesale Trade | 6,131 (67.5%) | 2,952 (32.5%) |
| Retail Trade | 28,150 (55.2%) | 22,866 (44.8%) |
| Transportation & Warehousing | 14,898 (78.9%) | 3,983 (21.1%) |
| Utilities | 2,556 (78.8%) | 687 (21.2%) |
| Information | 8,600 (59.8%) | 5,771 (40.2%) |
| Finance & Insurance | 22,061 (53.9%) | 18,872 (46.1%) |
| Real Estate, Rental & Leasing | 5,362 (53.3%) | 4,705 (46.7%) |
| Professional & Scientific | 51,535 (58.5%) | 36,583 (41.5%) |
| Enterprise Management | 527 (56.1%) | 413 (43.9%) |
| Administrative & Support | 11,991 (59.6%) | 8,139 (40.4%) |
| Educational Services | 26,462 (37.4%) | 44,333 (62.6%) |
| Health Care & Social Assistance | 22,139 (25.0%) | 66,397 (75.0%) |
| Arts, Entertainment & Recreation | 5,714 (53.9%) | 4,894 (46.1%) |
| Accommodation & Food Services | 16,846 (49.3%) | 17,319 (50.7%) |
| Public Administration | 12,092 (58.1%) | 8,705 (41.9%) |
| Total | 304,156 (52.0%) | 280,598 (48.0%) |
Education in Area Code 339
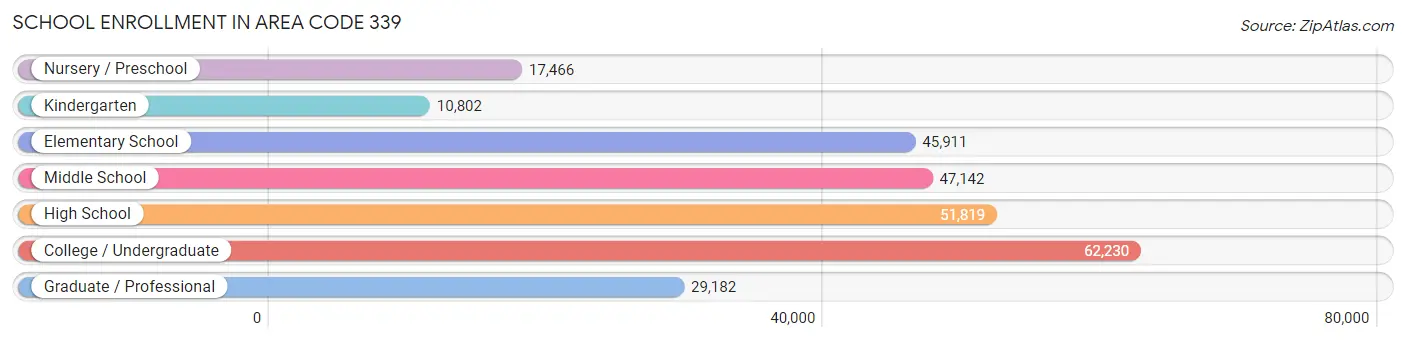
School Enrollment in Area Code 339
The most common levels of schooling among the 264,552 students in Area Code 339 are college / undergraduate (62,230 | 23.5%), high school (51,819 | 19.6%), and middle school (47,142 | 17.8%).
| School Level | # Students | % Students |
| Nursery / Preschool | 17,466 | 6.6% |
| Kindergarten | 10,802 | 4.1% |
| Elementary School | 45,911 | 17.3% |
| Middle School | 47,142 | 17.8% |
| High School | 51,819 | 19.6% |
| College / Undergraduate | 62,230 | 23.5% |
| Graduate / Professional | 29,182 | 11.0% |
| Total | 264,552 | 100.0% |
School Enrollment by Age by Funding Source in Area Code 339
Out of a total of 264,552 students who are enrolled in schools in Area Code 339, 87,458 (33.1%) attend a private institution, while the remaining 177,094 (66.9%) are enrolled in public schools. The age group of 25 to 34 year olds has the highest likelihood of being enrolled in private schools, with 15,256 (66.7% in the age bracket) enrolled. Conversely, the age group of 10 to 14 year olds has the lowest likelihood of being enrolled in a private school, with 52,039 (89.6% in the age bracket) attending a public institution.
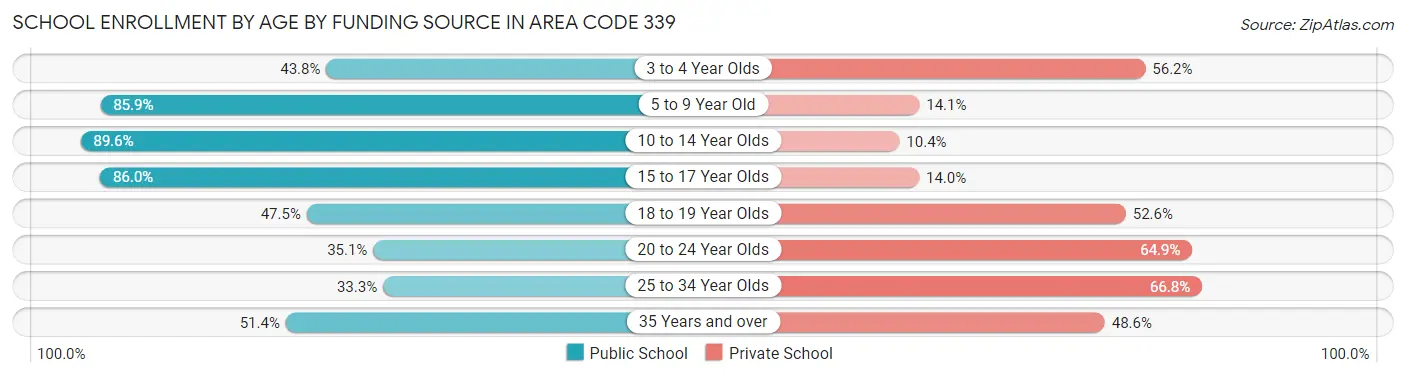
| Age Bracket | Public School | Private School |
| 3 to 4 Year Olds | 6,024 (43.8%) | 7,726 (56.2%) |
| 5 to 9 Year Old | 46,275 (85.9%) | 7,591 (14.1%) |
| 10 to 14 Year Olds | 52,039 (89.6%) | 6,026 (10.4%) |
| 15 to 17 Year Olds | 31,668 (86.0%) | 5,172 (14.0%) |
| 18 to 19 Year Olds | 13,106 (47.4%) | 14,517 (52.5%) |
| 20 to 24 Year Olds | 13,169 (35.1%) | 24,379 (64.9%) |
| 25 to 34 Year Olds | 7,600 (33.3%) | 15,256 (66.7%) |
| 35 Years and over | 7,192 (51.4%) | 6,812 (48.6%) |
| Total | 177,094 (66.9%) | 87,458 (33.1%) |
Educational Attainment by Field of Study in Area Code 339
Business (75,439 | 17.0%), social sciences (48,234 | 10.9%), engineering (44,098 | 10.0%), science & technology (34,622 | 7.8%), and bio, nature & agricultural (32,095 | 7.2%) are the most common fields of study among 443,002 individuals in Area Code 339 who have obtained a bachelor's degree or higher.
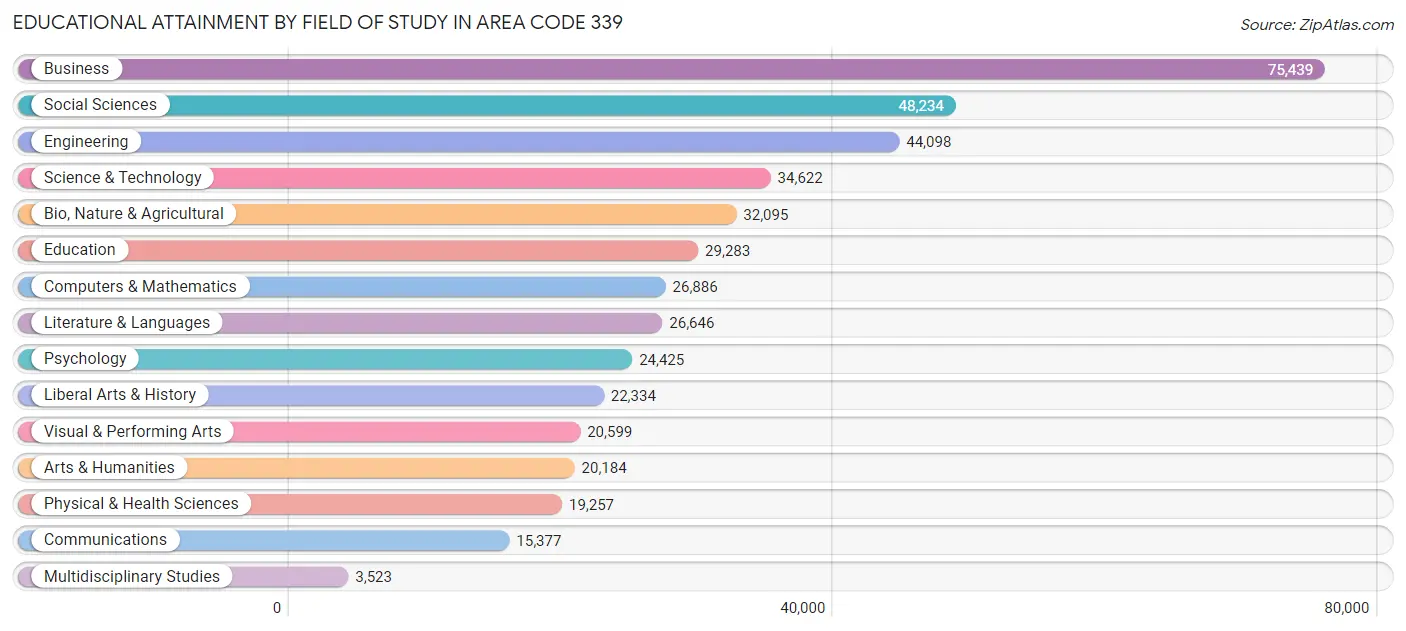
| Field of Study | # Graduates | % Graduates |
| Computers & Mathematics | 26,886 | 6.1% |
| Bio, Nature & Agricultural | 32,095 | 7.2% |
| Physical & Health Sciences | 19,257 | 4.3% |
| Psychology | 24,425 | 5.5% |
| Social Sciences | 48,234 | 10.9% |
| Engineering | 44,098 | 10.0% |
| Multidisciplinary Studies | 3,523 | 0.8% |
| Science & Technology | 34,622 | 7.8% |
| Business | 75,439 | 17.0% |
| Education | 29,283 | 6.6% |
| Literature & Languages | 26,646 | 6.0% |
| Liberal Arts & History | 22,334 | 5.0% |
| Visual & Performing Arts | 20,599 | 4.6% |
| Communications | 15,377 | 3.5% |
| Arts & Humanities | 20,184 | 4.6% |
| Total | 443,002 | 100.0% |
Transportation & Commute in Area Code 339
Vehicle Availability by Sex in Area Code 339
The most prevalent vehicle ownership categories in Area Code 339 are males with 2 vehicles (124,969, accounting for 42.4%) and females with 2 vehicles (110,023, making up 46.5%).
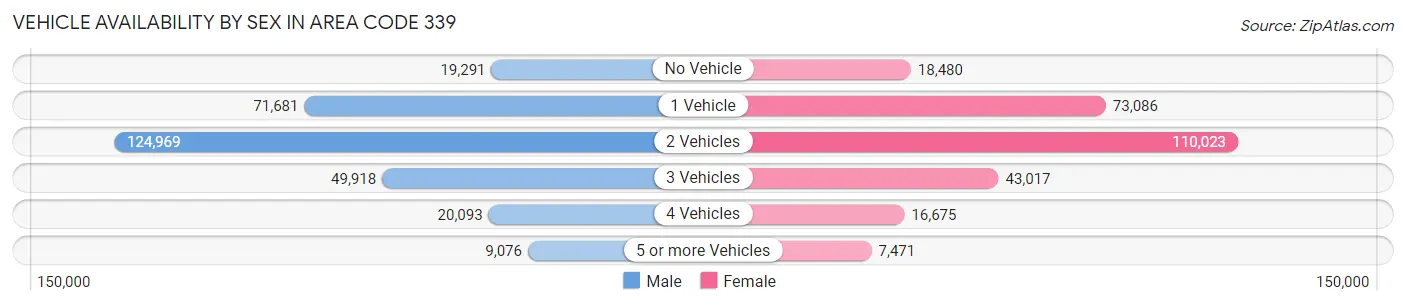
| Vehicles Available | Male | Female |
| No Vehicle | 19,291 (6.5%) | 18,480 (6.9%) |
| 1 Vehicle | 71,681 (24.3%) | 73,086 (27.2%) |
| 2 Vehicles | 124,969 (42.4%) | 110,023 (40.9%) |
| 3 Vehicles | 49,918 (16.9%) | 43,017 (16.0%) |
| 4 Vehicles | 20,093 (6.8%) | 16,675 (6.2%) |
| 5 or more Vehicles | 9,076 (3.1%) | 7,471 (2.8%) |
| Total | 295,028 (100.0%) | 268,752 (100.0%) |
Commute Time in Area Code 339
The most frequently occuring commute durations in Area Code 339 are 30 to 34 minutes (69,996 commuters, 14.8%), 20 to 24 minutes (59,635 commuters, 12.6%), and 45 to 59 minutes (57,859 commuters, 12.2%).
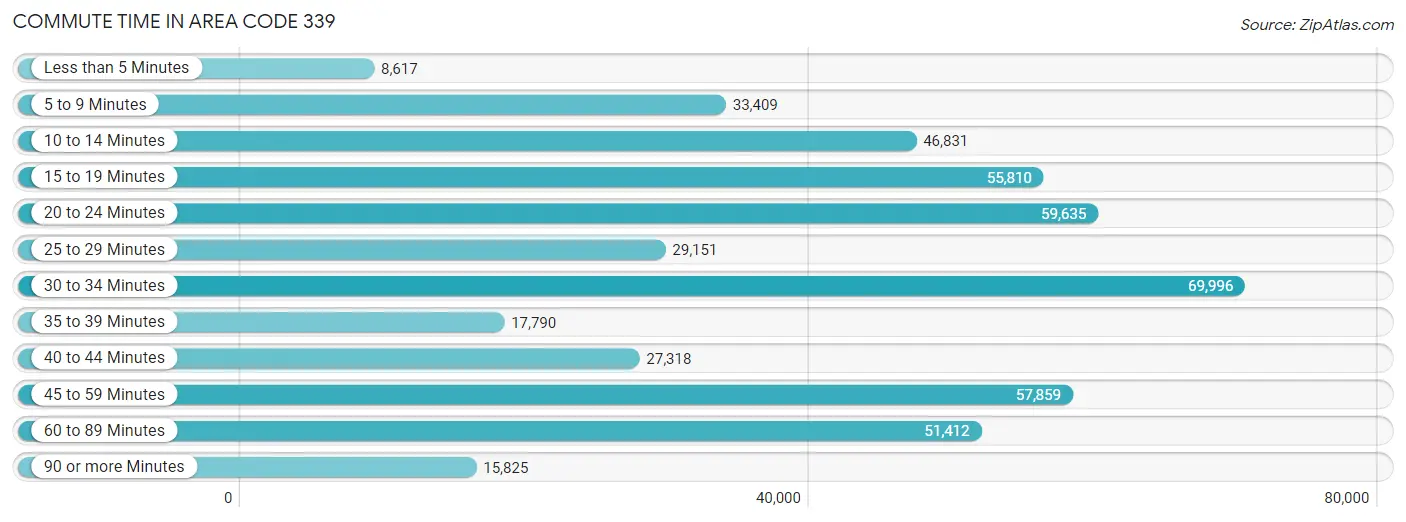
| Commute Time | # Commuters | % Commuters |
| Less than 5 Minutes | 8,617 | 1.8% |
| 5 to 9 Minutes | 33,409 | 7.0% |
| 10 to 14 Minutes | 46,831 | 9.9% |
| 15 to 19 Minutes | 55,810 | 11.8% |
| 20 to 24 Minutes | 59,635 | 12.6% |
| 25 to 29 Minutes | 29,151 | 6.1% |
| 30 to 34 Minutes | 69,996 | 14.8% |
| 35 to 39 Minutes | 17,790 | 3.8% |
| 40 to 44 Minutes | 27,318 | 5.8% |
| 45 to 59 Minutes | 57,859 | 12.2% |
| 60 to 89 Minutes | 51,412 | 10.8% |
| 90 or more Minutes | 15,825 | 3.3% |
Commute Time by Sex in Area Code 339
The most common commute times in Area Code 339 are 30 to 34 minutes (37,446 commuters, 15.0%) for males and 30 to 34 minutes (32,550 commuters, 14.5%) for females.
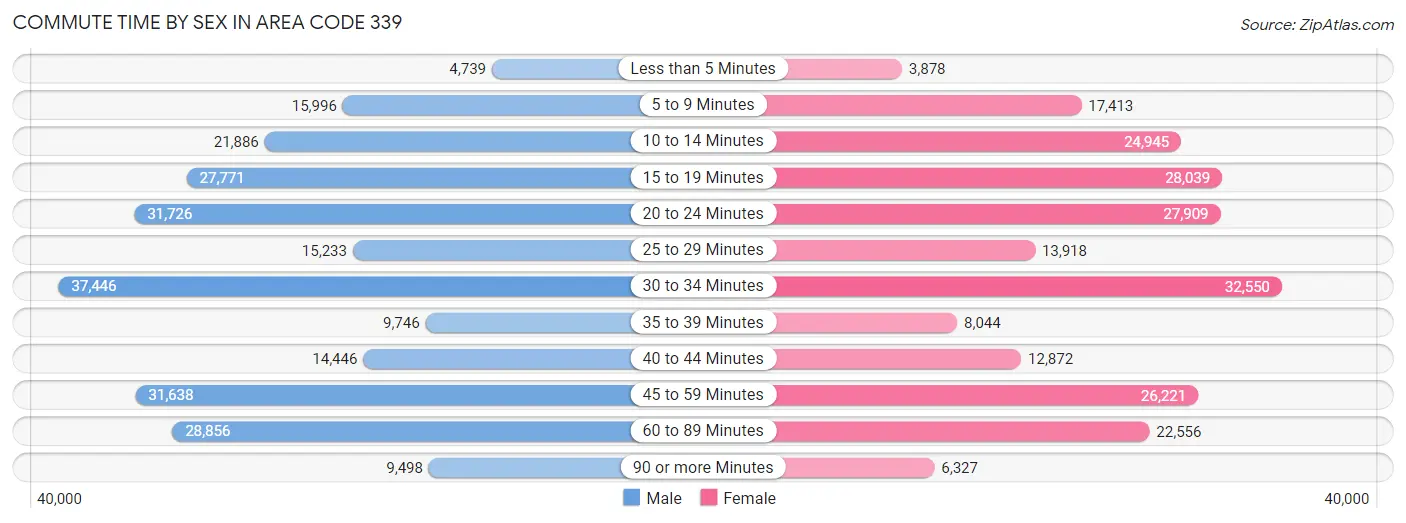
| Commute Time | Male | Female |
| Less than 5 Minutes | 4,739 (1.9%) | 3,878 (1.7%) |
| 5 to 9 Minutes | 15,996 (6.4%) | 17,413 (7.7%) |
| 10 to 14 Minutes | 21,886 (8.8%) | 24,945 (11.1%) |
| 15 to 19 Minutes | 27,771 (11.2%) | 28,039 (12.5%) |
| 20 to 24 Minutes | 31,726 (12.7%) | 27,909 (12.4%) |
| 25 to 29 Minutes | 15,233 (6.1%) | 13,918 (6.2%) |
| 30 to 34 Minutes | 37,446 (15.0%) | 32,550 (14.5%) |
| 35 to 39 Minutes | 9,746 (3.9%) | 8,044 (3.6%) |
| 40 to 44 Minutes | 14,446 (5.8%) | 12,872 (5.7%) |
| 45 to 59 Minutes | 31,638 (12.7%) | 26,221 (11.7%) |
| 60 to 89 Minutes | 28,856 (11.6%) | 22,556 (10.0%) |
| 90 or more Minutes | 9,498 (3.8%) | 6,327 (2.8%) |
Time of Departure to Work by Sex in Area Code 339
The most frequent times of departure to work in Area Code 339 are 7:00 AM to 7:29 AM (34,427, 13.8%) for males and 7:00 AM to 7:29 AM (34,051, 15.2%) for females.
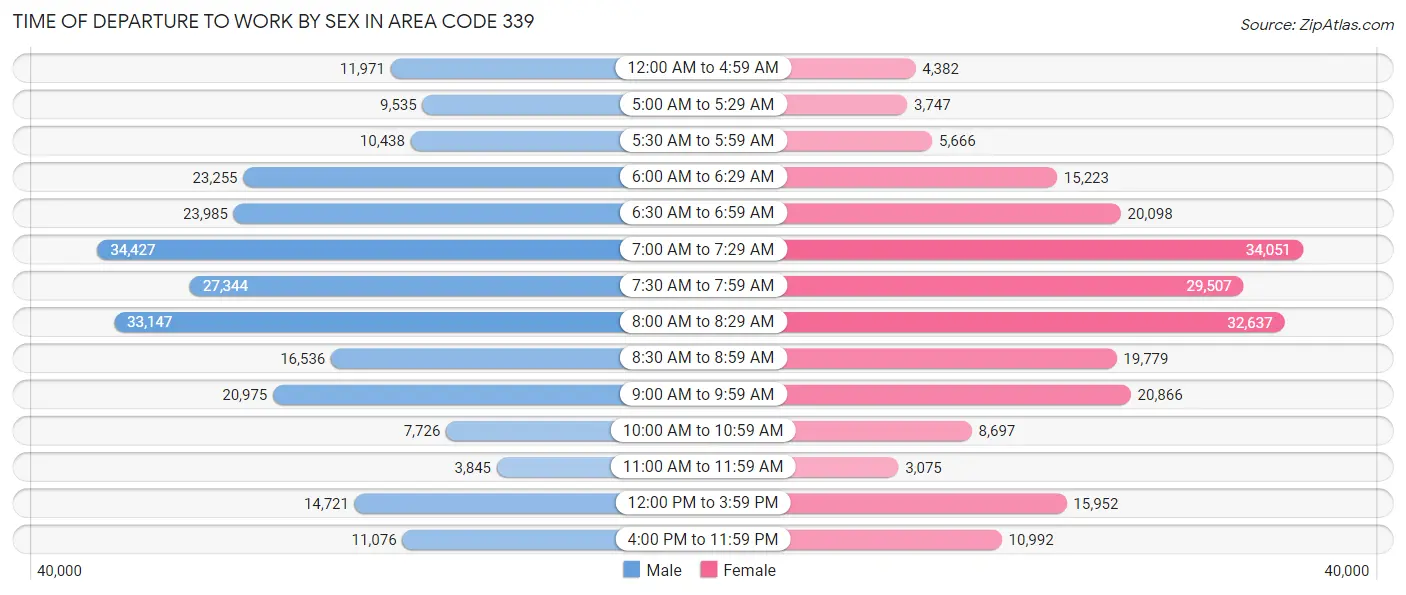
| Time of Departure | Male | Female |
| 12:00 AM to 4:59 AM | 11,971 (4.8%) | 4,382 (1.9%) |
| 5:00 AM to 5:29 AM | 9,535 (3.8%) | 3,747 (1.7%) |
| 5:30 AM to 5:59 AM | 10,438 (4.2%) | 5,666 (2.5%) |
| 6:00 AM to 6:29 AM | 23,255 (9.3%) | 15,223 (6.8%) |
| 6:30 AM to 6:59 AM | 23,985 (9.6%) | 20,098 (8.9%) |
| 7:00 AM to 7:29 AM | 34,427 (13.8%) | 34,051 (15.2%) |
| 7:30 AM to 7:59 AM | 27,344 (11.0%) | 29,507 (13.1%) |
| 8:00 AM to 8:29 AM | 33,147 (13.3%) | 32,637 (14.5%) |
| 8:30 AM to 8:59 AM | 16,536 (6.6%) | 19,779 (8.8%) |
| 9:00 AM to 9:59 AM | 20,975 (8.4%) | 20,866 (9.3%) |
| 10:00 AM to 10:59 AM | 7,726 (3.1%) | 8,697 (3.9%) |
| 11:00 AM to 11:59 AM | 3,845 (1.5%) | 3,075 (1.4%) |
| 12:00 PM to 3:59 PM | 14,721 (5.9%) | 15,952 (7.1%) |
| 4:00 PM to 11:59 PM | 11,076 (4.4%) | 10,992 (4.9%) |
| Total | 248,981 (100.0%) | 224,672 (100.0%) |
Housing Occupancy in Area Code 339
Occupancy by Ownership in Area Code 339
Of the total 418,963 dwellings in Area Code 339, owner-occupied units account for 257,873 (61.6%), while renter-occupied units make up 161,090 (38.5%).
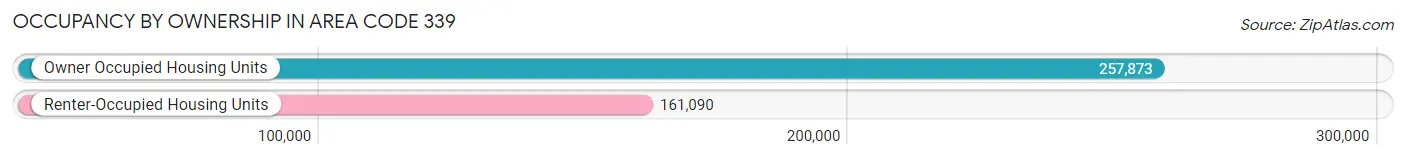
| Occupancy | # Housing Units | % Housing Units |
| Owner Occupied Housing Units | 257,873 | 61.6% |
| Renter-Occupied Housing Units | 161,090 | 38.5% |
| Total Occupied Housing Units | 418,963 | 100.0% |
Occupancy by Household Size in Area Code 339
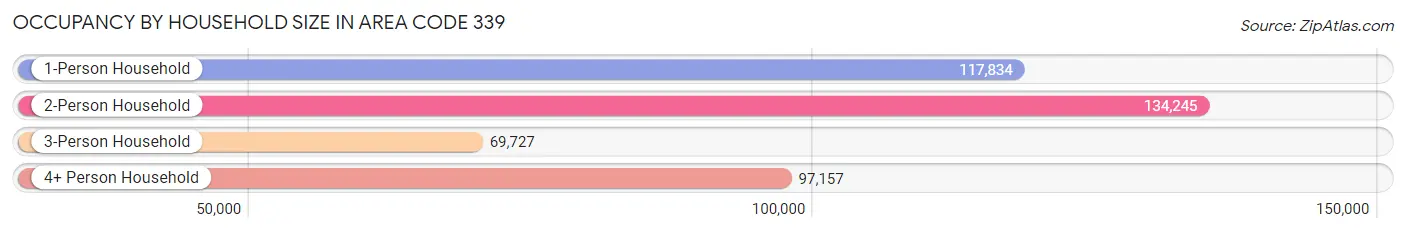
| Household Size | # Housing Units | % Housing Units |
| 1-Person Household | 117,834 | 28.1% |
| 2-Person Household | 134,245 | 32.0% |
| 3-Person Household | 69,727 | 16.6% |
| 4+ Person Household | 97,157 | 23.2% |
| Total Housing Units | 418,963 | 100.0% |
Occupancy by Ownership by Household Size in Area Code 339
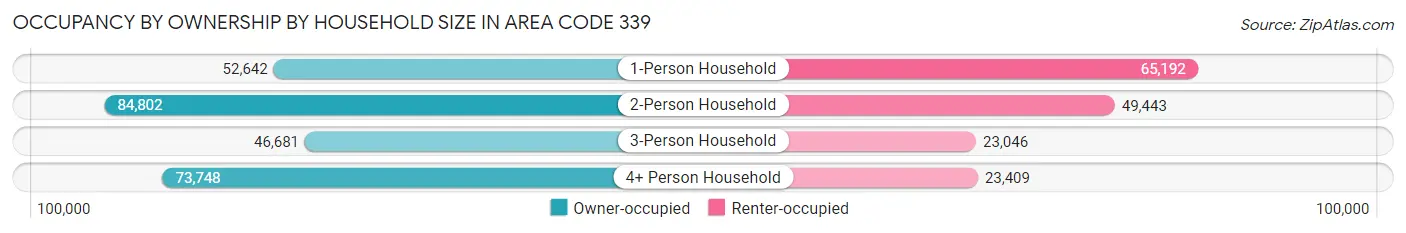
| Household Size | Owner-occupied | Renter-occupied |
| 1-Person Household | 52,642 (44.7%) | 65,192 (55.3%) |
| 2-Person Household | 84,802 (63.2%) | 49,443 (36.8%) |
| 3-Person Household | 46,681 (66.9%) | 23,046 (33.1%) |
| 4+ Person Household | 73,748 (75.9%) | 23,409 (24.1%) |
| Total Housing Units | 257,873 (61.6%) | 161,090 (38.5%) |
Occupancy by Educational Attainment in Area Code 339
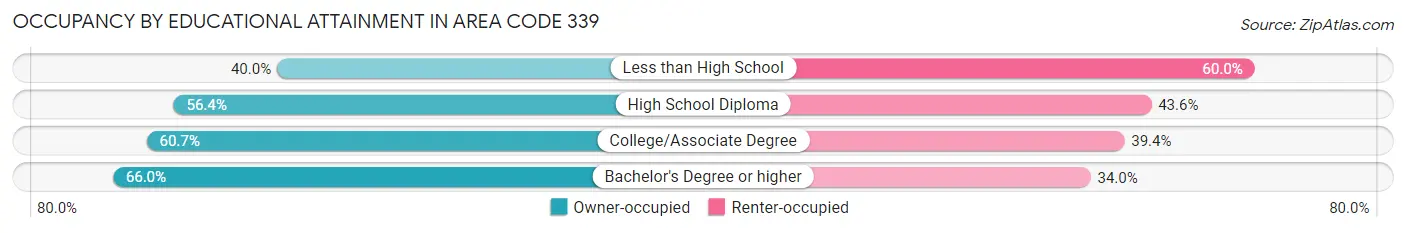
| Household Size | Owner-occupied | Renter-occupied |
| Less than High School | 10,793 (40.0%) | 16,213 (60.0%) |
| High School Diploma | 41,589 (56.4%) | 32,195 (43.6%) |
| College/Associate Degree | 50,981 (60.7%) | 33,082 (39.4%) |
| Bachelor's Degree or higher | 154,510 (66.0%) | 79,600 (34.0%) |
Occupancy by Age of Householder in Area Code 339
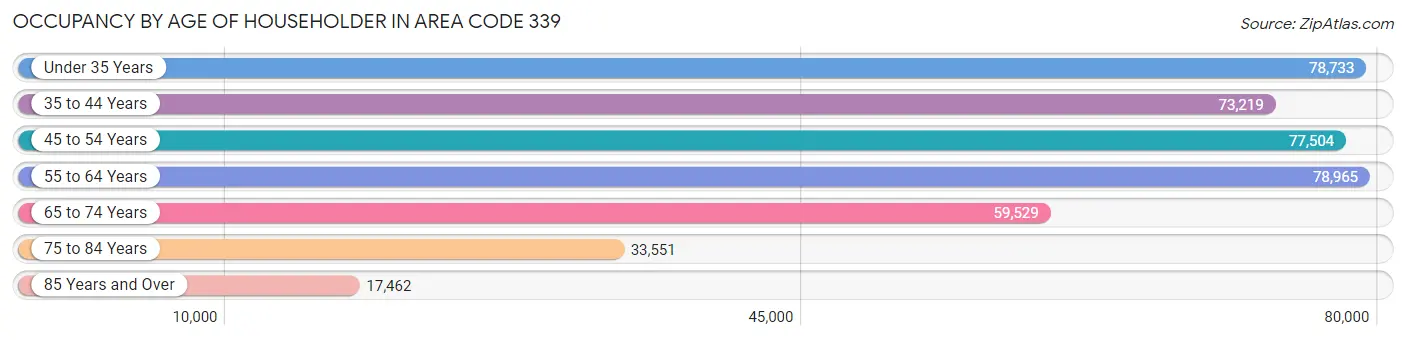
| Age Bracket | # Households | % Households |
| Under 35 Years | 78,733 | 18.8% |
| 35 to 44 Years | 73,219 | 17.5% |
| 45 to 54 Years | 77,504 | 18.5% |
| 55 to 64 Years | 78,965 | 18.9% |
| 65 to 74 Years | 59,529 | 14.2% |
| 75 to 84 Years | 33,551 | 8.0% |
| 85 Years and Over | 17,462 | 4.2% |
| Total | 418,963 | 100.0% |
Housing Finances in Area Code 339
Median Income by Occupancy in Area Code 339
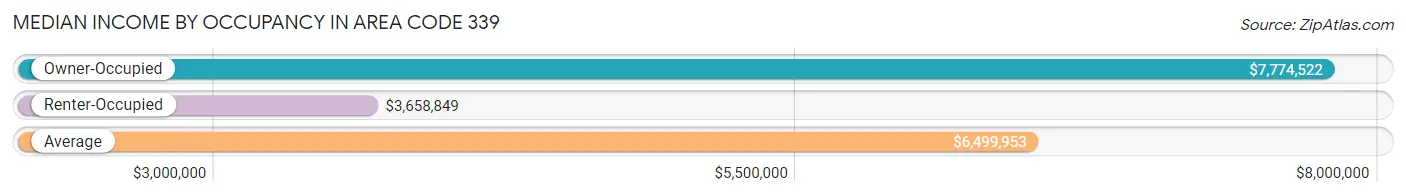
| Occupancy Type | # Households | Median Income |
| Owner-Occupied | 257,873 (61.6%) | $7,774,522 |
| Renter-Occupied | 161,090 (38.5%) | $3,658,849 |
| Average | 418,963 (100.0%) | $6,499,953 |
Occupancy by Householder Income Bracket in Area Code 339
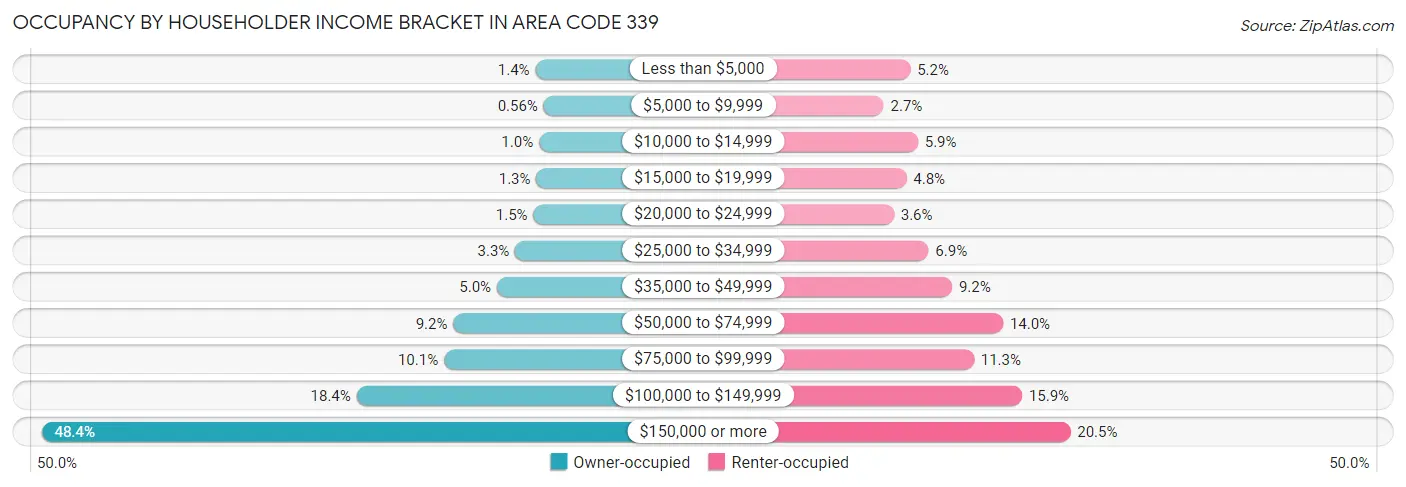
| Income Bracket | Owner-occupied | Renter-occupied |
| Less than $5,000 | 3,490 (1.3%) | 8,385 (5.2%) |
| $5,000 to $9,999 | 1,438 (0.6%) | 4,302 (2.7%) |
| $10,000 to $14,999 | 2,592 (1.0%) | 9,550 (5.9%) |
| $15,000 to $19,999 | 3,260 (1.3%) | 7,794 (4.8%) |
| $20,000 to $24,999 | 3,974 (1.5%) | 5,859 (3.6%) |
| $25,000 to $34,999 | 8,450 (3.3%) | 11,172 (6.9%) |
| $35,000 to $49,999 | 12,949 (5.0%) | 14,796 (9.2%) |
| $50,000 to $74,999 | 23,635 (9.2%) | 22,623 (14.0%) |
| $75,000 to $99,999 | 25,943 (10.1%) | 18,138 (11.3%) |
| $100,000 to $149,999 | 47,388 (18.4%) | 25,528 (15.9%) |
| $150,000 or more | 124,754 (48.4%) | 32,943 (20.4%) |
| Total | 257,873 (100.0%) | 161,090 (100.0%) |
Monthly Housing Cost Tiers in Area Code 339
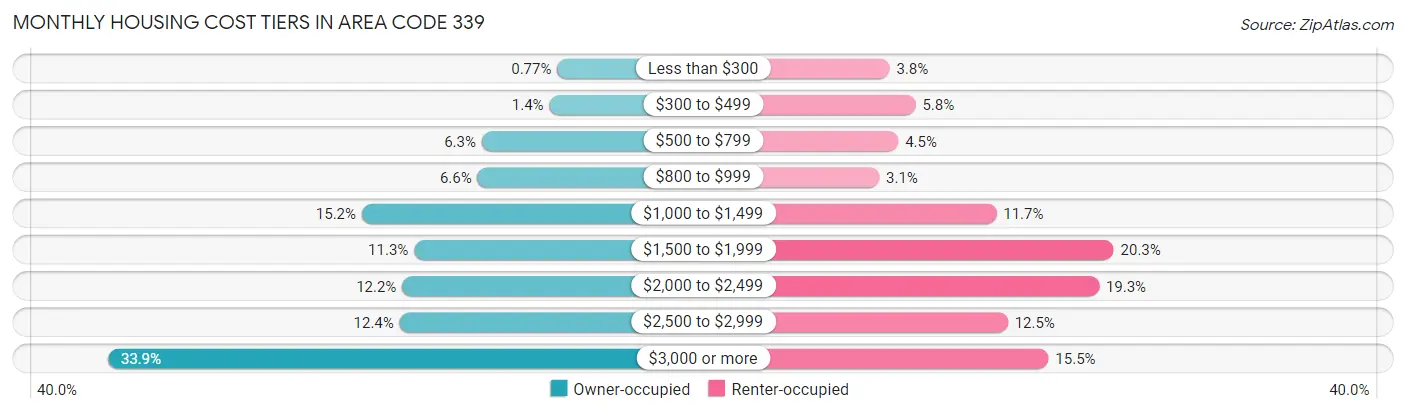
| Monthly Cost | Owner-occupied | Renter-occupied |
| Less than $300 | 1,979 (0.8%) | 6,181 (3.8%) |
| $300 to $499 | 3,479 (1.3%) | 9,268 (5.8%) |
| $500 to $799 | 16,327 (6.3%) | 7,224 (4.5%) |
| $800 to $999 | 17,124 (6.6%) | 4,953 (3.1%) |
| $1,000 to $1,499 | 39,096 (15.2%) | 18,850 (11.7%) |
| $1,500 to $1,999 | 29,158 (11.3%) | 32,771 (20.3%) |
| $2,000 to $2,499 | 31,441 (12.2%) | 31,032 (19.3%) |
| $2,500 to $2,999 | 31,936 (12.4%) | 20,205 (12.5%) |
| $3,000 or more | 87,333 (33.9%) | 25,028 (15.5%) |
| Total | 257,873 (100.0%) | 161,090 (100.0%) |
Physical Housing Characteristics in Area Code 339
Housing Structures in Area Code 339
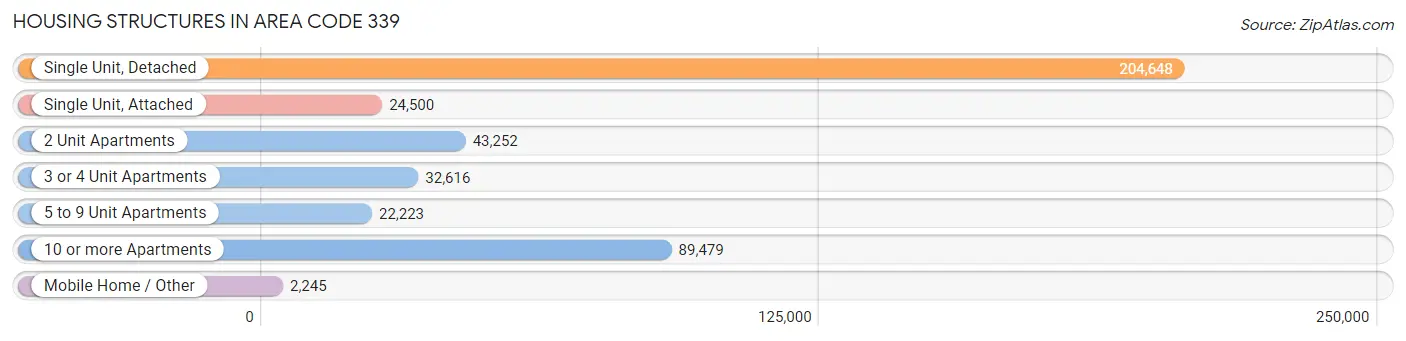
| Structure Type | # Housing Units | % Housing Units |
| Single Unit, Detached | 204,648 | 48.8% |
| Single Unit, Attached | 24,500 | 5.9% |
| 2 Unit Apartments | 43,252 | 10.3% |
| 3 or 4 Unit Apartments | 32,616 | 7.8% |
| 5 to 9 Unit Apartments | 22,223 | 5.3% |
| 10 or more Apartments | 89,479 | 21.4% |
| Mobile Home / Other | 2,245 | 0.5% |
| Total | 418,963 | 100.0% |
Housing Structures by Occupancy in Area Code 339
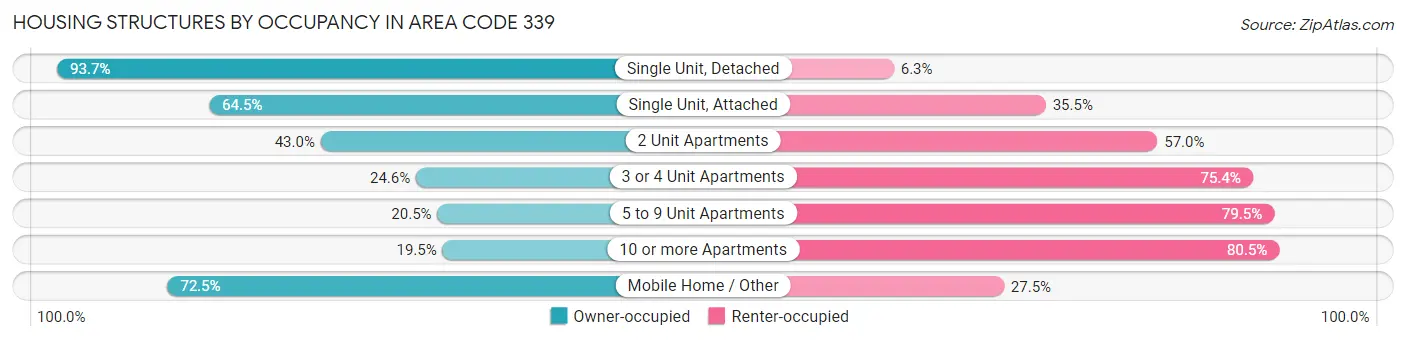
| Structure Type | Owner-occupied | Renter-occupied |
| Single Unit, Detached | 191,795 (93.7%) | 12,853 (6.3%) |
| Single Unit, Attached | 15,792 (64.5%) | 8,708 (35.5%) |
| 2 Unit Apartments | 18,590 (43.0%) | 24,662 (57.0%) |
| 3 or 4 Unit Apartments | 8,034 (24.6%) | 24,582 (75.4%) |
| 5 to 9 Unit Apartments | 4,560 (20.5%) | 17,663 (79.5%) |
| 10 or more Apartments | 17,474 (19.5%) | 72,005 (80.5%) |
| Mobile Home / Other | 1,628 (72.5%) | 617 (27.5%) |
| Total | 257,873 (61.6%) | 161,090 (38.5%) |
Housing Structures by Number of Rooms in Area Code 339
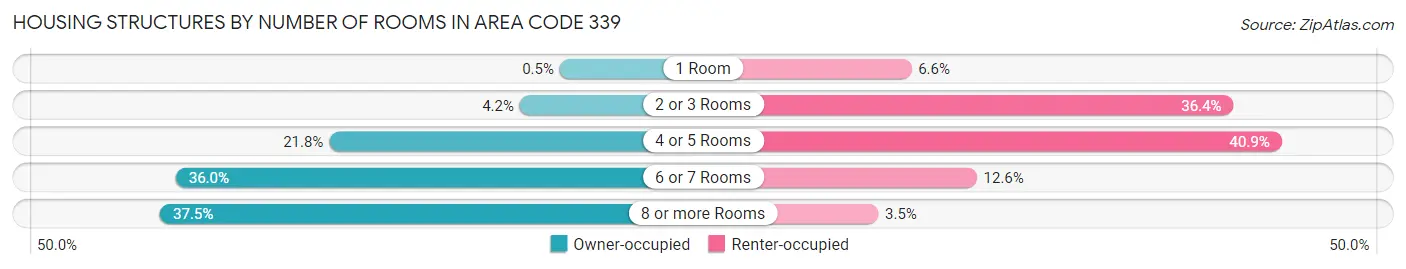
| Number of Rooms | Owner-occupied | Renter-occupied |
| 1 Room | 1,291 (0.5%) | 10,618 (6.6%) |
| 2 or 3 Rooms | 10,820 (4.2%) | 58,619 (36.4%) |
| 4 or 5 Rooms | 56,282 (21.8%) | 65,802 (40.8%) |
| 6 or 7 Rooms | 92,849 (36.0%) | 20,363 (12.6%) |
| 8 or more Rooms | 96,631 (37.5%) | 5,688 (3.5%) |
| Total | 257,873 (100.0%) | 161,090 (100.0%) |
Housing Structure by Heating Type in Area Code 339
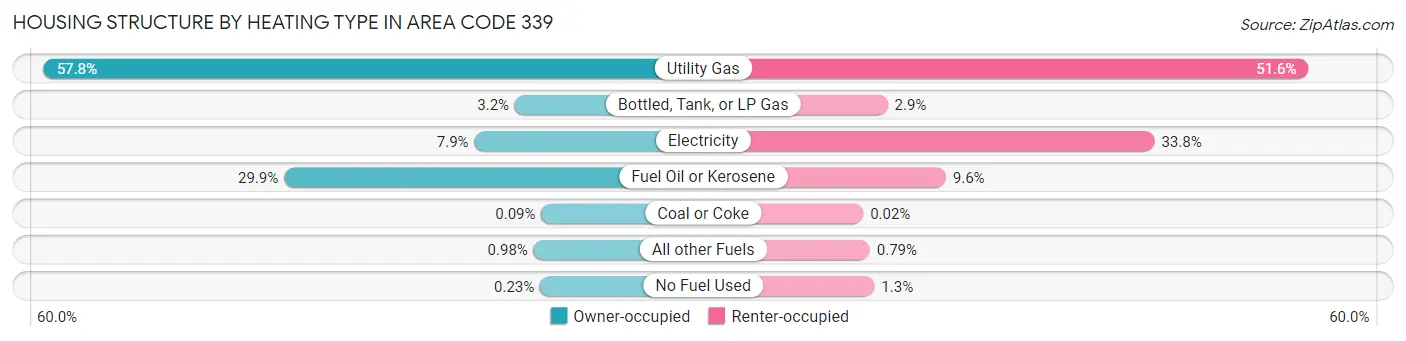
| Heating Type | Owner-occupied | Renter-occupied |
| Utility Gas | 148,997 (57.8%) | 83,172 (51.6%) |
| Bottled, Tank, or LP Gas | 8,121 (3.2%) | 4,584 (2.9%) |
| Electricity | 20,254 (7.9%) | 54,428 (33.8%) |
| Fuel Oil or Kerosene | 77,162 (29.9%) | 15,463 (9.6%) |
| Coal or Coke | 230 (0.1%) | 32 (0.0%) |
| All other Fuels | 2,516 (1.0%) | 1,278 (0.8%) |
| No Fuel Used | 593 (0.2%) | 2,133 (1.3%) |
| Total | 257,873 (100.0%) | 161,090 (100.0%) |
Household Vehicle Usage in Area Code 339
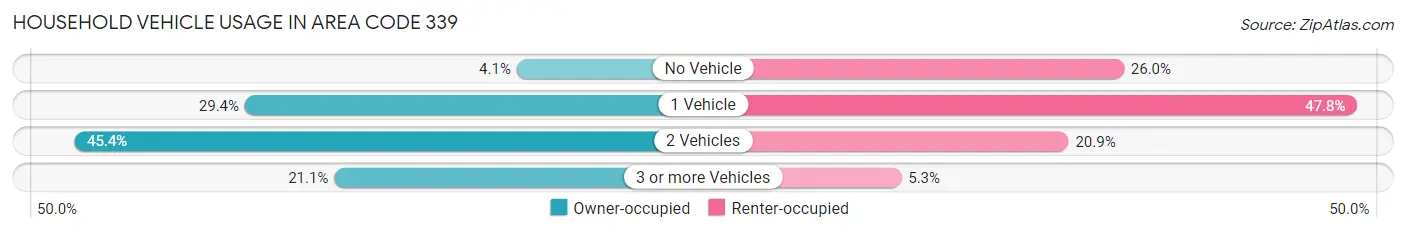
| Vehicles per Household | Owner-occupied | Renter-occupied |
| No Vehicle | 10,479 (4.1%) | 41,943 (26.0%) |
| 1 Vehicle | 75,929 (29.4%) | 77,057 (47.8%) |
| 2 Vehicles | 117,053 (45.4%) | 33,613 (20.9%) |
| 3 or more Vehicles | 54,412 (21.1%) | 8,477 (5.3%) |
| Total | 257,873 (100.0%) | 161,090 (100.0%) |
Real Estate & Mortgages in Area Code 339
Real Estate and Mortgage Overview in Area Code 339
| Characteristic | Without Mortgage | With Mortgage |
| Housing Units | 84,261 | 173,612 |
| Median Property Value | $34,949,701 | $37,878,800 |
| Median Household Income | $5,432,273 | $97,993 |
| Monthly Housing Costs | $55,323 | $85,111 |
| Real Estate Taxes | $329,211 | $2,336 |
Property Value by Mortgage Status in Area Code 339
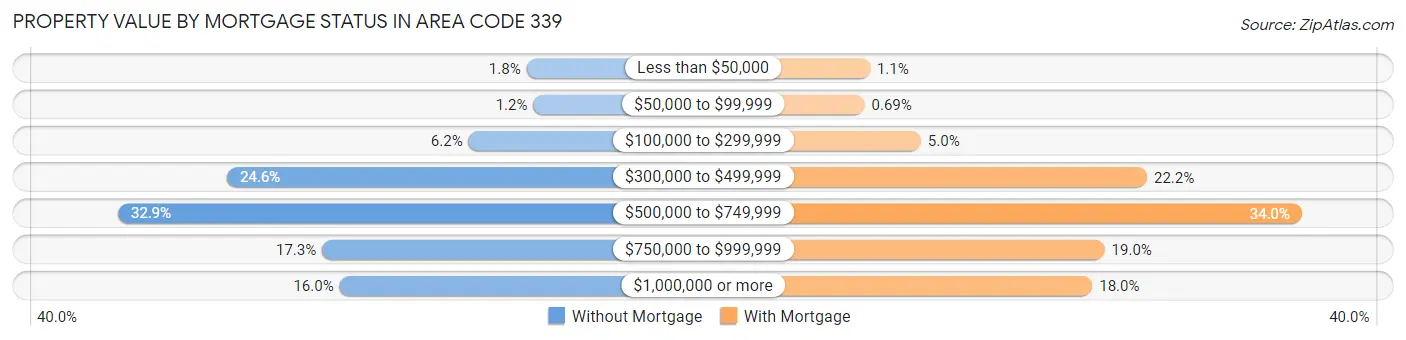
| Property Value | Without Mortgage | With Mortgage |
| Less than $50,000 | 1,483 (1.8%) | 1,914 (1.1%) |
| $50,000 to $99,999 | 1,042 (1.2%) | 1,190 (0.7%) |
| $100,000 to $299,999 | 5,211 (6.2%) | 8,645 (5.0%) |
| $300,000 to $499,999 | 20,709 (24.6%) | 38,564 (22.2%) |
| $500,000 to $749,999 | 27,717 (32.9%) | 59,028 (34.0%) |
| $750,000 to $999,999 | 14,610 (17.3%) | 32,943 (19.0%) |
| $1,000,000 or more | 13,489 (16.0%) | 31,328 (18.0%) |
| Total | 84,261 (100.0%) | 173,612 (100.0%) |
Household Income by Mortgage Status in Area Code 339
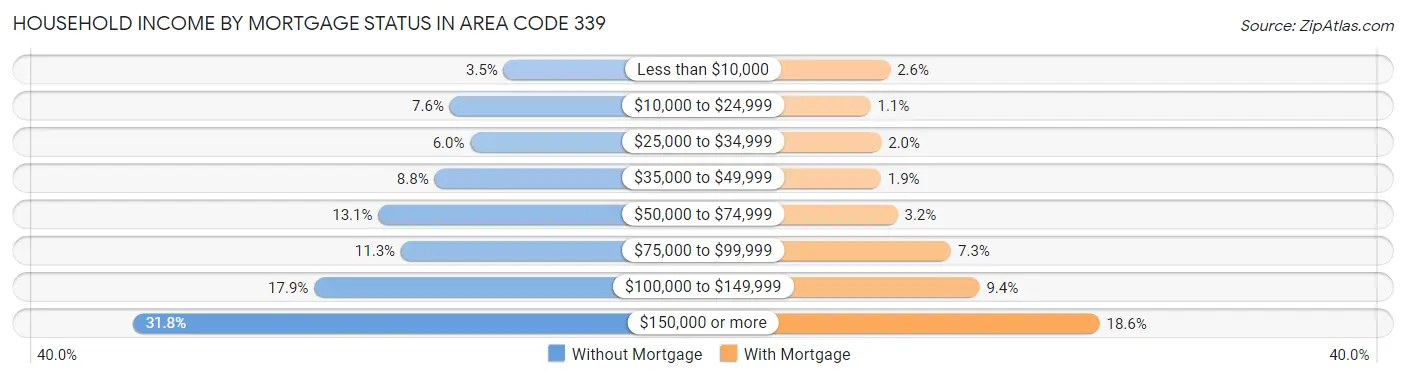
| Household Income | Without Mortgage | With Mortgage |
| Less than $10,000 | 2,945 (3.5%) | 4,579 (2.6%) |
| $10,000 to $24,999 | 6,415 (7.6%) | 1,983 (1.1%) |
| $25,000 to $34,999 | 5,092 (6.0%) | 3,411 (2.0%) |
| $35,000 to $49,999 | 7,387 (8.8%) | 3,358 (1.9%) |
| $50,000 to $74,999 | 10,995 (13.1%) | 5,562 (3.2%) |
| $75,000 to $99,999 | 9,546 (11.3%) | 12,640 (7.3%) |
| $100,000 to $149,999 | 15,120 (17.9%) | 16,397 (9.4%) |
| $150,000 or more | 26,761 (31.8%) | 32,268 (18.6%) |
| Total | 84,261 (100.0%) | 173,612 (100.0%) |
Property Value to Household Income Ratio in Area Code 339
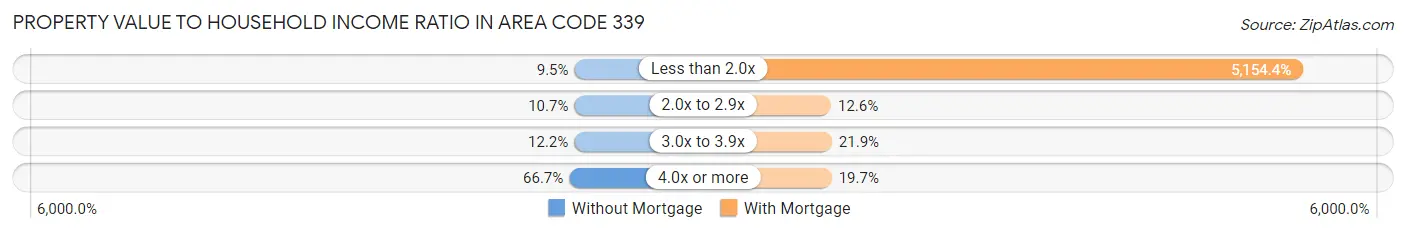
| Value-to-Income Ratio | Without Mortgage | With Mortgage |
| Less than 2.0x | 7,988 (9.5%) | 8,948,589 (5,154.4%) |
| 2.0x to 2.9x | 8,991 (10.7%) | 21,834 (12.6%) |
| 3.0x to 3.9x | 10,262 (12.2%) | 38,013 (21.9%) |
| 4.0x or more | 56,172 (66.7%) | 34,147 (19.7%) |
| Total | 84,261 (100.0%) | 173,612 (100.0%) |
Real Estate Taxes by Mortgage Status in Area Code 339
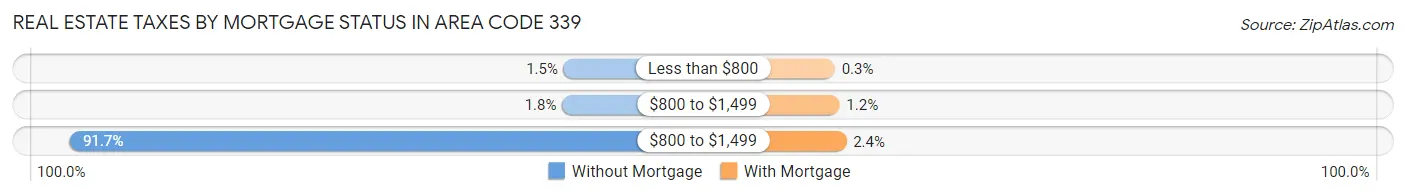
| Property Taxes | Without Mortgage | With Mortgage |
| Less than $800 | 1,270 (1.5%) | 523 (0.3%) |
| $800 to $1,499 | 1,506 (1.8%) | 2,018 (1.2%) |
| $800 to $1,499 | 77,266 (91.7%) | 4,180 (2.4%) |
| Total | 84,261 (100.0%) | 173,612 (100.0%) |
Health & Disability in Area Code 339
Health Insurance Coverage by Age in Area Code 339
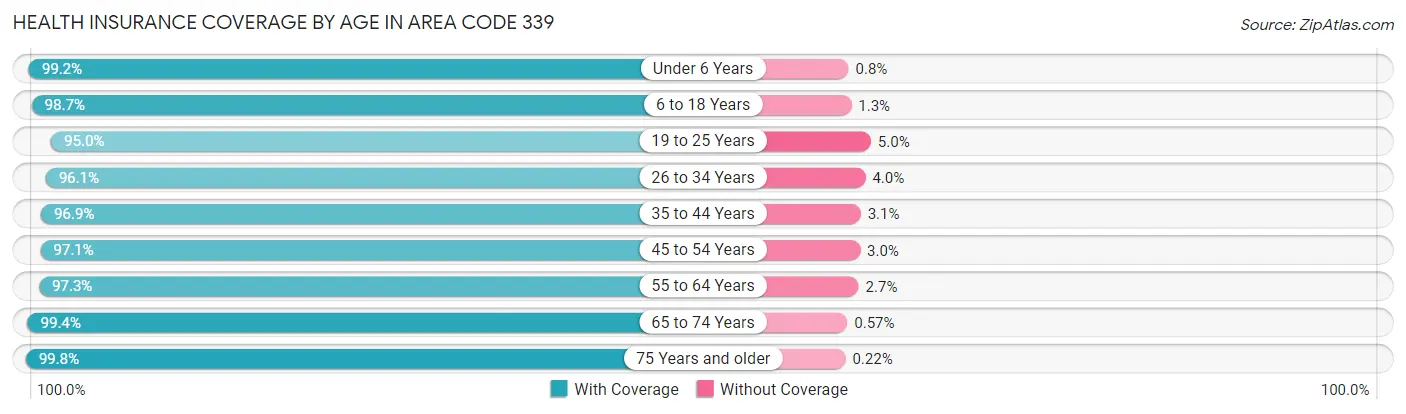
| Age Bracket | With Coverage | Without Coverage |
| Under 6 Years | 66,822 (99.2%) | 536 (0.8%) |
| 6 to 18 Years | 157,651 (98.7%) | 2,112 (1.3%) |
| 19 to 25 Years | 102,826 (95.0%) | 5,366 (5.0%) |
| 26 to 34 Years | 137,774 (96.1%) | 5,660 (4.0%) |
| 35 to 44 Years | 137,989 (96.9%) | 4,353 (3.1%) |
| 45 to 54 Years | 136,368 (97.1%) | 4,151 (2.9%) |
| 55 to 64 Years | 135,741 (97.3%) | 3,734 (2.7%) |
| 65 to 74 Years | 97,278 (99.4%) | 556 (0.6%) |
| 75 Years and older | 74,619 (99.8%) | 163 (0.2%) |
| Total | 1,047,068 (97.5%) | 26,631 (2.5%) |
Health Insurance Coverage by Citizenship Status in Area Code 339
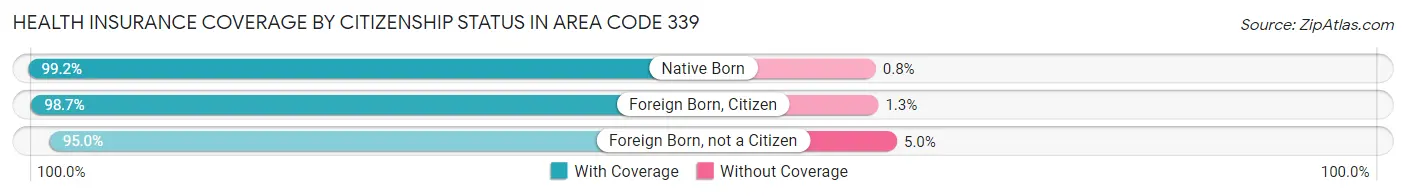
| Citizenship Status | With Coverage | Without Coverage |
| Native Born | 66,822 (99.2%) | 536 (0.8%) |
| Foreign Born, Citizen | 157,651 (98.7%) | 2,112 (1.3%) |
| Foreign Born, not a Citizen | 102,826 (95.0%) | 5,366 (5.0%) |
Health Insurance Coverage by Household Income in Area Code 339
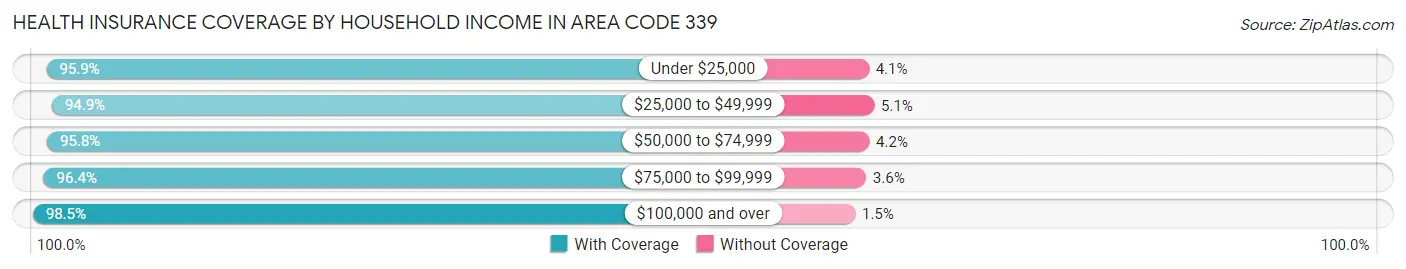
| Household Income | With Coverage | Without Coverage |
| Under $25,000 | 73,371 (95.9%) | 3,135 (4.1%) |
| $25,000 to $49,999 | 87,841 (94.9%) | 4,736 (5.1%) |
| $50,000 to $74,999 | 91,554 (95.8%) | 4,008 (4.2%) |
| $75,000 to $99,999 | 96,129 (96.4%) | 3,573 (3.6%) |
| $100,000 and over | 671,964 (98.5%) | 10,476 (1.5%) |
Public vs Private Health Insurance Coverage by Age in Area Code 339
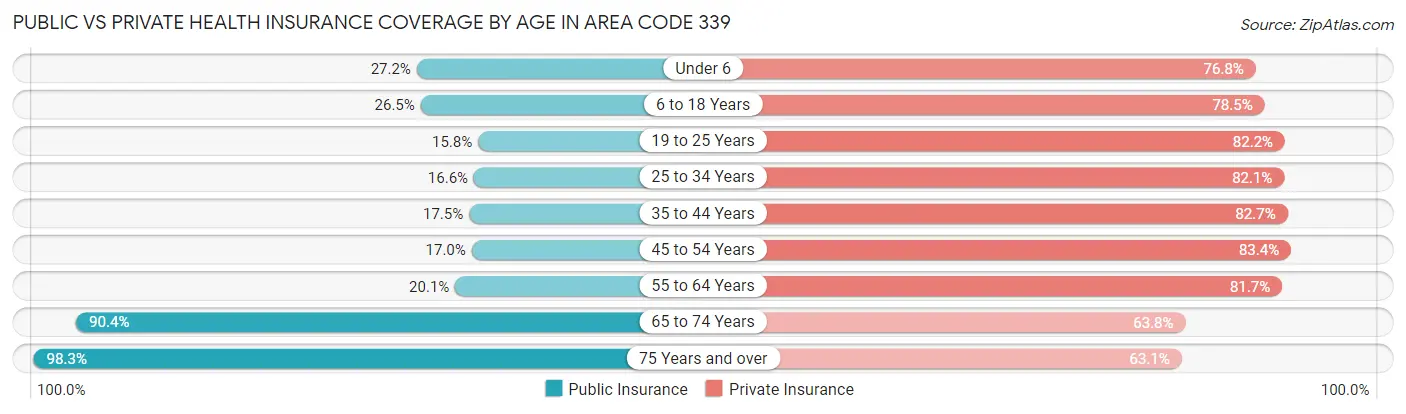
| Age Bracket | Public Insurance | Private Insurance |
| Under 6 | 18,333 (27.2%) | 51,737 (76.8%) |
| 6 to 18 Years | 42,334 (26.5%) | 125,334 (78.4%) |
| 19 to 25 Years | 17,125 (15.8%) | 88,976 (82.2%) |
| 25 to 34 Years | 23,807 (16.6%) | 117,769 (82.1%) |
| 35 to 44 Years | 24,907 (17.5%) | 117,744 (82.7%) |
| 45 to 54 Years | 23,932 (17.0%) | 117,145 (83.4%) |
| 55 to 64 Years | 28,013 (20.1%) | 113,974 (81.7%) |
| 65 to 74 Years | 88,459 (90.4%) | 62,380 (63.8%) |
| 75 Years and over | 73,536 (98.3%) | 47,171 (63.1%) |
| Total | 340,446 (31.7%) | 842,230 (78.4%) |
Disability Status by Sex by Age in Area Code 339
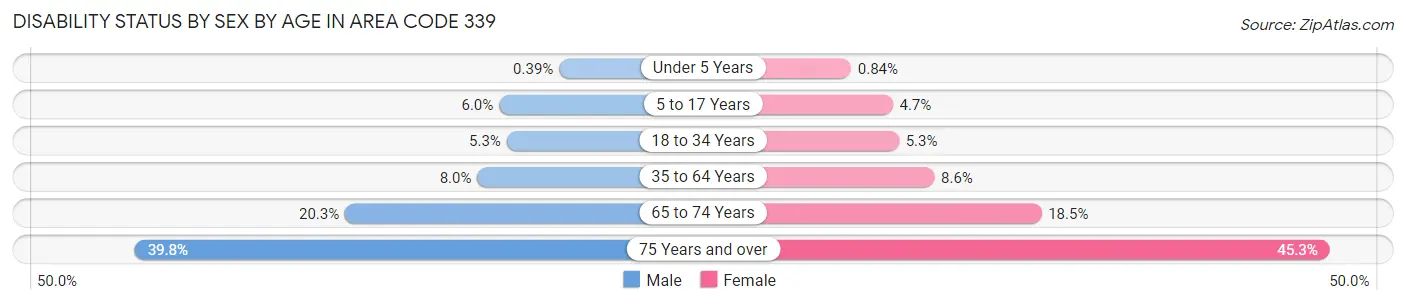
| Age Bracket | Male | Female |
| Under 5 Years | 119 (0.4%) | 220 (0.8%) |
| 5 to 17 Years | 4,541 (6.0%) | 3,673 (4.7%) |
| 18 to 34 Years | 7,228 (5.3%) | 6,891 (5.3%) |
| 35 to 64 Years | 16,757 (8.0%) | 18,205 (8.6%) |
| 65 to 74 Years | 9,110 (20.3%) | 9,785 (18.5%) |
| 75 Years and over | 11,425 (39.8%) | 20,851 (45.3%) |
Disability Class by Sex by Age in Area Code 339
Disability Class: Hearing Difficulty
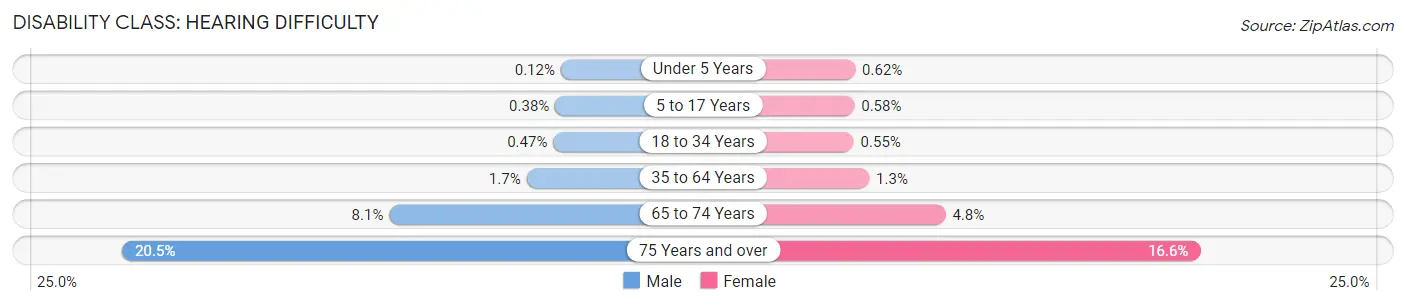
| Age Bracket | Male | Female |
| Under 5 Years | 37 (0.1%) | 163 (0.6%) |
| 5 to 17 Years | 287 (0.4%) | 453 (0.6%) |
| 18 to 34 Years | 640 (0.5%) | 711 (0.5%) |
| 35 to 64 Years | 3,580 (1.7%) | 2,706 (1.3%) |
| 65 to 74 Years | 3,633 (8.1%) | 2,542 (4.8%) |
| 75 Years and over | 5,884 (20.5%) | 7,661 (16.6%) |
Disability Class: Vision Difficulty
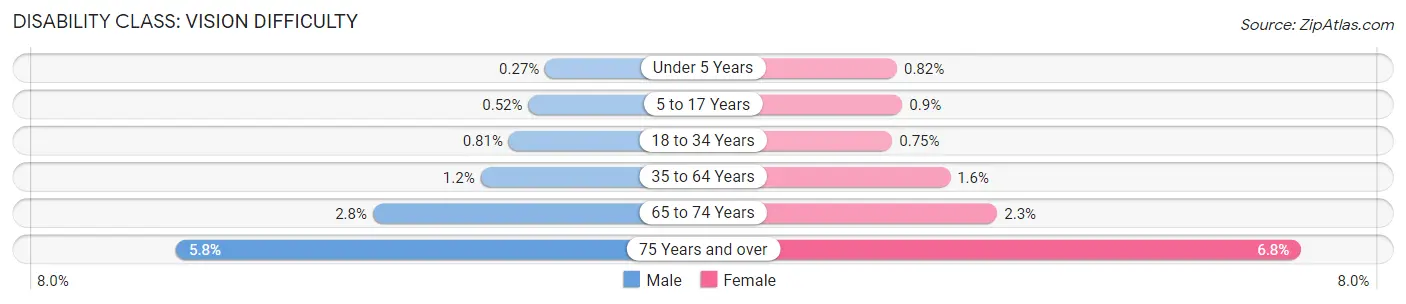
| Age Bracket | Male | Female |
| Under 5 Years | 82 (0.3%) | 215 (0.8%) |
| 5 to 17 Years | 399 (0.5%) | 705 (0.9%) |
| 18 to 34 Years | 1,111 (0.8%) | 976 (0.7%) |
| 35 to 64 Years | 2,589 (1.2%) | 3,425 (1.6%) |
| 65 to 74 Years | 1,273 (2.8%) | 1,223 (2.3%) |
| 75 Years and over | 1,651 (5.8%) | 3,139 (6.8%) |
Disability Class: Cognitive Difficulty
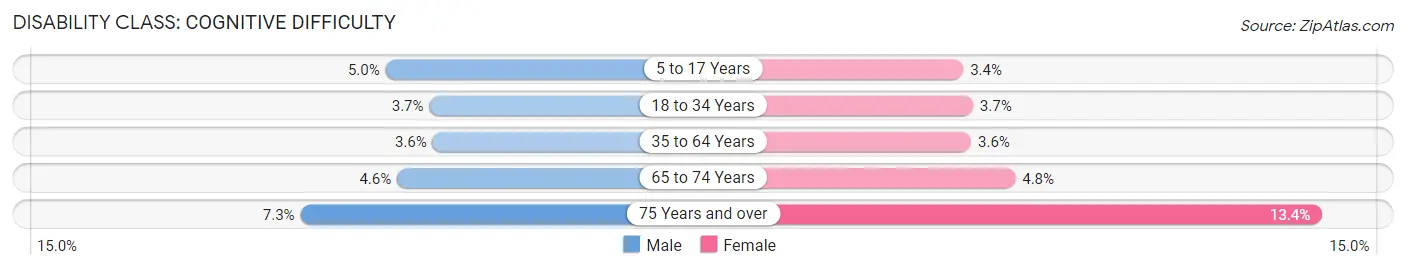
| Age Bracket | Male | Female |
| 5 to 17 Years | 3,776 (5.0%) | 2,632 (3.4%) |
| 18 to 34 Years | 5,116 (3.7%) | 4,759 (3.6%) |
| 35 to 64 Years | 7,631 (3.6%) | 7,657 (3.6%) |
| 65 to 74 Years | 2,083 (4.6%) | 2,552 (4.8%) |
| 75 Years and over | 2,102 (7.3%) | 6,156 (13.4%) |
Disability Class: Ambulatory Difficulty
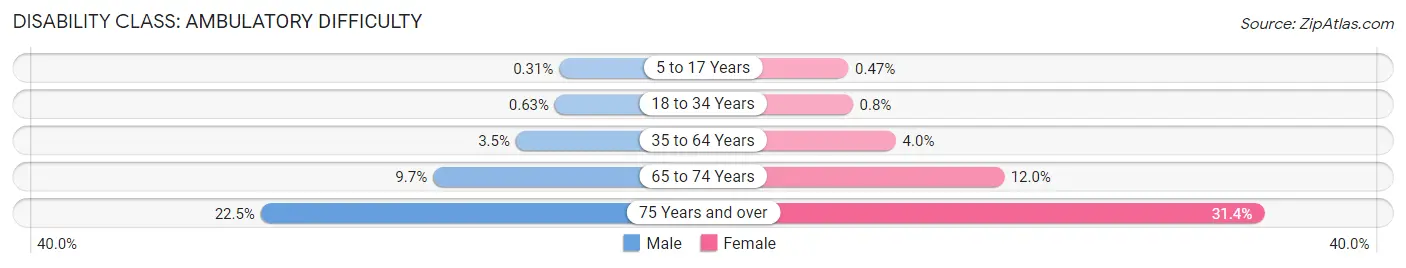
| Age Bracket | Male | Female |
| 5 to 17 Years | 239 (0.3%) | 370 (0.5%) |
| 18 to 34 Years | 861 (0.6%) | 1,040 (0.8%) |
| 35 to 64 Years | 7,408 (3.5%) | 8,491 (4.0%) |
| 65 to 74 Years | 4,351 (9.7%) | 6,355 (12.0%) |
| 75 Years and over | 6,454 (22.5%) | 14,440 (31.4%) |
Disability Class: Self-Care Difficulty
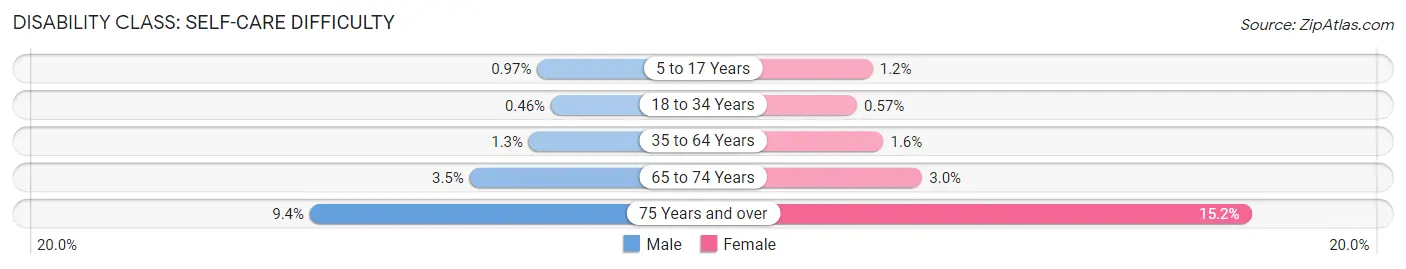
| Age Bracket | Male | Female |
| 5 to 17 Years | 736 (1.0%) | 899 (1.1%) |
| 18 to 34 Years | 636 (0.5%) | 748 (0.6%) |
| 35 to 64 Years | 2,682 (1.3%) | 3,288 (1.5%) |
| 65 to 74 Years | 1,567 (3.5%) | 1,578 (3.0%) |
| 75 Years and over | 2,702 (9.4%) | 7,002 (15.2%) |
Technology Access in Area Code 339
Computing Device Access in Area Code 339
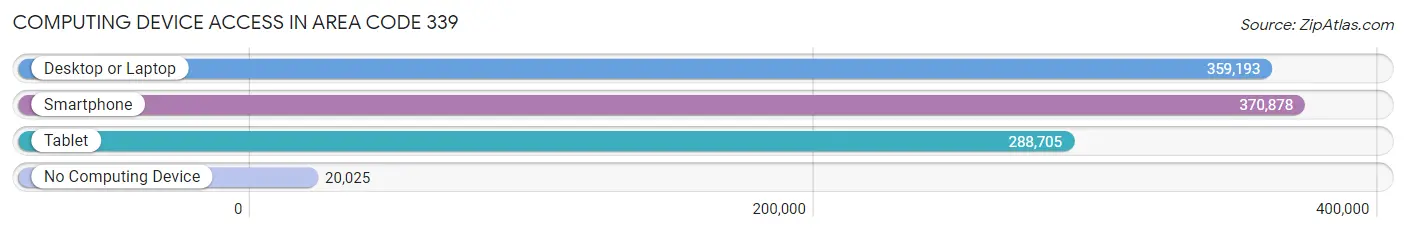
| Device Type | # Households | % Households |
| Desktop or Laptop | 359,193 | 85.7% |
| Smartphone | 370,878 | 88.5% |
| Tablet | 288,705 | 68.9% |
| No Computing Device | 20,025 | 4.8% |
| Total | 418,963 | 100.0% |
Internet Access in Area Code 339
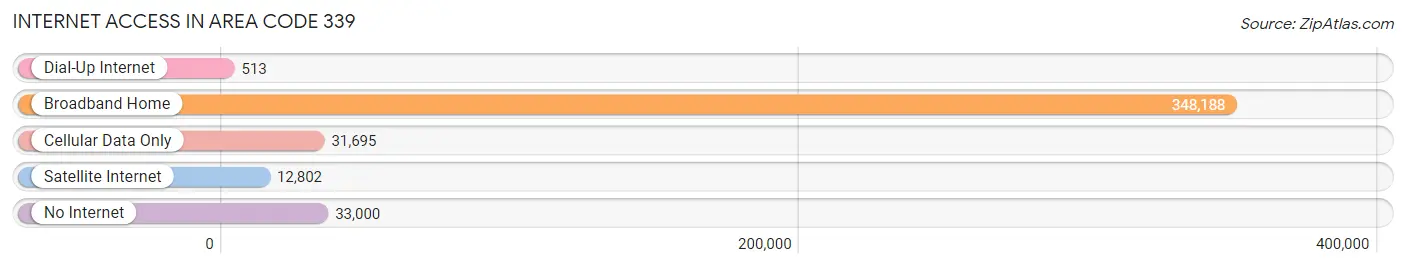
| Internet Type | # Households | % Households |
| Dial-Up Internet | 513 | 0.1% |
| Broadband Home | 348,188 | 83.1% |
| Cellular Data Only | 31,695 | 7.6% |
| Satellite Internet | 12,802 | 3.1% |
| No Internet | 33,000 | 7.9% |
| Total | 418,963 | 100.0% |
Area Code 339 Summary
Geography
Area code 339 is an area code in the North American Numbering Plan (NANP) for the eastern portion of Massachusetts. It was created in 2001 as an overlay to area code 781, which serves the same geographic area. The 339 area code covers the cities of Boston, Cambridge, Quincy, and Brockton, as well as the towns of Arlington, Belmont, Brookline, Dedham, Needham, Newton, Norwood, and Wellesley.
Social
The 339 area code is home to a diverse population of people from all walks of life. The area is home to a large number of universities and colleges, including Harvard, MIT, and Boston University. The area is also home to a vibrant arts and culture scene, with numerous museums, galleries, and performance venues.
Economics
The 339 area code is home to a thriving economy. The area is home to a number of major corporations, including Fidelity Investments, Liberty Mutual, and State Street Corporation. The area is also home to a number of start-ups and small businesses.
Demographics
The 339 area code is home to a diverse population of people from all walks of life. The area is home to a large number of immigrants from all over the world, including Latin America, Asia, and Africa. The area is also home to a large number of young professionals and students. The median household income in the area is $77,000, and the median age is 33.
Common Questions
What is Per Capita Income in Area Code 339?
Per Capita income in Area Code 339 is $68,460.
What is the Median Family Income in Area Code 339?
Median Family Income in Area Code 339 is $161,463.
What is the Median Household income in Area Code 339?
Median Household Income in Area Code 339 is $129,999.
What is Income or Wage Gap in Area Code 339?
Income or Wage Gap in Area Code 339 is 32.3%.
Women in Area Code 339 earn 67.7 cents for every dollar earned by a man.
What is Family Income Deficit in Area Code 339?
Family Income Deficit in Area Code 339 is $11,820.
Families that are below poverty line in Area Code 339 earn $11,820 less on average than the poverty threshold level.
What is Inequality or Gini Index in Area Code 339?
Inequality or Gini Index in Area Code 339 is 23.40.
What is the Total Population of Area Code 339?
Total Population of Area Code 339 is 1,081,009.
What is the Total Male Population of Area Code 339?
Total Male Population of Area Code 339 is 530,619.
What is the Total Female Population of Area Code 339?
Total Female Population of Area Code 339 is 550,390.
What is the Ratio of Males per 100 Females in Area Code 339?
There are 96.41 Males per 100 Females in Area Code 339.
What is the Ratio of Females per 100 Males in Area Code 339?
There are 103.73 Females per 100 Males in Area Code 339.
What is the Median Population Age in Area Code 339?
Median Population Age in Area Code 339 is 40.1 Years.
What is the Average Family Size in Area Code 339
Average Family Size in Area Code 339 is 3.0 People.
What is the Average Household Size in Area Code 339
Average Household Size in Area Code 339 is 2.4 People.
How Large is the Labor Force in Area Code 339?
There are 600,519 People in the Labor Forcein in Area Code 339.
What is the Percentage of People in the Labor Force in Area Code 339?
67.0% of People are in the Labor Force in Area Code 339.
What is the Unemployment Rate in Area Code 339?
Unemployment Rate in Area Code 339 is 4.4%.