Middlesex County, MA Map & Demographics
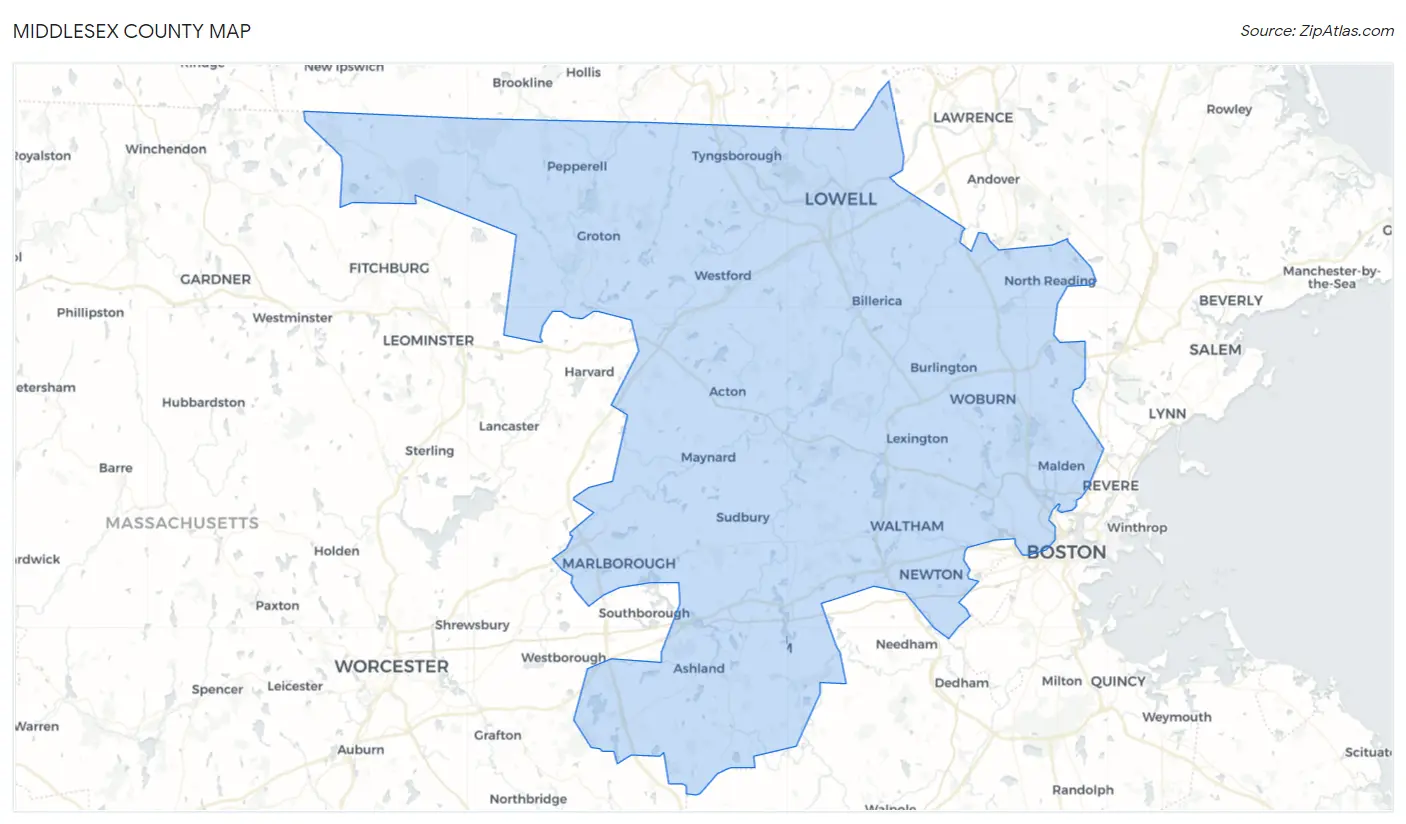
Middlesex County Map
Middlesex County Overview
$64,197
PER CAPITA INCOME
$153,239
AVG FAMILY INCOME
$121,304
AVG HOUSEHOLD INCOME
28.7%
WAGE / INCOME GAP [ % ]
71.3¢/ $1
WAGE / INCOME GAP [ $ ]
$10,830
FAMILY INCOME DEFICIT
0.47
INEQUALITY / GINI INDEX
1,623,109
TOTAL POPULATION
802,270
MALE POPULATION
820,839
FEMALE POPULATION
97.74
MALES / 100 FEMALES
102.31
FEMALES / 100 MALES
38.8
MEDIAN AGE
3.1
AVG FAMILY SIZE
2.5
AVG HOUSEHOLD SIZE
939,000
LABOR FORCE [ PEOPLE ]
69.9%
PERCENT IN LABOR FORCE
4.4%
UNEMPLOYMENT RATE
Income in Middlesex County
Income Overview in Middlesex County
Per Capita Income in Middlesex County is $64,197, while median incomes of families and households are $153,239 and $121,304 respectively.
| Characteristic | Number | Measure |
| Per Capita Income | 1,623,109 | $64,197 |
| Median Family Income | 397,780 | $153,239 |
| Mean Family Income | 397,780 | $198,974 |
| Median Household Income | 629,775 | $121,304 |
| Mean Household Income | 629,775 | $164,118 |
| Income Deficit | 397,780 | $10,830 |
| Wage / Income Gap (%) | 1,623,109 | 28.74% |
| Wage / Income Gap ($) | 1,623,109 | 71.26¢ per $1 |
| Gini / Inequality Index | 1,623,109 | 0.47 |
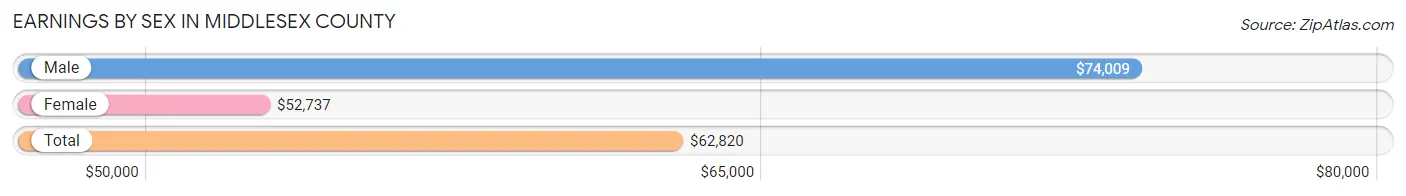
Earnings by Sex in Middlesex County
Average Earnings in Middlesex County are $62,820, $74,009 for men and $52,737 for women, a difference of 28.7%.
| Sex | Number | Average Earnings |
| Male | 511,357 (52.0%) | $74,009 |
| Female | 471,267 (48.0%) | $52,737 |
| Total | 982,624 (100.0%) | $62,820 |
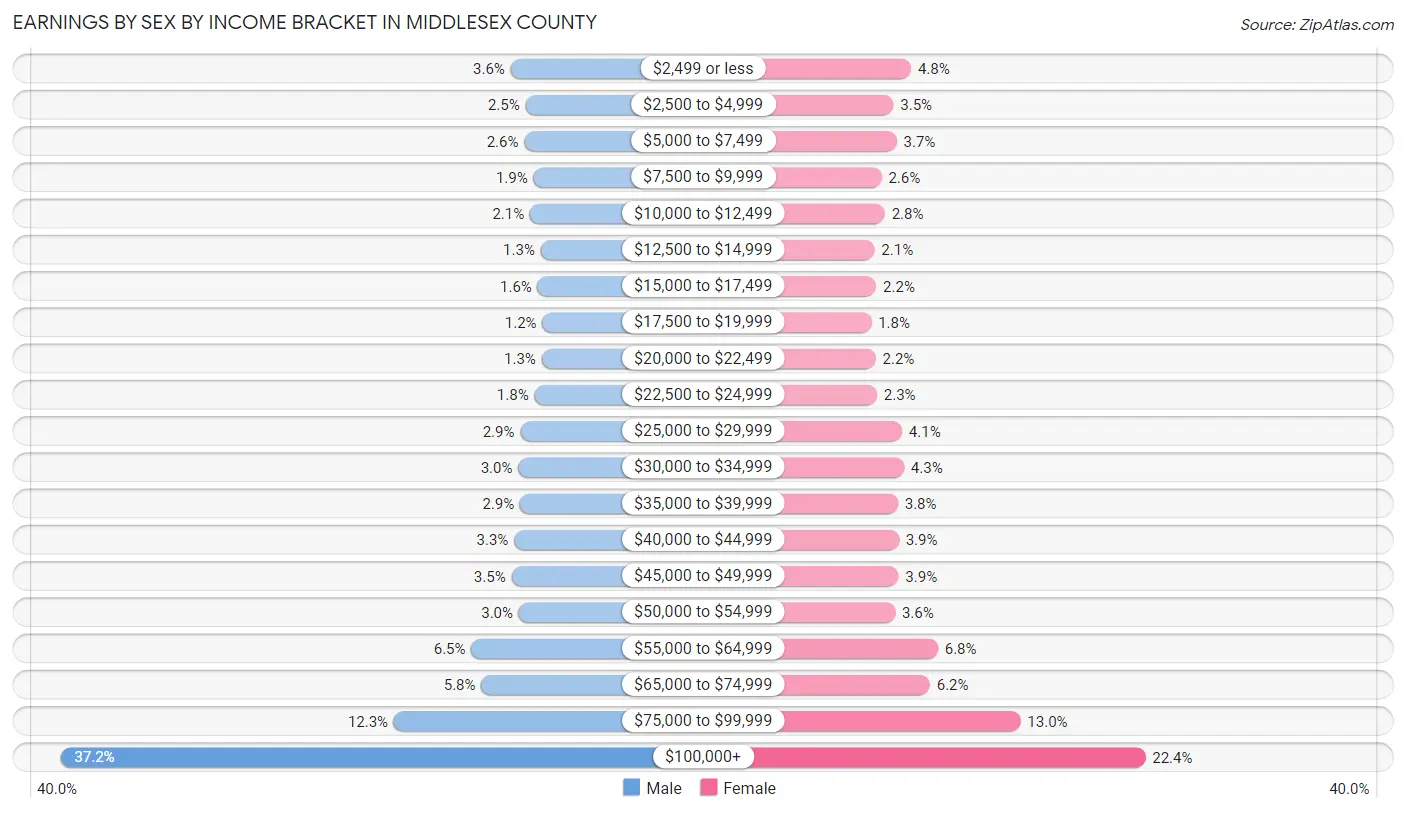
Earnings by Sex by Income Bracket in Middlesex County
The most common earnings brackets in Middlesex County are $100,000+ for men (190,440 | 37.2%) and $100,000+ for women (105,443 | 22.4%).
| Income | Male | Female |
| $2,499 or less | 18,250 (3.6%) | 22,647 (4.8%) |
| $2,500 to $4,999 | 12,595 (2.5%) | 16,468 (3.5%) |
| $5,000 to $7,499 | 13,046 (2.5%) | 17,566 (3.7%) |
| $7,500 to $9,999 | 9,518 (1.9%) | 12,253 (2.6%) |
| $10,000 to $12,499 | 10,823 (2.1%) | 13,374 (2.8%) |
| $12,500 to $14,999 | 6,736 (1.3%) | 9,756 (2.1%) |
| $15,000 to $17,499 | 7,911 (1.5%) | 10,374 (2.2%) |
| $17,500 to $19,999 | 6,079 (1.2%) | 8,625 (1.8%) |
| $20,000 to $22,499 | 6,405 (1.3%) | 10,164 (2.2%) |
| $22,500 to $24,999 | 9,176 (1.8%) | 10,585 (2.2%) |
| $25,000 to $29,999 | 14,571 (2.9%) | 19,467 (4.1%) |
| $30,000 to $34,999 | 15,328 (3.0%) | 20,150 (4.3%) |
| $35,000 to $39,999 | 14,658 (2.9%) | 18,006 (3.8%) |
| $40,000 to $44,999 | 16,916 (3.3%) | 18,334 (3.9%) |
| $45,000 to $49,999 | 17,950 (3.5%) | 18,244 (3.9%) |
| $50,000 to $54,999 | 15,150 (3.0%) | 17,034 (3.6%) |
| $55,000 to $64,999 | 33,318 (6.5%) | 32,163 (6.8%) |
| $65,000 to $74,999 | 29,503 (5.8%) | 29,309 (6.2%) |
| $75,000 to $99,999 | 62,984 (12.3%) | 61,305 (13.0%) |
| $100,000+ | 190,440 (37.2%) | 105,443 (22.4%) |
| Total | 511,357 (100.0%) | 471,267 (100.0%) |
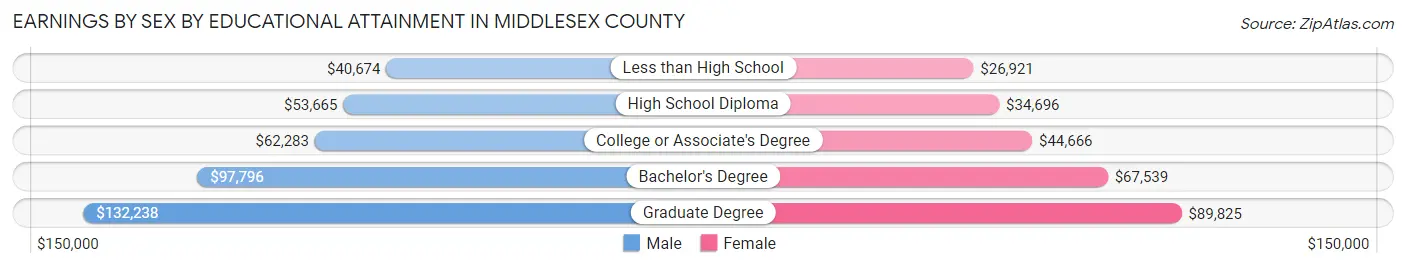
Earnings by Sex by Educational Attainment in Middlesex County
Average earnings in Middlesex County are $85,814 for men and $61,857 for women, a difference of 27.9%. Men with an educational attainment of graduate degree enjoy the highest average annual earnings of $132,238, while those with less than high school education earn the least with $40,674. Women with an educational attainment of graduate degree earn the most with the average annual earnings of $89,825, while those with less than high school education have the smallest earnings of $26,921.
| Educational Attainment | Male Income | Female Income |
| Less than High School | $40,674 | $26,921 |
| High School Diploma | $53,665 | $34,696 |
| College or Associate's Degree | $62,283 | $44,666 |
| Bachelor's Degree | $97,796 | $67,539 |
| Graduate Degree | $132,238 | $89,825 |
| Total | $85,814 | $61,857 |
Family Income in Middlesex County
Family Income Brackets in Middlesex County
According to the Middlesex County family income data, there are 142,007 families falling into the $200,000+ income range, which is the most common income bracket and makes up 35.7% of all families. Conversely, the $10,000 to $14,999 income bracket is the least frequent group with only 3,580 families (0.9%) belonging to this category.
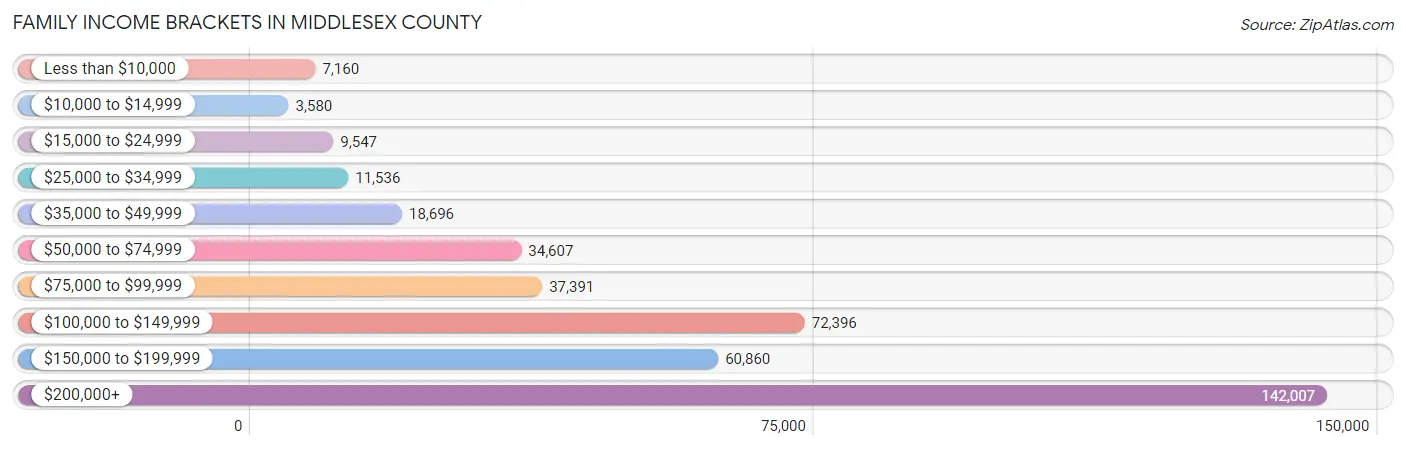
| Income Bracket | # Families | % Families |
| Less than $10,000 | 7,160 | 1.8% |
| $10,000 to $14,999 | 3,580 | 0.9% |
| $15,000 to $24,999 | 9,547 | 2.4% |
| $25,000 to $34,999 | 11,536 | 2.9% |
| $35,000 to $49,999 | 18,696 | 4.7% |
| $50,000 to $74,999 | 34,607 | 8.7% |
| $75,000 to $99,999 | 37,391 | 9.4% |
| $100,000 to $149,999 | 72,396 | 18.2% |
| $150,000 to $199,999 | 60,860 | 15.3% |
| $200,000+ | 142,007 | 35.7% |
Family Income by Famaliy Size in Middlesex County
5-person families (29,812 | 7.5%) account for the highest median family income in Middlesex County with $190,410 per family, while 2-person families (170,895 | 43.0%) have the highest median income of $62,015 per family member.
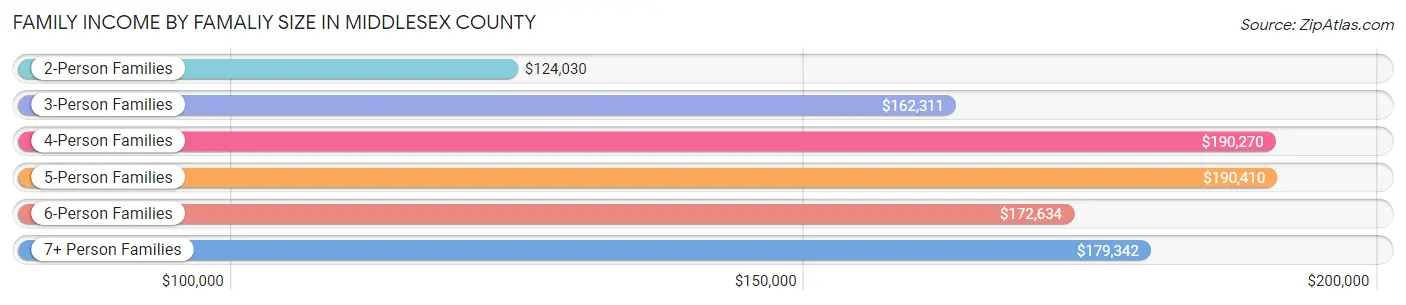
| Income Bracket | # Families | Median Income |
| 2-Person Families | 170,895 (43.0%) | $124,030 |
| 3-Person Families | 95,492 (24.0%) | $162,311 |
| 4-Person Families | 89,084 (22.4%) | $190,270 |
| 5-Person Families | 29,812 (7.5%) | $190,410 |
| 6-Person Families | 8,665 (2.2%) | $172,634 |
| 7+ Person Families | 3,832 (1.0%) | $179,342 |
| Total | 397,780 (100.0%) | $153,239 |
Family Income by Number of Earners in Middlesex County
The median family income in Middlesex County is $153,239, with families comprising 3+ earners (59,665) having the highest median family income of $203,564, while families with no earners (38,895) have the lowest median family income of $61,579, accounting for 15.0% and 9.8% of families, respectively.
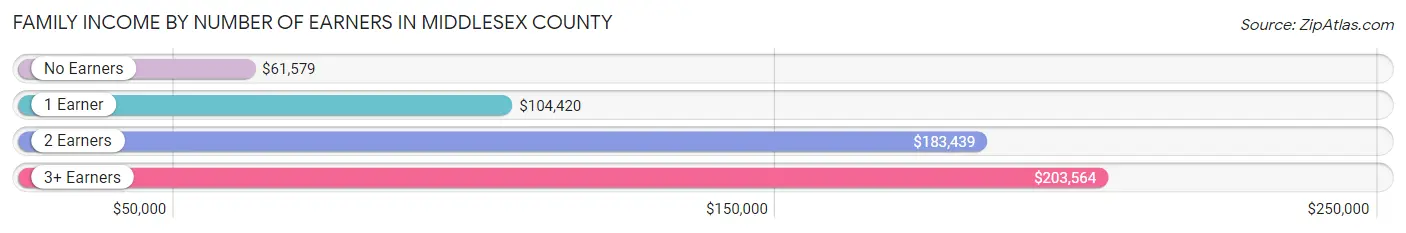
| Number of Earners | # Families | Median Income |
| No Earners | 38,895 (9.8%) | $61,579 |
| 1 Earner | 102,383 (25.7%) | $104,420 |
| 2 Earners | 196,837 (49.5%) | $183,439 |
| 3+ Earners | 59,665 (15.0%) | $203,564 |
| Total | 397,780 (100.0%) | $153,239 |
Household Income in Middlesex County
Household Income Brackets in Middlesex County
With 171,929 households falling in the category, the $200,000+ income range is the most frequent in Middlesex County, accounting for 27.3% of all households. In contrast, only 15,744 households (2.5%) fall into the $10,000 to $14,999 income bracket, making it the least populous group.

| Income Bracket | # Households | % Households |
| Less than $10,000 | 22,672 | 3.6% |
| $10,000 to $14,999 | 15,744 | 2.5% |
| $15,000 to $24,999 | 27,710 | 4.4% |
| $25,000 to $34,999 | 26,451 | 4.2% |
| $35,000 to $49,999 | 39,046 | 6.2% |
| $50,000 to $74,999 | 67,386 | 10.7% |
| $75,000 to $99,999 | 64,237 | 10.2% |
| $100,000 to $149,999 | 111,470 | 17.7% |
| $150,000 to $199,999 | 83,130 | 13.2% |
| $200,000+ | 171,929 | 27.3% |
Household Income by Householder Age in Middlesex County
The median household income in Middlesex County is $121,304, with the highest median household income of $148,680 found in the 45 to 64 years age bracket for the primary householder. A total of 235,968 households (37.5%) fall into this category. Meanwhile, the 15 to 24 years age bracket for the primary householder has the lowest median household income of $69,810, with 18,792 households (3.0%) in this group.
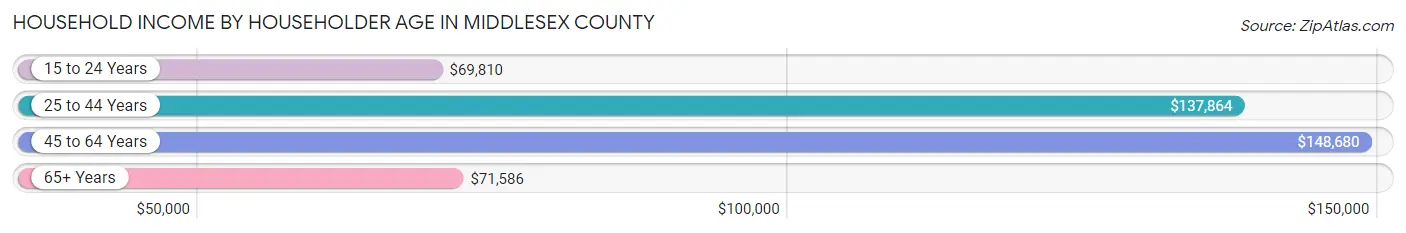
| Income Bracket | # Households | Median Income |
| 15 to 24 Years | 18,792 (3.0%) | $69,810 |
| 25 to 44 Years | 218,070 (34.6%) | $137,864 |
| 45 to 64 Years | 235,968 (37.5%) | $148,680 |
| 65+ Years | 156,945 (24.9%) | $71,586 |
| Total | 629,775 (100.0%) | $121,304 |
Poverty in Middlesex County
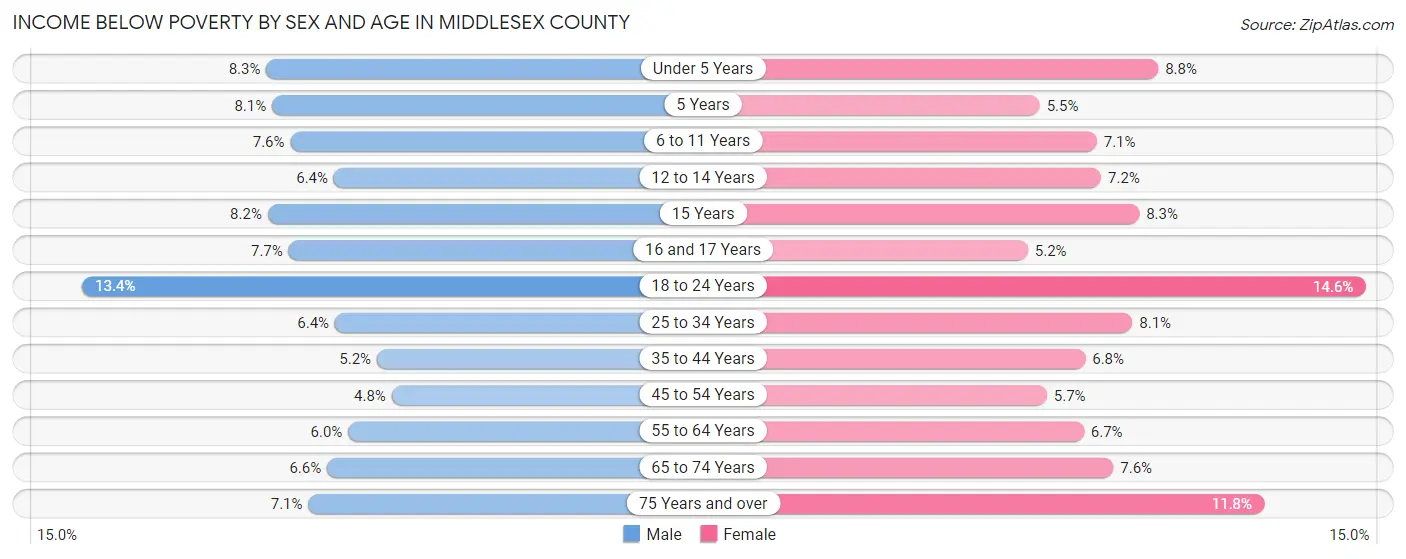
Income Below Poverty by Sex and Age in Middlesex County
With 6.9% poverty level for males and 8.0% for females among the residents of Middlesex County, 18 to 24 year old males and 18 to 24 year old females are the most vulnerable to poverty, with 8,728 males (13.4%) and 9,282 females (14.6%) in their respective age groups living below the poverty level.
| Age Bracket | Male | Female |
| Under 5 Years | 3,462 (8.3%) | 3,513 (8.8%) |
| 5 Years | 715 (8.1%) | 441 (5.5%) |
| 6 to 11 Years | 4,062 (7.6%) | 3,618 (7.1%) |
| 12 to 14 Years | 1,773 (6.4%) | 1,934 (7.2%) |
| 15 Years | 798 (8.2%) | 781 (8.3%) |
| 16 and 17 Years | 1,453 (7.6%) | 924 (5.2%) |
| 18 to 24 Years | 8,728 (13.4%) | 9,282 (14.6%) |
| 25 to 34 Years | 7,853 (6.4%) | 9,610 (8.1%) |
| 35 to 44 Years | 5,700 (5.2%) | 7,423 (6.8%) |
| 45 to 54 Years | 5,007 (4.8%) | 6,026 (5.7%) |
| 55 to 64 Years | 6,217 (6.0%) | 7,212 (6.7%) |
| 65 to 74 Years | 4,472 (6.6%) | 5,872 (7.6%) |
| 75 Years and over | 2,936 (7.1%) | 7,238 (11.7%) |
| Total | 53,176 (6.9%) | 63,874 (8.0%) |
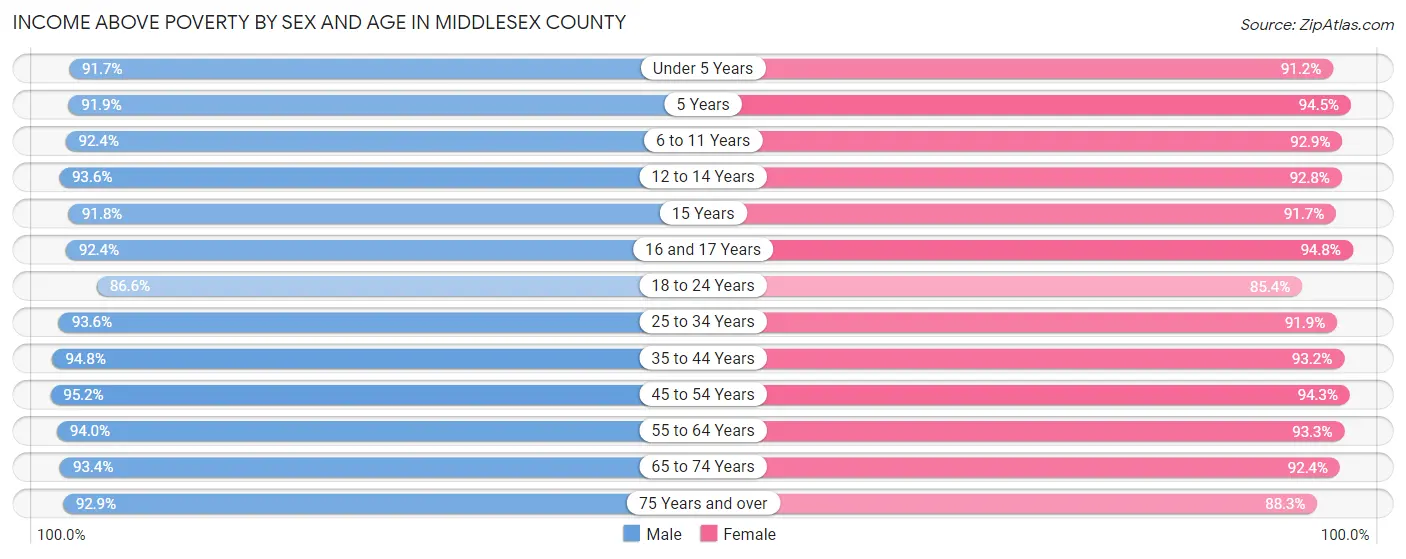
Income Above Poverty by Sex and Age in Middlesex County
According to the poverty statistics in Middlesex County, males aged 45 to 54 years and females aged 16 and 17 years are the age groups that are most secure financially, with 95.2% of males and 94.8% of females in these age groups living above the poverty line.
| Age Bracket | Male | Female |
| Under 5 Years | 38,404 (91.7%) | 36,355 (91.2%) |
| 5 Years | 8,099 (91.9%) | 7,564 (94.5%) |
| 6 to 11 Years | 49,365 (92.4%) | 47,366 (92.9%) |
| 12 to 14 Years | 25,968 (93.6%) | 24,857 (92.8%) |
| 15 Years | 8,901 (91.8%) | 8,647 (91.7%) |
| 16 and 17 Years | 17,532 (92.3%) | 16,926 (94.8%) |
| 18 to 24 Years | 56,393 (86.6%) | 54,421 (85.4%) |
| 25 to 34 Years | 115,660 (93.6%) | 109,191 (91.9%) |
| 35 to 44 Years | 104,138 (94.8%) | 102,087 (93.2%) |
| 45 to 54 Years | 99,645 (95.2%) | 99,596 (94.3%) |
| 55 to 64 Years | 97,541 (94.0%) | 99,750 (93.3%) |
| 65 to 74 Years | 63,446 (93.4%) | 71,824 (92.4%) |
| 75 Years and over | 38,435 (92.9%) | 54,362 (88.2%) |
| Total | 723,527 (93.1%) | 732,946 (92.0%) |
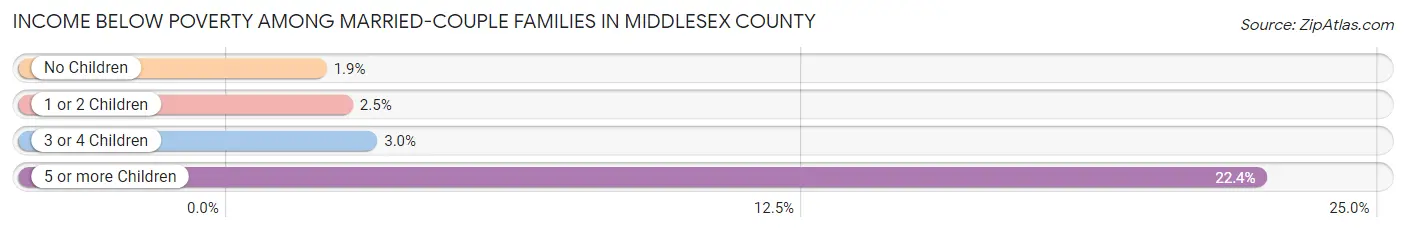
Income Below Poverty Among Married-Couple Families in Middlesex County
The poverty statistics for married-couple families in Middlesex County show that 2.3% or 7,134 of the total 316,163 families live below the poverty line. Families with 5 or more children have the highest poverty rate of 22.4%, comprising of 127 families. On the other hand, families with no children have the lowest poverty rate of 1.9%, which includes 3,356 families.
| Children | Above Poverty | Below Poverty |
| No Children | 170,142 (98.1%) | 3,356 (1.9%) |
| 1 or 2 Children | 120,772 (97.5%) | 3,099 (2.5%) |
| 3 or 4 Children | 17,675 (97.0%) | 552 (3.0%) |
| 5 or more Children | 440 (77.6%) | 127 (22.4%) |
| Total | 309,029 (97.7%) | 7,134 (2.3%) |
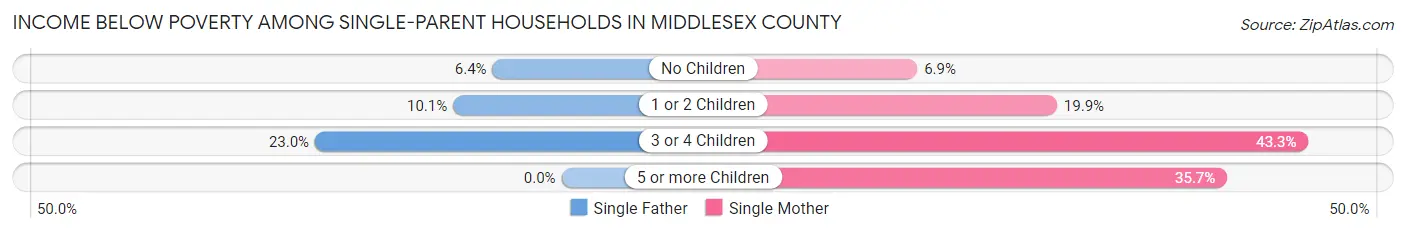
Income Below Poverty Among Single-Parent Households in Middlesex County
According to the poverty data in Middlesex County, 8.6% or 2,070 single-father households and 15.0% or 8,670 single-mother households are living below the poverty line. Among single-father households, those with 3 or 4 children have the highest poverty rate, with 239 households (23.0%) experiencing poverty. Likewise, among single-mother households, those with 3 or 4 children have the highest poverty rate, with 1,465 households (43.3%) falling below the poverty line.
| Children | Single Father | Single Mother |
| No Children | 851 (6.4%) | 1,882 (6.9%) |
| 1 or 2 Children | 980 (10.1%) | 5,293 (19.9%) |
| 3 or 4 Children | 239 (23.0%) | 1,465 (43.3%) |
| 5 or more Children | 0 (0.0%) | 30 (35.7%) |
| Total | 2,070 (8.6%) | 8,670 (15.0%) |
Income Below Poverty Among Married-Couple vs Single-Parent Households in Middlesex County
The poverty data for Middlesex County shows that 7,134 of the married-couple family households (2.3%) and 10,740 of the single-parent households (13.2%) are living below the poverty level. Within the married-couple family households, those with 5 or more children have the highest poverty rate, with 127 households (22.4%) falling below the poverty line. Among the single-parent households, those with 3 or 4 children have the highest poverty rate, with 1,704 household (38.5%) living below poverty.
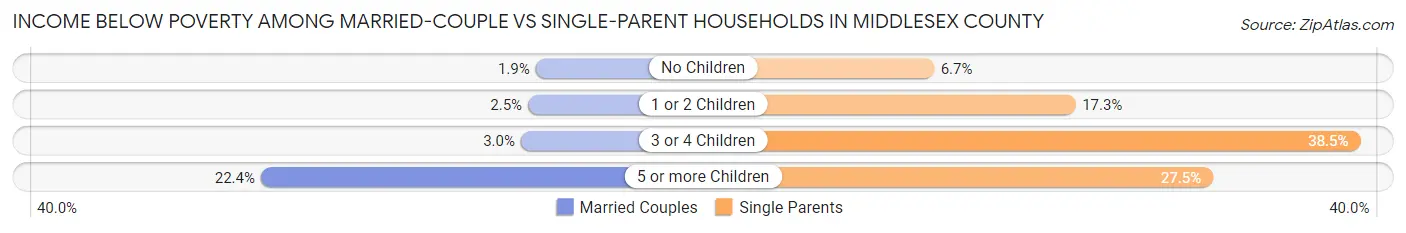
| Children | Married-Couple Families | Single-Parent Households |
| No Children | 3,356 (1.9%) | 2,733 (6.7%) |
| 1 or 2 Children | 3,099 (2.5%) | 6,273 (17.2%) |
| 3 or 4 Children | 552 (3.0%) | 1,704 (38.5%) |
| 5 or more Children | 127 (22.4%) | 30 (27.5%) |
| Total | 7,134 (2.3%) | 10,740 (13.2%) |
Race in Middlesex County
The most populous races in Middlesex County are White / Caucasian (1,154,437 | 71.1%), Asian (210,784 | 13.0%), and Hispanic or Latino (136,457 | 8.4%).
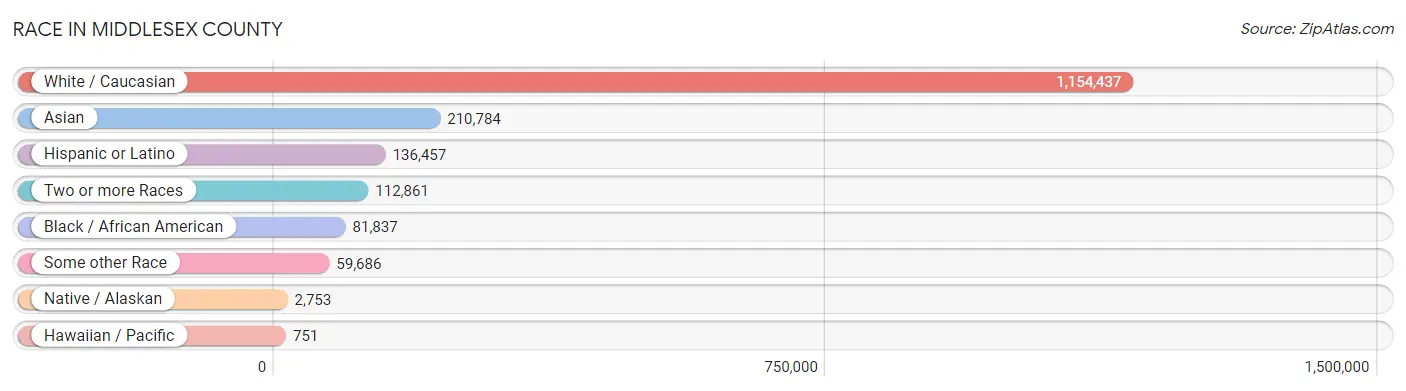
| Race | # Population | % Population |
| Asian | 210,784 | 13.0% |
| Black / African American | 81,837 | 5.0% |
| Hawaiian / Pacific | 751 | 0.1% |
| Hispanic or Latino | 136,457 | 8.4% |
| Native / Alaskan | 2,753 | 0.2% |
| White / Caucasian | 1,154,437 | 71.1% |
| Two or more Races | 112,861 | 7.0% |
| Some other Race | 59,686 | 3.7% |
| Total | 1,623,109 | 100.0% |
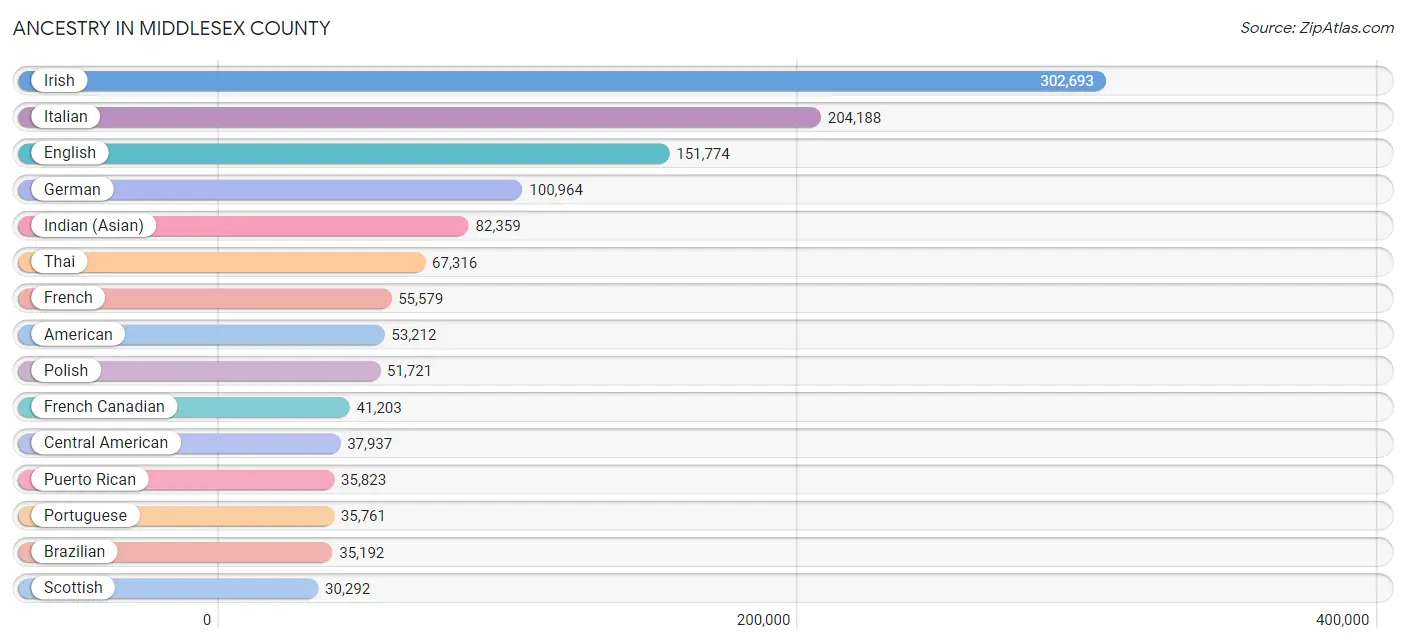
Ancestry in Middlesex County
The most populous ancestries reported in Middlesex County are Irish (302,693 | 18.6%), Italian (204,188 | 12.6%), English (151,774 | 9.3%), German (100,964 | 6.2%), and Indian (Asian) (82,359 | 5.1%), together accounting for 51.9% of all Middlesex County residents.
| Ancestry | # Population | % Population |
| Afghan | 241 | 0.0% |
| African | 8,046 | 0.5% |
| Alaska Native | 8 | 0.0% |
| Albanian | 3,371 | 0.2% |
| Alsatian | 58 | 0.0% |
| American | 53,212 | 3.3% |
| Apache | 37 | 0.0% |
| Arab | 19,007 | 1.2% |
| Argentinean | 1,986 | 0.1% |
| Armenian | 11,293 | 0.7% |
| Assyrian / Chaldean / Syriac | 103 | 0.0% |
| Australian | 498 | 0.0% |
| Austrian | 4,185 | 0.3% |
| Bahamian | 206 | 0.0% |
| Bangladeshi | 116 | 0.0% |
| Barbadian | 867 | 0.1% |
| Basque | 188 | 0.0% |
| Belgian | 1,623 | 0.1% |
| Belizean | 21 | 0.0% |
| Bermudan | 38 | 0.0% |
| Bhutanese | 8,142 | 0.5% |
| Blackfeet | 227 | 0.0% |
| Bolivian | 487 | 0.0% |
| Brazilian | 35,192 | 2.2% |
| British | 10,693 | 0.7% |
| British West Indian | 441 | 0.0% |
| Bulgarian | 1,824 | 0.1% |
| Burmese | 14,738 | 0.9% |
| Cajun | 91 | 0.0% |
| Cambodian | 111 | 0.0% |
| Canadian | 10,855 | 0.7% |
| Cape Verdean | 1,694 | 0.1% |
| Carpatho Rusyn | 64 | 0.0% |
| Celtic | 311 | 0.0% |
| Central American | 37,937 | 2.3% |
| Central American Indian | 1,969 | 0.1% |
| Cherokee | 1,238 | 0.1% |
| Cheyenne | 46 | 0.0% |
| Chickasaw | 91 | 0.0% |
| Chilean | 1,577 | 0.1% |
| Chinese | 18 | 0.0% |
| Chippewa | 104 | 0.0% |
| Choctaw | 95 | 0.0% |
| Colombian | 8,789 | 0.5% |
| Comanche | 9 | 0.0% |
| Costa Rican | 481 | 0.0% |
| Cree | 103 | 0.0% |
| Creek | 79 | 0.0% |
| Croatian | 1,373 | 0.1% |
| Crow | 15 | 0.0% |
| Cuban | 3,165 | 0.2% |
| Cypriot | 252 | 0.0% |
| Czech | 3,147 | 0.2% |
| Czechoslovakian | 540 | 0.0% |
| Danish | 4,328 | 0.3% |
| Delaware | 19 | 0.0% |
| Dominican | 11,003 | 0.7% |
| Dutch | 9,573 | 0.6% |
| Dutch West Indian | 20 | 0.0% |
| Eastern European | 15,133 | 0.9% |
| Ecuadorian | 3,317 | 0.2% |
| Egyptian | 2,064 | 0.1% |
| English | 151,774 | 9.3% |
| Estonian | 273 | 0.0% |
| Ethiopian | 3,197 | 0.2% |
| European | 24,580 | 1.5% |
| Filipino | 4,091 | 0.3% |
| Finnish | 4,252 | 0.3% |
| French | 55,579 | 3.4% |
| French American Indian | 222 | 0.0% |
| French Canadian | 41,203 | 2.5% |
| German | 100,964 | 6.2% |
| German Russian | 59 | 0.0% |
| Ghanaian | 1,099 | 0.1% |
| Greek | 22,934 | 1.4% |
| Guamanian / Chamorro | 343 | 0.0% |
| Guatemalan | 13,780 | 0.9% |
| Guyanese | 419 | 0.0% |
| Haitian | 16,694 | 1.0% |
| Honduran | 2,897 | 0.2% |
| Hopi | 35 | 0.0% |
| Houma | 16 | 0.0% |
| Hungarian | 5,496 | 0.3% |
| Icelander | 252 | 0.0% |
| Indian (Asian) | 82,359 | 5.1% |
| Indonesian | 781 | 0.1% |
| Inupiat | 72 | 0.0% |
| Iranian | 4,484 | 0.3% |
| Iraqi | 964 | 0.1% |
| Irish | 302,693 | 18.6% |
| Iroquois | 247 | 0.0% |
| Israeli | 1,955 | 0.1% |
| Italian | 204,188 | 12.6% |
| Jamaican | 3,765 | 0.2% |
| Japanese | 18,942 | 1.2% |
| Jordanian | 440 | 0.0% |
| Kenyan | 2,178 | 0.1% |
| Korean | 7,337 | 0.4% |
| Laotian | 2,213 | 0.1% |
| Latvian | 1,100 | 0.1% |
| Lebanese | 5,423 | 0.3% |
| Liberian | 959 | 0.1% |
| Lithuanian | 9,352 | 0.6% |
| Lumbee | 32 | 0.0% |
| Luxembourger | 83 | 0.0% |
| Macedonian | 127 | 0.0% |
| Malaysian | 1,888 | 0.1% |
| Maltese | 219 | 0.0% |
| Mexican | 12,959 | 0.8% |
| Mexican American Indian | 702 | 0.0% |
| Mongolian | 622 | 0.0% |
| Moroccan | 2,937 | 0.2% |
| Native Hawaiian | 482 | 0.0% |
| Navajo | 88 | 0.0% |
| New Zealander | 283 | 0.0% |
| Nicaraguan | 467 | 0.0% |
| Nigerian | 2,689 | 0.2% |
| Northern European | 3,248 | 0.2% |
| Norwegian | 8,838 | 0.5% |
| Okinawan | 253 | 0.0% |
| Osage | 114 | 0.0% |
| Ottawa | 7 | 0.0% |
| Pakistani | 1,734 | 0.1% |
| Palestinian | 1,072 | 0.1% |
| Panamanian | 874 | 0.1% |
| Paraguayan | 173 | 0.0% |
| Pennsylvania German | 153 | 0.0% |
| Peruvian | 2,813 | 0.2% |
| Polish | 51,721 | 3.2% |
| Portuguese | 35,761 | 2.2% |
| Potawatomi | 10 | 0.0% |
| Pueblo | 21 | 0.0% |
| Puerto Rican | 35,823 | 2.2% |
| Romanian | 3,028 | 0.2% |
| Russian | 29,362 | 1.8% |
| Salvadoran | 18,840 | 1.2% |
| Samoan | 273 | 0.0% |
| Scandinavian | 2,964 | 0.2% |
| Scotch-Irish | 10,959 | 0.7% |
| Scottish | 30,292 | 1.9% |
| Seminole | 30 | 0.0% |
| Senegalese | 23 | 0.0% |
| Serbian | 774 | 0.1% |
| Shoshone | 8 | 0.0% |
| Sierra Leonean | 642 | 0.0% |
| Sioux | 304 | 0.0% |
| Slavic | 423 | 0.0% |
| Slovak | 2,047 | 0.1% |
| Slovene | 541 | 0.0% |
| Somali | 30 | 0.0% |
| South African | 563 | 0.0% |
| South American | 22,058 | 1.4% |
| South American Indian | 329 | 0.0% |
| Spaniard | 2,670 | 0.2% |
| Spanish | 3,055 | 0.2% |
| Spanish American | 127 | 0.0% |
| Spanish American Indian | 12 | 0.0% |
| Sri Lankan | 15,931 | 1.0% |
| Subsaharan African | 25,598 | 1.6% |
| Sudanese | 207 | 0.0% |
| Swedish | 18,538 | 1.1% |
| Swiss | 3,360 | 0.2% |
| Syrian | 1,829 | 0.1% |
| Taiwanese | 10 | 0.0% |
| Thai | 67,316 | 4.2% |
| Tlingit-Haida | 55 | 0.0% |
| Tongan | 11 | 0.0% |
| Trinidadian and Tobagonian | 667 | 0.0% |
| Turkish | 2,781 | 0.2% |
| U.S. Virgin Islander | 84 | 0.0% |
| Ugandan | 3,079 | 0.2% |
| Ukrainian | 8,047 | 0.5% |
| Uruguayan | 263 | 0.0% |
| Venezuelan | 2,180 | 0.1% |
| Vietnamese | 1,824 | 0.1% |
| Welsh | 6,659 | 0.4% |
| West Indian | 960 | 0.1% |
| Yugoslavian | 783 | 0.1% |
| Zimbabwean | 52 | 0.0% | View All 179 Rows |
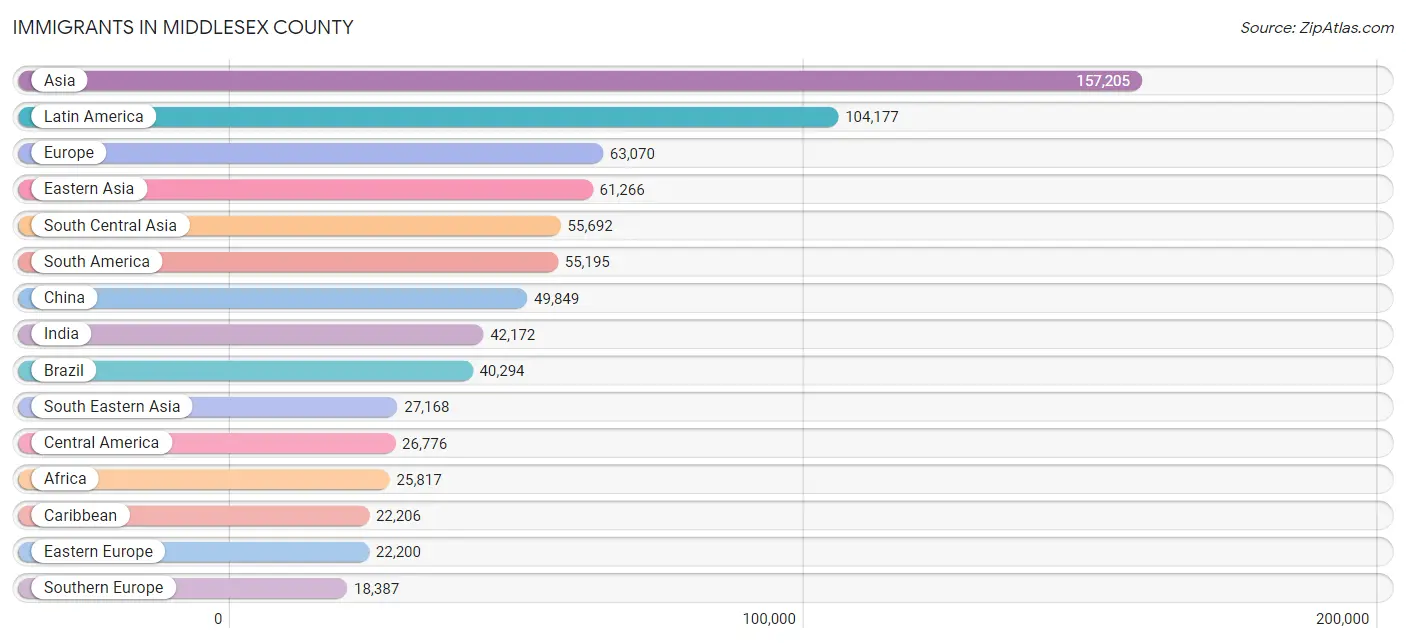
Immigrants in Middlesex County
The most numerous immigrant groups reported in Middlesex County came from Asia (157,205 | 9.7%), Latin America (104,177 | 6.4%), Europe (63,070 | 3.9%), Eastern Asia (61,266 | 3.8%), and South Central Asia (55,692 | 3.4%), together accounting for 27.2% of all Middlesex County residents.
| Immigration Origin | # Population | % Population |
| Afghanistan | 263 | 0.0% |
| Africa | 25,817 | 1.6% |
| Albania | 1,561 | 0.1% |
| Argentina | 1,442 | 0.1% |
| Armenia | 1,220 | 0.1% |
| Asia | 157,205 | 9.7% |
| Australia | 1,107 | 0.1% |
| Austria | 187 | 0.0% |
| Azores | 1,423 | 0.1% |
| Bahamas | 146 | 0.0% |
| Bangladesh | 1,916 | 0.1% |
| Barbados | 455 | 0.0% |
| Belarus | 710 | 0.0% |
| Belgium | 538 | 0.0% |
| Bolivia | 380 | 0.0% |
| Bosnia and Herzegovina | 582 | 0.0% |
| Brazil | 40,294 | 2.5% |
| Bulgaria | 1,344 | 0.1% |
| Cabo Verde | 625 | 0.0% |
| Cambodia | 9,103 | 0.6% |
| Cameroon | 588 | 0.0% |
| Canada | 9,013 | 0.6% |
| Caribbean | 22,206 | 1.4% |
| Central America | 26,776 | 1.7% |
| Chile | 1,019 | 0.1% |
| China | 49,849 | 3.1% |
| Colombia | 5,969 | 0.4% |
| Congo | 61 | 0.0% |
| Costa Rica | 377 | 0.0% |
| Croatia | 153 | 0.0% |
| Cuba | 504 | 0.0% |
| Czechoslovakia | 748 | 0.1% |
| Denmark | 493 | 0.0% |
| Dominica | 104 | 0.0% |
| Dominican Republic | 5,314 | 0.3% |
| Eastern Africa | 10,993 | 0.7% |
| Eastern Asia | 61,266 | 3.8% |
| Eastern Europe | 22,200 | 1.4% |
| Ecuador | 2,261 | 0.1% |
| Egypt | 1,758 | 0.1% |
| El Salvador | 11,774 | 0.7% |
| England | 3,341 | 0.2% |
| Eritrea | 463 | 0.0% |
| Ethiopia | 2,827 | 0.2% |
| Europe | 63,070 | 3.9% |
| Fiji | 67 | 0.0% |
| France | 3,347 | 0.2% |
| Germany | 3,883 | 0.2% |
| Ghana | 1,368 | 0.1% |
| Greece | 2,984 | 0.2% |
| Grenada | 87 | 0.0% |
| Guatemala | 8,619 | 0.5% |
| Guyana | 223 | 0.0% |
| Haiti | 12,873 | 0.8% |
| Honduras | 1,915 | 0.1% |
| Hong Kong | 3,259 | 0.2% |
| Hungary | 908 | 0.1% |
| India | 42,172 | 2.6% |
| Indonesia | 1,215 | 0.1% |
| Iran | 3,549 | 0.2% |
| Iraq | 1,035 | 0.1% |
| Ireland | 3,071 | 0.2% |
| Israel | 2,713 | 0.2% |
| Italy | 6,378 | 0.4% |
| Jamaica | 1,717 | 0.1% |
| Japan | 3,349 | 0.2% |
| Jordan | 438 | 0.0% |
| Kazakhstan | 243 | 0.0% |
| Kenya | 3,125 | 0.2% |
| Korea | 8,014 | 0.5% |
| Kuwait | 365 | 0.0% |
| Laos | 858 | 0.1% |
| Latin America | 104,177 | 6.4% |
| Latvia | 257 | 0.0% |
| Lebanon | 2,089 | 0.1% |
| Liberia | 847 | 0.1% |
| Lithuania | 435 | 0.0% |
| Malaysia | 642 | 0.0% |
| Mexico | 3,487 | 0.2% |
| Micronesia | 58 | 0.0% |
| Middle Africa | 796 | 0.1% |
| Moldova | 897 | 0.1% |
| Morocco | 2,655 | 0.2% |
| Nepal | 3,294 | 0.2% |
| Netherlands | 1,007 | 0.1% |
| Nicaragua | 137 | 0.0% |
| Nigeria | 1,928 | 0.1% |
| North Macedonia | 54 | 0.0% |
| Northern Africa | 5,685 | 0.4% |
| Northern Europe | 12,715 | 0.8% |
| Norway | 145 | 0.0% |
| Oceania | 1,715 | 0.1% |
| Pakistan | 2,697 | 0.2% |
| Panama | 268 | 0.0% |
| Peru | 1,747 | 0.1% |
| Philippines | 3,010 | 0.2% |
| Poland | 1,777 | 0.1% |
| Portugal | 7,850 | 0.5% |
| Romania | 936 | 0.1% |
| Russia | 6,501 | 0.4% |
| Saudi Arabia | 867 | 0.1% |
| Scotland | 371 | 0.0% |
| Senegal | 61 | 0.0% |
| Serbia | 378 | 0.0% |
| Sierra Leone | 421 | 0.0% |
| Singapore | 702 | 0.0% |
| Somalia | 30 | 0.0% |
| South Africa | 1,273 | 0.1% |
| South America | 55,195 | 3.4% |
| South Central Asia | 55,692 | 3.4% |
| South Eastern Asia | 27,168 | 1.7% |
| Southern Europe | 18,387 | 1.1% |
| Spain | 1,126 | 0.1% |
| Sri Lanka | 961 | 0.1% |
| Sudan | 271 | 0.0% |
| Sweden | 504 | 0.0% |
| Switzerland | 664 | 0.0% |
| Syria | 889 | 0.1% |
| Taiwan | 4,606 | 0.3% |
| Thailand | 2,263 | 0.1% |
| Trinidad and Tobago | 513 | 0.0% |
| Turkey | 2,305 | 0.1% |
| Uganda | 3,903 | 0.2% |
| Ukraine | 3,492 | 0.2% |
| Uruguay | 207 | 0.0% |
| Uzbekistan | 217 | 0.0% |
| Venezuela | 1,466 | 0.1% |
| Vietnam | 8,638 | 0.5% |
| West Indies | 92 | 0.0% |
| Western Africa | 5,923 | 0.4% |
| Western Asia | 12,859 | 0.8% |
| Western Europe | 9,626 | 0.6% |
| Yemen | 79 | 0.0% |
| Zaire | 61 | 0.0% |
| Zimbabwe | 334 | 0.0% | View All 135 Rows |
Sex and Age in Middlesex County
Sex and Age in Middlesex County
The most populous age groups in Middlesex County are 25 to 29 Years (63,462 | 7.9%) for men and 30 to 34 Years (60,477 | 7.4%) for women.
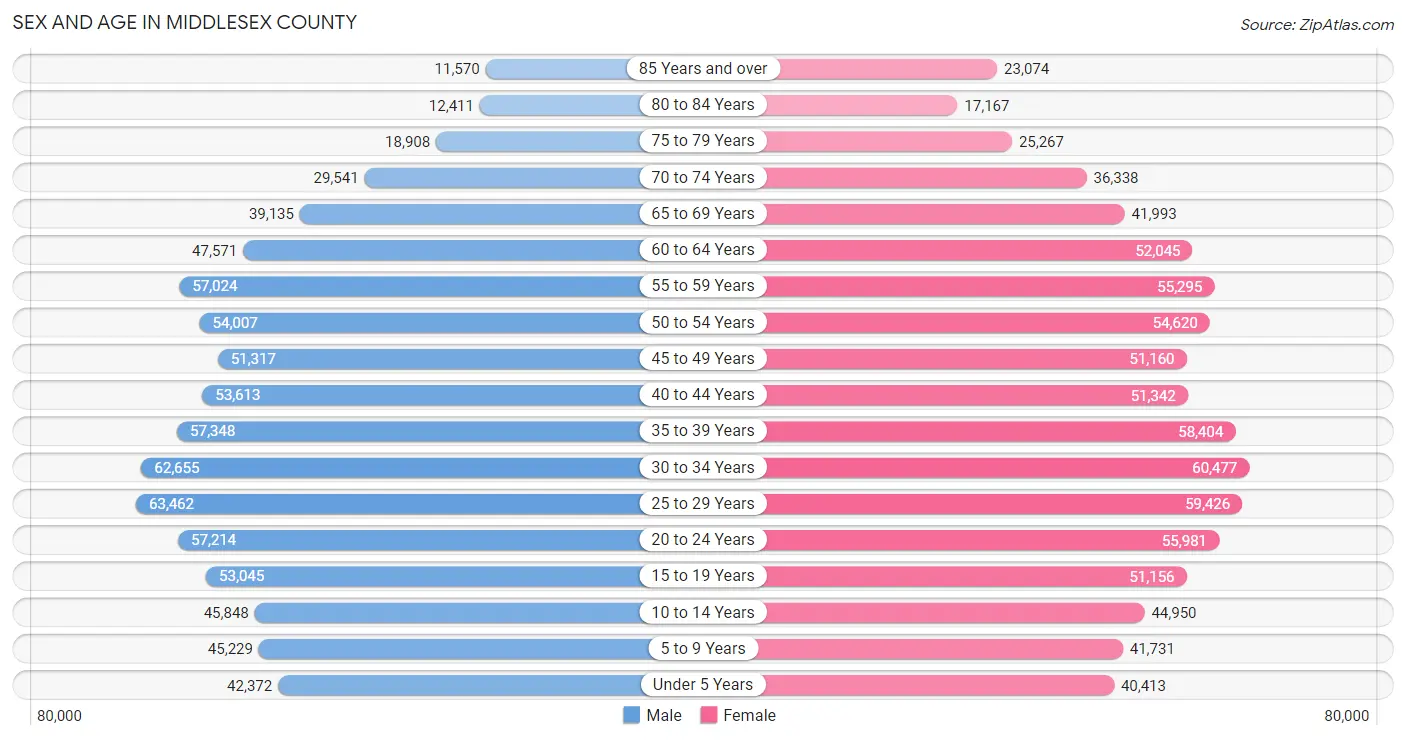
| Age Bracket | Male | Female |
| Under 5 Years | 42,372 (5.3%) | 40,413 (4.9%) |
| 5 to 9 Years | 45,229 (5.6%) | 41,731 (5.1%) |
| 10 to 14 Years | 45,848 (5.7%) | 44,950 (5.5%) |
| 15 to 19 Years | 53,045 (6.6%) | 51,156 (6.2%) |
| 20 to 24 Years | 57,214 (7.1%) | 55,981 (6.8%) |
| 25 to 29 Years | 63,462 (7.9%) | 59,426 (7.2%) |
| 30 to 34 Years | 62,655 (7.8%) | 60,477 (7.4%) |
| 35 to 39 Years | 57,348 (7.1%) | 58,404 (7.1%) |
| 40 to 44 Years | 53,613 (6.7%) | 51,342 (6.2%) |
| 45 to 49 Years | 51,317 (6.4%) | 51,160 (6.2%) |
| 50 to 54 Years | 54,007 (6.7%) | 54,620 (6.7%) |
| 55 to 59 Years | 57,024 (7.1%) | 55,295 (6.7%) |
| 60 to 64 Years | 47,571 (5.9%) | 52,045 (6.3%) |
| 65 to 69 Years | 39,135 (4.9%) | 41,993 (5.1%) |
| 70 to 74 Years | 29,541 (3.7%) | 36,338 (4.4%) |
| 75 to 79 Years | 18,908 (2.4%) | 25,267 (3.1%) |
| 80 to 84 Years | 12,411 (1.5%) | 17,167 (2.1%) |
| 85 Years and over | 11,570 (1.4%) | 23,074 (2.8%) |
| Total | 802,270 (100.0%) | 820,839 (100.0%) |
Families and Households in Middlesex County
Median Family Size in Middlesex County
The median family size in Middlesex County is 3.07 persons per family, with married-couple families (316,163 | 79.5%) accounting for the largest median family size of 3.16 persons per family. On the other hand, single male/father families (23,997 | 6.0%) represent the smallest median family size with 2.63 persons per family.
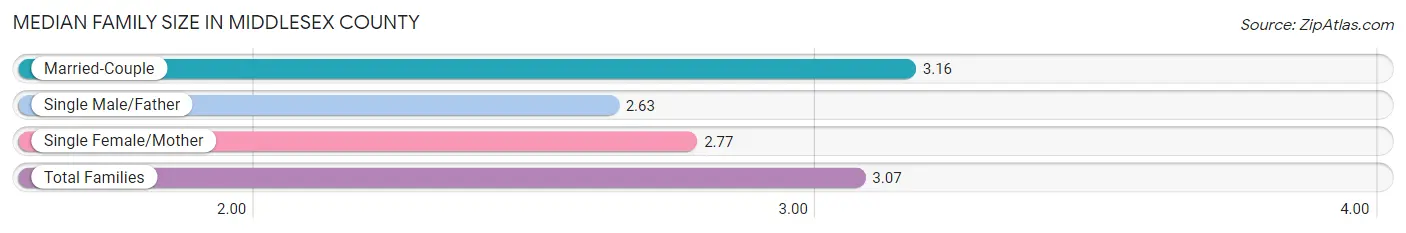
| Family Type | # Families | Family Size |
| Married-Couple | 316,163 (79.5%) | 3.16 |
| Single Male/Father | 23,997 (6.0%) | 2.63 |
| Single Female/Mother | 57,620 (14.5%) | 2.77 |
| Total Families | 397,780 (100.0%) | 3.07 |
Median Household Size in Middlesex County
The median household size in Middlesex County is 2.49 persons per household, with married-couple households (316,163 | 50.2%) accounting for the largest median household size of 3.19 persons per household. non-family households (231,995 | 36.8%) represent the smallest median household size with 1.38 persons per household.
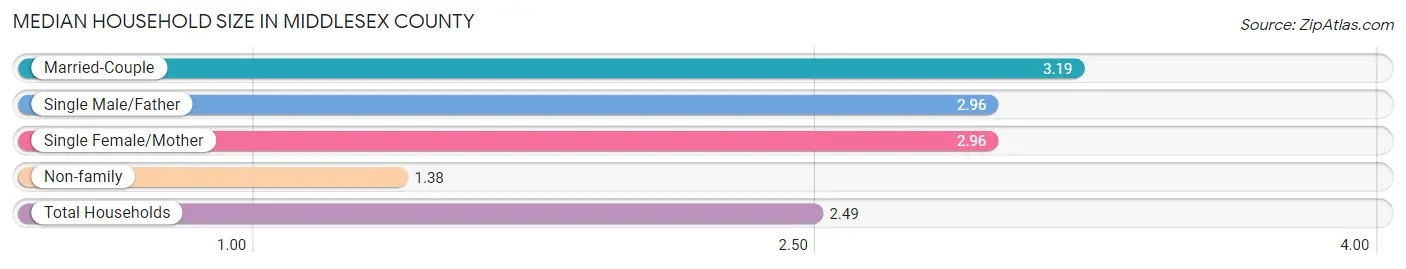
| Household Type | # Households | Household Size |
| Married-Couple | 316,163 (50.2%) | 3.19 |
| Single Male/Father | 23,997 (3.8%) | 2.96 |
| Single Female/Mother | 57,620 (9.1%) | 2.96 |
| Non-family | 231,995 (36.8%) | 1.38 |
| Total Households | 629,775 (100.0%) | 2.49 |
Household Size by Marriage Status in Middlesex County
Out of a total of 629,775 households in Middlesex County, 397,780 (63.2%) are family households, while 231,995 (36.8%) are nonfamily households. The most numerous type of family households are 2-person households, comprising 160,348, and the most common type of nonfamily households are 1-person households, comprising 165,986.
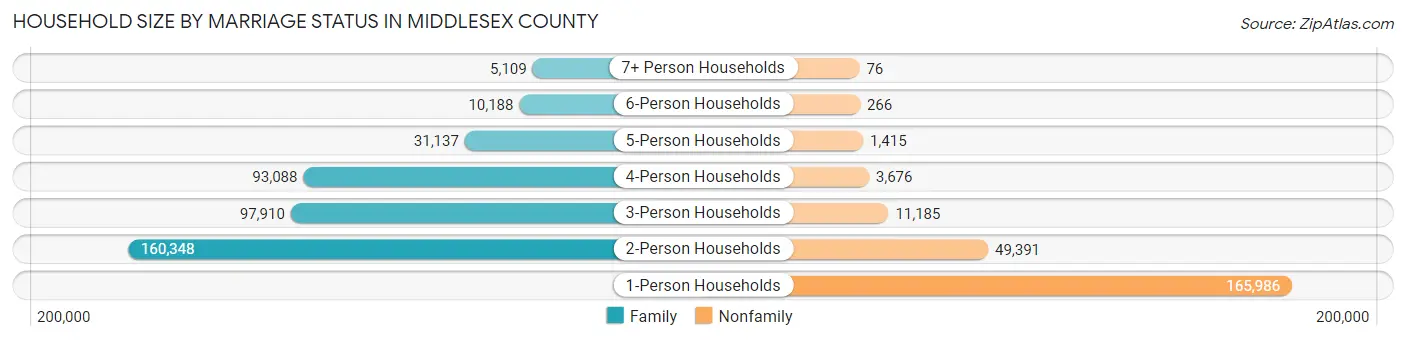
| Household Size | Family Households | Nonfamily Households |
| 1-Person Households | - | 165,986 (26.4%) |
| 2-Person Households | 160,348 (25.5%) | 49,391 (7.8%) |
| 3-Person Households | 97,910 (15.5%) | 11,185 (1.8%) |
| 4-Person Households | 93,088 (14.8%) | 3,676 (0.6%) |
| 5-Person Households | 31,137 (4.9%) | 1,415 (0.2%) |
| 6-Person Households | 10,188 (1.6%) | 266 (0.0%) |
| 7+ Person Households | 5,109 (0.8%) | 76 (0.0%) |
| Total | 397,780 (63.2%) | 231,995 (36.8%) |
Female Fertility in Middlesex County
Fertility by Age in Middlesex County
Average fertility rate in Middlesex County is 45.0 births per 1,000 women. Women in the age bracket of 20 to 34 years have the highest fertility rate with 54.0 births per 1,000 women. Women in the age bracket of 20 to 34 years acount for 53.5% of all women with births.
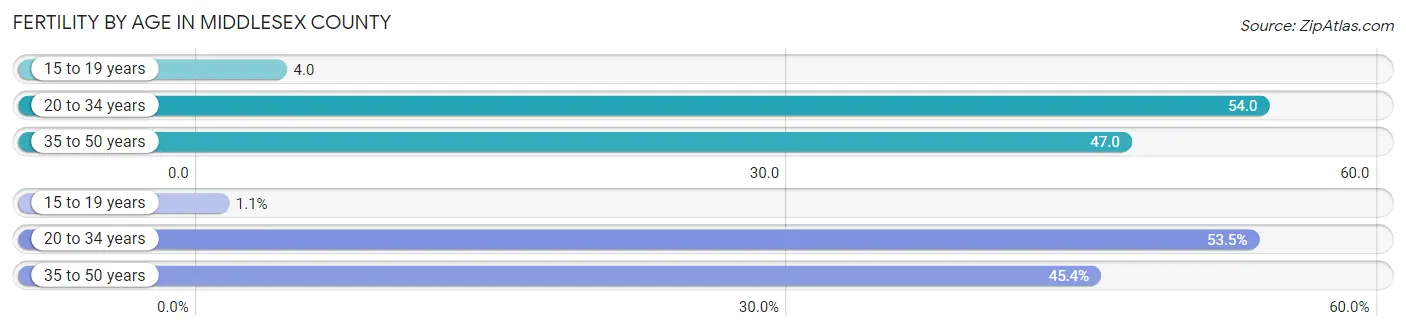
| Age Bracket | Women with Births | Births / 1,000 Women |
| 15 to 19 years | 190 (1.1%) | 4.0 |
| 20 to 34 years | 9,556 (53.5%) | 54.0 |
| 35 to 50 years | 8,117 (45.4%) | 47.0 |
| Total | 17,863 (100.0%) | 45.0 |
Fertility by Age by Marriage Status in Middlesex County
81.3% of women with births (17,863) in Middlesex County are married. The highest percentage of unmarried women with births falls into 15 to 19 years age bracket with 43.2% of them unmarried at the time of birth, while the lowest percentage of unmarried women with births belong to 35 to 50 years age bracket with 10.8% of them unmarried.
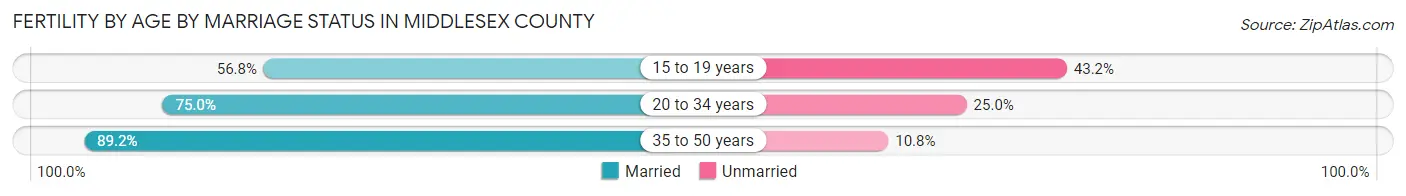
| Age Bracket | Married | Unmarried |
| 15 to 19 years | 108 (56.8%) | 82 (43.2%) |
| 20 to 34 years | 7,167 (75.0%) | 2,389 (25.0%) |
| 35 to 50 years | 7,240 (89.2%) | 877 (10.8%) |
| Total | 14,523 (81.3%) | 3,340 (18.7%) |
Fertility by Education in Middlesex County
Average fertility rate in Middlesex County is 45.0 births per 1,000 women. Women with the education attainment of graduate degree have the highest fertility rate of 60.0 births per 1,000 women, while women with the education attainment of less than high school have the lowest fertility at 23.0 births per 1,000 women. Women with the education attainment of graduate degree represent 36.1% of all women with births.
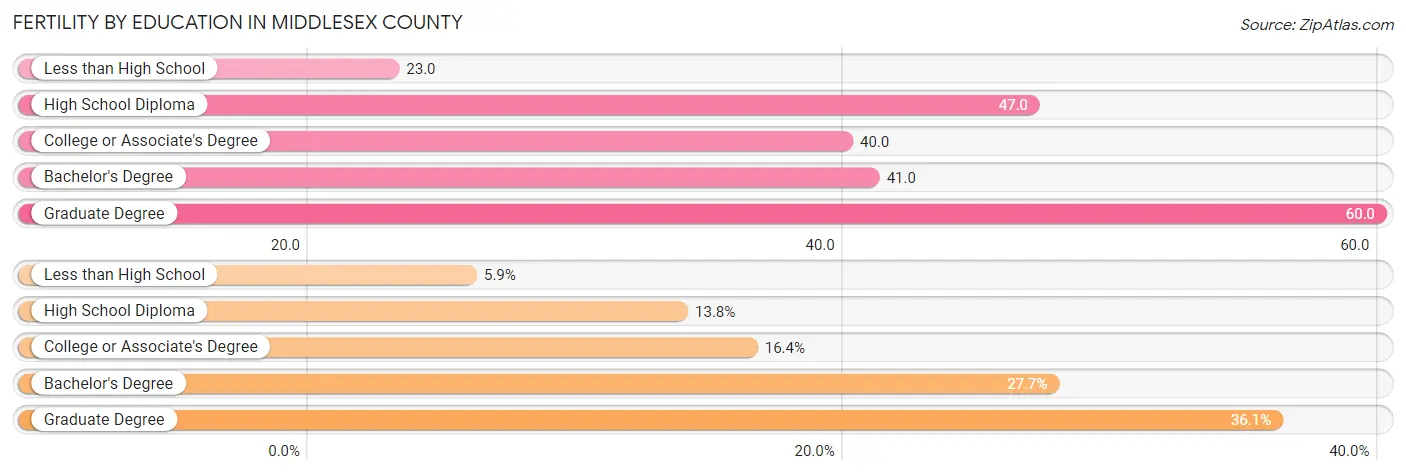
| Educational Attainment | Women with Births | Births / 1,000 Women |
| Less than High School | 1,056 (5.9%) | 23.0 |
| High School Diploma | 2,468 (13.8%) | 47.0 |
| College or Associate's Degree | 2,935 (16.4%) | 40.0 |
| Bachelor's Degree | 4,953 (27.7%) | 41.0 |
| Graduate Degree | 6,451 (36.1%) | 60.0 |
| Total | 17,863 (100.0%) | 45.0 |
Fertility by Education by Marriage Status in Middlesex County
18.7% of women with births in Middlesex County are unmarried. Women with the educational attainment of graduate degree are most likely to be married with 97.3% of them married at childbirth, while women with the educational attainment of high school diploma are least likely to be married with 47.0% of them unmarried at childbirth.
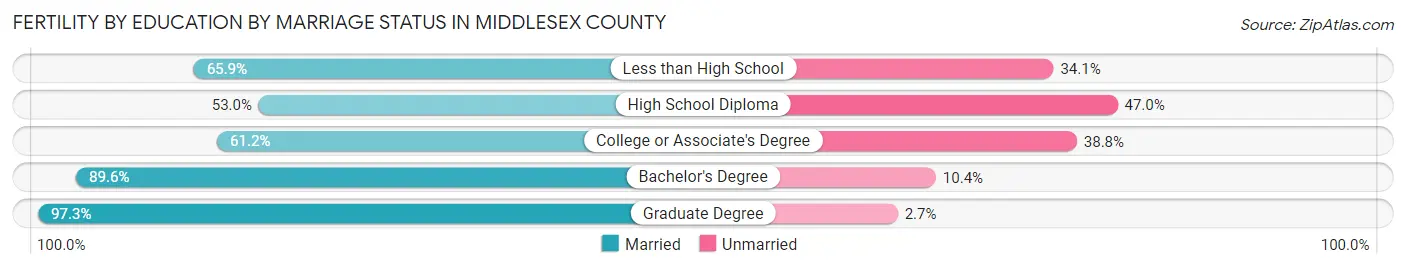
| Educational Attainment | Married | Unmarried |
| Less than High School | 696 (65.9%) | 360 (34.1%) |
| High School Diploma | 1,308 (53.0%) | 1,160 (47.0%) |
| College or Associate's Degree | 1,796 (61.2%) | 1,139 (38.8%) |
| Bachelor's Degree | 4,438 (89.6%) | 515 (10.4%) |
| Graduate Degree | 6,277 (97.3%) | 174 (2.7%) |
| Total | 14,523 (81.3%) | 3,340 (18.7%) |
Employment Characteristics in Middlesex County
Employment by Class of Employer in Middlesex County
Among the 881,099 employed individuals in Middlesex County, private company employees (576,419 | 65.4%), not-for-profit organizations (131,822 | 15.0%), and local government employees (53,700 | 6.1%) make up the most common classes of employment.
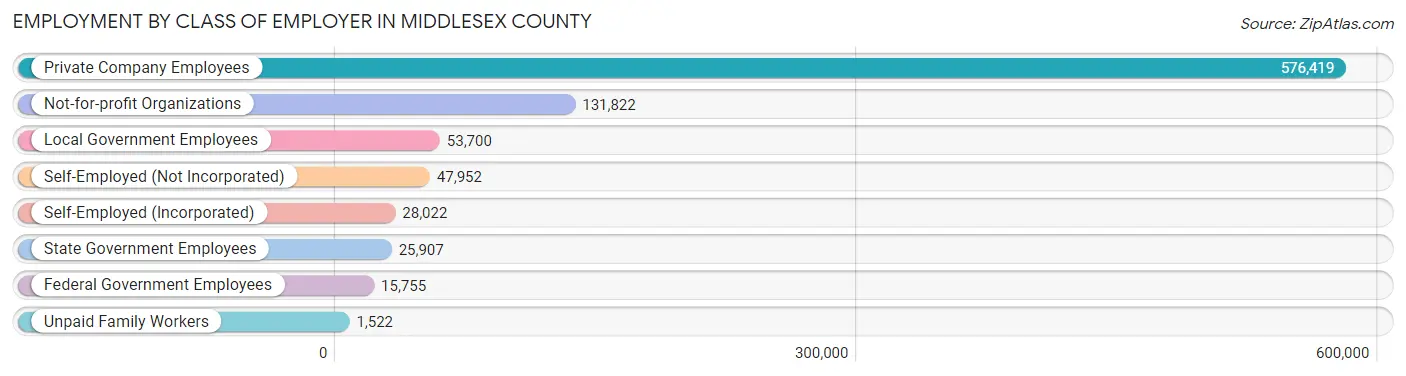
| Employer Class | # Employees | % Employees |
| Private Company Employees | 576,419 | 65.4% |
| Self-Employed (Incorporated) | 28,022 | 3.2% |
| Self-Employed (Not Incorporated) | 47,952 | 5.4% |
| Not-for-profit Organizations | 131,822 | 15.0% |
| Local Government Employees | 53,700 | 6.1% |
| State Government Employees | 25,907 | 2.9% |
| Federal Government Employees | 15,755 | 1.8% |
| Unpaid Family Workers | 1,522 | 0.2% |
| Total | 881,099 | 100.0% |
Employment Status by Age in Middlesex County
According to the labor force statistics for Middlesex County, out of the total population over 16 years of age (1,343,347), 69.9% or 939,000 individuals are in the labor force, with 4.4% or 41,316 of them unemployed. The age group with the highest labor force participation rate is 25 to 29 years, with 88.5% or 108,756 individuals in the labor force. Within the labor force, the 16 to 19 years age range has the highest percentage of unemployed individuals, with 11.3% or 3,688 of them being unemployed.
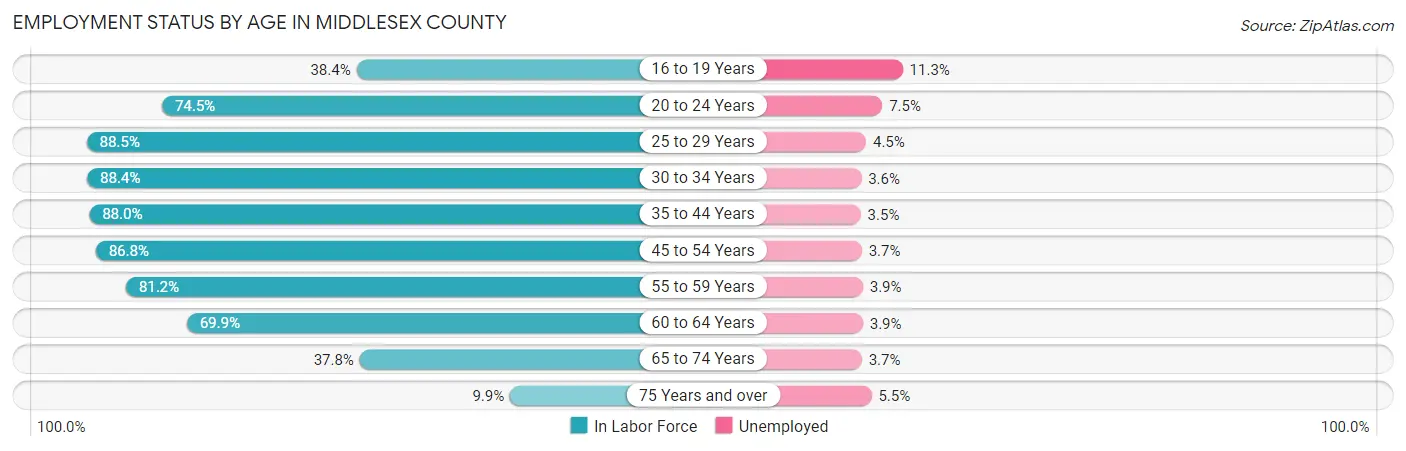
| Age Bracket | In Labor Force | Unemployed |
| 16 to 19 Years | 32,633 (38.4%) | 3,688 (11.3%) |
| 20 to 24 Years | 84,330 (74.5%) | 6,325 (7.5%) |
| 25 to 29 Years | 108,756 (88.5%) | 4,894 (4.5%) |
| 30 to 34 Years | 108,849 (88.4%) | 3,919 (3.6%) |
| 35 to 44 Years | 194,222 (88.0%) | 6,798 (3.5%) |
| 45 to 54 Years | 183,238 (86.8%) | 6,780 (3.7%) |
| 55 to 59 Years | 91,203 (81.2%) | 3,557 (3.9%) |
| 60 to 64 Years | 69,632 (69.9%) | 2,716 (3.9%) |
| 65 to 74 Years | 55,569 (37.8%) | 2,056 (3.7%) |
| 75 Years and over | 10,731 (9.9%) | 590 (5.5%) |
| Total | 939,000 (69.9%) | 41,316 (4.4%) |
Employment Status by Educational Attainment in Middlesex County
According to labor force statistics for Middlesex County, 85.0% of individuals (756,301) out of the total population between 25 and 64 years of age (889,766) are in the labor force, with 3.8% or 28,739 of them being unemployed. The group with the highest labor force participation rate are those with the educational attainment of bachelor's degree or higher, with 89.7% or 496,858 individuals in the labor force. Within the labor force, individuals with less than high school education have the highest percentage of unemployment, with 9.2% or 2,971 of them being unemployed.
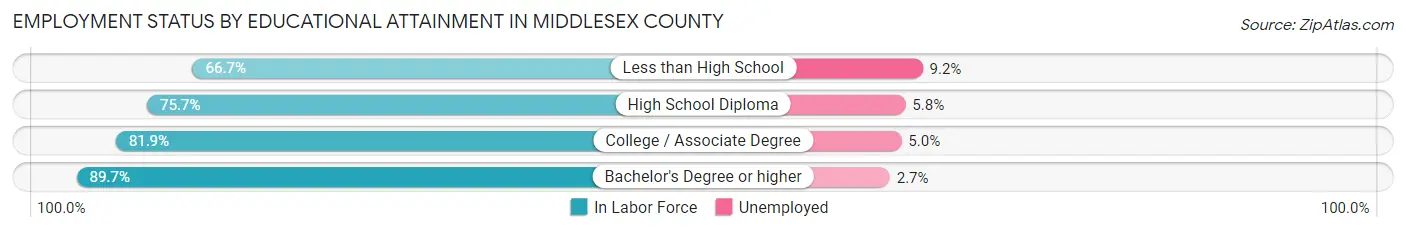
| Educational Attainment | In Labor Force | Unemployed |
| Less than High School | 32,293 (66.7%) | 4,454 (9.2%) |
| High School Diploma | 105,366 (75.7%) | 8,073 (5.8%) |
| College / Associate Degree | 121,418 (81.9%) | 7,413 (5.0%) |
| Bachelor's Degree or higher | 496,858 (89.7%) | 14,956 (2.7%) |
| Total | 756,301 (85.0%) | 33,811 (3.8%) |
Employment Occupations by Sex in Middlesex County
Management, Business, Science and Arts Occupations
The most common Management, Business, Science and Arts occupations in Middlesex County are Computers, Engineering & Science (145,713 | 16.3%), Community & Social Service (133,549 | 14.9%), Management (128,731 | 14.4%), Education Instruction & Library (76,713 | 8.6%), and Business & Financial (73,458 | 8.2%).
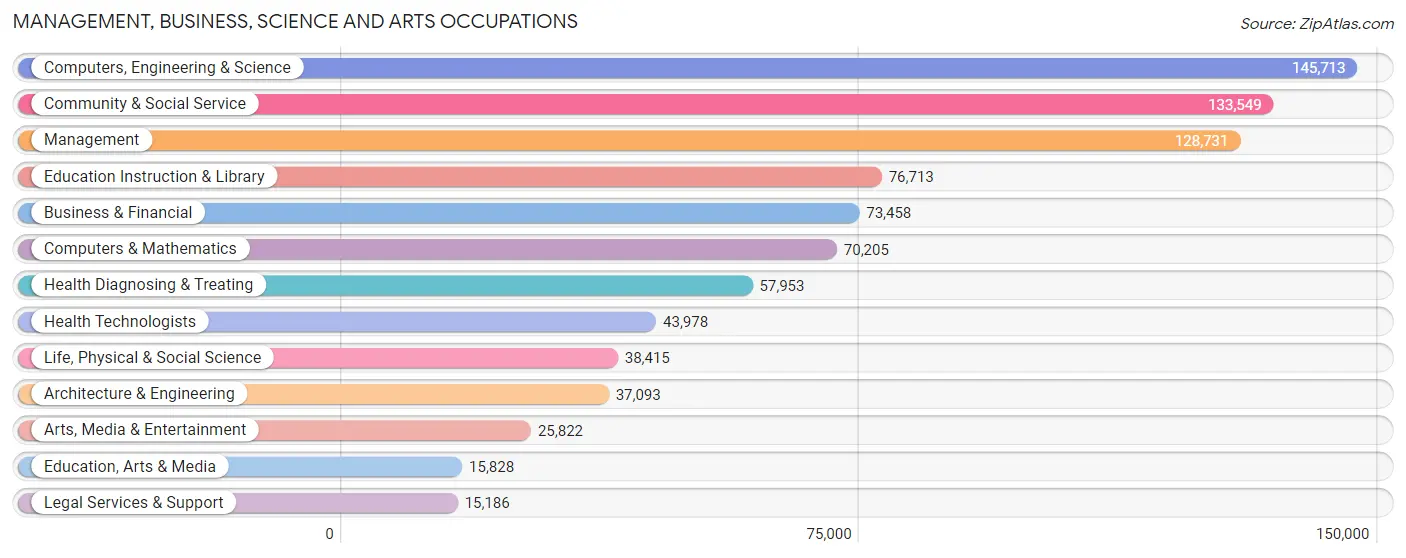
Management, Business, Science and Arts Occupations by Sex
Within the Management, Business, Science and Arts occupations in Middlesex County, the most male-oriented occupations are Architecture & Engineering (79.9%), Computers & Mathematics (74.8%), and Computers, Engineering & Science (70.0%), while the most female-oriented occupations are Health Technologists (76.2%), Health Diagnosing & Treating (75.8%), and Education, Arts & Media (71.8%).
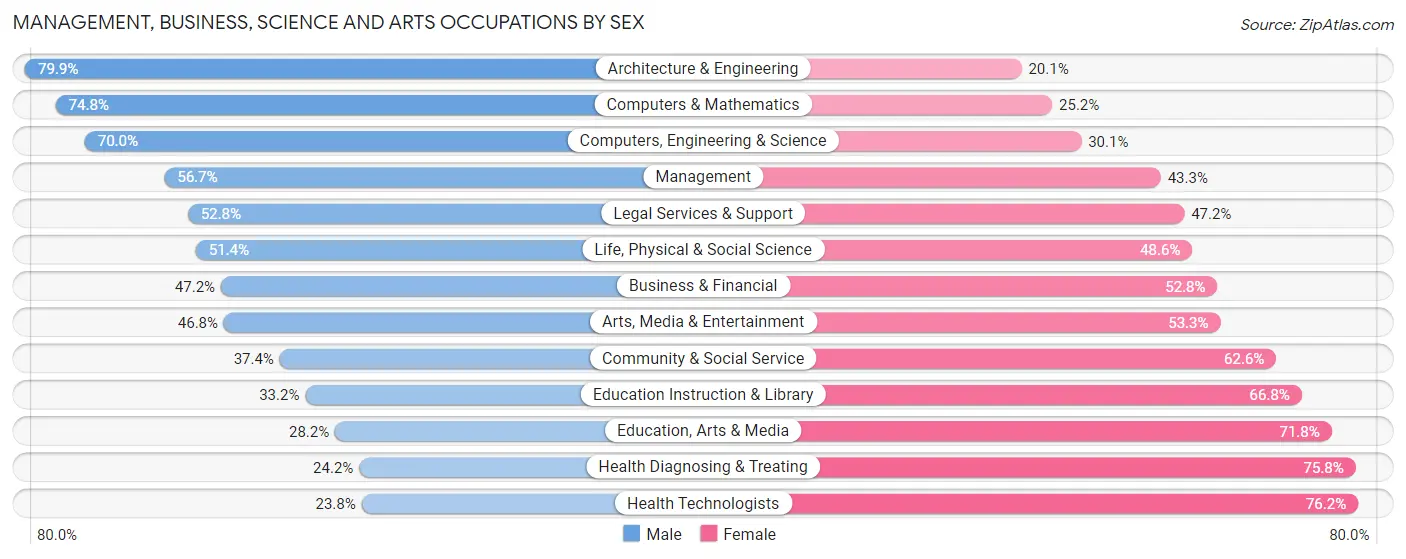
| Occupation | Male | Female |
| Management | 72,966 (56.7%) | 55,765 (43.3%) |
| Business & Financial | 34,705 (47.2%) | 38,753 (52.8%) |
| Computers, Engineering & Science | 101,926 (70.0%) | 43,787 (30.0%) |
| Computers & Mathematics | 52,522 (74.8%) | 17,683 (25.2%) |
| Architecture & Engineering | 29,646 (79.9%) | 7,447 (20.1%) |
| Life, Physical & Social Science | 19,758 (51.4%) | 18,657 (48.6%) |
| Community & Social Service | 49,993 (37.4%) | 83,556 (62.6%) |
| Education, Arts & Media | 4,462 (28.2%) | 11,366 (71.8%) |
| Legal Services & Support | 8,013 (52.8%) | 7,173 (47.2%) |
| Education Instruction & Library | 25,445 (33.2%) | 51,268 (66.8%) |
| Arts, Media & Entertainment | 12,073 (46.8%) | 13,749 (53.2%) |
| Health Diagnosing & Treating | 14,006 (24.2%) | 43,947 (75.8%) |
| Health Technologists | 10,454 (23.8%) | 33,524 (76.2%) |
| Total (Category) | 273,596 (50.7%) | 265,808 (49.3%) |
| Total (Overall) | 467,566 (52.2%) | 428,819 (47.8%) |
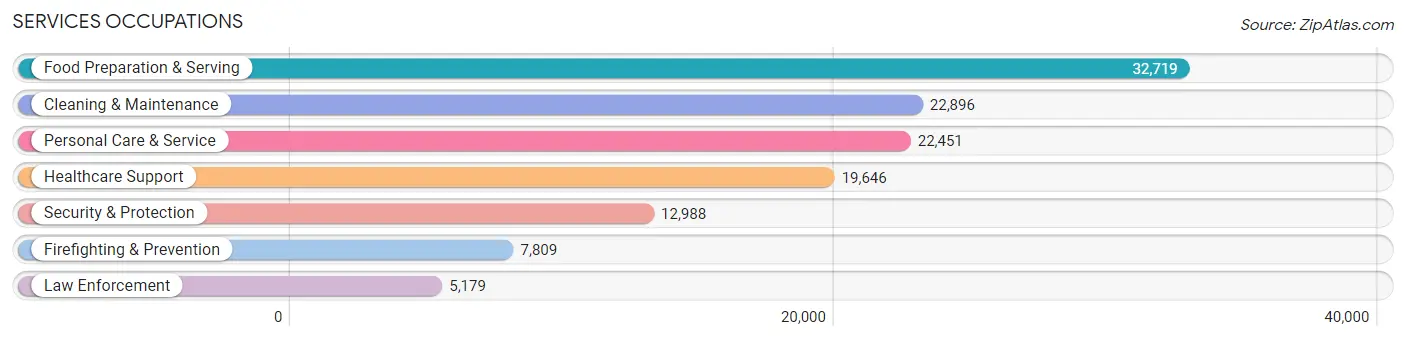
Services Occupations
The most common Services occupations in Middlesex County are Food Preparation & Serving (32,719 | 3.6%), Cleaning & Maintenance (22,896 | 2.5%), Personal Care & Service (22,451 | 2.5%), Healthcare Support (19,646 | 2.2%), and Security & Protection (12,988 | 1.5%).
Services Occupations by Sex
Within the Services occupations in Middlesex County, the most male-oriented occupations are Law Enforcement (80.9%), Security & Protection (76.1%), and Firefighting & Prevention (72.9%), while the most female-oriented occupations are Healthcare Support (80.2%), Personal Care & Service (74.9%), and Food Preparation & Serving (51.9%).
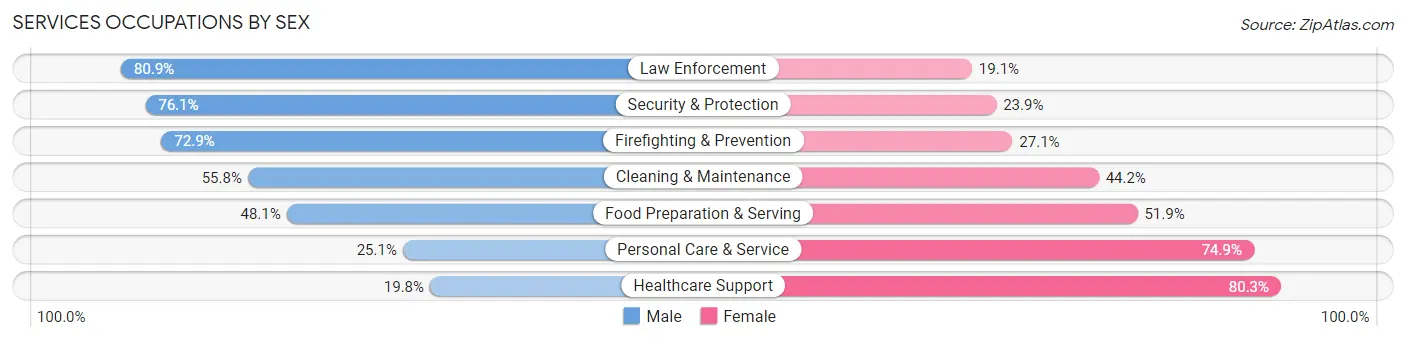
| Occupation | Male | Female |
| Healthcare Support | 3,881 (19.8%) | 15,765 (80.2%) |
| Security & Protection | 9,884 (76.1%) | 3,104 (23.9%) |
| Firefighting & Prevention | 5,693 (72.9%) | 2,116 (27.1%) |
| Law Enforcement | 4,191 (80.9%) | 988 (19.1%) |
| Food Preparation & Serving | 15,748 (48.1%) | 16,971 (51.9%) |
| Cleaning & Maintenance | 12,779 (55.8%) | 10,117 (44.2%) |
| Personal Care & Service | 5,639 (25.1%) | 16,812 (74.9%) |
| Total (Category) | 47,931 (43.3%) | 62,769 (56.7%) |
| Total (Overall) | 467,566 (52.2%) | 428,819 (47.8%) |
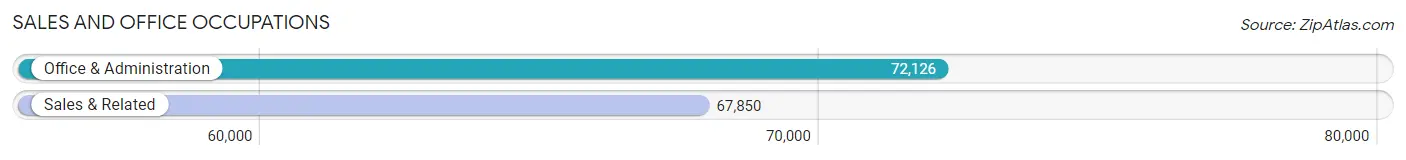
Sales and Office Occupations
The most common Sales and Office occupations in Middlesex County are Office & Administration (72,126 | 8.1%), and Sales & Related (67,850 | 7.6%).
Sales and Office Occupations by Sex
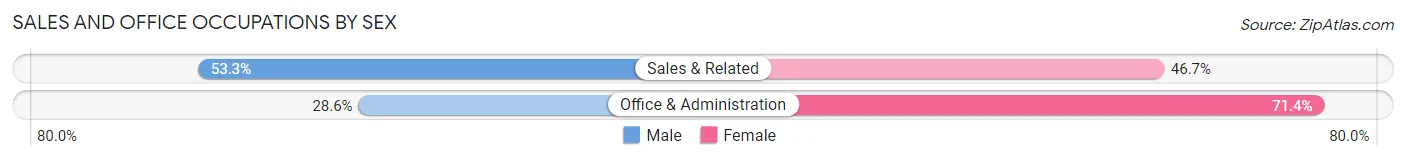
| Occupation | Male | Female |
| Sales & Related | 36,189 (53.3%) | 31,661 (46.7%) |
| Office & Administration | 20,656 (28.6%) | 51,470 (71.4%) |
| Total (Category) | 56,845 (40.6%) | 83,131 (59.4%) |
| Total (Overall) | 467,566 (52.2%) | 428,819 (47.8%) |
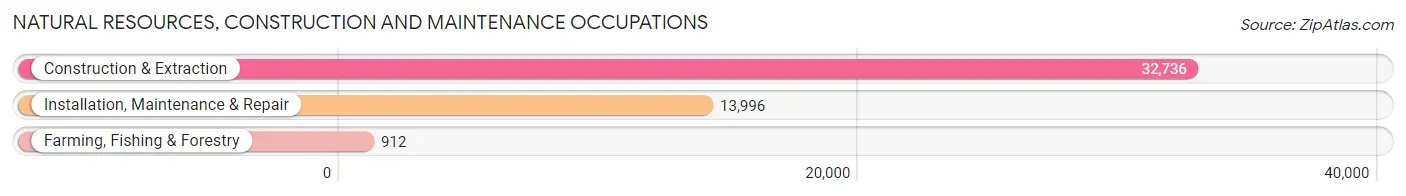
Natural Resources, Construction and Maintenance Occupations
The most common Natural Resources, Construction and Maintenance occupations in Middlesex County are Construction & Extraction (32,736 | 3.6%), Installation, Maintenance & Repair (13,996 | 1.6%), and Farming, Fishing & Forestry (912 | 0.1%).
Natural Resources, Construction and Maintenance Occupations by Sex
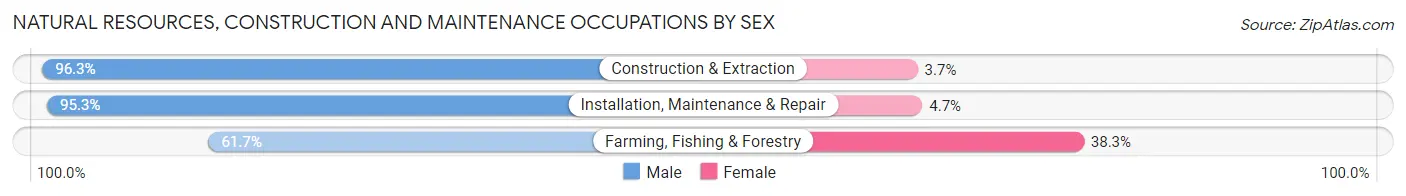
| Occupation | Male | Female |
| Farming, Fishing & Forestry | 563 (61.7%) | 349 (38.3%) |
| Construction & Extraction | 31,529 (96.3%) | 1,207 (3.7%) |
| Installation, Maintenance & Repair | 13,342 (95.3%) | 654 (4.7%) |
| Total (Category) | 45,434 (95.4%) | 2,210 (4.6%) |
| Total (Overall) | 467,566 (52.2%) | 428,819 (47.8%) |
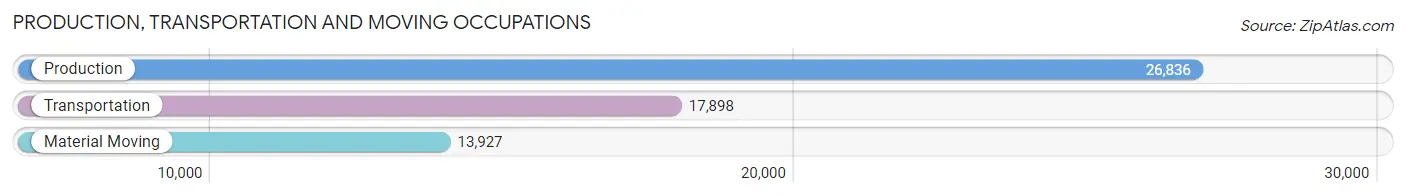
Production, Transportation and Moving Occupations
The most common Production, Transportation and Moving occupations in Middlesex County are Production (26,836 | 3.0%), Transportation (17,898 | 2.0%), and Material Moving (13,927 | 1.5%).
Production, Transportation and Moving Occupations by Sex
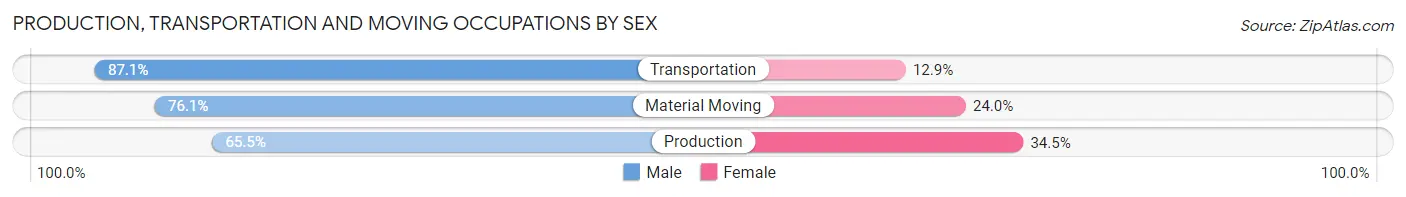
| Occupation | Male | Female |
| Production | 17,584 (65.5%) | 9,252 (34.5%) |
| Transportation | 15,584 (87.1%) | 2,314 (12.9%) |
| Material Moving | 10,592 (76.0%) | 3,335 (23.9%) |
| Total (Category) | 43,760 (74.6%) | 14,901 (25.4%) |
| Total (Overall) | 467,566 (52.2%) | 428,819 (47.8%) |
Employment Industries by Sex in Middlesex County
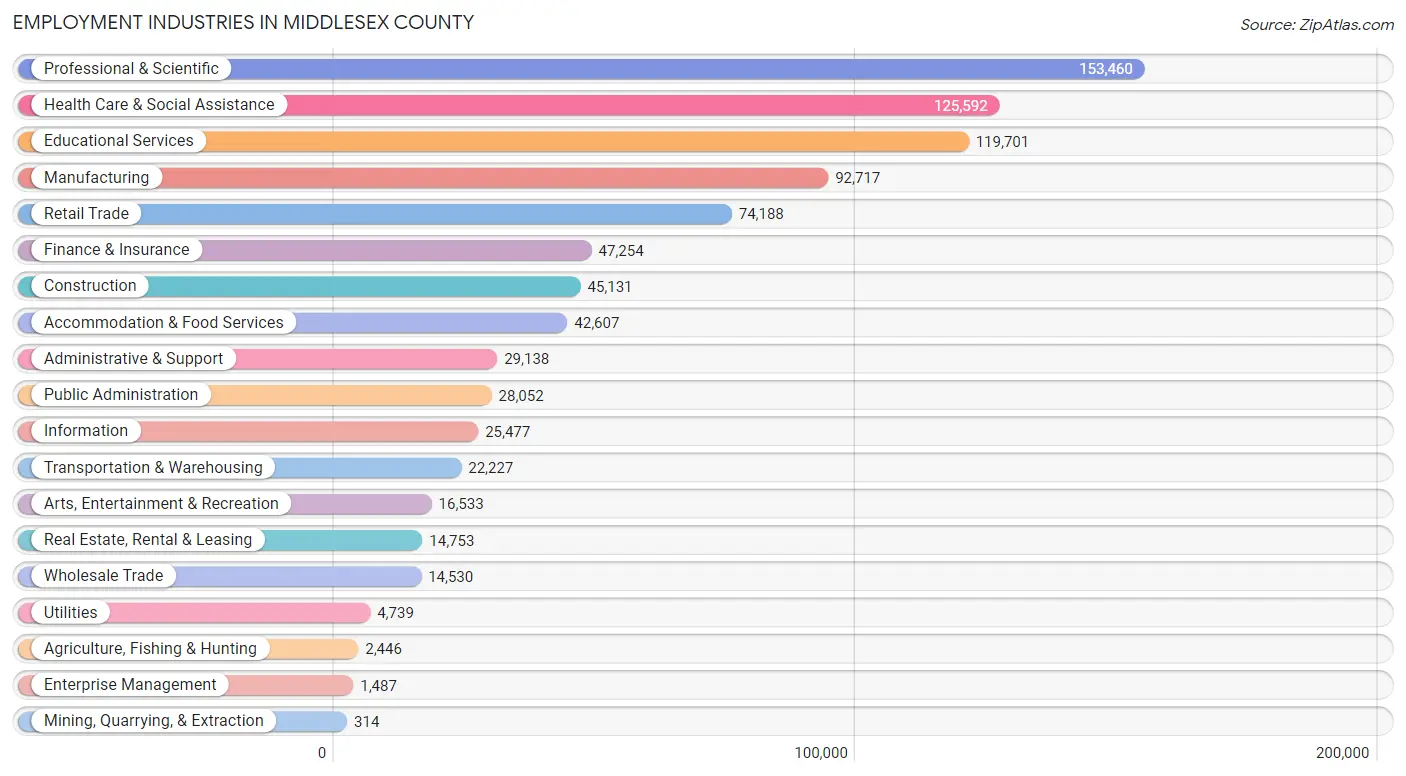
Employment Industries in Middlesex County
The major employment industries in Middlesex County include Professional & Scientific (153,460 | 17.1%), Health Care & Social Assistance (125,592 | 14.0%), Educational Services (119,701 | 13.4%), Manufacturing (92,717 | 10.3%), and Retail Trade (74,188 | 8.3%).
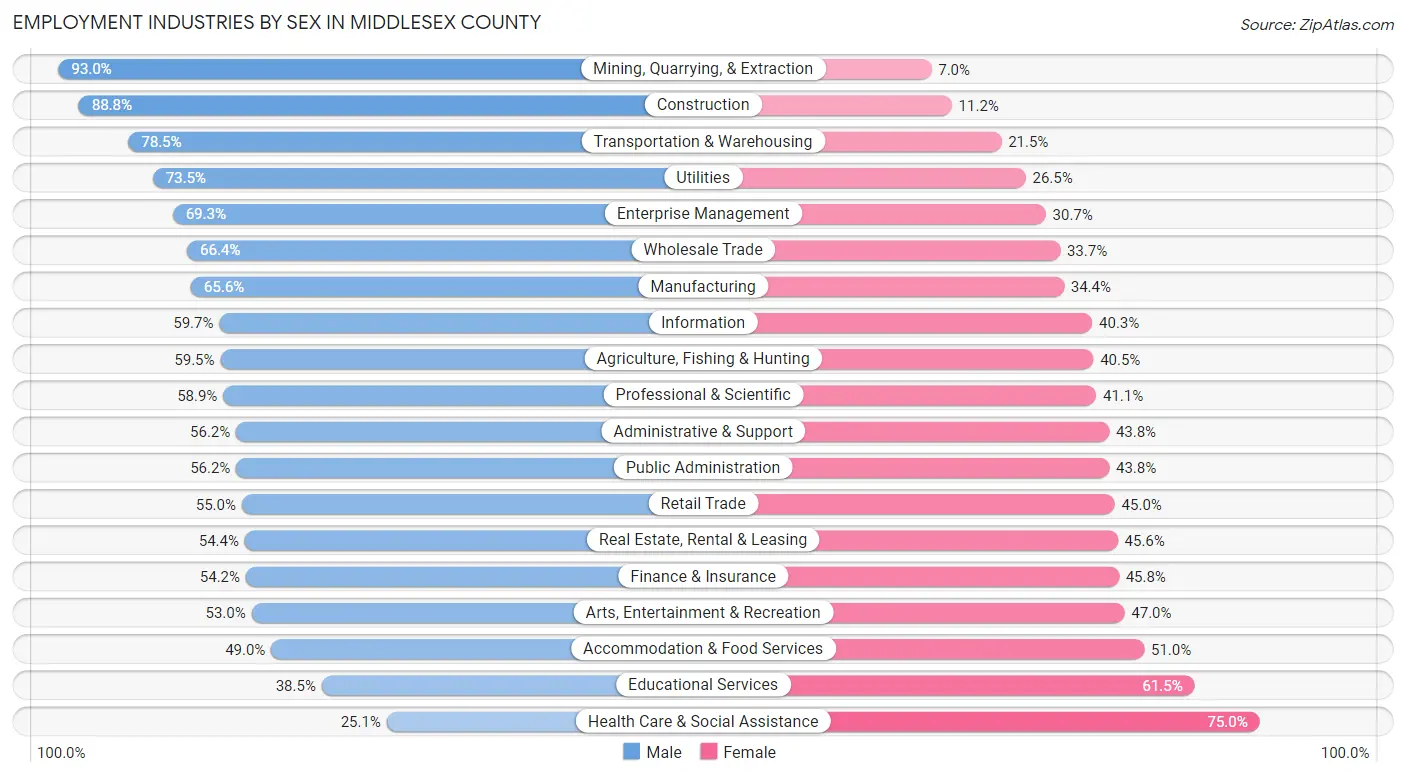
Employment Industries by Sex in Middlesex County
The Middlesex County industries that see more men than women are Mining, Quarrying, & Extraction (93.0%), Construction (88.8%), and Transportation & Warehousing (78.5%), whereas the industries that tend to have a higher number of women are Health Care & Social Assistance (75.0%), Educational Services (61.5%), and Accommodation & Food Services (51.0%).
| Industry | Male | Female |
| Agriculture, Fishing & Hunting | 1,455 (59.5%) | 991 (40.5%) |
| Mining, Quarrying, & Extraction | 292 (93.0%) | 22 (7.0%) |
| Construction | 40,064 (88.8%) | 5,067 (11.2%) |
| Manufacturing | 60,795 (65.6%) | 31,922 (34.4%) |
| Wholesale Trade | 9,641 (66.3%) | 4,889 (33.7%) |
| Retail Trade | 40,836 (55.0%) | 33,352 (45.0%) |
| Transportation & Warehousing | 17,452 (78.5%) | 4,775 (21.5%) |
| Utilities | 3,482 (73.5%) | 1,257 (26.5%) |
| Information | 15,210 (59.7%) | 10,267 (40.3%) |
| Finance & Insurance | 25,614 (54.2%) | 21,640 (45.8%) |
| Real Estate, Rental & Leasing | 8,030 (54.4%) | 6,723 (45.6%) |
| Professional & Scientific | 90,377 (58.9%) | 63,083 (41.1%) |
| Enterprise Management | 1,031 (69.3%) | 456 (30.7%) |
| Administrative & Support | 16,381 (56.2%) | 12,757 (43.8%) |
| Educational Services | 46,086 (38.5%) | 73,615 (61.5%) |
| Health Care & Social Assistance | 31,461 (25.1%) | 94,131 (75.0%) |
| Arts, Entertainment & Recreation | 8,765 (53.0%) | 7,768 (47.0%) |
| Accommodation & Food Services | 20,862 (49.0%) | 21,745 (51.0%) |
| Public Administration | 15,765 (56.2%) | 12,287 (43.8%) |
| Total | 467,566 (52.2%) | 428,819 (47.8%) |
Education in Middlesex County
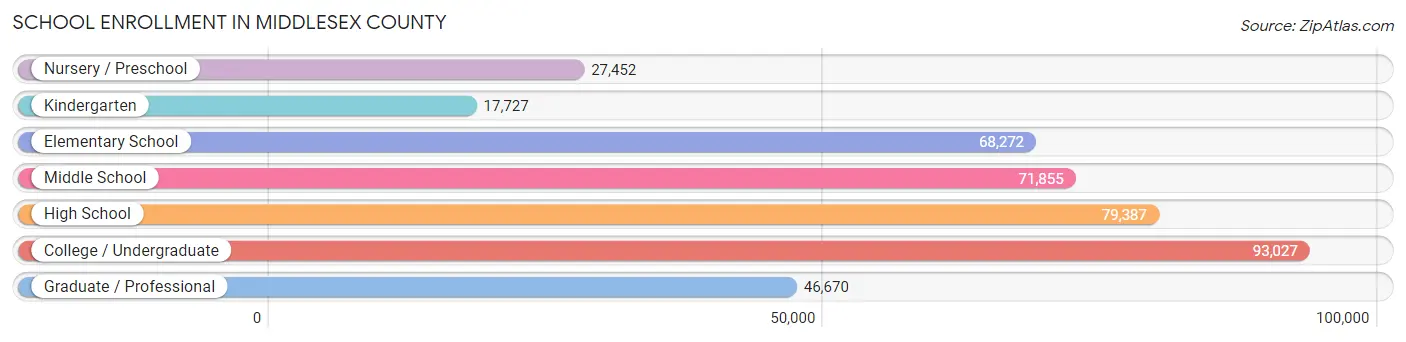
School Enrollment in Middlesex County
The most common levels of schooling among the 404,390 students in Middlesex County are college / undergraduate (93,027 | 23.0%), high school (79,387 | 19.6%), and middle school (71,855 | 17.8%).
| School Level | # Students | % Students |
| Nursery / Preschool | 27,452 | 6.8% |
| Kindergarten | 17,727 | 4.4% |
| Elementary School | 68,272 | 16.9% |
| Middle School | 71,855 | 17.8% |
| High School | 79,387 | 19.6% |
| College / Undergraduate | 93,027 | 23.0% |
| Graduate / Professional | 46,670 | 11.5% |
| Total | 404,390 | 100.0% |
School Enrollment by Age by Funding Source in Middlesex County
Out of a total of 404,390 students who are enrolled in schools in Middlesex County, 128,596 (31.8%) attend a private institution, while the remaining 275,794 (68.2%) are enrolled in public schools. The age group of 25 to 34 year olds has the highest likelihood of being enrolled in private schools, with 23,729 (65.9% in the age bracket) enrolled. Conversely, the age group of 10 to 14 year olds has the lowest likelihood of being enrolled in a private school, with 80,582 (90.5% in the age bracket) attending a public institution.
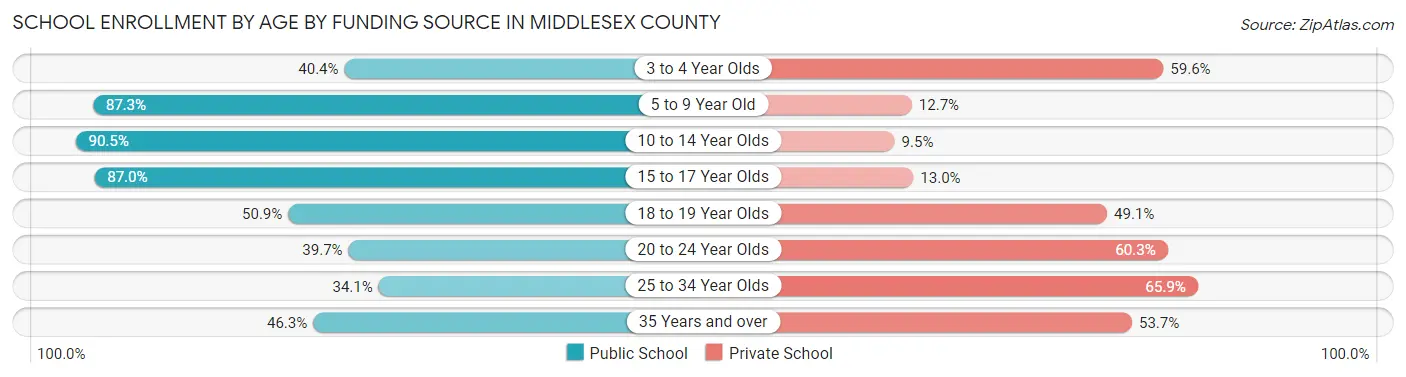
| Age Bracket | Public School | Private School |
| 3 to 4 Year Olds | 8,626 (40.4%) | 12,706 (59.6%) |
| 5 to 9 Year Old | 72,517 (87.3%) | 10,555 (12.7%) |
| 10 to 14 Year Olds | 80,582 (90.5%) | 8,456 (9.5%) |
| 15 to 17 Year Olds | 48,376 (87.0%) | 7,225 (13.0%) |
| 18 to 19 Year Olds | 20,700 (50.9%) | 19,954 (49.1%) |
| 20 to 24 Year Olds | 22,897 (39.7%) | 34,794 (60.3%) |
| 25 to 34 Year Olds | 12,263 (34.1%) | 23,729 (65.9%) |
| 35 Years and over | 9,723 (46.3%) | 11,287 (53.7%) |
| Total | 275,794 (68.2%) | 128,596 (31.8%) |
Educational Attainment by Field of Study in Middlesex County
Business (106,855 | 14.6%), engineering (89,312 | 12.2%), social sciences (76,263 | 10.4%), bio, nature & agricultural (55,765 | 7.6%), and science & technology (53,703 | 7.3%) are the most common fields of study among 732,427 individuals in Middlesex County who have obtained a bachelor's degree or higher.
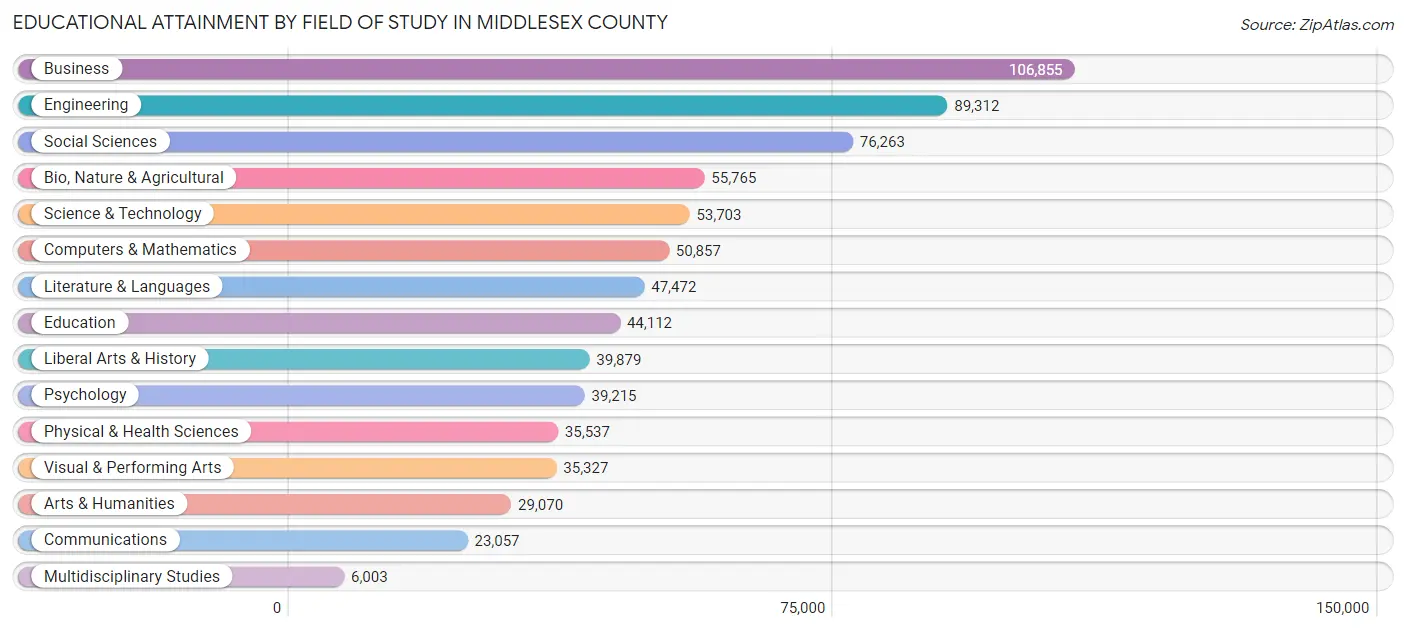
| Field of Study | # Graduates | % Graduates |
| Computers & Mathematics | 50,857 | 6.9% |
| Bio, Nature & Agricultural | 55,765 | 7.6% |
| Physical & Health Sciences | 35,537 | 4.9% |
| Psychology | 39,215 | 5.3% |
| Social Sciences | 76,263 | 10.4% |
| Engineering | 89,312 | 12.2% |
| Multidisciplinary Studies | 6,003 | 0.8% |
| Science & Technology | 53,703 | 7.3% |
| Business | 106,855 | 14.6% |
| Education | 44,112 | 6.0% |
| Literature & Languages | 47,472 | 6.5% |
| Liberal Arts & History | 39,879 | 5.4% |
| Visual & Performing Arts | 35,327 | 4.8% |
| Communications | 23,057 | 3.2% |
| Arts & Humanities | 29,070 | 4.0% |
| Total | 732,427 | 100.0% |
Transportation & Commute in Middlesex County
Vehicle Availability by Sex in Middlesex County
The most prevalent vehicle ownership categories in Middlesex County are males with 2 vehicles (198,427, accounting for 43.6%) and females with 2 vehicles (175,067, making up 48.3%).
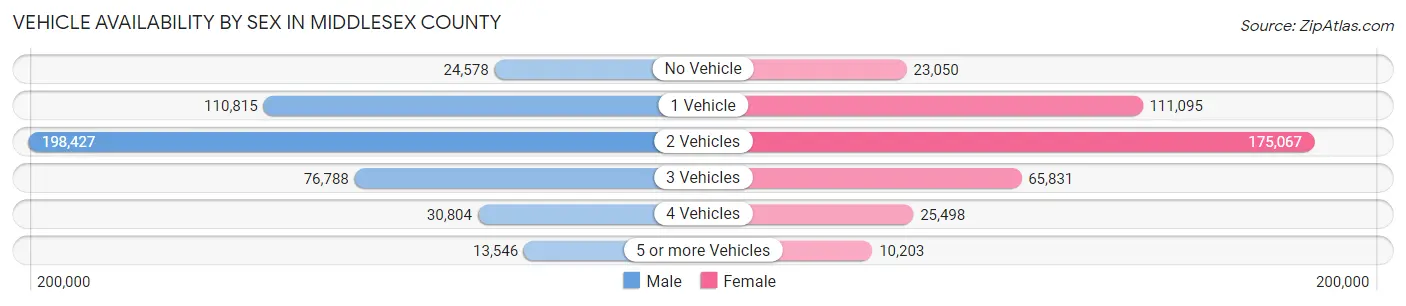
| Vehicles Available | Male | Female |
| No Vehicle | 24,578 (5.4%) | 23,050 (5.6%) |
| 1 Vehicle | 110,815 (24.4%) | 111,095 (27.1%) |
| 2 Vehicles | 198,427 (43.6%) | 175,067 (42.6%) |
| 3 Vehicles | 76,788 (16.9%) | 65,831 (16.0%) |
| 4 Vehicles | 30,804 (6.8%) | 25,498 (6.2%) |
| 5 or more Vehicles | 13,546 (3.0%) | 10,203 (2.5%) |
| Total | 454,958 (100.0%) | 410,744 (100.0%) |
Commute Time in Middlesex County
The most frequently occuring commute durations in Middlesex County are 30 to 34 minutes (112,060 commuters, 15.8%), 20 to 24 minutes (91,359 commuters, 12.9%), and 45 to 59 minutes (86,011 commuters, 12.1%).
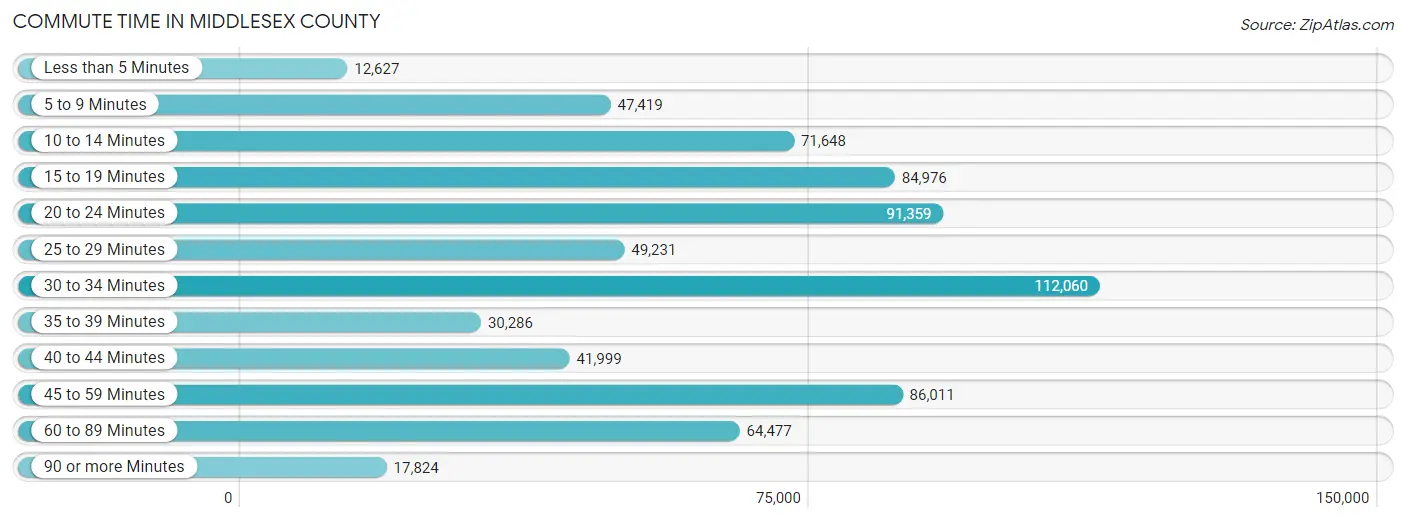
| Commute Time | # Commuters | % Commuters |
| Less than 5 Minutes | 12,627 | 1.8% |
| 5 to 9 Minutes | 47,419 | 6.7% |
| 10 to 14 Minutes | 71,648 | 10.1% |
| 15 to 19 Minutes | 84,976 | 12.0% |
| 20 to 24 Minutes | 91,359 | 12.9% |
| 25 to 29 Minutes | 49,231 | 6.9% |
| 30 to 34 Minutes | 112,060 | 15.8% |
| 35 to 39 Minutes | 30,286 | 4.3% |
| 40 to 44 Minutes | 41,999 | 5.9% |
| 45 to 59 Minutes | 86,011 | 12.1% |
| 60 to 89 Minutes | 64,477 | 9.1% |
| 90 or more Minutes | 17,824 | 2.5% |
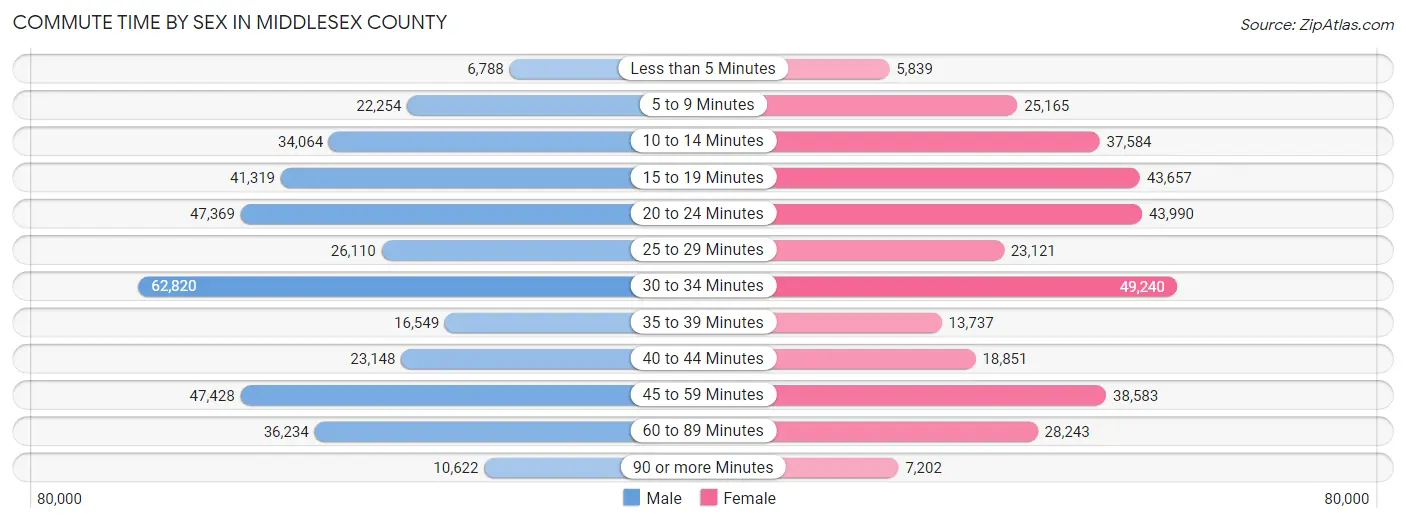
Commute Time by Sex in Middlesex County
The most common commute times in Middlesex County are 30 to 34 minutes (62,820 commuters, 16.8%) for males and 30 to 34 minutes (49,240 commuters, 14.7%) for females.
| Commute Time | Male | Female |
| Less than 5 Minutes | 6,788 (1.8%) | 5,839 (1.7%) |
| 5 to 9 Minutes | 22,254 (5.9%) | 25,165 (7.5%) |
| 10 to 14 Minutes | 34,064 (9.1%) | 37,584 (11.2%) |
| 15 to 19 Minutes | 41,319 (11.0%) | 43,657 (13.0%) |
| 20 to 24 Minutes | 47,369 (12.6%) | 43,990 (13.1%) |
| 25 to 29 Minutes | 26,110 (7.0%) | 23,121 (6.9%) |
| 30 to 34 Minutes | 62,820 (16.8%) | 49,240 (14.7%) |
| 35 to 39 Minutes | 16,549 (4.4%) | 13,737 (4.1%) |
| 40 to 44 Minutes | 23,148 (6.2%) | 18,851 (5.6%) |
| 45 to 59 Minutes | 47,428 (12.7%) | 38,583 (11.5%) |
| 60 to 89 Minutes | 36,234 (9.7%) | 28,243 (8.4%) |
| 90 or more Minutes | 10,622 (2.8%) | 7,202 (2.1%) |
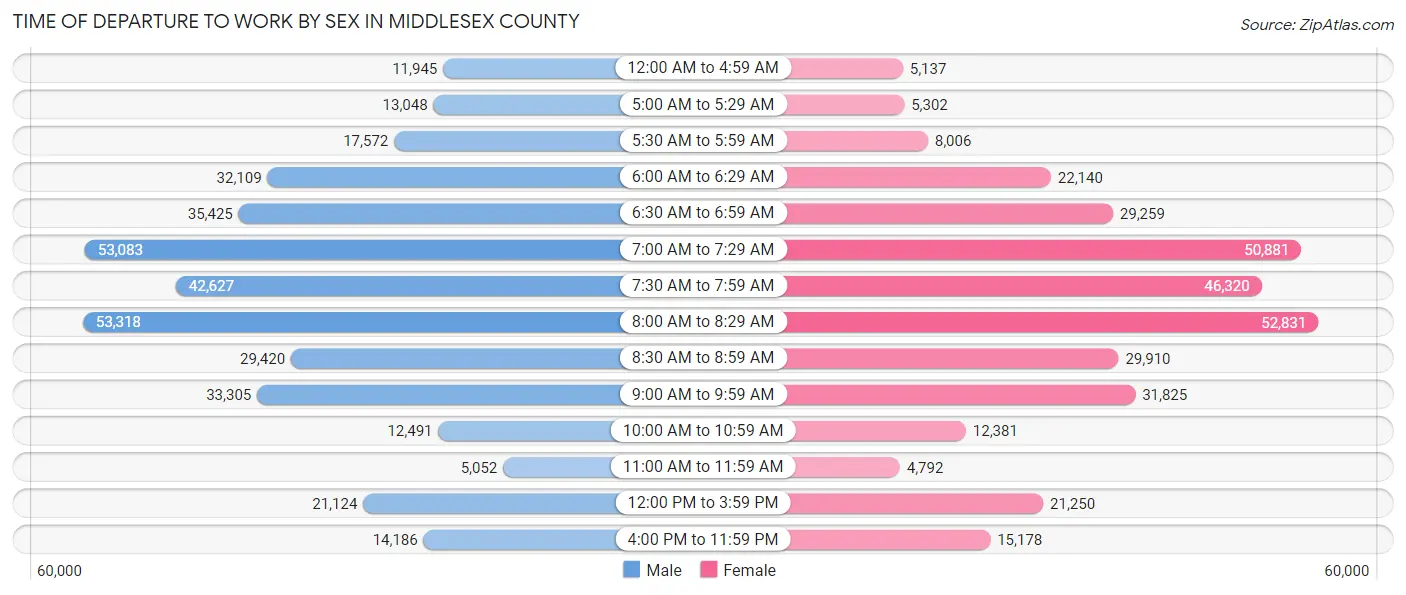
Time of Departure to Work by Sex in Middlesex County
The most frequent times of departure to work in Middlesex County are 8:00 AM to 8:29 AM (53,318, 14.2%) for males and 8:00 AM to 8:29 AM (52,831, 15.8%) for females.
| Time of Departure | Male | Female |
| 12:00 AM to 4:59 AM | 11,945 (3.2%) | 5,137 (1.5%) |
| 5:00 AM to 5:29 AM | 13,048 (3.5%) | 5,302 (1.6%) |
| 5:30 AM to 5:59 AM | 17,572 (4.7%) | 8,006 (2.4%) |
| 6:00 AM to 6:29 AM | 32,109 (8.6%) | 22,140 (6.6%) |
| 6:30 AM to 6:59 AM | 35,425 (9.5%) | 29,259 (8.7%) |
| 7:00 AM to 7:29 AM | 53,083 (14.2%) | 50,881 (15.2%) |
| 7:30 AM to 7:59 AM | 42,627 (11.4%) | 46,320 (13.8%) |
| 8:00 AM to 8:29 AM | 53,318 (14.2%) | 52,831 (15.8%) |
| 8:30 AM to 8:59 AM | 29,420 (7.9%) | 29,910 (8.9%) |
| 9:00 AM to 9:59 AM | 33,305 (8.9%) | 31,825 (9.5%) |
| 10:00 AM to 10:59 AM | 12,491 (3.3%) | 12,381 (3.7%) |
| 11:00 AM to 11:59 AM | 5,052 (1.3%) | 4,792 (1.4%) |
| 12:00 PM to 3:59 PM | 21,124 (5.6%) | 21,250 (6.3%) |
| 4:00 PM to 11:59 PM | 14,186 (3.8%) | 15,178 (4.5%) |
| Total | 374,705 (100.0%) | 335,212 (100.0%) |
Housing Occupancy in Middlesex County
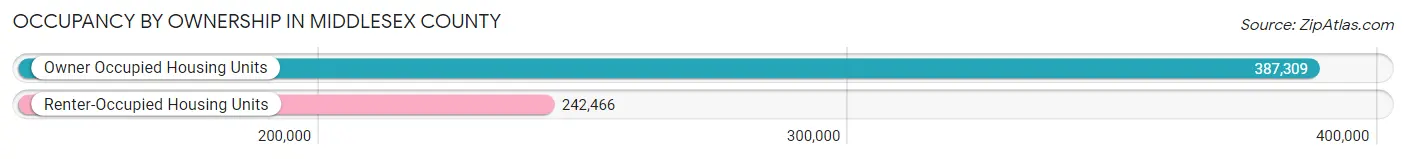
Occupancy by Ownership in Middlesex County
Of the total 629,775 dwellings in Middlesex County, owner-occupied units account for 387,309 (61.5%), while renter-occupied units make up 242,466 (38.5%).
| Occupancy | # Housing Units | % Housing Units |
| Owner Occupied Housing Units | 387,309 | 61.5% |
| Renter-Occupied Housing Units | 242,466 | 38.5% |
| Total Occupied Housing Units | 629,775 | 100.0% |
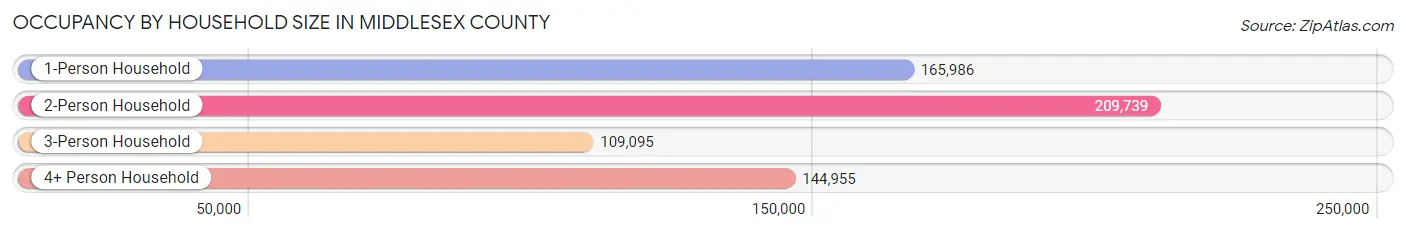
Occupancy by Household Size in Middlesex County
| Household Size | # Housing Units | % Housing Units |
| 1-Person Household | 165,986 | 26.4% |
| 2-Person Household | 209,739 | 33.3% |
| 3-Person Household | 109,095 | 17.3% |
| 4+ Person Household | 144,955 | 23.0% |
| Total Housing Units | 629,775 | 100.0% |
Occupancy by Ownership by Household Size in Middlesex County
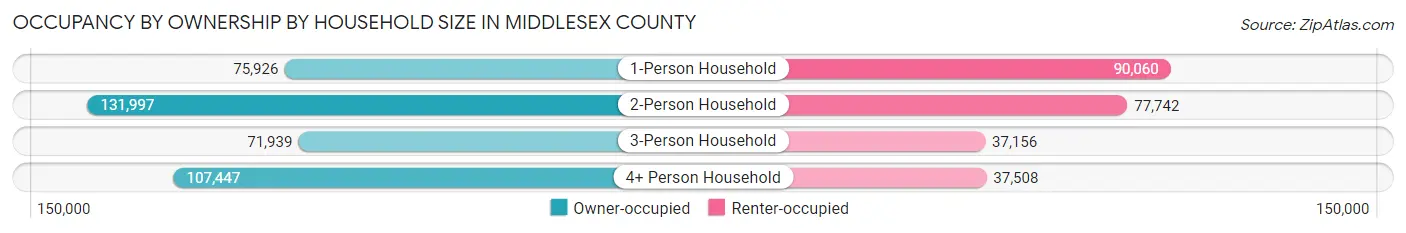
| Household Size | Owner-occupied | Renter-occupied |
| 1-Person Household | 75,926 (45.7%) | 90,060 (54.3%) |
| 2-Person Household | 131,997 (62.9%) | 77,742 (37.1%) |
| 3-Person Household | 71,939 (65.9%) | 37,156 (34.1%) |
| 4+ Person Household | 107,447 (74.1%) | 37,508 (25.9%) |
| Total Housing Units | 387,309 (61.5%) | 242,466 (38.5%) |
Occupancy by Educational Attainment in Middlesex County
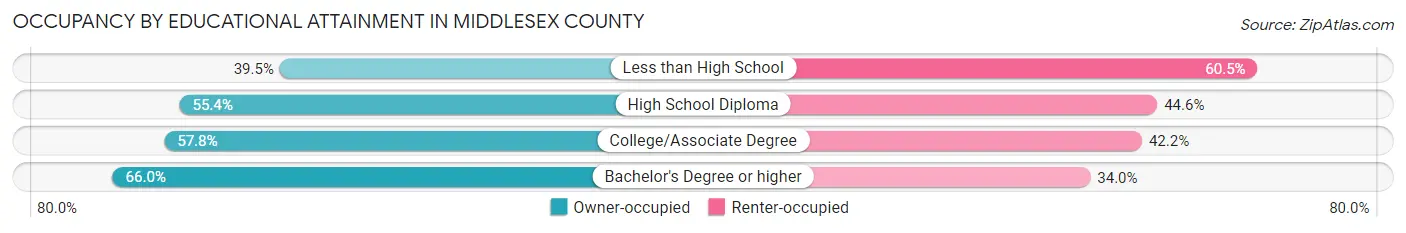
| Household Size | Owner-occupied | Renter-occupied |
| Less than High School | 13,404 (39.5%) | 20,507 (60.5%) |
| High School Diploma | 53,871 (55.4%) | 43,335 (44.6%) |
| College/Associate Degree | 65,067 (57.8%) | 47,425 (42.2%) |
| Bachelor's Degree or higher | 254,967 (66.0%) | 131,199 (34.0%) |
Occupancy by Age of Householder in Middlesex County
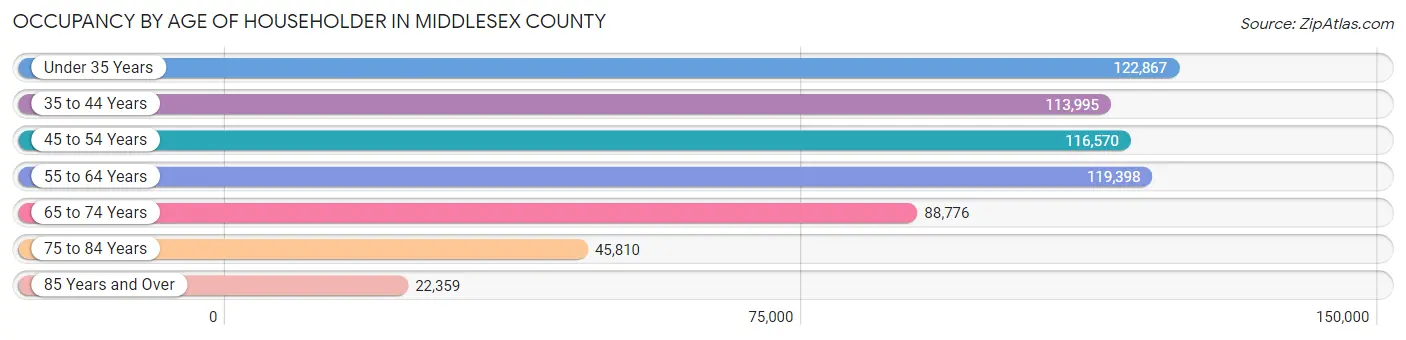
| Age Bracket | # Households | % Households |
| Under 35 Years | 122,867 | 19.5% |
| 35 to 44 Years | 113,995 | 18.1% |
| 45 to 54 Years | 116,570 | 18.5% |
| 55 to 64 Years | 119,398 | 19.0% |
| 65 to 74 Years | 88,776 | 14.1% |
| 75 to 84 Years | 45,810 | 7.3% |
| 85 Years and Over | 22,359 | 3.5% |
| Total | 629,775 | 100.0% |
Housing Finances in Middlesex County
Median Income by Occupancy in Middlesex County
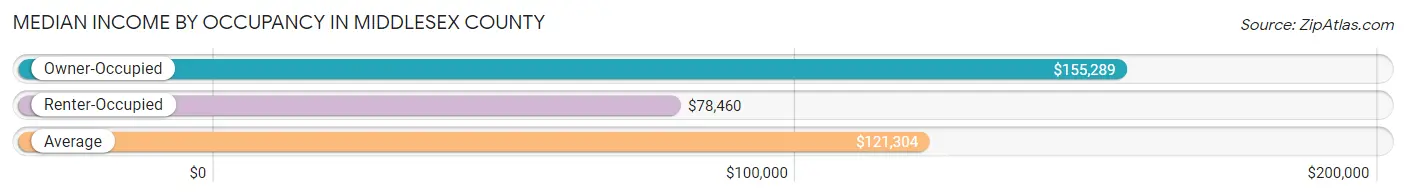
| Occupancy Type | # Households | Median Income |
| Owner-Occupied | 387,309 (61.5%) | $155,289 |
| Renter-Occupied | 242,466 (38.5%) | $78,460 |
| Average | 629,775 (100.0%) | $121,304 |
Occupancy by Householder Income Bracket in Middlesex County
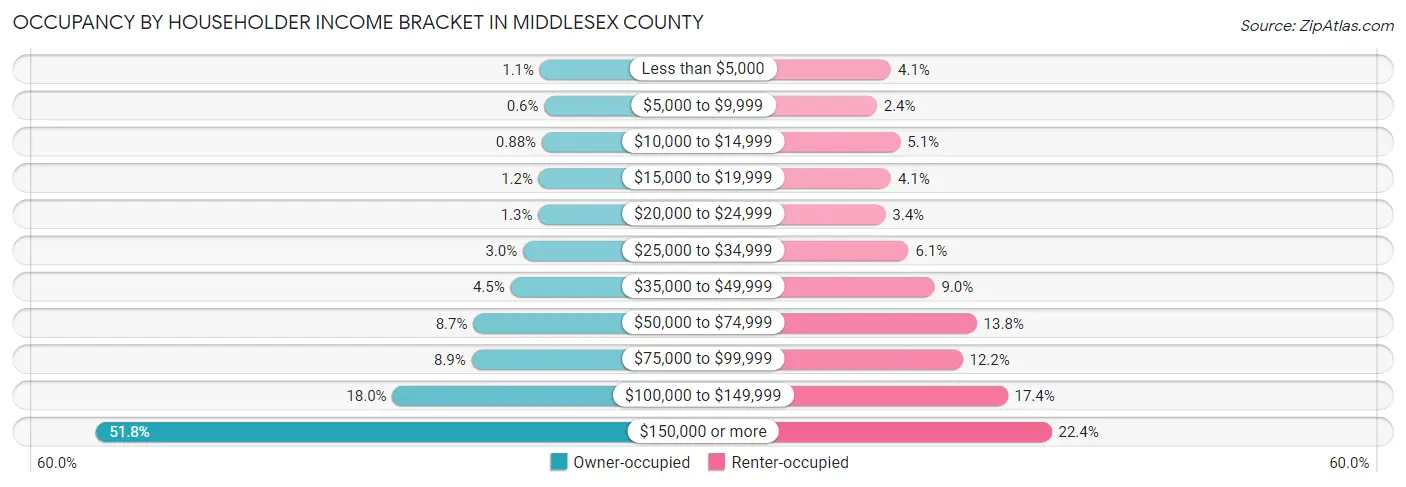
| Income Bracket | Owner-occupied | Renter-occupied |
| Less than $5,000 | 4,315 (1.1%) | 9,848 (4.1%) |
| $5,000 to $9,999 | 2,326 (0.6%) | 5,892 (2.4%) |
| $10,000 to $14,999 | 3,413 (0.9%) | 12,404 (5.1%) |
| $15,000 to $19,999 | 4,761 (1.2%) | 9,817 (4.1%) |
| $20,000 to $24,999 | 5,011 (1.3%) | 8,268 (3.4%) |
| $25,000 to $34,999 | 11,720 (3.0%) | 14,689 (6.1%) |
| $35,000 to $49,999 | 17,292 (4.5%) | 21,883 (9.0%) |
| $50,000 to $74,999 | 33,785 (8.7%) | 33,565 (13.8%) |
| $75,000 to $99,999 | 34,524 (8.9%) | 29,661 (12.2%) |
| $100,000 to $149,999 | 69,573 (18.0%) | 42,116 (17.4%) |
| $150,000 or more | 200,589 (51.8%) | 54,323 (22.4%) |
| Total | 387,309 (100.0%) | 242,466 (100.0%) |
Monthly Housing Cost Tiers in Middlesex County
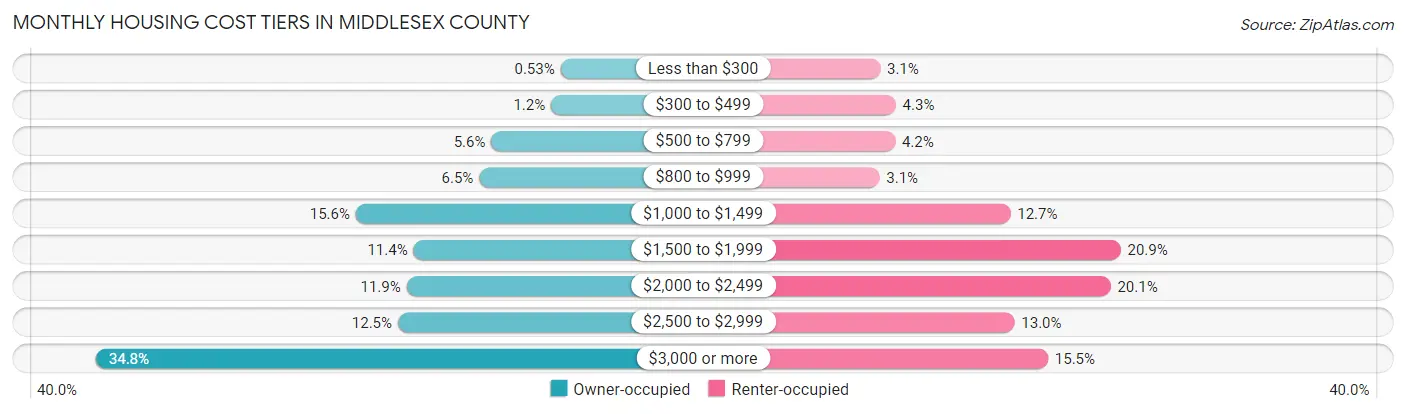
| Monthly Cost | Owner-occupied | Renter-occupied |
| Less than $300 | 2,039 (0.5%) | 7,607 (3.1%) |
| $300 to $499 | 4,748 (1.2%) | 10,404 (4.3%) |
| $500 to $799 | 21,802 (5.6%) | 10,286 (4.2%) |
| $800 to $999 | 25,254 (6.5%) | 7,486 (3.1%) |
| $1,000 to $1,499 | 60,449 (15.6%) | 30,858 (12.7%) |
| $1,500 to $1,999 | 44,014 (11.4%) | 50,562 (20.8%) |
| $2,000 to $2,499 | 45,981 (11.9%) | 48,765 (20.1%) |
| $2,500 to $2,999 | 48,450 (12.5%) | 31,597 (13.0%) |
| $3,000 or more | 134,572 (34.7%) | 37,584 (15.5%) |
| Total | 387,309 (100.0%) | 242,466 (100.0%) |
Physical Housing Characteristics in Middlesex County
Housing Structures in Middlesex County
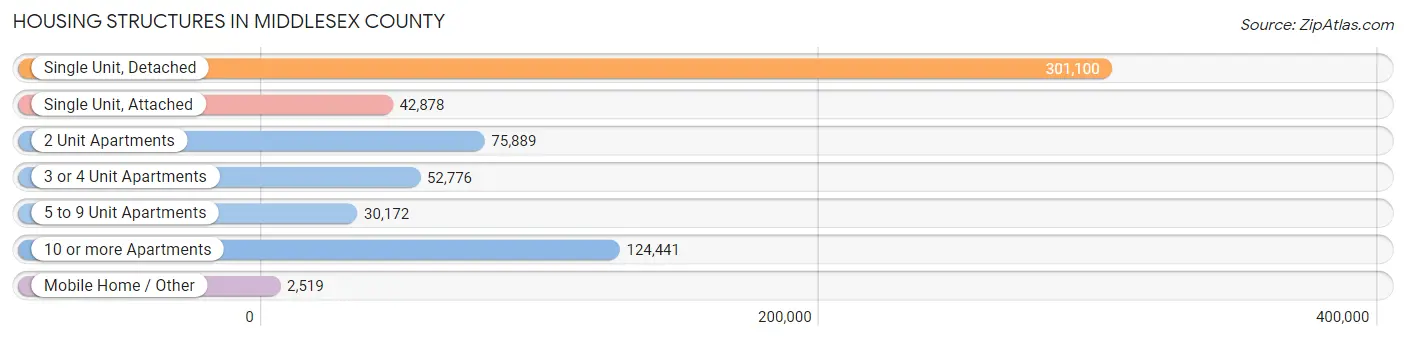
| Structure Type | # Housing Units | % Housing Units |
| Single Unit, Detached | 301,100 | 47.8% |
| Single Unit, Attached | 42,878 | 6.8% |
| 2 Unit Apartments | 75,889 | 12.0% |
| 3 or 4 Unit Apartments | 52,776 | 8.4% |
| 5 to 9 Unit Apartments | 30,172 | 4.8% |
| 10 or more Apartments | 124,441 | 19.8% |
| Mobile Home / Other | 2,519 | 0.4% |
| Total | 629,775 | 100.0% |
Housing Structures by Occupancy in Middlesex County
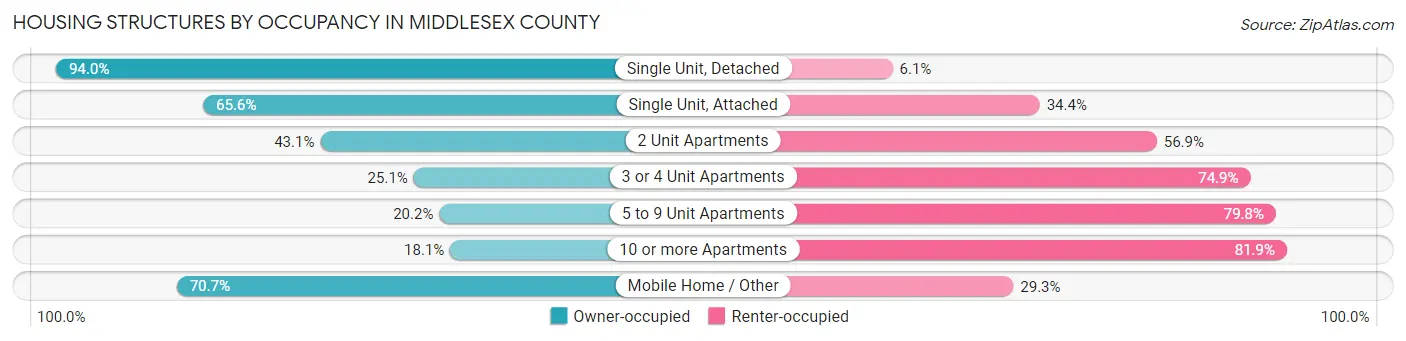
| Structure Type | Owner-occupied | Renter-occupied |
| Single Unit, Detached | 282,898 (94.0%) | 18,202 (6.0%) |
| Single Unit, Attached | 28,137 (65.6%) | 14,741 (34.4%) |
| 2 Unit Apartments | 32,692 (43.1%) | 43,197 (56.9%) |
| 3 or 4 Unit Apartments | 13,239 (25.1%) | 39,537 (74.9%) |
| 5 to 9 Unit Apartments | 6,087 (20.2%) | 24,085 (79.8%) |
| 10 or more Apartments | 22,475 (18.1%) | 101,966 (81.9%) |
| Mobile Home / Other | 1,781 (70.7%) | 738 (29.3%) |
| Total | 387,309 (61.5%) | 242,466 (38.5%) |
Housing Structures by Number of Rooms in Middlesex County
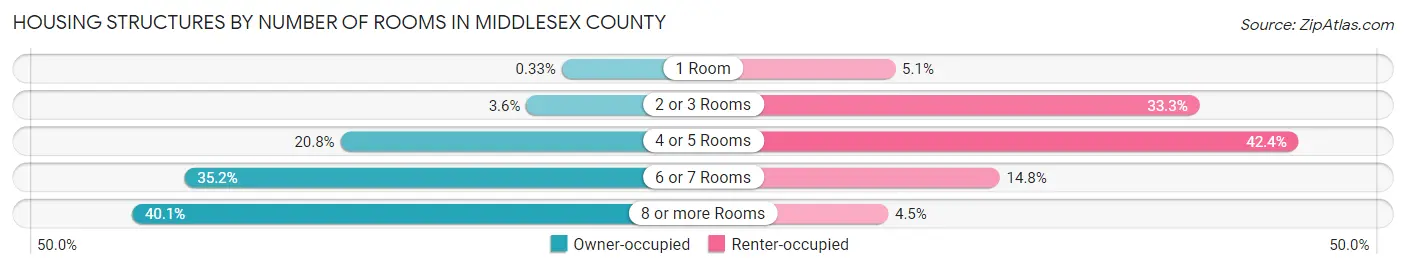
| Number of Rooms | Owner-occupied | Renter-occupied |
| 1 Room | 1,267 (0.3%) | 12,383 (5.1%) |
| 2 or 3 Rooms | 13,928 (3.6%) | 80,649 (33.3%) |
| 4 or 5 Rooms | 80,517 (20.8%) | 102,838 (42.4%) |
| 6 or 7 Rooms | 136,393 (35.2%) | 35,804 (14.8%) |
| 8 or more Rooms | 155,204 (40.1%) | 10,792 (4.4%) |
| Total | 387,309 (100.0%) | 242,466 (100.0%) |
Housing Structure by Heating Type in Middlesex County
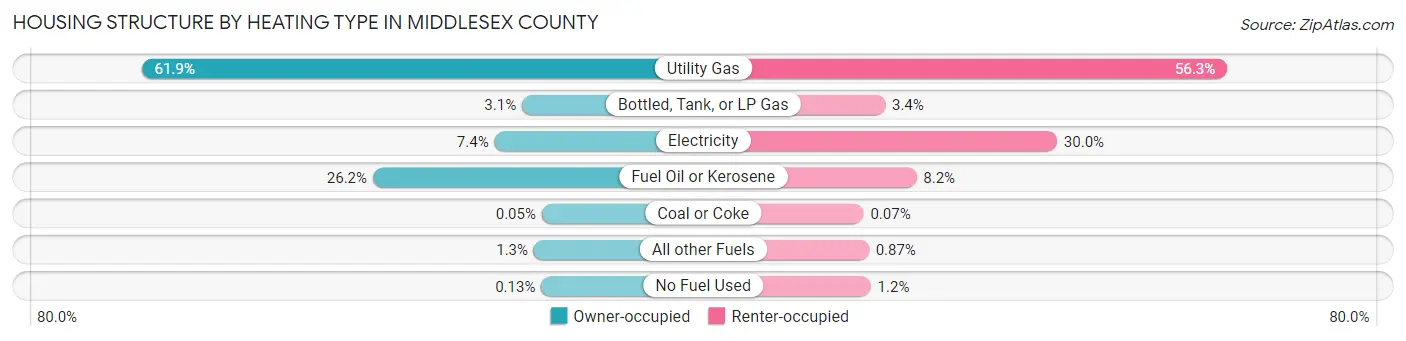
| Heating Type | Owner-occupied | Renter-occupied |
| Utility Gas | 239,817 (61.9%) | 136,448 (56.3%) |
| Bottled, Tank, or LP Gas | 12,060 (3.1%) | 8,252 (3.4%) |
| Electricity | 28,520 (7.4%) | 72,657 (30.0%) |
| Fuel Oil or Kerosene | 101,306 (26.2%) | 19,979 (8.2%) |
| Coal or Coke | 203 (0.1%) | 173 (0.1%) |
| All other Fuels | 4,911 (1.3%) | 2,106 (0.9%) |
| No Fuel Used | 492 (0.1%) | 2,851 (1.2%) |
| Total | 387,309 (100.0%) | 242,466 (100.0%) |
Household Vehicle Usage in Middlesex County
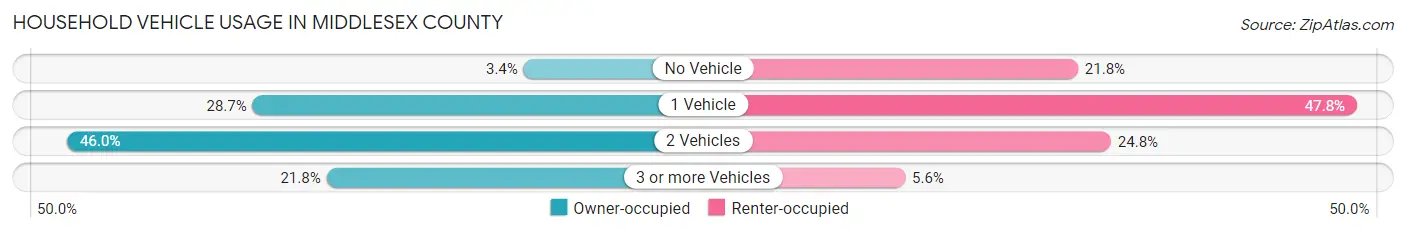
| Vehicles per Household | Owner-occupied | Renter-occupied |
| No Vehicle | 13,262 (3.4%) | 52,742 (21.7%) |
| 1 Vehicle | 111,216 (28.7%) | 115,873 (47.8%) |
| 2 Vehicles | 178,328 (46.0%) | 60,216 (24.8%) |
| 3 or more Vehicles | 84,503 (21.8%) | 13,635 (5.6%) |
| Total | 387,309 (100.0%) | 242,466 (100.0%) |
Real Estate & Mortgages in Middlesex County
Real Estate and Mortgage Overview in Middlesex County
| Characteristic | Without Mortgage | With Mortgage |
| Housing Units | 127,514 | 259,795 |
| Median Property Value | $638,400 | $661,600 |
| Median Household Income | $107,918 | $154,933 |
| Monthly Housing Costs | $1,119 | $131,426 |
| Real Estate Taxes | $7,012 | $2,250 |
Property Value by Mortgage Status in Middlesex County
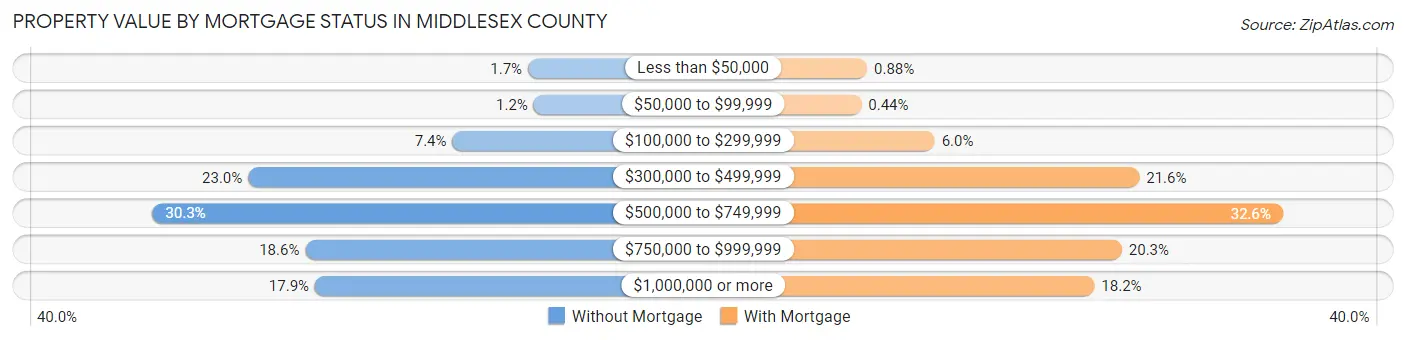
| Property Value | Without Mortgage | With Mortgage |
| Less than $50,000 | 2,110 (1.7%) | 2,285 (0.9%) |
| $50,000 to $99,999 | 1,540 (1.2%) | 1,133 (0.4%) |
| $100,000 to $299,999 | 9,451 (7.4%) | 15,657 (6.0%) |
| $300,000 to $499,999 | 29,293 (23.0%) | 56,159 (21.6%) |
| $500,000 to $749,999 | 38,585 (30.3%) | 84,564 (32.6%) |
| $750,000 to $999,999 | 23,737 (18.6%) | 52,706 (20.3%) |
| $1,000,000 or more | 22,798 (17.9%) | 47,291 (18.2%) |
| Total | 127,514 (100.0%) | 259,795 (100.0%) |
Household Income by Mortgage Status in Middlesex County
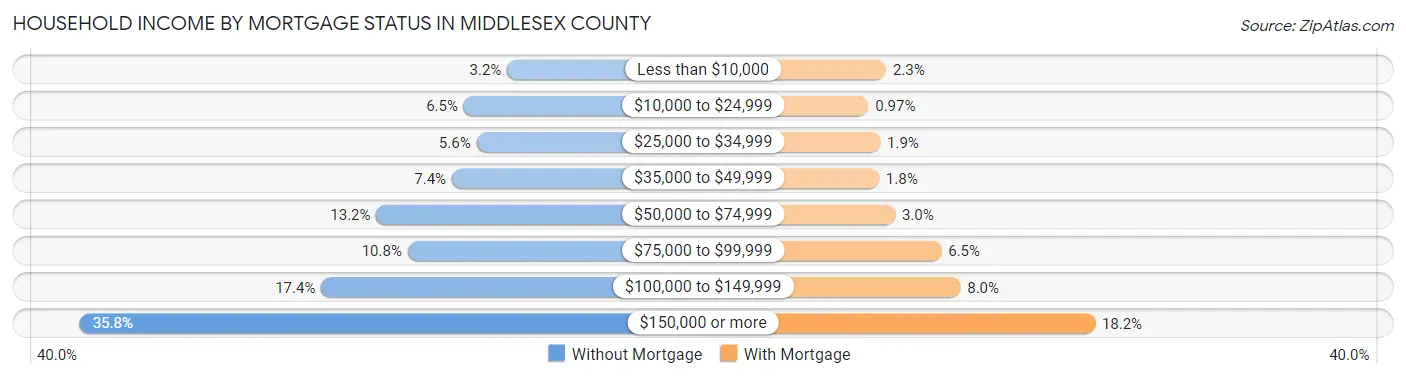
| Household Income | Without Mortgage | With Mortgage |
| Less than $10,000 | 4,122 (3.2%) | 6,016 (2.3%) |
| $10,000 to $24,999 | 8,334 (6.5%) | 2,519 (1.0%) |
| $25,000 to $34,999 | 7,106 (5.6%) | 4,851 (1.9%) |
| $35,000 to $49,999 | 9,487 (7.4%) | 4,614 (1.8%) |
| $50,000 to $74,999 | 16,833 (13.2%) | 7,805 (3.0%) |
| $75,000 to $99,999 | 13,790 (10.8%) | 16,952 (6.5%) |
| $100,000 to $149,999 | 22,186 (17.4%) | 20,734 (8.0%) |
| $150,000 or more | 45,656 (35.8%) | 47,387 (18.2%) |
| Total | 127,514 (100.0%) | 259,795 (100.0%) |
Property Value to Household Income Ratio in Middlesex County
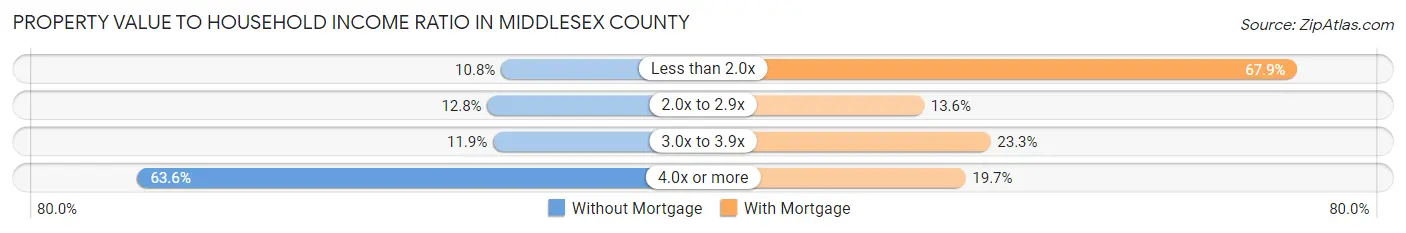
| Value-to-Income Ratio | Without Mortgage | With Mortgage |
| Less than 2.0x | 13,723 (10.8%) | 176,444 (67.9%) |
| 2.0x to 2.9x | 16,257 (12.8%) | 35,440 (13.6%) |
| 3.0x to 3.9x | 15,223 (11.9%) | 60,562 (23.3%) |
| 4.0x or more | 81,081 (63.6%) | 51,118 (19.7%) |
| Total | 127,514 (100.0%) | 259,795 (100.0%) |
Real Estate Taxes by Mortgage Status in Middlesex County
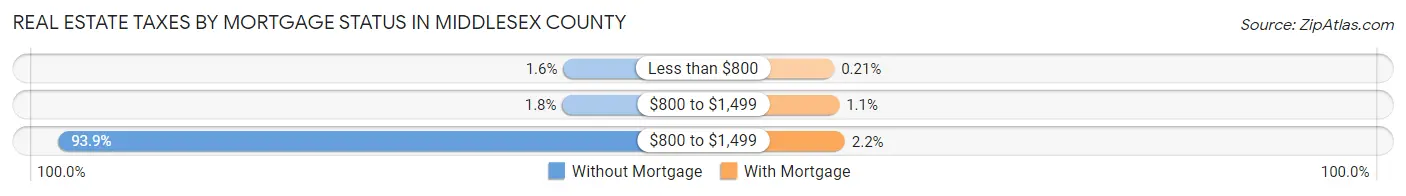
| Property Taxes | Without Mortgage | With Mortgage |
| Less than $800 | 2,058 (1.6%) | 539 (0.2%) |
| $800 to $1,499 | 2,264 (1.8%) | 2,935 (1.1%) |
| $800 to $1,499 | 119,680 (93.9%) | 5,587 (2.1%) |
| Total | 127,514 (100.0%) | 259,795 (100.0%) |
Health & Disability in Middlesex County
Health Insurance Coverage by Age in Middlesex County
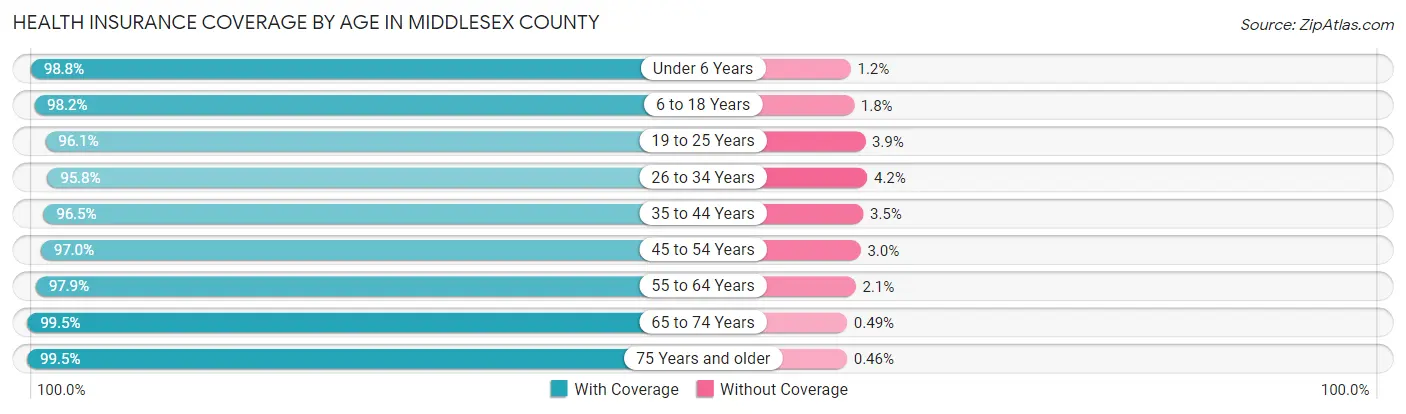
| Age Bracket | With Coverage | Without Coverage |
| Under 6 Years | 98,533 (98.8%) | 1,156 (1.2%) |
| 6 to 18 Years | 238,504 (98.2%) | 4,327 (1.8%) |
| 19 to 25 Years | 153,678 (96.1%) | 6,165 (3.9%) |
| 26 to 34 Years | 209,155 (95.8%) | 9,254 (4.2%) |
| 35 to 44 Years | 211,342 (96.5%) | 7,674 (3.5%) |
| 45 to 54 Years | 203,945 (97.0%) | 6,342 (3.0%) |
| 55 to 64 Years | 206,300 (97.9%) | 4,421 (2.1%) |
| 65 to 74 Years | 144,900 (99.5%) | 714 (0.5%) |
| 75 Years and older | 102,495 (99.5%) | 476 (0.5%) |
| Total | 1,568,852 (97.5%) | 40,529 (2.5%) |
Health Insurance Coverage by Citizenship Status in Middlesex County
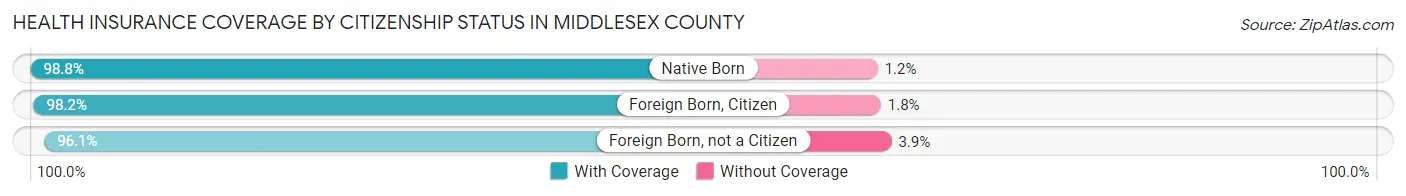
| Citizenship Status | With Coverage | Without Coverage |
| Native Born | 98,533 (98.8%) | 1,156 (1.2%) |
| Foreign Born, Citizen | 238,504 (98.2%) | 4,327 (1.8%) |
| Foreign Born, not a Citizen | 153,678 (96.1%) | 6,165 (3.9%) |
Health Insurance Coverage by Household Income in Middlesex County
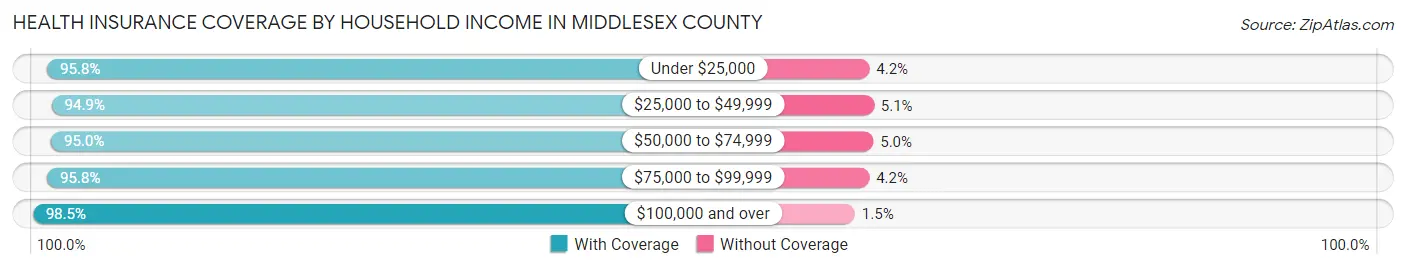
| Household Income | With Coverage | Without Coverage |
| Under $25,000 | 97,998 (95.8%) | 4,325 (4.2%) |
| $25,000 to $49,999 | 117,550 (94.9%) | 6,274 (5.1%) |
| $50,000 to $74,999 | 130,689 (95.0%) | 6,823 (5.0%) |
| $75,000 to $99,999 | 138,557 (95.8%) | 6,077 (4.2%) |
| $100,000 and over | 1,043,849 (98.5%) | 16,107 (1.5%) |
Public vs Private Health Insurance Coverage by Age in Middlesex County
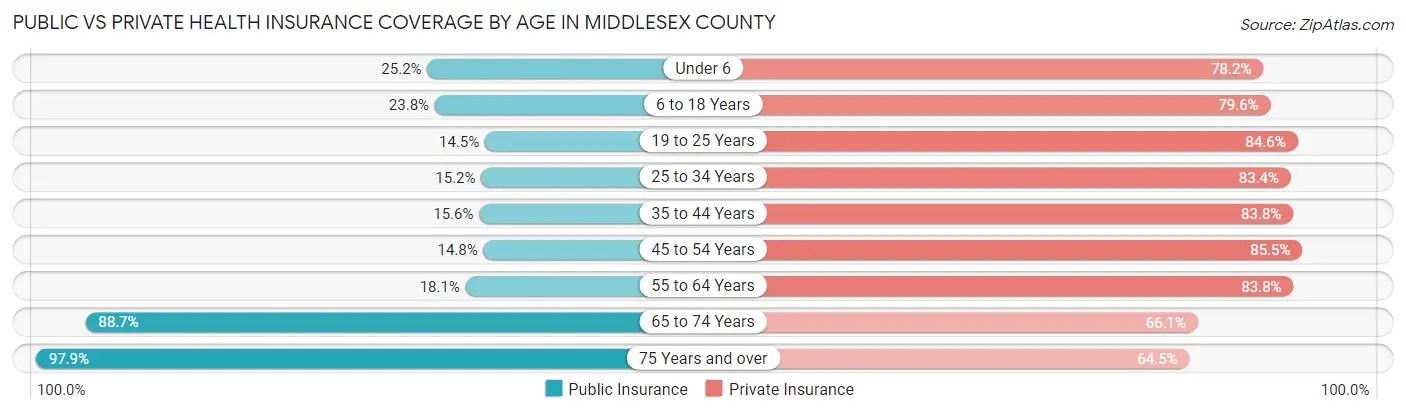
| Age Bracket | Public Insurance | Private Insurance |
| Under 6 | 25,151 (25.2%) | 77,976 (78.2%) |
| 6 to 18 Years | 57,887 (23.8%) | 193,195 (79.6%) |
| 19 to 25 Years | 23,238 (14.5%) | 135,226 (84.6%) |
| 25 to 34 Years | 33,246 (15.2%) | 182,051 (83.4%) |
| 35 to 44 Years | 34,191 (15.6%) | 183,480 (83.8%) |
| 45 to 54 Years | 31,128 (14.8%) | 179,740 (85.5%) |
| 55 to 64 Years | 38,203 (18.1%) | 176,651 (83.8%) |
| 65 to 74 Years | 129,196 (88.7%) | 96,227 (66.1%) |
| 75 Years and over | 100,830 (97.9%) | 66,441 (64.5%) |
| Total | 473,070 (29.4%) | 1,290,987 (80.2%) |
Disability Status by Sex by Age in Middlesex County
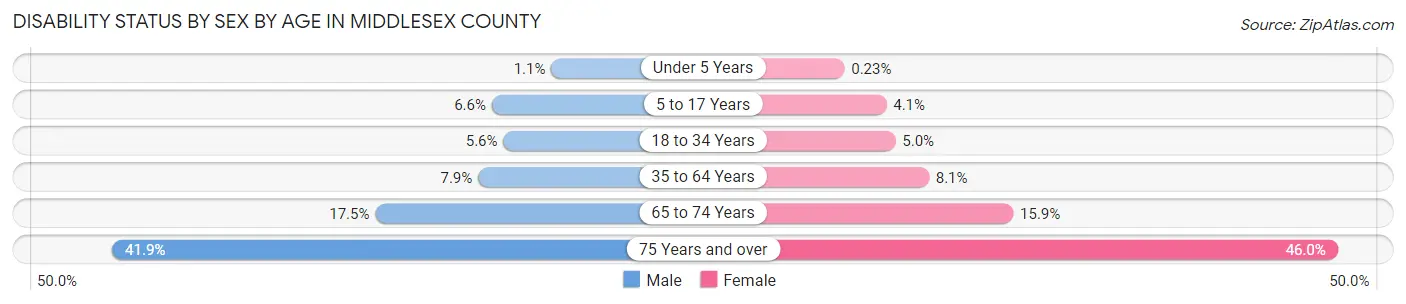
| Age Bracket | Male | Female |
| Under 5 Years | 474 (1.1%) | 94 (0.2%) |
| 5 to 17 Years | 7,954 (6.6%) | 4,706 (4.1%) |
| 18 to 34 Years | 11,427 (5.6%) | 9,900 (5.0%) |
| 35 to 64 Years | 25,130 (7.9%) | 25,982 (8.1%) |
| 65 to 74 Years | 11,851 (17.4%) | 12,357 (15.9%) |
| 75 Years and over | 17,321 (41.9%) | 28,346 (46.0%) |
Disability Class by Sex by Age in Middlesex County
Disability Class: Hearing Difficulty
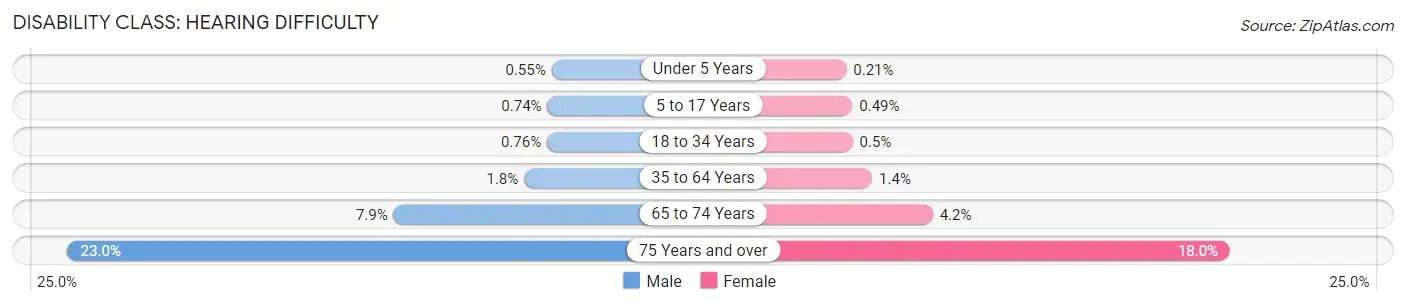
| Age Bracket | Male | Female |
| Under 5 Years | 231 (0.5%) | 83 (0.2%) |
| 5 to 17 Years | 884 (0.7%) | 560 (0.5%) |
| 18 to 34 Years | 1,565 (0.8%) | 1,002 (0.5%) |
| 35 to 64 Years | 5,792 (1.8%) | 4,530 (1.4%) |
| 65 to 74 Years | 5,350 (7.9%) | 3,281 (4.2%) |
| 75 Years and over | 9,515 (23.0%) | 11,096 (18.0%) |
Disability Class: Vision Difficulty
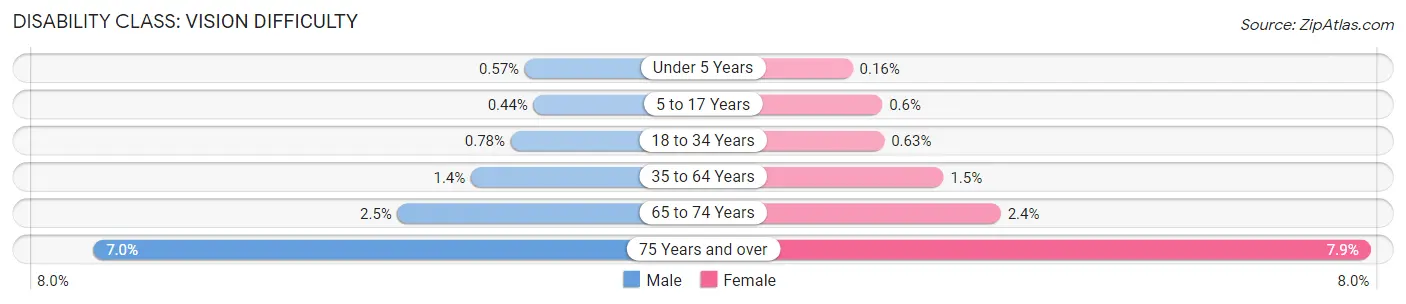
| Age Bracket | Male | Female |
| Under 5 Years | 243 (0.6%) | 65 (0.2%) |
| 5 to 17 Years | 529 (0.4%) | 690 (0.6%) |
| 18 to 34 Years | 1,608 (0.8%) | 1,259 (0.6%) |
| 35 to 64 Years | 4,357 (1.4%) | 4,861 (1.5%) |
| 65 to 74 Years | 1,671 (2.5%) | 1,834 (2.4%) |
| 75 Years and over | 2,886 (7.0%) | 4,833 (7.9%) |
Disability Class: Cognitive Difficulty
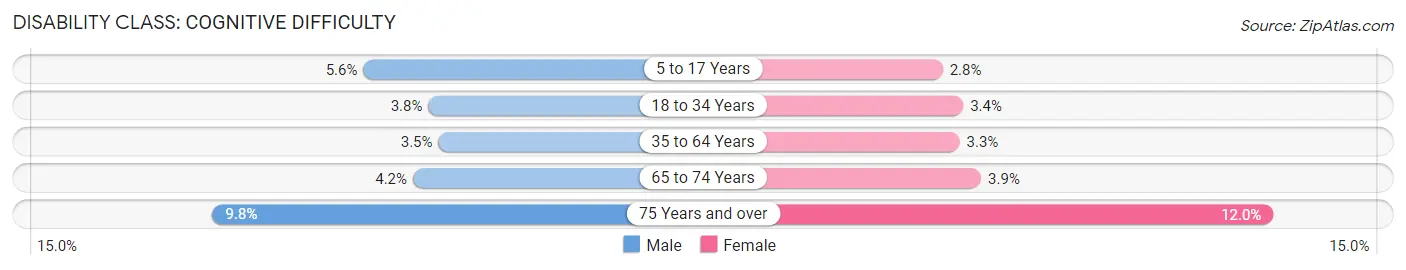
| Age Bracket | Male | Female |
| 5 to 17 Years | 6,670 (5.6%) | 3,200 (2.8%) |
| 18 to 34 Years | 7,718 (3.8%) | 6,736 (3.4%) |
| 35 to 64 Years | 11,069 (3.5%) | 10,551 (3.3%) |
| 65 to 74 Years | 2,844 (4.2%) | 3,011 (3.9%) |
| 75 Years and over | 4,042 (9.8%) | 7,400 (12.0%) |
Disability Class: Ambulatory Difficulty
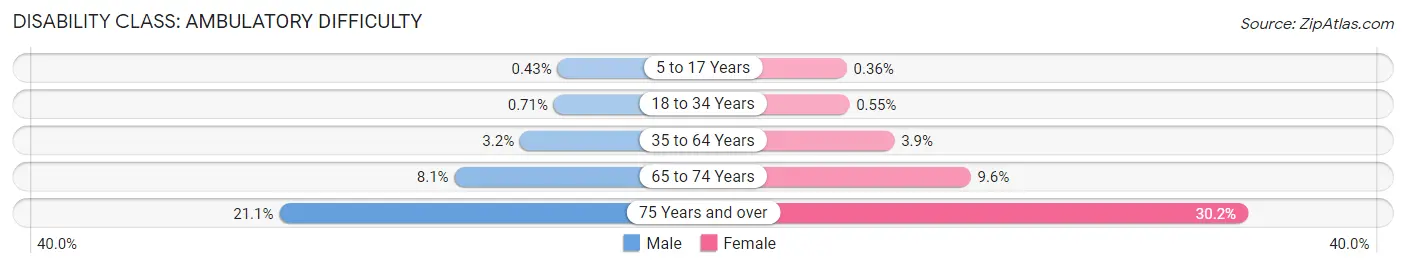
| Age Bracket | Male | Female |
| 5 to 17 Years | 520 (0.4%) | 407 (0.4%) |
| 18 to 34 Years | 1,462 (0.7%) | 1,087 (0.5%) |
| 35 to 64 Years | 10,222 (3.2%) | 12,546 (3.9%) |
| 65 to 74 Years | 5,497 (8.1%) | 7,427 (9.6%) |
| 75 Years and over | 8,727 (21.1%) | 18,572 (30.1%) |
Disability Class: Self-Care Difficulty
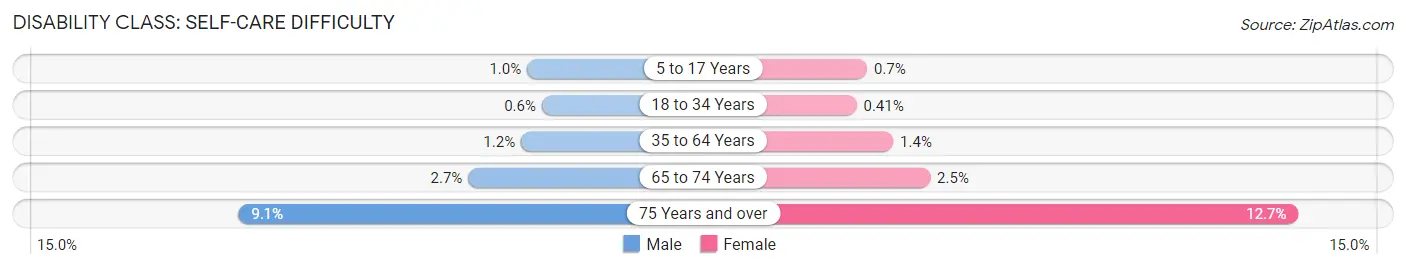
| Age Bracket | Male | Female |
| 5 to 17 Years | 1,205 (1.0%) | 800 (0.7%) |
| 18 to 34 Years | 1,226 (0.6%) | 810 (0.4%) |
| 35 to 64 Years | 3,758 (1.2%) | 4,616 (1.4%) |
| 65 to 74 Years | 1,798 (2.6%) | 1,914 (2.5%) |
| 75 Years and over | 3,743 (9.0%) | 7,827 (12.7%) |
Technology Access in Middlesex County
Computing Device Access in Middlesex County
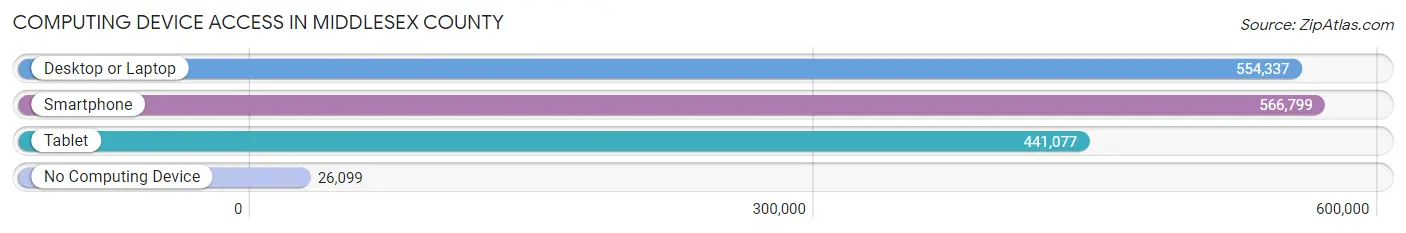
| Device Type | # Households | % Households |
| Desktop or Laptop | 554,337 | 88.0% |
| Smartphone | 566,799 | 90.0% |
| Tablet | 441,077 | 70.0% |
| No Computing Device | 26,099 | 4.1% |
| Total | 629,775 | 100.0% |
Internet Access in Middlesex County
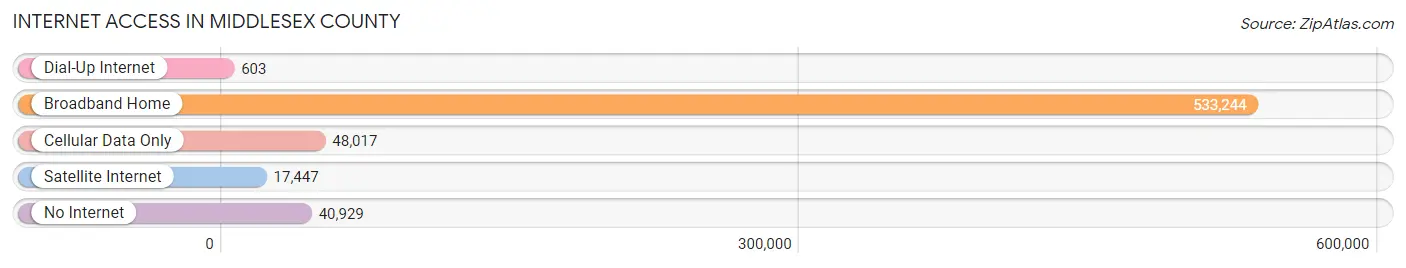
| Internet Type | # Households | % Households |
| Dial-Up Internet | 603 | 0.1% |
| Broadband Home | 533,244 | 84.7% |
| Cellular Data Only | 48,017 | 7.6% |
| Satellite Internet | 17,447 | 2.8% |
| No Internet | 40,929 | 6.5% |
| Total | 629,775 | 100.0% |
Middlesex County Summary
Middlesex County, Massachusetts is located in the northeastern part of the state and is the most populous county in the state. It is bordered by Essex County to the north, Suffolk County to the east, Norfolk County to the south, and Worcester County to the west. The county seat is Cambridge, and the largest city is Lowell.
History
Middlesex County was established in 1643 and was one of the original four counties of the Massachusetts Bay Colony. It was named after the English county of Middlesex, which was located in the same area. The county was originally divided into four towns: Cambridge, Charlestown, Watertown, and Concord. In 1649, the towns of Billerica, Chelmsford, and Woburn were added. In 1686, the towns of Sudbury and Groton were added.
In the late 1700s, the county experienced a period of rapid growth and development. The towns of Lexington and Bedford were added in 1775, and the towns of Acton, Carlisle, and Westford were added in 1780. The county was also home to the first public school in the United States, the Boston Latin School, which was founded in 1635.
Geography
Middlesex County covers an area of 845 square miles and is located in the northeastern part of the state. It is bordered by Essex County to the north, Suffolk County to the east, Norfolk County to the south, and Worcester County to the west. The county is divided into two regions: the Greater Boston area and the Merrimack Valley. The county is home to several rivers, including the Concord, Merrimack, and Nashua rivers.
The county is home to several parks and recreational areas, including the Middlesex Fells Reservation, the Great Meadows National Wildlife Refuge, and the Assabet River National Wildlife Refuge. The county is also home to several historic sites, including the Minute Man National Historical Park, the Lowell National Historical Park, and the Concord Museum.
Economy
Middlesex County has a diverse economy that is driven by several industries, including healthcare, education, technology, finance, and manufacturing. The county is home to several major employers, including Harvard University, Massachusetts General Hospital, and Raytheon.
The county is also home to several major shopping centers, including the Burlington Mall, the Natick Mall, and the CambridgeSide Galleria. The county is also home to several major airports, including Logan International Airport, Hanscom Field, and the Worcester Regional Airport.
Demographics
As of the 2010 census, Middlesex County had a population of 1,503,085. The population was spread out with 24.3% under the age of 18, 10.3% from 18 to 24, 33.2% from 25 to 44, 22.2% from 45 to 64, and 10.0% who were 65 years of age or older. The median age was 34.5 years.
The racial makeup of the county was 79.2% White, 8.3% African American, 0.3% Native American, 8.2% Asian, 0.1% Pacific Islander, 1.3% from other races, and 2.6% from two or more races. Hispanic or Latino of any race were 5.2% of the population.
The median income for a household in the county was $76,824 and the median income for a family was $90,856. The per capita income for the county was $37,890. About 6.2% of families and 8.7% of the population were below the poverty line, including 11.2% of those under age 18 and 6.2% of those age 65 or over.
Common Questions
What is Per Capita Income in Middlesex County?
Per Capita income in Middlesex County is $64,197.
What is the Median Family Income in Middlesex County?
Median Family Income in Middlesex County is $153,239.
What is the Median Household income in Middlesex County?
Median Household Income in Middlesex County is $121,304.
What is Income or Wage Gap in Middlesex County?
Income or Wage Gap in Middlesex County is 28.7%.
Women in Middlesex County earn 71.3 cents for every dollar earned by a man.
What is Family Income Deficit in Middlesex County?
Family Income Deficit in Middlesex County is $10,830.
Families that are below poverty line in Middlesex County earn $10,830 less on average than the poverty threshold level.
What is Inequality or Gini Index in Middlesex County?
Inequality or Gini Index in Middlesex County is 0.47.
What is the Total Population of Middlesex County?
Total Population of Middlesex County is 1,623,109.
What is the Total Male Population of Middlesex County?
Total Male Population of Middlesex County is 802,270.
What is the Total Female Population of Middlesex County?
Total Female Population of Middlesex County is 820,839.
What is the Ratio of Males per 100 Females in Middlesex County?
There are 97.74 Males per 100 Females in Middlesex County.
What is the Ratio of Females per 100 Males in Middlesex County?
There are 102.31 Females per 100 Males in Middlesex County.
What is the Median Population Age in Middlesex County?
Median Population Age in Middlesex County is 38.8 Years.
What is the Average Family Size in Middlesex County
Average Family Size in Middlesex County is 3.1 People.
What is the Average Household Size in Middlesex County
Average Household Size in Middlesex County is 2.5 People.
How Large is the Labor Force in Middlesex County?
There are 939,000 People in the Labor Forcein in Middlesex County.
What is the Percentage of People in the Labor Force in Middlesex County?
69.9% of People are in the Labor Force in Middlesex County.
What is the Unemployment Rate in Middlesex County?
Unemployment Rate in Middlesex County is 4.4%.