Zip Codes with the Highest Percentage of Population with a Degree in Engineering in Hammond, IN
RELATED REPORTS & OPTIONS
Engineering
Hammond
Compare Zip Codes
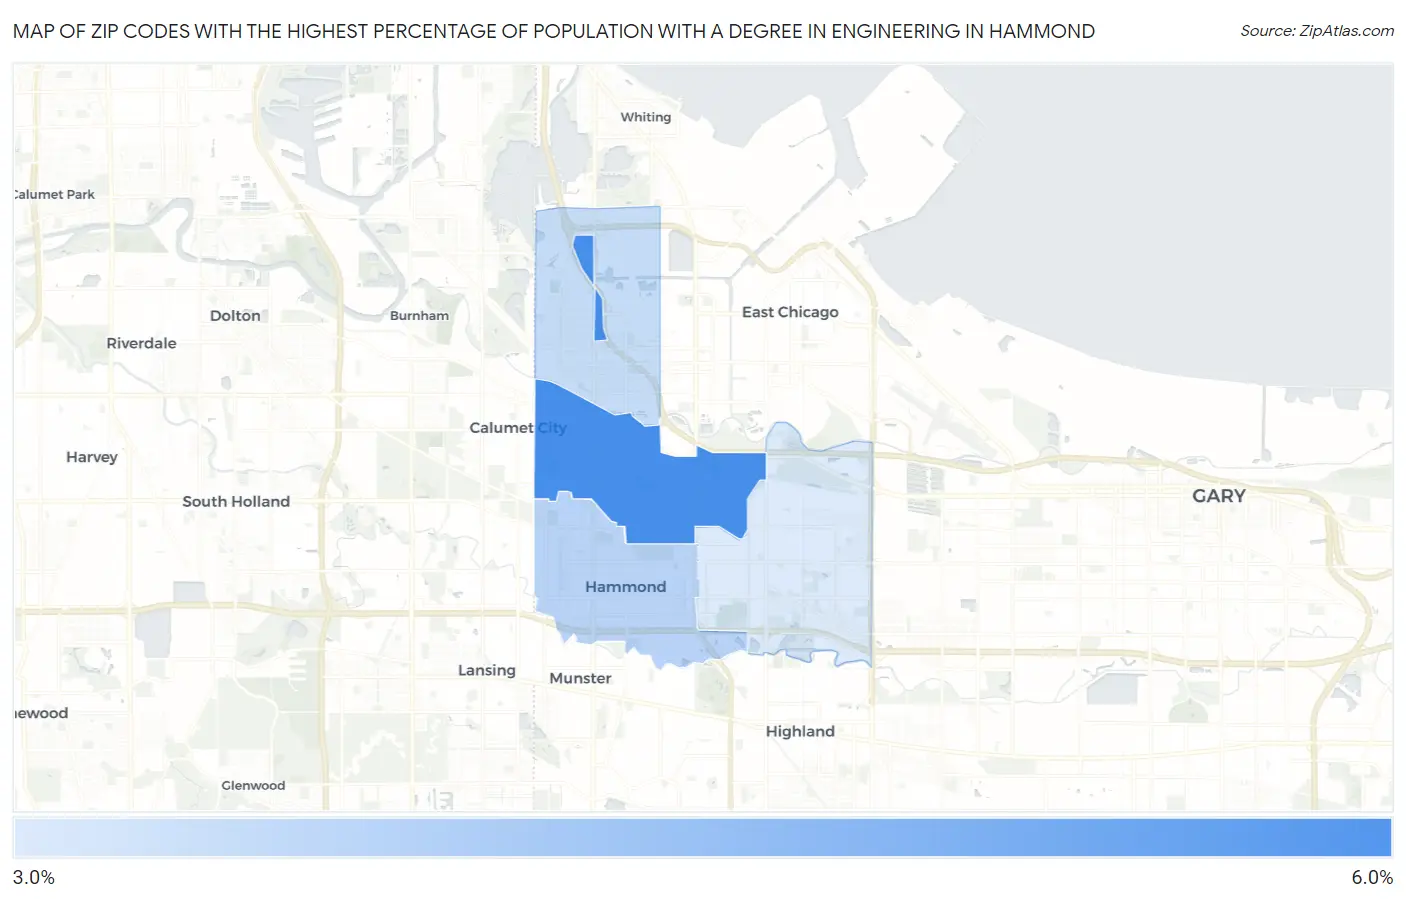
Map of Zip Codes with the Highest Percentage of Population with a Degree in Engineering in Hammond
3.1%
5.6%
Zip Codes with the Highest Percentage of Population with a Degree in Engineering in Hammond, IN
| Zip Code | % Graduates | vs State | vs National | |
| 1. | 46320 | 5.6% | 6.6%(-1.06)#269 | 7.6%(-2.08)#12,281 |
| 2. | 46324 | 3.7% | 6.6%(-2.90)#384 | 7.6%(-3.93)#17,090 |
| 3. | 46327 | 3.5% | 6.6%(-3.10)#392 | 7.6%(-4.13)#17,610 |
| 4. | 46323 | 3.1% | 6.6%(-3.49)#423 | 7.6%(-4.51)#18,547 |
1
Common Questions
What are the Top 3 Zip Codes with the Highest Percentage of Population with a Degree in Engineering in Hammond, IN?
Top 3 Zip Codes with the Highest Percentage of Population with a Degree in Engineering in Hammond, IN are:
What zip code has the Highest Percentage of Population with a Degree in Engineering in Hammond, IN?
46320 has the Highest Percentage of Population with a Degree in Engineering in Hammond, IN with 5.6%.
What is the Percentage of Population with a Degree in Engineering in Hammond, IN?
Percentage of Population with a Degree in Engineering in Hammond is 3.7%.
What is the Percentage of Population with a Degree in Engineering in Indiana?
Percentage of Population with a Degree in Engineering in Indiana is 6.6%.
What is the Percentage of Population with a Degree in Engineering in the United States?
Percentage of Population with a Degree in Engineering in the United States is 7.6%.