Zip Codes with the Highest Percentage of Population with a Degree in Engineering in Indiana
RELATED REPORTS & OPTIONS
Engineering
Indiana
Compare Zip Codes
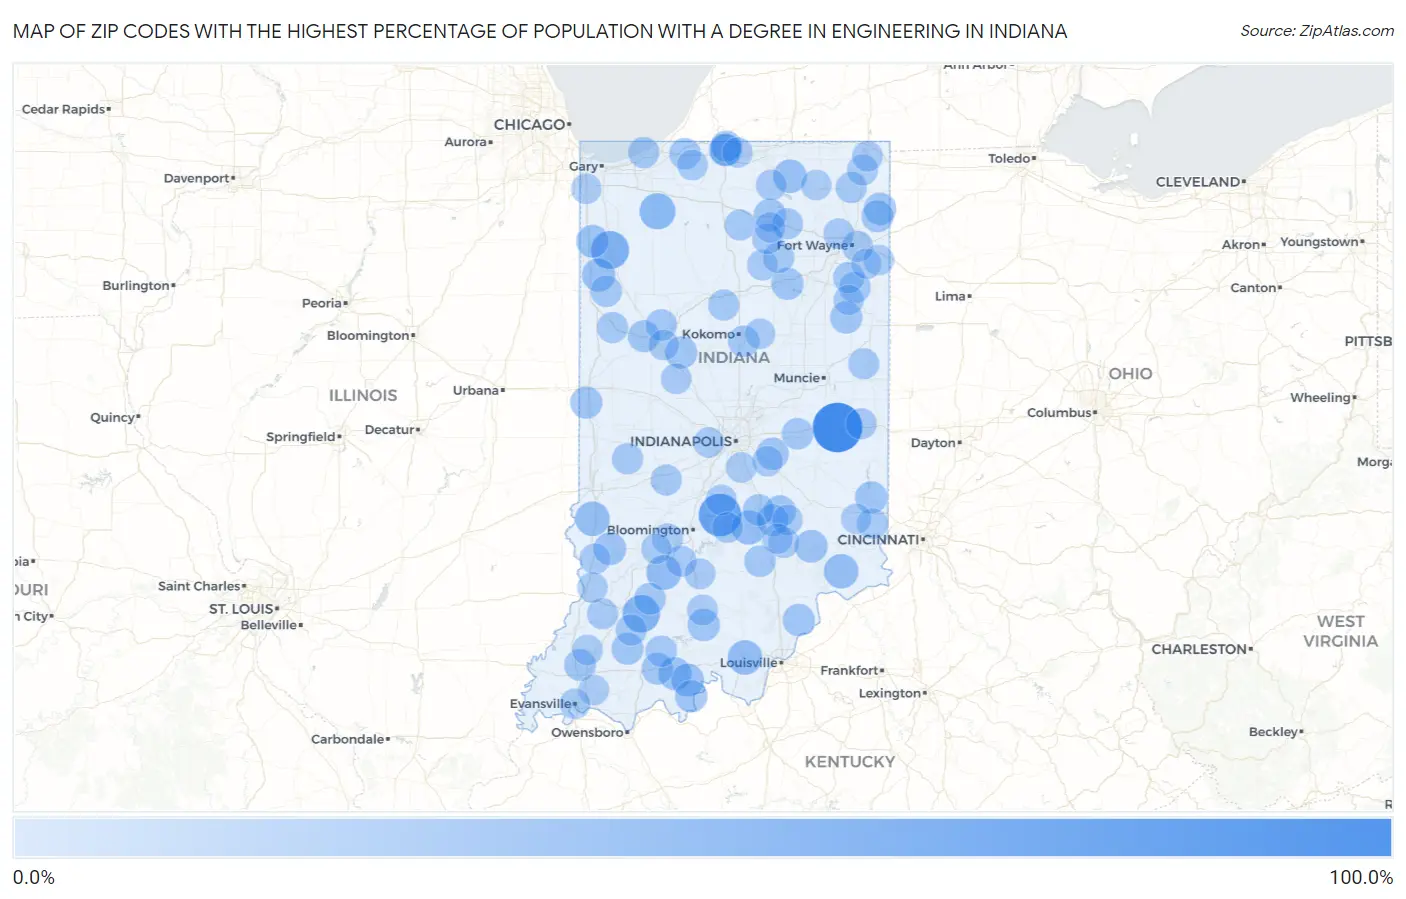
Map of Zip Codes with the Highest Percentage of Population with a Degree in Engineering in Indiana
0.0%
100.0%
Zip Codes with the Highest Percentage of Population with a Degree in Engineering in Indiana
| Zip Code | % Graduates | vs State | vs National | |
| 1. | 47366 | 100.0% | 6.6%(+93.4)#1 | 7.6%(+92.4)#43 |
| 2. | 47435 | 66.7% | 6.6%(+60.0)#2 | 7.6%(+59.0)#77 |
| 3. | 47943 | 45.3% | 6.6%(+38.7)#3 | 7.6%(+37.6)#174 |
| 4. | 47519 | 42.3% | 6.6%(+35.7)#4 | 7.6%(+34.7)#196 |
| 5. | 46348 | 36.1% | 6.6%(+29.5)#5 | 7.6%(+28.5)#261 |
| 6. | 47522 | 30.0% | 6.6%(+23.4)#6 | 7.6%(+22.4)#371 |
| 7. | 47114 | 28.9% | 6.6%(+22.3)#7 | 7.6%(+21.3)#390 |
| 8. | 47224 | 28.8% | 6.6%(+22.2)#8 | 7.6%(+21.1)#400 |
| 9. | 47850 | 28.5% | 6.6%(+21.8)#9 | 7.6%(+20.8)#417 |
| 10. | 47201 | 27.5% | 6.6%(+20.8)#10 | 7.6%(+19.8)#445 |
| 11. | 46543 | 24.6% | 6.6%(+18.0)#11 | 7.6%(+17.0)#574 |
| 12. | 47922 | 23.5% | 6.6%(+16.8)#12 | 7.6%(+15.8)#630 |
| 13. | 47515 | 21.7% | 6.6%(+15.1)#13 | 7.6%(+14.1)#735 |
| 14. | 47551 | 21.6% | 6.6%(+15.0)#14 | 7.6%(+14.0)#742 |
| 15. | 47223 | 20.9% | 6.6%(+14.3)#15 | 7.6%(+13.2)#819 |
| 16. | 46349 | 20.1% | 6.6%(+13.5)#16 | 7.6%(+12.5)#897 |
| 17. | 47848 | 19.8% | 6.6%(+13.2)#17 | 7.6%(+12.2)#932 |
| 18. | 46582 | 19.7% | 6.6%(+13.0)#18 | 7.6%(+12.0)#949 |
| 19. | 47454 | 19.1% | 6.6%(+12.4)#19 | 7.6%(+11.4)#1,014 |
| 20. | 47525 | 19.0% | 6.6%(+12.3)#20 | 7.6%(+11.3)#1,034 |
| 21. | 47012 | 18.9% | 6.6%(+12.3)#21 | 7.6%(+11.2)#1,048 |
| 22. | 46130 | 18.7% | 6.6%(+12.0)#22 | 7.6%(+11.0)#1,075 |
| 23. | 46759 | 18.6% | 6.6%(+12.0)#23 | 7.6%(+11.0)#1,079 |
| 24. | 46556 | 18.5% | 6.6%(+11.9)#24 | 7.6%(+10.9)#1,093 |
| 25. | 47141 | 18.4% | 6.6%(+11.8)#25 | 7.6%(+10.8)#1,107 |
| 26. | 46785 | 18.4% | 6.6%(+11.8)#26 | 7.6%(+10.8)#1,108 |
| 27. | 46941 | 18.3% | 6.6%(+11.7)#27 | 7.6%(+10.7)#1,122 |
| 28. | 46058 | 18.2% | 6.6%(+11.6)#28 | 7.6%(+10.6)#1,129 |
| 29. | 47974 | 18.1% | 6.6%(+11.5)#29 | 7.6%(+10.4)#1,152 |
| 30. | 46624 | 17.5% | 6.6%(+10.9)#30 | 7.6%(+9.85)#1,221 |
| 31. | 46788 | 17.2% | 6.6%(+10.6)#31 | 7.6%(+9.56)#1,281 |
| 32. | 47590 | 17.1% | 6.6%(+10.5)#32 | 7.6%(+9.50)#1,293 |
| 33. | 47246 | 16.9% | 6.6%(+10.3)#33 | 7.6%(+9.29)#1,329 |
| 34. | 47906 | 16.6% | 6.6%(+10.0)#34 | 7.6%(+8.99)#1,383 |
| 35. | 47532 | 16.3% | 6.6%(+9.68)#35 | 7.6%(+8.66)#1,436 |
| 36. | 47203 | 16.3% | 6.6%(+9.66)#36 | 7.6%(+8.64)#1,441 |
| 37. | 47648 | 16.3% | 6.6%(+9.64)#37 | 7.6%(+8.62)#1,444 |
| 38. | 47553 | 16.0% | 6.6%(+9.40)#38 | 7.6%(+8.38)#1,490 |
| 39. | 47280 | 15.7% | 6.6%(+9.05)#39 | 7.6%(+8.02)#1,569 |
| 40. | 47274 | 15.4% | 6.6%(+8.76)#40 | 7.6%(+7.74)#1,659 |
| 41. | 47920 | 15.4% | 6.6%(+8.75)#41 | 7.6%(+7.73)#1,662 |
| 42. | 46117 | 15.1% | 6.6%(+8.46)#42 | 7.6%(+7.43)#1,728 |
| 43. | 46902 | 15.0% | 6.6%(+8.40)#43 | 7.6%(+7.38)#1,744 |
| 44. | 46371 | 14.9% | 6.6%(+8.32)#44 | 7.6%(+7.30)#1,758 |
| 45. | 46731 | 14.5% | 6.6%(+7.92)#45 | 7.6%(+6.90)#1,855 |
| 46. | 47575 | 14.3% | 6.6%(+7.66)#46 | 7.6%(+6.64)#1,932 |
| 47. | 47948 | 14.2% | 6.6%(+7.54)#47 | 7.6%(+6.52)#1,974 |
| 48. | 46301 | 14.1% | 6.6%(+7.44)#48 | 7.6%(+6.41)#1,993 |
| 49. | 47837 | 13.9% | 6.6%(+7.27)#49 | 7.6%(+6.24)#2,060 |
| 50. | 47971 | 13.9% | 6.6%(+7.25)#50 | 7.6%(+6.22)#2,071 |
| 51. | 47564 | 13.8% | 6.6%(+7.21)#51 | 7.6%(+6.18)#2,090 |
| 52. | 46777 | 13.7% | 6.6%(+7.12)#52 | 7.6%(+6.10)#2,121 |
| 53. | 46730 | 13.6% | 6.6%(+6.96)#53 | 7.6%(+5.94)#2,174 |
| 54. | 46637 | 13.5% | 6.6%(+6.91)#54 | 7.6%(+5.89)#2,202 |
| 55. | 46994 | 13.3% | 6.6%(+6.63)#55 | 7.6%(+5.61)#2,323 |
| 56. | 47380 | 13.2% | 6.6%(+6.58)#56 | 7.6%(+5.56)#2,338 |
| 57. | 46962 | 13.2% | 6.6%(+6.58)#57 | 7.6%(+5.55)#2,341 |
| 58. | 46562 | 13.2% | 6.6%(+6.53)#58 | 7.6%(+5.51)#2,356 |
| 59. | 47345 | 13.0% | 6.6%(+6.40)#59 | 7.6%(+5.37)#2,400 |
| 60. | 46570 | 12.9% | 6.6%(+6.28)#60 | 7.6%(+5.26)#2,447 |
| 61. | 46120 | 12.8% | 6.6%(+6.18)#61 | 7.6%(+5.16)#2,493 |
| 62. | 46803 | 12.7% | 6.6%(+6.06)#62 | 7.6%(+5.04)#2,545 |
| 63. | 46779 | 12.6% | 6.6%(+5.95)#63 | 7.6%(+4.92)#2,587 |
| 64. | 47273 | 12.4% | 6.6%(+5.77)#64 | 7.6%(+4.74)#2,685 |
| 65. | 47452 | 12.4% | 6.6%(+5.75)#65 | 7.6%(+4.73)#2,693 |
| 66. | 47462 | 12.4% | 6.6%(+5.75)#66 | 7.6%(+4.72)#2,697 |
| 67. | 47557 | 12.4% | 6.6%(+5.74)#67 | 7.6%(+4.71)#2,707 |
| 68. | 46974 | 12.3% | 6.6%(+5.71)#68 | 7.6%(+4.68)#2,729 |
| 69. | 46160 | 12.3% | 6.6%(+5.65)#69 | 7.6%(+4.62)#2,769 |
| 70. | 47022 | 12.1% | 6.6%(+5.46)#70 | 7.6%(+4.44)#2,851 |
| 71. | 47459 | 11.9% | 6.6%(+5.27)#71 | 7.6%(+4.25)#2,949 |
| 72. | 46553 | 11.7% | 6.6%(+5.06)#72 | 7.6%(+4.04)#3,059 |
| 73. | 47838 | 11.6% | 6.6%(+4.98)#73 | 7.6%(+3.96)#3,110 |
| 74. | 46818 | 11.6% | 6.6%(+4.98)#74 | 7.6%(+3.95)#3,112 |
| 75. | 46510 | 11.5% | 6.6%(+4.92)#75 | 7.6%(+3.89)#3,140 |
| 76. | 46703 | 11.5% | 6.6%(+4.86)#76 | 7.6%(+3.84)#3,191 |
| 77. | 47448 | 11.4% | 6.6%(+4.76)#77 | 7.6%(+3.73)#3,269 |
| 78. | 47421 | 11.4% | 6.6%(+4.73)#78 | 7.6%(+3.71)#3,288 |
| 79. | 46035 | 11.3% | 6.6%(+4.72)#79 | 7.6%(+3.69)#3,295 |
| 80. | 46365 | 11.3% | 6.6%(+4.64)#80 | 7.6%(+3.61)#3,356 |
| 81. | 47649 | 11.2% | 6.6%(+4.57)#81 | 7.6%(+3.54)#3,411 |
| 82. | 46580 | 11.1% | 6.6%(+4.52)#82 | 7.6%(+3.50)#3,435 |
| 83. | 47244 | 11.0% | 6.6%(+4.35)#83 | 7.6%(+3.33)#3,566 |
| 84. | 46143 | 10.7% | 6.6%(+4.09)#84 | 7.6%(+3.06)#3,775 |
| 85. | 46794 | 10.7% | 6.6%(+4.04)#85 | 7.6%(+3.02)#3,814 |
| 86. | 47905 | 10.6% | 6.6%(+4.00)#86 | 7.6%(+2.98)#3,850 |
| 87. | 47516 | 10.6% | 6.6%(+3.98)#87 | 7.6%(+2.96)#3,874 |
| 88. | 46123 | 10.6% | 6.6%(+3.93)#88 | 7.6%(+2.90)#3,930 |
| 89. | 47610 | 10.5% | 6.6%(+3.88)#89 | 7.6%(+2.85)#3,977 |
| 90. | 46936 | 10.5% | 6.6%(+3.84)#90 | 7.6%(+2.82)#4,011 |
| 91. | 46126 | 10.4% | 6.6%(+3.81)#91 | 7.6%(+2.78)#4,047 |
| 92. | 46373 | 10.3% | 6.6%(+3.65)#92 | 7.6%(+2.62)#4,202 |
| 93. | 46773 | 10.3% | 6.6%(+3.63)#93 | 7.6%(+2.61)#4,214 |
| 94. | 46745 | 10.1% | 6.6%(+3.52)#94 | 7.6%(+2.50)#4,322 |
| 95. | 46714 | 10.0% | 6.6%(+3.42)#95 | 7.6%(+2.40)#4,404 |
| 96. | 47708 | 10.0% | 6.6%(+3.42)#96 | 7.6%(+2.39)#4,408 |
| 97. | 47232 | 10.0% | 6.6%(+3.40)#97 | 7.6%(+2.38)#4,418 |
| 98. | 47424 | 10.0% | 6.6%(+3.39)#98 | 7.6%(+2.37)#4,427 |
| 99. | 46545 | 9.9% | 6.6%(+3.26)#99 | 7.6%(+2.24)#4,549 |
| 100. | 47041 | 9.9% | 6.6%(+3.25)#100 | 7.6%(+2.22)#4,559 |
Common Questions
What are the Top 10 Zip Codes with the Highest Percentage of Population with a Degree in Engineering in Indiana?
Top 10 Zip Codes with the Highest Percentage of Population with a Degree in Engineering in Indiana are:
What zip code has the Highest Percentage of Population with a Degree in Engineering in Indiana?
47366 has the Highest Percentage of Population with a Degree in Engineering in Indiana with 100.0%.
What is the Percentage of Population with a Degree in Engineering in the State of Indiana?
Percentage of Population with a Degree in Engineering in Indiana is 6.6%.
What is the Percentage of Population with a Degree in Engineering in the United States?
Percentage of Population with a Degree in Engineering in the United States is 7.6%.