Millhousen, IN Map & Demographics
Millhousen Map
Millhousen Overview
$39,300
PER CAPITA INCOME
$80,278
AVG FAMILY INCOME
$70,000
AVG HOUSEHOLD INCOME
0.6%
WAGE / INCOME GAP [ % ]
99.4¢/ $1
WAGE / INCOME GAP [ $ ]
0.33
INEQUALITY / GINI INDEX
267
TOTAL POPULATION
159
MALE POPULATION
108
FEMALE POPULATION
147.22
MALES / 100 FEMALES
67.92
FEMALES / 100 MALES
47.4
MEDIAN AGE
2.5
AVG FAMILY SIZE
2.1
AVG HOUSEHOLD SIZE
133
LABOR FORCE [ PEOPLE ]
57.6%
PERCENT IN LABOR FORCE
6.8%
UNEMPLOYMENT RATE
Income in Millhousen
Income Overview in Millhousen
Per Capita Income in Millhousen is $39,300, while median incomes of families and households are $80,278 and $70,000 respectively.
| Characteristic | Number | Measure |
| Per Capita Income | 267 | $39,300 |
| Median Family Income | 88 | $80,278 |
| Mean Family Income | 88 | $87,818 |
| Median Household Income | 124 | $70,000 |
| Mean Household Income | 124 | $82,723 |
| Income Deficit | 88 | $0 |
| Wage / Income Gap (%) | 267 | 0.64% |
| Wage / Income Gap ($) | 267 | 99.36¢ per $1 |
| Gini / Inequality Index | 267 | 0.33 |
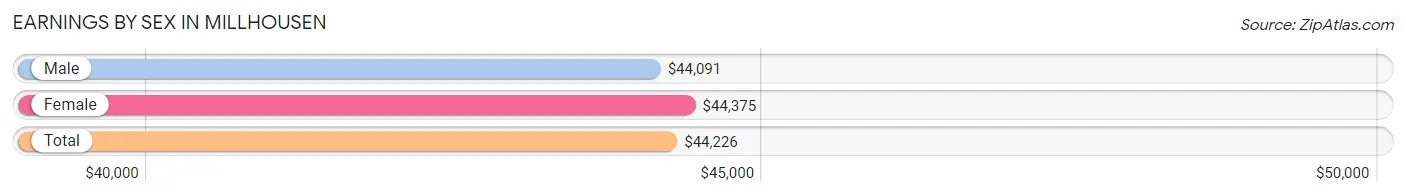
Earnings by Sex in Millhousen
Average Earnings in Millhousen are $44,226, $44,091 for men and $44,375 for women, a difference of 0.6%.
| Sex | Number | Average Earnings |
| Male | 122 (69.7%) | $44,091 |
| Female | 53 (30.3%) | $44,375 |
| Total | 175 (100.0%) | $44,226 |
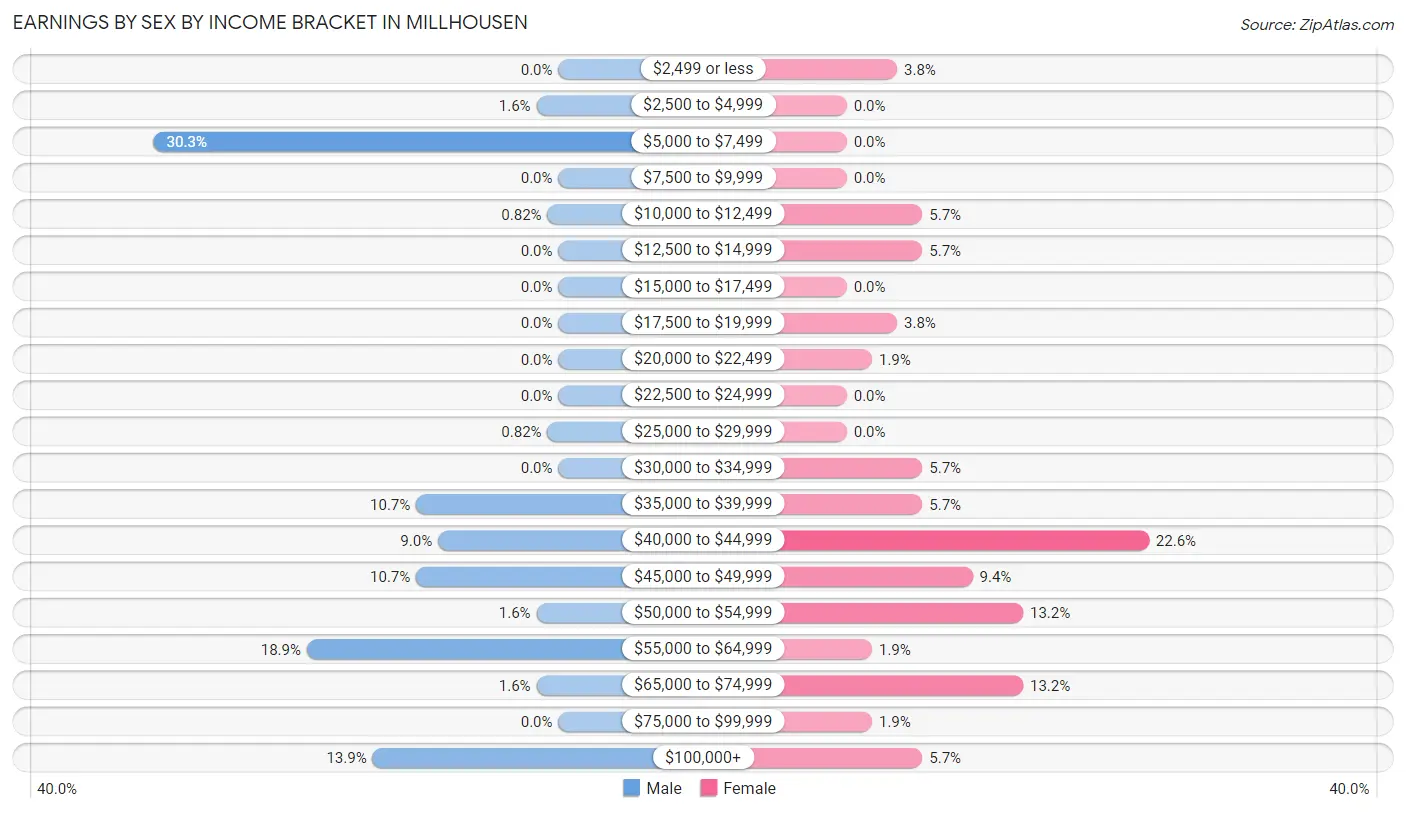
Earnings by Sex by Income Bracket in Millhousen
The most common earnings brackets in Millhousen are $5,000 to $7,499 for men (37 | 30.3%) and $40,000 to $44,999 for women (12 | 22.6%).
| Income | Male | Female |
| $2,499 or less | 0 (0.0%) | 2 (3.8%) |
| $2,500 to $4,999 | 2 (1.6%) | 0 (0.0%) |
| $5,000 to $7,499 | 37 (30.3%) | 0 (0.0%) |
| $7,500 to $9,999 | 0 (0.0%) | 0 (0.0%) |
| $10,000 to $12,499 | 1 (0.8%) | 3 (5.7%) |
| $12,500 to $14,999 | 0 (0.0%) | 3 (5.7%) |
| $15,000 to $17,499 | 0 (0.0%) | 0 (0.0%) |
| $17,500 to $19,999 | 0 (0.0%) | 2 (3.8%) |
| $20,000 to $22,499 | 0 (0.0%) | 1 (1.9%) |
| $22,500 to $24,999 | 0 (0.0%) | 0 (0.0%) |
| $25,000 to $29,999 | 1 (0.8%) | 0 (0.0%) |
| $30,000 to $34,999 | 0 (0.0%) | 3 (5.7%) |
| $35,000 to $39,999 | 13 (10.7%) | 3 (5.7%) |
| $40,000 to $44,999 | 11 (9.0%) | 12 (22.6%) |
| $45,000 to $49,999 | 13 (10.7%) | 5 (9.4%) |
| $50,000 to $54,999 | 2 (1.6%) | 7 (13.2%) |
| $55,000 to $64,999 | 23 (18.9%) | 1 (1.9%) |
| $65,000 to $74,999 | 2 (1.6%) | 7 (13.2%) |
| $75,000 to $99,999 | 0 (0.0%) | 1 (1.9%) |
| $100,000+ | 17 (13.9%) | 3 (5.7%) |
| Total | 122 (100.0%) | 53 (100.0%) |
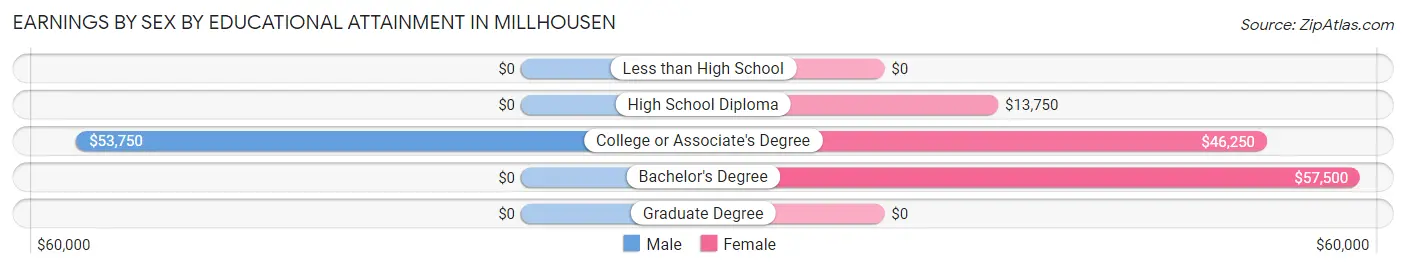
Earnings by Sex by Educational Attainment in Millhousen
Average earnings in Millhousen are $44,205 for men and $44,375 for women, a difference of 0.4%. Men with an educational attainment of college or associate's degree enjoy the highest average annual earnings of $53,750, while those with college or associate's degree education earn the least with $53,750. Women with an educational attainment of bachelor's degree earn the most with the average annual earnings of $57,500, while those with high school diploma education have the smallest earnings of $13,750.
| Educational Attainment | Male Income | Female Income |
| Less than High School | - | - |
| High School Diploma | - | - |
| College or Associate's Degree | $53,750 | $46,250 |
| Bachelor's Degree | - | - |
| Graduate Degree | - | - |
| Total | $44,205 | $44,375 |
Family Income in Millhousen
Family Income Brackets in Millhousen
According to the Millhousen family income data, there are 38 families falling into the $50,000 to $74,999 income range, which is the most common income bracket and makes up 43.2% of all families.
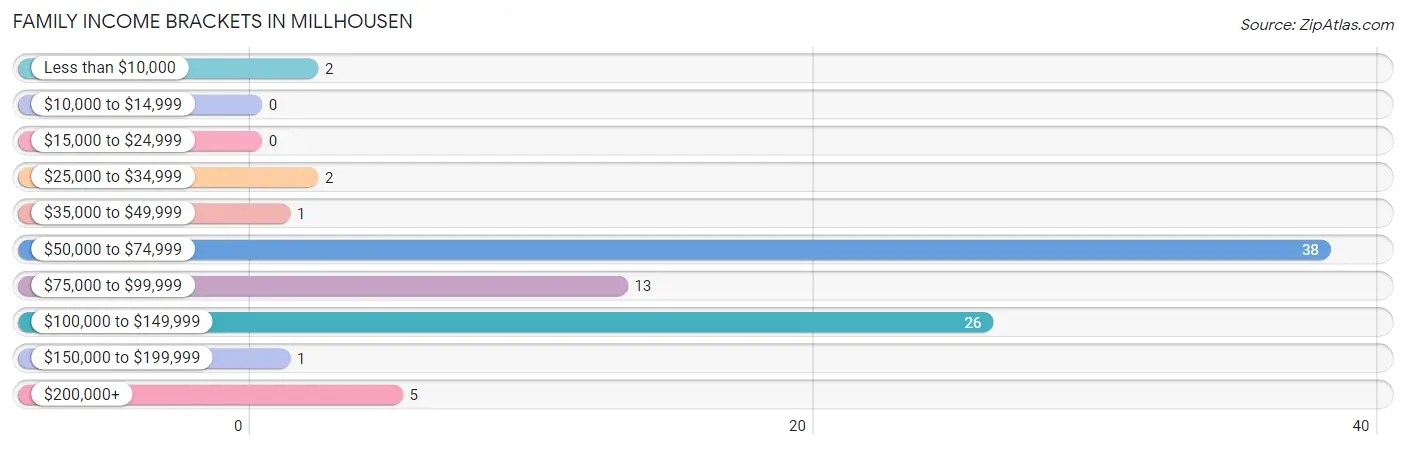
| Income Bracket | # Families | % Families |
| Less than $10,000 | 2 | 2.3% |
| $10,000 to $14,999 | 0 | 0.0% |
| $15,000 to $24,999 | 0 | 0.0% |
| $25,000 to $34,999 | 2 | 2.3% |
| $35,000 to $49,999 | 1 | 1.1% |
| $50,000 to $74,999 | 38 | 43.2% |
| $75,000 to $99,999 | 13 | 14.8% |
| $100,000 to $149,999 | 26 | 29.5% |
| $150,000 to $199,999 | 1 | 1.1% |
| $200,000+ | 5 | 5.7% |
Family Income by Famaliy Size in Millhousen
2-person families (68 | 77.3%) account for the highest median family income in Millhousen with $54,559 per family, while 2-person families (68 | 77.3%) have the highest median income of $27,280 per family member.
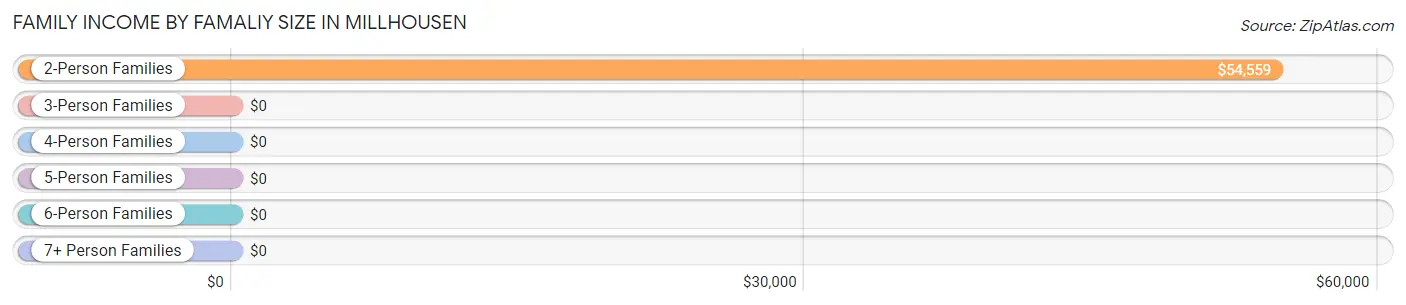
| Income Bracket | # Families | Median Income |
| 2-Person Families | 68 (77.3%) | $54,559 |
| 3-Person Families | 10 (11.4%) | $0 |
| 4-Person Families | 5 (5.7%) | $0 |
| 5-Person Families | 1 (1.1%) | $0 |
| 6-Person Families | 4 (4.5%) | $0 |
| 7+ Person Families | 0 (0.0%) | $0 |
| Total | 88 (100.0%) | $80,278 |
Family Income by Number of Earners in Millhousen
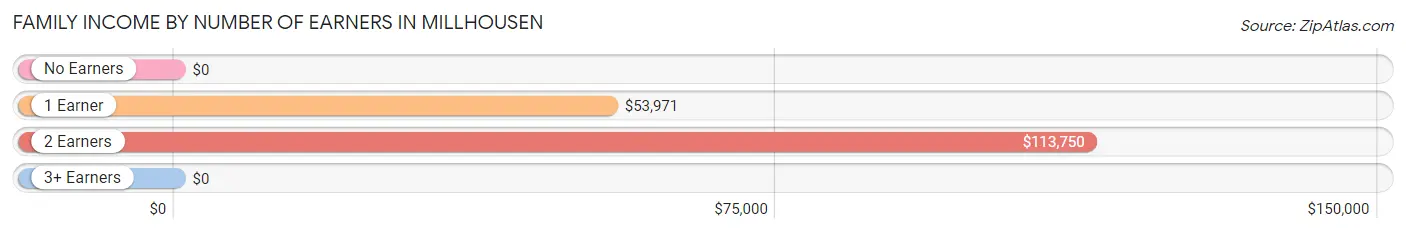
| Number of Earners | # Families | Median Income |
| No Earners | 1 (1.1%) | $0 |
| 1 Earner | 48 (54.5%) | $53,971 |
| 2 Earners | 38 (43.2%) | $113,750 |
| 3+ Earners | 1 (1.1%) | $0 |
| Total | 88 (100.0%) | $80,278 |
Household Income in Millhousen
Household Income Brackets in Millhousen
With 38 households falling in the category, the $50,000 to $74,999 income range is the most frequent in Millhousen, accounting for 30.6% of all households.
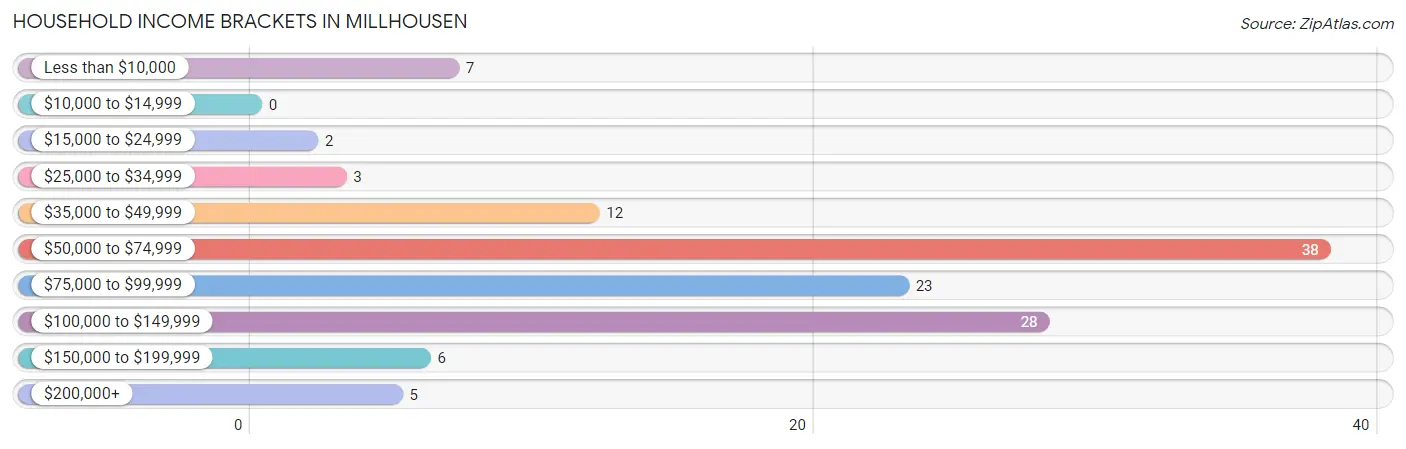
| Income Bracket | # Households | % Households |
| Less than $10,000 | 7 | 5.6% |
| $10,000 to $14,999 | 0 | 0.0% |
| $15,000 to $24,999 | 2 | 1.6% |
| $25,000 to $34,999 | 3 | 2.4% |
| $35,000 to $49,999 | 12 | 9.7% |
| $50,000 to $74,999 | 38 | 30.6% |
| $75,000 to $99,999 | 23 | 18.5% |
| $100,000 to $149,999 | 28 | 22.6% |
| $150,000 to $199,999 | 6 | 4.8% |
| $200,000+ | 5 | 4.0% |
Household Income by Householder Age in Millhousen
The median household income in Millhousen is $70,000, with the highest median household income of $101,111 found in the 45 to 64 years age bracket for the primary householder. A total of 42 households (33.9%) fall into this category.
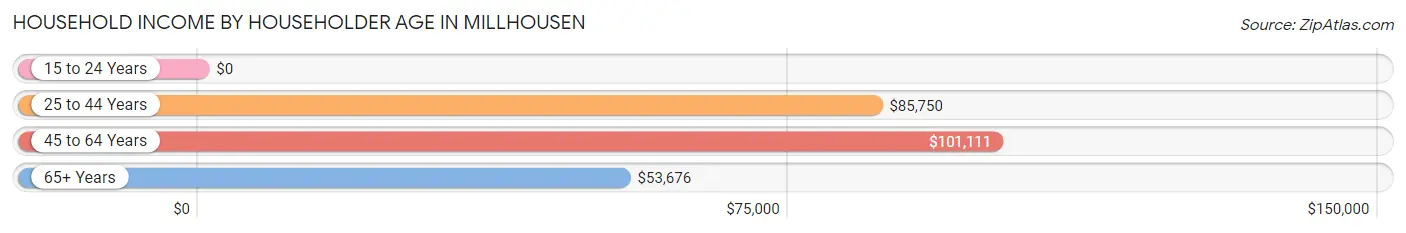
| Income Bracket | # Households | Median Income |
| 15 to 24 Years | 0 (0.0%) | $0 |
| 25 to 44 Years | 42 (33.9%) | $85,750 |
| 45 to 64 Years | 42 (33.9%) | $101,111 |
| 65+ Years | 40 (32.3%) | $53,676 |
| Total | 124 (100.0%) | $70,000 |
Poverty in Millhousen
Income Below Poverty by Sex and Age in Millhousen
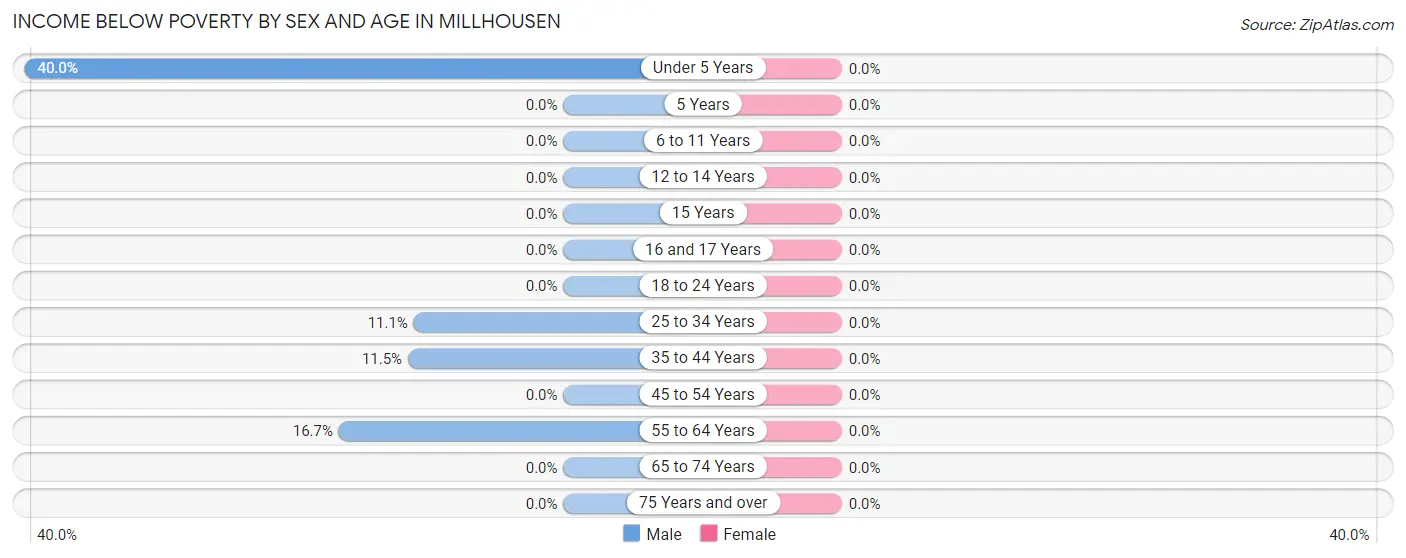
| Age Bracket | Male | Female |
| Under 5 Years | 4 (40.0%) | 0 (0.0%) |
| 5 Years | 0 (0.0%) | 0 (0.0%) |
| 6 to 11 Years | 0 (0.0%) | 0 (0.0%) |
| 12 to 14 Years | 0 (0.0%) | 0 (0.0%) |
| 15 Years | 0 (0.0%) | 0 (0.0%) |
| 16 and 17 Years | 0 (0.0%) | 0 (0.0%) |
| 18 to 24 Years | 0 (0.0%) | 0 (0.0%) |
| 25 to 34 Years | 2 (11.1%) | 0 (0.0%) |
| 35 to 44 Years | 3 (11.5%) | 0 (0.0%) |
| 45 to 54 Years | 0 (0.0%) | 0 (0.0%) |
| 55 to 64 Years | 2 (16.7%) | 0 (0.0%) |
| 65 to 74 Years | 0 (0.0%) | 0 (0.0%) |
| 75 Years and over | 0 (0.0%) | 0 (0.0%) |
| Total | 11 (6.9%) | 0 (0.0%) |
Income Above Poverty by Sex and Age in Millhousen
According to the poverty statistics in Millhousen, males aged 6 to 11 years and females aged under 5 years are the age groups that are most secure financially, with 100.0% of males and 100.0% of females in these age groups living above the poverty line.
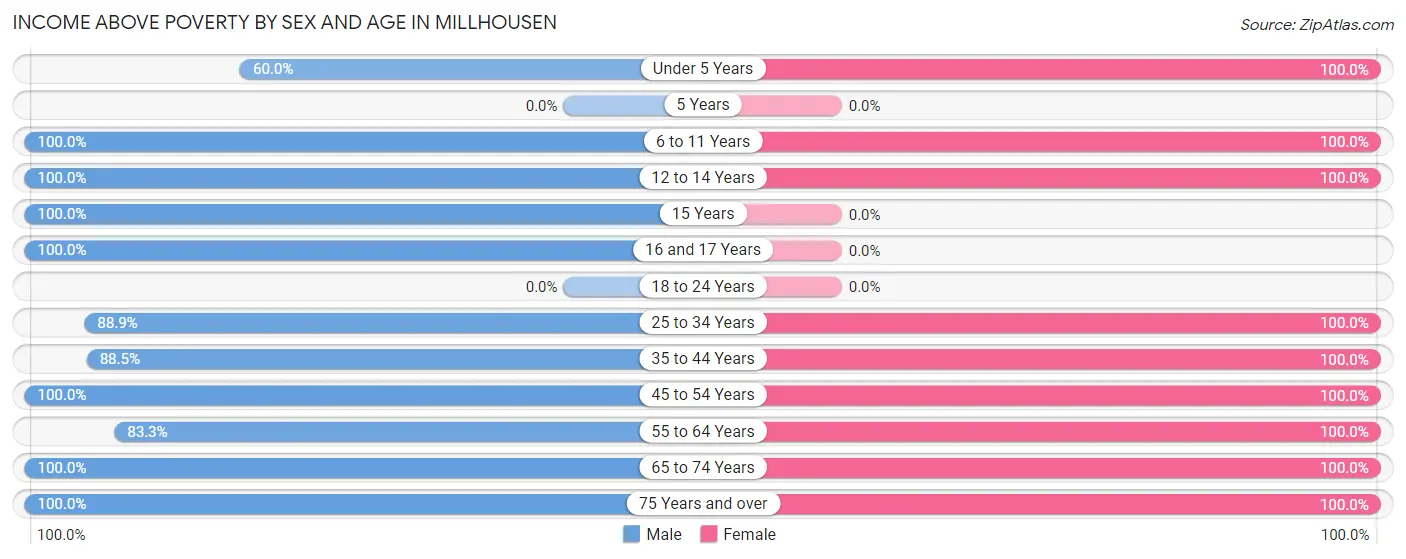
| Age Bracket | Male | Female |
| Under 5 Years | 6 (60.0%) | 4 (100.0%) |
| 5 Years | 0 (0.0%) | 0 (0.0%) |
| 6 to 11 Years | 11 (100.0%) | 3 (100.0%) |
| 12 to 14 Years | 6 (100.0%) | 1 (100.0%) |
| 15 Years | 1 (100.0%) | 0 (0.0%) |
| 16 and 17 Years | 1 (100.0%) | 0 (0.0%) |
| 18 to 24 Years | 0 (0.0%) | 0 (0.0%) |
| 25 to 34 Years | 16 (88.9%) | 17 (100.0%) |
| 35 to 44 Years | 23 (88.5%) | 20 (100.0%) |
| 45 to 54 Years | 36 (100.0%) | 18 (100.0%) |
| 55 to 64 Years | 10 (83.3%) | 5 (100.0%) |
| 65 to 74 Years | 37 (100.0%) | 34 (100.0%) |
| 75 Years and over | 1 (100.0%) | 6 (100.0%) |
| Total | 148 (93.1%) | 108 (100.0%) |
Income Below Poverty Among Married-Couple Families in Millhousen
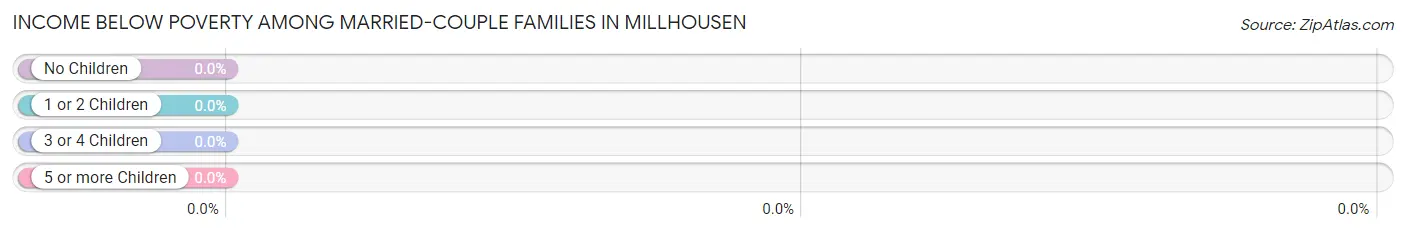
| Children | Above Poverty | Below Poverty |
| No Children | 65 (100.0%) | 0 (0.0%) |
| 1 or 2 Children | 12 (100.0%) | 0 (0.0%) |
| 3 or 4 Children | 4 (100.0%) | 0 (0.0%) |
| 5 or more Children | 0 (0.0%) | 0 (0.0%) |
| Total | 81 (100.0%) | 0 (0.0%) |
Income Below Poverty Among Single-Parent Households in Millhousen
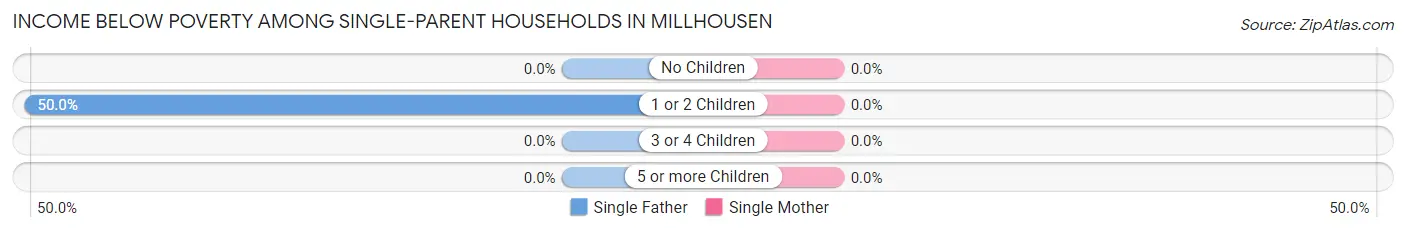
| Children | Single Father | Single Mother |
| No Children | 0 (0.0%) | 0 (0.0%) |
| 1 or 2 Children | 2 (50.0%) | 0 (0.0%) |
| 3 or 4 Children | 0 (0.0%) | 0 (0.0%) |
| 5 or more Children | 0 (0.0%) | 0 (0.0%) |
| Total | 2 (33.3%) | 0 (0.0%) |
Income Below Poverty Among Married-Couple vs Single-Parent Households in Millhousen
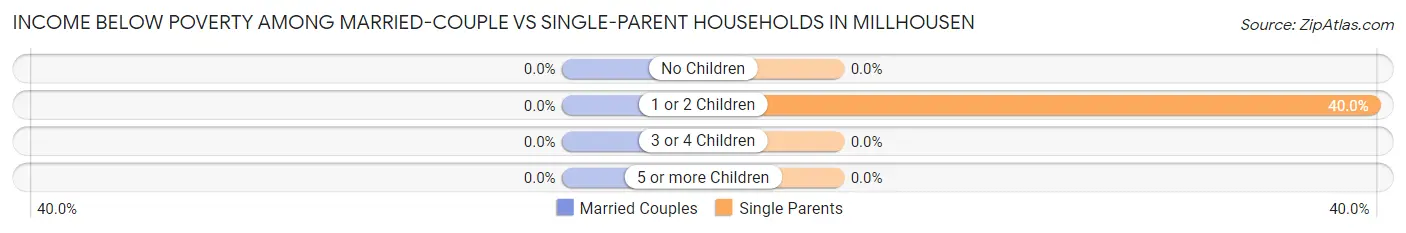
| Children | Married-Couple Families | Single-Parent Households |
| No Children | 0 (0.0%) | 0 (0.0%) |
| 1 or 2 Children | 0 (0.0%) | 2 (40.0%) |
| 3 or 4 Children | 0 (0.0%) | 0 (0.0%) |
| 5 or more Children | 0 (0.0%) | 0 (0.0%) |
| Total | 0 (0.0%) | 2 (28.6%) |
Race in Millhousen
The most populous races in Millhousen are White / Caucasian (248 | 92.9%), Two or more Races (16 | 6.0%), and Asian (3 | 1.1%).
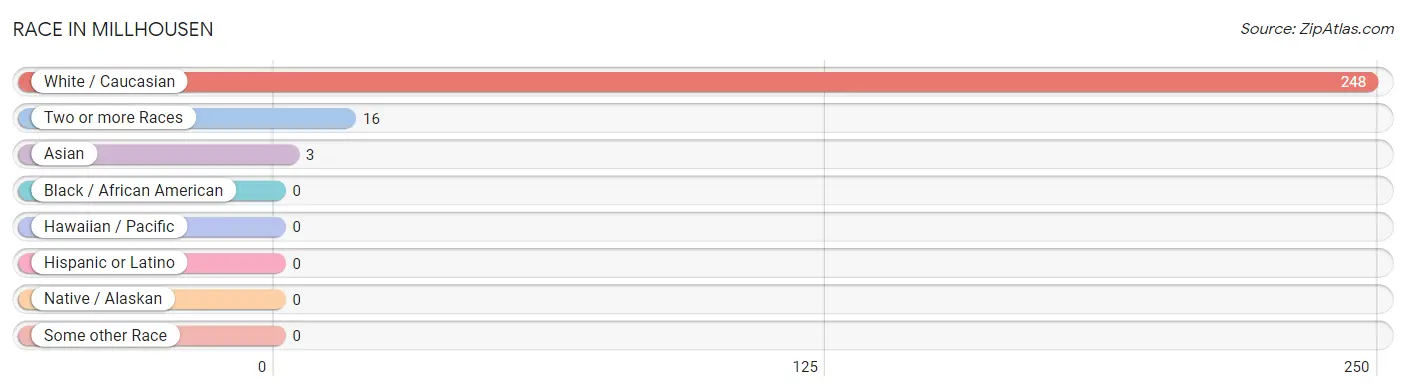
| Race | # Population | % Population |
| Asian | 3 | 1.1% |
| Black / African American | 0 | 0.0% |
| Hawaiian / Pacific | 0 | 0.0% |
| Hispanic or Latino | 0 | 0.0% |
| Native / Alaskan | 0 | 0.0% |
| White / Caucasian | 248 | 92.9% |
| Two or more Races | 16 | 6.0% |
| Some other Race | 0 | 0.0% |
| Total | 267 | 100.0% |
Ancestry in Millhousen
The most populous ancestries reported in Millhousen are German (79 | 29.6%), Irish (19 | 7.1%), American (8 | 3.0%), Dutch (8 | 3.0%), and European (6 | 2.2%), together accounting for 45.0% of all Millhousen residents.
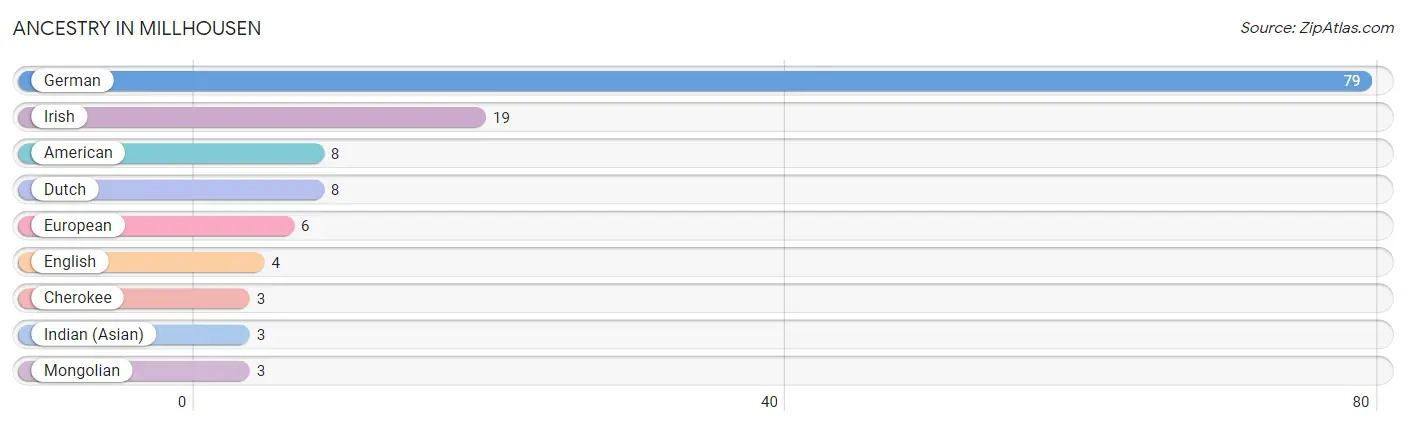
| Ancestry | # Population | % Population |
| American | 8 | 3.0% |
| Cherokee | 3 | 1.1% |
| Dutch | 8 | 3.0% |
| English | 4 | 1.5% |
| European | 6 | 2.2% |
| German | 79 | 29.6% |
| Indian (Asian) | 3 | 1.1% |
| Irish | 19 | 7.1% |
| Mongolian | 3 | 1.1% | View All 9 Rows |
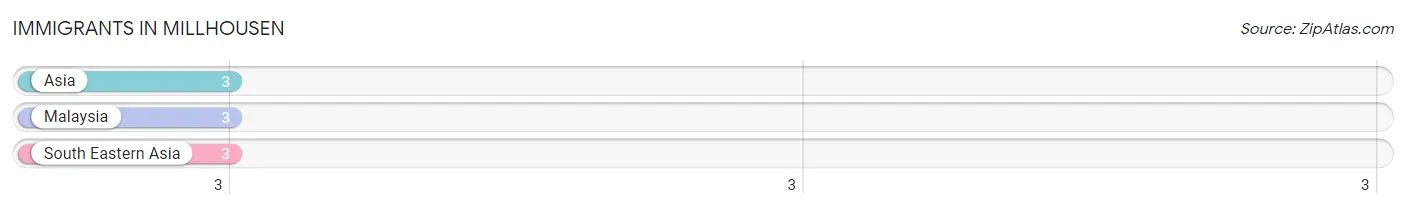
Immigrants in Millhousen
The most numerous immigrant groups reported in Millhousen came from Asia (3 | 1.1%), Malaysia (3 | 1.1%), and South Eastern Asia (3 | 1.1%), together accounting for 3.4% of all Millhousen residents.
| Immigration Origin | # Population | % Population |
| Asia | 3 | 1.1% |
| Malaysia | 3 | 1.1% |
| South Eastern Asia | 3 | 1.1% | View All 3 Rows |
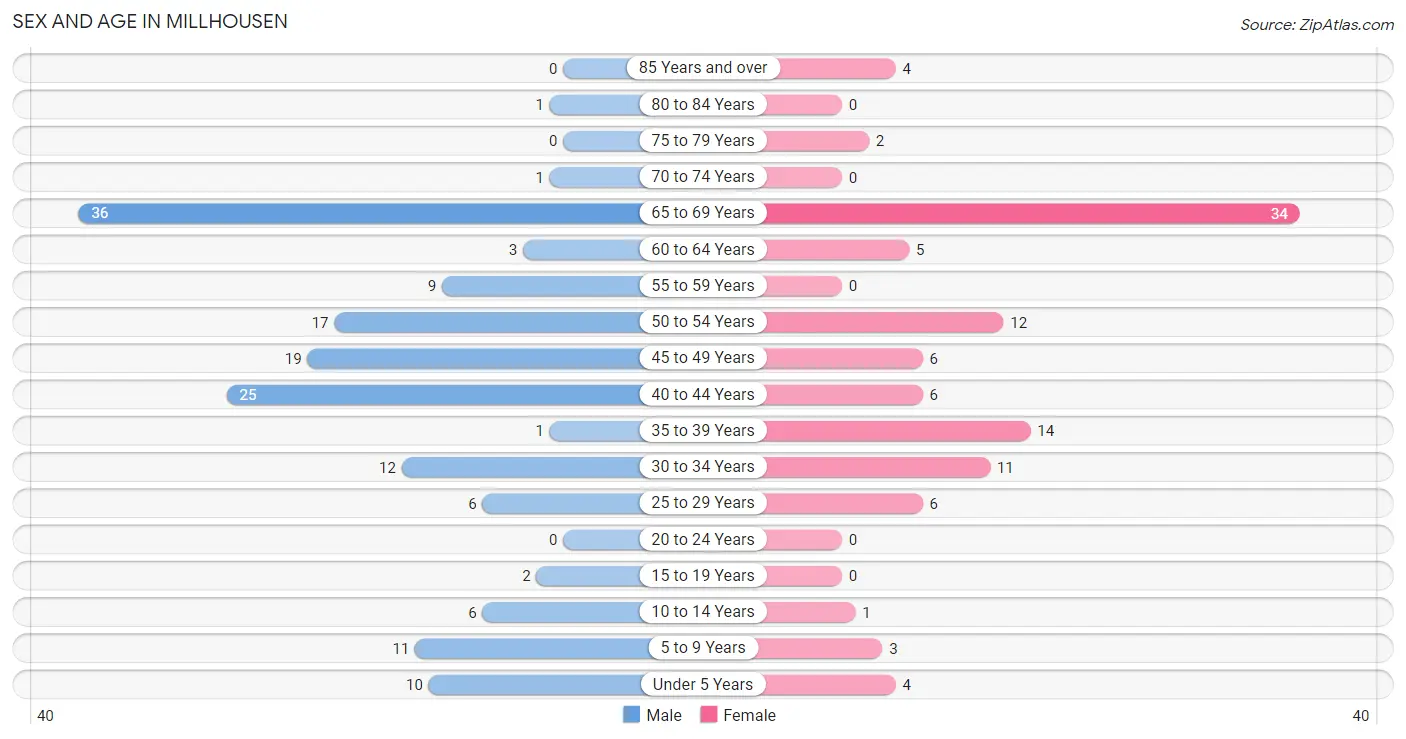
Sex and Age in Millhousen
Sex and Age in Millhousen
The most populous age groups in Millhousen are 65 to 69 Years (36 | 22.6%) for men and 65 to 69 Years (34 | 31.5%) for women.
| Age Bracket | Male | Female |
| Under 5 Years | 10 (6.3%) | 4 (3.7%) |
| 5 to 9 Years | 11 (6.9%) | 3 (2.8%) |
| 10 to 14 Years | 6 (3.8%) | 1 (0.9%) |
| 15 to 19 Years | 2 (1.3%) | 0 (0.0%) |
| 20 to 24 Years | 0 (0.0%) | 0 (0.0%) |
| 25 to 29 Years | 6 (3.8%) | 6 (5.6%) |
| 30 to 34 Years | 12 (7.5%) | 11 (10.2%) |
| 35 to 39 Years | 1 (0.6%) | 14 (13.0%) |
| 40 to 44 Years | 25 (15.7%) | 6 (5.6%) |
| 45 to 49 Years | 19 (11.9%) | 6 (5.6%) |
| 50 to 54 Years | 17 (10.7%) | 12 (11.1%) |
| 55 to 59 Years | 9 (5.7%) | 0 (0.0%) |
| 60 to 64 Years | 3 (1.9%) | 5 (4.6%) |
| 65 to 69 Years | 36 (22.6%) | 34 (31.5%) |
| 70 to 74 Years | 1 (0.6%) | 0 (0.0%) |
| 75 to 79 Years | 0 (0.0%) | 2 (1.8%) |
| 80 to 84 Years | 1 (0.6%) | 0 (0.0%) |
| 85 Years and over | 0 (0.0%) | 4 (3.7%) |
| Total | 159 (100.0%) | 108 (100.0%) |
Families and Households in Millhousen
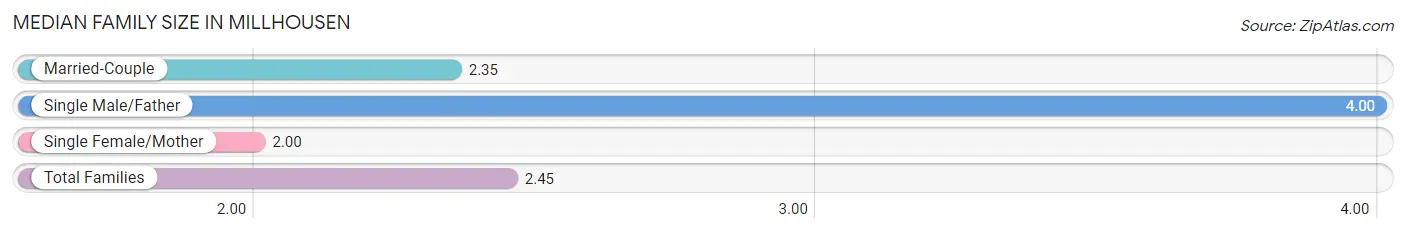
Median Family Size in Millhousen
The median family size in Millhousen is 2.45 persons per family, with single male/father families (6 | 6.8%) accounting for the largest median family size of 4 persons per family. On the other hand, single female/mother families (1 | 1.1%) represent the smallest median family size with 2.00 persons per family.
| Family Type | # Families | Family Size |
| Married-Couple | 81 (92.0%) | 2.35 |
| Single Male/Father | 6 (6.8%) | 4.00 |
| Single Female/Mother | 1 (1.1%) | 2.00 |
| Total Families | 88 (100.0%) | 2.45 |
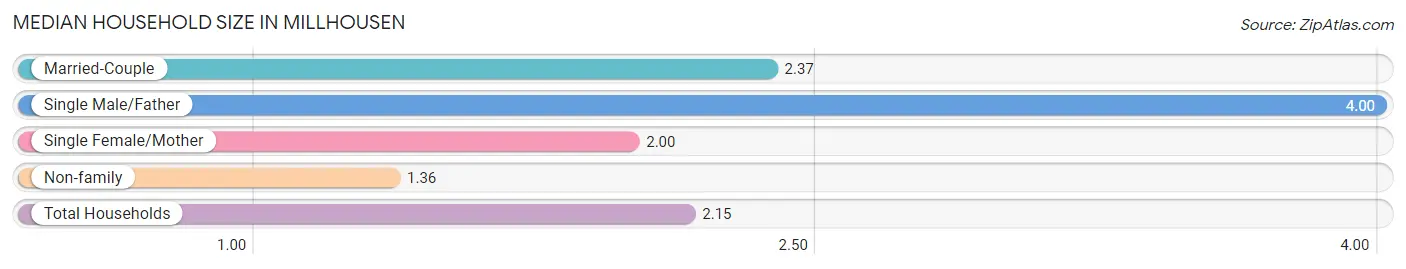
Median Household Size in Millhousen
The median household size in Millhousen is 2.15 persons per household, with single male/father households (6 | 4.8%) accounting for the largest median household size of 4 persons per household. non-family households (36 | 29.0%) represent the smallest median household size with 1.36 persons per household.
| Household Type | # Households | Household Size |
| Married-Couple | 81 (65.3%) | 2.37 |
| Single Male/Father | 6 (4.8%) | 4.00 |
| Single Female/Mother | 1 (0.8%) | 2.00 |
| Non-family | 36 (29.0%) | 1.36 |
| Total Households | 124 (100.0%) | 2.15 |
Household Size by Marriage Status in Millhousen
Out of a total of 124 households in Millhousen, 88 (71.0%) are family households, while 36 (29.0%) are nonfamily households. The most numerous type of family households are 2-person households, comprising 68, and the most common type of nonfamily households are 1-person households, comprising 24.
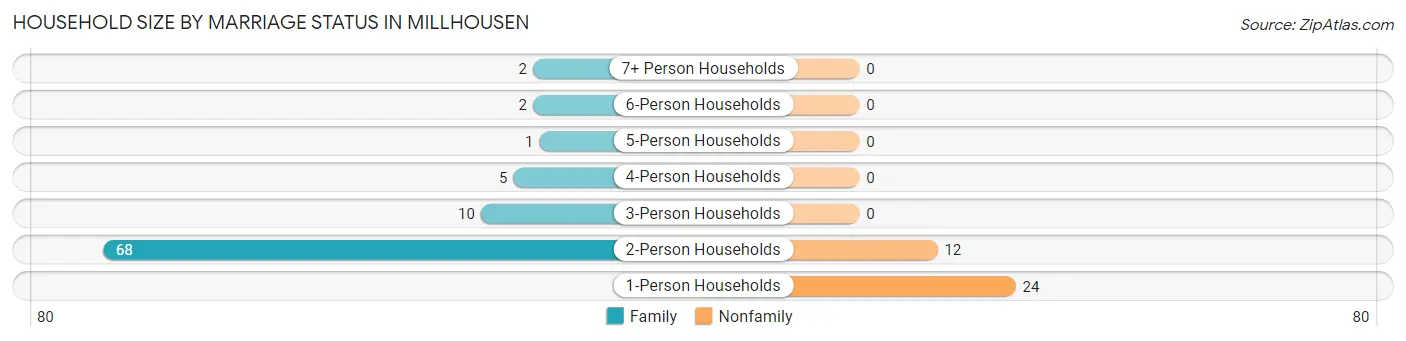
| Household Size | Family Households | Nonfamily Households |
| 1-Person Households | - | 24 (19.4%) |
| 2-Person Households | 68 (54.8%) | 12 (9.7%) |
| 3-Person Households | 10 (8.1%) | 0 (0.0%) |
| 4-Person Households | 5 (4.0%) | 0 (0.0%) |
| 5-Person Households | 1 (0.8%) | 0 (0.0%) |
| 6-Person Households | 2 (1.6%) | 0 (0.0%) |
| 7+ Person Households | 2 (1.6%) | 0 (0.0%) |
| Total | 88 (71.0%) | 36 (29.0%) |
Female Fertility in Millhousen
Fertility by Age in Millhousen
Average fertility rate in Millhousen is 100.0 births per 1,000 women. Women in the age bracket of 35 to 50 years have the highest fertility rate with 152.0 births per 1,000 women. Women in the age bracket of 35 to 50 years acount for 100.0% of all women with births.
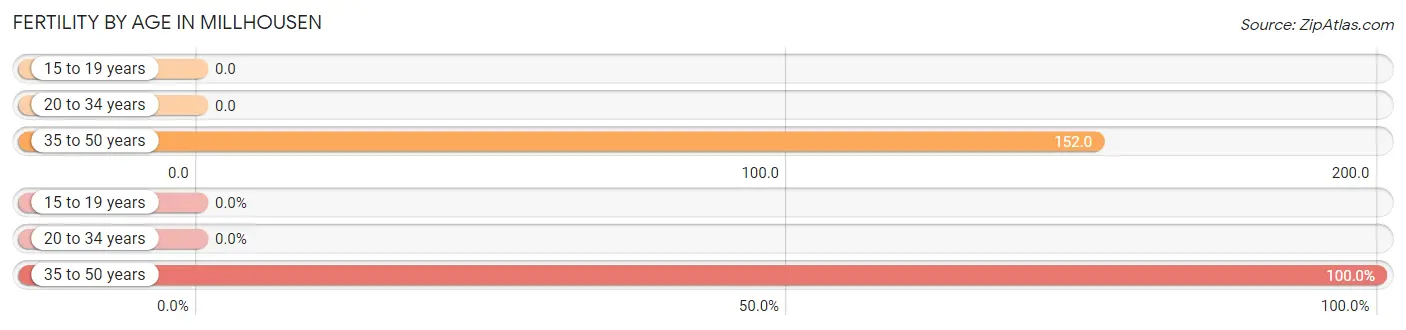
| Age Bracket | Women with Births | Births / 1,000 Women |
| 15 to 19 years | 0 (0.0%) | 0.0 |
| 20 to 34 years | 0 (0.0%) | 0.0 |
| 35 to 50 years | 5 (100.0%) | 152.0 |
| Total | 5 (100.0%) | 100.0 |
Fertility by Age by Marriage Status in Millhousen
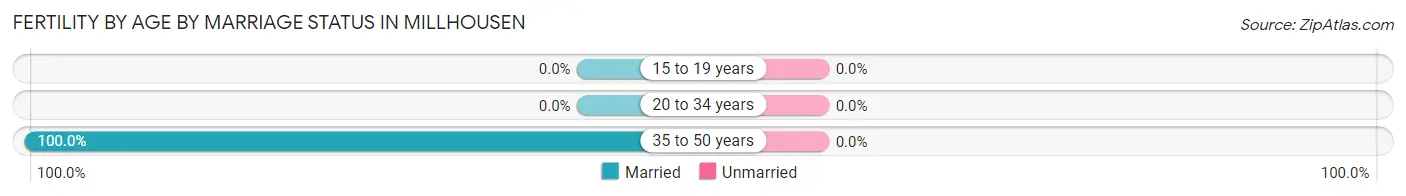
| Age Bracket | Married | Unmarried |
| 15 to 19 years | 0 (0.0%) | 0 (0.0%) |
| 20 to 34 years | 0 (0.0%) | 0 (0.0%) |
| 35 to 50 years | 5 (100.0%) | 0 (0.0%) |
| Total | 5 (100.0%) | 0 (0.0%) |
Fertility by Education in Millhousen
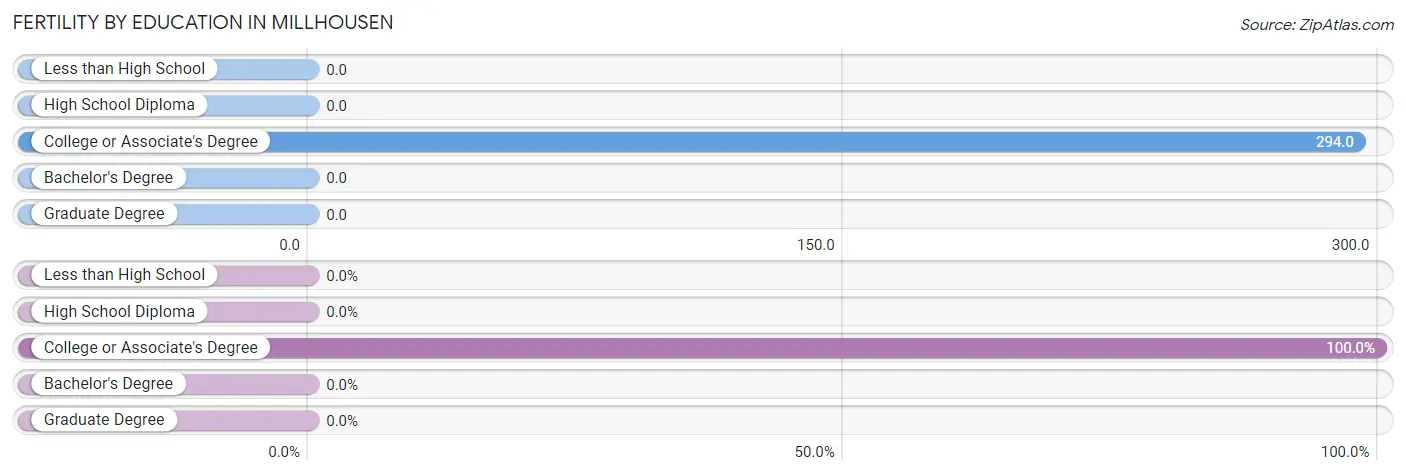
| Educational Attainment | Women with Births | Births / 1,000 Women |
| Less than High School | 0 (0.0%) | 0.0 |
| High School Diploma | 0 (0.0%) | 0.0 |
| College or Associate's Degree | 5 (100.0%) | 294.0 |
| Bachelor's Degree | 0 (0.0%) | 0.0 |
| Graduate Degree | 0 (0.0%) | 0.0 |
| Total | 5 (100.0%) | 100.0 |
Fertility by Education by Marriage Status in Millhousen
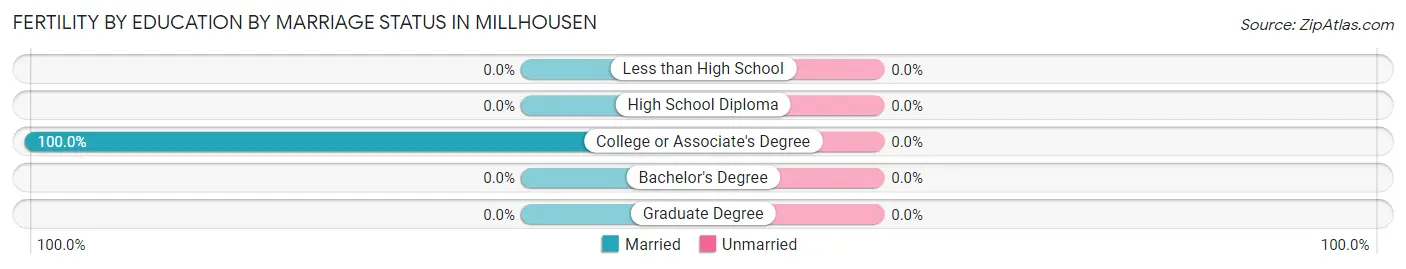
| Educational Attainment | Married | Unmarried |
| Less than High School | 0 (0.0%) | 0 (0.0%) |
| High School Diploma | 0 (0.0%) | 0 (0.0%) |
| College or Associate's Degree | 5 (100.0%) | 0 (0.0%) |
| Bachelor's Degree | 0 (0.0%) | 0 (0.0%) |
| Graduate Degree | 0 (0.0%) | 0 (0.0%) |
| Total | 5 (100.0%) | 0 (0.0%) |
Employment Characteristics in Millhousen
Employment by Class of Employer in Millhousen
Among the 124 employed individuals in Millhousen, private company employees (96 | 77.4%), not-for-profit organizations (16 | 12.9%), and state government employees (10 | 8.1%) make up the most common classes of employment.
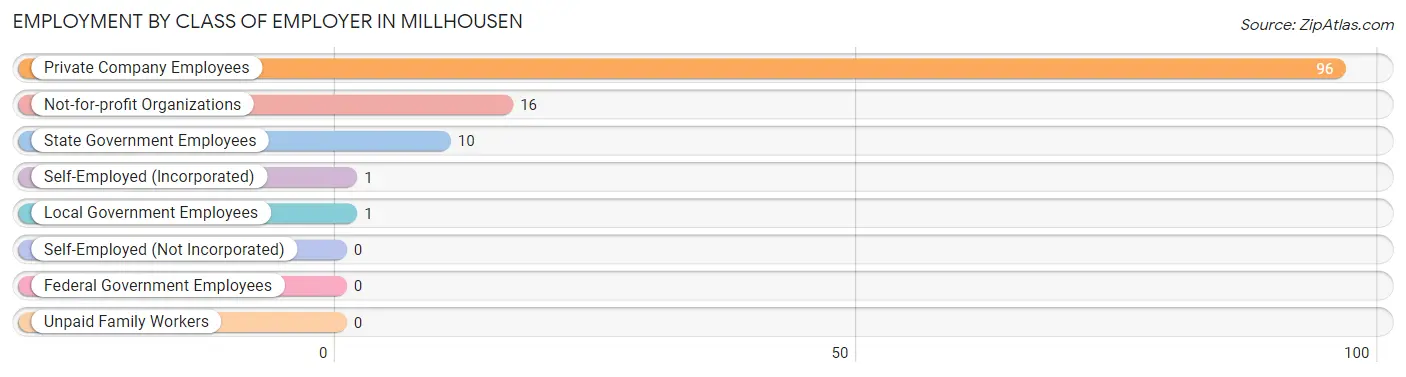
| Employer Class | # Employees | % Employees |
| Private Company Employees | 96 | 77.4% |
| Self-Employed (Incorporated) | 1 | 0.8% |
| Self-Employed (Not Incorporated) | 0 | 0.0% |
| Not-for-profit Organizations | 16 | 12.9% |
| Local Government Employees | 1 | 0.8% |
| State Government Employees | 10 | 8.1% |
| Federal Government Employees | 0 | 0.0% |
| Unpaid Family Workers | 0 | 0.0% |
| Total | 124 | 100.0% |
Employment Status by Age in Millhousen
According to the labor force statistics for Millhousen, out of the total population over 16 years of age (231), 57.6% or 133 individuals are in the labor force, with 6.8% or 9 of them unemployed. The age group with the highest labor force participation rate is 16 to 19 years, with 100.0% or 1 individuals in the labor force. Within the labor force, the 45 to 54 years age range has the highest percentage of unemployed individuals, with 16.7% or 9 of them being unemployed.
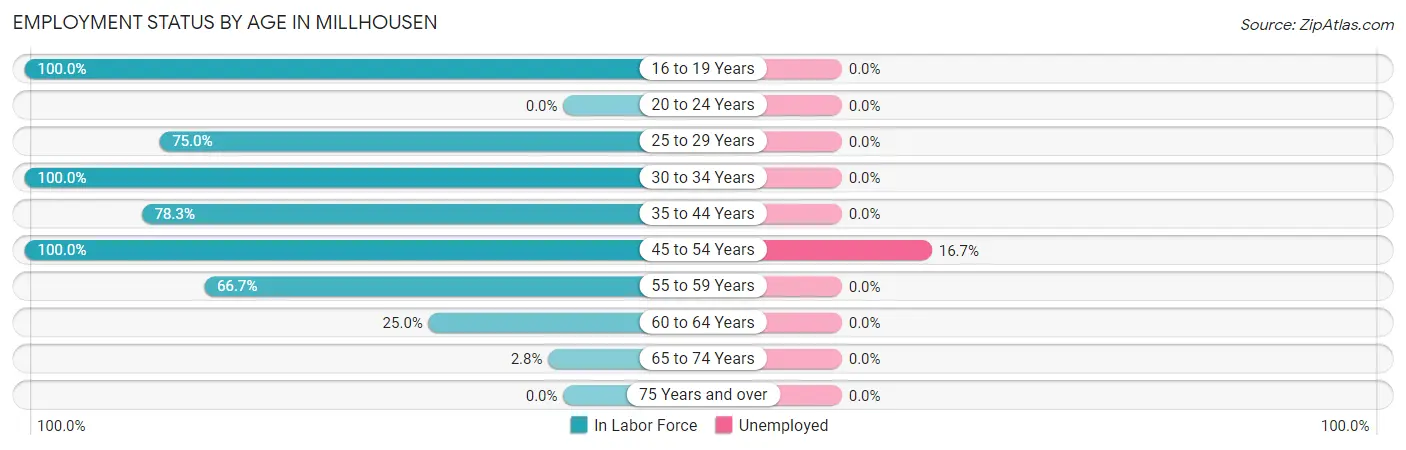
| Age Bracket | In Labor Force | Unemployed |
| 16 to 19 Years | 1 (100.0%) | 0 (0.0%) |
| 20 to 24 Years | 0 (0.0%) | 0 (0.0%) |
| 25 to 29 Years | 9 (75.0%) | 0 (0.0%) |
| 30 to 34 Years | 23 (100.0%) | 0 (0.0%) |
| 35 to 44 Years | 36 (78.3%) | 0 (0.0%) |
| 45 to 54 Years | 54 (100.0%) | 9 (16.7%) |
| 55 to 59 Years | 6 (66.7%) | 0 (0.0%) |
| 60 to 64 Years | 2 (25.0%) | 0 (0.0%) |
| 65 to 74 Years | 2 (2.8%) | 0 (0.0%) |
| 75 Years and over | 0 (0.0%) | 0 (0.0%) |
| Total | 133 (57.6%) | 9 (6.8%) |
Employment Status by Educational Attainment in Millhousen
According to labor force statistics for Millhousen, 85.5% of individuals (130) out of the total population between 25 and 64 years of age (152) are in the labor force, with 6.9% or 9 of them being unemployed. The group with the highest labor force participation rate are those with the educational attainment of bachelor's degree or higher, with 100.0% or 23 individuals in the labor force. Within the labor force, individuals with high school diploma education have the highest percentage of unemployment, with 14.3% or 9 of them being unemployed.
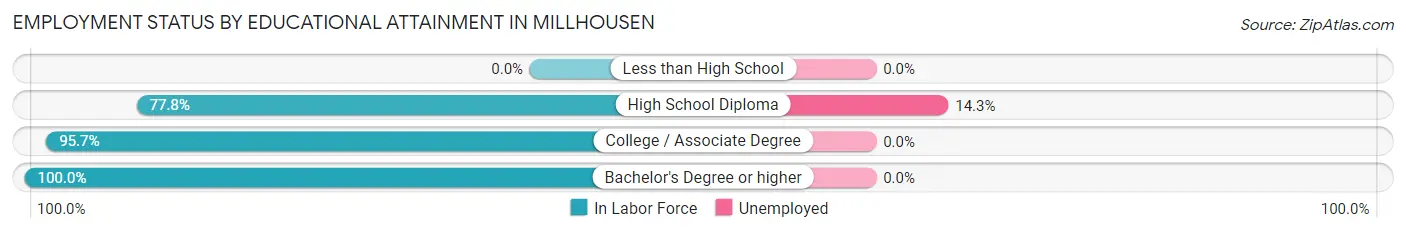
| Educational Attainment | In Labor Force | Unemployed |
| Less than High School | 0 (0.0%) | 0 (0.0%) |
| High School Diploma | 63 (77.8%) | 12 (14.3%) |
| College / Associate Degree | 44 (95.7%) | 0 (0.0%) |
| Bachelor's Degree or higher | 23 (100.0%) | 0 (0.0%) |
| Total | 130 (85.5%) | 10 (6.9%) |
Employment Occupations by Sex in Millhousen
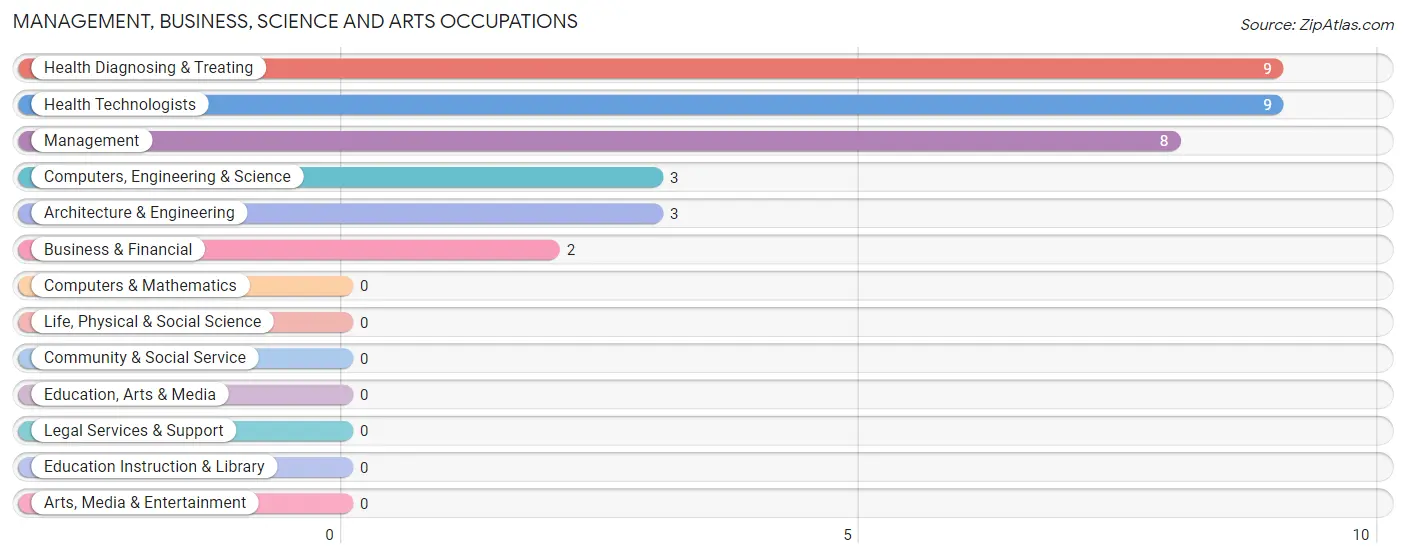
Management, Business, Science and Arts Occupations
The most common Management, Business, Science and Arts occupations in Millhousen are Health Diagnosing & Treating (9 | 7.3%), Health Technologists (9 | 7.3%), Management (8 | 6.5%), Computers, Engineering & Science (3 | 2.4%), and Architecture & Engineering (3 | 2.4%).
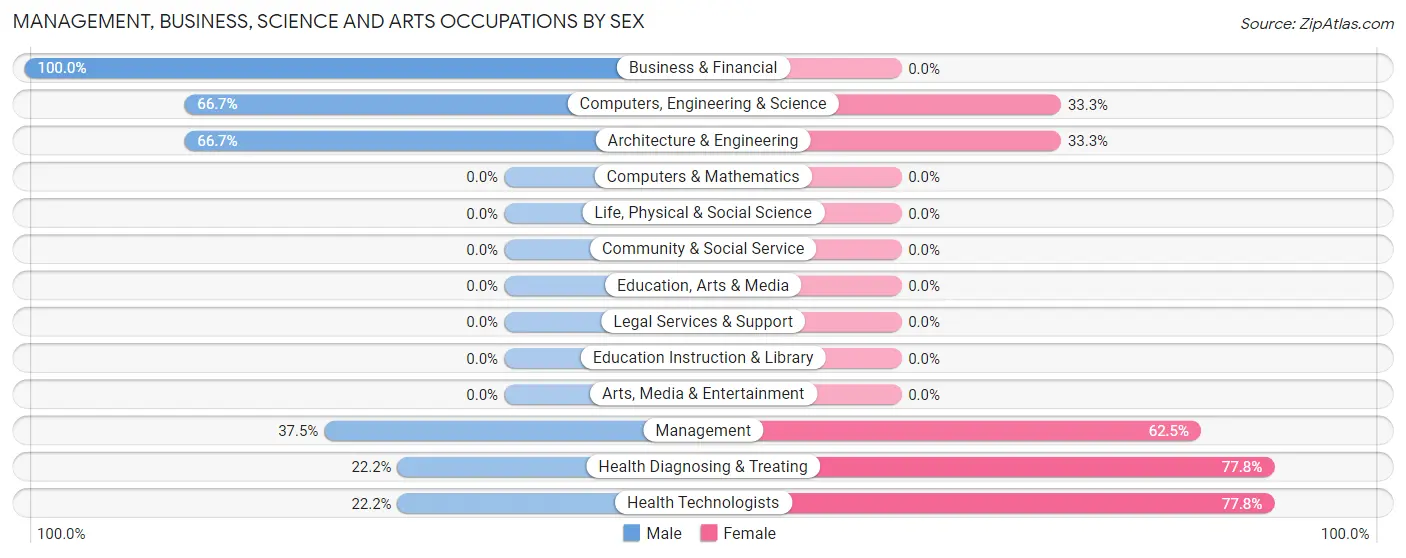
Management, Business, Science and Arts Occupations by Sex
Within the Management, Business, Science and Arts occupations in Millhousen, the most male-oriented occupations are Business & Financial (100.0%), Computers, Engineering & Science (66.7%), and Architecture & Engineering (66.7%), while the most female-oriented occupations are Health Diagnosing & Treating (77.8%), Health Technologists (77.8%), and Management (62.5%).
| Occupation | Male | Female |
| Management | 3 (37.5%) | 5 (62.5%) |
| Business & Financial | 2 (100.0%) | 0 (0.0%) |
| Computers, Engineering & Science | 2 (66.7%) | 1 (33.3%) |
| Computers & Mathematics | 0 (0.0%) | 0 (0.0%) |
| Architecture & Engineering | 2 (66.7%) | 1 (33.3%) |
| Life, Physical & Social Science | 0 (0.0%) | 0 (0.0%) |
| Community & Social Service | 0 (0.0%) | 0 (0.0%) |
| Education, Arts & Media | 0 (0.0%) | 0 (0.0%) |
| Legal Services & Support | 0 (0.0%) | 0 (0.0%) |
| Education Instruction & Library | 0 (0.0%) | 0 (0.0%) |
| Arts, Media & Entertainment | 0 (0.0%) | 0 (0.0%) |
| Health Diagnosing & Treating | 2 (22.2%) | 7 (77.8%) |
| Health Technologists | 2 (22.2%) | 7 (77.8%) |
| Total (Category) | 9 (40.9%) | 13 (59.1%) |
| Total (Overall) | 76 (61.3%) | 48 (38.7%) |
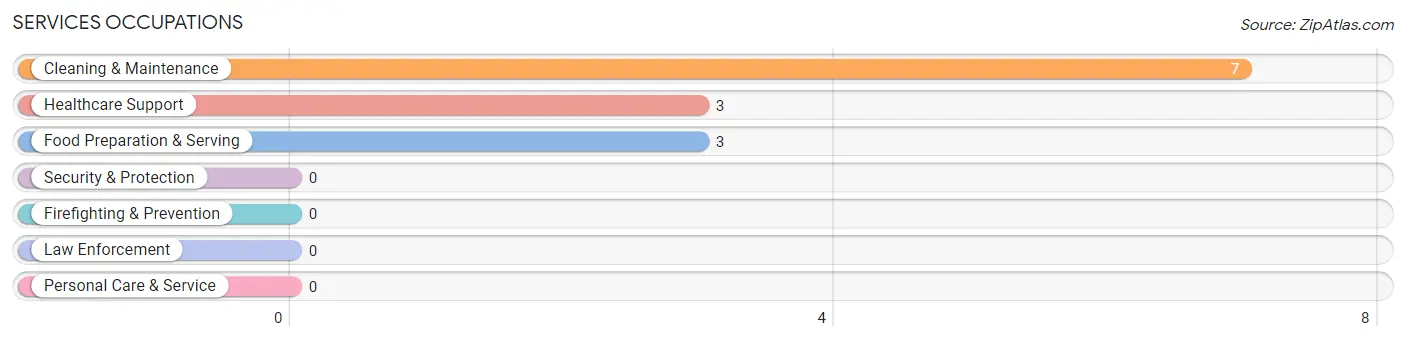
Services Occupations
The most common Services occupations in Millhousen are Cleaning & Maintenance (7 | 5.7%), Healthcare Support (3 | 2.4%), and Food Preparation & Serving (3 | 2.4%).
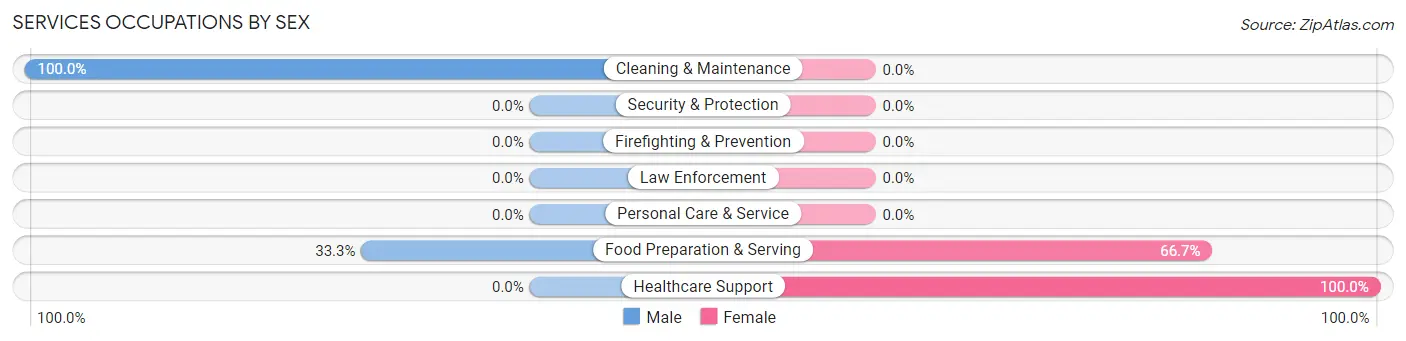
Services Occupations by Sex
Within the Services occupations in Millhousen, the most male-oriented occupations are Cleaning & Maintenance (100.0%), and Food Preparation & Serving (33.3%), while the most female-oriented occupations are Healthcare Support (100.0%), and Food Preparation & Serving (66.7%).
| Occupation | Male | Female |
| Healthcare Support | 0 (0.0%) | 3 (100.0%) |
| Security & Protection | 0 (0.0%) | 0 (0.0%) |
| Firefighting & Prevention | 0 (0.0%) | 0 (0.0%) |
| Law Enforcement | 0 (0.0%) | 0 (0.0%) |
| Food Preparation & Serving | 1 (33.3%) | 2 (66.7%) |
| Cleaning & Maintenance | 7 (100.0%) | 0 (0.0%) |
| Personal Care & Service | 0 (0.0%) | 0 (0.0%) |
| Total (Category) | 8 (61.5%) | 5 (38.5%) |
| Total (Overall) | 76 (61.3%) | 48 (38.7%) |
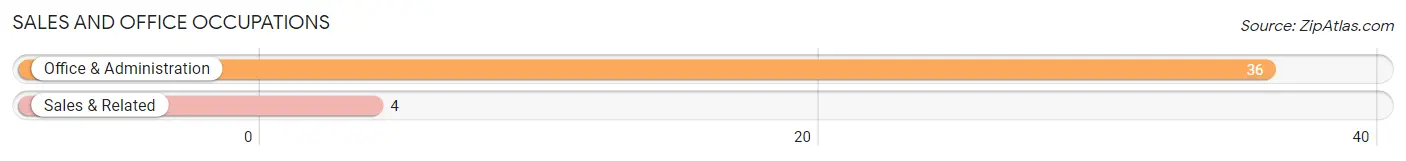
Sales and Office Occupations
The most common Sales and Office occupations in Millhousen are Office & Administration (36 | 29.0%), and Sales & Related (4 | 3.2%).
Sales and Office Occupations by Sex
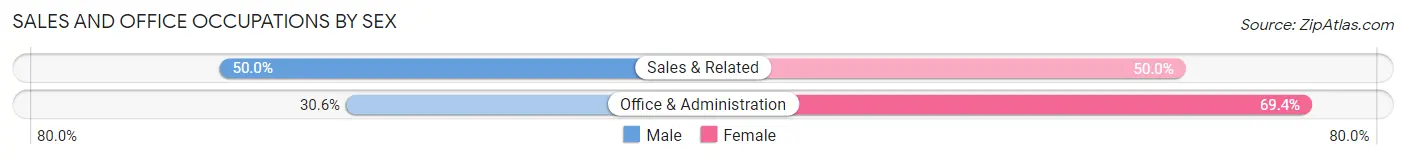
| Occupation | Male | Female |
| Sales & Related | 2 (50.0%) | 2 (50.0%) |
| Office & Administration | 11 (30.6%) | 25 (69.4%) |
| Total (Category) | 13 (32.5%) | 27 (67.5%) |
| Total (Overall) | 76 (61.3%) | 48 (38.7%) |
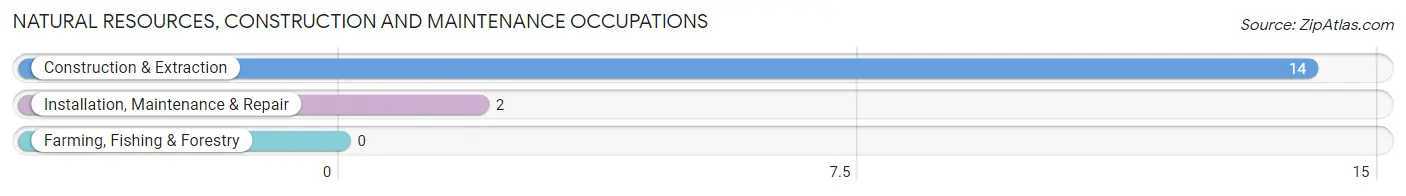
Natural Resources, Construction and Maintenance Occupations
The most common Natural Resources, Construction and Maintenance occupations in Millhousen are Construction & Extraction (14 | 11.3%), and Installation, Maintenance & Repair (2 | 1.6%).
Natural Resources, Construction and Maintenance Occupations by Sex
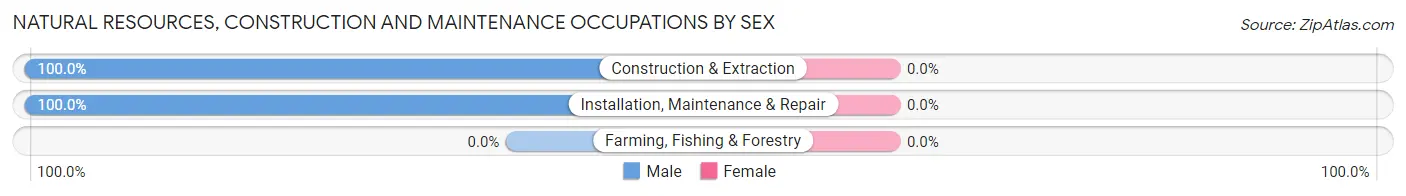
| Occupation | Male | Female |
| Farming, Fishing & Forestry | 0 (0.0%) | 0 (0.0%) |
| Construction & Extraction | 14 (100.0%) | 0 (0.0%) |
| Installation, Maintenance & Repair | 2 (100.0%) | 0 (0.0%) |
| Total (Category) | 16 (100.0%) | 0 (0.0%) |
| Total (Overall) | 76 (61.3%) | 48 (38.7%) |
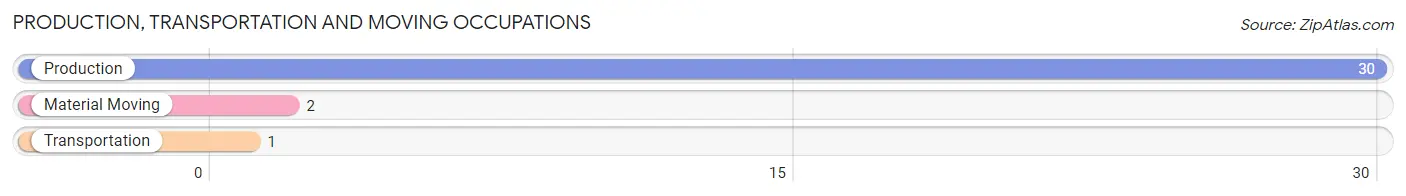
Production, Transportation and Moving Occupations
The most common Production, Transportation and Moving occupations in Millhousen are Production (30 | 24.2%), Material Moving (2 | 1.6%), and Transportation (1 | 0.8%).
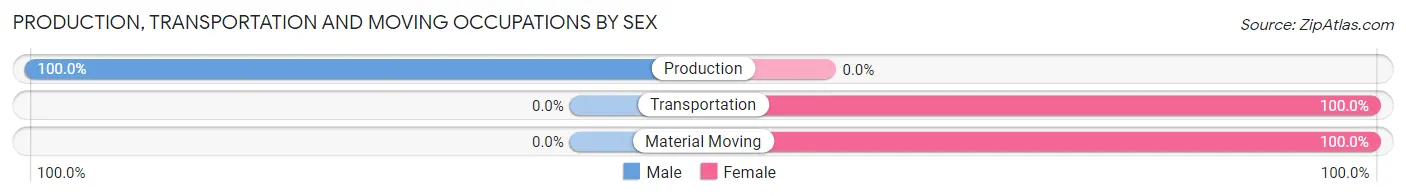
Production, Transportation and Moving Occupations by Sex
| Occupation | Male | Female |
| Production | 30 (100.0%) | 0 (0.0%) |
| Transportation | 0 (0.0%) | 1 (100.0%) |
| Material Moving | 0 (0.0%) | 2 (100.0%) |
| Total (Category) | 30 (90.9%) | 3 (9.1%) |
| Total (Overall) | 76 (61.3%) | 48 (38.7%) |
Employment Industries by Sex in Millhousen
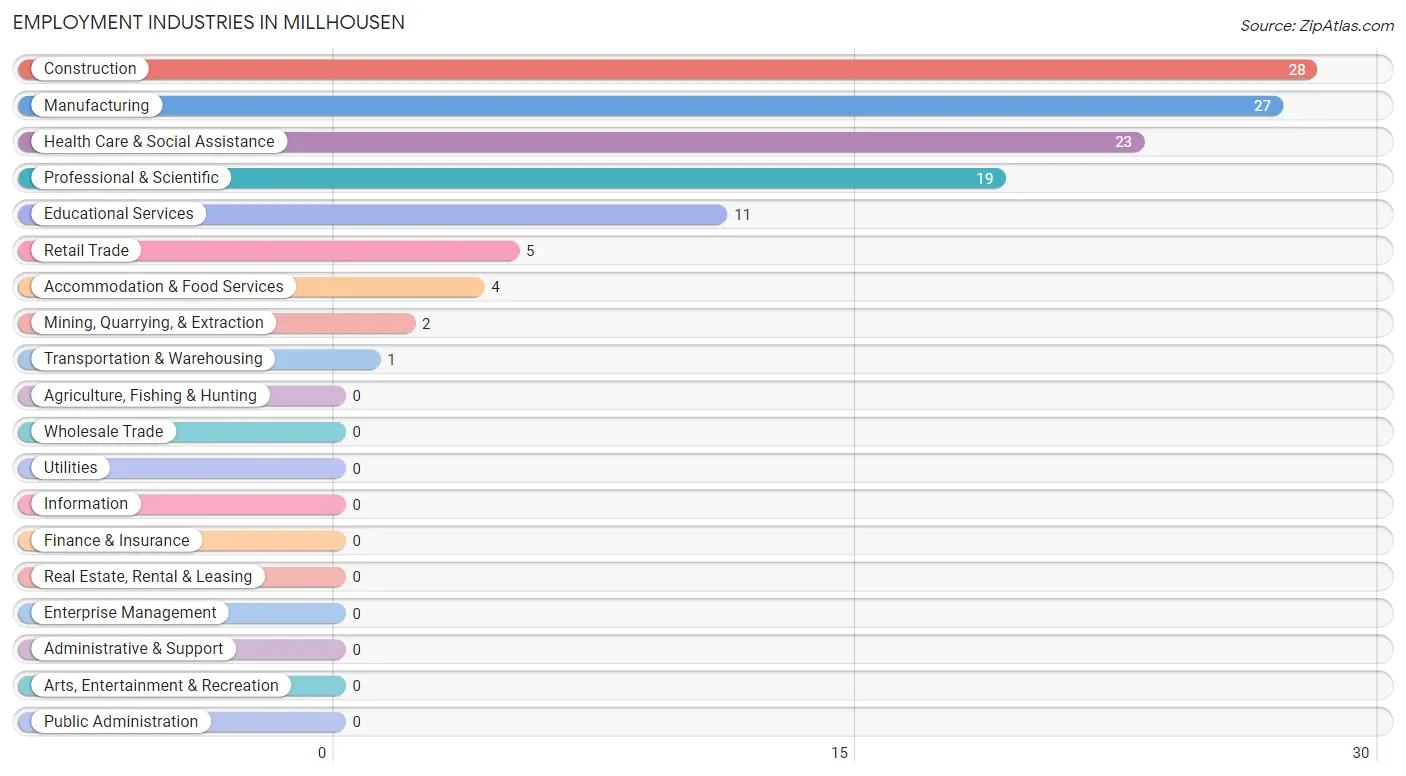
Employment Industries in Millhousen
The major employment industries in Millhousen include Construction (28 | 22.6%), Manufacturing (27 | 21.8%), Health Care & Social Assistance (23 | 18.5%), Professional & Scientific (19 | 15.3%), and Educational Services (11 | 8.9%).
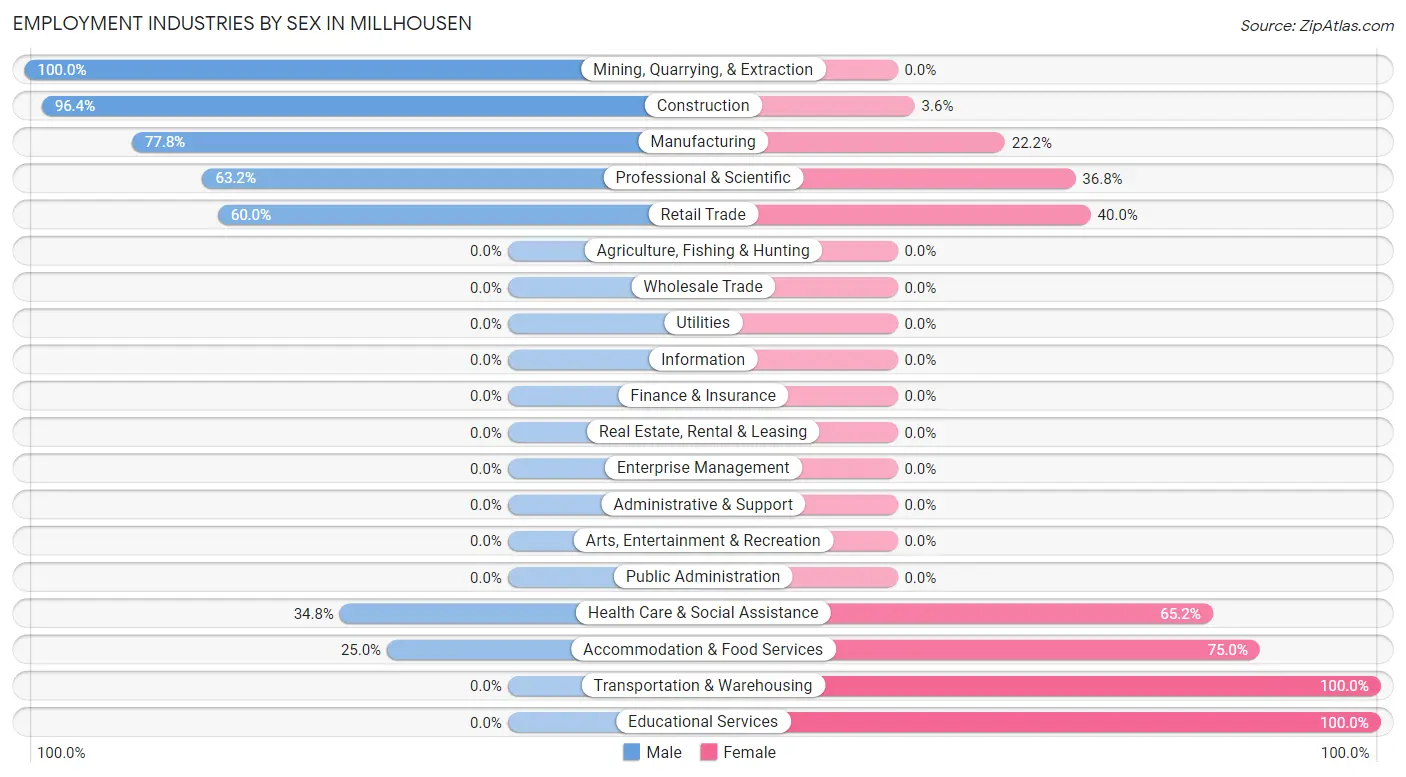
Employment Industries by Sex in Millhousen
The Millhousen industries that see more men than women are Mining, Quarrying, & Extraction (100.0%), Construction (96.4%), and Manufacturing (77.8%), whereas the industries that tend to have a higher number of women are Transportation & Warehousing (100.0%), Educational Services (100.0%), and Accommodation & Food Services (75.0%).
| Industry | Male | Female |
| Agriculture, Fishing & Hunting | 0 (0.0%) | 0 (0.0%) |
| Mining, Quarrying, & Extraction | 2 (100.0%) | 0 (0.0%) |
| Construction | 27 (96.4%) | 1 (3.6%) |
| Manufacturing | 21 (77.8%) | 6 (22.2%) |
| Wholesale Trade | 0 (0.0%) | 0 (0.0%) |
| Retail Trade | 3 (60.0%) | 2 (40.0%) |
| Transportation & Warehousing | 0 (0.0%) | 1 (100.0%) |
| Utilities | 0 (0.0%) | 0 (0.0%) |
| Information | 0 (0.0%) | 0 (0.0%) |
| Finance & Insurance | 0 (0.0%) | 0 (0.0%) |
| Real Estate, Rental & Leasing | 0 (0.0%) | 0 (0.0%) |
| Professional & Scientific | 12 (63.2%) | 7 (36.8%) |
| Enterprise Management | 0 (0.0%) | 0 (0.0%) |
| Administrative & Support | 0 (0.0%) | 0 (0.0%) |
| Educational Services | 0 (0.0%) | 11 (100.0%) |
| Health Care & Social Assistance | 8 (34.8%) | 15 (65.2%) |
| Arts, Entertainment & Recreation | 0 (0.0%) | 0 (0.0%) |
| Accommodation & Food Services | 1 (25.0%) | 3 (75.0%) |
| Public Administration | 0 (0.0%) | 0 (0.0%) |
| Total | 76 (61.3%) | 48 (38.7%) |
Education in Millhousen
School Enrollment in Millhousen
The most common levels of schooling among the 24 students in Millhousen are elementary school (11 | 45.8%), middle school (7 | 29.2%), and kindergarten (3 | 12.5%).
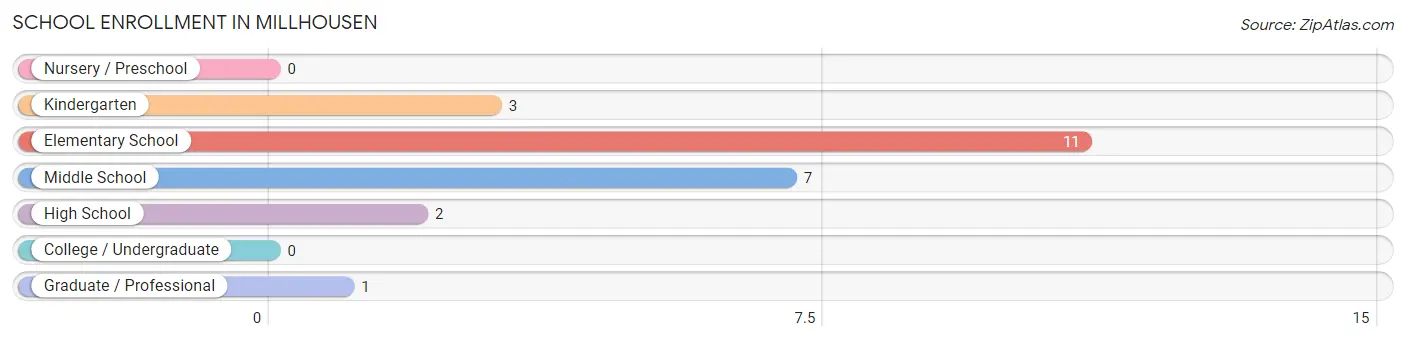
| School Level | # Students | % Students |
| Nursery / Preschool | 0 | 0.0% |
| Kindergarten | 3 | 12.5% |
| Elementary School | 11 | 45.8% |
| Middle School | 7 | 29.2% |
| High School | 2 | 8.3% |
| College / Undergraduate | 0 | 0.0% |
| Graduate / Professional | 1 | 4.2% |
| Total | 24 | 100.0% |
School Enrollment by Age by Funding Source in Millhousen
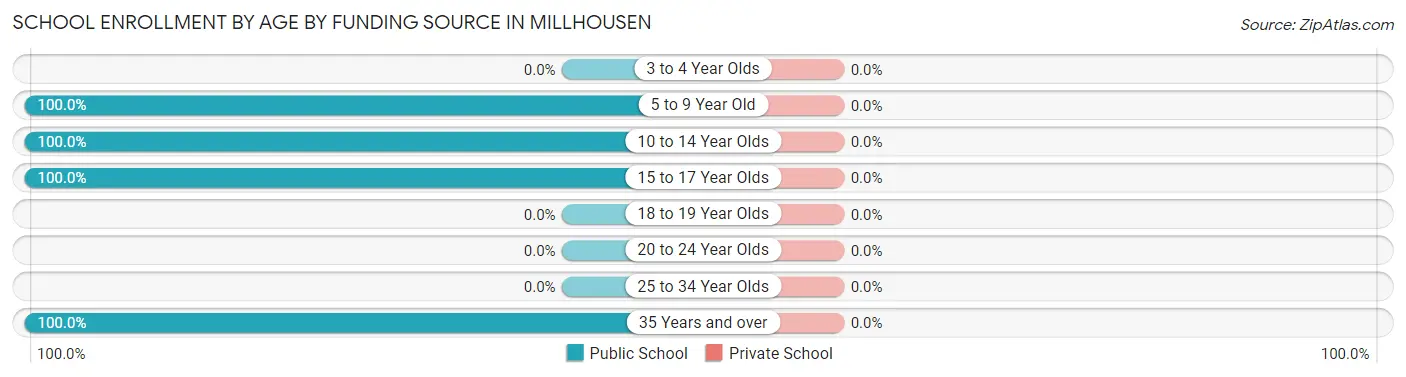
| Age Bracket | Public School | Private School |
| 3 to 4 Year Olds | 0 (0.0%) | 0 (0.0%) |
| 5 to 9 Year Old | 14 (100.0%) | 0 (0.0%) |
| 10 to 14 Year Olds | 7 (100.0%) | 0 (0.0%) |
| 15 to 17 Year Olds | 2 (100.0%) | 0 (0.0%) |
| 18 to 19 Year Olds | 0 (0.0%) | 0 (0.0%) |
| 20 to 24 Year Olds | 0 (0.0%) | 0 (0.0%) |
| 25 to 34 Year Olds | 0 (0.0%) | 0 (0.0%) |
| 35 Years and over | 1 (100.0%) | 0 (0.0%) |
| Total | 24 (100.0%) | 0 (0.0%) |
Educational Attainment by Field of Study in Millhousen
Education (10 | 43.5%), science & technology (7 | 30.4%), engineering (3 | 13.0%), and business (3 | 13.0%) are the most common fields of study among 23 individuals in Millhousen who have obtained a bachelor's degree or higher.
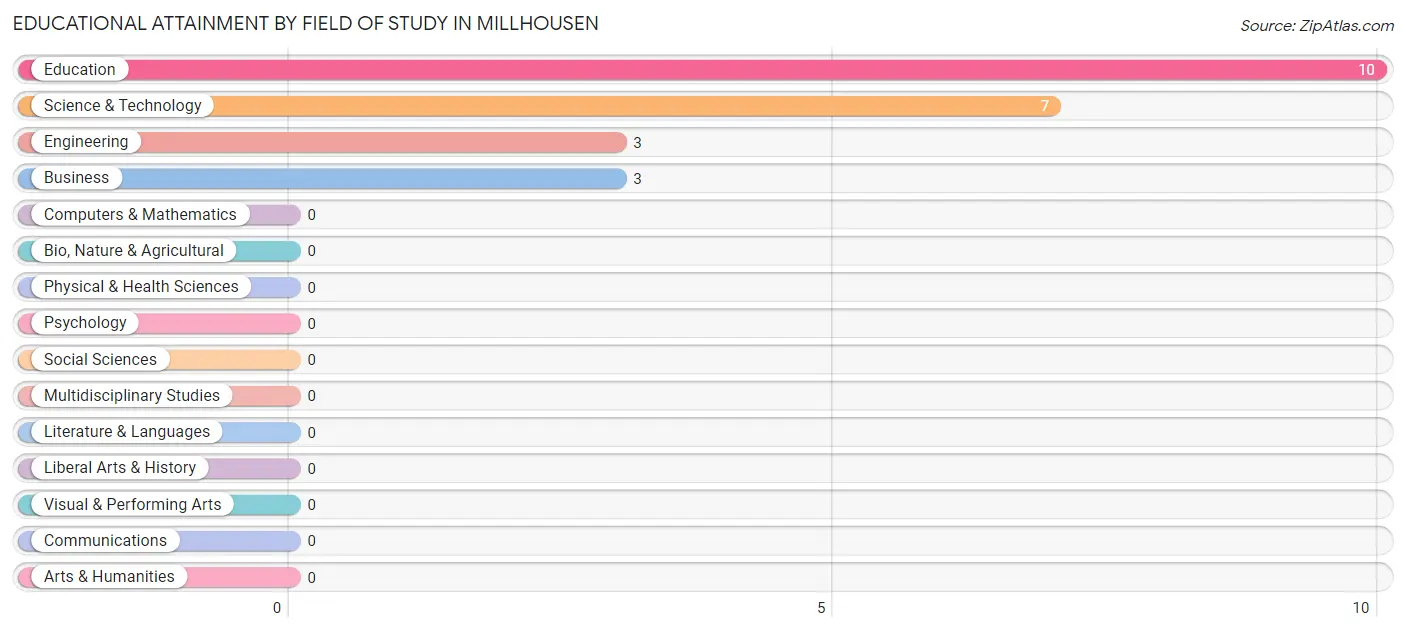
| Field of Study | # Graduates | % Graduates |
| Computers & Mathematics | 0 | 0.0% |
| Bio, Nature & Agricultural | 0 | 0.0% |
| Physical & Health Sciences | 0 | 0.0% |
| Psychology | 0 | 0.0% |
| Social Sciences | 0 | 0.0% |
| Engineering | 3 | 13.0% |
| Multidisciplinary Studies | 0 | 0.0% |
| Science & Technology | 7 | 30.4% |
| Business | 3 | 13.0% |
| Education | 10 | 43.5% |
| Literature & Languages | 0 | 0.0% |
| Liberal Arts & History | 0 | 0.0% |
| Visual & Performing Arts | 0 | 0.0% |
| Communications | 0 | 0.0% |
| Arts & Humanities | 0 | 0.0% |
| Total | 23 | 100.0% |
Transportation & Commute in Millhousen
Vehicle Availability by Sex in Millhousen
The most prevalent vehicle ownership categories in Millhousen are males with 2 vehicles (31, accounting for 40.8%) and females with 2 vehicles (20, making up 64.6%).
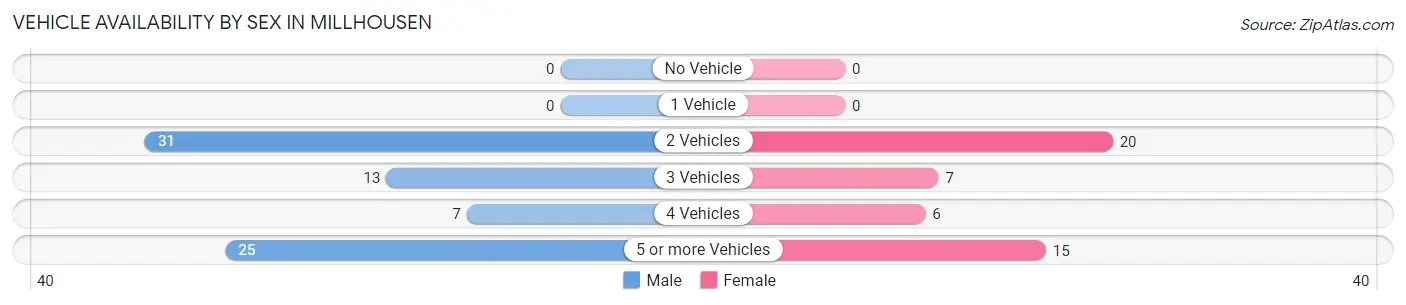
| Vehicles Available | Male | Female |
| No Vehicle | 0 (0.0%) | 0 (0.0%) |
| 1 Vehicle | 0 (0.0%) | 0 (0.0%) |
| 2 Vehicles | 31 (40.8%) | 20 (41.7%) |
| 3 Vehicles | 13 (17.1%) | 7 (14.6%) |
| 4 Vehicles | 7 (9.2%) | 6 (12.5%) |
| 5 or more Vehicles | 25 (32.9%) | 15 (31.2%) |
| Total | 76 (100.0%) | 48 (100.0%) |
Commute Time in Millhousen
The most frequently occuring commute durations in Millhousen are 60 to 89 minutes (49 commuters, 42.6%), 10 to 14 minutes (20 commuters, 17.4%), and 20 to 24 minutes (11 commuters, 9.6%).
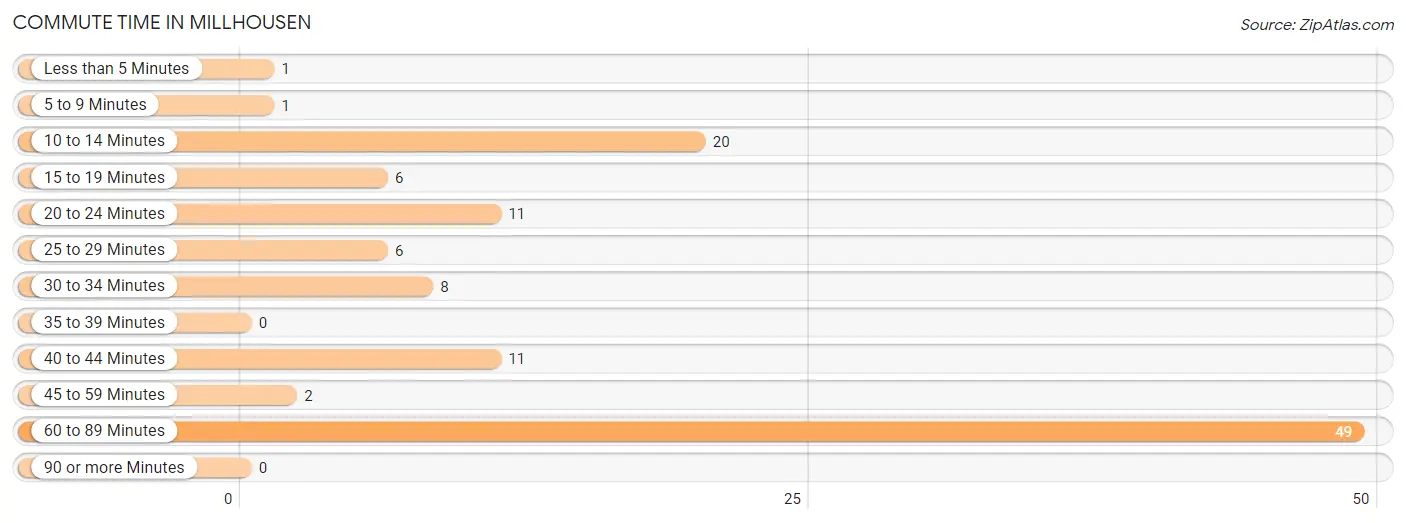
| Commute Time | # Commuters | % Commuters |
| Less than 5 Minutes | 1 | 0.9% |
| 5 to 9 Minutes | 1 | 0.9% |
| 10 to 14 Minutes | 20 | 17.4% |
| 15 to 19 Minutes | 6 | 5.2% |
| 20 to 24 Minutes | 11 | 9.6% |
| 25 to 29 Minutes | 6 | 5.2% |
| 30 to 34 Minutes | 8 | 7.0% |
| 35 to 39 Minutes | 0 | 0.0% |
| 40 to 44 Minutes | 11 | 9.6% |
| 45 to 59 Minutes | 2 | 1.7% |
| 60 to 89 Minutes | 49 | 42.6% |
| 90 or more Minutes | 0 | 0.0% |
Commute Time by Sex in Millhousen
The most common commute times in Millhousen are 60 to 89 minutes (37 commuters, 50.0%) for males and 60 to 89 minutes (12 commuters, 29.3%) for females.
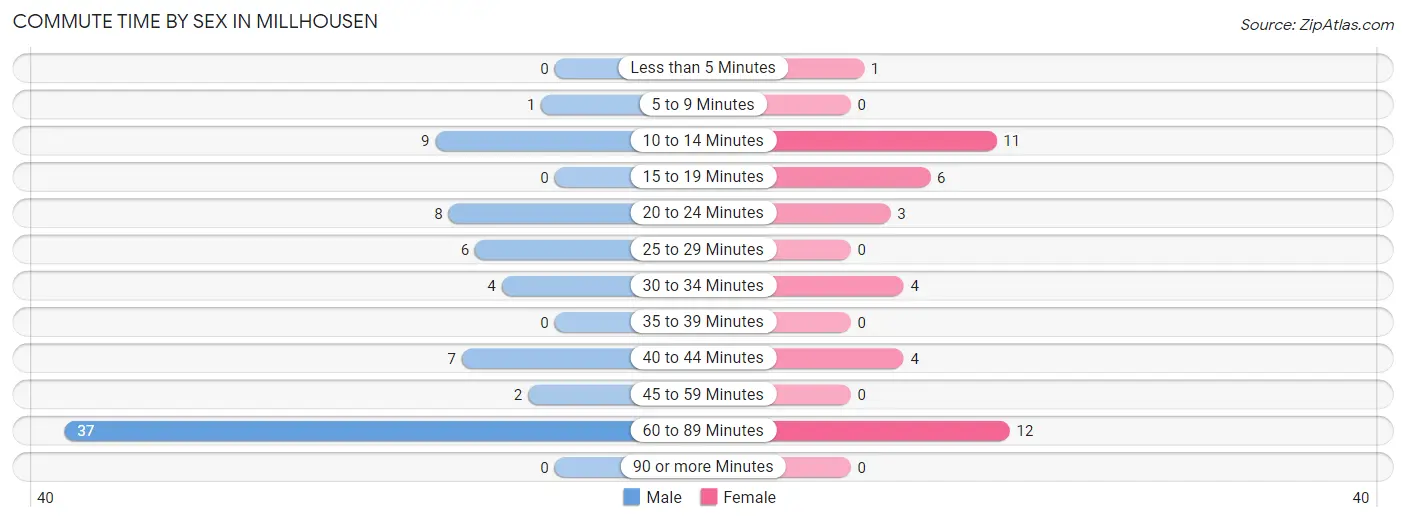
| Commute Time | Male | Female |
| Less than 5 Minutes | 0 (0.0%) | 1 (2.4%) |
| 5 to 9 Minutes | 1 (1.3%) | 0 (0.0%) |
| 10 to 14 Minutes | 9 (12.2%) | 11 (26.8%) |
| 15 to 19 Minutes | 0 (0.0%) | 6 (14.6%) |
| 20 to 24 Minutes | 8 (10.8%) | 3 (7.3%) |
| 25 to 29 Minutes | 6 (8.1%) | 0 (0.0%) |
| 30 to 34 Minutes | 4 (5.4%) | 4 (9.8%) |
| 35 to 39 Minutes | 0 (0.0%) | 0 (0.0%) |
| 40 to 44 Minutes | 7 (9.5%) | 4 (9.8%) |
| 45 to 59 Minutes | 2 (2.7%) | 0 (0.0%) |
| 60 to 89 Minutes | 37 (50.0%) | 12 (29.3%) |
| 90 or more Minutes | 0 (0.0%) | 0 (0.0%) |
Time of Departure to Work by Sex in Millhousen
The most frequent times of departure to work in Millhousen are 6:00 AM to 6:29 AM (24, 32.4%) for males and 7:30 AM to 7:59 AM (14, 34.2%) for females.
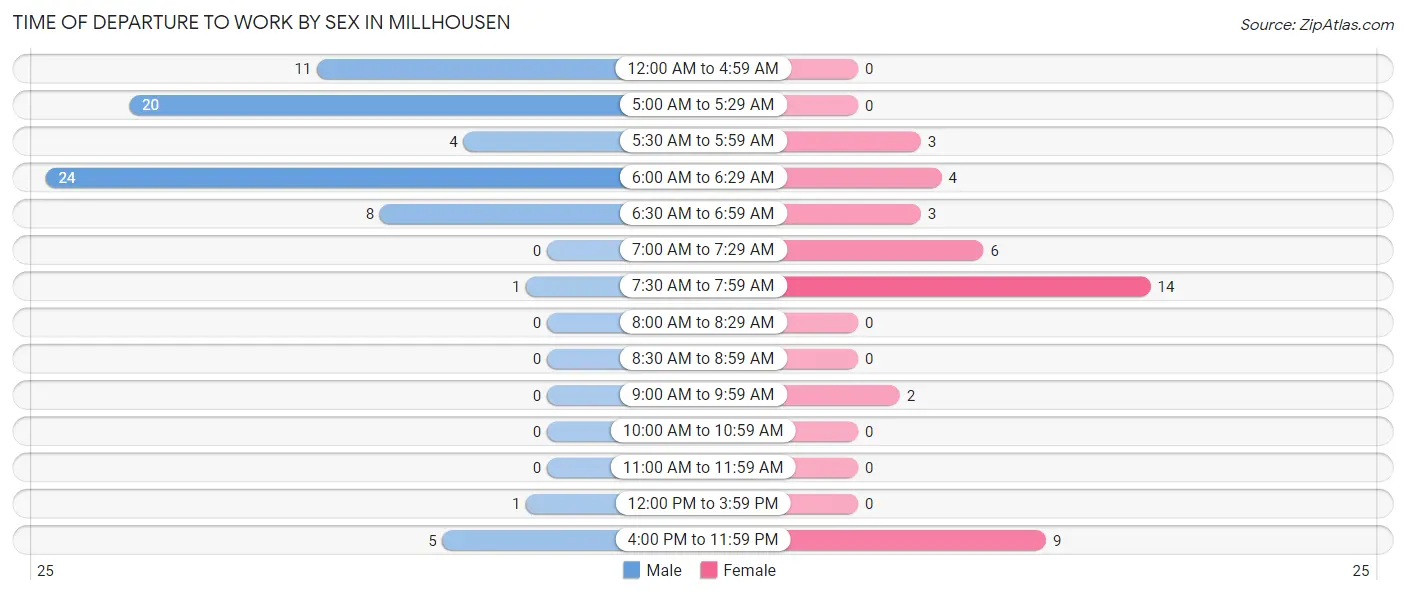
| Time of Departure | Male | Female |
| 12:00 AM to 4:59 AM | 11 (14.9%) | 0 (0.0%) |
| 5:00 AM to 5:29 AM | 20 (27.0%) | 0 (0.0%) |
| 5:30 AM to 5:59 AM | 4 (5.4%) | 3 (7.3%) |
| 6:00 AM to 6:29 AM | 24 (32.4%) | 4 (9.8%) |
| 6:30 AM to 6:59 AM | 8 (10.8%) | 3 (7.3%) |
| 7:00 AM to 7:29 AM | 0 (0.0%) | 6 (14.6%) |
| 7:30 AM to 7:59 AM | 1 (1.3%) | 14 (34.2%) |
| 8:00 AM to 8:29 AM | 0 (0.0%) | 0 (0.0%) |
| 8:30 AM to 8:59 AM | 0 (0.0%) | 0 (0.0%) |
| 9:00 AM to 9:59 AM | 0 (0.0%) | 2 (4.9%) |
| 10:00 AM to 10:59 AM | 0 (0.0%) | 0 (0.0%) |
| 11:00 AM to 11:59 AM | 0 (0.0%) | 0 (0.0%) |
| 12:00 PM to 3:59 PM | 1 (1.3%) | 0 (0.0%) |
| 4:00 PM to 11:59 PM | 5 (6.8%) | 9 (22.0%) |
| Total | 74 (100.0%) | 41 (100.0%) |
Housing Occupancy in Millhousen
Occupancy by Ownership in Millhousen
Of the total 124 dwellings in Millhousen, owner-occupied units account for 116 (93.5%), while renter-occupied units make up 8 (6.5%).
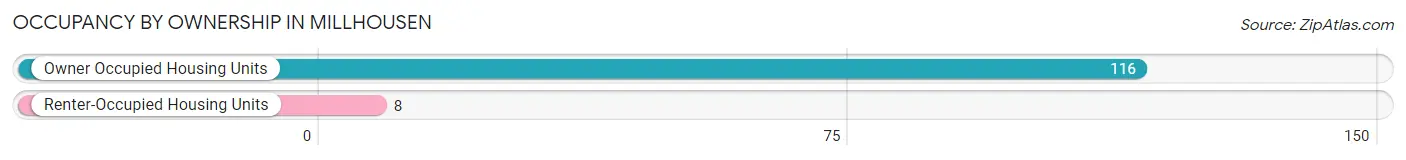
| Occupancy | # Housing Units | % Housing Units |
| Owner Occupied Housing Units | 116 | 93.5% |
| Renter-Occupied Housing Units | 8 | 6.5% |
| Total Occupied Housing Units | 124 | 100.0% |
Occupancy by Household Size in Millhousen
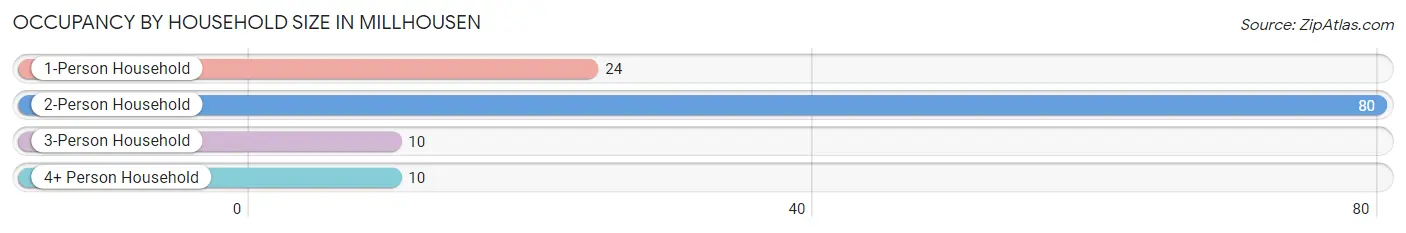
| Household Size | # Housing Units | % Housing Units |
| 1-Person Household | 24 | 19.4% |
| 2-Person Household | 80 | 64.5% |
| 3-Person Household | 10 | 8.1% |
| 4+ Person Household | 10 | 8.1% |
| Total Housing Units | 124 | 100.0% |
Occupancy by Ownership by Household Size in Millhousen
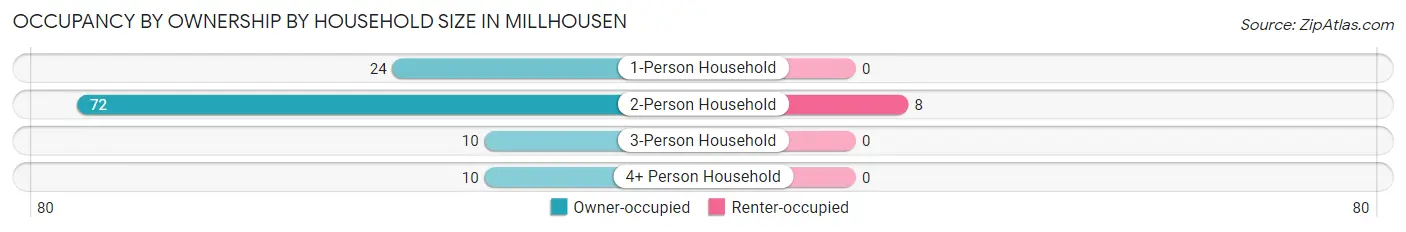
| Household Size | Owner-occupied | Renter-occupied |
| 1-Person Household | 24 (100.0%) | 0 (0.0%) |
| 2-Person Household | 72 (90.0%) | 8 (10.0%) |
| 3-Person Household | 10 (100.0%) | 0 (0.0%) |
| 4+ Person Household | 10 (100.0%) | 0 (0.0%) |
| Total Housing Units | 116 (93.5%) | 8 (6.5%) |
Occupancy by Educational Attainment in Millhousen
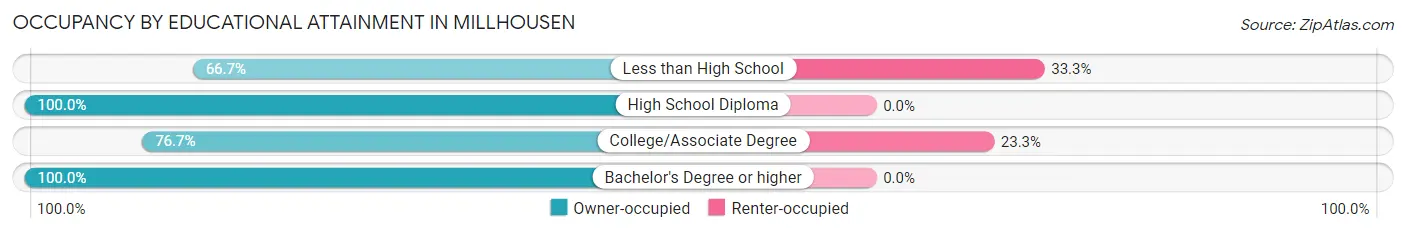
| Household Size | Owner-occupied | Renter-occupied |
| Less than High School | 2 (66.7%) | 1 (33.3%) |
| High School Diploma | 71 (100.0%) | 0 (0.0%) |
| College/Associate Degree | 23 (76.7%) | 7 (23.3%) |
| Bachelor's Degree or higher | 20 (100.0%) | 0 (0.0%) |
Occupancy by Age of Householder in Millhousen
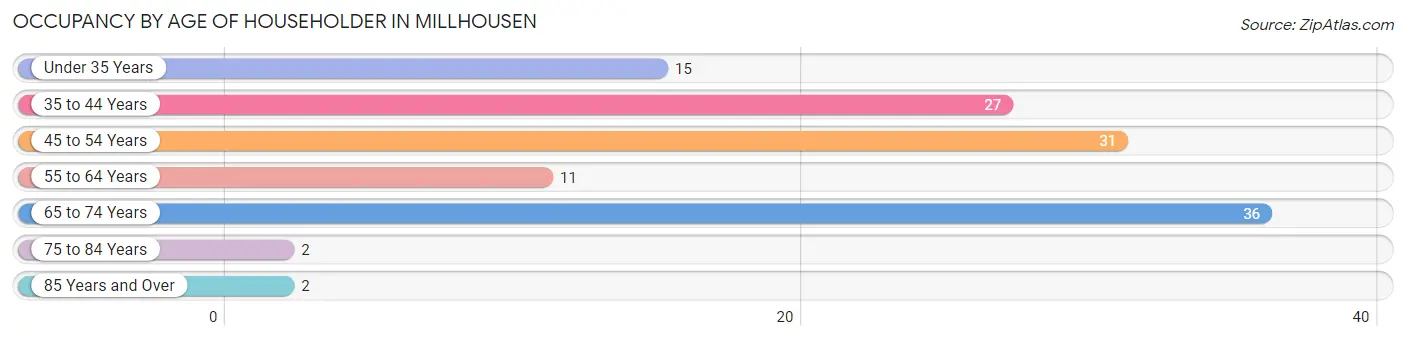
| Age Bracket | # Households | % Households |
| Under 35 Years | 15 | 12.1% |
| 35 to 44 Years | 27 | 21.8% |
| 45 to 54 Years | 31 | 25.0% |
| 55 to 64 Years | 11 | 8.9% |
| 65 to 74 Years | 36 | 29.0% |
| 75 to 84 Years | 2 | 1.6% |
| 85 Years and Over | 2 | 1.6% |
| Total | 124 | 100.0% |
Housing Finances in Millhousen
Median Income by Occupancy in Millhousen
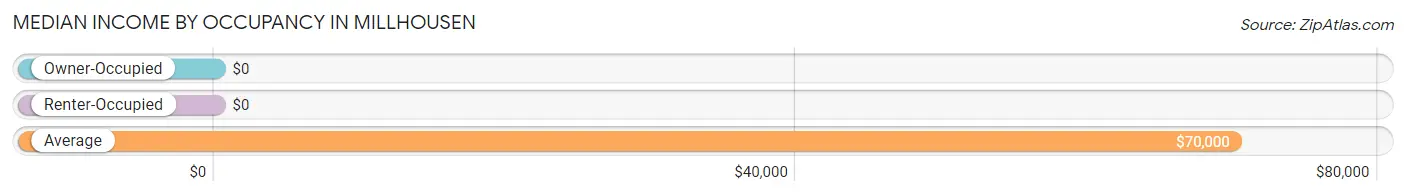
| Occupancy Type | # Households | Median Income |
| Owner-Occupied | 116 (93.5%) | $0 |
| Renter-Occupied | 8 (6.5%) | $0 |
| Average | 124 (100.0%) | $70,000 |
Occupancy by Householder Income Bracket in Millhousen
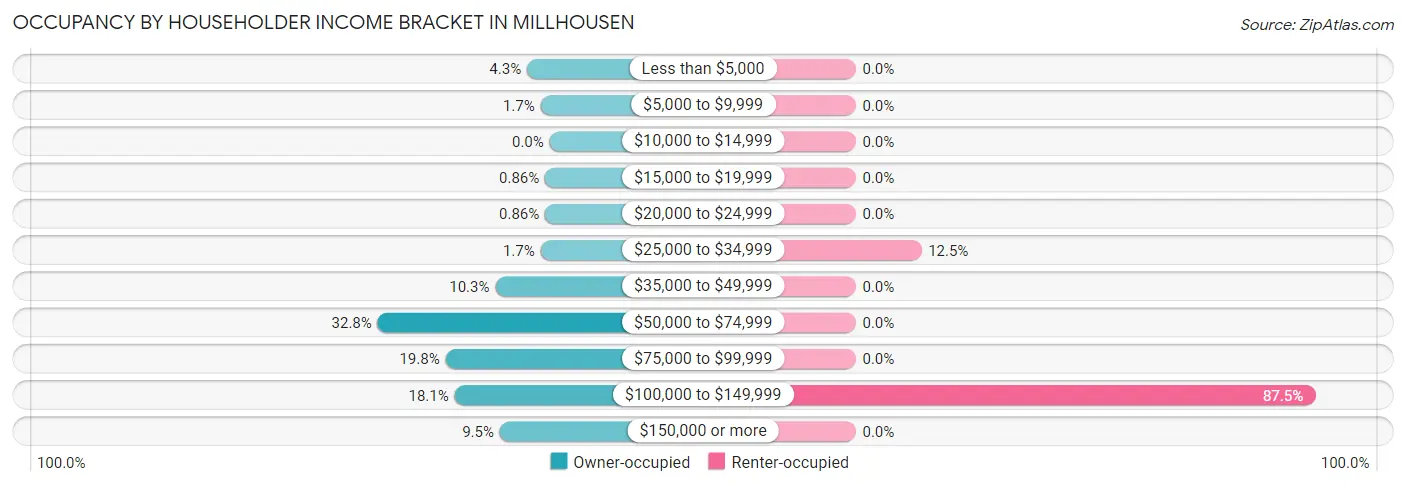
| Income Bracket | Owner-occupied | Renter-occupied |
| Less than $5,000 | 5 (4.3%) | 0 (0.0%) |
| $5,000 to $9,999 | 2 (1.7%) | 0 (0.0%) |
| $10,000 to $14,999 | 0 (0.0%) | 0 (0.0%) |
| $15,000 to $19,999 | 1 (0.9%) | 0 (0.0%) |
| $20,000 to $24,999 | 1 (0.9%) | 0 (0.0%) |
| $25,000 to $34,999 | 2 (1.7%) | 1 (12.5%) |
| $35,000 to $49,999 | 12 (10.3%) | 0 (0.0%) |
| $50,000 to $74,999 | 38 (32.8%) | 0 (0.0%) |
| $75,000 to $99,999 | 23 (19.8%) | 0 (0.0%) |
| $100,000 to $149,999 | 21 (18.1%) | 7 (87.5%) |
| $150,000 or more | 11 (9.5%) | 0 (0.0%) |
| Total | 116 (100.0%) | 8 (100.0%) |
Monthly Housing Cost Tiers in Millhousen
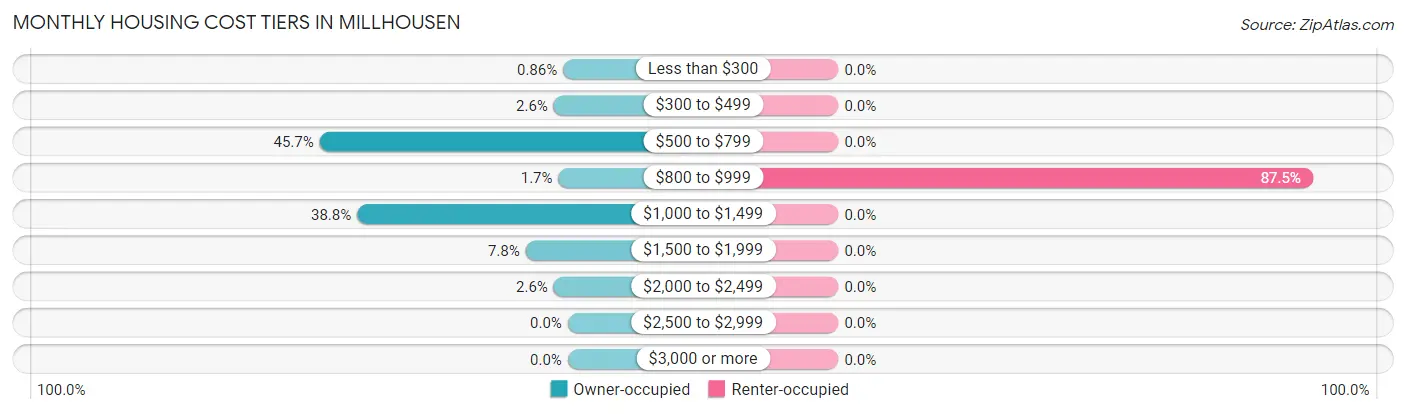
| Monthly Cost | Owner-occupied | Renter-occupied |
| Less than $300 | 1 (0.9%) | 0 (0.0%) |
| $300 to $499 | 3 (2.6%) | 0 (0.0%) |
| $500 to $799 | 53 (45.7%) | 0 (0.0%) |
| $800 to $999 | 2 (1.7%) | 7 (87.5%) |
| $1,000 to $1,499 | 45 (38.8%) | 0 (0.0%) |
| $1,500 to $1,999 | 9 (7.8%) | 0 (0.0%) |
| $2,000 to $2,499 | 3 (2.6%) | 0 (0.0%) |
| $2,500 to $2,999 | 0 (0.0%) | 0 (0.0%) |
| $3,000 or more | 0 (0.0%) | 0 (0.0%) |
| Total | 116 (100.0%) | 8 (100.0%) |
Physical Housing Characteristics in Millhousen
Housing Structures in Millhousen
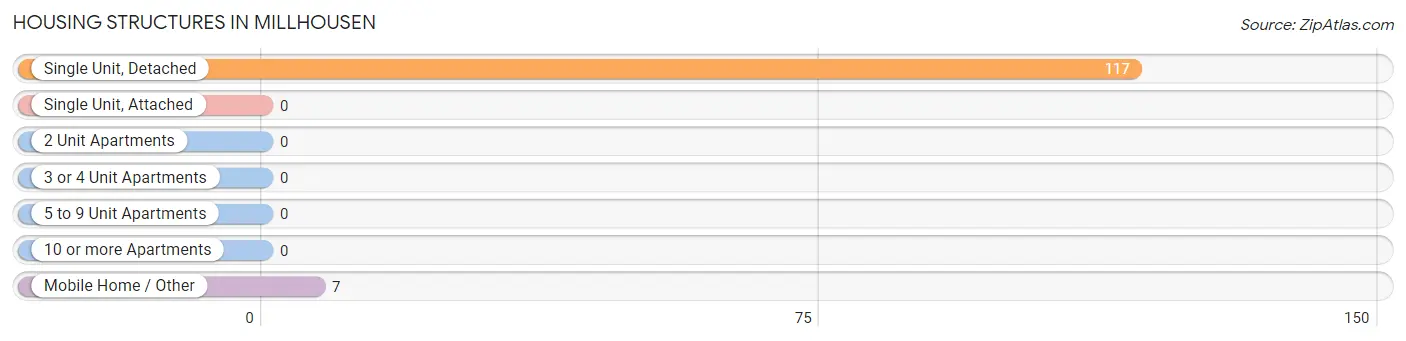
| Structure Type | # Housing Units | % Housing Units |
| Single Unit, Detached | 117 | 94.4% |
| Single Unit, Attached | 0 | 0.0% |
| 2 Unit Apartments | 0 | 0.0% |
| 3 or 4 Unit Apartments | 0 | 0.0% |
| 5 to 9 Unit Apartments | 0 | 0.0% |
| 10 or more Apartments | 0 | 0.0% |
| Mobile Home / Other | 7 | 5.7% |
| Total | 124 | 100.0% |
Housing Structures by Occupancy in Millhousen
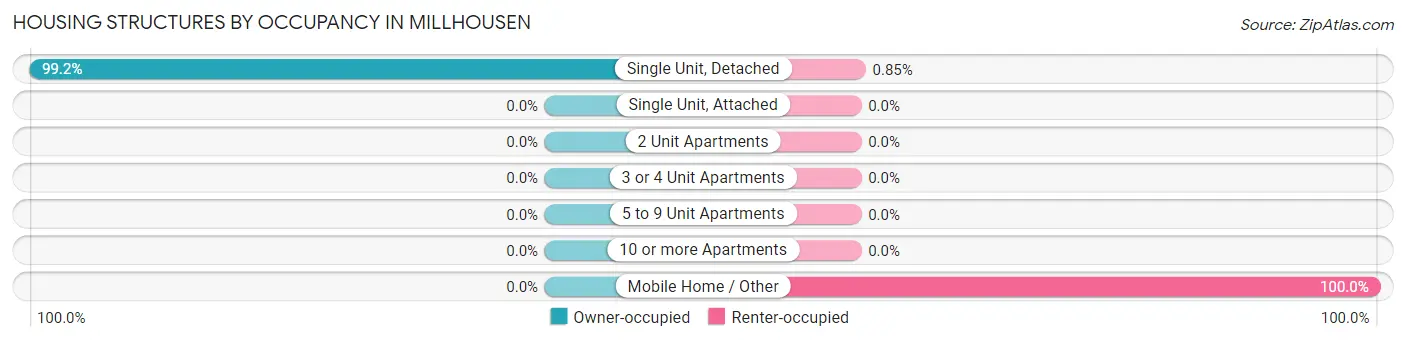
| Structure Type | Owner-occupied | Renter-occupied |
| Single Unit, Detached | 116 (99.2%) | 1 (0.9%) |
| Single Unit, Attached | 0 (0.0%) | 0 (0.0%) |
| 2 Unit Apartments | 0 (0.0%) | 0 (0.0%) |
| 3 or 4 Unit Apartments | 0 (0.0%) | 0 (0.0%) |
| 5 to 9 Unit Apartments | 0 (0.0%) | 0 (0.0%) |
| 10 or more Apartments | 0 (0.0%) | 0 (0.0%) |
| Mobile Home / Other | 0 (0.0%) | 7 (100.0%) |
| Total | 116 (93.5%) | 8 (6.5%) |
Housing Structures by Number of Rooms in Millhousen
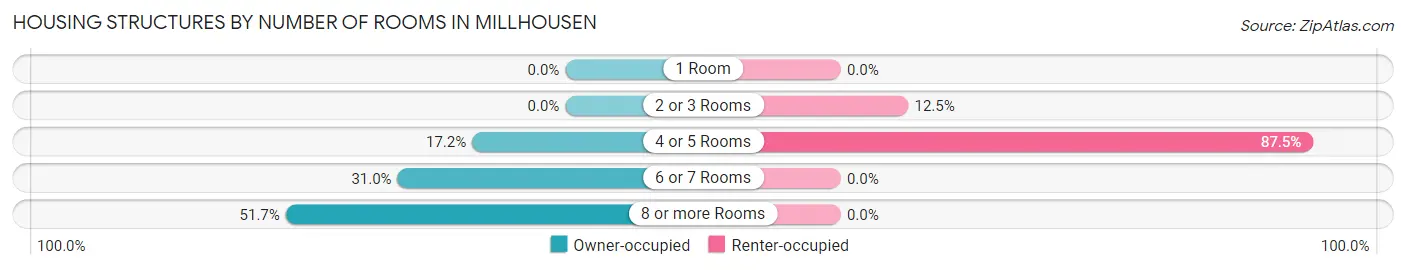
| Number of Rooms | Owner-occupied | Renter-occupied |
| 1 Room | 0 (0.0%) | 0 (0.0%) |
| 2 or 3 Rooms | 0 (0.0%) | 1 (12.5%) |
| 4 or 5 Rooms | 20 (17.2%) | 7 (87.5%) |
| 6 or 7 Rooms | 36 (31.0%) | 0 (0.0%) |
| 8 or more Rooms | 60 (51.7%) | 0 (0.0%) |
| Total | 116 (100.0%) | 8 (100.0%) |
Housing Structure by Heating Type in Millhousen
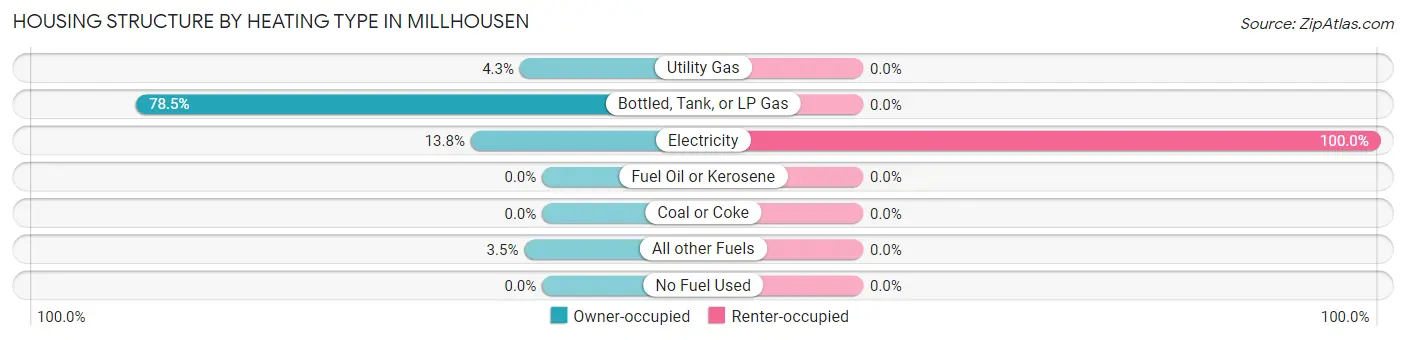
| Heating Type | Owner-occupied | Renter-occupied |
| Utility Gas | 5 (4.3%) | 0 (0.0%) |
| Bottled, Tank, or LP Gas | 91 (78.4%) | 0 (0.0%) |
| Electricity | 16 (13.8%) | 8 (100.0%) |
| Fuel Oil or Kerosene | 0 (0.0%) | 0 (0.0%) |
| Coal or Coke | 0 (0.0%) | 0 (0.0%) |
| All other Fuels | 4 (3.5%) | 0 (0.0%) |
| No Fuel Used | 0 (0.0%) | 0 (0.0%) |
| Total | 116 (100.0%) | 8 (100.0%) |
Household Vehicle Usage in Millhousen
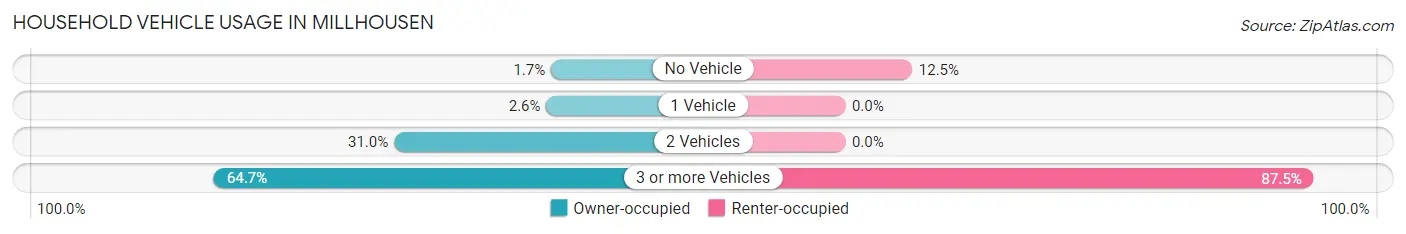
| Vehicles per Household | Owner-occupied | Renter-occupied |
| No Vehicle | 2 (1.7%) | 1 (12.5%) |
| 1 Vehicle | 3 (2.6%) | 0 (0.0%) |
| 2 Vehicles | 36 (31.0%) | 0 (0.0%) |
| 3 or more Vehicles | 75 (64.7%) | 7 (87.5%) |
| Total | 116 (100.0%) | 8 (100.0%) |
Real Estate & Mortgages in Millhousen
Real Estate and Mortgage Overview in Millhousen
| Characteristic | Without Mortgage | With Mortgage |
| Housing Units | 53 | 63 |
| Median Property Value | $216,900 | $143,300 |
| Median Household Income | $53,934 | $10 |
| Monthly Housing Costs | $732 | $0 |
| Real Estate Taxes | $2,264 | $0 |
Property Value by Mortgage Status in Millhousen
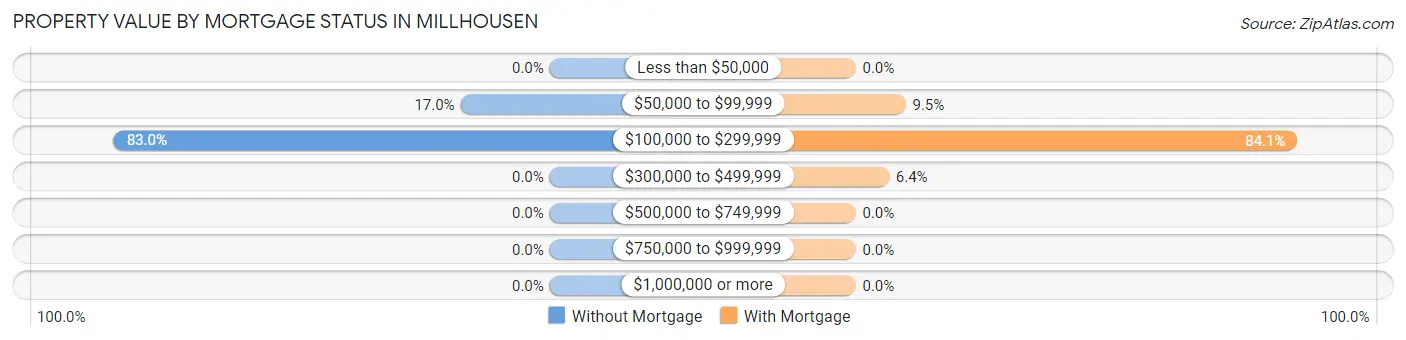
| Property Value | Without Mortgage | With Mortgage |
| Less than $50,000 | 0 (0.0%) | 0 (0.0%) |
| $50,000 to $99,999 | 9 (17.0%) | 6 (9.5%) |
| $100,000 to $299,999 | 44 (83.0%) | 53 (84.1%) |
| $300,000 to $499,999 | 0 (0.0%) | 4 (6.4%) |
| $500,000 to $749,999 | 0 (0.0%) | 0 (0.0%) |
| $750,000 to $999,999 | 0 (0.0%) | 0 (0.0%) |
| $1,000,000 or more | 0 (0.0%) | 0 (0.0%) |
| Total | 53 (100.0%) | 63 (100.0%) |
Household Income by Mortgage Status in Millhousen
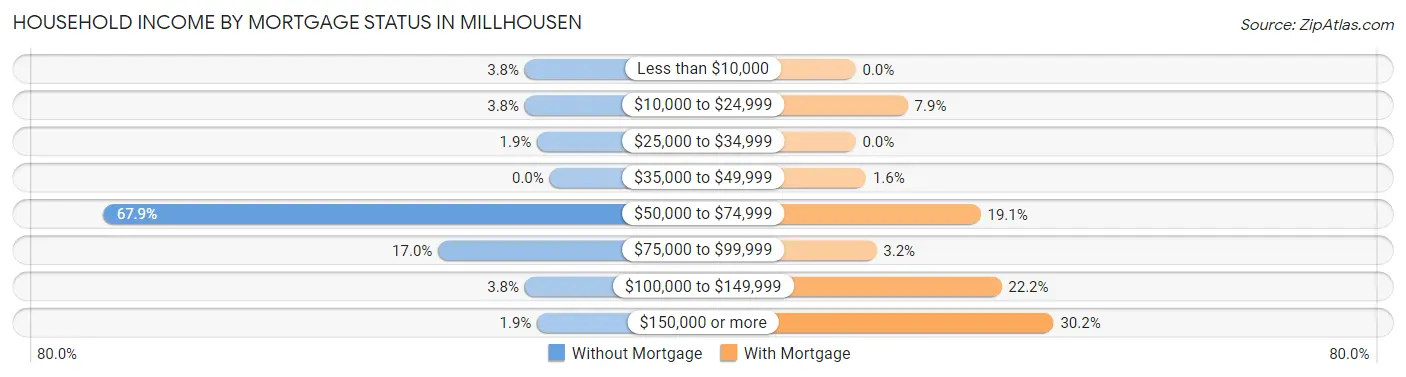
| Household Income | Without Mortgage | With Mortgage |
| Less than $10,000 | 2 (3.8%) | 0 (0.0%) |
| $10,000 to $24,999 | 2 (3.8%) | 5 (7.9%) |
| $25,000 to $34,999 | 1 (1.9%) | 0 (0.0%) |
| $35,000 to $49,999 | 0 (0.0%) | 1 (1.6%) |
| $50,000 to $74,999 | 36 (67.9%) | 12 (19.1%) |
| $75,000 to $99,999 | 9 (17.0%) | 2 (3.2%) |
| $100,000 to $149,999 | 2 (3.8%) | 14 (22.2%) |
| $150,000 or more | 1 (1.9%) | 19 (30.2%) |
| Total | 53 (100.0%) | 63 (100.0%) |
Property Value to Household Income Ratio in Millhousen
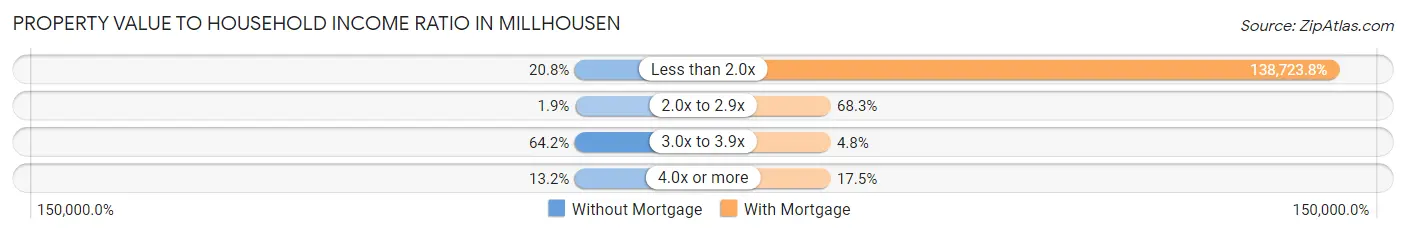
| Value-to-Income Ratio | Without Mortgage | With Mortgage |
| Less than 2.0x | 11 (20.7%) | 87,396 (138,723.8%) |
| 2.0x to 2.9x | 1 (1.9%) | 43 (68.2%) |
| 3.0x to 3.9x | 34 (64.1%) | 3 (4.8%) |
| 4.0x or more | 7 (13.2%) | 11 (17.5%) |
| Total | 53 (100.0%) | 63 (100.0%) |
Real Estate Taxes by Mortgage Status in Millhousen
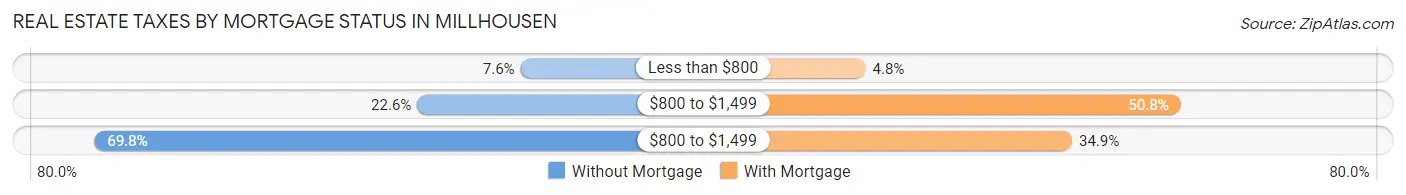
| Property Taxes | Without Mortgage | With Mortgage |
| Less than $800 | 4 (7.5%) | 3 (4.8%) |
| $800 to $1,499 | 12 (22.6%) | 32 (50.8%) |
| $800 to $1,499 | 37 (69.8%) | 22 (34.9%) |
| Total | 53 (100.0%) | 63 (100.0%) |
Health & Disability in Millhousen
Health Insurance Coverage by Age in Millhousen
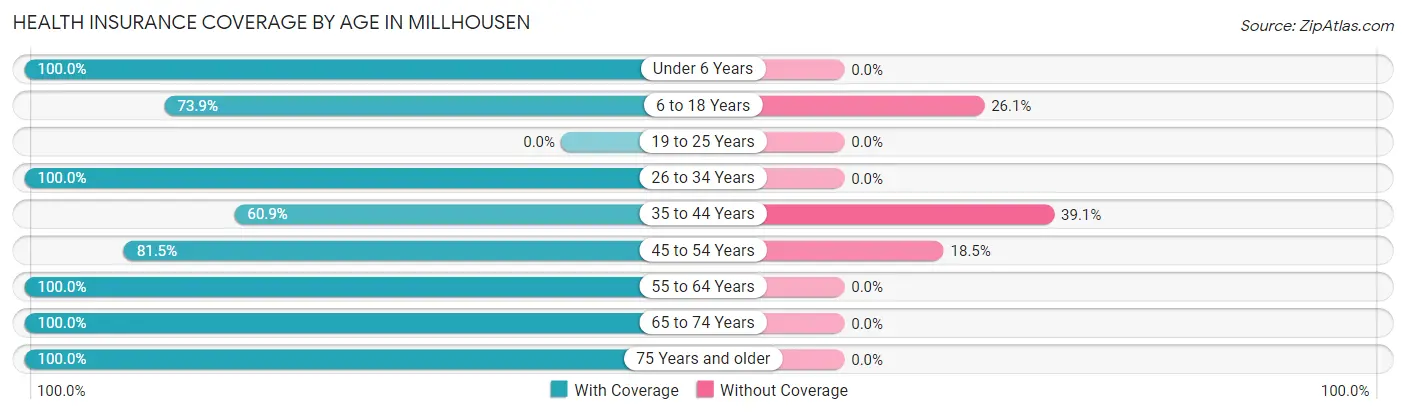
| Age Bracket | With Coverage | Without Coverage |
| Under 6 Years | 14 (100.0%) | 0 (0.0%) |
| 6 to 18 Years | 17 (73.9%) | 6 (26.1%) |
| 19 to 25 Years | 0 (0.0%) | 0 (0.0%) |
| 26 to 34 Years | 35 (100.0%) | 0 (0.0%) |
| 35 to 44 Years | 28 (60.9%) | 18 (39.1%) |
| 45 to 54 Years | 44 (81.5%) | 10 (18.5%) |
| 55 to 64 Years | 17 (100.0%) | 0 (0.0%) |
| 65 to 74 Years | 71 (100.0%) | 0 (0.0%) |
| 75 Years and older | 7 (100.0%) | 0 (0.0%) |
| Total | 233 (87.3%) | 34 (12.7%) |
Health Insurance Coverage by Citizenship Status in Millhousen
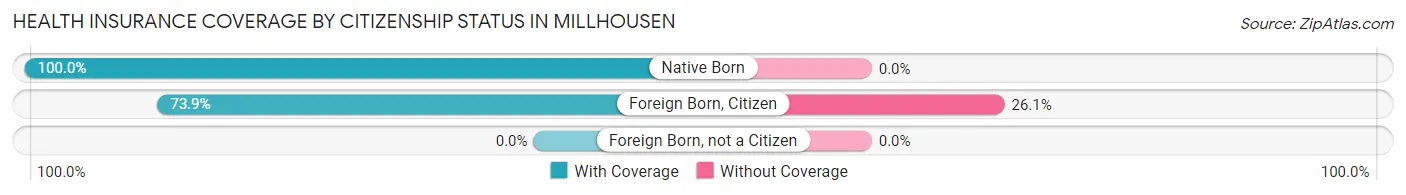
| Citizenship Status | With Coverage | Without Coverage |
| Native Born | 14 (100.0%) | 0 (0.0%) |
| Foreign Born, Citizen | 17 (73.9%) | 6 (26.1%) |
| Foreign Born, not a Citizen | 0 (0.0%) | 0 (0.0%) |
Health Insurance Coverage by Household Income in Millhousen
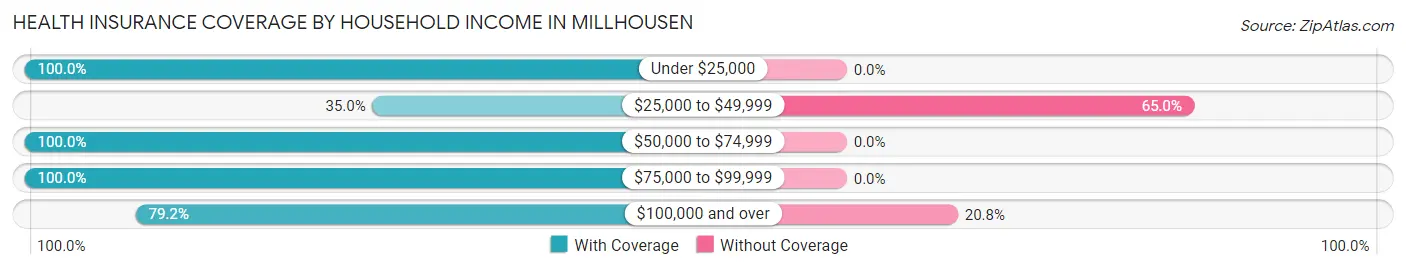
| Household Income | With Coverage | Without Coverage |
| Under $25,000 | 13 (100.0%) | 0 (0.0%) |
| $25,000 to $49,999 | 7 (35.0%) | 13 (65.0%) |
| $50,000 to $74,999 | 82 (100.0%) | 0 (0.0%) |
| $75,000 to $99,999 | 51 (100.0%) | 0 (0.0%) |
| $100,000 and over | 80 (79.2%) | 21 (20.8%) |
Public vs Private Health Insurance Coverage by Age in Millhousen
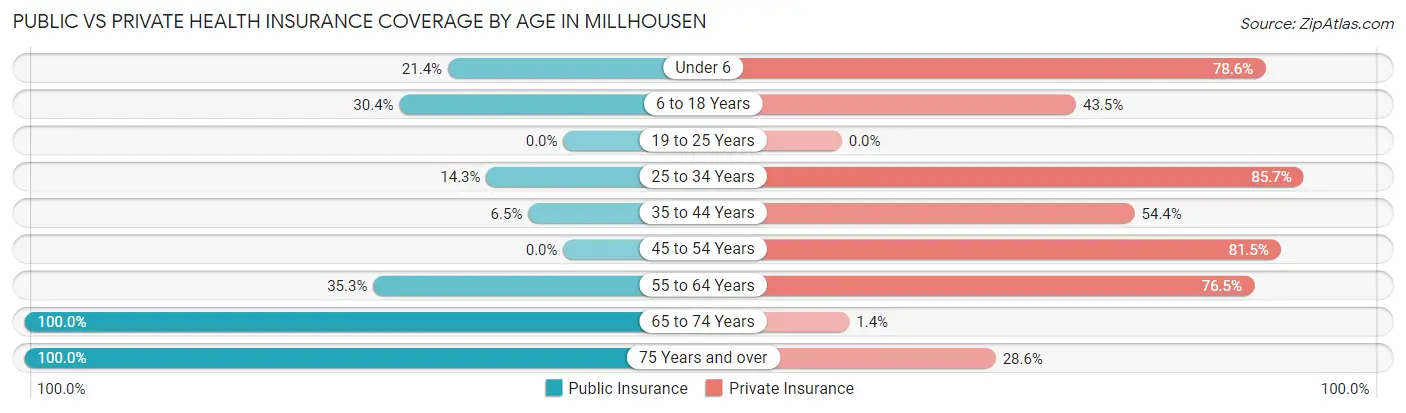
| Age Bracket | Public Insurance | Private Insurance |
| Under 6 | 3 (21.4%) | 11 (78.6%) |
| 6 to 18 Years | 7 (30.4%) | 10 (43.5%) |
| 19 to 25 Years | 0 (0.0%) | 0 (0.0%) |
| 25 to 34 Years | 5 (14.3%) | 30 (85.7%) |
| 35 to 44 Years | 3 (6.5%) | 25 (54.3%) |
| 45 to 54 Years | 0 (0.0%) | 44 (81.5%) |
| 55 to 64 Years | 6 (35.3%) | 13 (76.5%) |
| 65 to 74 Years | 71 (100.0%) | 1 (1.4%) |
| 75 Years and over | 7 (100.0%) | 2 (28.6%) |
| Total | 102 (38.2%) | 136 (50.9%) |
Disability Status by Sex by Age in Millhousen
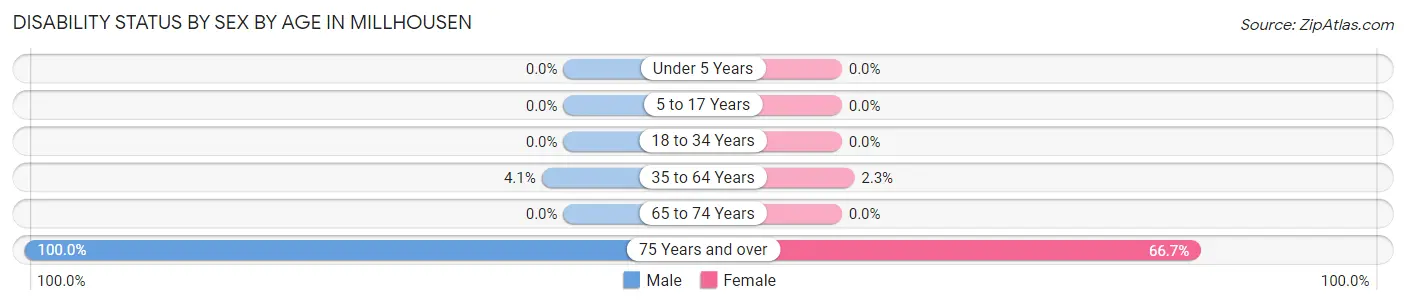
| Age Bracket | Male | Female |
| Under 5 Years | 0 (0.0%) | 0 (0.0%) |
| 5 to 17 Years | 0 (0.0%) | 0 (0.0%) |
| 18 to 34 Years | 0 (0.0%) | 0 (0.0%) |
| 35 to 64 Years | 3 (4.1%) | 1 (2.3%) |
| 65 to 74 Years | 0 (0.0%) | 0 (0.0%) |
| 75 Years and over | 1 (100.0%) | 4 (66.7%) |
Disability Class by Sex by Age in Millhousen
Disability Class: Hearing Difficulty
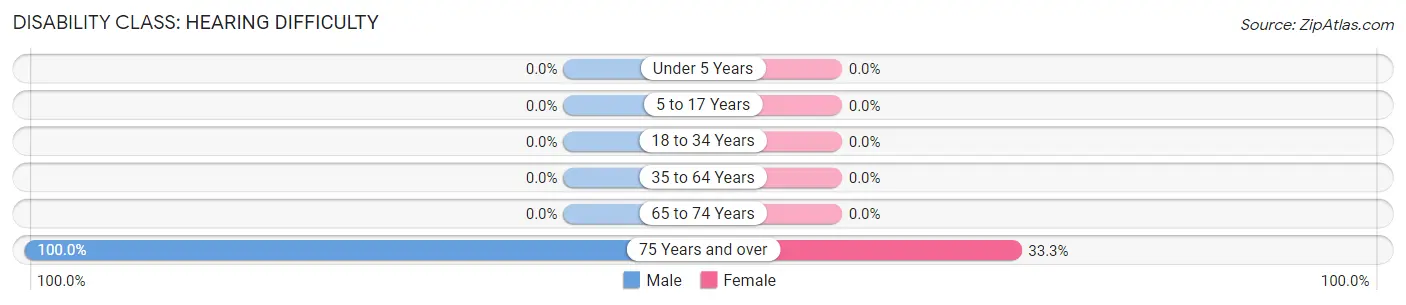
| Age Bracket | Male | Female |
| Under 5 Years | 0 (0.0%) | 0 (0.0%) |
| 5 to 17 Years | 0 (0.0%) | 0 (0.0%) |
| 18 to 34 Years | 0 (0.0%) | 0 (0.0%) |
| 35 to 64 Years | 0 (0.0%) | 0 (0.0%) |
| 65 to 74 Years | 0 (0.0%) | 0 (0.0%) |
| 75 Years and over | 1 (100.0%) | 2 (33.3%) |
Disability Class: Vision Difficulty
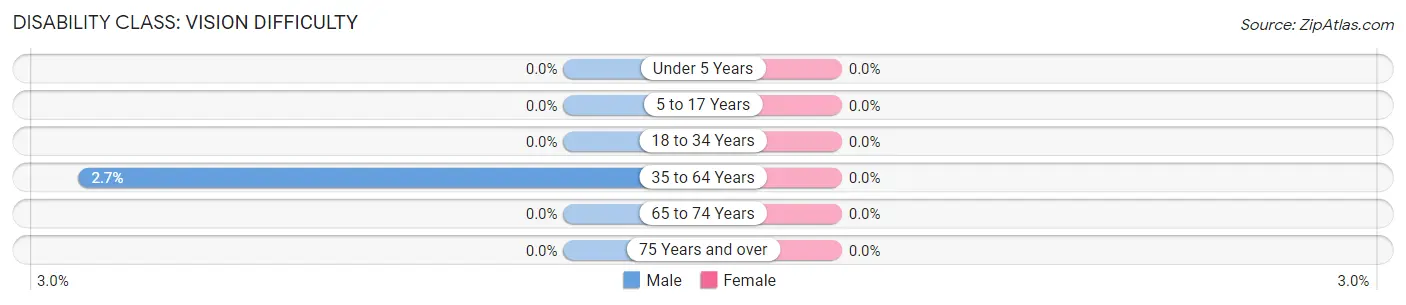
| Age Bracket | Male | Female |
| Under 5 Years | 0 (0.0%) | 0 (0.0%) |
| 5 to 17 Years | 0 (0.0%) | 0 (0.0%) |
| 18 to 34 Years | 0 (0.0%) | 0 (0.0%) |
| 35 to 64 Years | 2 (2.7%) | 0 (0.0%) |
| 65 to 74 Years | 0 (0.0%) | 0 (0.0%) |
| 75 Years and over | 0 (0.0%) | 0 (0.0%) |
Disability Class: Cognitive Difficulty
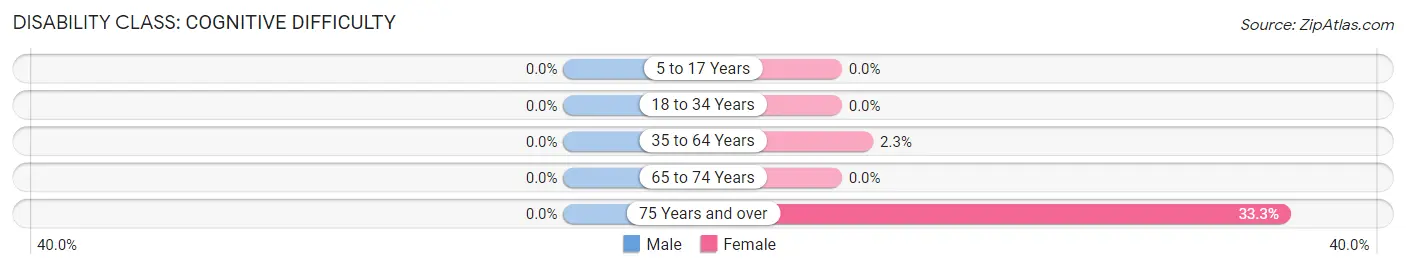
| Age Bracket | Male | Female |
| 5 to 17 Years | 0 (0.0%) | 0 (0.0%) |
| 18 to 34 Years | 0 (0.0%) | 0 (0.0%) |
| 35 to 64 Years | 0 (0.0%) | 1 (2.3%) |
| 65 to 74 Years | 0 (0.0%) | 0 (0.0%) |
| 75 Years and over | 0 (0.0%) | 2 (33.3%) |
Disability Class: Ambulatory Difficulty
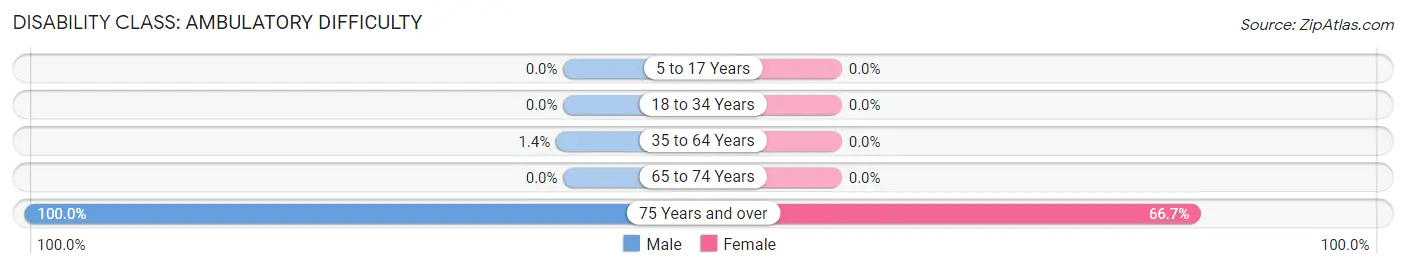
| Age Bracket | Male | Female |
| 5 to 17 Years | 0 (0.0%) | 0 (0.0%) |
| 18 to 34 Years | 0 (0.0%) | 0 (0.0%) |
| 35 to 64 Years | 1 (1.3%) | 0 (0.0%) |
| 65 to 74 Years | 0 (0.0%) | 0 (0.0%) |
| 75 Years and over | 1 (100.0%) | 4 (66.7%) |
Disability Class: Self-Care Difficulty
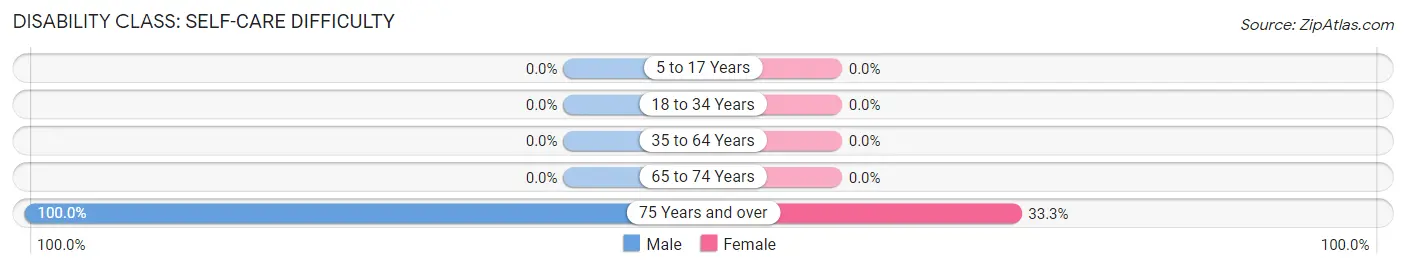
| Age Bracket | Male | Female |
| 5 to 17 Years | 0 (0.0%) | 0 (0.0%) |
| 18 to 34 Years | 0 (0.0%) | 0 (0.0%) |
| 35 to 64 Years | 0 (0.0%) | 0 (0.0%) |
| 65 to 74 Years | 0 (0.0%) | 0 (0.0%) |
| 75 Years and over | 1 (100.0%) | 2 (33.3%) |
Technology Access in Millhousen
Computing Device Access in Millhousen
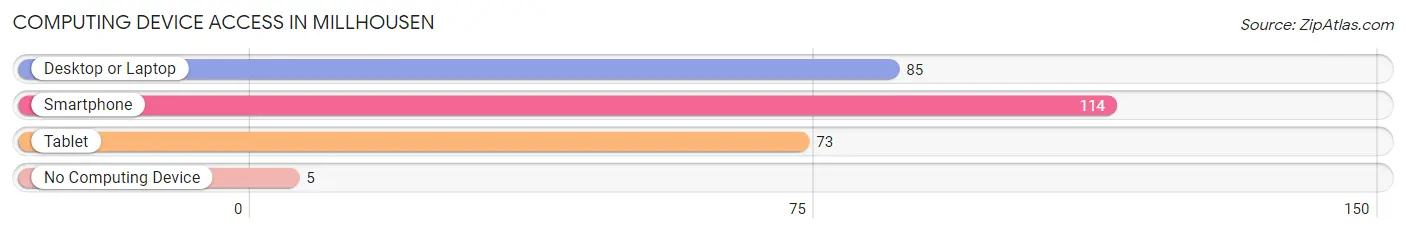
| Device Type | # Households | % Households |
| Desktop or Laptop | 85 | 68.5% |
| Smartphone | 114 | 91.9% |
| Tablet | 73 | 58.9% |
| No Computing Device | 5 | 4.0% |
| Total | 124 | 100.0% |
Internet Access in Millhousen
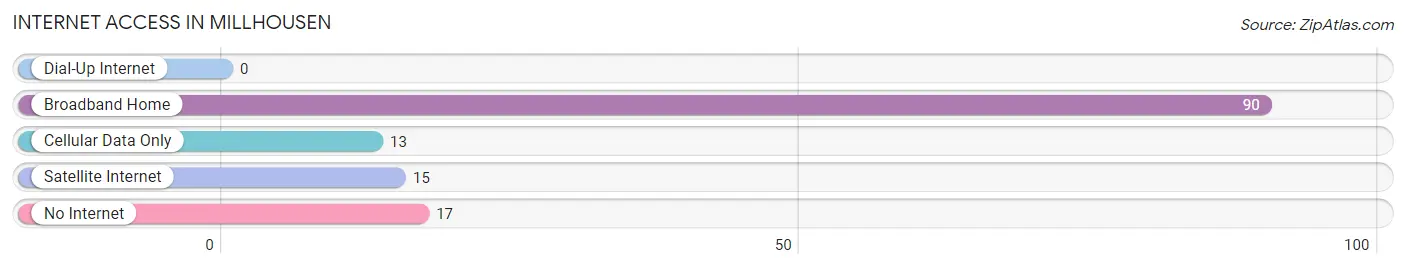
| Internet Type | # Households | % Households |
| Dial-Up Internet | 0 | 0.0% |
| Broadband Home | 90 | 72.6% |
| Cellular Data Only | 13 | 10.5% |
| Satellite Internet | 15 | 12.1% |
| No Internet | 17 | 13.7% |
| Total | 124 | 100.0% |
Millhousen Summary
Millhousen is a small unincorporated community located in Decatur County, Indiana. It is situated in the southeastern part of the state, approximately 40 miles southeast of Indianapolis. The population of Millhousen was estimated to be around 200 people in 2020.
History
Millhousen was founded in 1837 by German immigrants who had settled in the area. The town was named after the Millhousen family, who were among the first settlers. The town was originally a farming community, but it soon developed into a small industrial center. The town was home to several factories, including a flour mill, a sawmill, and a brickyard.
In the late 19th century, Millhousen was a thriving community with a population of over 500 people. The town had several churches, a school, a post office, and a variety of businesses. The town was also home to a number of fraternal organizations, including the Odd Fellows and the Knights of Pythias.
Geography
Millhousen is located in southeastern Indiana, approximately 40 miles southeast of Indianapolis. The town is situated in Decatur County, which is part of the Indianapolis metropolitan area. The town is located on the banks of the White River, which flows through the area. The town is surrounded by rolling hills and farmland.
Economy
Millhousen is a small, rural community with a limited economy. The town is home to a few small businesses, including a grocery store, a hardware store, and a few restaurants. The town is also home to a few small manufacturing companies. The town is served by a few small banks and credit unions.
Demographics
Millhousen is a small, rural community with a population of around 200 people. The town is predominantly white, with a small minority population. The median household income in Millhousen is around $40,000, and the median home value is around $100,000. The town has a low unemployment rate and a low poverty rate.
Conclusion
Millhousen is a small, rural community located in Decatur County, Indiana. The town was founded in 1837 by German immigrants and was originally a farming community. The town has since developed into a small industrial center, and is home to a few small businesses and manufacturing companies. The population of Millhousen is around 200 people, and the town has a median household income of around $40,000.
Common Questions
What is Per Capita Income in Millhousen?
Per Capita income in Millhousen is $39,300.
What is the Median Family Income in Millhousen?
Median Family Income in Millhousen is $80,278.
What is the Median Household income in Millhousen?
Median Household Income in Millhousen is $70,000.
What is Income or Wage Gap in Millhousen?
Income or Wage Gap in Millhousen is 0.6%.
Women in Millhousen earn 99.4 cents for every dollar earned by a man.
What is Inequality or Gini Index in Millhousen?
Inequality or Gini Index in Millhousen is 0.33.
What is the Total Population of Millhousen?
Total Population of Millhousen is 267.
What is the Total Male Population of Millhousen?
Total Male Population of Millhousen is 159.
What is the Total Female Population of Millhousen?
Total Female Population of Millhousen is 108.
What is the Ratio of Males per 100 Females in Millhousen?
There are 147.22 Males per 100 Females in Millhousen.
What is the Ratio of Females per 100 Males in Millhousen?
There are 67.92 Females per 100 Males in Millhousen.
What is the Median Population Age in Millhousen?
Median Population Age in Millhousen is 47.4 Years.
What is the Average Family Size in Millhousen
Average Family Size in Millhousen is 2.5 People.
What is the Average Household Size in Millhousen
Average Household Size in Millhousen is 2.1 People.
How Large is the Labor Force in Millhousen?
There are 133 People in the Labor Forcein in Millhousen.
What is the Percentage of People in the Labor Force in Millhousen?
57.6% of People are in the Labor Force in Millhousen.
What is the Unemployment Rate in Millhousen?
Unemployment Rate in Millhousen is 6.8%.