Zip Codes with the Highest Percentage of Population with a Degree in Engineering in Indianapolis, IN
RELATED REPORTS & OPTIONS
Engineering
Indianapolis
Compare Zip Codes
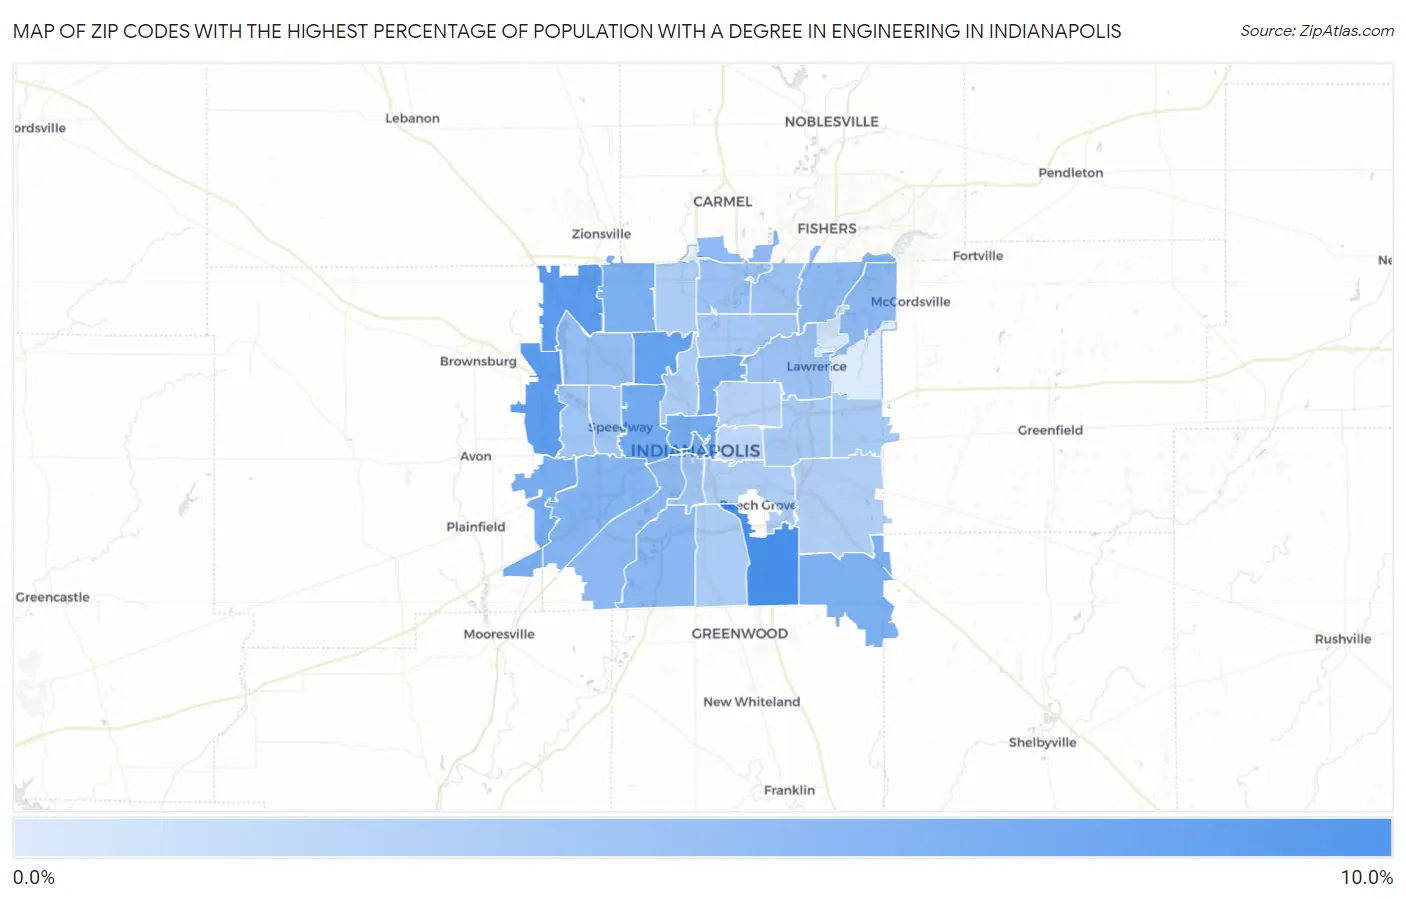
Map of Zip Codes with the Highest Percentage of Population with a Degree in Engineering in Indianapolis
1.1%
9.7%
Zip Codes with the Highest Percentage of Population with a Degree in Engineering in Indianapolis, IN
| Zip Code | % Graduates | vs State | vs National | |
| 1. | 46237 | 9.7% | 6.6%(+3.11)#104 | 7.6%(+2.08)#4,713 |
| 2. | 46278 | 8.5% | 6.6%(+1.92)#128 | 7.6%(+0.894)#6,215 |
| 3. | 46234 | 8.4% | 6.6%(+1.74)#134 | 7.6%(+0.714)#6,483 |
| 4. | 46228 | 8.0% | 6.6%(+1.34)#150 | 7.6%(+0.319)#7,150 |
| 5. | 46222 | 7.1% | 6.6%(+0.431)#187 | 7.6%(-0.594)#8,877 |
| 6. | 46204 | 7.0% | 6.6%(+0.351)#192 | 7.6%(-0.673)#9,041 |
| 7. | 46202 | 7.0% | 6.6%(+0.338)#193 | 7.6%(-0.687)#9,082 |
| 8. | 46231 | 6.8% | 6.6%(+0.175)#201 | 7.6%(-0.849)#9,402 |
| 9. | 46205 | 6.8% | 6.6%(+0.157)#202 | 7.6%(-0.868)#9,437 |
| 10. | 46259 | 6.6% | 6.6%(-0.016)#213 | 7.6%(-1.04)#9,811 |
| 11. | 46268 | 6.5% | 6.6%(-0.092)#217 | 7.6%(-1.12)#9,945 |
| 12. | 46241 | 6.2% | 6.6%(-0.430)#235 | 7.6%(-1.46)#10,727 |
| 13. | 46217 | 5.8% | 6.6%(-0.793)#253 | 7.6%(-1.82)#11,614 |
| 14. | 46221 | 5.7% | 6.6%(-0.944)#261 | 7.6%(-1.97)#11,999 |
| 15. | 46236 | 5.6% | 6.6%(-1.04)#266 | 7.6%(-2.06)#12,242 |
| 16. | 46280 | 5.6% | 6.6%(-1.06)#268 | 7.6%(-2.08)#12,278 |
| 17. | 46256 | 5.5% | 6.6%(-1.14)#275 | 7.6%(-2.16)#12,482 |
| 18. | 46254 | 5.3% | 6.6%(-1.35)#286 | 7.6%(-2.37)#13,017 |
| 19. | 46240 | 4.9% | 6.6%(-1.76)#310 | 7.6%(-2.79)#14,090 |
| 20. | 46226 | 4.8% | 6.6%(-1.79)#313 | 7.6%(-2.81)#14,172 |
| 21. | 46250 | 4.7% | 6.6%(-1.91)#320 | 7.6%(-2.93)#14,480 |
| 22. | 46214 | 4.6% | 6.6%(-2.05)#327 | 7.6%(-3.08)#14,871 |
| 23. | 46224 | 4.5% | 6.6%(-2.14)#333 | 7.6%(-3.16)#15,089 |
| 24. | 46225 | 4.4% | 6.6%(-2.20)#337 | 7.6%(-3.22)#15,260 |
| 25. | 46220 | 4.2% | 6.6%(-2.44)#352 | 7.6%(-3.46)#15,845 |
| 26. | 46219 | 4.0% | 6.6%(-2.61)#365 | 7.6%(-3.63)#16,304 |
| 27. | 46229 | 4.0% | 6.6%(-2.62)#367 | 7.6%(-3.65)#16,339 |
| 28. | 46227 | 3.9% | 6.6%(-2.74)#373 | 7.6%(-3.77)#16,673 |
| 29. | 46203 | 3.8% | 6.6%(-2.79)#378 | 7.6%(-3.81)#16,813 |
| 30. | 46208 | 3.8% | 6.6%(-2.84)#383 | 7.6%(-3.86)#16,937 |
| 31. | 46260 | 3.7% | 6.6%(-2.91)#385 | 7.6%(-3.93)#17,112 |
| 32. | 46239 | 3.6% | 6.6%(-3.03)#389 | 7.6%(-4.05)#17,413 |
| 33. | 46218 | 3.3% | 6.6%(-3.28)#410 | 7.6%(-4.30)#18,041 |
| 34. | 46201 | 2.8% | 6.6%(-3.86)#451 | 7.6%(-4.88)#19,378 |
| 35. | 46216 | 1.5% | 6.6%(-5.16)#502 | 7.6%(-6.18)#21,889 |
| 36. | 46235 | 1.1% | 6.6%(-5.57)#521 | 7.6%(-6.60)#22,548 |
1
Common Questions
What are the Top 10 Zip Codes with the Highest Percentage of Population with a Degree in Engineering in Indianapolis, IN?
Top 10 Zip Codes with the Highest Percentage of Population with a Degree in Engineering in Indianapolis, IN are:
What zip code has the Highest Percentage of Population with a Degree in Engineering in Indianapolis, IN?
46237 has the Highest Percentage of Population with a Degree in Engineering in Indianapolis, IN with 9.7%.
What is the Percentage of Population with a Degree in Engineering in Indianapolis, IN?
Percentage of Population with a Degree in Engineering in Indianapolis is 5.4%.
What is the Percentage of Population with a Degree in Engineering in Indiana?
Percentage of Population with a Degree in Engineering in Indiana is 6.6%.
What is the Percentage of Population with a Degree in Engineering in the United States?
Percentage of Population with a Degree in Engineering in the United States is 7.6%.