Zip Codes with the Highest Percentage of Population Employed in Administrative & Support Services in Fishers, IN
RELATED REPORTS & OPTIONS
Administrative & Support Services
Fishers
Compare Zip Codes
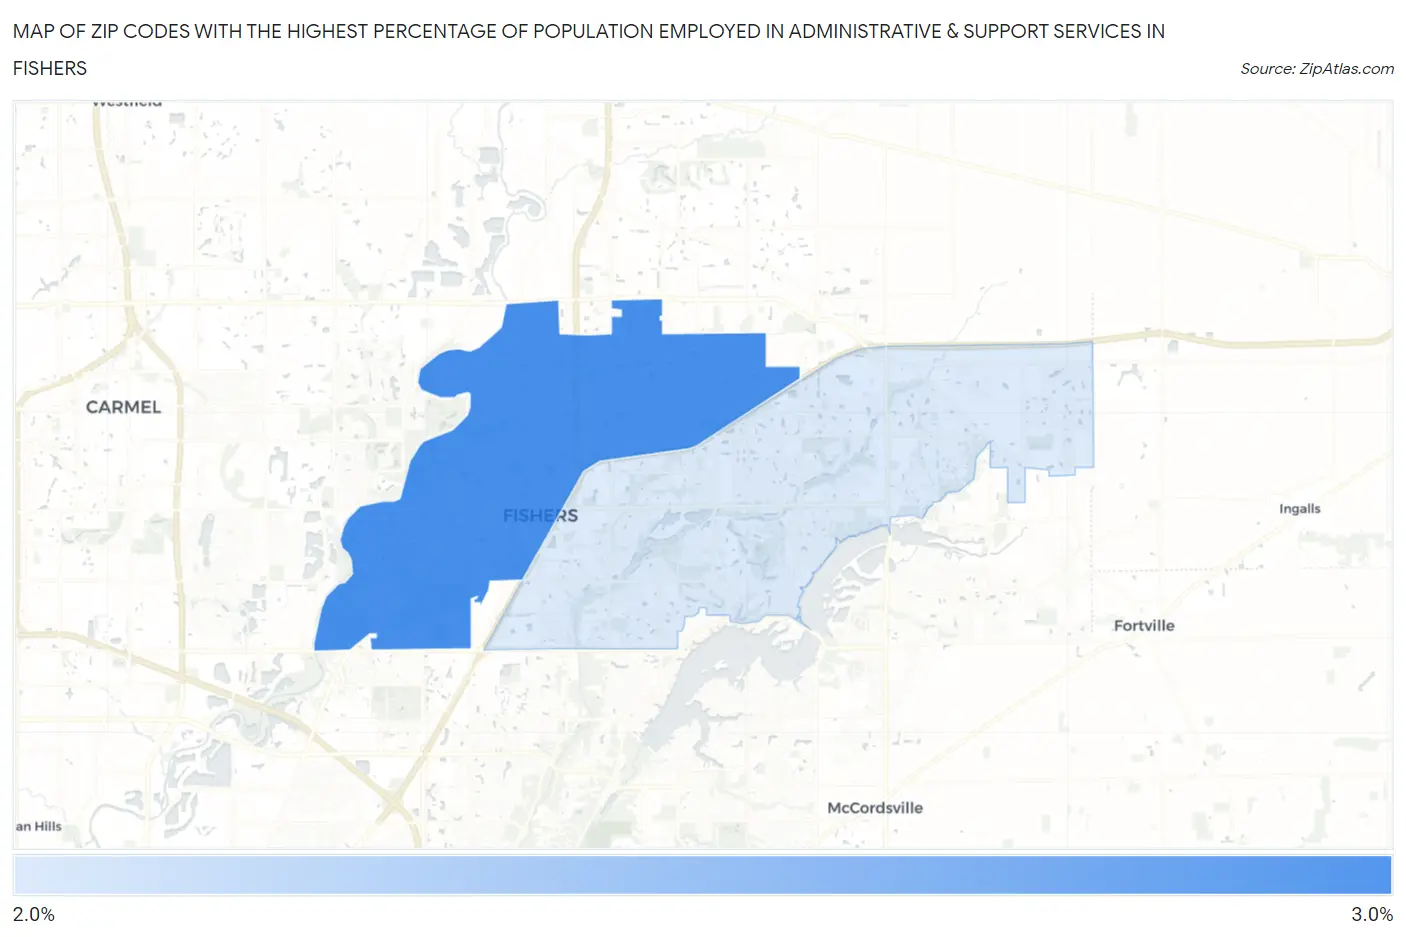
Map of Zip Codes with the Highest Percentage of Population Employed in Administrative & Support Services in Fishers
2.1%
3.0%
Zip Codes with the Highest Percentage of Population Employed in Administrative & Support Services in Fishers, IN
| Zip Code | % Employed | vs State | vs National | |
| 1. | 46038 | 3.0% | 3.5%(-0.557)#362 | 4.1%(-1.18)#15,617 |
| 2. | 46037 | 2.1% | 3.5%(-1.42)#479 | 4.1%(-2.04)#20,090 |
1
Common Questions
What are the Top Zip Codes with the Highest Percentage of Population Employed in Administrative & Support Services in Fishers, IN?
Top Zip Codes with the Highest Percentage of Population Employed in Administrative & Support Services in Fishers, IN are:
What zip code has the Highest Percentage of Population Employed in Administrative & Support Services in Fishers, IN?
46038 has the Highest Percentage of Population Employed in Administrative & Support Services in Fishers, IN with 3.0%.
What is the Percentage of Population Employed in Administrative & Support Services in Fishers, IN?
Percentage of Population Employed in Administrative & Support Services in Fishers is 3.0%.
What is the Percentage of Population Employed in Administrative & Support Services in Indiana?
Percentage of Population Employed in Administrative & Support Services in Indiana is 3.5%.
What is the Percentage of Population Employed in Administrative & Support Services in the United States?
Percentage of Population Employed in Administrative & Support Services in the United States is 4.1%.