Zip Codes with the Highest Percentage of Population Employed in Administrative & Support Services in Hammond, IN
RELATED REPORTS & OPTIONS
Administrative & Support Services
Hammond
Compare Zip Codes
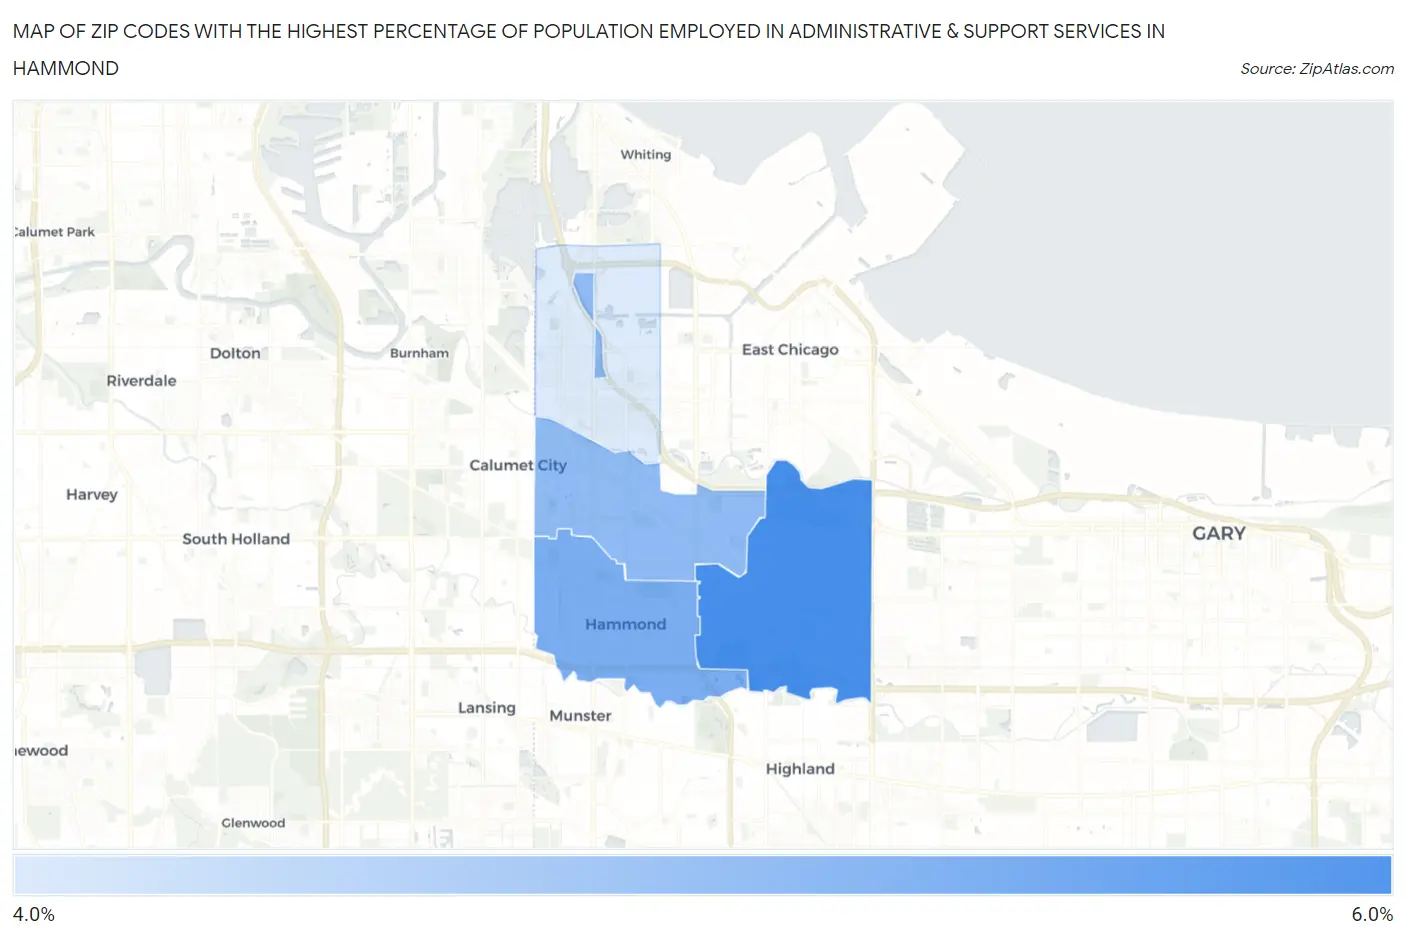
Map of Zip Codes with the Highest Percentage of Population Employed in Administrative & Support Services in Hammond
4.4%
5.9%
Zip Codes with the Highest Percentage of Population Employed in Administrative & Support Services in Hammond, IN
| Zip Code | % Employed | vs State | vs National | |
| 1. | 46323 | 5.9% | 3.5%(+2.41)#97 | 4.1%(+1.78)#4,907 |
| 2. | 46324 | 5.4% | 3.5%(+1.88)#117 | 4.1%(+1.26)#6,043 |
| 3. | 46320 | 5.2% | 3.5%(+1.65)#135 | 4.1%(+1.03)#6,649 |
| 4. | 46327 | 4.4% | 3.5%(+0.836)#207 | 4.1%(+0.215)#9,219 |
1
Common Questions
What are the Top 3 Zip Codes with the Highest Percentage of Population Employed in Administrative & Support Services in Hammond, IN?
Top 3 Zip Codes with the Highest Percentage of Population Employed in Administrative & Support Services in Hammond, IN are:
What zip code has the Highest Percentage of Population Employed in Administrative & Support Services in Hammond, IN?
46323 has the Highest Percentage of Population Employed in Administrative & Support Services in Hammond, IN with 5.9%.
What is the Percentage of Population Employed in Administrative & Support Services in Hammond, IN?
Percentage of Population Employed in Administrative & Support Services in Hammond is 5.3%.
What is the Percentage of Population Employed in Administrative & Support Services in Indiana?
Percentage of Population Employed in Administrative & Support Services in Indiana is 3.5%.
What is the Percentage of Population Employed in Administrative & Support Services in the United States?
Percentage of Population Employed in Administrative & Support Services in the United States is 4.1%.