Zip Codes with the Highest Percentage of Population Employed in Administrative & Support Services in Indianapolis, IN
RELATED REPORTS & OPTIONS
Administrative & Support Services
Indianapolis
Compare Zip Codes
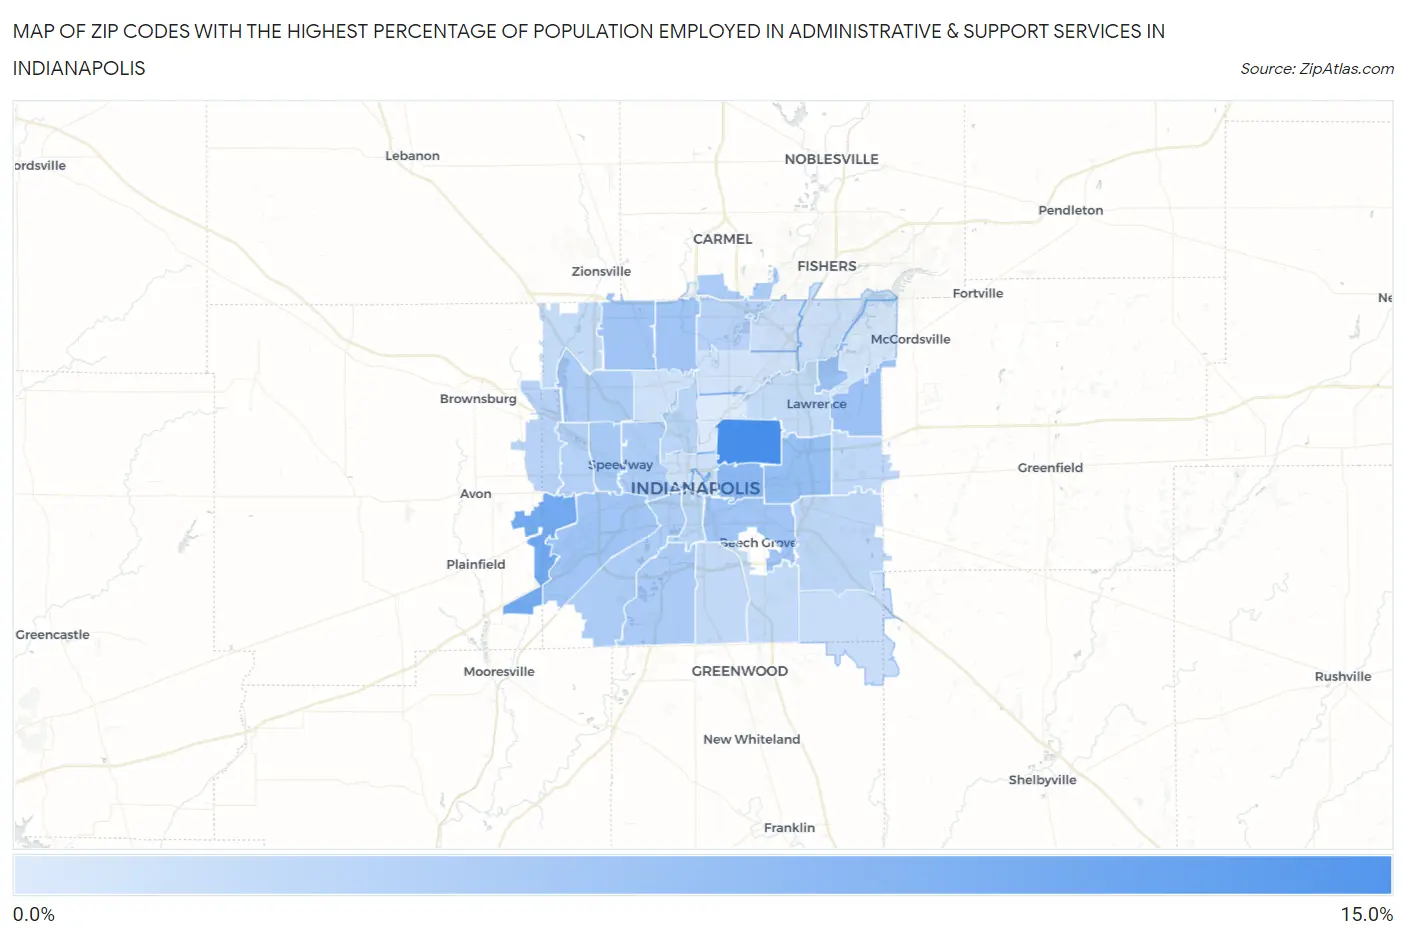
Map of Zip Codes with the Highest Percentage of Population Employed in Administrative & Support Services in Indianapolis
2.5%
11.5%
Zip Codes with the Highest Percentage of Population Employed in Administrative & Support Services in Indianapolis, IN
| Zip Code | % Employed | vs State | vs National | |
| 1. | 46218 | 11.5% | 3.5%(+7.94)#13 | 4.1%(+7.32)#926 |
| 2. | 46231 | 8.7% | 3.5%(+5.21)#30 | 4.1%(+4.59)#1,826 |
| 3. | 46201 | 7.4% | 3.5%(+3.90)#49 | 4.1%(+3.28)#2,754 |
| 4. | 46219 | 6.7% | 3.5%(+3.14)#63 | 4.1%(+2.52)#3,669 |
| 5. | 46216 | 6.5% | 3.5%(+2.94)#71 | 4.1%(+2.32)#3,958 |
| 6. | 46235 | 6.5% | 3.5%(+2.94)#72 | 4.1%(+2.32)#3,959 |
| 7. | 46241 | 6.1% | 3.5%(+2.52)#85 | 4.1%(+1.90)#4,681 |
| 8. | 46268 | 6.1% | 3.5%(+2.52)#86 | 4.1%(+1.90)#4,685 |
| 9. | 46260 | 6.0% | 3.5%(+2.43)#92 | 4.1%(+1.80)#4,866 |
| 10. | 46203 | 5.9% | 3.5%(+2.41)#96 | 4.1%(+1.79)#4,902 |
| 11. | 46224 | 5.5% | 3.5%(+2.00)#108 | 4.1%(+1.38)#5,761 |
| 12. | 46280 | 5.5% | 3.5%(+1.98)#112 | 4.1%(+1.36)#5,821 |
| 13. | 46217 | 5.4% | 3.5%(+1.85)#121 | 4.1%(+1.23)#6,122 |
| 14. | 46222 | 5.3% | 3.5%(+1.80)#124 | 4.1%(+1.18)#6,270 |
| 15. | 46221 | 5.3% | 3.5%(+1.78)#125 | 4.1%(+1.16)#6,305 |
| 16. | 46254 | 5.3% | 3.5%(+1.77)#126 | 4.1%(+1.15)#6,331 |
| 17. | 46214 | 4.8% | 3.5%(+1.31)#153 | 4.1%(+0.684)#7,611 |
| 18. | 46240 | 4.6% | 3.5%(+1.11)#172 | 4.1%(+0.493)#8,219 |
| 19. | 46234 | 4.6% | 3.5%(+1.10)#175 | 4.1%(+0.476)#8,276 |
| 20. | 46225 | 4.5% | 3.5%(+1.01)#184 | 4.1%(+0.392)#8,584 |
| 21. | 46208 | 4.5% | 3.5%(+0.990)#186 | 4.1%(+0.369)#8,661 |
| 22. | 46239 | 4.4% | 3.5%(+0.883)#200 | 4.1%(+0.262)#9,026 |
| 23. | 46229 | 4.2% | 3.5%(+0.707)#214 | 4.1%(+0.086)#9,678 |
| 24. | 46227 | 4.1% | 3.5%(+0.546)#230 | 4.1%(-0.075)#10,358 |
| 25. | 46226 | 4.0% | 3.5%(+0.485)#234 | 4.1%(-0.135)#10,632 |
| 26. | 46278 | 3.9% | 3.5%(+0.418)#242 | 4.1%(-0.203)#10,910 |
| 27. | 46237 | 3.9% | 3.5%(+0.408)#243 | 4.1%(-0.212)#10,940 |
| 28. | 46259 | 3.7% | 3.5%(+0.183)#266 | 4.1%(-0.438)#11,936 |
| 29. | 46250 | 3.6% | 3.5%(+0.047)#287 | 4.1%(-0.574)#12,582 |
| 30. | 46256 | 3.4% | 3.5%(-0.172)#311 | 4.1%(-0.793)#13,659 |
| 31. | 46202 | 3.3% | 3.5%(-0.264)#319 | 4.1%(-0.885)#14,127 |
| 32. | 46228 | 3.3% | 3.5%(-0.268)#321 | 4.1%(-0.889)#14,151 |
| 33. | 46220 | 3.1% | 3.5%(-0.440)#346 | 4.1%(-1.06)#15,044 |
| 34. | 46236 | 3.0% | 3.5%(-0.480)#352 | 4.1%(-1.10)#15,245 |
| 35. | 46204 | 2.8% | 3.5%(-0.763)#392 | 4.1%(-1.38)#16,745 |
| 36. | 46205 | 2.5% | 3.5%(-1.04)#421 | 4.1%(-1.67)#18,219 |
1
Common Questions
What are the Top 10 Zip Codes with the Highest Percentage of Population Employed in Administrative & Support Services in Indianapolis, IN?
Top 10 Zip Codes with the Highest Percentage of Population Employed in Administrative & Support Services in Indianapolis, IN are:
What zip code has the Highest Percentage of Population Employed in Administrative & Support Services in Indianapolis, IN?
46218 has the Highest Percentage of Population Employed in Administrative & Support Services in Indianapolis, IN with 11.5%.
What is the Percentage of Population Employed in Administrative & Support Services in Indianapolis, IN?
Percentage of Population Employed in Administrative & Support Services in Indianapolis is 5.0%.
What is the Percentage of Population Employed in Administrative & Support Services in Indiana?
Percentage of Population Employed in Administrative & Support Services in Indiana is 3.5%.
What is the Percentage of Population Employed in Administrative & Support Services in the United States?
Percentage of Population Employed in Administrative & Support Services in the United States is 4.1%.