Kauai County, HI Map & Demographics
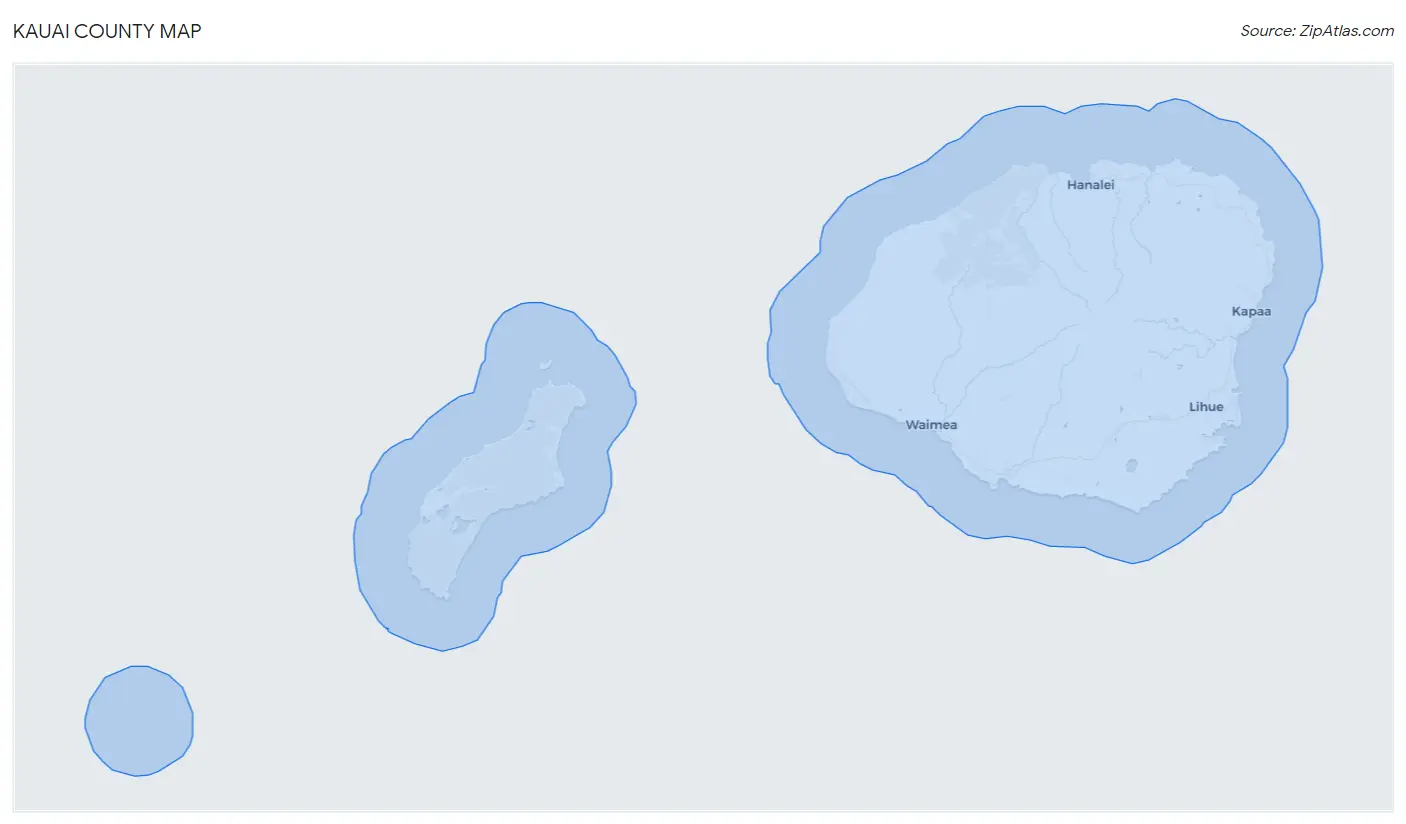
Kauai County Map
Kauai County Overview
$39,372
PER CAPITA INCOME
$102,083
AVG FAMILY INCOME
$88,869
AVG HOUSEHOLD INCOME
26.4%
WAGE / INCOME GAP [ % ]
73.6¢/ $1
WAGE / INCOME GAP [ $ ]
$10,784
FAMILY INCOME DEFICIT
0.44
INEQUALITY / GINI INDEX
73,511
TOTAL POPULATION
36,809
MALE POPULATION
36,702
FEMALE POPULATION
100.29
MALES / 100 FEMALES
99.71
FEMALES / 100 MALES
42.3
MEDIAN AGE
3.7
AVG FAMILY SIZE
3.2
AVG HOUSEHOLD SIZE
37,439
LABOR FORCE [ PEOPLE ]
63.3%
PERCENT IN LABOR FORCE
4.1%
UNEMPLOYMENT RATE
Kauai County Area Codes
Income in Kauai County
Income Overview in Kauai County
Per Capita Income in Kauai County is $39,372, while median incomes of families and households are $102,083 and $88,869 respectively.
| Characteristic | Number | Measure |
| Per Capita Income | 73,511 | $39,372 |
| Median Family Income | 16,224 | $102,083 |
| Mean Family Income | 16,224 | $125,649 |
| Median Household Income | 22,978 | $88,869 |
| Mean Household Income | 22,978 | $115,181 |
| Income Deficit | 16,224 | $10,784 |
| Wage / Income Gap (%) | 73,511 | 26.43% |
| Wage / Income Gap ($) | 73,511 | 73.57¢ per $1 |
| Gini / Inequality Index | 73,511 | 0.44 |
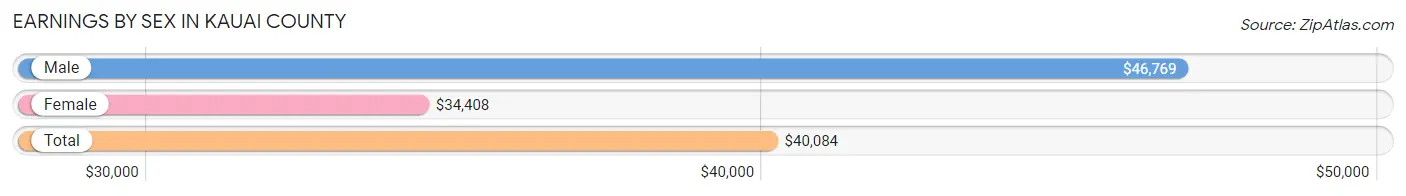
Earnings by Sex in Kauai County
Average Earnings in Kauai County are $40,084, $46,769 for men and $34,408 for women, a difference of 26.4%.
| Sex | Number | Average Earnings |
| Male | 19,741 (50.6%) | $46,769 |
| Female | 19,269 (49.4%) | $34,408 |
| Total | 39,010 (100.0%) | $40,084 |
Earnings by Sex by Income Bracket in Kauai County
The most common earnings brackets in Kauai County are $100,000+ for men (3,177 | 16.1%) and $55,000 to $64,999 for women (1,805 | 9.4%).
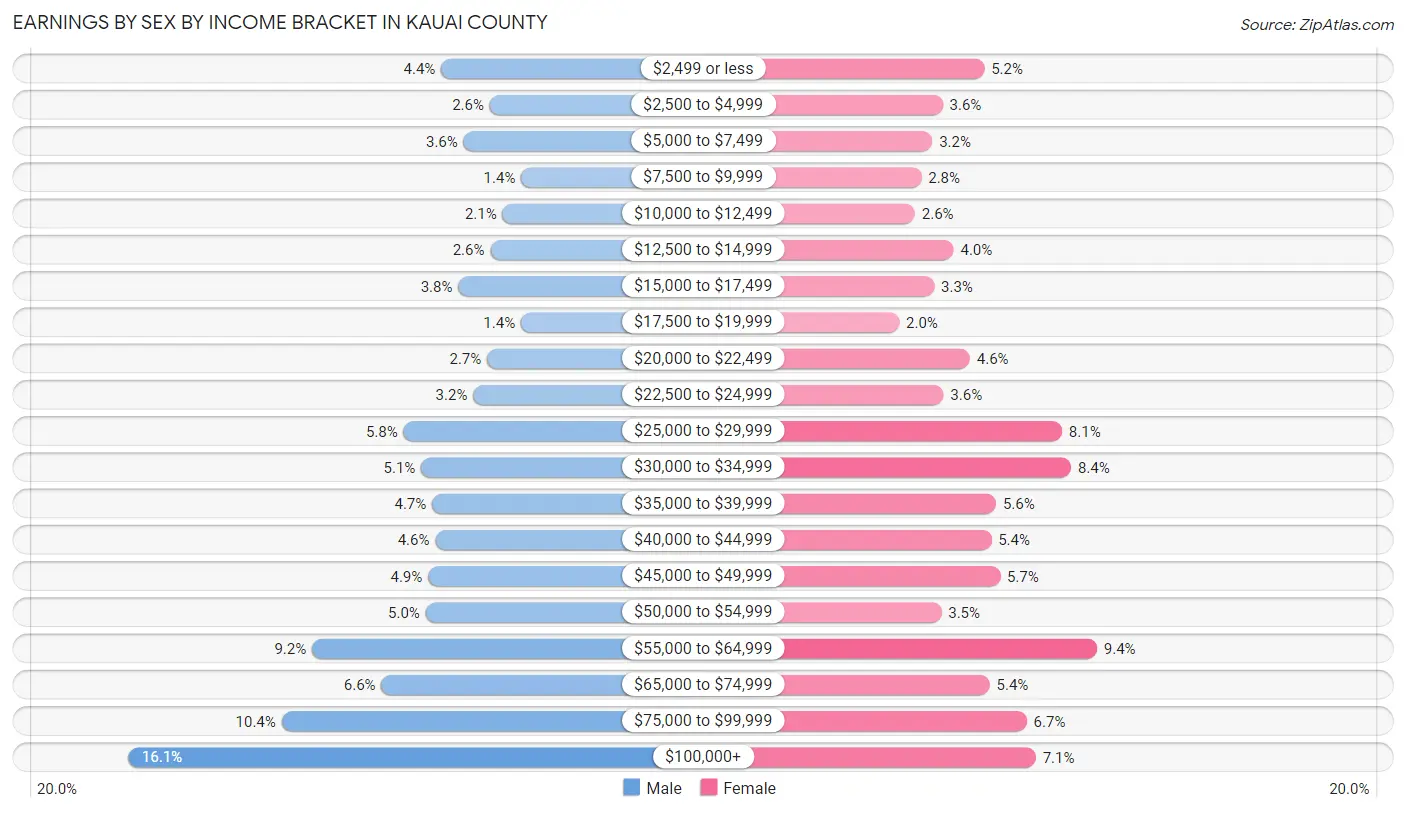
| Income | Male | Female |
| $2,499 or less | 867 (4.4%) | 993 (5.1%) |
| $2,500 to $4,999 | 507 (2.6%) | 691 (3.6%) |
| $5,000 to $7,499 | 700 (3.5%) | 616 (3.2%) |
| $7,500 to $9,999 | 274 (1.4%) | 537 (2.8%) |
| $10,000 to $12,499 | 412 (2.1%) | 491 (2.5%) |
| $12,500 to $14,999 | 503 (2.5%) | 770 (4.0%) |
| $15,000 to $17,499 | 741 (3.7%) | 630 (3.3%) |
| $17,500 to $19,999 | 276 (1.4%) | 377 (2.0%) |
| $20,000 to $22,499 | 527 (2.7%) | 889 (4.6%) |
| $22,500 to $24,999 | 630 (3.2%) | 697 (3.6%) |
| $25,000 to $29,999 | 1,145 (5.8%) | 1,553 (8.1%) |
| $30,000 to $34,999 | 1,015 (5.1%) | 1,618 (8.4%) |
| $35,000 to $39,999 | 934 (4.7%) | 1,077 (5.6%) |
| $40,000 to $44,999 | 910 (4.6%) | 1,043 (5.4%) |
| $45,000 to $49,999 | 963 (4.9%) | 1,106 (5.7%) |
| $50,000 to $54,999 | 982 (5.0%) | 683 (3.5%) |
| $55,000 to $64,999 | 1,822 (9.2%) | 1,805 (9.4%) |
| $65,000 to $74,999 | 1,309 (6.6%) | 1,031 (5.3%) |
| $75,000 to $99,999 | 2,047 (10.4%) | 1,298 (6.7%) |
| $100,000+ | 3,177 (16.1%) | 1,364 (7.1%) |
| Total | 19,741 (100.0%) | 19,269 (100.0%) |
Earnings by Sex by Educational Attainment in Kauai County
Average earnings in Kauai County are $52,027 for men and $37,089 for women, a difference of 28.7%. Men with an educational attainment of graduate degree enjoy the highest average annual earnings of $69,653, while those with less than high school education earn the least with $34,417. Women with an educational attainment of graduate degree earn the most with the average annual earnings of $57,558, while those with high school diploma education have the smallest earnings of $32,516.
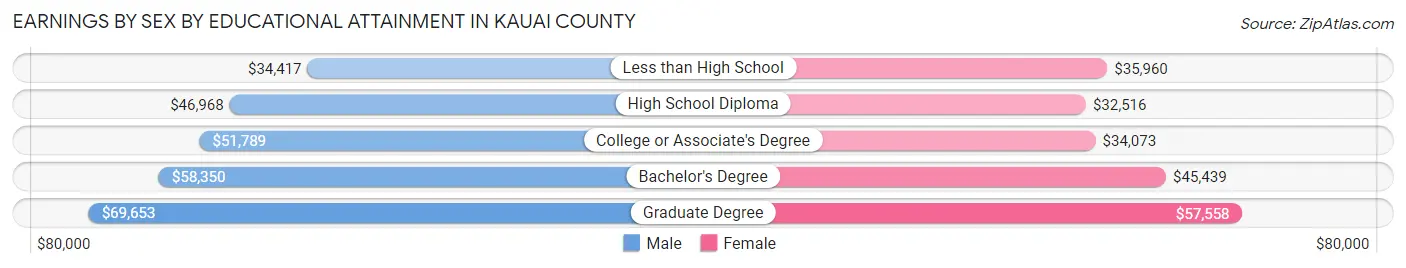
| Educational Attainment | Male Income | Female Income |
| Less than High School | $34,417 | $35,960 |
| High School Diploma | $46,968 | $32,516 |
| College or Associate's Degree | $51,789 | $34,073 |
| Bachelor's Degree | $58,350 | $45,439 |
| Graduate Degree | $69,653 | $57,558 |
| Total | $52,027 | $37,089 |
Family Income in Kauai County
Family Income Brackets in Kauai County
According to the Kauai County family income data, there are 3,991 families falling into the $100,000 to $149,999 income range, which is the most common income bracket and makes up 24.6% of all families. Conversely, the $10,000 to $14,999 income bracket is the least frequent group with only 178 families (1.1%) belonging to this category.
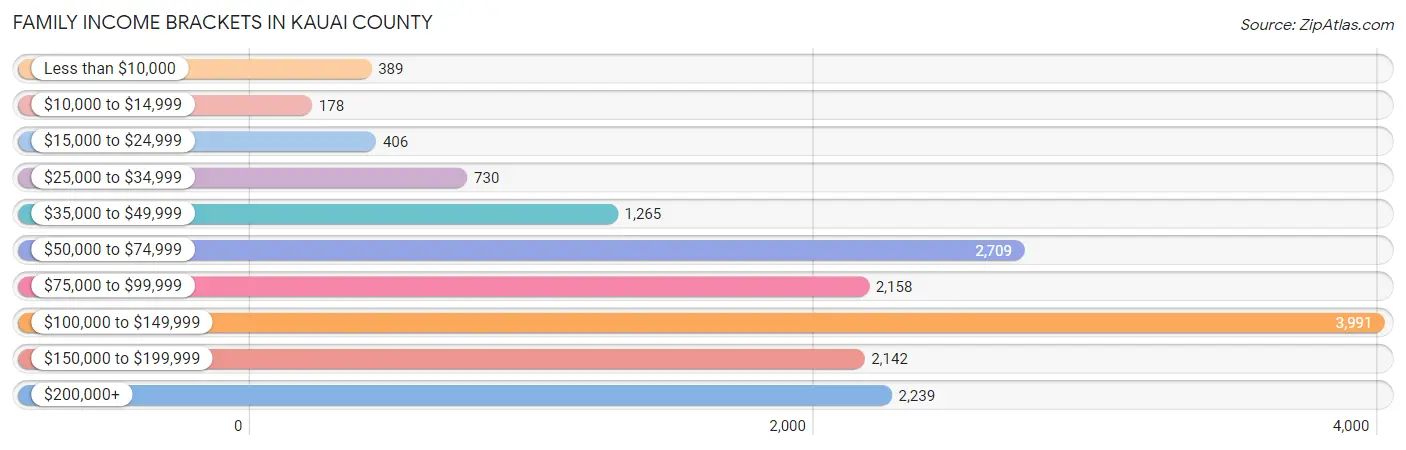
| Income Bracket | # Families | % Families |
| Less than $10,000 | 389 | 2.4% |
| $10,000 to $14,999 | 178 | 1.1% |
| $15,000 to $24,999 | 406 | 2.5% |
| $25,000 to $34,999 | 730 | 4.5% |
| $35,000 to $49,999 | 1,265 | 7.8% |
| $50,000 to $74,999 | 2,709 | 16.7% |
| $75,000 to $99,999 | 2,158 | 13.3% |
| $100,000 to $149,999 | 3,991 | 24.6% |
| $150,000 to $199,999 | 2,142 | 13.2% |
| $200,000+ | 2,239 | 13.8% |
Family Income by Famaliy Size in Kauai County
6-person families (609 | 3.7%) account for the highest median family income in Kauai County with $160,013 per family, while 2-person families (7,823 | 48.2%) have the highest median income of $45,736 per family member.
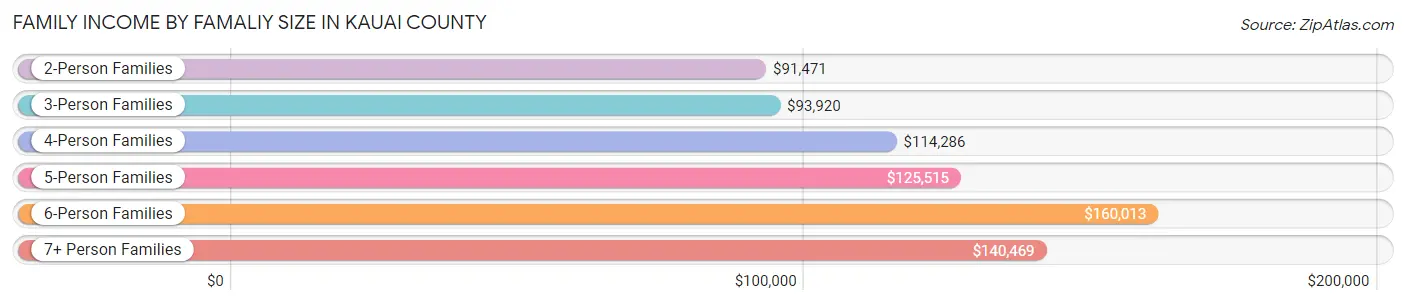
| Income Bracket | # Families | Median Income |
| 2-Person Families | 7,823 (48.2%) | $91,471 |
| 3-Person Families | 3,122 (19.2%) | $93,920 |
| 4-Person Families | 2,532 (15.6%) | $114,286 |
| 5-Person Families | 1,482 (9.1%) | $125,515 |
| 6-Person Families | 609 (3.7%) | $160,013 |
| 7+ Person Families | 656 (4.0%) | $140,469 |
| Total | 16,224 (100.0%) | $102,083 |
Family Income by Number of Earners in Kauai County
The median family income in Kauai County is $102,083, with families comprising 3+ earners (2,532) having the highest median family income of $159,554, while families with no earners (2,462) have the lowest median family income of $72,090, accounting for 15.6% and 15.2% of families, respectively.
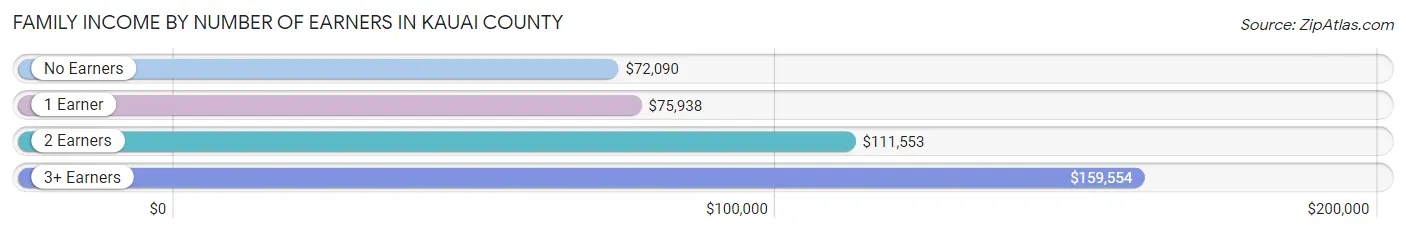
| Number of Earners | # Families | Median Income |
| No Earners | 2,462 (15.2%) | $72,090 |
| 1 Earner | 4,969 (30.6%) | $75,938 |
| 2 Earners | 6,261 (38.6%) | $111,553 |
| 3+ Earners | 2,532 (15.6%) | $159,554 |
| Total | 16,224 (100.0%) | $102,083 |
Household Income in Kauai County
Household Income Brackets in Kauai County
With 4,733 households falling in the category, the $100,000 to $149,999 income range is the most frequent in Kauai County, accounting for 20.6% of all households. In contrast, only 483 households (2.1%) fall into the $10,000 to $14,999 income bracket, making it the least populous group.
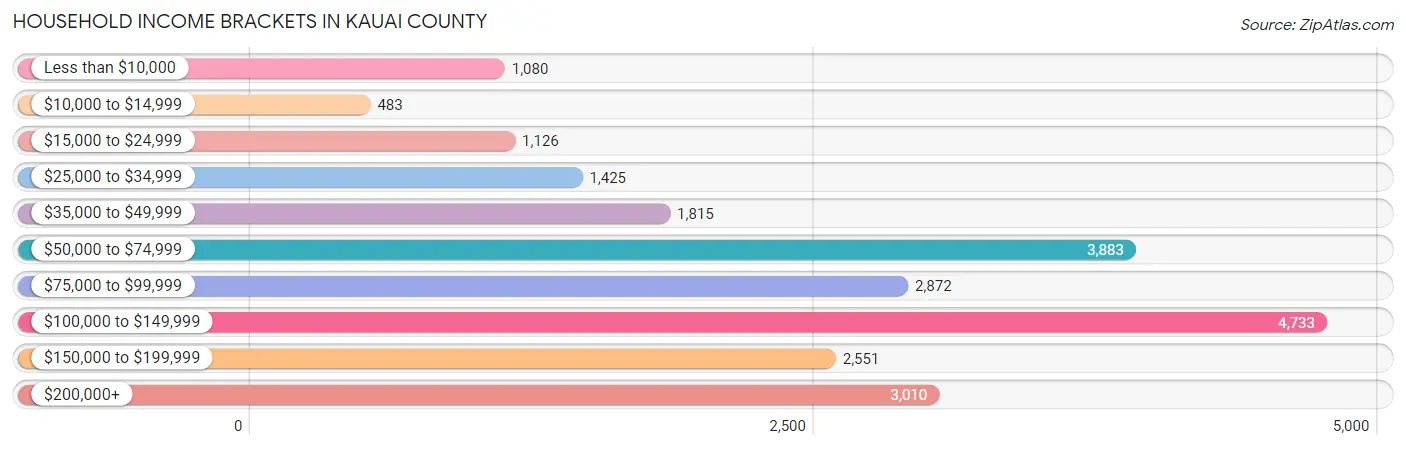
| Income Bracket | # Households | % Households |
| Less than $10,000 | 1,080 | 4.7% |
| $10,000 to $14,999 | 483 | 2.1% |
| $15,000 to $24,999 | 1,126 | 4.9% |
| $25,000 to $34,999 | 1,425 | 6.2% |
| $35,000 to $49,999 | 1,815 | 7.9% |
| $50,000 to $74,999 | 3,883 | 16.9% |
| $75,000 to $99,999 | 2,872 | 12.5% |
| $100,000 to $149,999 | 4,733 | 20.6% |
| $150,000 to $199,999 | 2,551 | 11.1% |
| $200,000+ | 3,010 | 13.1% |
Household Income by Householder Age in Kauai County
The median household income in Kauai County is $88,869, with the highest median household income of $101,735 found in the 45 to 64 years age bracket for the primary householder. A total of 8,875 households (38.6%) fall into this category. Meanwhile, the 15 to 24 years age bracket for the primary householder has the lowest median household income of $36,477, with 199 households (0.9%) in this group.
| Income Bracket | # Households | Median Income |
| 15 to 24 Years | 199 (0.9%) | $36,477 |
| 25 to 44 Years | 5,272 (22.9%) | $97,161 |
| 45 to 64 Years | 8,875 (38.6%) | $101,735 |
| 65+ Years | 8,632 (37.6%) | $73,518 |
| Total | 22,978 (100.0%) | $88,869 |
Poverty in Kauai County
Income Below Poverty by Sex and Age in Kauai County
With 6.9% poverty level for males and 9.7% for females among the residents of Kauai County, 16 and 17 year old males and 12 to 14 year old females are the most vulnerable to poverty, with 141 males (17.9%) and 317 females (21.8%) in their respective age groups living below the poverty level.
| Age Bracket | Male | Female |
| Under 5 Years | 164 (8.0%) | 330 (17.0%) |
| 5 Years | 38 (9.2%) | 36 (13.2%) |
| 6 to 11 Years | 221 (7.3%) | 113 (4.4%) |
| 12 to 14 Years | 97 (7.3%) | 317 (21.8%) |
| 15 Years | 78 (11.8%) | 26 (5.7%) |
| 16 and 17 Years | 141 (17.9%) | 95 (14.6%) |
| 18 to 24 Years | 264 (10.2%) | 305 (12.5%) |
| 25 to 34 Years | 86 (2.0%) | 377 (8.9%) |
| 35 to 44 Years | 264 (5.5%) | 342 (7.4%) |
| 45 to 54 Years | 334 (7.6%) | 325 (7.3%) |
| 55 to 64 Years | 438 (8.8%) | 498 (9.8%) |
| 65 to 74 Years | 221 (4.8%) | 415 (8.9%) |
| 75 Years and over | 168 (6.8%) | 347 (10.1%) |
| Total | 2,514 (6.9%) | 3,526 (9.7%) |
Income Above Poverty by Sex and Age in Kauai County
According to the poverty statistics in Kauai County, males aged 25 to 34 years and females aged 6 to 11 years are the age groups that are most secure financially, with 98.0% of males and 95.6% of females in these age groups living above the poverty line.
| Age Bracket | Male | Female |
| Under 5 Years | 1,893 (92.0%) | 1,617 (83.1%) |
| 5 Years | 375 (90.8%) | 236 (86.8%) |
| 6 to 11 Years | 2,807 (92.7%) | 2,460 (95.6%) |
| 12 to 14 Years | 1,232 (92.7%) | 1,136 (78.2%) |
| 15 Years | 584 (88.2%) | 432 (94.3%) |
| 16 and 17 Years | 646 (82.1%) | 555 (85.4%) |
| 18 to 24 Years | 2,311 (89.7%) | 2,131 (87.5%) |
| 25 to 34 Years | 4,216 (98.0%) | 3,858 (91.1%) |
| 35 to 44 Years | 4,545 (94.5%) | 4,250 (92.5%) |
| 45 to 54 Years | 4,086 (92.4%) | 4,153 (92.7%) |
| 55 to 64 Years | 4,540 (91.2%) | 4,572 (90.2%) |
| 65 to 74 Years | 4,429 (95.3%) | 4,260 (91.1%) |
| 75 Years and over | 2,305 (93.2%) | 3,103 (89.9%) |
| Total | 33,969 (93.1%) | 32,763 (90.3%) |
Income Below Poverty Among Married-Couple Families in Kauai County
The poverty statistics for married-couple families in Kauai County show that 3.2% or 373 of the total 11,769 families live below the poverty line. Families with 5 or more children have the highest poverty rate of 36.6%, comprising of 64 families. On the other hand, families with no children have the lowest poverty rate of 2.3%, which includes 176 families.
| Children | Above Poverty | Below Poverty |
| No Children | 7,566 (97.7%) | 176 (2.3%) |
| 1 or 2 Children | 2,914 (96.3%) | 111 (3.7%) |
| 3 or 4 Children | 805 (97.3%) | 22 (2.7%) |
| 5 or more Children | 111 (63.4%) | 64 (36.6%) |
| Total | 11,396 (96.8%) | 373 (3.2%) |
Income Below Poverty Among Single-Parent Households in Kauai County
According to the poverty data in Kauai County, 13.7% or 211 single-father households and 13.4% or 390 single-mother households are living below the poverty line. Among single-father households, those with 5 or more children have the highest poverty rate, with 5 households (26.3%) experiencing poverty. Likewise, among single-mother households, those with 5 or more children have the highest poverty rate, with 5 households (20.0%) falling below the poverty line.
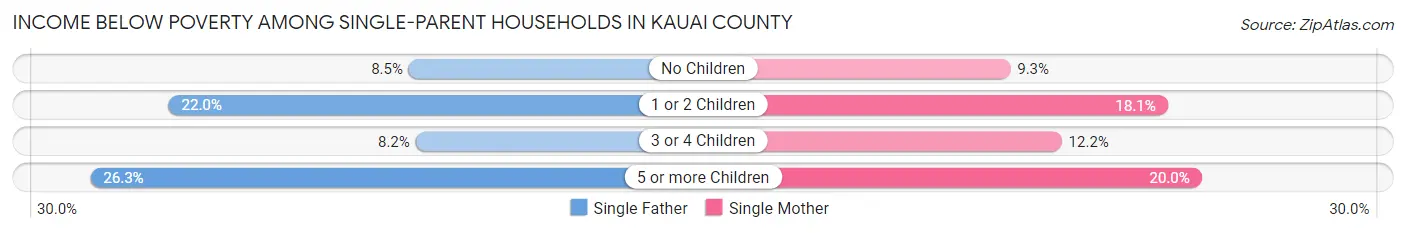
| Children | Single Father | Single Mother |
| No Children | 58 (8.5%) | 119 (9.3%) |
| 1 or 2 Children | 126 (22.0%) | 214 (18.1%) |
| 3 or 4 Children | 22 (8.2%) | 52 (12.2%) |
| 5 or more Children | 5 (26.3%) | 5 (20.0%) |
| Total | 211 (13.7%) | 390 (13.4%) |
Income Below Poverty Among Married-Couple vs Single-Parent Households in Kauai County
The poverty data for Kauai County shows that 373 of the married-couple family households (3.2%) and 601 of the single-parent households (13.5%) are living below the poverty level. Within the married-couple family households, those with 5 or more children have the highest poverty rate, with 64 households (36.6%) falling below the poverty line. Among the single-parent households, those with 5 or more children have the highest poverty rate, with 10 household (22.7%) living below poverty.
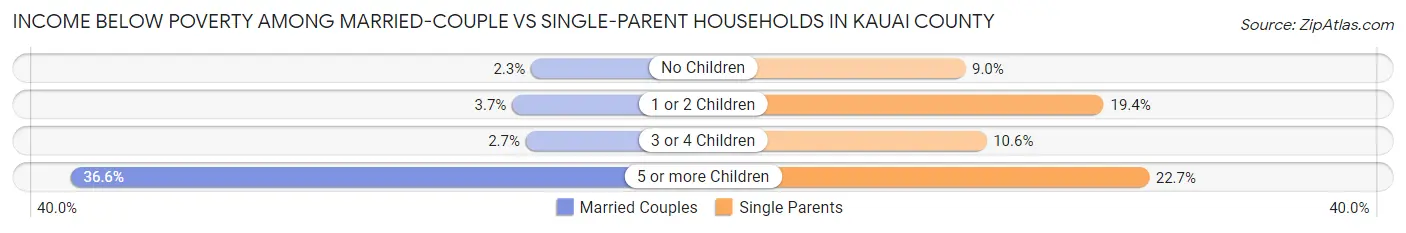
| Children | Married-Couple Families | Single-Parent Households |
| No Children | 176 (2.3%) | 177 (9.0%) |
| 1 or 2 Children | 111 (3.7%) | 340 (19.4%) |
| 3 or 4 Children | 22 (2.7%) | 74 (10.6%) |
| 5 or more Children | 64 (36.6%) | 10 (22.7%) |
| Total | 373 (3.2%) | 601 (13.5%) |
Race in Kauai County
The most populous races in Kauai County are White / Caucasian (22,274 | 30.3%), Asian (21,620 | 29.4%), and Two or more Races (20,880 | 28.4%).
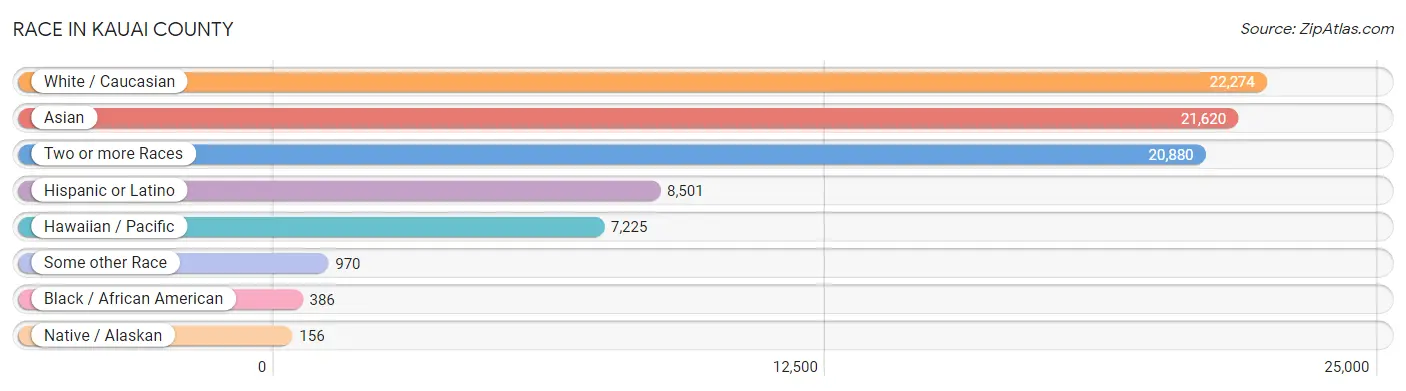
| Race | # Population | % Population |
| Asian | 21,620 | 29.4% |
| Black / African American | 386 | 0.5% |
| Hawaiian / Pacific | 7,225 | 9.8% |
| Hispanic or Latino | 8,501 | 11.6% |
| Native / Alaskan | 156 | 0.2% |
| White / Caucasian | 22,274 | 30.3% |
| Two or more Races | 20,880 | 28.4% |
| Some other Race | 970 | 1.3% |
| Total | 73,511 | 100.0% |
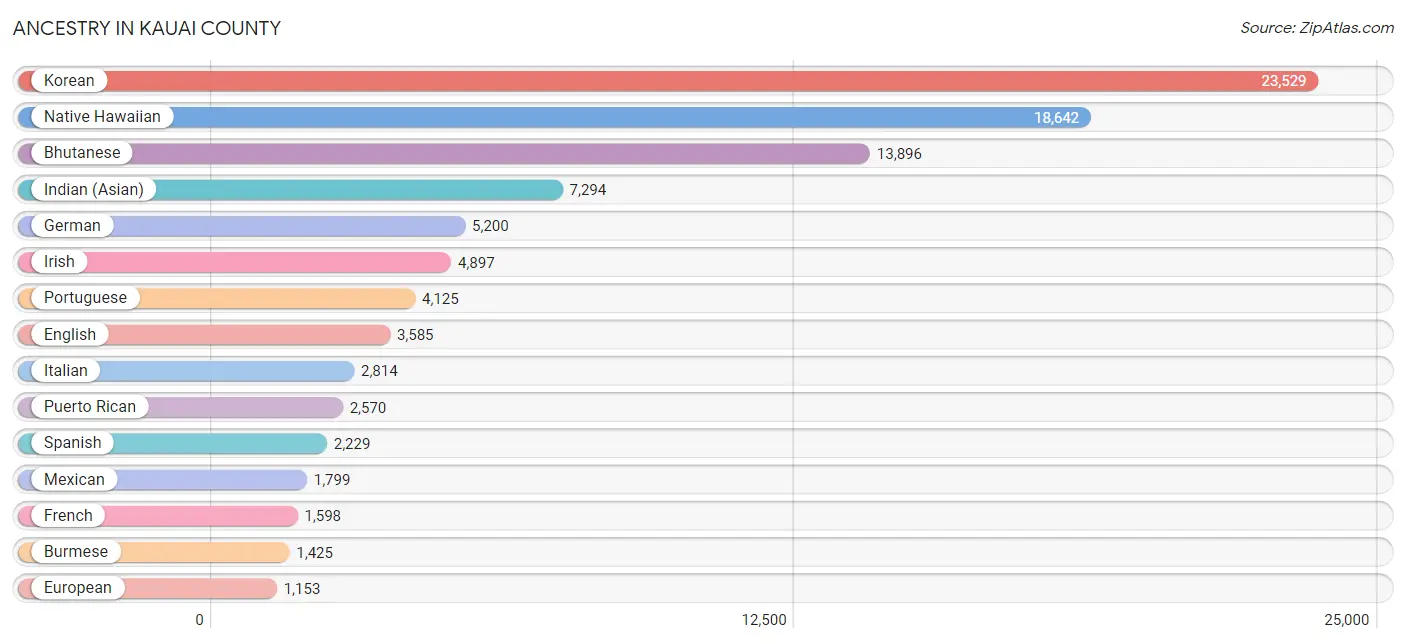
Ancestry in Kauai County
The most populous ancestries reported in Kauai County are Korean (23,529 | 32.0%), Native Hawaiian (18,642 | 25.4%), Bhutanese (13,896 | 18.9%), Indian (Asian) (7,294 | 9.9%), and German (5,200 | 7.1%), together accounting for 93.3% of all Kauai County residents.
| Ancestry | # Population | % Population |
| African | 30 | 0.0% |
| Alaska Native | 16 | 0.0% |
| Alaskan Athabascan | 58 | 0.1% |
| American | 1,118 | 1.5% |
| Apache | 209 | 0.3% |
| Arab | 187 | 0.3% |
| Argentinean | 28 | 0.0% |
| Armenian | 6 | 0.0% |
| Australian | 52 | 0.1% |
| Austrian | 101 | 0.1% |
| Basque | 35 | 0.1% |
| Belgian | 16 | 0.0% |
| Bhutanese | 13,896 | 18.9% |
| Blackfeet | 4 | 0.0% |
| Brazilian | 30 | 0.0% |
| British | 244 | 0.3% |
| British West Indian | 28 | 0.0% |
| Bulgarian | 51 | 0.1% |
| Burmese | 1,425 | 1.9% |
| Canadian | 134 | 0.2% |
| Central American | 389 | 0.5% |
| Central American Indian | 1 | 0.0% |
| Cherokee | 967 | 1.3% |
| Cheyenne | 8 | 0.0% |
| Chilean | 12 | 0.0% |
| Chinese | 208 | 0.3% |
| Chippewa | 47 | 0.1% |
| Choctaw | 36 | 0.1% |
| Colombian | 148 | 0.2% |
| Comanche | 5 | 0.0% |
| Costa Rican | 49 | 0.1% |
| Creek | 2 | 0.0% |
| Croatian | 22 | 0.0% |
| Cuban | 7 | 0.0% |
| Czech | 343 | 0.5% |
| Danish | 180 | 0.2% |
| Dominican | 47 | 0.1% |
| Dutch | 555 | 0.7% |
| Eastern European | 107 | 0.2% |
| Ecuadorian | 23 | 0.0% |
| Egyptian | 7 | 0.0% |
| English | 3,585 | 4.9% |
| Ethiopian | 33 | 0.0% |
| European | 1,153 | 1.6% |
| Fijian | 503 | 0.7% |
| Finnish | 83 | 0.1% |
| French | 1,598 | 2.2% |
| French Canadian | 272 | 0.4% |
| German | 5,200 | 7.1% |
| Greek | 266 | 0.4% |
| Guamanian / Chamorro | 309 | 0.4% |
| Guatemalan | 53 | 0.1% |
| Haitian | 39 | 0.1% |
| Hungarian | 157 | 0.2% |
| Icelander | 116 | 0.2% |
| Indian (Asian) | 7,294 | 9.9% |
| Irish | 4,897 | 6.7% |
| Iroquois | 115 | 0.2% |
| Israeli | 25 | 0.0% |
| Italian | 2,814 | 3.8% |
| Jamaican | 12 | 0.0% |
| Japanese | 15 | 0.0% |
| Korean | 23,529 | 32.0% |
| Laotian | 9 | 0.0% |
| Latvian | 8 | 0.0% |
| Lebanese | 137 | 0.2% |
| Lithuanian | 89 | 0.1% |
| Luxembourger | 10 | 0.0% |
| Macedonian | 42 | 0.1% |
| Marshallese | 45 | 0.1% |
| Menominee | 3 | 0.0% |
| Mexican | 1,799 | 2.5% |
| Mexican American Indian | 54 | 0.1% |
| Mongolian | 12 | 0.0% |
| Native Hawaiian | 18,642 | 25.4% |
| Navajo | 70 | 0.1% |
| Northern European | 88 | 0.1% |
| Norwegian | 666 | 0.9% |
| Pakistani | 95 | 0.1% |
| Palestinian | 29 | 0.0% |
| Peruvian | 177 | 0.2% |
| Pima | 4 | 0.0% |
| Polish | 684 | 0.9% |
| Portuguese | 4,125 | 5.6% |
| Potawatomi | 9 | 0.0% |
| Pueblo | 177 | 0.2% |
| Puerto Rican | 2,570 | 3.5% |
| Romanian | 22 | 0.0% |
| Russian | 299 | 0.4% |
| Salvadoran | 287 | 0.4% |
| Samoan | 325 | 0.4% |
| Scandinavian | 403 | 0.5% |
| Scotch-Irish | 299 | 0.4% |
| Scottish | 747 | 1.0% |
| Seminole | 19 | 0.0% |
| Serbian | 11 | 0.0% |
| Sioux | 169 | 0.2% |
| Slovak | 18 | 0.0% |
| Slovene | 38 | 0.1% |
| South African | 9 | 0.0% |
| South American | 418 | 0.6% |
| South American Indian | 51 | 0.1% |
| Spaniard | 586 | 0.8% |
| Spanish | 2,229 | 3.0% |
| Spanish American | 55 | 0.1% |
| Sri Lankan | 160 | 0.2% |
| Subsaharan African | 138 | 0.2% |
| Swedish | 573 | 0.8% |
| Swiss | 126 | 0.2% |
| Syrian | 10 | 0.0% |
| Thai | 237 | 0.3% |
| Tlingit-Haida | 12 | 0.0% |
| Tongan | 232 | 0.3% |
| Trinidadian and Tobagonian | 6 | 0.0% |
| Ukrainian | 120 | 0.2% |
| Uruguayan | 10 | 0.0% |
| Venezuelan | 20 | 0.0% |
| Welsh | 230 | 0.3% |
| West Indian | 12 | 0.0% |
| Yugoslavian | 50 | 0.1% |
| Yuman | 3 | 0.0% | View All 121 Rows |
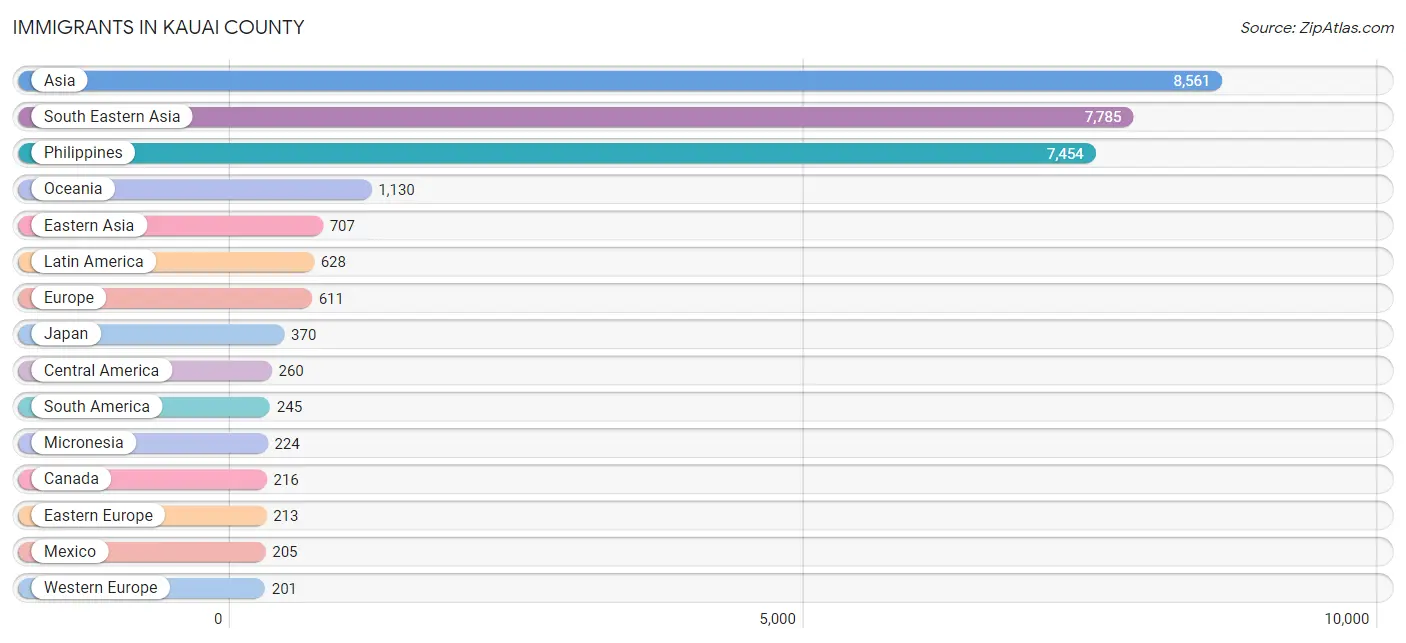
Immigrants in Kauai County
The most numerous immigrant groups reported in Kauai County came from Asia (8,561 | 11.7%), South Eastern Asia (7,785 | 10.6%), Philippines (7,454 | 10.1%), Oceania (1,130 | 1.5%), and Eastern Asia (707 | 1.0%), together accounting for 34.9% of all Kauai County residents.
| Immigration Origin | # Population | % Population |
| Africa | 29 | 0.0% |
| Argentina | 34 | 0.1% |
| Asia | 8,561 | 11.7% |
| Australia | 67 | 0.1% |
| Bosnia and Herzegovina | 40 | 0.1% |
| Brazil | 73 | 0.1% |
| Bulgaria | 11 | 0.0% |
| Cambodia | 15 | 0.0% |
| Canada | 216 | 0.3% |
| Caribbean | 123 | 0.2% |
| Central America | 260 | 0.4% |
| China | 169 | 0.2% |
| Colombia | 52 | 0.1% |
| Costa Rica | 37 | 0.1% |
| Czechoslovakia | 18 | 0.0% |
| Dominican Republic | 59 | 0.1% |
| Eastern Asia | 707 | 1.0% |
| Eastern Europe | 213 | 0.3% |
| Ecuador | 16 | 0.0% |
| El Salvador | 18 | 0.0% |
| England | 20 | 0.0% |
| Europe | 611 | 0.8% |
| Fiji | 4 | 0.0% |
| France | 18 | 0.0% |
| Germany | 59 | 0.1% |
| Haiti | 24 | 0.0% |
| Hong Kong | 57 | 0.1% |
| Hungary | 19 | 0.0% |
| India | 37 | 0.1% |
| Indonesia | 32 | 0.0% |
| Ireland | 87 | 0.1% |
| Israel | 25 | 0.0% |
| Italy | 16 | 0.0% |
| Jamaica | 12 | 0.0% |
| Japan | 370 | 0.5% |
| Korea | 168 | 0.2% |
| Laos | 40 | 0.1% |
| Latin America | 628 | 0.9% |
| Lithuania | 17 | 0.0% |
| Malaysia | 26 | 0.0% |
| Mexico | 205 | 0.3% |
| Micronesia | 224 | 0.3% |
| Netherlands | 124 | 0.2% |
| North Macedonia | 11 | 0.0% |
| Northern Africa | 4 | 0.0% |
| Northern Europe | 155 | 0.2% |
| Oceania | 1,130 | 1.5% |
| Peru | 40 | 0.1% |
| Philippines | 7,454 | 10.1% |
| Poland | 13 | 0.0% |
| Romania | 16 | 0.0% |
| Russia | 7 | 0.0% |
| Saudi Arabia | 7 | 0.0% |
| Serbia | 11 | 0.0% |
| South Africa | 8 | 0.0% |
| South America | 245 | 0.3% |
| South Central Asia | 37 | 0.1% |
| South Eastern Asia | 7,785 | 10.6% |
| Southern Europe | 42 | 0.1% |
| Spain | 26 | 0.0% |
| Sweden | 7 | 0.0% |
| Taiwan | 22 | 0.0% |
| Thailand | 45 | 0.1% |
| Uruguay | 10 | 0.0% |
| Venezuela | 20 | 0.0% |
| Vietnam | 168 | 0.2% |
| Western Asia | 32 | 0.0% |
| Western Europe | 201 | 0.3% | View All 68 Rows |
Sex and Age in Kauai County
Sex and Age in Kauai County
The most populous age groups in Kauai County are 60 to 64 Years (2,737 | 7.4%) for men and 60 to 64 Years (2,998 | 8.2%) for women.
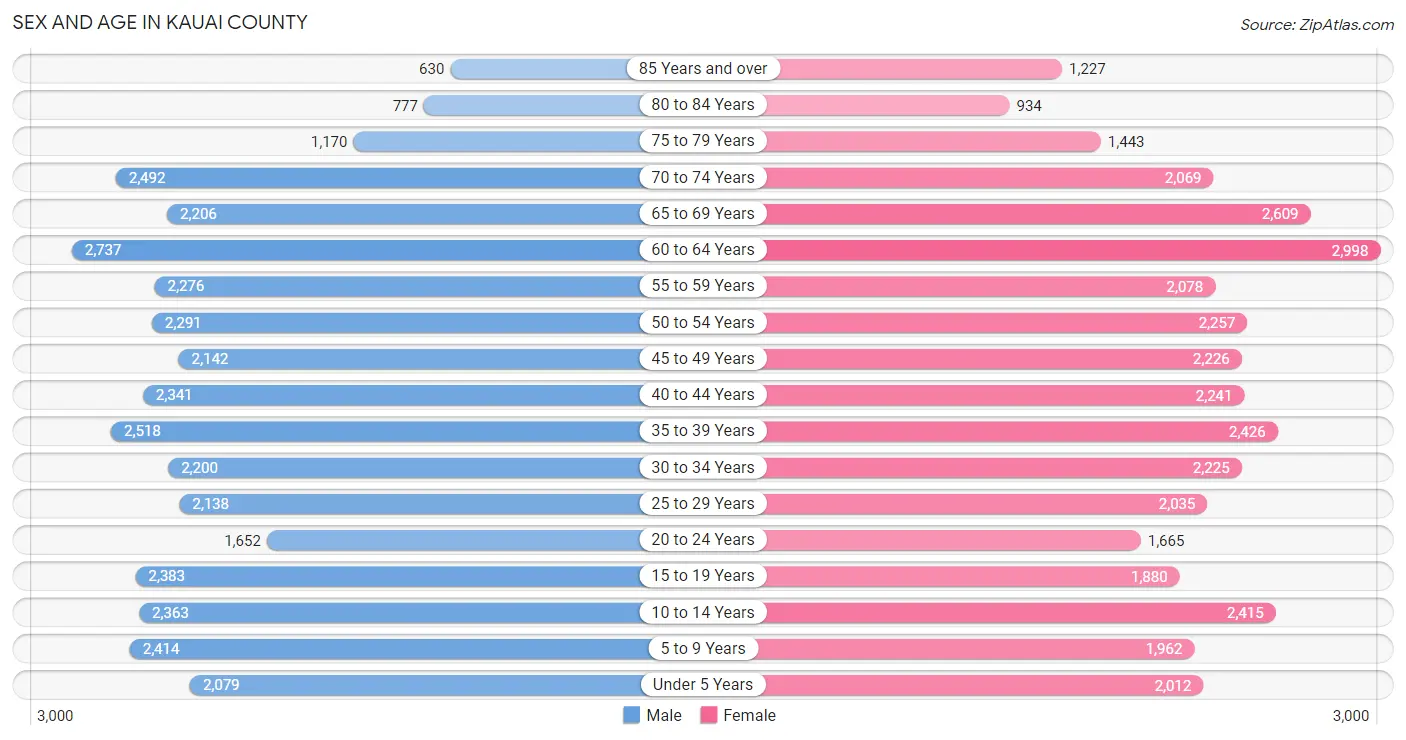
| Age Bracket | Male | Female |
| Under 5 Years | 2,079 (5.7%) | 2,012 (5.5%) |
| 5 to 9 Years | 2,414 (6.6%) | 1,962 (5.3%) |
| 10 to 14 Years | 2,363 (6.4%) | 2,415 (6.6%) |
| 15 to 19 Years | 2,383 (6.5%) | 1,880 (5.1%) |
| 20 to 24 Years | 1,652 (4.5%) | 1,665 (4.5%) |
| 25 to 29 Years | 2,138 (5.8%) | 2,035 (5.5%) |
| 30 to 34 Years | 2,200 (6.0%) | 2,225 (6.1%) |
| 35 to 39 Years | 2,518 (6.8%) | 2,426 (6.6%) |
| 40 to 44 Years | 2,341 (6.4%) | 2,241 (6.1%) |
| 45 to 49 Years | 2,142 (5.8%) | 2,226 (6.1%) |
| 50 to 54 Years | 2,291 (6.2%) | 2,257 (6.1%) |
| 55 to 59 Years | 2,276 (6.2%) | 2,078 (5.7%) |
| 60 to 64 Years | 2,737 (7.4%) | 2,998 (8.2%) |
| 65 to 69 Years | 2,206 (6.0%) | 2,609 (7.1%) |
| 70 to 74 Years | 2,492 (6.8%) | 2,069 (5.6%) |
| 75 to 79 Years | 1,170 (3.2%) | 1,443 (3.9%) |
| 80 to 84 Years | 777 (2.1%) | 934 (2.5%) |
| 85 Years and over | 630 (1.7%) | 1,227 (3.3%) |
| Total | 36,809 (100.0%) | 36,702 (100.0%) |
Families and Households in Kauai County
Median Family Size in Kauai County
The median family size in Kauai County is 3.66 persons per family, with single female/mother families (2,912 | 17.9%) accounting for the largest median family size of 3.96 persons per family. On the other hand, married-couple families (11,769 | 72.5%) represent the smallest median family size with 3.56 persons per family.
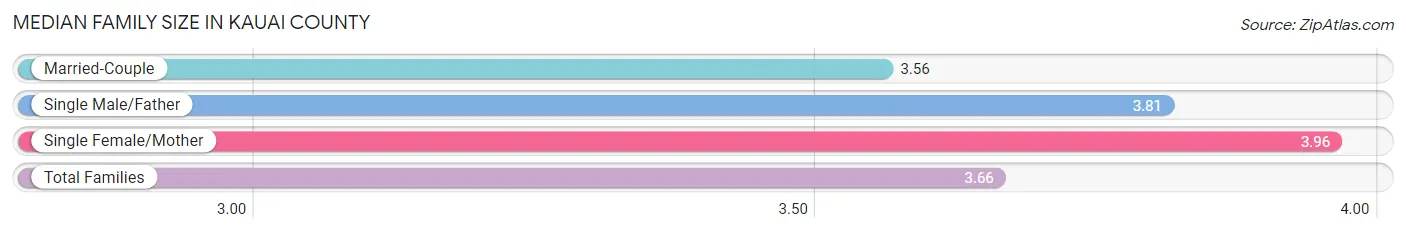
| Family Type | # Families | Family Size |
| Married-Couple | 11,769 (72.5%) | 3.56 |
| Single Male/Father | 1,543 (9.5%) | 3.81 |
| Single Female/Mother | 2,912 (17.9%) | 3.96 |
| Total Families | 16,224 (100.0%) | 3.66 |
Median Household Size in Kauai County
The median household size in Kauai County is 3.16 persons per household, with single male/father households (1,543 | 6.7%) accounting for the largest median household size of 4.34 persons per household. non-family households (6,754 | 29.4%) represent the smallest median household size with 1.45 persons per household.
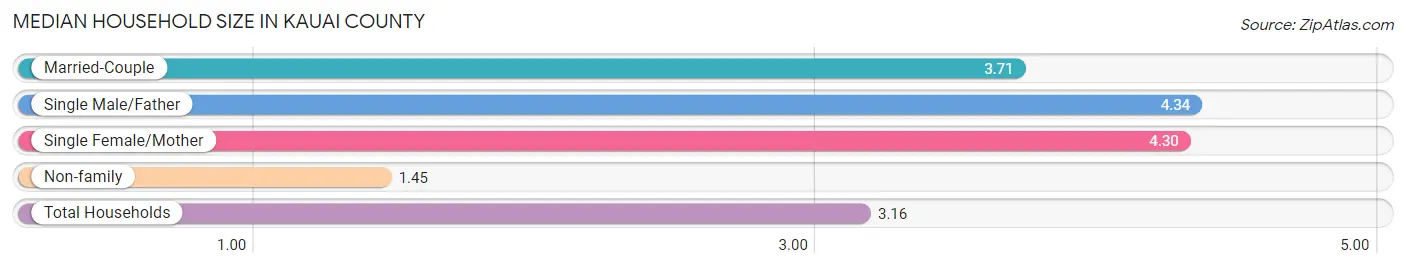
| Household Type | # Households | Household Size |
| Married-Couple | 11,769 (51.2%) | 3.71 |
| Single Male/Father | 1,543 (6.7%) | 4.34 |
| Single Female/Mother | 2,912 (12.7%) | 4.30 |
| Non-family | 6,754 (29.4%) | 1.45 |
| Total Households | 22,978 (100.0%) | 3.16 |
Household Size by Marriage Status in Kauai County
Out of a total of 22,978 households in Kauai County, 16,224 (70.6%) are family households, while 6,754 (29.4%) are nonfamily households. The most numerous type of family households are 2-person households, comprising 6,874, and the most common type of nonfamily households are 1-person households, comprising 4,851.
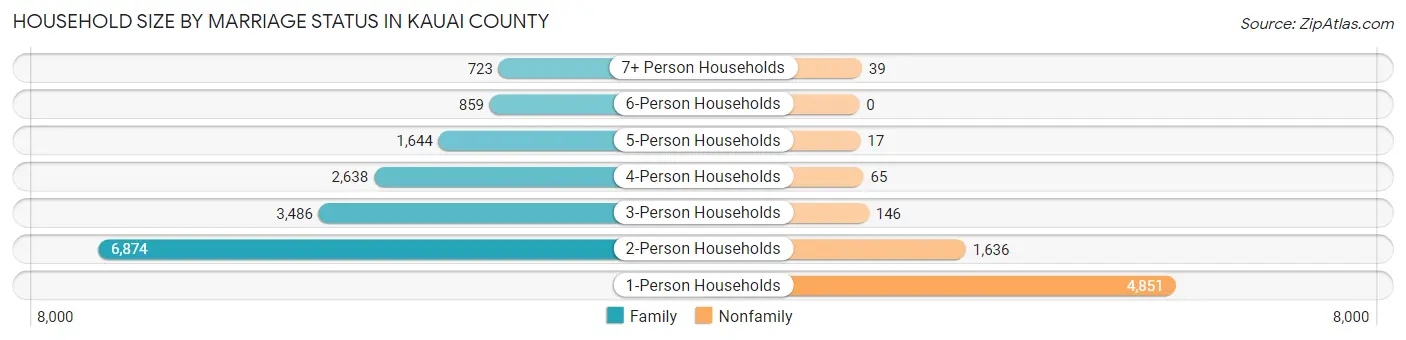
| Household Size | Family Households | Nonfamily Households |
| 1-Person Households | - | 4,851 (21.1%) |
| 2-Person Households | 6,874 (29.9%) | 1,636 (7.1%) |
| 3-Person Households | 3,486 (15.2%) | 146 (0.6%) |
| 4-Person Households | 2,638 (11.5%) | 65 (0.3%) |
| 5-Person Households | 1,644 (7.1%) | 17 (0.1%) |
| 6-Person Households | 859 (3.7%) | 0 (0.0%) |
| 7+ Person Households | 723 (3.2%) | 39 (0.2%) |
| Total | 16,224 (70.6%) | 6,754 (29.4%) |
Female Fertility in Kauai County
Fertility by Age in Kauai County
Average fertility rate in Kauai County is 59.0 births per 1,000 women. Women in the age bracket of 20 to 34 years have the highest fertility rate with 68.0 births per 1,000 women. Women in the age bracket of 35 to 50 years acount for 51.6% of all women with births.
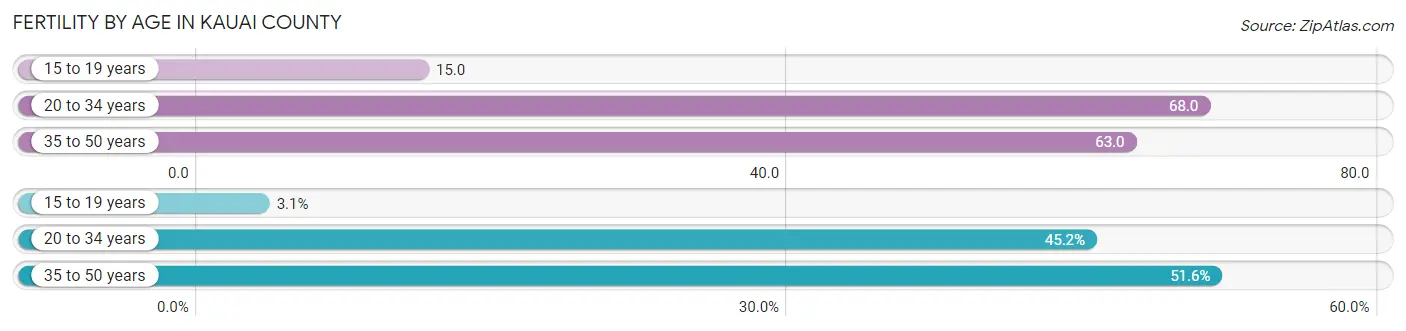
| Age Bracket | Women with Births | Births / 1,000 Women |
| 15 to 19 years | 28 (3.1%) | 15.0 |
| 20 to 34 years | 404 (45.2%) | 68.0 |
| 35 to 50 years | 461 (51.6%) | 63.0 |
| Total | 893 (100.0%) | 59.0 |
Fertility by Age by Marriage Status in Kauai County
55.3% of women with births (893) in Kauai County are married. The highest percentage of unmarried women with births falls into 15 to 19 years age bracket with 78.6% of them unmarried at the time of birth, while the lowest percentage of unmarried women with births belong to 35 to 50 years age bracket with 33.6% of them unmarried.
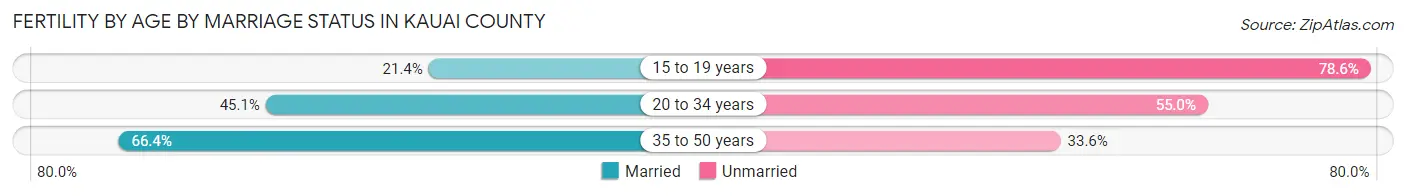
| Age Bracket | Married | Unmarried |
| 15 to 19 years | 6 (21.4%) | 22 (78.6%) |
| 20 to 34 years | 182 (45.1%) | 222 (54.9%) |
| 35 to 50 years | 306 (66.4%) | 155 (33.6%) |
| Total | 494 (55.3%) | 399 (44.7%) |
Fertility by Education in Kauai County
Average fertility rate in Kauai County is 59.0 births per 1,000 women. Women with the education attainment of graduate degree have the highest fertility rate of 117.0 births per 1,000 women, while women with the education attainment of bachelor's degree have the lowest fertility at 41.0 births per 1,000 women. Women with the education attainment of college or associate's degree represent 31.6% of all women with births.
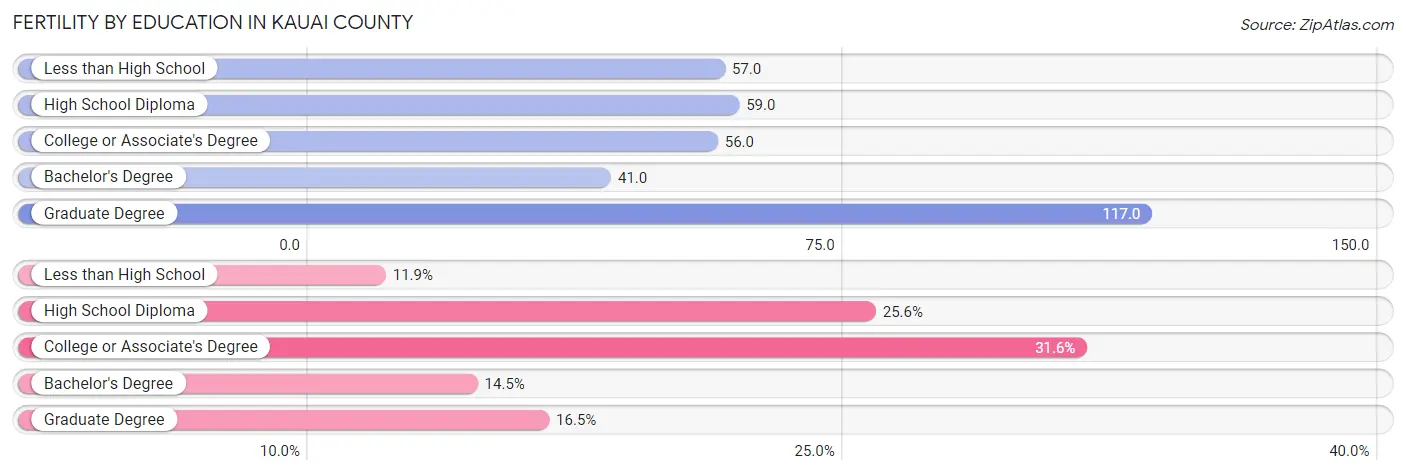
| Educational Attainment | Women with Births | Births / 1,000 Women |
| Less than High School | 106 (11.9%) | 57.0 |
| High School Diploma | 229 (25.6%) | 59.0 |
| College or Associate's Degree | 282 (31.6%) | 56.0 |
| Bachelor's Degree | 129 (14.4%) | 41.0 |
| Graduate Degree | 147 (16.5%) | 117.0 |
| Total | 893 (100.0%) | 59.0 |
Fertility by Education by Marriage Status in Kauai County
44.7% of women with births in Kauai County are unmarried. Women with the educational attainment of graduate degree are most likely to be married with 98.0% of them married at childbirth, while women with the educational attainment of less than high school are least likely to be married with 82.1% of them unmarried at childbirth.
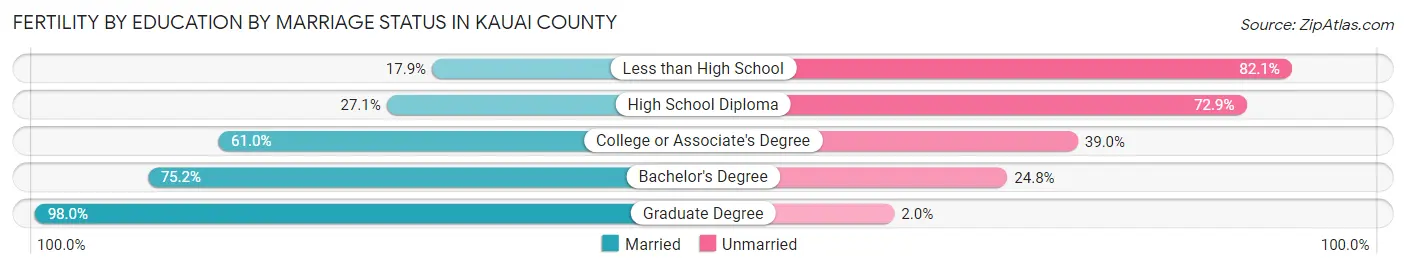
| Educational Attainment | Married | Unmarried |
| Less than High School | 19 (17.9%) | 87 (82.1%) |
| High School Diploma | 62 (27.1%) | 167 (72.9%) |
| College or Associate's Degree | 172 (61.0%) | 110 (39.0%) |
| Bachelor's Degree | 97 (75.2%) | 32 (24.8%) |
| Graduate Degree | 144 (98.0%) | 3 (2.0%) |
| Total | 494 (55.3%) | 399 (44.7%) |
Employment Characteristics in Kauai County
Employment by Class of Employer in Kauai County
Among the 34,033 employed individuals in Kauai County, private company employees (20,442 | 60.1%), self-employed (not incorporated) (3,688 | 10.8%), and state government employees (2,978 | 8.7%) make up the most common classes of employment.
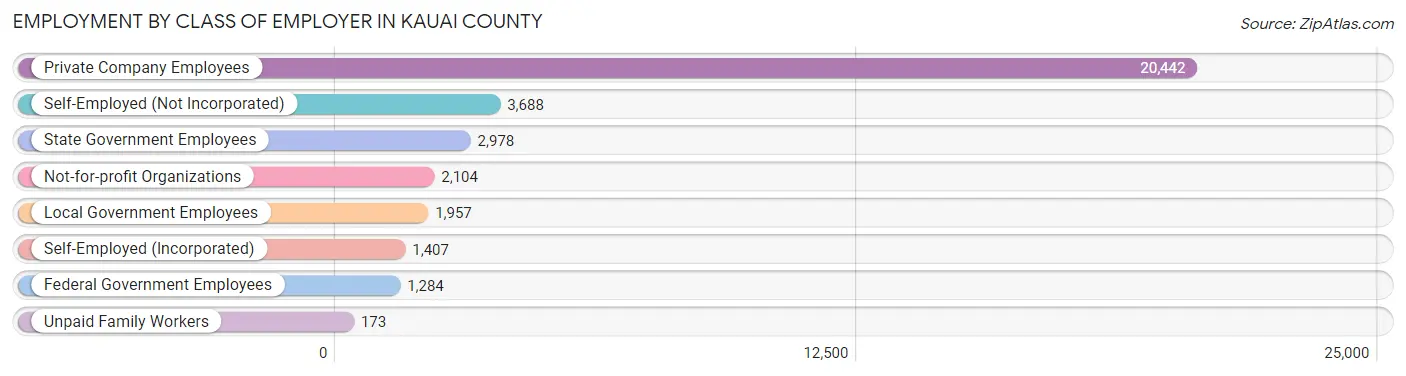
| Employer Class | # Employees | % Employees |
| Private Company Employees | 20,442 | 60.1% |
| Self-Employed (Incorporated) | 1,407 | 4.1% |
| Self-Employed (Not Incorporated) | 3,688 | 10.8% |
| Not-for-profit Organizations | 2,104 | 6.2% |
| Local Government Employees | 1,957 | 5.8% |
| State Government Employees | 2,978 | 8.7% |
| Federal Government Employees | 1,284 | 3.8% |
| Unpaid Family Workers | 173 | 0.5% |
| Total | 34,033 | 100.0% |
Employment Status by Age in Kauai County
According to the labor force statistics for Kauai County, out of the total population over 16 years of age (59,146), 63.3% or 37,439 individuals are in the labor force, with 4.1% or 1,535 of them unemployed. The age group with the highest labor force participation rate is 30 to 34 years, with 86.8% or 3,841 individuals in the labor force. Within the labor force, the 16 to 19 years age range has the highest percentage of unemployed individuals, with 11.2% or 122 of them being unemployed.
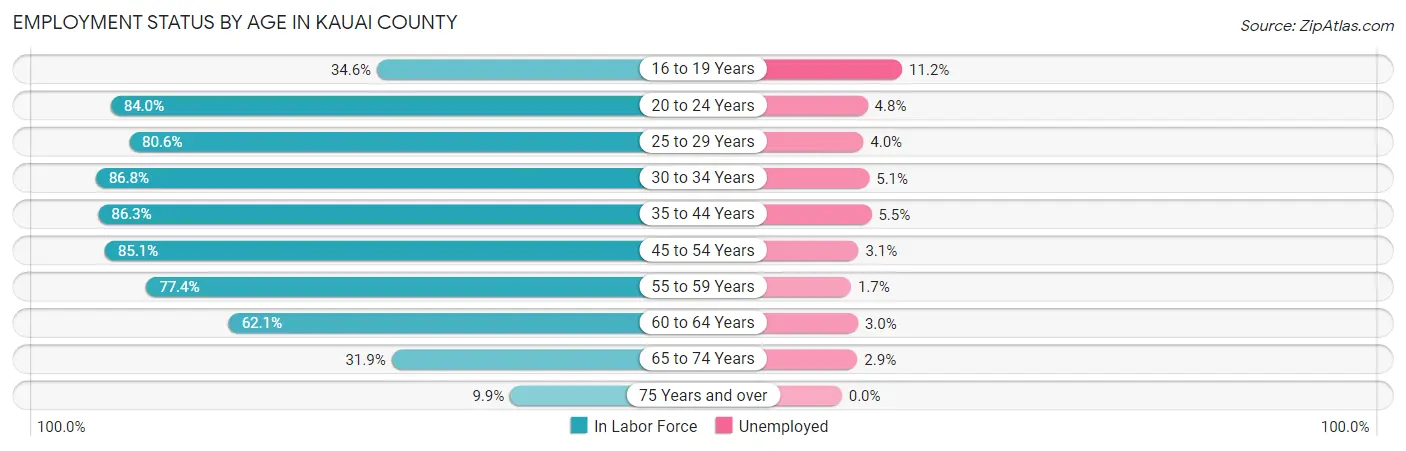
| Age Bracket | In Labor Force | Unemployed |
| 16 to 19 Years | 1,087 (34.6%) | 122 (11.2%) |
| 20 to 24 Years | 2,786 (84.0%) | 134 (4.8%) |
| 25 to 29 Years | 3,363 (80.6%) | 135 (4.0%) |
| 30 to 34 Years | 3,841 (86.8%) | 196 (5.1%) |
| 35 to 44 Years | 8,221 (86.3%) | 452 (5.5%) |
| 45 to 54 Years | 7,588 (85.1%) | 235 (3.1%) |
| 55 to 59 Years | 3,370 (77.4%) | 57 (1.7%) |
| 60 to 64 Years | 3,561 (62.1%) | 107 (3.0%) |
| 65 to 74 Years | 2,991 (31.9%) | 87 (2.9%) |
| 75 Years and over | 612 (9.9%) | 0 (0.0%) |
| Total | 37,439 (63.3%) | 1,535 (4.1%) |
Employment Status by Educational Attainment in Kauai County
According to labor force statistics for Kauai County, 80.7% of individuals (29,963) out of the total population between 25 and 64 years of age (37,129) are in the labor force, with 3.9% or 1,169 of them being unemployed. The group with the highest labor force participation rate are those with the educational attainment of bachelor's degree or higher, with 85.9% or 9,414 individuals in the labor force. Within the labor force, individuals with less than high school education have the highest percentage of unemployment, with 8.9% or 120 of them being unemployed.
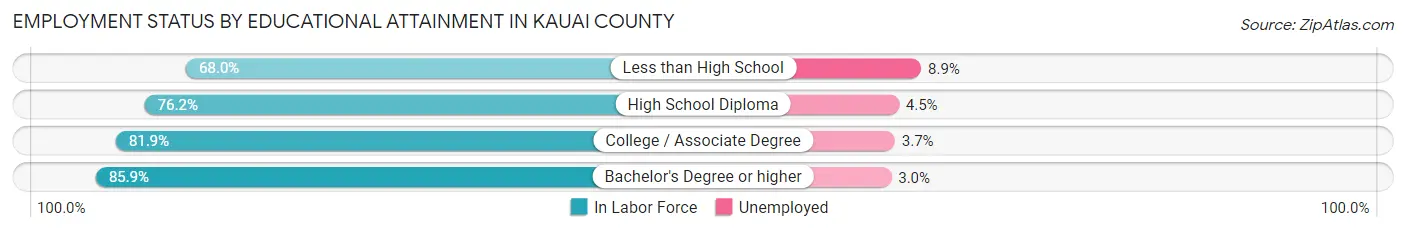
| Educational Attainment | In Labor Force | Unemployed |
| Less than High School | 1,349 (68.0%) | 177 (8.9%) |
| High School Diploma | 8,508 (76.2%) | 502 (4.5%) |
| College / Associate Degree | 10,663 (81.9%) | 482 (3.7%) |
| Bachelor's Degree or higher | 9,414 (85.9%) | 329 (3.0%) |
| Total | 29,963 (80.7%) | 1,448 (3.9%) |
Employment Occupations by Sex in Kauai County
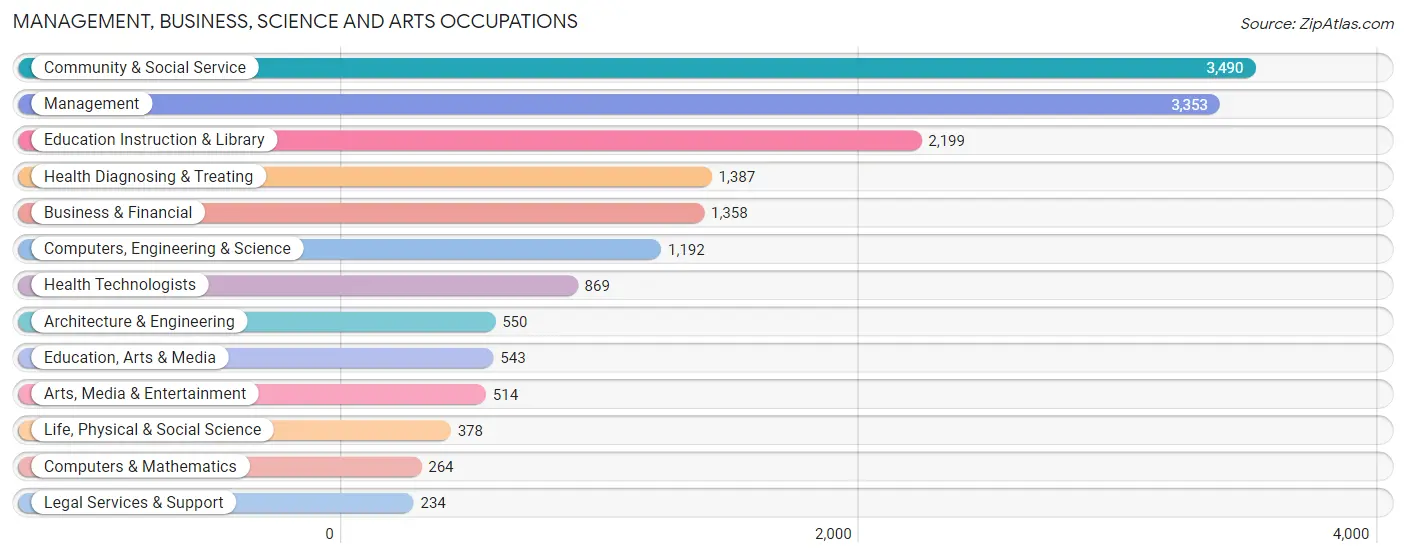
Management, Business, Science and Arts Occupations
The most common Management, Business, Science and Arts occupations in Kauai County are Community & Social Service (3,490 | 9.8%), Management (3,353 | 9.4%), Education Instruction & Library (2,199 | 6.2%), Health Diagnosing & Treating (1,387 | 3.9%), and Business & Financial (1,358 | 3.8%).
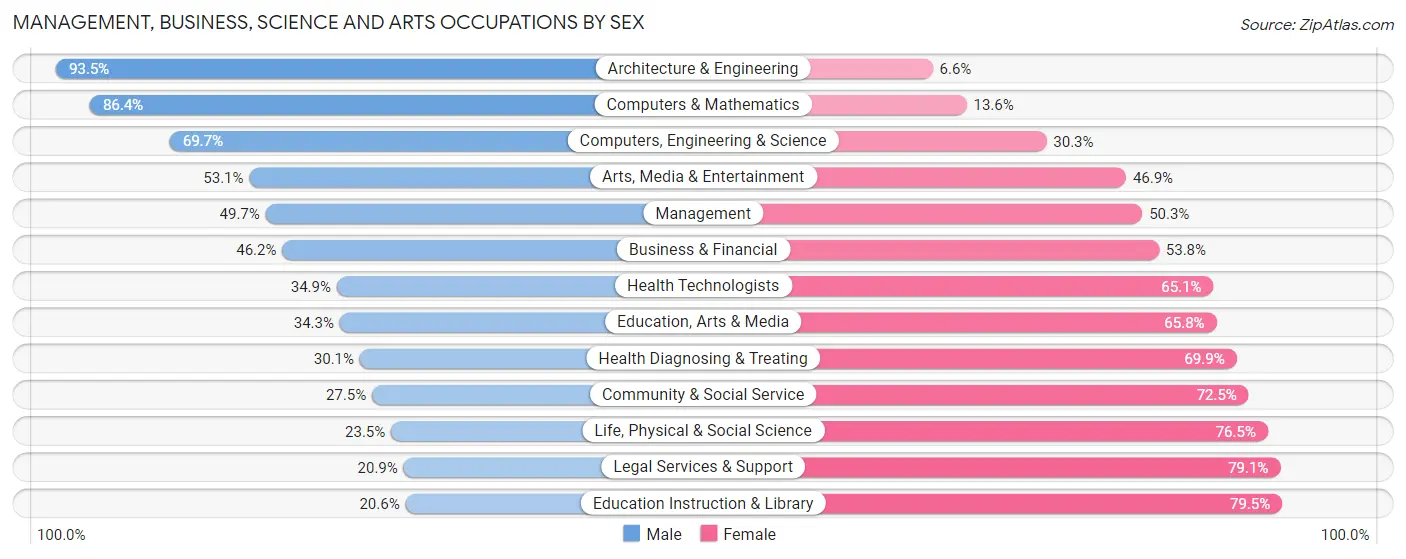
Management, Business, Science and Arts Occupations by Sex
Within the Management, Business, Science and Arts occupations in Kauai County, the most male-oriented occupations are Architecture & Engineering (93.4%), Computers & Mathematics (86.4%), and Computers, Engineering & Science (69.7%), while the most female-oriented occupations are Education Instruction & Library (79.4%), Legal Services & Support (79.1%), and Life, Physical & Social Science (76.5%).
| Occupation | Male | Female |
| Management | 1,667 (49.7%) | 1,686 (50.3%) |
| Business & Financial | 628 (46.2%) | 730 (53.8%) |
| Computers, Engineering & Science | 831 (69.7%) | 361 (30.3%) |
| Computers & Mathematics | 228 (86.4%) | 36 (13.6%) |
| Architecture & Engineering | 514 (93.4%) | 36 (6.6%) |
| Life, Physical & Social Science | 89 (23.5%) | 289 (76.5%) |
| Community & Social Service | 960 (27.5%) | 2,530 (72.5%) |
| Education, Arts & Media | 186 (34.3%) | 357 (65.7%) |
| Legal Services & Support | 49 (20.9%) | 185 (79.1%) |
| Education Instruction & Library | 452 (20.5%) | 1,747 (79.4%) |
| Arts, Media & Entertainment | 273 (53.1%) | 241 (46.9%) |
| Health Diagnosing & Treating | 417 (30.1%) | 970 (69.9%) |
| Health Technologists | 303 (34.9%) | 566 (65.1%) |
| Total (Category) | 4,503 (41.8%) | 6,277 (58.2%) |
| Total (Overall) | 17,647 (49.4%) | 18,036 (50.5%) |
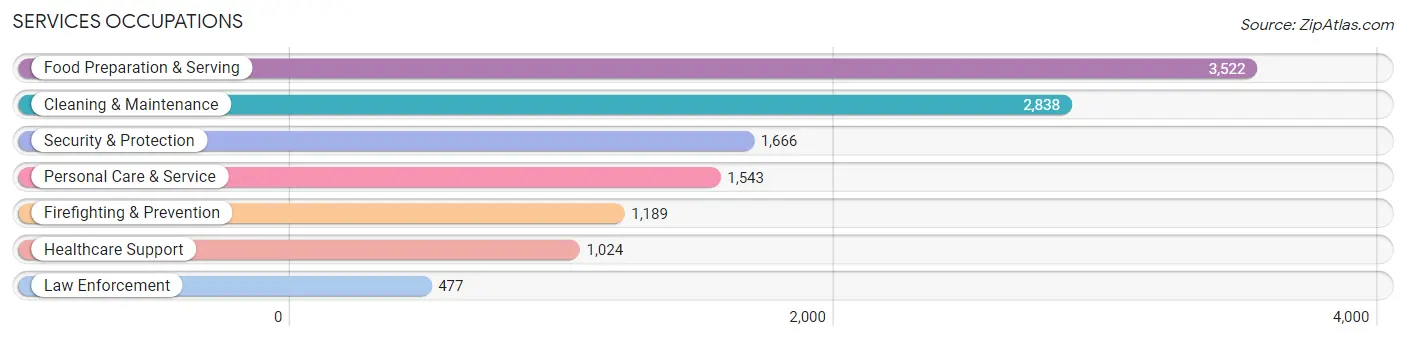
Services Occupations
The most common Services occupations in Kauai County are Food Preparation & Serving (3,522 | 9.9%), Cleaning & Maintenance (2,838 | 8.0%), Security & Protection (1,666 | 4.7%), Personal Care & Service (1,543 | 4.3%), and Firefighting & Prevention (1,189 | 3.3%).
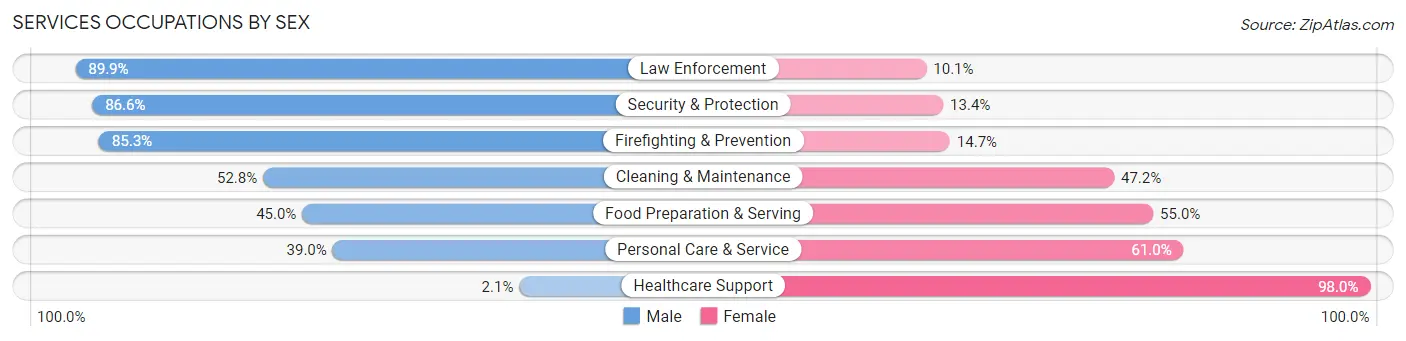
Services Occupations by Sex
Within the Services occupations in Kauai County, the most male-oriented occupations are Law Enforcement (89.9%), Security & Protection (86.6%), and Firefighting & Prevention (85.3%), while the most female-oriented occupations are Healthcare Support (98.0%), Personal Care & Service (61.0%), and Food Preparation & Serving (55.0%).
| Occupation | Male | Female |
| Healthcare Support | 21 (2.1%) | 1,003 (98.0%) |
| Security & Protection | 1,443 (86.6%) | 223 (13.4%) |
| Firefighting & Prevention | 1,014 (85.3%) | 175 (14.7%) |
| Law Enforcement | 429 (89.9%) | 48 (10.1%) |
| Food Preparation & Serving | 1,586 (45.0%) | 1,936 (55.0%) |
| Cleaning & Maintenance | 1,498 (52.8%) | 1,340 (47.2%) |
| Personal Care & Service | 602 (39.0%) | 941 (61.0%) |
| Total (Category) | 5,150 (48.6%) | 5,443 (51.4%) |
| Total (Overall) | 17,647 (49.4%) | 18,036 (50.5%) |
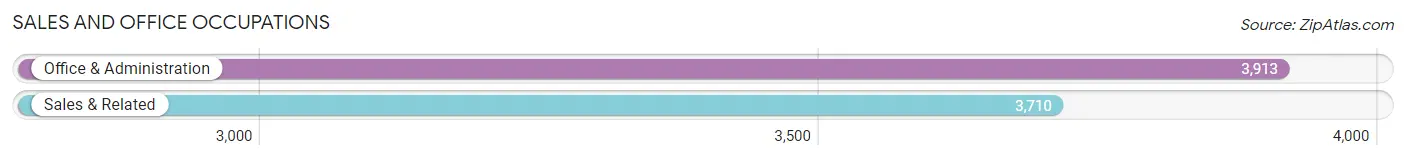
Sales and Office Occupations
The most common Sales and Office occupations in Kauai County are Office & Administration (3,913 | 11.0%), and Sales & Related (3,710 | 10.4%).
Sales and Office Occupations by Sex
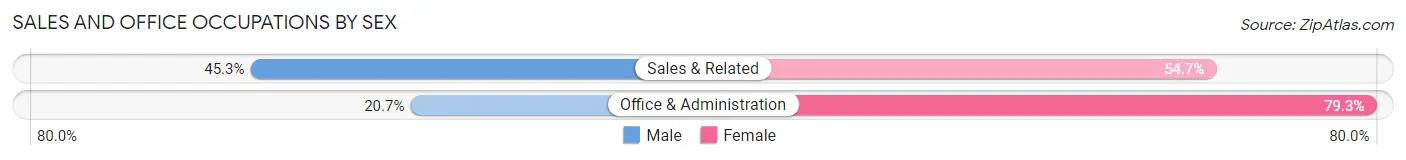
| Occupation | Male | Female |
| Sales & Related | 1,680 (45.3%) | 2,030 (54.7%) |
| Office & Administration | 809 (20.7%) | 3,104 (79.3%) |
| Total (Category) | 2,489 (32.7%) | 5,134 (67.3%) |
| Total (Overall) | 17,647 (49.4%) | 18,036 (50.5%) |
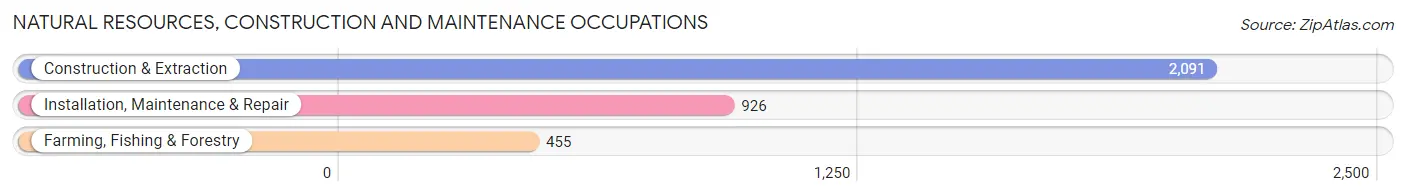
Natural Resources, Construction and Maintenance Occupations
The most common Natural Resources, Construction and Maintenance occupations in Kauai County are Construction & Extraction (2,091 | 5.9%), Installation, Maintenance & Repair (926 | 2.6%), and Farming, Fishing & Forestry (455 | 1.3%).
Natural Resources, Construction and Maintenance Occupations by Sex
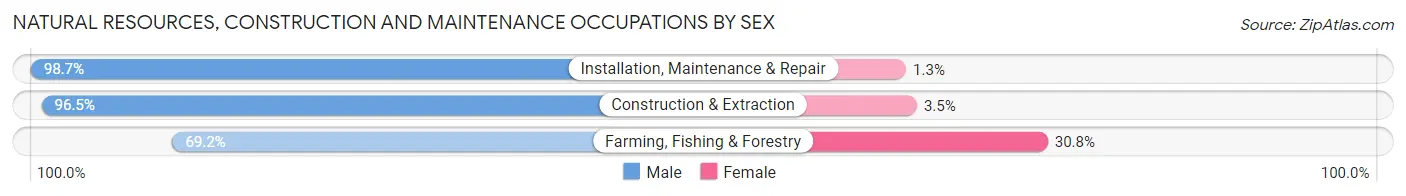
| Occupation | Male | Female |
| Farming, Fishing & Forestry | 315 (69.2%) | 140 (30.8%) |
| Construction & Extraction | 2,017 (96.5%) | 74 (3.5%) |
| Installation, Maintenance & Repair | 914 (98.7%) | 12 (1.3%) |
| Total (Category) | 3,246 (93.5%) | 226 (6.5%) |
| Total (Overall) | 17,647 (49.4%) | 18,036 (50.5%) |
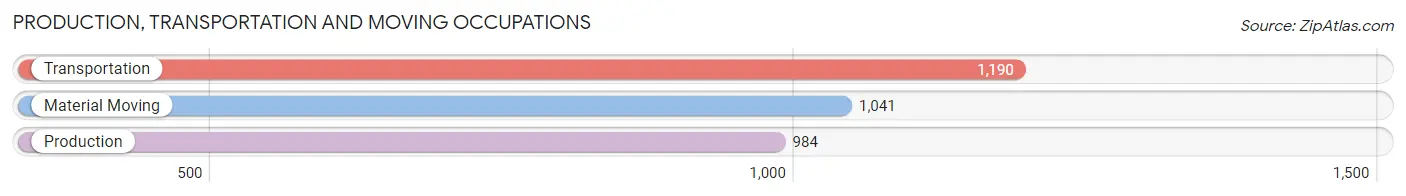
Production, Transportation and Moving Occupations
The most common Production, Transportation and Moving occupations in Kauai County are Transportation (1,190 | 3.3%), Material Moving (1,041 | 2.9%), and Production (984 | 2.8%).
Production, Transportation and Moving Occupations by Sex
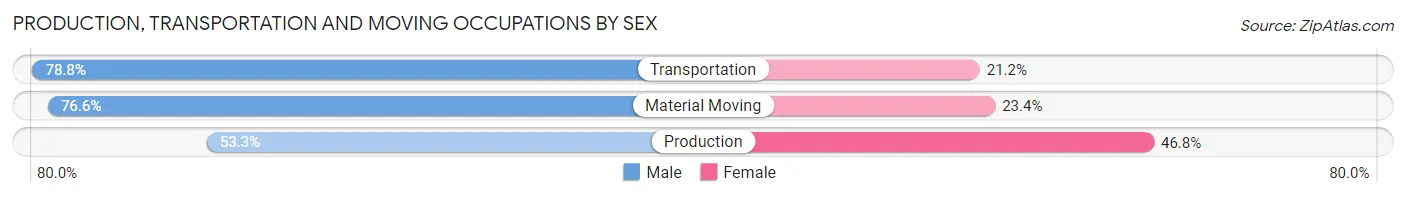
| Occupation | Male | Female |
| Production | 524 (53.2%) | 460 (46.8%) |
| Transportation | 938 (78.8%) | 252 (21.2%) |
| Material Moving | 797 (76.6%) | 244 (23.4%) |
| Total (Category) | 2,259 (70.3%) | 956 (29.7%) |
| Total (Overall) | 17,647 (49.4%) | 18,036 (50.5%) |
Employment Industries by Sex in Kauai County
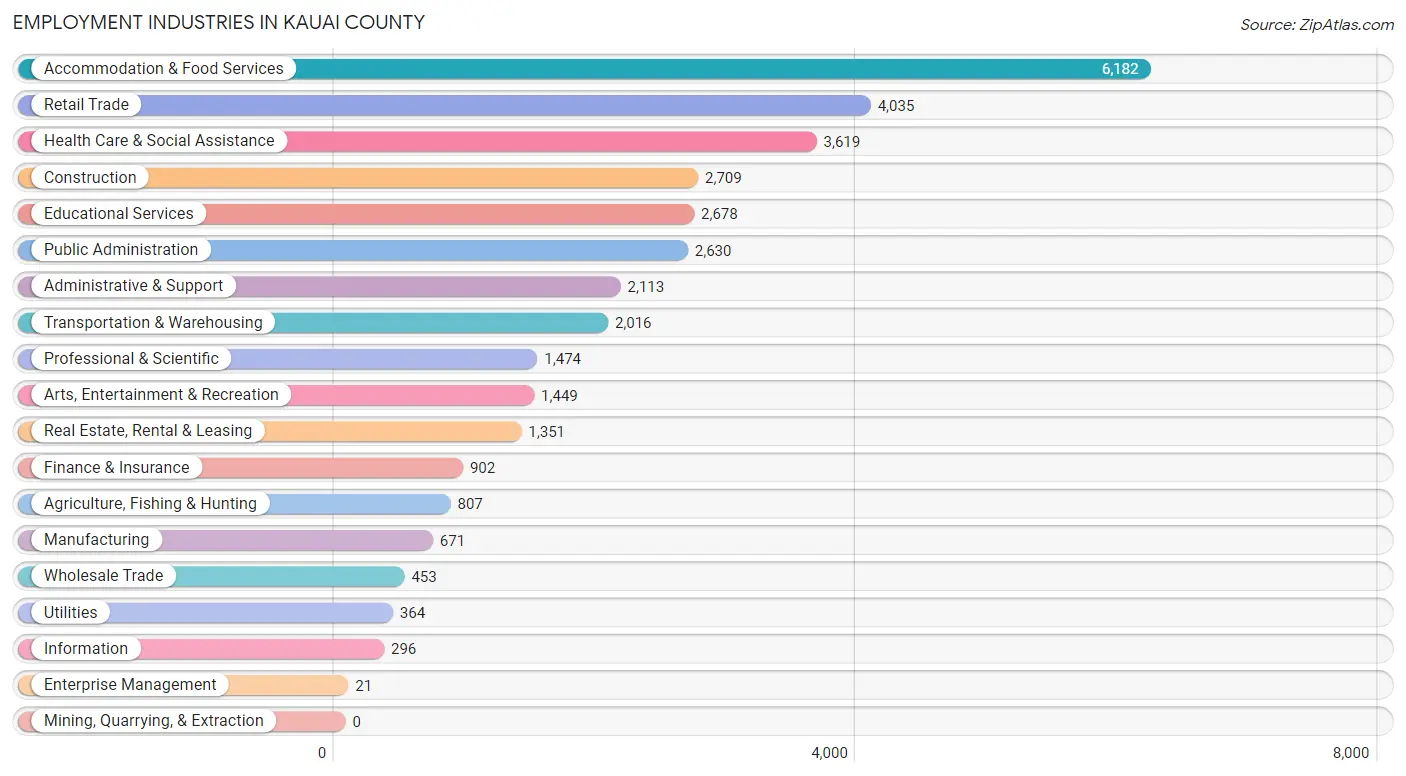
Employment Industries in Kauai County
The major employment industries in Kauai County include Accommodation & Food Services (6,182 | 17.3%), Retail Trade (4,035 | 11.3%), Health Care & Social Assistance (3,619 | 10.1%), Construction (2,709 | 7.6%), and Educational Services (2,678 | 7.5%).
Employment Industries by Sex in Kauai County
The Kauai County industries that see more men than women are Enterprise Management (100.0%), Construction (85.8%), and Agriculture, Fishing & Hunting (70.6%), whereas the industries that tend to have a higher number of women are Health Care & Social Assistance (84.6%), Educational Services (79.4%), and Retail Trade (58.8%).
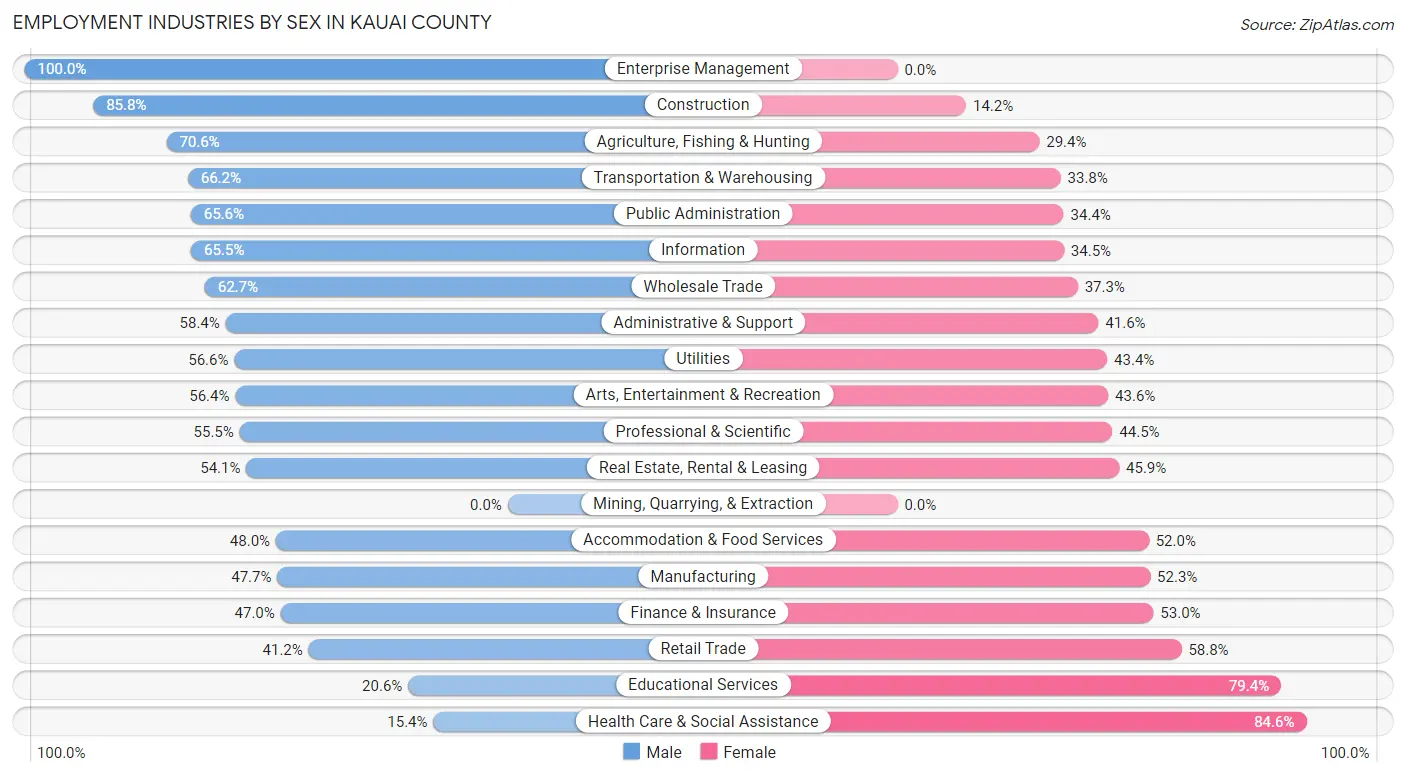
| Industry | Male | Female |
| Agriculture, Fishing & Hunting | 570 (70.6%) | 237 (29.4%) |
| Mining, Quarrying, & Extraction | 0 (0.0%) | 0 (0.0%) |
| Construction | 2,324 (85.8%) | 385 (14.2%) |
| Manufacturing | 320 (47.7%) | 351 (52.3%) |
| Wholesale Trade | 284 (62.7%) | 169 (37.3%) |
| Retail Trade | 1,663 (41.2%) | 2,372 (58.8%) |
| Transportation & Warehousing | 1,335 (66.2%) | 681 (33.8%) |
| Utilities | 206 (56.6%) | 158 (43.4%) |
| Information | 194 (65.5%) | 102 (34.5%) |
| Finance & Insurance | 424 (47.0%) | 478 (53.0%) |
| Real Estate, Rental & Leasing | 731 (54.1%) | 620 (45.9%) |
| Professional & Scientific | 818 (55.5%) | 656 (44.5%) |
| Enterprise Management | 21 (100.0%) | 0 (0.0%) |
| Administrative & Support | 1,234 (58.4%) | 879 (41.6%) |
| Educational Services | 552 (20.6%) | 2,126 (79.4%) |
| Health Care & Social Assistance | 557 (15.4%) | 3,062 (84.6%) |
| Arts, Entertainment & Recreation | 817 (56.4%) | 632 (43.6%) |
| Accommodation & Food Services | 2,966 (48.0%) | 3,216 (52.0%) |
| Public Administration | 1,725 (65.6%) | 905 (34.4%) |
| Total | 17,647 (49.4%) | 18,036 (50.5%) |
Education in Kauai County
School Enrollment in Kauai County
The most common levels of schooling among the 16,254 students in Kauai County are middle school (4,081 | 25.1%), high school (3,604 | 22.2%), and elementary school (3,342 | 20.6%).
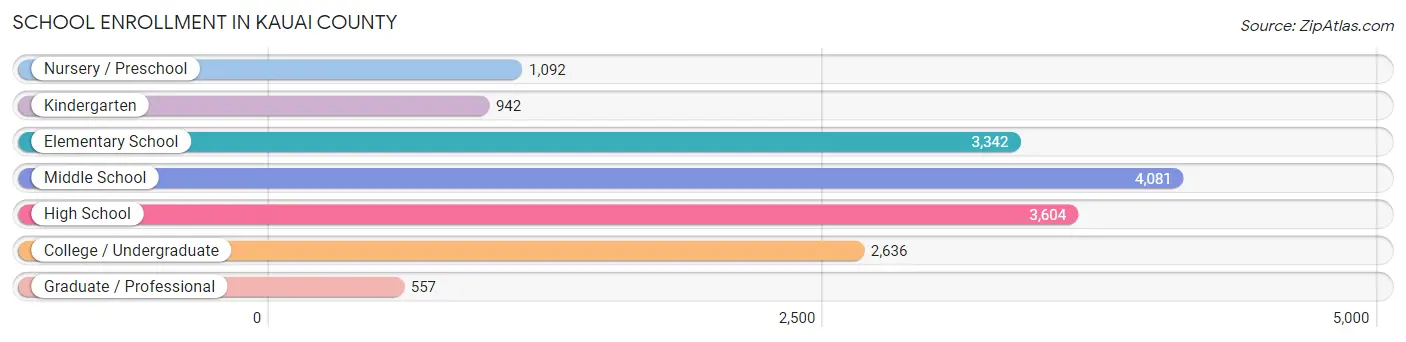
| School Level | # Students | % Students |
| Nursery / Preschool | 1,092 | 6.7% |
| Kindergarten | 942 | 5.8% |
| Elementary School | 3,342 | 20.6% |
| Middle School | 4,081 | 25.1% |
| High School | 3,604 | 22.2% |
| College / Undergraduate | 2,636 | 16.2% |
| Graduate / Professional | 557 | 3.4% |
| Total | 16,254 | 100.0% |
School Enrollment by Age by Funding Source in Kauai County
Out of a total of 16,254 students who are enrolled in schools in Kauai County, 2,861 (17.6%) attend a private institution, while the remaining 13,393 (82.4%) are enrolled in public schools. The age group of 3 to 4 year olds has the highest likelihood of being enrolled in private schools, with 660 (68.8% in the age bracket) enrolled. Conversely, the age group of 15 to 17 year olds has the lowest likelihood of being enrolled in a private school, with 2,155 (87.7% in the age bracket) attending a public institution.
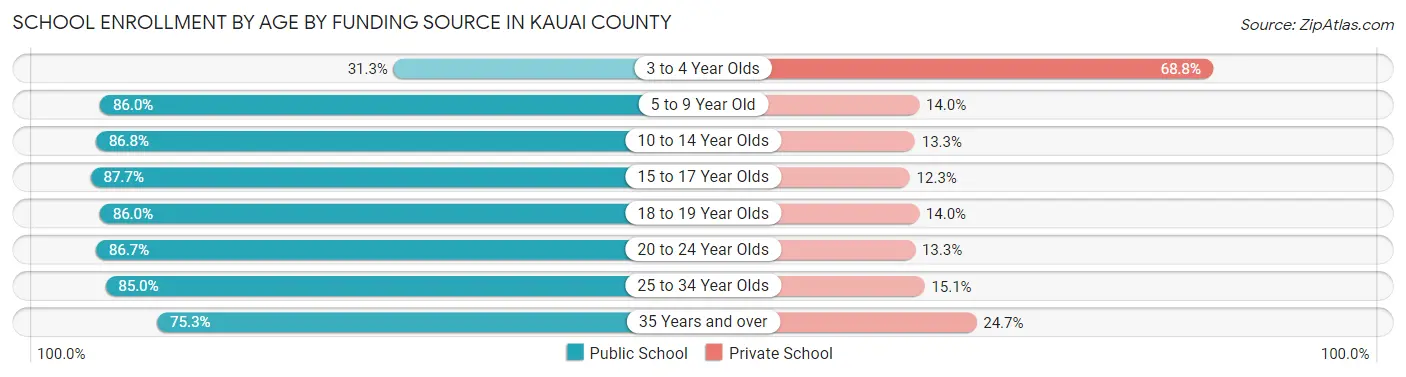
| Age Bracket | Public School | Private School |
| 3 to 4 Year Olds | 300 (31.2%) | 660 (68.8%) |
| 5 to 9 Year Old | 3,576 (86.0%) | 584 (14.0%) |
| 10 to 14 Year Olds | 4,033 (86.8%) | 616 (13.3%) |
| 15 to 17 Year Olds | 2,155 (87.7%) | 302 (12.3%) |
| 18 to 19 Year Olds | 933 (86.0%) | 152 (14.0%) |
| 20 to 24 Year Olds | 816 (86.7%) | 125 (13.3%) |
| 25 to 34 Year Olds | 655 (85.0%) | 116 (15.0%) |
| 35 Years and over | 927 (75.3%) | 304 (24.7%) |
| Total | 13,393 (82.4%) | 2,861 (17.6%) |
Educational Attainment by Field of Study in Kauai County
Business (2,803 | 16.5%), education (2,296 | 13.5%), science & technology (1,684 | 9.9%), social sciences (1,640 | 9.6%), and bio, nature & agricultural (1,254 | 7.4%) are the most common fields of study among 17,027 individuals in Kauai County who have obtained a bachelor's degree or higher.
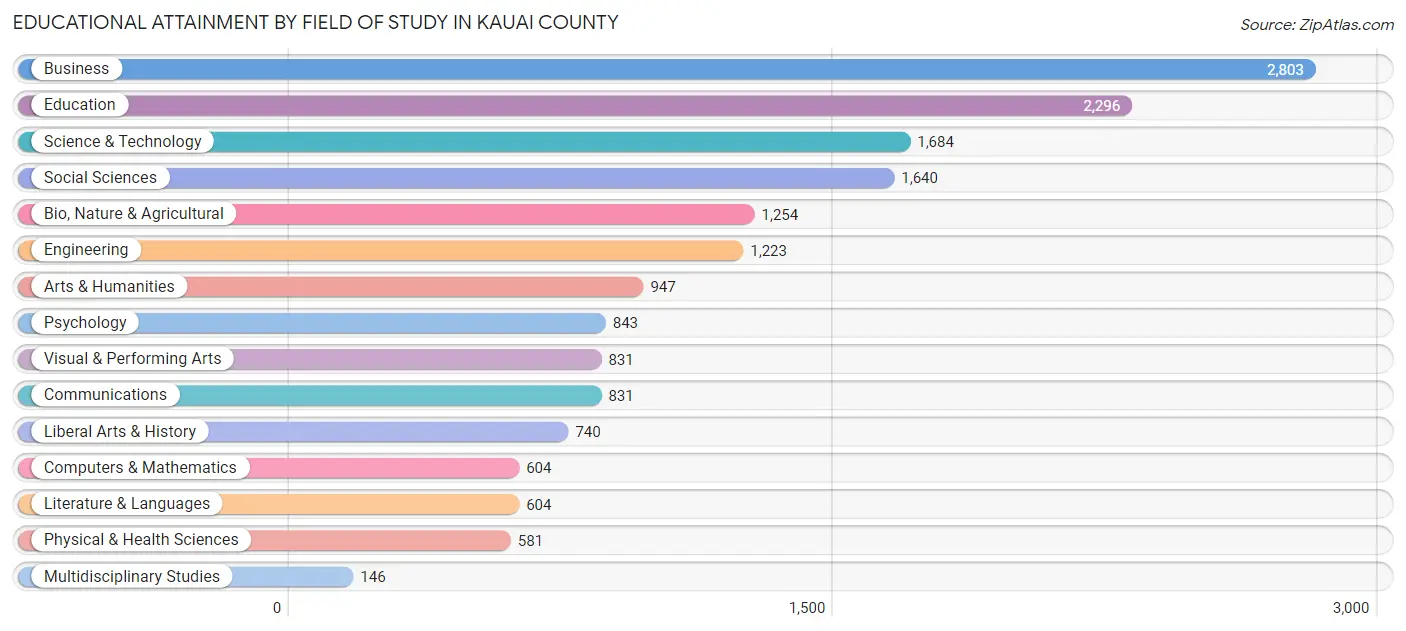
| Field of Study | # Graduates | % Graduates |
| Computers & Mathematics | 604 | 3.5% |
| Bio, Nature & Agricultural | 1,254 | 7.4% |
| Physical & Health Sciences | 581 | 3.4% |
| Psychology | 843 | 5.0% |
| Social Sciences | 1,640 | 9.6% |
| Engineering | 1,223 | 7.2% |
| Multidisciplinary Studies | 146 | 0.9% |
| Science & Technology | 1,684 | 9.9% |
| Business | 2,803 | 16.5% |
| Education | 2,296 | 13.5% |
| Literature & Languages | 604 | 3.5% |
| Liberal Arts & History | 740 | 4.3% |
| Visual & Performing Arts | 831 | 4.9% |
| Communications | 831 | 4.9% |
| Arts & Humanities | 947 | 5.6% |
| Total | 17,027 | 100.0% |
Transportation & Commute in Kauai County
Vehicle Availability by Sex in Kauai County
The most prevalent vehicle ownership categories in Kauai County are males with 2 vehicles (4,848, accounting for 28.3%) and females with 2 vehicles (5,300, making up 28.8%).
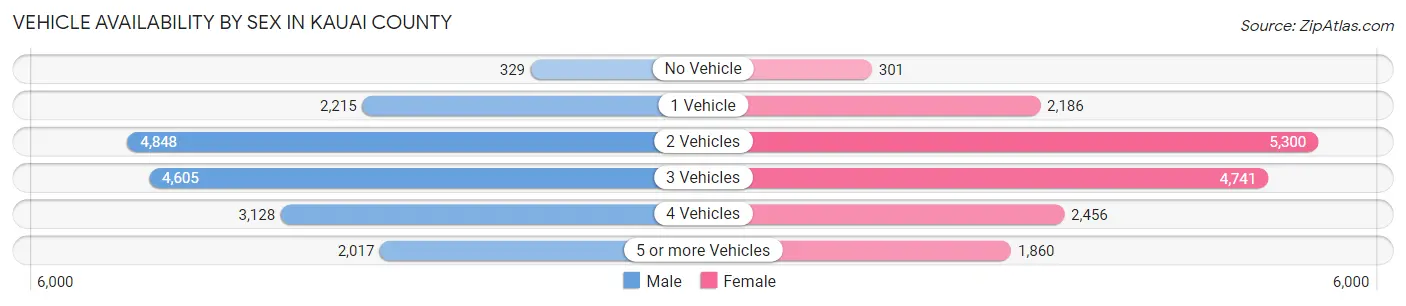
| Vehicles Available | Male | Female |
| No Vehicle | 329 (1.9%) | 301 (1.8%) |
| 1 Vehicle | 2,215 (12.9%) | 2,186 (13.0%) |
| 2 Vehicles | 4,848 (28.3%) | 5,300 (31.5%) |
| 3 Vehicles | 4,605 (26.9%) | 4,741 (28.1%) |
| 4 Vehicles | 3,128 (18.2%) | 2,456 (14.6%) |
| 5 or more Vehicles | 2,017 (11.8%) | 1,860 (11.0%) |
| Total | 17,142 (100.0%) | 16,844 (100.0%) |
Commute Time in Kauai County
The most frequently occuring commute durations in Kauai County are 30 to 34 minutes (5,218 commuters, 16.8%), 20 to 24 minutes (5,095 commuters, 16.4%), and 10 to 14 minutes (4,913 commuters, 15.8%).
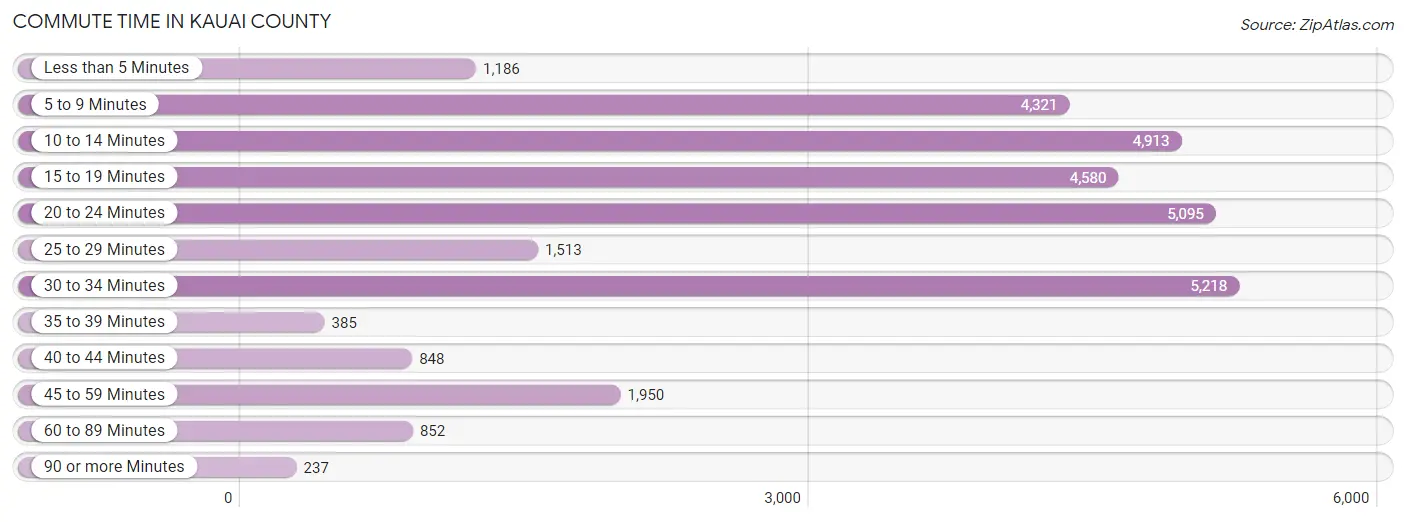
| Commute Time | # Commuters | % Commuters |
| Less than 5 Minutes | 1,186 | 3.8% |
| 5 to 9 Minutes | 4,321 | 13.9% |
| 10 to 14 Minutes | 4,913 | 15.8% |
| 15 to 19 Minutes | 4,580 | 14.7% |
| 20 to 24 Minutes | 5,095 | 16.4% |
| 25 to 29 Minutes | 1,513 | 4.9% |
| 30 to 34 Minutes | 5,218 | 16.8% |
| 35 to 39 Minutes | 385 | 1.2% |
| 40 to 44 Minutes | 848 | 2.7% |
| 45 to 59 Minutes | 1,950 | 6.3% |
| 60 to 89 Minutes | 852 | 2.7% |
| 90 or more Minutes | 237 | 0.8% |
Commute Time by Sex in Kauai County
The most common commute times in Kauai County are 20 to 24 minutes (2,943 commuters, 18.5%) for males and 10 to 14 minutes (2,942 commuters, 19.3%) for females.
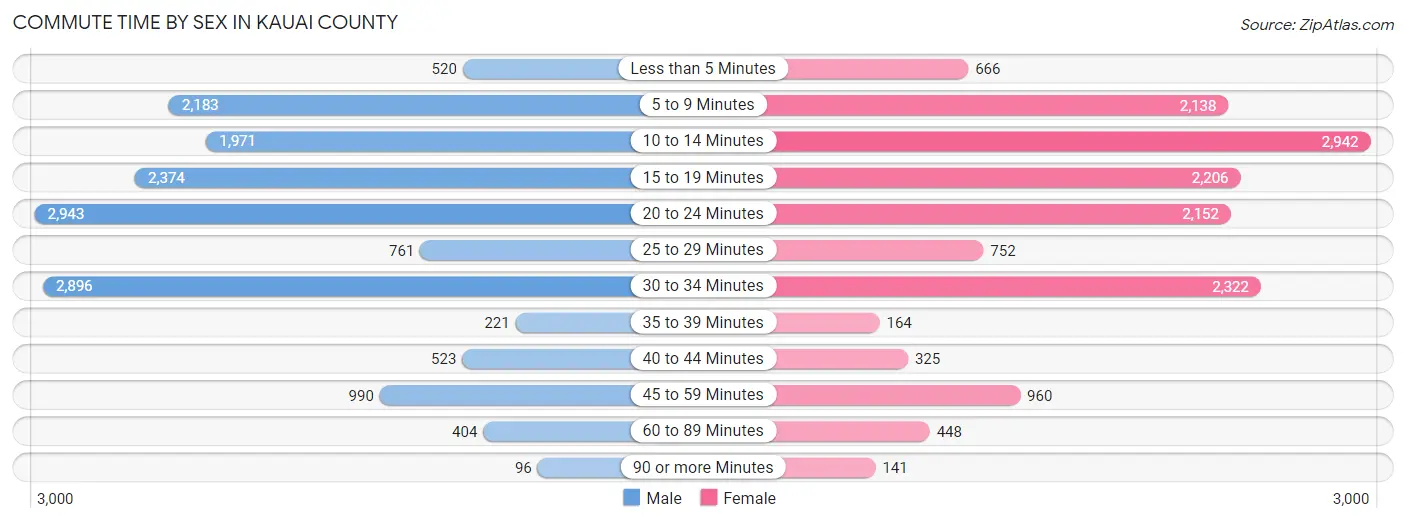
| Commute Time | Male | Female |
| Less than 5 Minutes | 520 (3.3%) | 666 (4.4%) |
| 5 to 9 Minutes | 2,183 (13.8%) | 2,138 (14.1%) |
| 10 to 14 Minutes | 1,971 (12.4%) | 2,942 (19.3%) |
| 15 to 19 Minutes | 2,374 (14.9%) | 2,206 (14.5%) |
| 20 to 24 Minutes | 2,943 (18.5%) | 2,152 (14.1%) |
| 25 to 29 Minutes | 761 (4.8%) | 752 (4.9%) |
| 30 to 34 Minutes | 2,896 (18.2%) | 2,322 (15.3%) |
| 35 to 39 Minutes | 221 (1.4%) | 164 (1.1%) |
| 40 to 44 Minutes | 523 (3.3%) | 325 (2.1%) |
| 45 to 59 Minutes | 990 (6.2%) | 960 (6.3%) |
| 60 to 89 Minutes | 404 (2.5%) | 448 (2.9%) |
| 90 or more Minutes | 96 (0.6%) | 141 (0.9%) |
Time of Departure to Work by Sex in Kauai County
The most frequent times of departure to work in Kauai County are 7:00 AM to 7:29 AM (2,562, 16.1%) for males and 7:00 AM to 7:29 AM (2,875, 18.9%) for females.
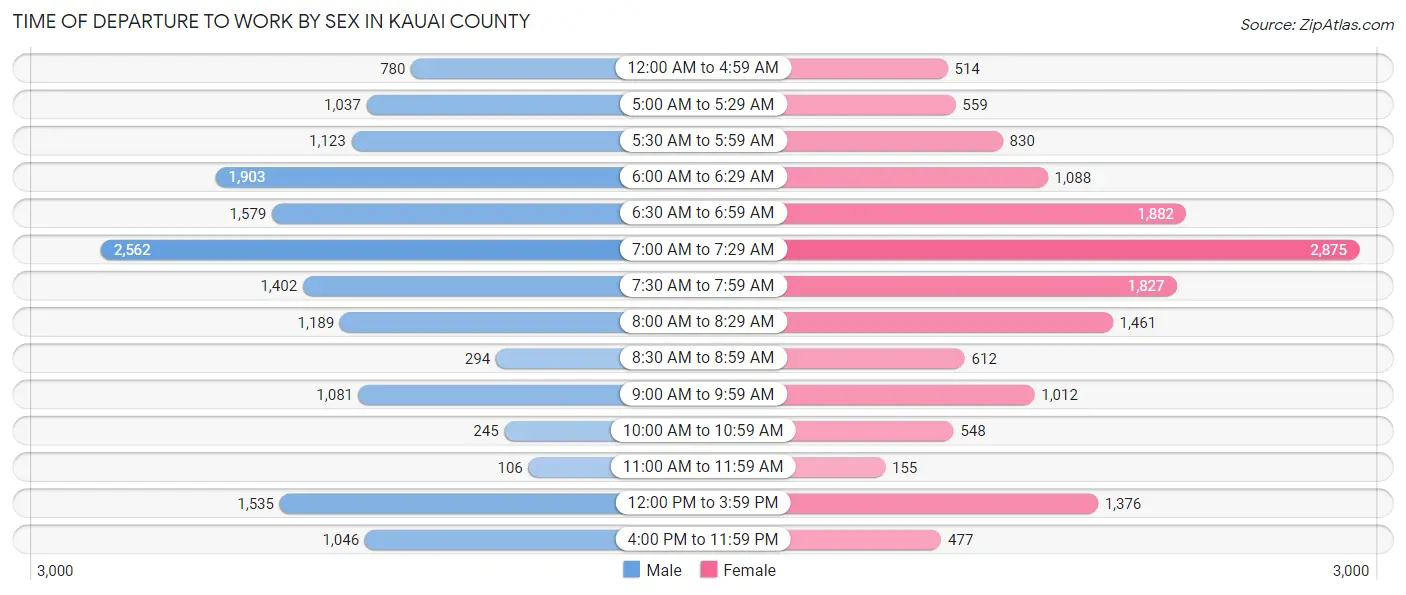
| Time of Departure | Male | Female |
| 12:00 AM to 4:59 AM | 780 (4.9%) | 514 (3.4%) |
| 5:00 AM to 5:29 AM | 1,037 (6.5%) | 559 (3.7%) |
| 5:30 AM to 5:59 AM | 1,123 (7.1%) | 830 (5.4%) |
| 6:00 AM to 6:29 AM | 1,903 (12.0%) | 1,088 (7.1%) |
| 6:30 AM to 6:59 AM | 1,579 (9.9%) | 1,882 (12.4%) |
| 7:00 AM to 7:29 AM | 2,562 (16.1%) | 2,875 (18.9%) |
| 7:30 AM to 7:59 AM | 1,402 (8.8%) | 1,827 (12.0%) |
| 8:00 AM to 8:29 AM | 1,189 (7.5%) | 1,461 (9.6%) |
| 8:30 AM to 8:59 AM | 294 (1.8%) | 612 (4.0%) |
| 9:00 AM to 9:59 AM | 1,081 (6.8%) | 1,012 (6.7%) |
| 10:00 AM to 10:59 AM | 245 (1.5%) | 548 (3.6%) |
| 11:00 AM to 11:59 AM | 106 (0.7%) | 155 (1.0%) |
| 12:00 PM to 3:59 PM | 1,535 (9.7%) | 1,376 (9.0%) |
| 4:00 PM to 11:59 PM | 1,046 (6.6%) | 477 (3.1%) |
| Total | 15,882 (100.0%) | 15,216 (100.0%) |
Housing Occupancy in Kauai County
Occupancy by Ownership in Kauai County
Of the total 22,978 dwellings in Kauai County, owner-occupied units account for 14,896 (64.8%), while renter-occupied units make up 8,082 (35.2%).
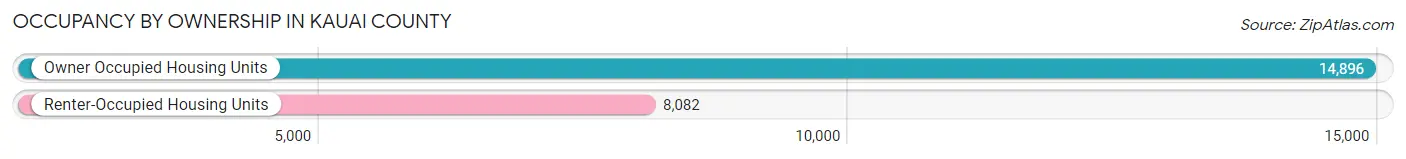
| Occupancy | # Housing Units | % Housing Units |
| Owner Occupied Housing Units | 14,896 | 64.8% |
| Renter-Occupied Housing Units | 8,082 | 35.2% |
| Total Occupied Housing Units | 22,978 | 100.0% |
Occupancy by Household Size in Kauai County
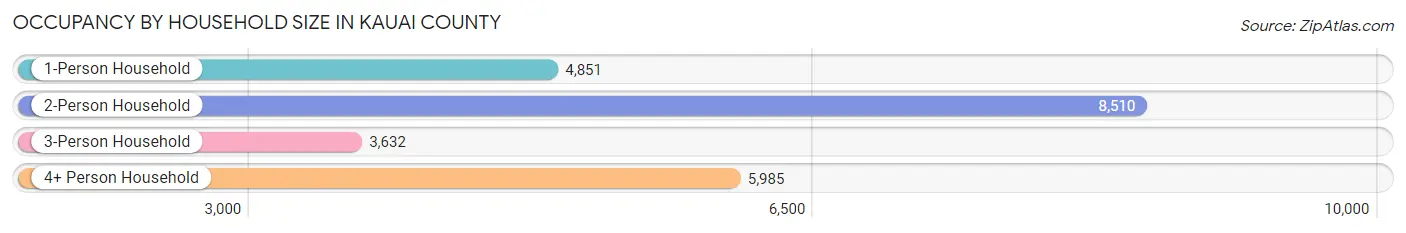
| Household Size | # Housing Units | % Housing Units |
| 1-Person Household | 4,851 | 21.1% |
| 2-Person Household | 8,510 | 37.0% |
| 3-Person Household | 3,632 | 15.8% |
| 4+ Person Household | 5,985 | 26.1% |
| Total Housing Units | 22,978 | 100.0% |
Occupancy by Ownership by Household Size in Kauai County
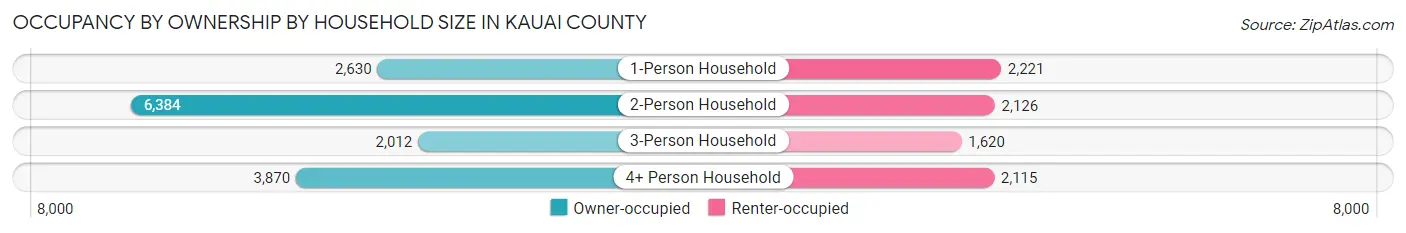
| Household Size | Owner-occupied | Renter-occupied |
| 1-Person Household | 2,630 (54.2%) | 2,221 (45.8%) |
| 2-Person Household | 6,384 (75.0%) | 2,126 (25.0%) |
| 3-Person Household | 2,012 (55.4%) | 1,620 (44.6%) |
| 4+ Person Household | 3,870 (64.7%) | 2,115 (35.3%) |
| Total Housing Units | 14,896 (64.8%) | 8,082 (35.2%) |
Occupancy by Educational Attainment in Kauai County
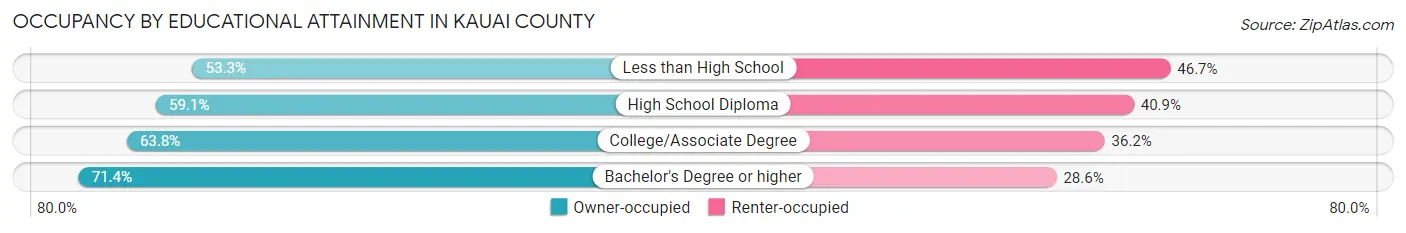
| Household Size | Owner-occupied | Renter-occupied |
| Less than High School | 774 (53.3%) | 677 (46.7%) |
| High School Diploma | 3,050 (59.1%) | 2,107 (40.9%) |
| College/Associate Degree | 5,149 (63.8%) | 2,926 (36.2%) |
| Bachelor's Degree or higher | 5,923 (71.4%) | 2,372 (28.6%) |
Occupancy by Age of Householder in Kauai County
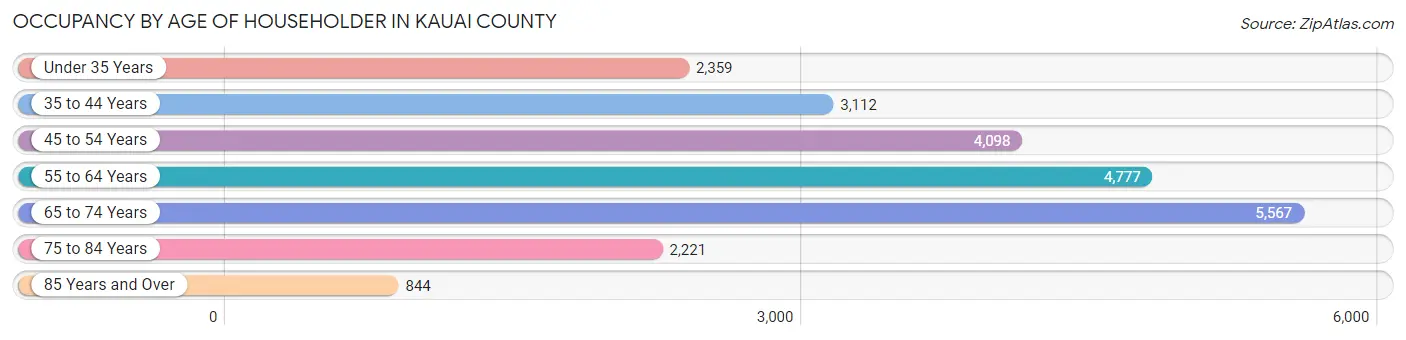
| Age Bracket | # Households | % Households |
| Under 35 Years | 2,359 | 10.3% |
| 35 to 44 Years | 3,112 | 13.5% |
| 45 to 54 Years | 4,098 | 17.8% |
| 55 to 64 Years | 4,777 | 20.8% |
| 65 to 74 Years | 5,567 | 24.2% |
| 75 to 84 Years | 2,221 | 9.7% |
| 85 Years and Over | 844 | 3.7% |
| Total | 22,978 | 100.0% |
Housing Finances in Kauai County
Median Income by Occupancy in Kauai County
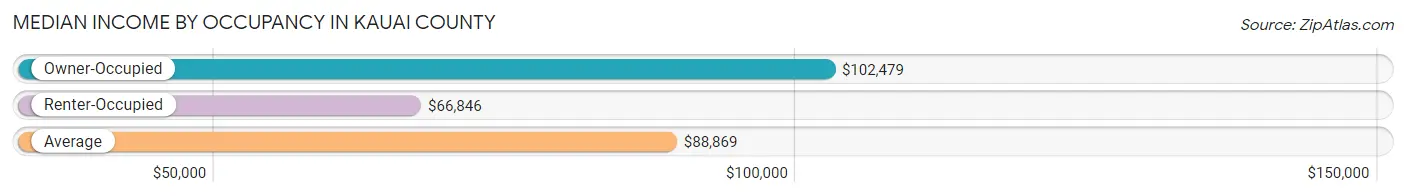
| Occupancy Type | # Households | Median Income |
| Owner-Occupied | 14,896 (64.8%) | $102,479 |
| Renter-Occupied | 8,082 (35.2%) | $66,846 |
| Average | 22,978 (100.0%) | $88,869 |
Occupancy by Householder Income Bracket in Kauai County
| Income Bracket | Owner-occupied | Renter-occupied |
| Less than $5,000 | 491 (3.3%) | 166 (2.1%) |
| $5,000 to $9,999 | 144 (1.0%) | 280 (3.5%) |
| $10,000 to $14,999 | 230 (1.5%) | 255 (3.2%) |
| $15,000 to $19,999 | 308 (2.1%) | 227 (2.8%) |
| $20,000 to $24,999 | 239 (1.6%) | 348 (4.3%) |
| $25,000 to $34,999 | 693 (4.6%) | 733 (9.1%) |
| $35,000 to $49,999 | 921 (6.2%) | 886 (11.0%) |
| $50,000 to $74,999 | 2,417 (16.2%) | 1,471 (18.2%) |
| $75,000 to $99,999 | 1,772 (11.9%) | 1,108 (13.7%) |
| $100,000 to $149,999 | 3,264 (21.9%) | 1,469 (18.2%) |
| $150,000 or more | 4,417 (29.6%) | 1,139 (14.1%) |
| Total | 14,896 (100.0%) | 8,082 (100.0%) |
Monthly Housing Cost Tiers in Kauai County
| Monthly Cost | Owner-occupied | Renter-occupied |
| Less than $300 | 597 (4.0%) | 89 (1.1%) |
| $300 to $499 | 2,012 (13.5%) | 147 (1.8%) |
| $500 to $799 | 2,058 (13.8%) | 526 (6.5%) |
| $800 to $999 | 813 (5.5%) | 557 (6.9%) |
| $1,000 to $1,499 | 1,549 (10.4%) | 1,523 (18.8%) |
| $1,500 to $1,999 | 1,438 (9.7%) | 1,922 (23.8%) |
| $2,000 to $2,499 | 1,451 (9.7%) | 1,124 (13.9%) |
| $2,500 to $2,999 | 1,764 (11.8%) | 535 (6.6%) |
| $3,000 or more | 3,214 (21.6%) | 689 (8.5%) |
| Total | 14,896 (100.0%) | 8,082 (100.0%) |
Physical Housing Characteristics in Kauai County
Housing Structures in Kauai County
| Structure Type | # Housing Units | % Housing Units |
| Single Unit, Detached | 17,757 | 77.3% |
| Single Unit, Attached | 1,742 | 7.6% |
| 2 Unit Apartments | 629 | 2.7% |
| 3 or 4 Unit Apartments | 820 | 3.6% |
| 5 to 9 Unit Apartments | 634 | 2.8% |
| 10 or more Apartments | 1,345 | 5.9% |
| Mobile Home / Other | 51 | 0.2% |
| Total | 22,978 | 100.0% |
Housing Structures by Occupancy in Kauai County
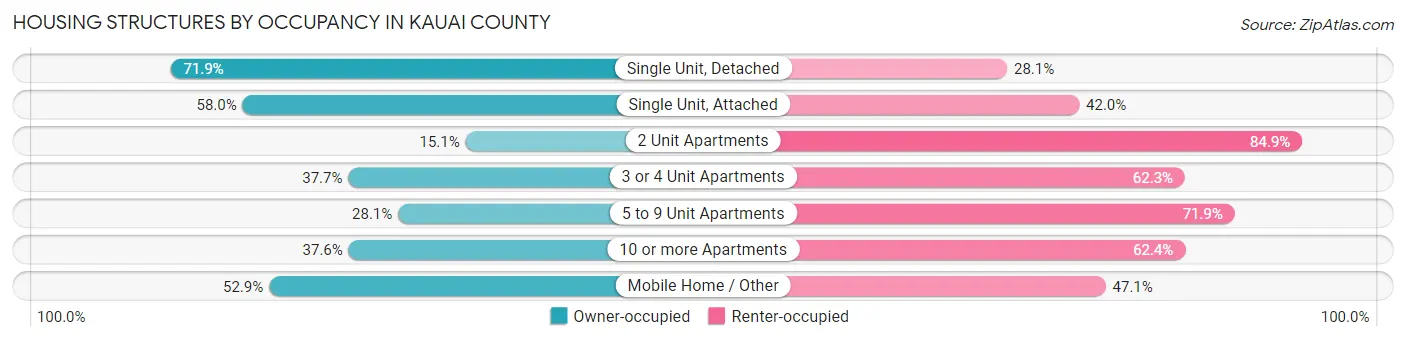
| Structure Type | Owner-occupied | Renter-occupied |
| Single Unit, Detached | 12,770 (71.9%) | 4,987 (28.1%) |
| Single Unit, Attached | 1,011 (58.0%) | 731 (42.0%) |
| 2 Unit Apartments | 95 (15.1%) | 534 (84.9%) |
| 3 or 4 Unit Apartments | 309 (37.7%) | 511 (62.3%) |
| 5 to 9 Unit Apartments | 178 (28.1%) | 456 (71.9%) |
| 10 or more Apartments | 506 (37.6%) | 839 (62.4%) |
| Mobile Home / Other | 27 (52.9%) | 24 (47.1%) |
| Total | 14,896 (64.8%) | 8,082 (35.2%) |
Housing Structures by Number of Rooms in Kauai County
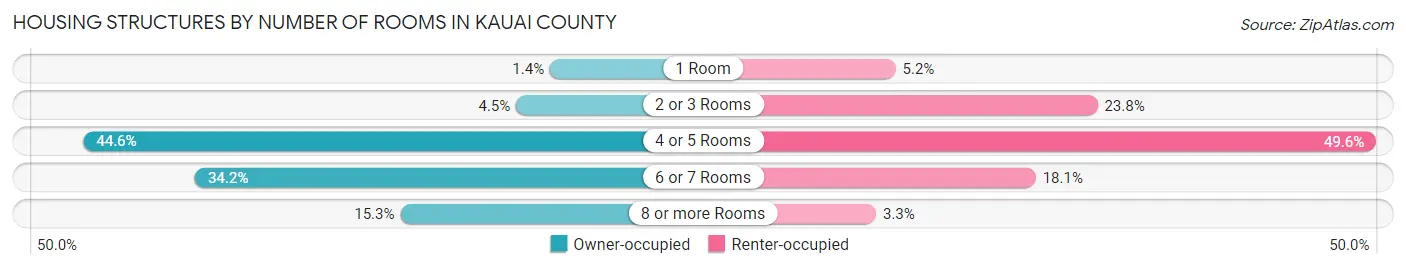
| Number of Rooms | Owner-occupied | Renter-occupied |
| 1 Room | 210 (1.4%) | 416 (5.1%) |
| 2 or 3 Rooms | 676 (4.5%) | 1,925 (23.8%) |
| 4 or 5 Rooms | 6,638 (44.6%) | 4,007 (49.6%) |
| 6 or 7 Rooms | 5,100 (34.2%) | 1,464 (18.1%) |
| 8 or more Rooms | 2,272 (15.2%) | 270 (3.3%) |
| Total | 14,896 (100.0%) | 8,082 (100.0%) |
Housing Structure by Heating Type in Kauai County
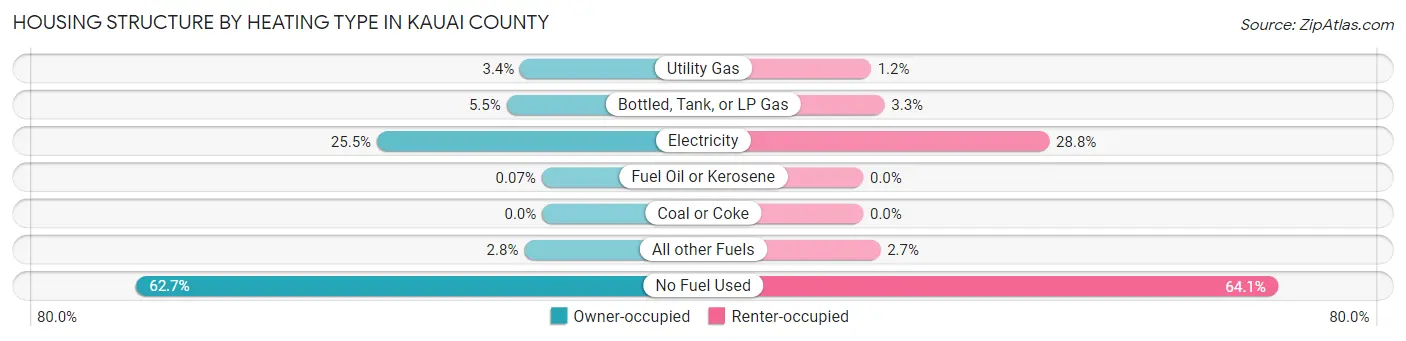
| Heating Type | Owner-occupied | Renter-occupied |
| Utility Gas | 507 (3.4%) | 96 (1.2%) |
| Bottled, Tank, or LP Gas | 818 (5.5%) | 266 (3.3%) |
| Electricity | 3,805 (25.5%) | 2,325 (28.8%) |
| Fuel Oil or Kerosene | 10 (0.1%) | 0 (0.0%) |
| Coal or Coke | 0 (0.0%) | 0 (0.0%) |
| All other Fuels | 411 (2.8%) | 215 (2.7%) |
| No Fuel Used | 9,345 (62.7%) | 5,180 (64.1%) |
| Total | 14,896 (100.0%) | 8,082 (100.0%) |
Household Vehicle Usage in Kauai County
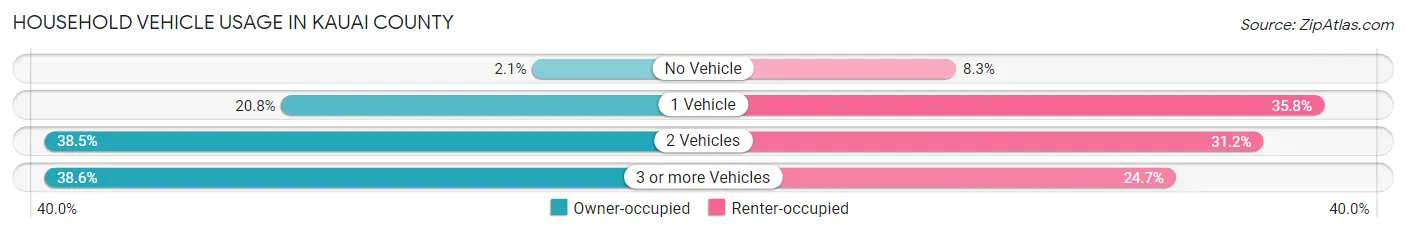
| Vehicles per Household | Owner-occupied | Renter-occupied |
| No Vehicle | 312 (2.1%) | 671 (8.3%) |
| 1 Vehicle | 3,101 (20.8%) | 2,890 (35.8%) |
| 2 Vehicles | 5,741 (38.5%) | 2,525 (31.2%) |
| 3 or more Vehicles | 5,742 (38.6%) | 1,996 (24.7%) |
| Total | 14,896 (100.0%) | 8,082 (100.0%) |
Real Estate & Mortgages in Kauai County
Real Estate and Mortgage Overview in Kauai County
| Characteristic | Without Mortgage | With Mortgage |
| Housing Units | 6,110 | 8,786 |
| Median Property Value | $745,800 | $741,100 |
| Median Household Income | $87,959 | $3,079 |
| Monthly Housing Costs | $572 | $3,177 |
| Real Estate Taxes | $1,484 | $388 |
Property Value by Mortgage Status in Kauai County
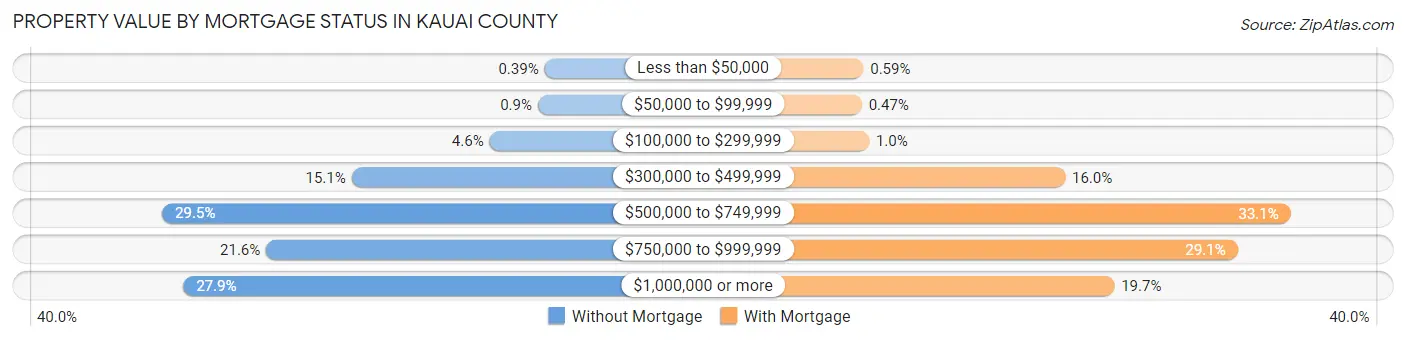
| Property Value | Without Mortgage | With Mortgage |
| Less than $50,000 | 24 (0.4%) | 52 (0.6%) |
| $50,000 to $99,999 | 55 (0.9%) | 41 (0.5%) |
| $100,000 to $299,999 | 280 (4.6%) | 90 (1.0%) |
| $300,000 to $499,999 | 922 (15.1%) | 1,402 (16.0%) |
| $500,000 to $749,999 | 1,804 (29.5%) | 2,912 (33.1%) |
| $750,000 to $999,999 | 1,320 (21.6%) | 2,557 (29.1%) |
| $1,000,000 or more | 1,705 (27.9%) | 1,732 (19.7%) |
| Total | 6,110 (100.0%) | 8,786 (100.0%) |
Household Income by Mortgage Status in Kauai County
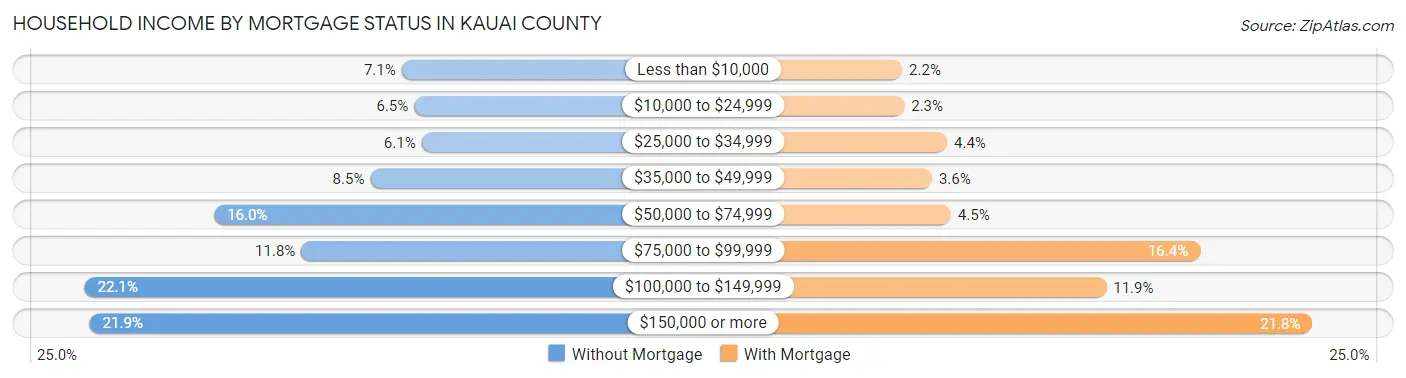
| Household Income | Without Mortgage | With Mortgage |
| Less than $10,000 | 431 (7.0%) | 195 (2.2%) |
| $10,000 to $24,999 | 394 (6.5%) | 204 (2.3%) |
| $25,000 to $34,999 | 373 (6.1%) | 383 (4.4%) |
| $35,000 to $49,999 | 522 (8.5%) | 320 (3.6%) |
| $50,000 to $74,999 | 976 (16.0%) | 399 (4.5%) |
| $75,000 to $99,999 | 723 (11.8%) | 1,441 (16.4%) |
| $100,000 to $149,999 | 1,353 (22.1%) | 1,049 (11.9%) |
| $150,000 or more | 1,338 (21.9%) | 1,911 (21.7%) |
| Total | 6,110 (100.0%) | 8,786 (100.0%) |
Property Value to Household Income Ratio in Kauai County
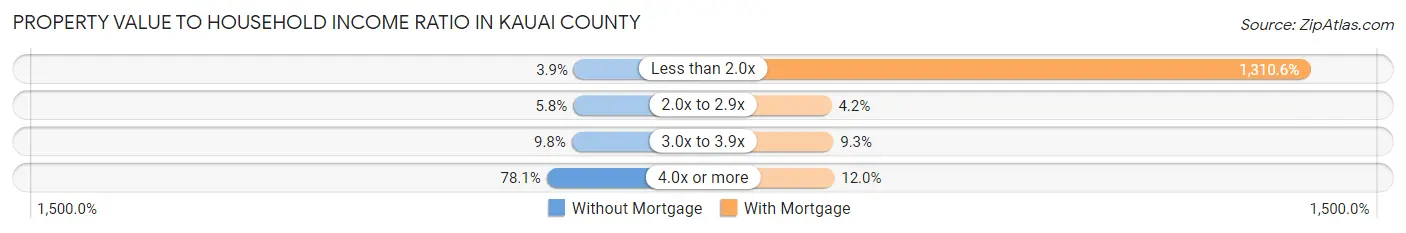
| Value-to-Income Ratio | Without Mortgage | With Mortgage |
| Less than 2.0x | 236 (3.9%) | 115,153 (1,310.6%) |
| 2.0x to 2.9x | 352 (5.8%) | 370 (4.2%) |
| 3.0x to 3.9x | 596 (9.8%) | 813 (9.2%) |
| 4.0x or more | 4,769 (78.0%) | 1,052 (12.0%) |
| Total | 6,110 (100.0%) | 8,786 (100.0%) |
Real Estate Taxes by Mortgage Status in Kauai County
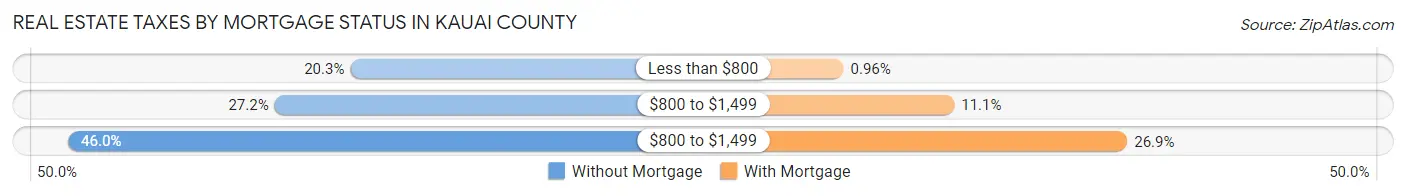
| Property Taxes | Without Mortgage | With Mortgage |
| Less than $800 | 1,238 (20.3%) | 84 (1.0%) |
| $800 to $1,499 | 1,661 (27.2%) | 973 (11.1%) |
| $800 to $1,499 | 2,812 (46.0%) | 2,361 (26.9%) |
| Total | 6,110 (100.0%) | 8,786 (100.0%) |
Health & Disability in Kauai County
Health Insurance Coverage by Age in Kauai County
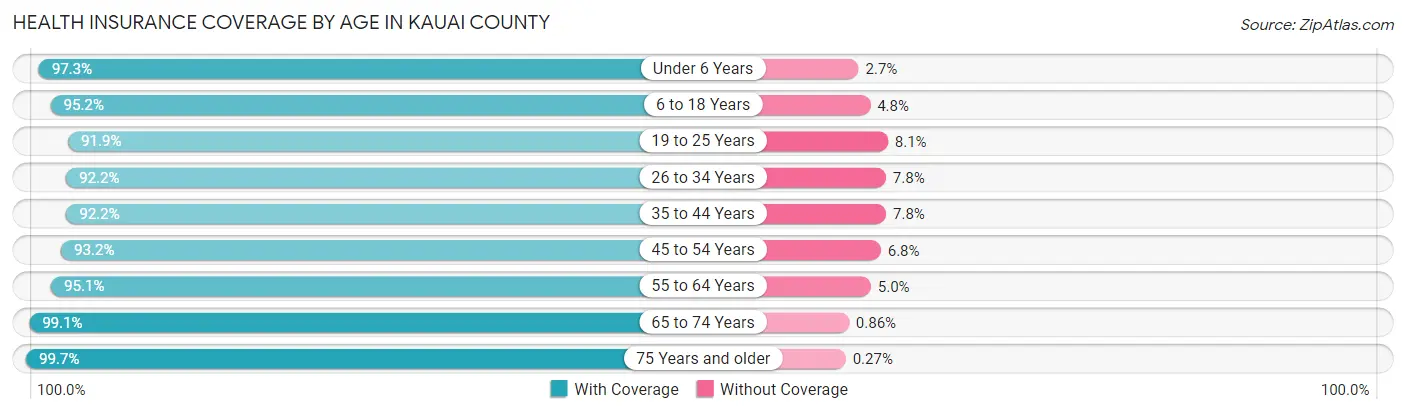
| Age Bracket | With Coverage | Without Coverage |
| Under 6 Years | 4,654 (97.3%) | 127 (2.7%) |
| 6 to 18 Years | 11,561 (95.2%) | 588 (4.8%) |
| 19 to 25 Years | 4,207 (91.9%) | 372 (8.1%) |
| 26 to 34 Years | 7,068 (92.2%) | 595 (7.8%) |
| 35 to 44 Years | 8,651 (92.2%) | 731 (7.8%) |
| 45 to 54 Years | 8,274 (93.2%) | 604 (6.8%) |
| 55 to 64 Years | 9,551 (95.1%) | 497 (5.0%) |
| 65 to 74 Years | 9,245 (99.1%) | 80 (0.9%) |
| 75 Years and older | 5,907 (99.7%) | 16 (0.3%) |
| Total | 69,118 (95.0%) | 3,610 (5.0%) |
Health Insurance Coverage by Citizenship Status in Kauai County
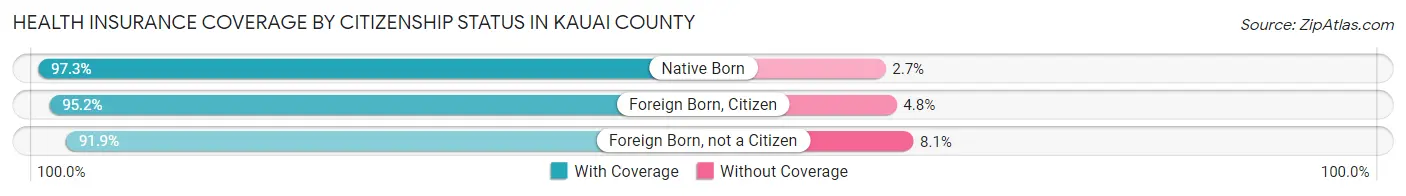
| Citizenship Status | With Coverage | Without Coverage |
| Native Born | 4,654 (97.3%) | 127 (2.7%) |
| Foreign Born, Citizen | 11,561 (95.2%) | 588 (4.8%) |
| Foreign Born, not a Citizen | 4,207 (91.9%) | 372 (8.1%) |
Health Insurance Coverage by Household Income in Kauai County
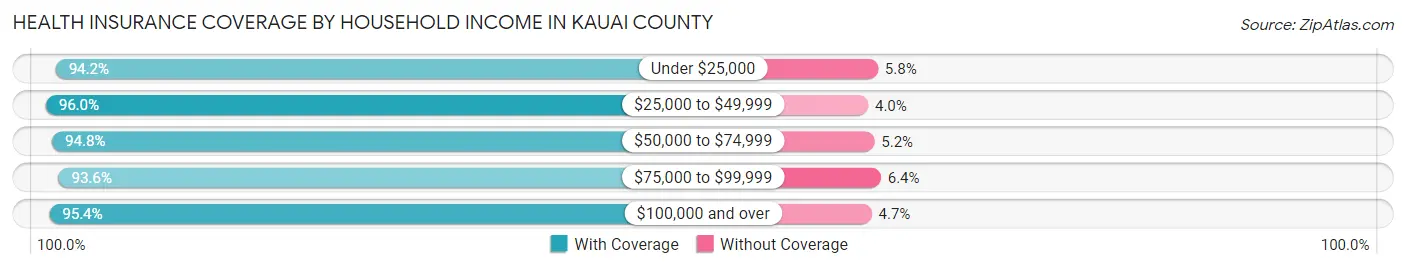
| Household Income | With Coverage | Without Coverage |
| Under $25,000 | 4,429 (94.2%) | 274 (5.8%) |
| $25,000 to $49,999 | 6,997 (96.0%) | 290 (4.0%) |
| $50,000 to $74,999 | 9,987 (94.8%) | 544 (5.2%) |
| $75,000 to $99,999 | 8,834 (93.6%) | 601 (6.4%) |
| $100,000 and over | 38,650 (95.4%) | 1,884 (4.6%) |
Public vs Private Health Insurance Coverage by Age in Kauai County
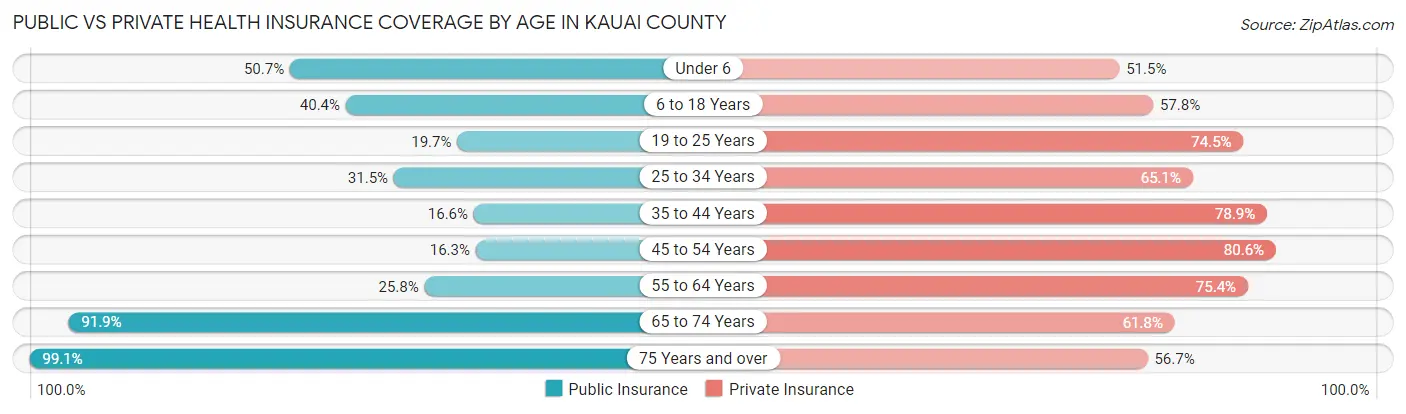
| Age Bracket | Public Insurance | Private Insurance |
| Under 6 | 2,426 (50.7%) | 2,462 (51.5%) |
| 6 to 18 Years | 4,905 (40.4%) | 7,017 (57.8%) |
| 19 to 25 Years | 901 (19.7%) | 3,413 (74.5%) |
| 25 to 34 Years | 2,410 (31.5%) | 4,992 (65.1%) |
| 35 to 44 Years | 1,558 (16.6%) | 7,406 (78.9%) |
| 45 to 54 Years | 1,443 (16.3%) | 7,153 (80.6%) |
| 55 to 64 Years | 2,589 (25.8%) | 7,573 (75.4%) |
| 65 to 74 Years | 8,567 (91.9%) | 5,762 (61.8%) |
| 75 Years and over | 5,870 (99.1%) | 3,361 (56.7%) |
| Total | 30,669 (42.2%) | 49,139 (67.6%) |
Disability Status by Sex by Age in Kauai County
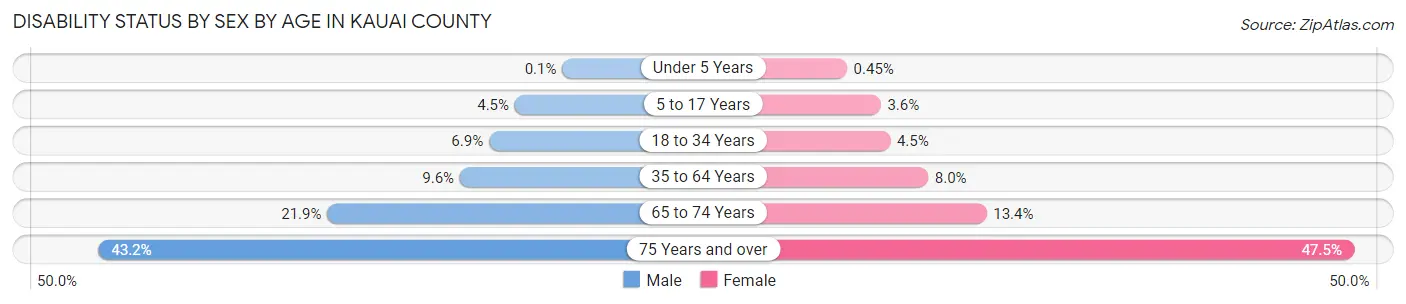
| Age Bracket | Male | Female |
| Under 5 Years | 2 (0.1%) | 9 (0.4%) |
| 5 to 17 Years | 280 (4.5%) | 197 (3.6%) |
| 18 to 34 Years | 466 (6.9%) | 296 (4.5%) |
| 35 to 64 Years | 1,360 (9.6%) | 1,130 (8.0%) |
| 65 to 74 Years | 1,019 (21.9%) | 627 (13.4%) |
| 75 Years and over | 1,067 (43.1%) | 1,639 (47.5%) |
Disability Class by Sex by Age in Kauai County
Disability Class: Hearing Difficulty
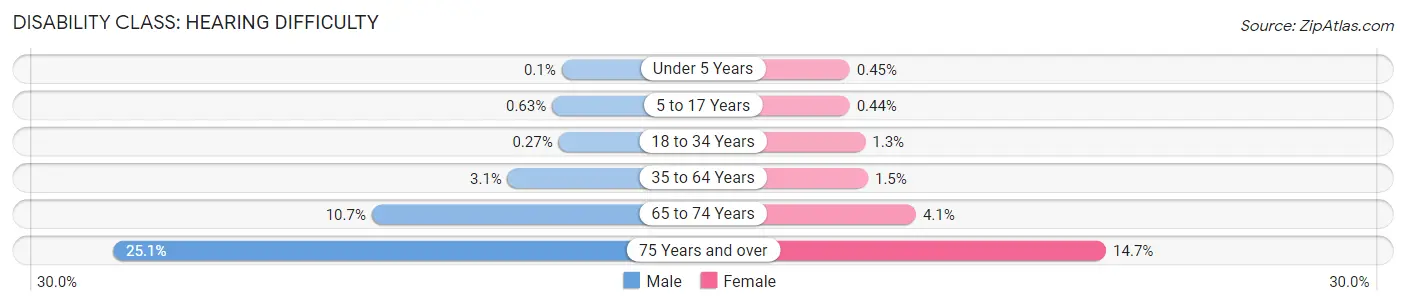
| Age Bracket | Male | Female |
| Under 5 Years | 2 (0.1%) | 9 (0.4%) |
| 5 to 17 Years | 39 (0.6%) | 24 (0.4%) |
| 18 to 34 Years | 18 (0.3%) | 87 (1.3%) |
| 35 to 64 Years | 439 (3.1%) | 207 (1.5%) |
| 65 to 74 Years | 496 (10.7%) | 193 (4.1%) |
| 75 Years and over | 620 (25.1%) | 508 (14.7%) |
Disability Class: Vision Difficulty
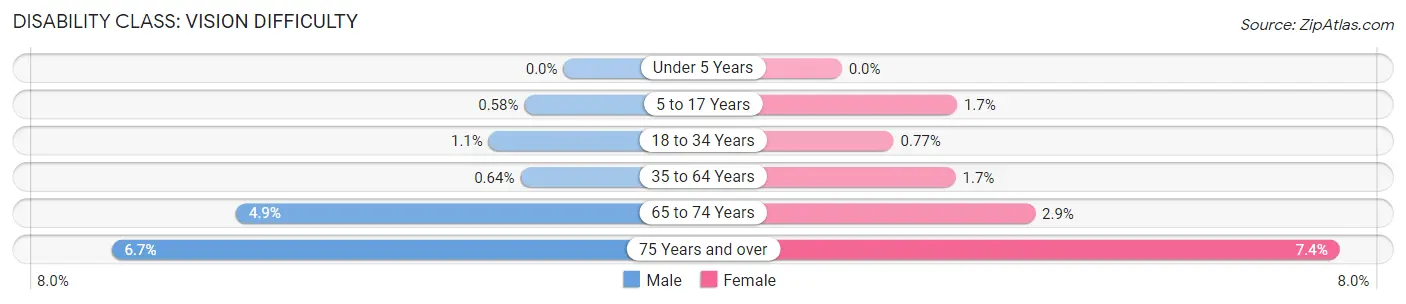
| Age Bracket | Male | Female |
| Under 5 Years | 0 (0.0%) | 0 (0.0%) |
| 5 to 17 Years | 36 (0.6%) | 94 (1.7%) |
| 18 to 34 Years | 75 (1.1%) | 51 (0.8%) |
| 35 to 64 Years | 91 (0.6%) | 239 (1.7%) |
| 65 to 74 Years | 226 (4.9%) | 134 (2.9%) |
| 75 Years and over | 166 (6.7%) | 255 (7.4%) |
Disability Class: Cognitive Difficulty
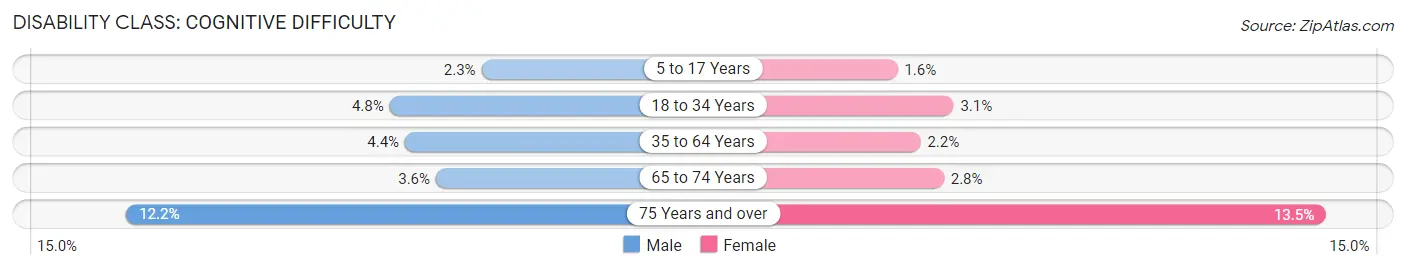
| Age Bracket | Male | Female |
| 5 to 17 Years | 142 (2.3%) | 85 (1.5%) |
| 18 to 34 Years | 327 (4.8%) | 206 (3.1%) |
| 35 to 64 Years | 625 (4.4%) | 309 (2.2%) |
| 65 to 74 Years | 165 (3.5%) | 133 (2.8%) |
| 75 Years and over | 301 (12.2%) | 465 (13.5%) |
Disability Class: Ambulatory Difficulty
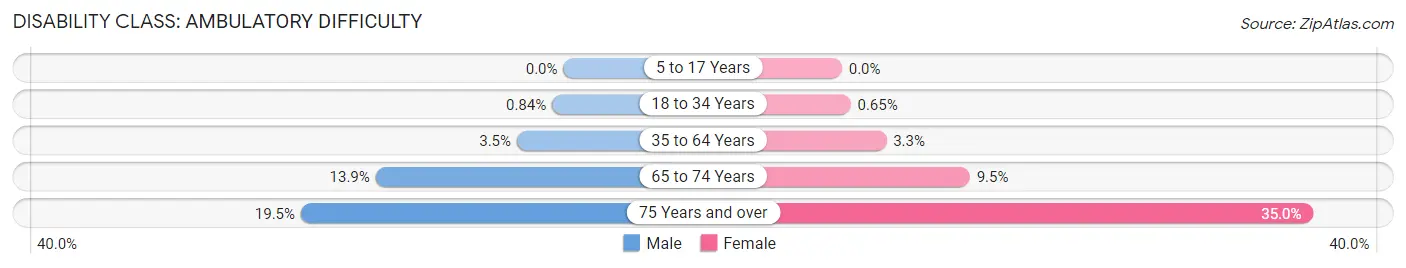
| Age Bracket | Male | Female |
| 5 to 17 Years | 0 (0.0%) | 0 (0.0%) |
| 18 to 34 Years | 57 (0.8%) | 43 (0.6%) |
| 35 to 64 Years | 489 (3.5%) | 466 (3.3%) |
| 65 to 74 Years | 648 (13.9%) | 444 (9.5%) |
| 75 Years and over | 482 (19.5%) | 1,208 (35.0%) |
Disability Class: Self-Care Difficulty
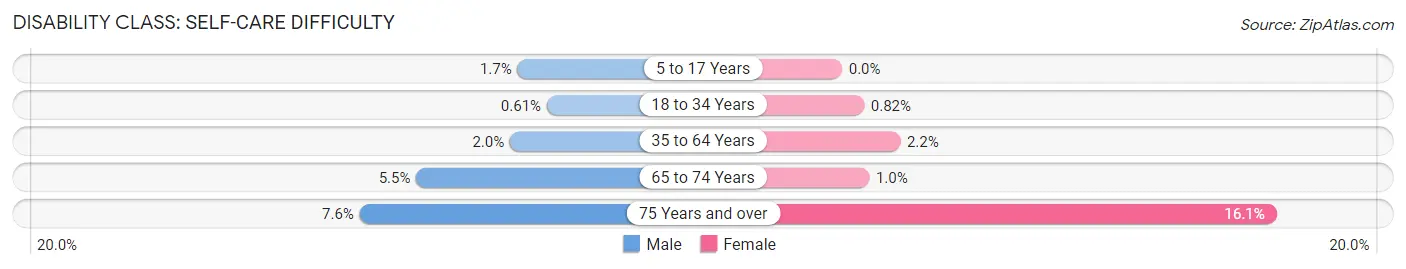
| Age Bracket | Male | Female |
| 5 to 17 Years | 106 (1.7%) | 0 (0.0%) |
| 18 to 34 Years | 41 (0.6%) | 54 (0.8%) |
| 35 to 64 Years | 280 (2.0%) | 306 (2.2%) |
| 65 to 74 Years | 254 (5.5%) | 47 (1.0%) |
| 75 Years and over | 187 (7.6%) | 557 (16.1%) |
Technology Access in Kauai County
Computing Device Access in Kauai County
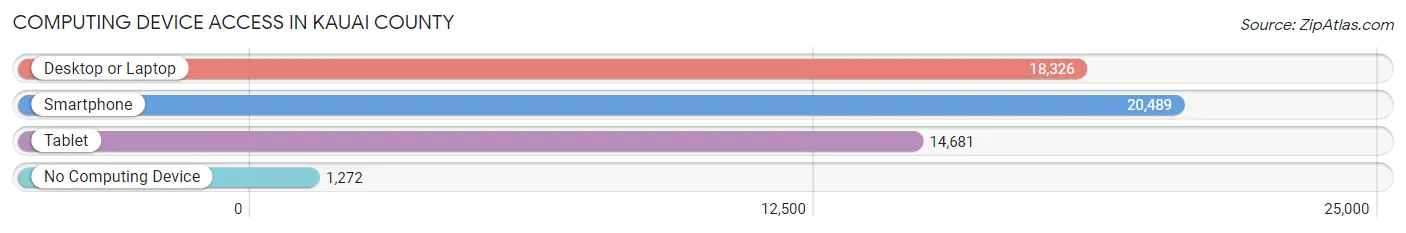
| Device Type | # Households | % Households |
| Desktop or Laptop | 18,326 | 79.7% |
| Smartphone | 20,489 | 89.2% |
| Tablet | 14,681 | 63.9% |
| No Computing Device | 1,272 | 5.5% |
| Total | 22,978 | 100.0% |
Internet Access in Kauai County
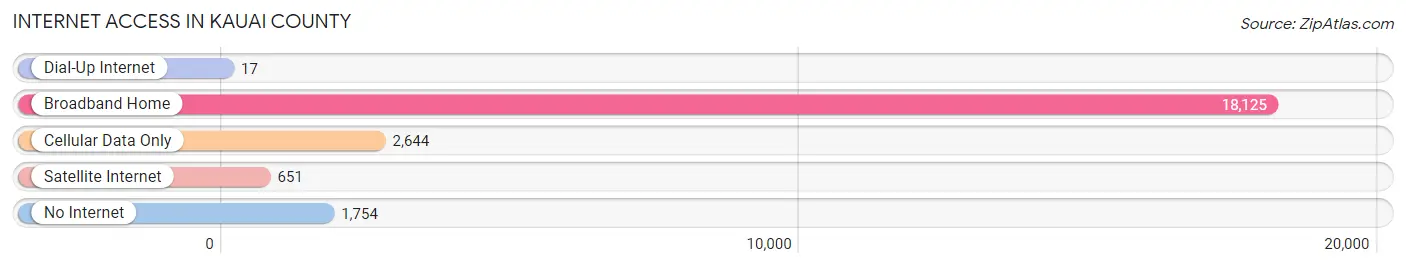
| Internet Type | # Households | % Households |
| Dial-Up Internet | 17 | 0.1% |
| Broadband Home | 18,125 | 78.9% |
| Cellular Data Only | 2,644 | 11.5% |
| Satellite Internet | 651 | 2.8% |
| No Internet | 1,754 | 7.6% |
| Total | 22,978 | 100.0% |
Kauai County Summary
Kauai County, Hawaii is located on the island of Kauai, the fourth largest of the Hawaiian Islands. It is the northernmost of the main Hawaiian Islands and is the oldest of the main islands. Kauai County is the only county in the state of Hawaii that is not part of the City and County of Honolulu. The county seat is Lihue, and the population was 67,091 as of the 2010 census.
Geography
Kauai County is located on the island of Kauai, which is the fourth largest of the Hawaiian Islands. The island is approximately 33 miles long and 25 miles wide, with a total area of 552 square miles. The island is surrounded by the Pacific Ocean and is located approximately 100 miles northwest of Oahu. The terrain of the island is mostly mountainous, with the highest peak being Mount Wai’ale’ale at 5,148 feet. The island is home to numerous rivers, waterfalls, and beaches.
History
Kauai County was established in 1905, when the Territory of Hawaii was created. The county was named after the island of Kauai, which was named after the Hawaiian god of creation, Kaua’i. The island has been inhabited for thousands of years, and was first visited by Europeans in 1778. The island was a major center of the whaling industry in the 19th century, and was also a major center of the sugar industry in the late 19th and early 20th centuries.
Economy
Kauai County’s economy is largely based on tourism, with the island being a popular destination for visitors from around the world. The county is also home to several large agricultural operations, including the Kauai Coffee Company, the largest coffee producer in the United States. Other major industries in the county include construction, retail, and health care.
Demographics
As of the 2010 census, Kauai County had a population of 67,091. The population is composed of a variety of ethnicities, including Native Hawaiian (25.3%), White (21.2%), Filipino (17.2%), Japanese (14.2%), and Chinese (4.2%). The median household income in the county is $63,945, and the median age is 44.7 years.
Kauai County is a beautiful and diverse place, with a rich history and a vibrant economy. The county is home to a variety of cultures and ethnicities, and is a popular destination for tourists from around the world. The county is also home to several large agricultural operations, and is a major center of the coffee and sugar industries. With its stunning natural beauty and vibrant culture, Kauai County is a great place to live and visit.
Common Questions
What is Per Capita Income in Kauai County?
Per Capita income in Kauai County is $39,372.
What is the Median Family Income in Kauai County?
Median Family Income in Kauai County is $102,083.
What is the Median Household income in Kauai County?
Median Household Income in Kauai County is $88,869.
What is Income or Wage Gap in Kauai County?
Income or Wage Gap in Kauai County is 26.4%.
Women in Kauai County earn 73.6 cents for every dollar earned by a man.
What is Family Income Deficit in Kauai County?
Family Income Deficit in Kauai County is $10,784.
Families that are below poverty line in Kauai County earn $10,784 less on average than the poverty threshold level.
What is Inequality or Gini Index in Kauai County?
Inequality or Gini Index in Kauai County is 0.44.
What is the Total Population of Kauai County?
Total Population of Kauai County is 73,511.
What is the Total Male Population of Kauai County?
Total Male Population of Kauai County is 36,809.
What is the Total Female Population of Kauai County?
Total Female Population of Kauai County is 36,702.
What is the Ratio of Males per 100 Females in Kauai County?
There are 100.29 Males per 100 Females in Kauai County.
What is the Ratio of Females per 100 Males in Kauai County?
There are 99.71 Females per 100 Males in Kauai County.
What is the Median Population Age in Kauai County?
Median Population Age in Kauai County is 42.3 Years.
What is the Average Family Size in Kauai County
Average Family Size in Kauai County is 3.7 People.
What is the Average Household Size in Kauai County
Average Household Size in Kauai County is 3.2 People.
How Large is the Labor Force in Kauai County?
There are 37,439 People in the Labor Forcein in Kauai County.
What is the Percentage of People in the Labor Force in Kauai County?
63.3% of People are in the Labor Force in Kauai County.
What is the Unemployment Rate in Kauai County?
Unemployment Rate in Kauai County is 4.1%.