Maui County, HI Map & Demographics
Maui County Map
Maui County Overview
$42,607
PER CAPITA INCOME
$107,660
AVG FAMILY INCOME
$95,379
AVG HOUSEHOLD INCOME
19.1%
WAGE / INCOME GAP [ % ]
80.9¢/ $1
WAGE / INCOME GAP [ $ ]
$10,224
FAMILY INCOME DEFICIT
0.44
INEQUALITY / GINI INDEX
164,765
TOTAL POPULATION
82,304
MALE POPULATION
82,461
FEMALE POPULATION
99.81
MALES / 100 FEMALES
100.19
FEMALES / 100 MALES
42.2
MEDIAN AGE
3.4
AVG FAMILY SIZE
3.0
AVG HOUSEHOLD SIZE
86,873
LABOR FORCE [ PEOPLE ]
65.2%
PERCENT IN LABOR FORCE
5.4%
UNEMPLOYMENT RATE
Maui County Area Codes
Income in Maui County
Income Overview in Maui County
Per Capita Income in Maui County is $42,607, while median incomes of families and households are $107,660 and $95,379 respectively.
| Characteristic | Number | Measure |
| Per Capita Income | 164,765 | $42,607 |
| Median Family Income | 38,935 | $107,660 |
| Mean Family Income | 38,935 | $134,320 |
| Median Household Income | 54,728 | $95,379 |
| Mean Household Income | 54,728 | $124,551 |
| Income Deficit | 38,935 | $10,224 |
| Wage / Income Gap (%) | 164,765 | 19.13% |
| Wage / Income Gap ($) | 164,765 | 80.87¢ per $1 |
| Gini / Inequality Index | 164,765 | 0.44 |
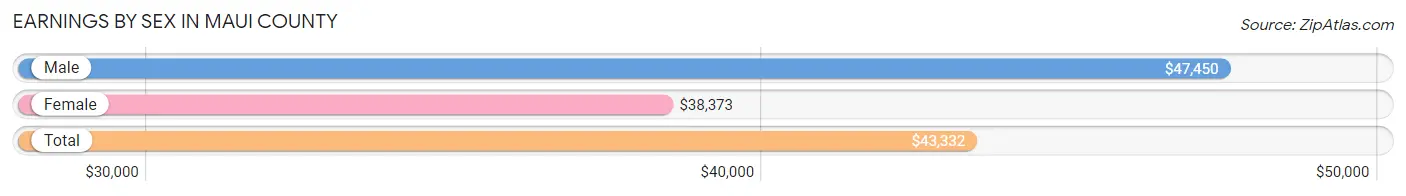
Earnings by Sex in Maui County
Average Earnings in Maui County are $43,332, $47,450 for men and $38,373 for women, a difference of 19.1%.
| Sex | Number | Average Earnings |
| Male | 45,910 (50.7%) | $47,450 |
| Female | 44,592 (49.3%) | $38,373 |
| Total | 90,502 (100.0%) | $43,332 |
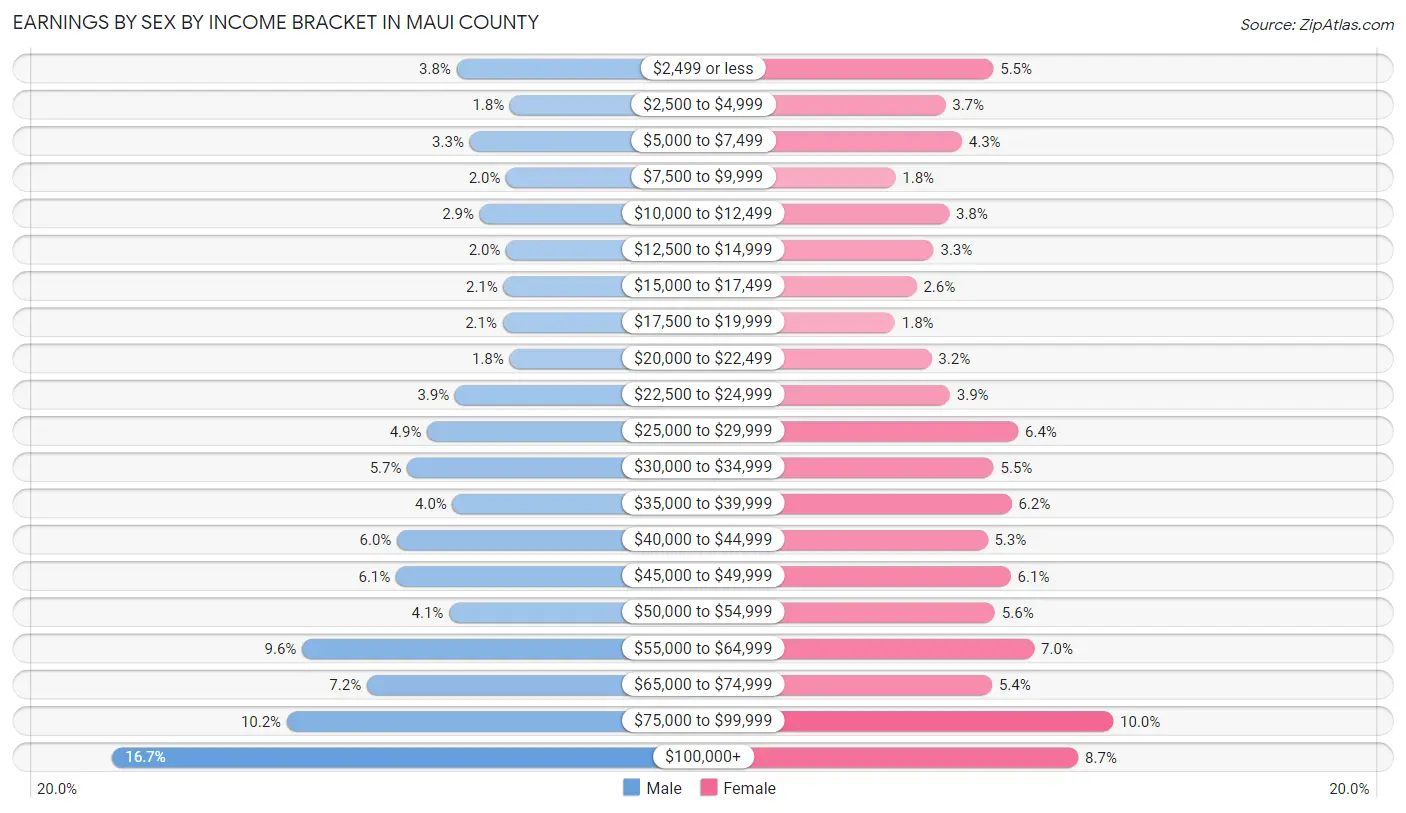
Earnings by Sex by Income Bracket in Maui County
The most common earnings brackets in Maui County are $100,000+ for men (7,670 | 16.7%) and $75,000 to $99,999 for women (4,452 | 10.0%).
| Income | Male | Female |
| $2,499 or less | 1,747 (3.8%) | 2,449 (5.5%) |
| $2,500 to $4,999 | 833 (1.8%) | 1,645 (3.7%) |
| $5,000 to $7,499 | 1,522 (3.3%) | 1,921 (4.3%) |
| $7,500 to $9,999 | 894 (1.9%) | 812 (1.8%) |
| $10,000 to $12,499 | 1,352 (2.9%) | 1,708 (3.8%) |
| $12,500 to $14,999 | 895 (1.9%) | 1,448 (3.3%) |
| $15,000 to $17,499 | 939 (2.1%) | 1,163 (2.6%) |
| $17,500 to $19,999 | 956 (2.1%) | 803 (1.8%) |
| $20,000 to $22,499 | 839 (1.8%) | 1,414 (3.2%) |
| $22,500 to $24,999 | 1,778 (3.9%) | 1,720 (3.9%) |
| $25,000 to $29,999 | 2,252 (4.9%) | 2,864 (6.4%) |
| $30,000 to $34,999 | 2,598 (5.7%) | 2,453 (5.5%) |
| $35,000 to $39,999 | 1,819 (4.0%) | 2,753 (6.2%) |
| $40,000 to $44,999 | 2,773 (6.0%) | 2,349 (5.3%) |
| $45,000 to $49,999 | 2,793 (6.1%) | 2,740 (6.1%) |
| $50,000 to $54,999 | 1,878 (4.1%) | 2,474 (5.6%) |
| $55,000 to $64,999 | 4,409 (9.6%) | 3,130 (7.0%) |
| $65,000 to $74,999 | 3,292 (7.2%) | 2,426 (5.4%) |
| $75,000 to $99,999 | 4,671 (10.2%) | 4,452 (10.0%) |
| $100,000+ | 7,670 (16.7%) | 3,868 (8.7%) |
| Total | 45,910 (100.0%) | 44,592 (100.0%) |
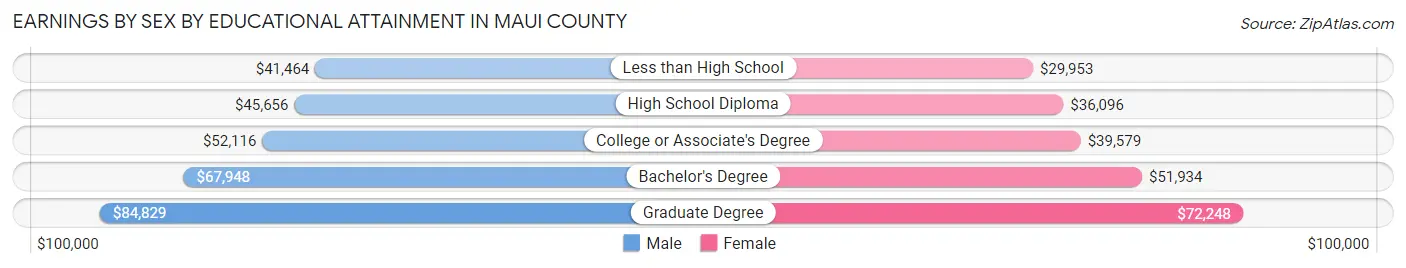
Earnings by Sex by Educational Attainment in Maui County
Average earnings in Maui County are $52,470 for men and $42,642 for women, a difference of 18.7%. Men with an educational attainment of graduate degree enjoy the highest average annual earnings of $84,829, while those with less than high school education earn the least with $41,464. Women with an educational attainment of graduate degree earn the most with the average annual earnings of $72,248, while those with less than high school education have the smallest earnings of $29,953.
| Educational Attainment | Male Income | Female Income |
| Less than High School | $41,464 | $29,953 |
| High School Diploma | $45,656 | $36,096 |
| College or Associate's Degree | $52,116 | $39,579 |
| Bachelor's Degree | $67,948 | $51,934 |
| Graduate Degree | $84,829 | $72,248 |
| Total | $52,470 | $42,642 |
Family Income in Maui County
Family Income Brackets in Maui County
According to the Maui County family income data, there are 9,539 families falling into the $100,000 to $149,999 income range, which is the most common income bracket and makes up 24.5% of all families. Conversely, the $10,000 to $14,999 income bracket is the least frequent group with only 545 families (1.4%) belonging to this category.
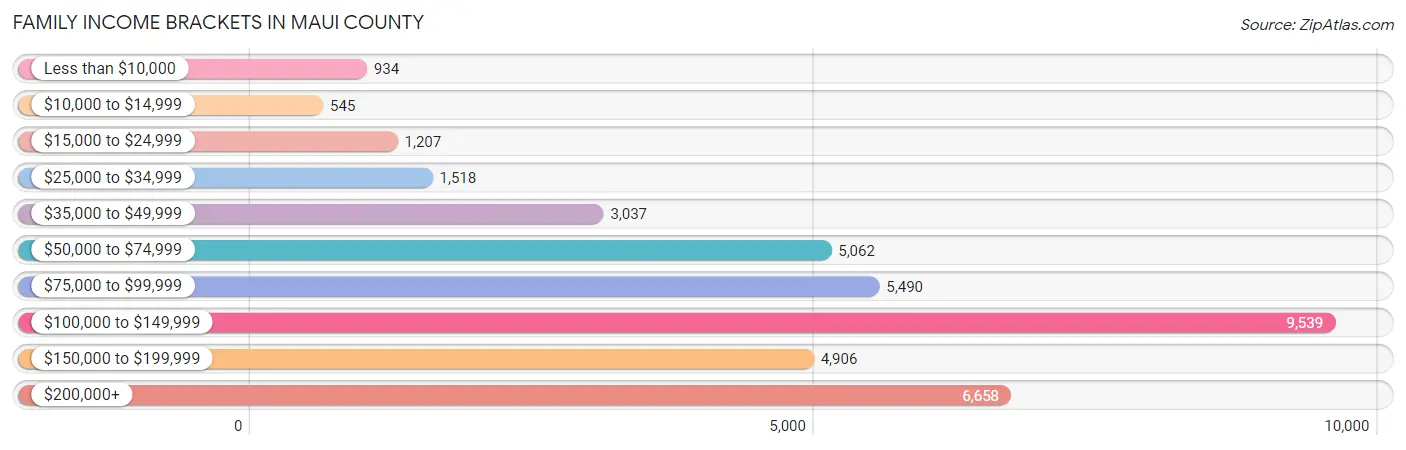
| Income Bracket | # Families | % Families |
| Less than $10,000 | 934 | 2.4% |
| $10,000 to $14,999 | 545 | 1.4% |
| $15,000 to $24,999 | 1,207 | 3.1% |
| $25,000 to $34,999 | 1,518 | 3.9% |
| $35,000 to $49,999 | 3,037 | 7.8% |
| $50,000 to $74,999 | 5,062 | 13.0% |
| $75,000 to $99,999 | 5,490 | 14.1% |
| $100,000 to $149,999 | 9,539 | 24.5% |
| $150,000 to $199,999 | 4,906 | 12.6% |
| $200,000+ | 6,658 | 17.1% |
Family Income by Famaliy Size in Maui County
7+ person families (1,770 | 4.5%) account for the highest median family income in Maui County with $166,857 per family, while 2-person families (17,320 | 44.5%) have the highest median income of $45,180 per family member.
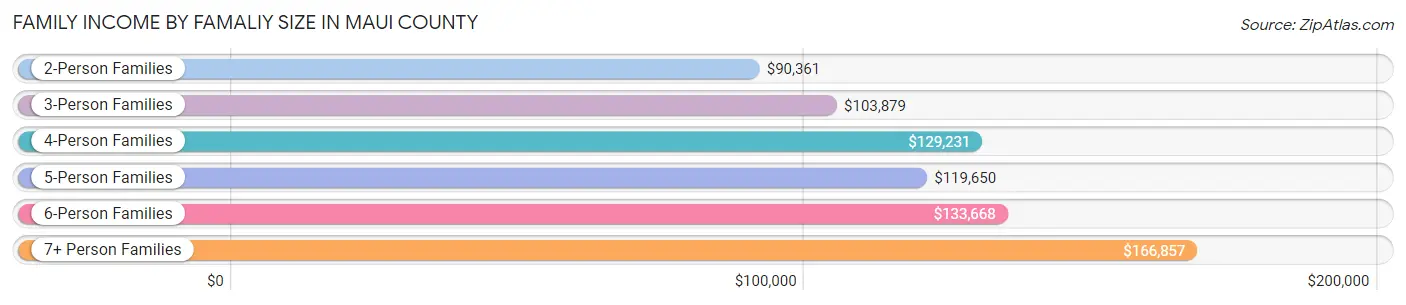
| Income Bracket | # Families | Median Income |
| 2-Person Families | 17,320 (44.5%) | $90,361 |
| 3-Person Families | 8,844 (22.7%) | $103,879 |
| 4-Person Families | 6,572 (16.9%) | $129,231 |
| 5-Person Families | 3,116 (8.0%) | $119,650 |
| 6-Person Families | 1,313 (3.4%) | $133,668 |
| 7+ Person Families | 1,770 (4.5%) | $166,857 |
| Total | 38,935 (100.0%) | $107,660 |
Family Income by Number of Earners in Maui County
The median family income in Maui County is $107,660, with families comprising 3+ earners (6,608) having the highest median family income of $163,804, while families with no earners (5,813) have the lowest median family income of $56,257, accounting for 17.0% and 14.9% of families, respectively.
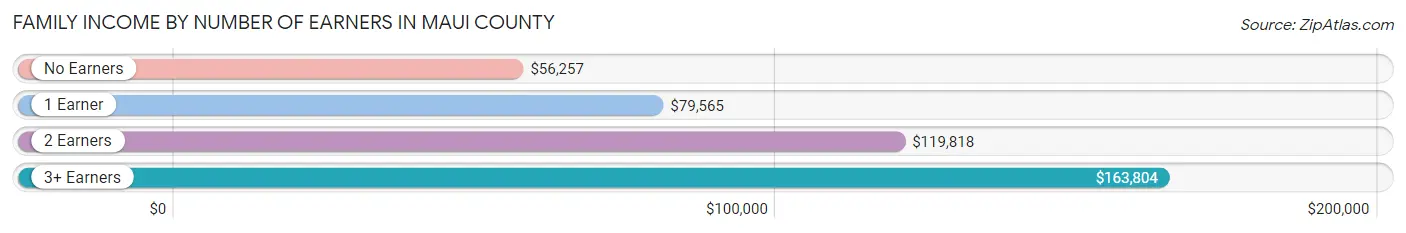
| Number of Earners | # Families | Median Income |
| No Earners | 5,813 (14.9%) | $56,257 |
| 1 Earner | 11,698 (30.0%) | $79,565 |
| 2 Earners | 14,816 (38.1%) | $119,818 |
| 3+ Earners | 6,608 (17.0%) | $163,804 |
| Total | 38,935 (100.0%) | $107,660 |
Household Income in Maui County
Household Income Brackets in Maui County
With 11,329 households falling in the category, the $100,000 to $149,999 income range is the most frequent in Maui County, accounting for 20.7% of all households. In contrast, only 1,478 households (2.7%) fall into the $10,000 to $14,999 income bracket, making it the least populous group.
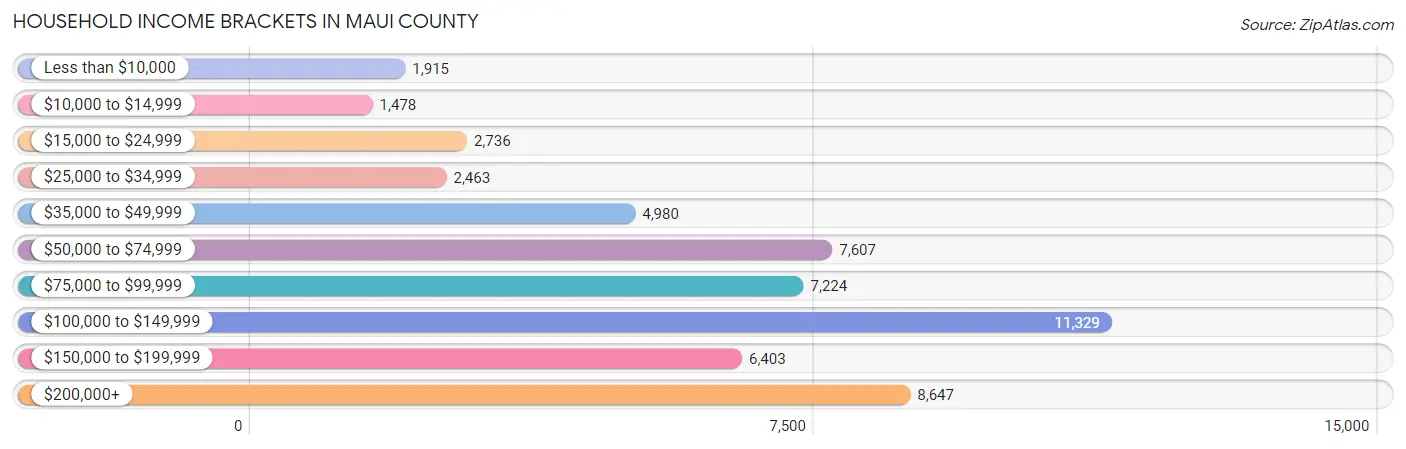
| Income Bracket | # Households | % Households |
| Less than $10,000 | 1,915 | 3.5% |
| $10,000 to $14,999 | 1,478 | 2.7% |
| $15,000 to $24,999 | 2,736 | 5.0% |
| $25,000 to $34,999 | 2,463 | 4.5% |
| $35,000 to $49,999 | 4,980 | 9.1% |
| $50,000 to $74,999 | 7,607 | 13.9% |
| $75,000 to $99,999 | 7,224 | 13.2% |
| $100,000 to $149,999 | 11,329 | 20.7% |
| $150,000 to $199,999 | 6,403 | 11.7% |
| $200,000+ | 8,647 | 15.8% |
Household Income by Householder Age in Maui County
The median household income in Maui County is $95,379, with the highest median household income of $110,551 found in the 45 to 64 years age bracket for the primary householder. A total of 22,261 households (40.7%) fall into this category. Meanwhile, the 15 to 24 years age bracket for the primary householder has the lowest median household income of $65,816, with 840 households (1.5%) in this group.
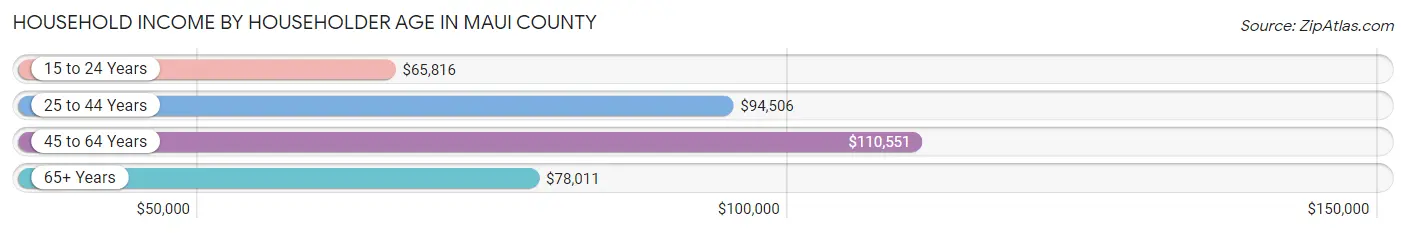
| Income Bracket | # Households | Median Income |
| 15 to 24 Years | 840 (1.5%) | $65,816 |
| 25 to 44 Years | 14,086 (25.7%) | $94,506 |
| 45 to 64 Years | 22,261 (40.7%) | $110,551 |
| 65+ Years | 17,541 (32.1%) | $78,011 |
| Total | 54,728 (100.0%) | $95,379 |
Poverty in Maui County
Income Below Poverty by Sex and Age in Maui County
With 9.3% poverty level for males and 9.3% for females among the residents of Maui County, 15 year old males and 15 year old females are the most vulnerable to poverty, with 193 males (14.7%) and 128 females (14.4%) in their respective age groups living below the poverty level.
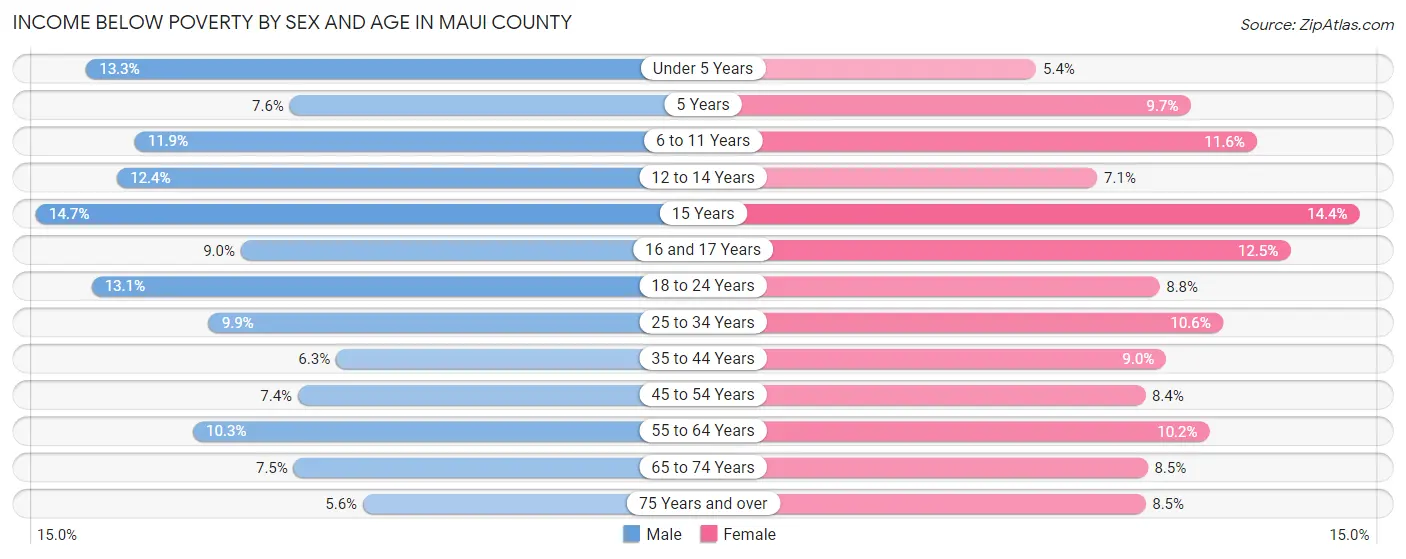
| Age Bracket | Male | Female |
| Under 5 Years | 619 (13.3%) | 226 (5.4%) |
| 5 Years | 69 (7.6%) | 106 (9.7%) |
| 6 to 11 Years | 701 (11.9%) | 677 (11.6%) |
| 12 to 14 Years | 457 (12.4%) | 171 (7.1%) |
| 15 Years | 193 (14.7%) | 128 (14.4%) |
| 16 and 17 Years | 145 (9.0%) | 266 (12.5%) |
| 18 to 24 Years | 735 (13.1%) | 500 (8.8%) |
| 25 to 34 Years | 913 (9.9%) | 1,041 (10.6%) |
| 35 to 44 Years | 726 (6.3%) | 1,001 (9.0%) |
| 45 to 54 Years | 785 (7.4%) | 872 (8.4%) |
| 55 to 64 Years | 1,177 (10.3%) | 1,188 (10.2%) |
| 65 to 74 Years | 735 (7.5%) | 837 (8.5%) |
| 75 Years and over | 287 (5.6%) | 565 (8.5%) |
| Total | 7,542 (9.3%) | 7,578 (9.3%) |
Income Above Poverty by Sex and Age in Maui County
According to the poverty statistics in Maui County, males aged 75 years and over and females aged under 5 years are the age groups that are most secure financially, with 94.4% of males and 94.6% of females in these age groups living above the poverty line.
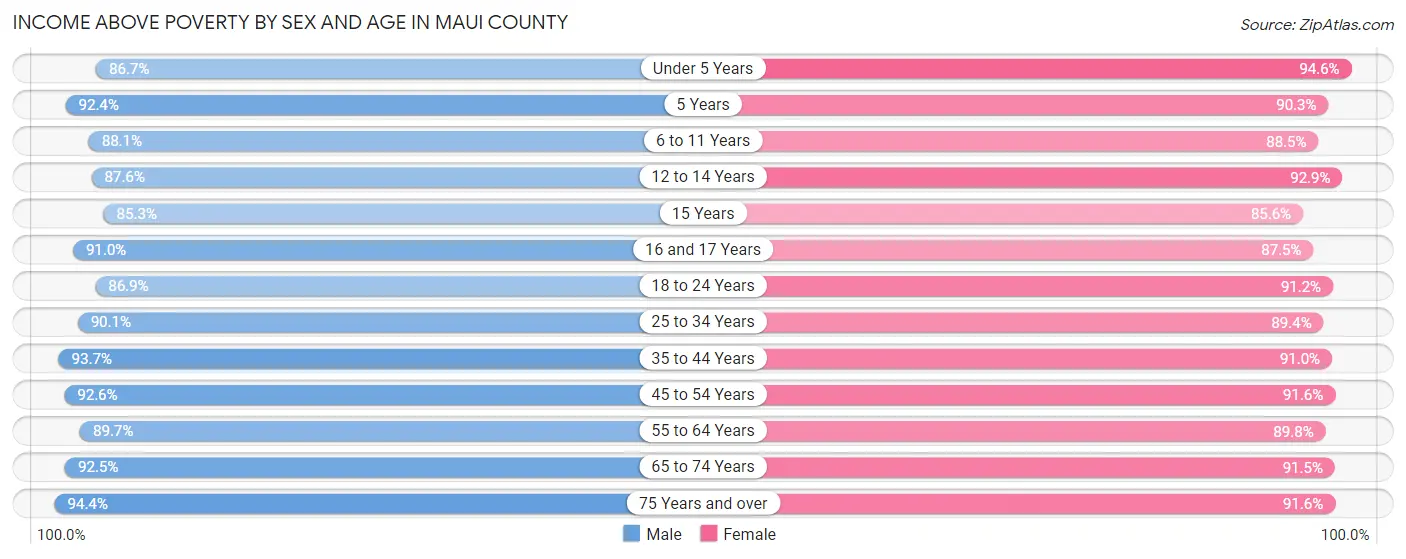
| Age Bracket | Male | Female |
| Under 5 Years | 4,041 (86.7%) | 3,949 (94.6%) |
| 5 Years | 837 (92.4%) | 987 (90.3%) |
| 6 to 11 Years | 5,177 (88.1%) | 5,186 (88.4%) |
| 12 to 14 Years | 3,222 (87.6%) | 2,233 (92.9%) |
| 15 Years | 1,122 (85.3%) | 760 (85.6%) |
| 16 and 17 Years | 1,470 (91.0%) | 1,865 (87.5%) |
| 18 to 24 Years | 4,862 (86.9%) | 5,153 (91.2%) |
| 25 to 34 Years | 8,337 (90.1%) | 8,781 (89.4%) |
| 35 to 44 Years | 10,751 (93.7%) | 10,090 (91.0%) |
| 45 to 54 Years | 9,842 (92.6%) | 9,455 (91.6%) |
| 55 to 64 Years | 10,241 (89.7%) | 10,424 (89.8%) |
| 65 to 74 Years | 9,056 (92.5%) | 9,002 (91.5%) |
| 75 Years and over | 4,852 (94.4%) | 6,124 (91.5%) |
| Total | 73,810 (90.7%) | 74,009 (90.7%) |
Income Below Poverty Among Married-Couple Families in Maui County
The poverty statistics for married-couple families in Maui County show that 3.5% or 991 of the total 28,300 families live below the poverty line. Families with 5 or more children have the highest poverty rate of 11.4%, comprising of 31 families. On the other hand, families with 1 or 2 children have the lowest poverty rate of 1.5%, which includes 139 families.
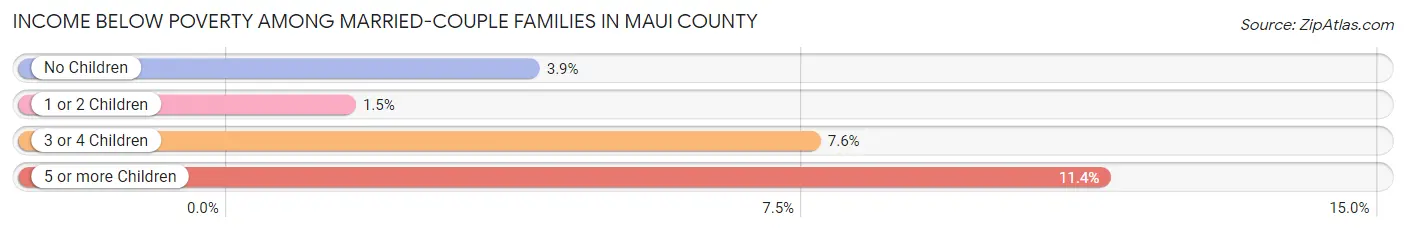
| Children | Above Poverty | Below Poverty |
| No Children | 16,283 (96.1%) | 667 (3.9%) |
| 1 or 2 Children | 8,916 (98.5%) | 139 (1.5%) |
| 3 or 4 Children | 1,869 (92.4%) | 154 (7.6%) |
| 5 or more Children | 241 (88.6%) | 31 (11.4%) |
| Total | 27,309 (96.5%) | 991 (3.5%) |
Income Below Poverty Among Single-Parent Households in Maui County
According to the poverty data in Maui County, 10.7% or 375 single-father households and 15.5% or 1,110 single-mother households are living below the poverty line. Among single-father households, those with 3 or 4 children have the highest poverty rate, with 117 households (33.5%) experiencing poverty. Likewise, among single-mother households, those with 5 or more children have the highest poverty rate, with 25 households (92.6%) falling below the poverty line.
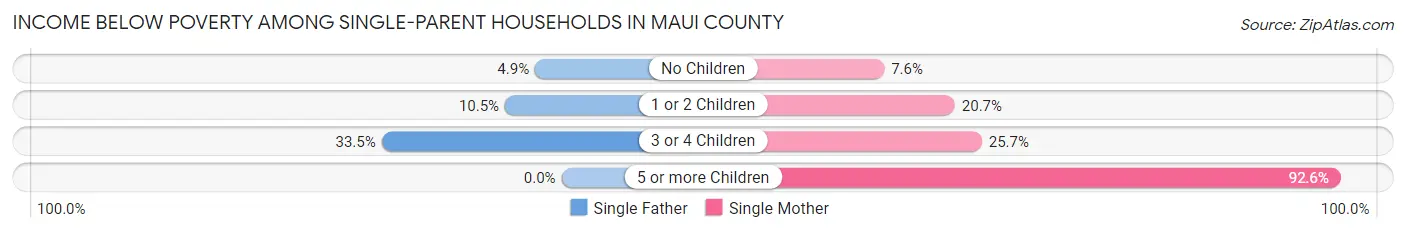
| Children | Single Father | Single Mother |
| No Children | 64 (4.9%) | 240 (7.5%) |
| 1 or 2 Children | 194 (10.5%) | 695 (20.7%) |
| 3 or 4 Children | 117 (33.5%) | 150 (25.7%) |
| 5 or more Children | 0 (0.0%) | 25 (92.6%) |
| Total | 375 (10.7%) | 1,110 (15.5%) |
Income Below Poverty Among Married-Couple vs Single-Parent Households in Maui County
The poverty data for Maui County shows that 991 of the married-couple family households (3.5%) and 1,485 of the single-parent households (14.0%) are living below the poverty level. Within the married-couple family households, those with 5 or more children have the highest poverty rate, with 31 households (11.4%) falling below the poverty line. Among the single-parent households, those with 5 or more children have the highest poverty rate, with 25 household (92.6%) living below poverty.
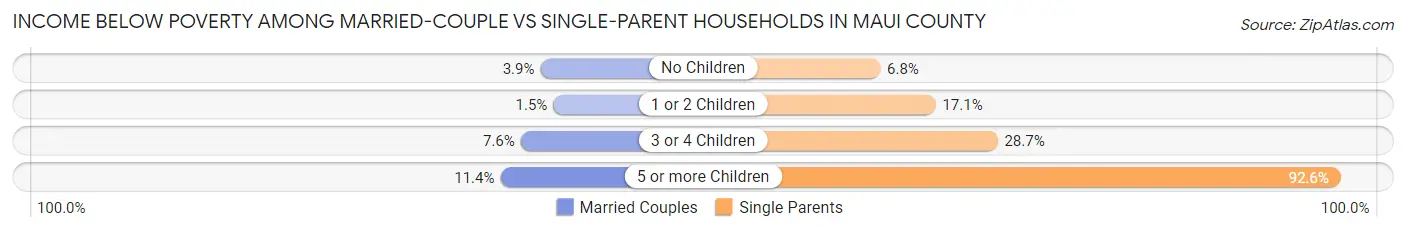
| Children | Married-Couple Families | Single-Parent Households |
| No Children | 667 (3.9%) | 304 (6.8%) |
| 1 or 2 Children | 139 (1.5%) | 889 (17.1%) |
| 3 or 4 Children | 154 (7.6%) | 267 (28.6%) |
| 5 or more Children | 31 (11.4%) | 25 (92.6%) |
| Total | 991 (3.5%) | 1,485 (14.0%) |
Race in Maui County
The most populous races in Maui County are White / Caucasian (52,341 | 31.8%), Asian (46,725 | 28.4%), and Two or more Races (42,761 | 26.0%).
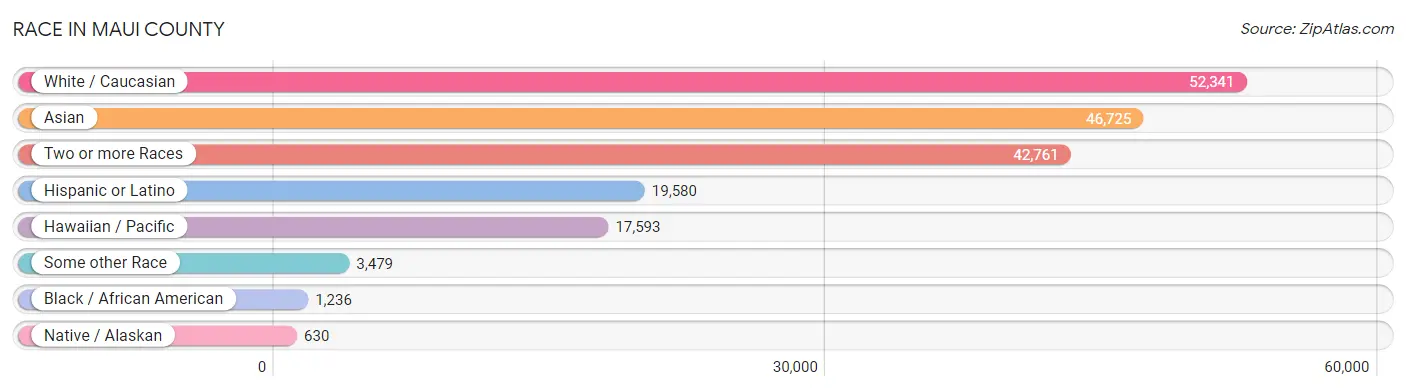
| Race | # Population | % Population |
| Asian | 46,725 | 28.4% |
| Black / African American | 1,236 | 0.7% |
| Hawaiian / Pacific | 17,593 | 10.7% |
| Hispanic or Latino | 19,580 | 11.9% |
| Native / Alaskan | 630 | 0.4% |
| White / Caucasian | 52,341 | 31.8% |
| Two or more Races | 42,761 | 26.0% |
| Some other Race | 3,479 | 2.1% |
| Total | 164,765 | 100.0% |
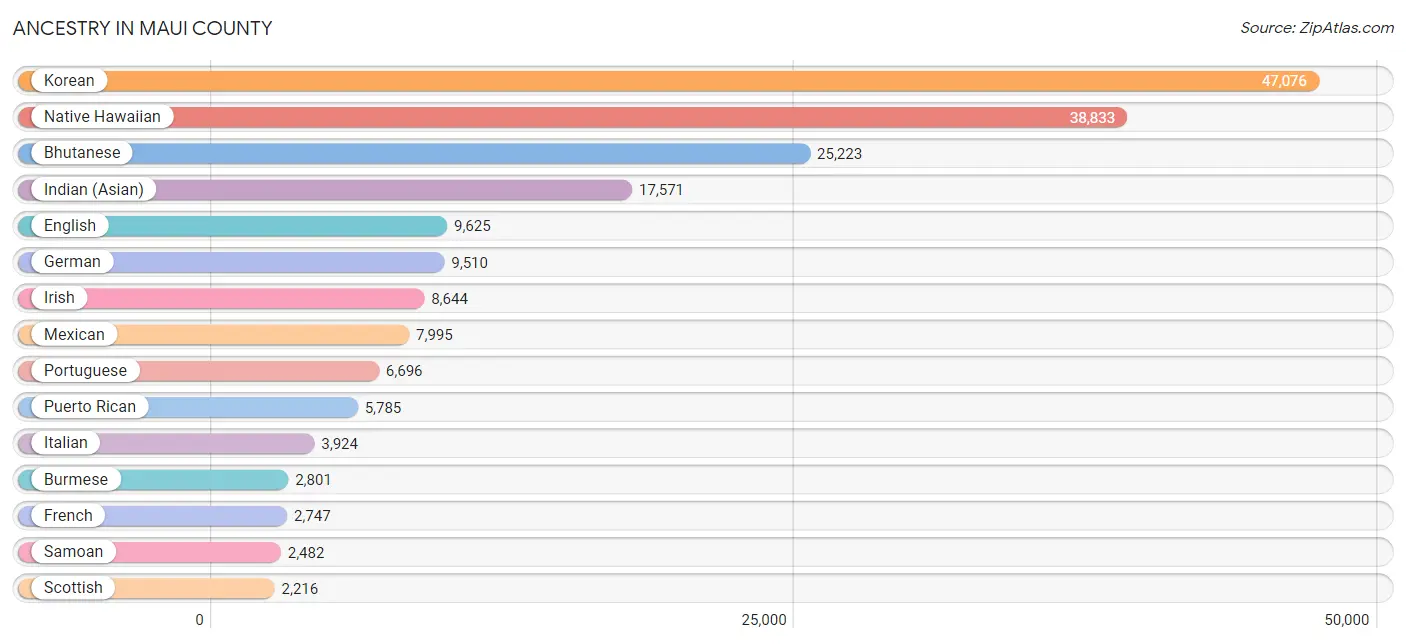
Ancestry in Maui County
The most populous ancestries reported in Maui County are Korean (47,076 | 28.6%), Native Hawaiian (38,833 | 23.6%), Bhutanese (25,223 | 15.3%), Indian (Asian) (17,571 | 10.7%), and English (9,625 | 5.8%), together accounting for 84.0% of all Maui County residents.
| Ancestry | # Population | % Population |
| African | 260 | 0.2% |
| Alsatian | 2 | 0.0% |
| American | 1,646 | 1.0% |
| Apache | 167 | 0.1% |
| Arab | 220 | 0.1% |
| Argentinean | 220 | 0.1% |
| Armenian | 47 | 0.0% |
| Australian | 135 | 0.1% |
| Austrian | 244 | 0.2% |
| Bangladeshi | 15 | 0.0% |
| Basque | 15 | 0.0% |
| Belgian | 113 | 0.1% |
| Bhutanese | 25,223 | 15.3% |
| Blackfeet | 111 | 0.1% |
| Bolivian | 22 | 0.0% |
| Brazilian | 221 | 0.1% |
| British | 837 | 0.5% |
| Bulgarian | 22 | 0.0% |
| Burmese | 2,801 | 1.7% |
| Cambodian | 4 | 0.0% |
| Canadian | 289 | 0.2% |
| Celtic | 28 | 0.0% |
| Central American | 1,136 | 0.7% |
| Central American Indian | 50 | 0.0% |
| Cherokee | 1,262 | 0.8% |
| Cheyenne | 61 | 0.0% |
| Chickasaw | 69 | 0.0% |
| Chilean | 76 | 0.1% |
| Chinese | 566 | 0.3% |
| Chippewa | 153 | 0.1% |
| Choctaw | 111 | 0.1% |
| Colombian | 234 | 0.1% |
| Colville | 4 | 0.0% |
| Comanche | 3 | 0.0% |
| Costa Rican | 7 | 0.0% |
| Cree | 11 | 0.0% |
| Creek | 14 | 0.0% |
| Croatian | 209 | 0.1% |
| Cuban | 265 | 0.2% |
| Czech | 202 | 0.1% |
| Czechoslovakian | 71 | 0.0% |
| Danish | 406 | 0.3% |
| Dominican | 113 | 0.1% |
| Dutch | 1,165 | 0.7% |
| Eastern European | 432 | 0.3% |
| Egyptian | 24 | 0.0% |
| English | 9,625 | 5.8% |
| Estonian | 72 | 0.0% |
| Ethiopian | 3 | 0.0% |
| European | 1,565 | 0.9% |
| Fijian | 1,169 | 0.7% |
| Filipino | 30 | 0.0% |
| Finnish | 200 | 0.1% |
| French | 2,747 | 1.7% |
| French Canadian | 335 | 0.2% |
| German | 9,510 | 5.8% |
| Ghanaian | 48 | 0.0% |
| Greek | 445 | 0.3% |
| Guamanian / Chamorro | 450 | 0.3% |
| Guatemalan | 567 | 0.3% |
| Guyanese | 17 | 0.0% |
| Haitian | 8 | 0.0% |
| Honduran | 30 | 0.0% |
| Hungarian | 524 | 0.3% |
| Icelander | 19 | 0.0% |
| Indian (Asian) | 17,571 | 10.7% |
| Indonesian | 14 | 0.0% |
| Inupiat | 12 | 0.0% |
| Iranian | 78 | 0.1% |
| Irish | 8,644 | 5.2% |
| Iroquois | 21 | 0.0% |
| Israeli | 70 | 0.0% |
| Italian | 3,924 | 2.4% |
| Japanese | 10 | 0.0% |
| Jordanian | 5 | 0.0% |
| Korean | 47,076 | 28.6% |
| Laotian | 120 | 0.1% |
| Latvian | 23 | 0.0% |
| Lebanese | 99 | 0.1% |
| Lithuanian | 113 | 0.1% |
| Luxembourger | 15 | 0.0% |
| Malaysian | 22 | 0.0% |
| Maltese | 23 | 0.0% |
| Marshallese | 412 | 0.3% |
| Mexican | 7,995 | 4.9% |
| Mexican American Indian | 148 | 0.1% |
| Mongolian | 10 | 0.0% |
| Moroccan | 40 | 0.0% |
| Native Hawaiian | 38,833 | 23.6% |
| Navajo | 74 | 0.0% |
| New Zealander | 10 | 0.0% |
| Northern European | 392 | 0.2% |
| Norwegian | 1,479 | 0.9% |
| Okinawan | 39 | 0.0% |
| Osage | 7 | 0.0% |
| Ottawa | 4 | 0.0% |
| Pakistani | 458 | 0.3% |
| Palestinian | 2 | 0.0% |
| Panamanian | 399 | 0.2% |
| Peruvian | 104 | 0.1% |
| Polish | 1,830 | 1.1% |
| Portuguese | 6,696 | 4.1% |
| Potawatomi | 15 | 0.0% |
| Pueblo | 31 | 0.0% |
| Puerto Rican | 5,785 | 3.5% |
| Puget Sound Salish | 2 | 0.0% |
| Romanian | 180 | 0.1% |
| Russian | 991 | 0.6% |
| Salvadoran | 133 | 0.1% |
| Samoan | 2,482 | 1.5% |
| Scandinavian | 308 | 0.2% |
| Scotch-Irish | 913 | 0.5% |
| Scottish | 2,216 | 1.3% |
| Serbian | 103 | 0.1% |
| Sierra Leonean | 1 | 0.0% |
| Sioux | 32 | 0.0% |
| Slavic | 47 | 0.0% |
| Slovak | 43 | 0.0% |
| Slovene | 5 | 0.0% |
| South African | 184 | 0.1% |
| South American | 1,071 | 0.6% |
| South American Indian | 44 | 0.0% |
| Spaniard | 1,049 | 0.6% |
| Spanish | 1,805 | 1.1% |
| Sri Lankan | 1,132 | 0.7% |
| Subsaharan African | 538 | 0.3% |
| Swedish | 1,550 | 0.9% |
| Swiss | 448 | 0.3% |
| Syrian | 5 | 0.0% |
| Thai | 590 | 0.4% |
| Tohono O'Odham | 6 | 0.0% |
| Tongan | 1,855 | 1.1% |
| Trinidadian and Tobagonian | 12 | 0.0% |
| Turkish | 85 | 0.1% |
| Ukrainian | 390 | 0.2% |
| Uruguayan | 50 | 0.0% |
| Venezuelan | 356 | 0.2% |
| Welsh | 958 | 0.6% |
| Yaqui | 33 | 0.0% |
| Yugoslavian | 10 | 0.0% |
| Yup'ik | 26 | 0.0% | View All 141 Rows |
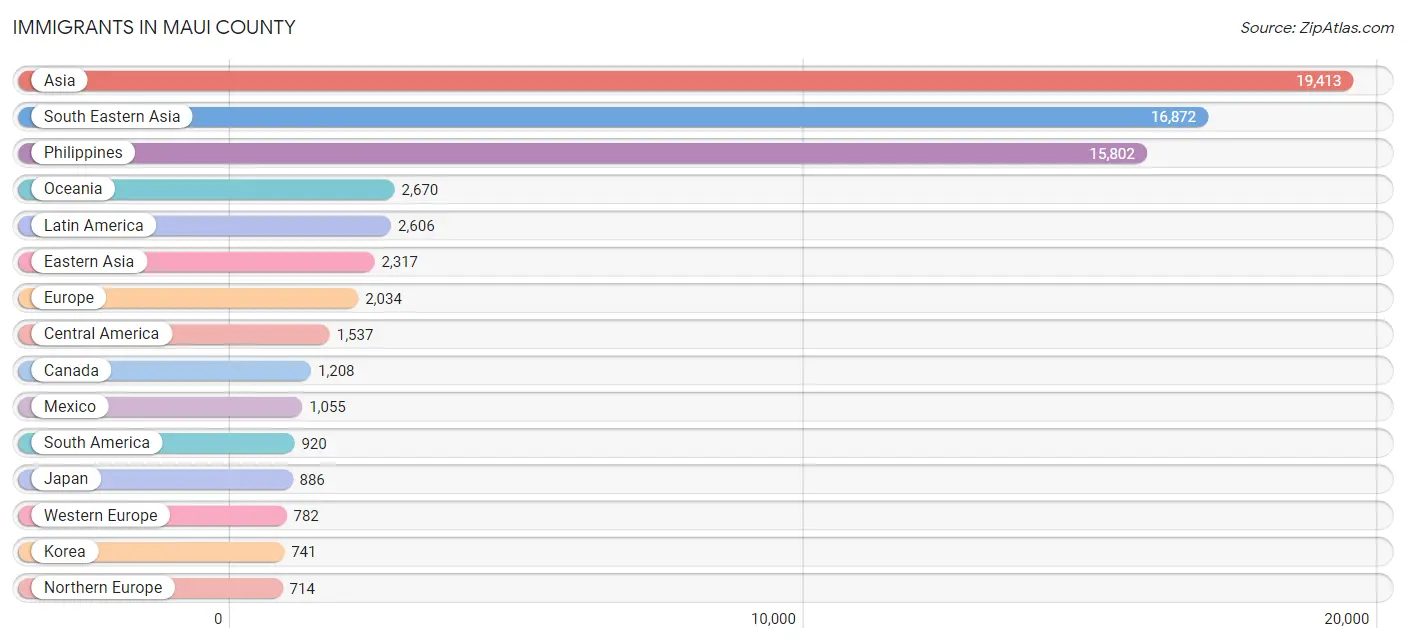
Immigrants in Maui County
The most numerous immigrant groups reported in Maui County came from Asia (19,413 | 11.8%), South Eastern Asia (16,872 | 10.2%), Philippines (15,802 | 9.6%), Oceania (2,670 | 1.6%), and Latin America (2,606 | 1.6%), together accounting for 34.8% of all Maui County residents.
| Immigration Origin | # Population | % Population |
| Africa | 438 | 0.3% |
| Argentina | 139 | 0.1% |
| Asia | 19,413 | 11.8% |
| Australia | 143 | 0.1% |
| Austria | 15 | 0.0% |
| Azores | 4 | 0.0% |
| Bahamas | 35 | 0.0% |
| Barbados | 34 | 0.0% |
| Belgium | 17 | 0.0% |
| Brazil | 449 | 0.3% |
| Cambodia | 14 | 0.0% |
| Canada | 1,208 | 0.7% |
| Caribbean | 149 | 0.1% |
| Central America | 1,537 | 0.9% |
| Chile | 15 | 0.0% |
| China | 690 | 0.4% |
| Colombia | 41 | 0.0% |
| Cuba | 32 | 0.0% |
| Czechoslovakia | 46 | 0.0% |
| Denmark | 100 | 0.1% |
| Dominican Republic | 38 | 0.0% |
| Eastern Africa | 86 | 0.1% |
| Eastern Asia | 2,317 | 1.4% |
| Eastern Europe | 247 | 0.2% |
| Ecuador | 20 | 0.0% |
| Egypt | 21 | 0.0% |
| El Salvador | 83 | 0.1% |
| England | 227 | 0.1% |
| Europe | 2,034 | 1.2% |
| France | 167 | 0.1% |
| Germany | 437 | 0.3% |
| Ghana | 94 | 0.1% |
| Grenada | 10 | 0.0% |
| Guatemala | 318 | 0.2% |
| Guyana | 17 | 0.0% |
| Honduras | 30 | 0.0% |
| Hong Kong | 161 | 0.1% |
| Hungary | 28 | 0.0% |
| India | 36 | 0.0% |
| Indonesia | 86 | 0.1% |
| Iran | 27 | 0.0% |
| Ireland | 40 | 0.0% |
| Israel | 13 | 0.0% |
| Italy | 82 | 0.1% |
| Japan | 886 | 0.5% |
| Jordan | 16 | 0.0% |
| Korea | 741 | 0.4% |
| Laos | 59 | 0.0% |
| Latin America | 2,606 | 1.6% |
| Latvia | 22 | 0.0% |
| Lebanon | 14 | 0.0% |
| Malaysia | 19 | 0.0% |
| Mexico | 1,055 | 0.6% |
| Micronesia | 705 | 0.4% |
| Morocco | 9 | 0.0% |
| Netherlands | 25 | 0.0% |
| Northern Africa | 54 | 0.0% |
| Northern Europe | 714 | 0.4% |
| Oceania | 2,670 | 1.6% |
| Panama | 51 | 0.0% |
| Peru | 33 | 0.0% |
| Philippines | 15,802 | 9.6% |
| Poland | 76 | 0.1% |
| Portugal | 158 | 0.1% |
| Romania | 1 | 0.0% |
| Russia | 46 | 0.0% |
| Scotland | 17 | 0.0% |
| Serbia | 4 | 0.0% |
| Sierra Leone | 1 | 0.0% |
| Singapore | 39 | 0.0% |
| South Africa | 194 | 0.1% |
| South America | 920 | 0.6% |
| South Central Asia | 83 | 0.1% |
| South Eastern Asia | 16,872 | 10.2% |
| Southern Europe | 291 | 0.2% |
| Spain | 39 | 0.0% |
| Sri Lanka | 20 | 0.0% |
| Sudan | 24 | 0.0% |
| Sweden | 28 | 0.0% |
| Switzerland | 121 | 0.1% |
| Taiwan | 110 | 0.1% |
| Thailand | 256 | 0.2% |
| Turkey | 55 | 0.0% |
| Ukraine | 24 | 0.0% |
| Uruguay | 72 | 0.0% |
| Venezuela | 127 | 0.1% |
| Vietnam | 597 | 0.4% |
| Western Africa | 104 | 0.1% |
| Western Asia | 105 | 0.1% |
| Western Europe | 782 | 0.5% |
| Zimbabwe | 11 | 0.0% | View All 91 Rows |
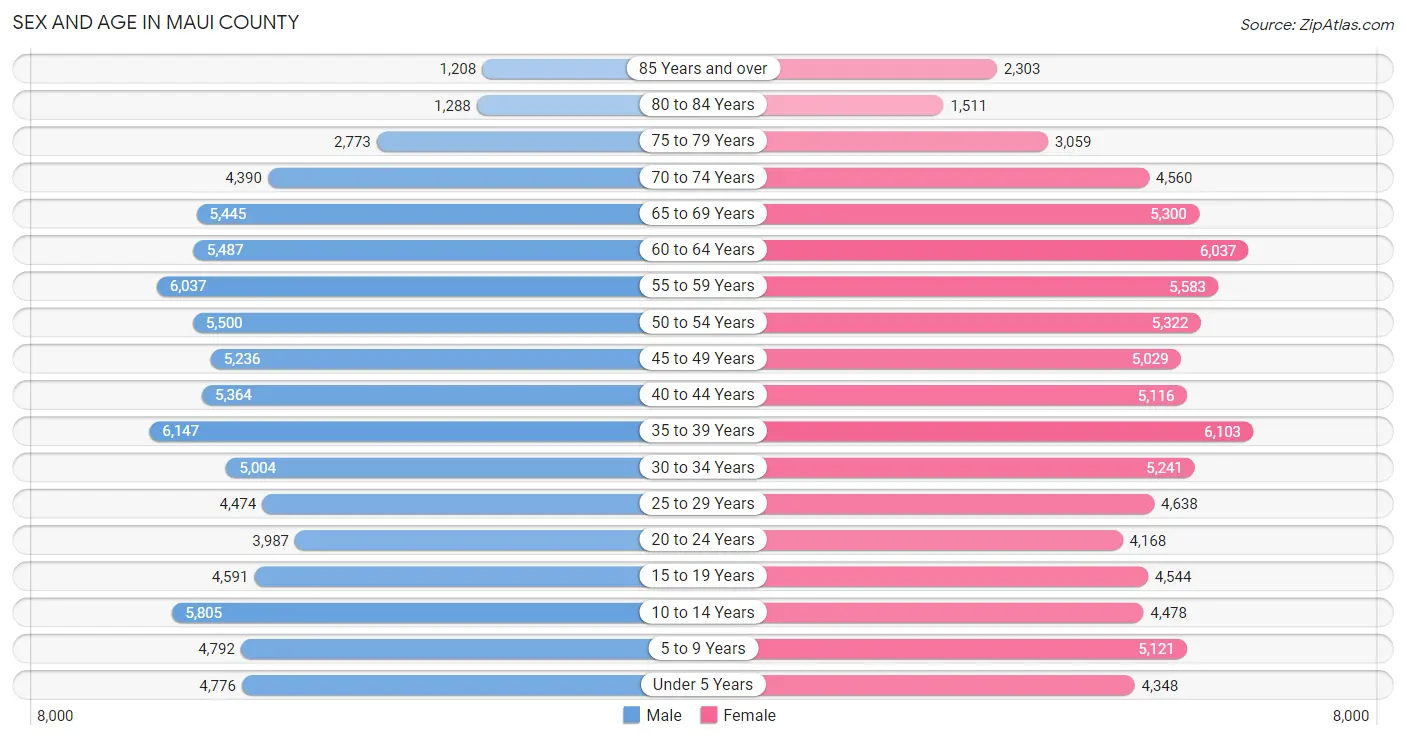
Sex and Age in Maui County
Sex and Age in Maui County
The most populous age groups in Maui County are 35 to 39 Years (6,147 | 7.5%) for men and 35 to 39 Years (6,103 | 7.4%) for women.
| Age Bracket | Male | Female |
| Under 5 Years | 4,776 (5.8%) | 4,348 (5.3%) |
| 5 to 9 Years | 4,792 (5.8%) | 5,121 (6.2%) |
| 10 to 14 Years | 5,805 (7.0%) | 4,478 (5.4%) |
| 15 to 19 Years | 4,591 (5.6%) | 4,544 (5.5%) |
| 20 to 24 Years | 3,987 (4.8%) | 4,168 (5.1%) |
| 25 to 29 Years | 4,474 (5.4%) | 4,638 (5.6%) |
| 30 to 34 Years | 5,004 (6.1%) | 5,241 (6.4%) |
| 35 to 39 Years | 6,147 (7.5%) | 6,103 (7.4%) |
| 40 to 44 Years | 5,364 (6.5%) | 5,116 (6.2%) |
| 45 to 49 Years | 5,236 (6.4%) | 5,029 (6.1%) |
| 50 to 54 Years | 5,500 (6.7%) | 5,322 (6.5%) |
| 55 to 59 Years | 6,037 (7.3%) | 5,583 (6.8%) |
| 60 to 64 Years | 5,487 (6.7%) | 6,037 (7.3%) |
| 65 to 69 Years | 5,445 (6.6%) | 5,300 (6.4%) |
| 70 to 74 Years | 4,390 (5.3%) | 4,560 (5.5%) |
| 75 to 79 Years | 2,773 (3.4%) | 3,059 (3.7%) |
| 80 to 84 Years | 1,288 (1.6%) | 1,511 (1.8%) |
| 85 Years and over | 1,208 (1.5%) | 2,303 (2.8%) |
| Total | 82,304 (100.0%) | 82,461 (100.0%) |
Families and Households in Maui County
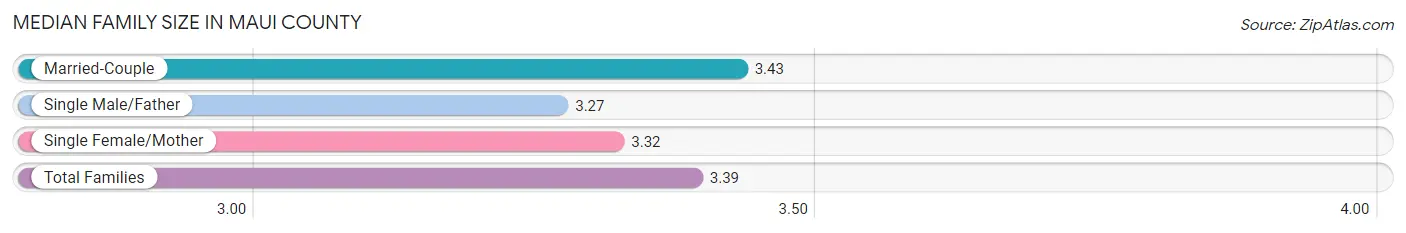
Median Family Size in Maui County
The median family size in Maui County is 3.39 persons per family, with married-couple families (28,300 | 72.7%) accounting for the largest median family size of 3.43 persons per family. On the other hand, single male/father families (3,491 | 9.0%) represent the smallest median family size with 3.27 persons per family.
| Family Type | # Families | Family Size |
| Married-Couple | 28,300 (72.7%) | 3.43 |
| Single Male/Father | 3,491 (9.0%) | 3.27 |
| Single Female/Mother | 7,144 (18.3%) | 3.32 |
| Total Families | 38,935 (100.0%) | 3.39 |
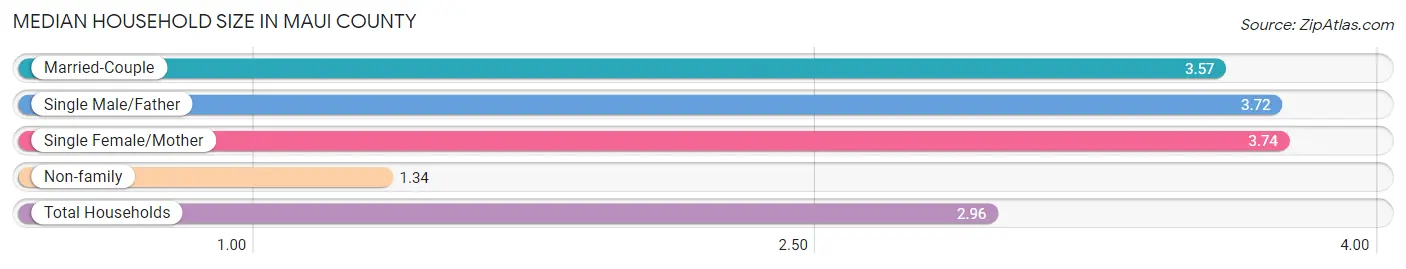
Median Household Size in Maui County
The median household size in Maui County is 2.96 persons per household, with single female/mother households (7,144 | 13.1%) accounting for the largest median household size of 3.74 persons per household. non-family households (15,793 | 28.9%) represent the smallest median household size with 1.34 persons per household.
| Household Type | # Households | Household Size |
| Married-Couple | 28,300 (51.7%) | 3.57 |
| Single Male/Father | 3,491 (6.4%) | 3.72 |
| Single Female/Mother | 7,144 (13.1%) | 3.74 |
| Non-family | 15,793 (28.9%) | 1.34 |
| Total Households | 54,728 (100.0%) | 2.96 |
Household Size by Marriage Status in Maui County
Out of a total of 54,728 households in Maui County, 38,935 (71.1%) are family households, while 15,793 (28.9%) are nonfamily households. The most numerous type of family households are 2-person households, comprising 15,492, and the most common type of nonfamily households are 1-person households, comprising 12,025.
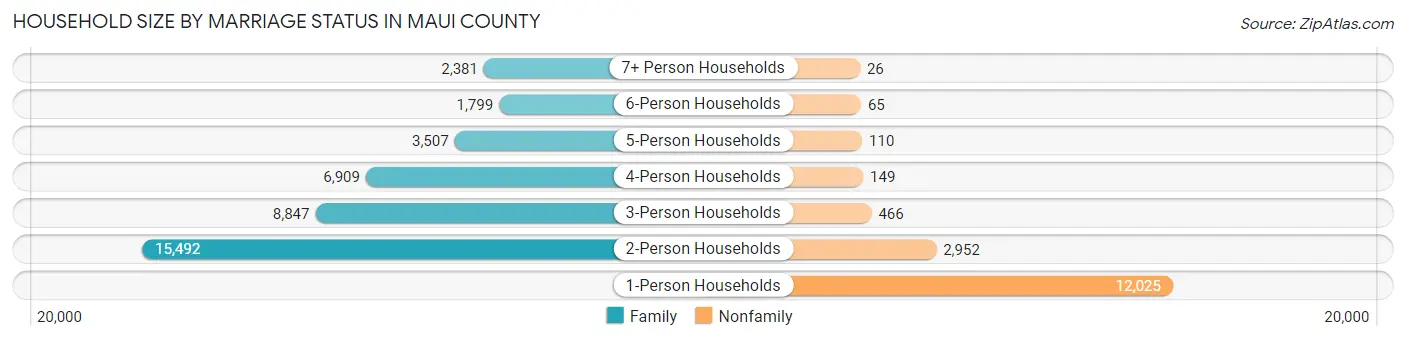
| Household Size | Family Households | Nonfamily Households |
| 1-Person Households | - | 12,025 (22.0%) |
| 2-Person Households | 15,492 (28.3%) | 2,952 (5.4%) |
| 3-Person Households | 8,847 (16.2%) | 466 (0.9%) |
| 4-Person Households | 6,909 (12.6%) | 149 (0.3%) |
| 5-Person Households | 3,507 (6.4%) | 110 (0.2%) |
| 6-Person Households | 1,799 (3.3%) | 65 (0.1%) |
| 7+ Person Households | 2,381 (4.3%) | 26 (0.1%) |
| Total | 38,935 (71.1%) | 15,793 (28.9%) |
Female Fertility in Maui County
Fertility by Age in Maui County
Average fertility rate in Maui County is 60.0 births per 1,000 women. Women in the age bracket of 20 to 34 years have the highest fertility rate with 98.0 births per 1,000 women. Women in the age bracket of 20 to 34 years acount for 64.0% of all women with births.
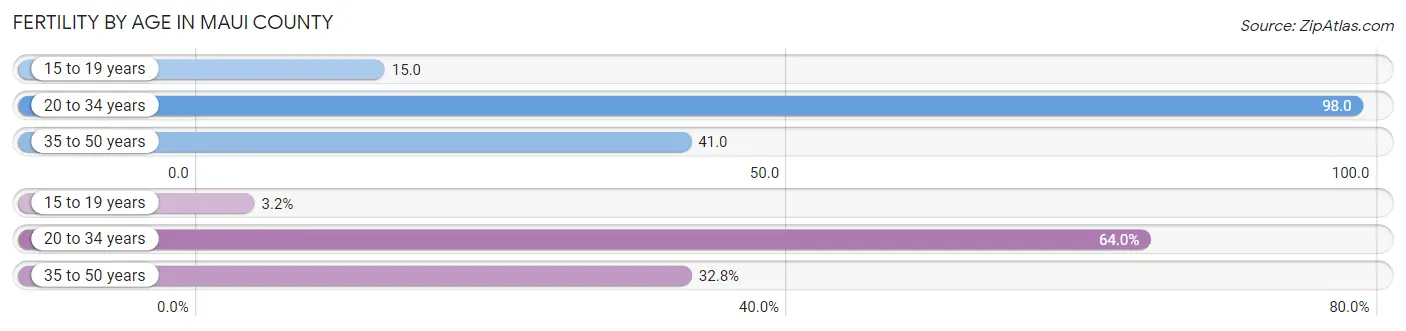
| Age Bracket | Women with Births | Births / 1,000 Women |
| 15 to 19 years | 68 (3.2%) | 15.0 |
| 20 to 34 years | 1,376 (64.0%) | 98.0 |
| 35 to 50 years | 706 (32.8%) | 41.0 |
| Total | 2,150 (100.0%) | 60.0 |
Fertility by Age by Marriage Status in Maui County
66.3% of women with births (2,150) in Maui County are married. The highest percentage of unmarried women with births falls into 15 to 19 years age bracket with 100.0% of them unmarried at the time of birth, while the lowest percentage of unmarried women with births belong to 35 to 50 years age bracket with 17.6% of them unmarried.
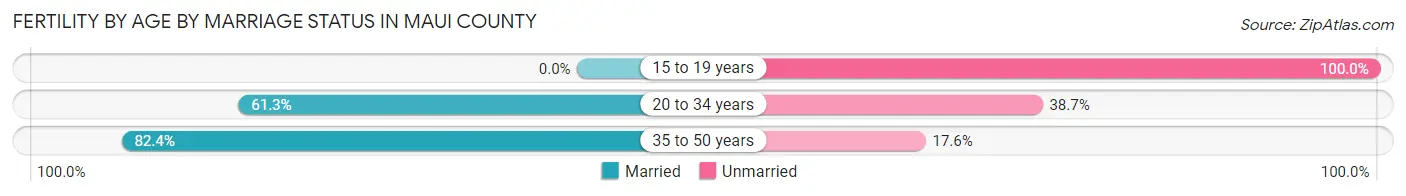
| Age Bracket | Married | Unmarried |
| 15 to 19 years | 0 (0.0%) | 68 (100.0%) |
| 20 to 34 years | 843 (61.3%) | 533 (38.7%) |
| 35 to 50 years | 582 (82.4%) | 124 (17.6%) |
| Total | 1,425 (66.3%) | 725 (33.7%) |
Fertility by Education in Maui County
Average fertility rate in Maui County is 60.0 births per 1,000 women. Women with the education attainment of college or associate's degree have the highest fertility rate of 87.0 births per 1,000 women, while women with the education attainment of less than high school have the lowest fertility at 4.0 births per 1,000 women. Women with the education attainment of college or associate's degree represent 44.7% of all women with births.
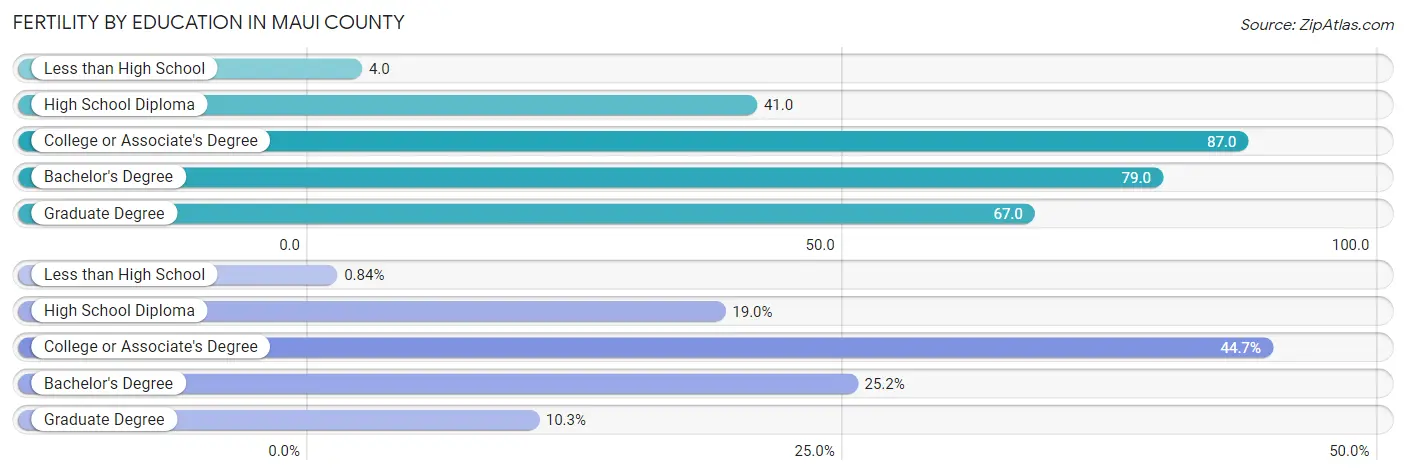
| Educational Attainment | Women with Births | Births / 1,000 Women |
| Less than High School | 18 (0.8%) | 4.0 |
| High School Diploma | 409 (19.0%) | 41.0 |
| College or Associate's Degree | 960 (44.7%) | 87.0 |
| Bachelor's Degree | 542 (25.2%) | 79.0 |
| Graduate Degree | 221 (10.3%) | 67.0 |
| Total | 2,150 (100.0%) | 60.0 |
Fertility by Education by Marriage Status in Maui County
33.7% of women with births in Maui County are unmarried. Women with the educational attainment of graduate degree are most likely to be married with 91.4% of them married at childbirth, while women with the educational attainment of less than high school are least likely to be married with 100.0% of them unmarried at childbirth.
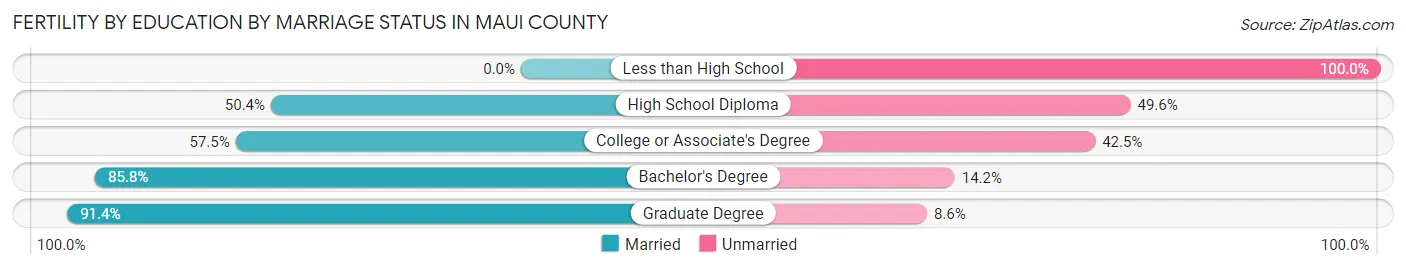
| Educational Attainment | Married | Unmarried |
| Less than High School | 0 (0.0%) | 18 (100.0%) |
| High School Diploma | 206 (50.4%) | 203 (49.6%) |
| College or Associate's Degree | 552 (57.5%) | 408 (42.5%) |
| Bachelor's Degree | 465 (85.8%) | 77 (14.2%) |
| Graduate Degree | 202 (91.4%) | 19 (8.6%) |
| Total | 1,425 (66.3%) | 725 (33.7%) |
Employment Characteristics in Maui County
Employment by Class of Employer in Maui County
Among the 79,955 employed individuals in Maui County, private company employees (50,757 | 63.5%), self-employed (not incorporated) (6,404 | 8.0%), and not-for-profit organizations (5,943 | 7.4%) make up the most common classes of employment.
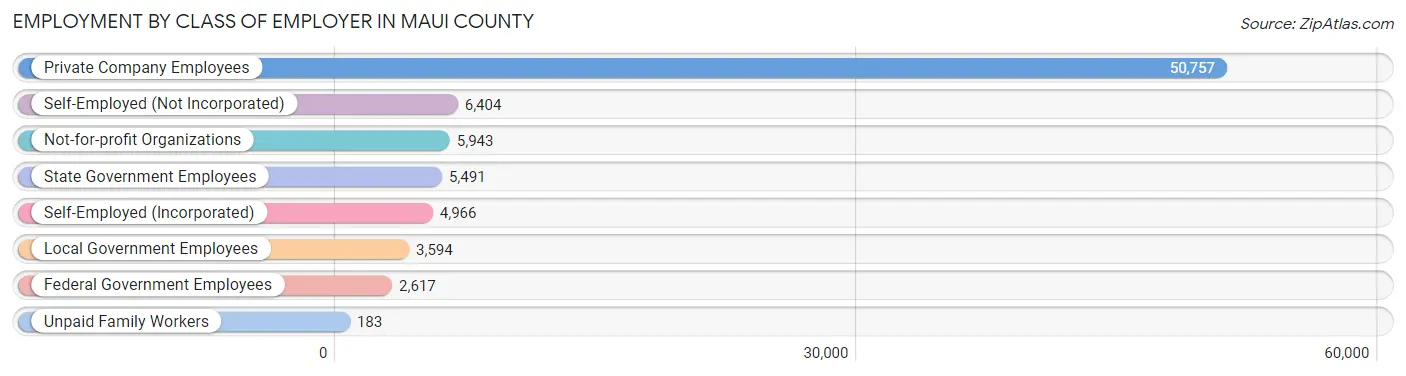
| Employer Class | # Employees | % Employees |
| Private Company Employees | 50,757 | 63.5% |
| Self-Employed (Incorporated) | 4,966 | 6.2% |
| Self-Employed (Not Incorporated) | 6,404 | 8.0% |
| Not-for-profit Organizations | 5,943 | 7.4% |
| Local Government Employees | 3,594 | 4.5% |
| State Government Employees | 5,491 | 6.9% |
| Federal Government Employees | 2,617 | 3.3% |
| Unpaid Family Workers | 183 | 0.2% |
| Total | 79,955 | 100.0% |
Employment Status by Age in Maui County
According to the labor force statistics for Maui County, out of the total population over 16 years of age (133,241), 65.2% or 86,873 individuals are in the labor force, with 5.4% or 4,691 of them unemployed. The age group with the highest labor force participation rate is 25 to 29 years, with 87.6% or 7,982 individuals in the labor force. Within the labor force, the 16 to 19 years age range has the highest percentage of unemployed individuals, with 12.1% or 321 of them being unemployed.
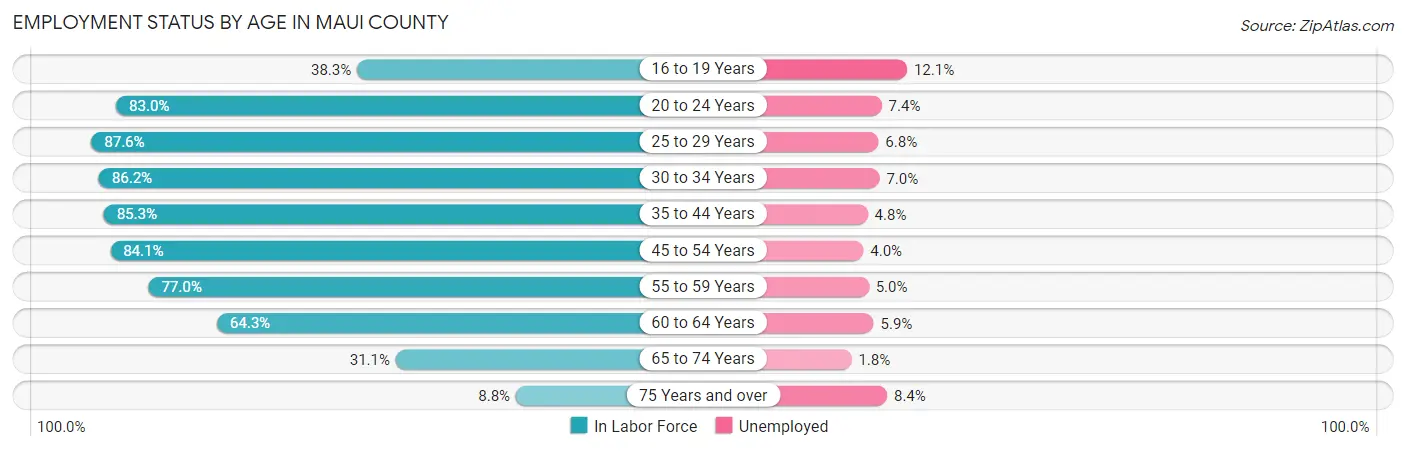
| Age Bracket | In Labor Force | Unemployed |
| 16 to 19 Years | 2,655 (38.3%) | 321 (12.1%) |
| 20 to 24 Years | 6,769 (83.0%) | 501 (7.4%) |
| 25 to 29 Years | 7,982 (87.6%) | 543 (6.8%) |
| 30 to 34 Years | 8,831 (86.2%) | 618 (7.0%) |
| 35 to 44 Years | 19,389 (85.3%) | 931 (4.8%) |
| 45 to 54 Years | 17,734 (84.1%) | 709 (4.0%) |
| 55 to 59 Years | 8,947 (77.0%) | 447 (5.0%) |
| 60 to 64 Years | 7,410 (64.3%) | 437 (5.9%) |
| 65 to 74 Years | 6,125 (31.1%) | 110 (1.8%) |
| 75 Years and over | 1,068 (8.8%) | 90 (8.4%) |
| Total | 86,873 (65.2%) | 4,691 (5.4%) |
Employment Status by Educational Attainment in Maui County
According to labor force statistics for Maui County, 81.4% of individuals (70,263) out of the total population between 25 and 64 years of age (86,318) are in the labor force, with 5.3% or 3,724 of them being unemployed. The group with the highest labor force participation rate are those with the educational attainment of bachelor's degree or higher, with 83.4% or 21,284 individuals in the labor force. Within the labor force, individuals with high school diploma education have the highest percentage of unemployment, with 6.4% or 1,371 of them being unemployed.
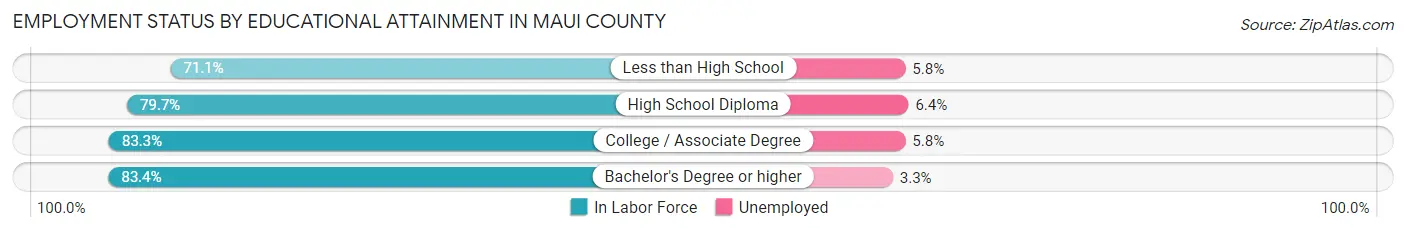
| Educational Attainment | In Labor Force | Unemployed |
| Less than High School | 3,960 (71.1%) | 323 (5.8%) |
| High School Diploma | 21,426 (79.7%) | 1,721 (6.4%) |
| College / Associate Degree | 23,612 (83.3%) | 1,644 (5.8%) |
| Bachelor's Degree or higher | 21,284 (83.4%) | 842 (3.3%) |
| Total | 70,263 (81.4%) | 4,575 (5.3%) |
Employment Occupations by Sex in Maui County
Management, Business, Science and Arts Occupations
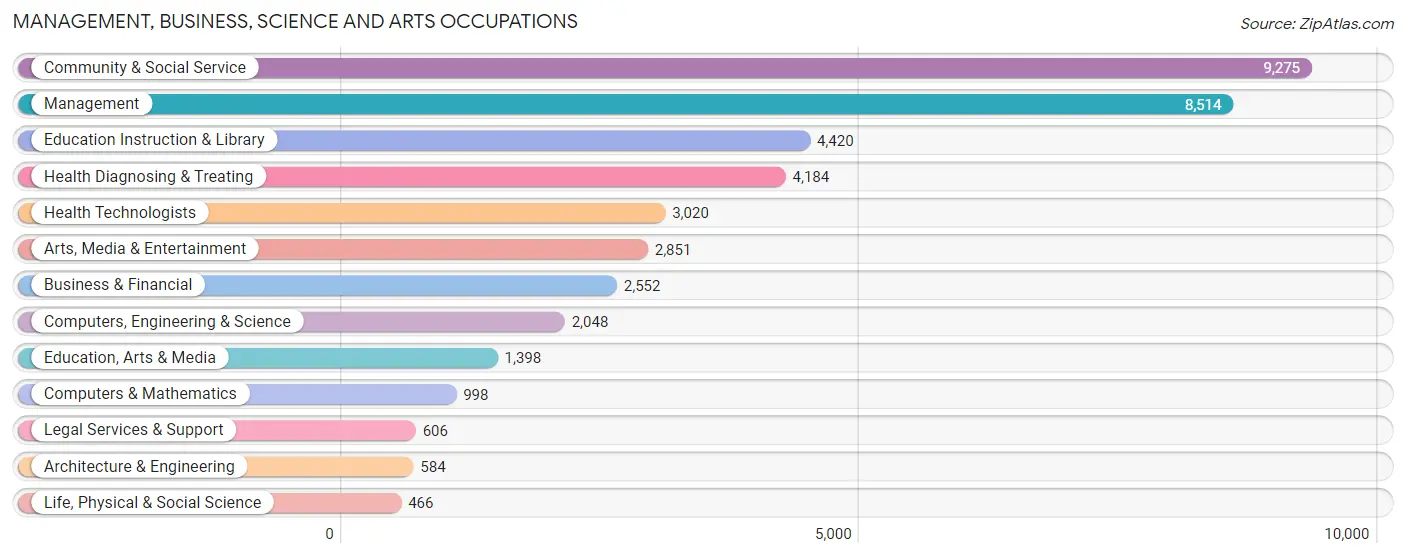
The most common Management, Business, Science and Arts occupations in Maui County are Community & Social Service (9,275 | 11.4%), Management (8,514 | 10.4%), Education Instruction & Library (4,420 | 5.4%), Health Diagnosing & Treating (4,184 | 5.1%), and Health Technologists (3,020 | 3.7%).
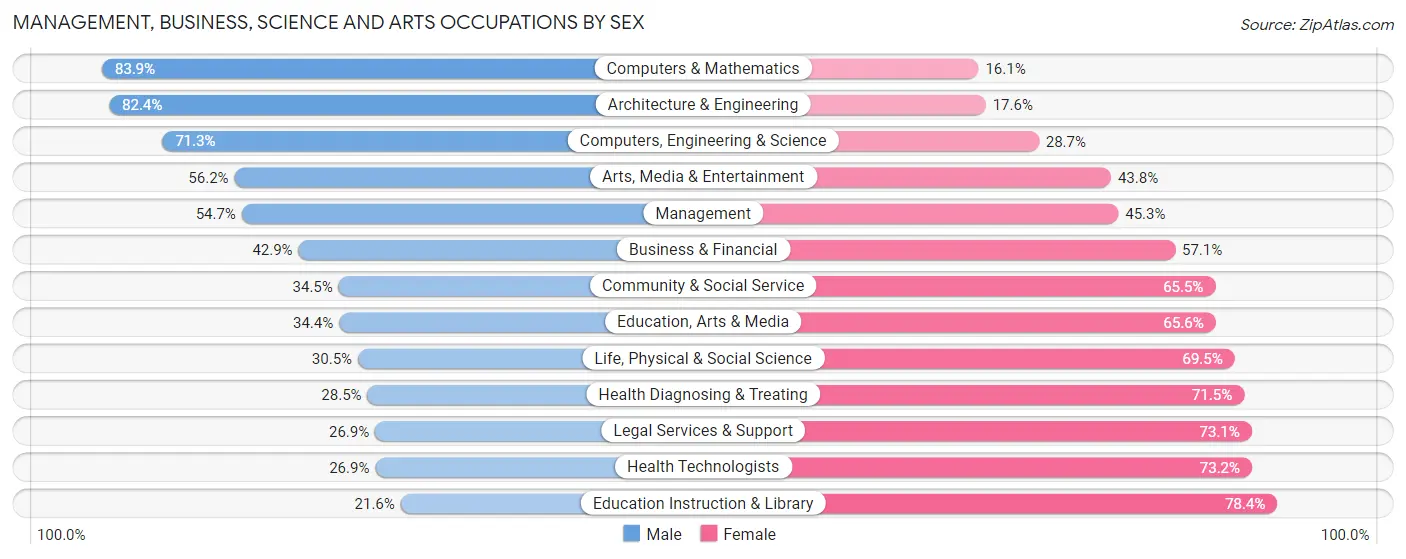
Management, Business, Science and Arts Occupations by Sex
Within the Management, Business, Science and Arts occupations in Maui County, the most male-oriented occupations are Computers & Mathematics (83.9%), Architecture & Engineering (82.4%), and Computers, Engineering & Science (71.3%), while the most female-oriented occupations are Education Instruction & Library (78.4%), Health Technologists (73.2%), and Legal Services & Support (73.1%).
| Occupation | Male | Female |
| Management | 4,658 (54.7%) | 3,856 (45.3%) |
| Business & Financial | 1,094 (42.9%) | 1,458 (57.1%) |
| Computers, Engineering & Science | 1,460 (71.3%) | 588 (28.7%) |
| Computers & Mathematics | 837 (83.9%) | 161 (16.1%) |
| Architecture & Engineering | 481 (82.4%) | 103 (17.6%) |
| Life, Physical & Social Science | 142 (30.5%) | 324 (69.5%) |
| Community & Social Service | 3,200 (34.5%) | 6,075 (65.5%) |
| Education, Arts & Media | 481 (34.4%) | 917 (65.6%) |
| Legal Services & Support | 163 (26.9%) | 443 (73.1%) |
| Education Instruction & Library | 953 (21.6%) | 3,467 (78.4%) |
| Arts, Media & Entertainment | 1,603 (56.2%) | 1,248 (43.8%) |
| Health Diagnosing & Treating | 1,192 (28.5%) | 2,992 (71.5%) |
| Health Technologists | 811 (26.9%) | 2,209 (73.2%) |
| Total (Category) | 11,604 (43.7%) | 14,969 (56.3%) |
| Total (Overall) | 41,557 (50.9%) | 40,039 (49.1%) |
Services Occupations
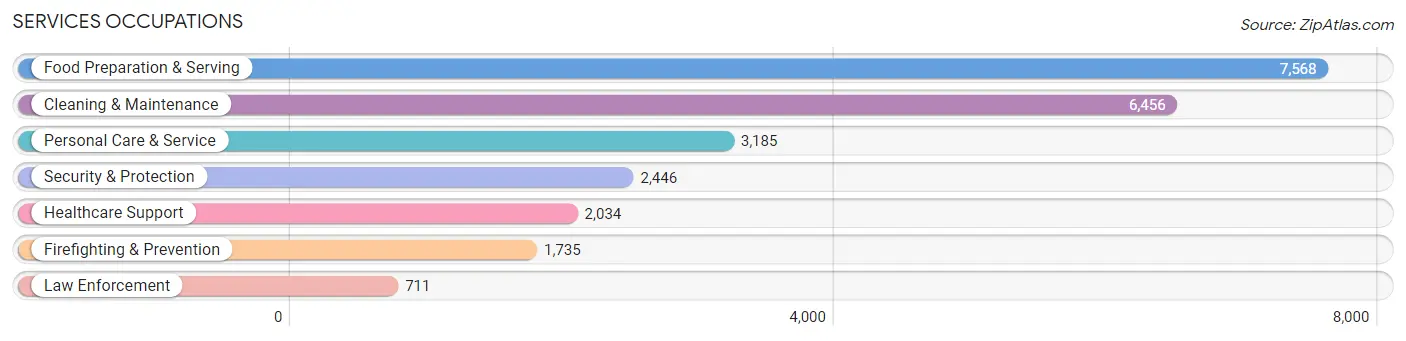
The most common Services occupations in Maui County are Food Preparation & Serving (7,568 | 9.3%), Cleaning & Maintenance (6,456 | 7.9%), Personal Care & Service (3,185 | 3.9%), Security & Protection (2,446 | 3.0%), and Healthcare Support (2,034 | 2.5%).
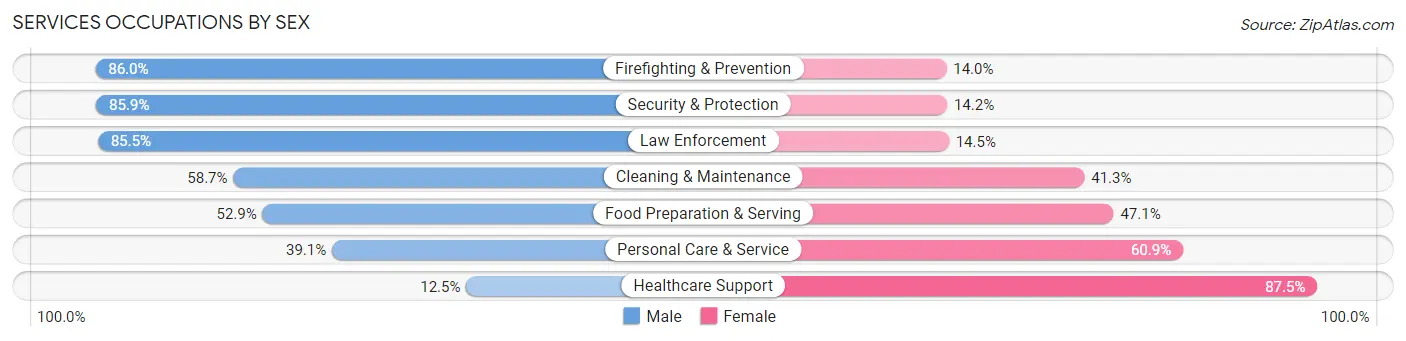
Services Occupations by Sex
Within the Services occupations in Maui County, the most male-oriented occupations are Firefighting & Prevention (86.0%), Security & Protection (85.9%), and Law Enforcement (85.5%), while the most female-oriented occupations are Healthcare Support (87.5%), Personal Care & Service (60.9%), and Food Preparation & Serving (47.1%).
| Occupation | Male | Female |
| Healthcare Support | 255 (12.5%) | 1,779 (87.5%) |
| Security & Protection | 2,100 (85.9%) | 346 (14.1%) |
| Firefighting & Prevention | 1,492 (86.0%) | 243 (14.0%) |
| Law Enforcement | 608 (85.5%) | 103 (14.5%) |
| Food Preparation & Serving | 4,002 (52.9%) | 3,566 (47.1%) |
| Cleaning & Maintenance | 3,787 (58.7%) | 2,669 (41.3%) |
| Personal Care & Service | 1,246 (39.1%) | 1,939 (60.9%) |
| Total (Category) | 11,390 (52.5%) | 10,299 (47.5%) |
| Total (Overall) | 41,557 (50.9%) | 40,039 (49.1%) |
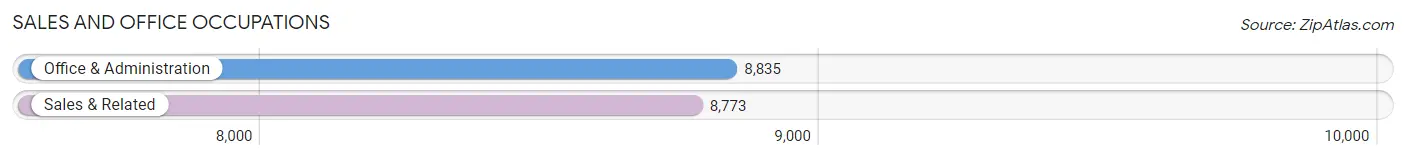
Sales and Office Occupations
The most common Sales and Office occupations in Maui County are Office & Administration (8,835 | 10.8%), and Sales & Related (8,773 | 10.7%).
Sales and Office Occupations by Sex
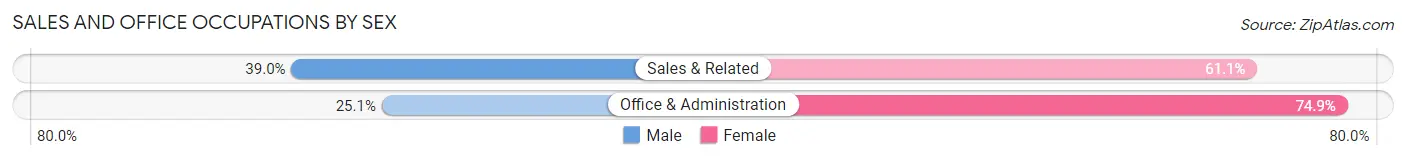
| Occupation | Male | Female |
| Sales & Related | 3,417 (39.0%) | 5,356 (61.1%) |
| Office & Administration | 2,214 (25.1%) | 6,621 (74.9%) |
| Total (Category) | 5,631 (32.0%) | 11,977 (68.0%) |
| Total (Overall) | 41,557 (50.9%) | 40,039 (49.1%) |
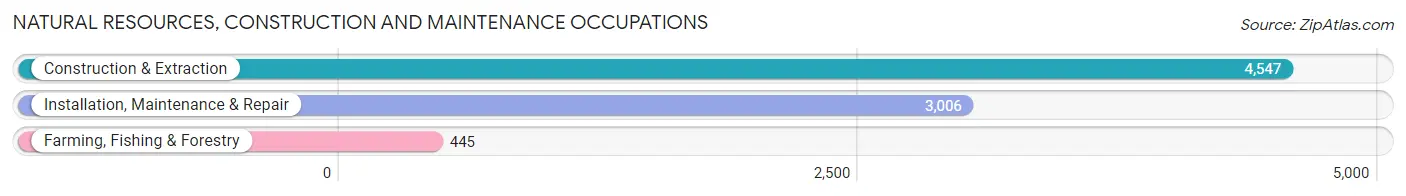
Natural Resources, Construction and Maintenance Occupations
The most common Natural Resources, Construction and Maintenance occupations in Maui County are Construction & Extraction (4,547 | 5.6%), Installation, Maintenance & Repair (3,006 | 3.7%), and Farming, Fishing & Forestry (445 | 0.5%).
Natural Resources, Construction and Maintenance Occupations by Sex
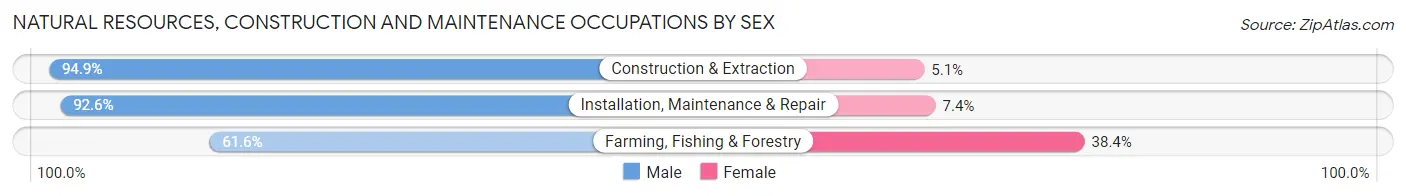
| Occupation | Male | Female |
| Farming, Fishing & Forestry | 274 (61.6%) | 171 (38.4%) |
| Construction & Extraction | 4,316 (94.9%) | 231 (5.1%) |
| Installation, Maintenance & Repair | 2,783 (92.6%) | 223 (7.4%) |
| Total (Category) | 7,373 (92.2%) | 625 (7.8%) |
| Total (Overall) | 41,557 (50.9%) | 40,039 (49.1%) |
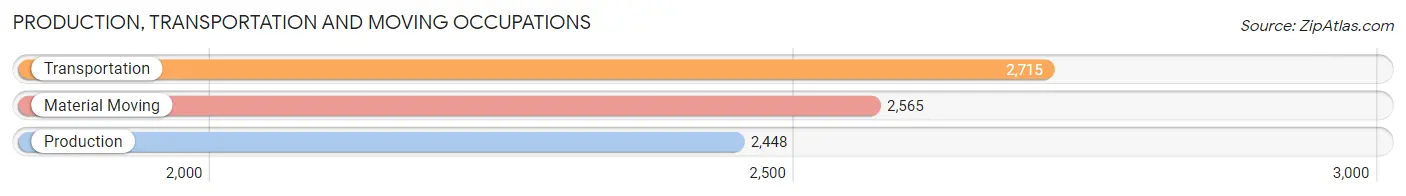
Production, Transportation and Moving Occupations
The most common Production, Transportation and Moving occupations in Maui County are Transportation (2,715 | 3.3%), Material Moving (2,565 | 3.1%), and Production (2,448 | 3.0%).
Production, Transportation and Moving Occupations by Sex
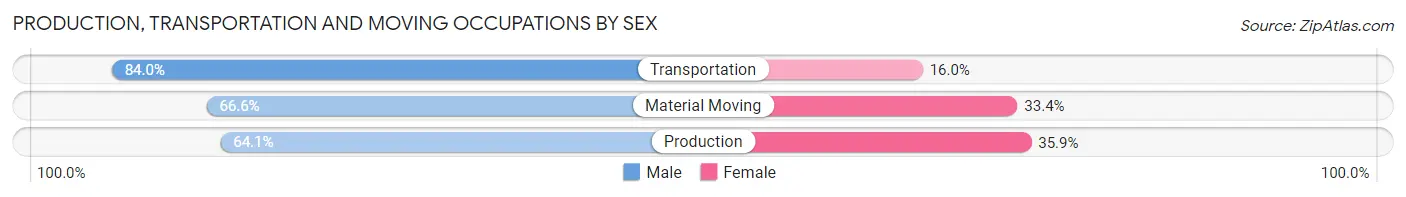
| Occupation | Male | Female |
| Production | 1,569 (64.1%) | 879 (35.9%) |
| Transportation | 2,281 (84.0%) | 434 (16.0%) |
| Material Moving | 1,709 (66.6%) | 856 (33.4%) |
| Total (Category) | 5,559 (71.9%) | 2,169 (28.1%) |
| Total (Overall) | 41,557 (50.9%) | 40,039 (49.1%) |
Employment Industries by Sex in Maui County
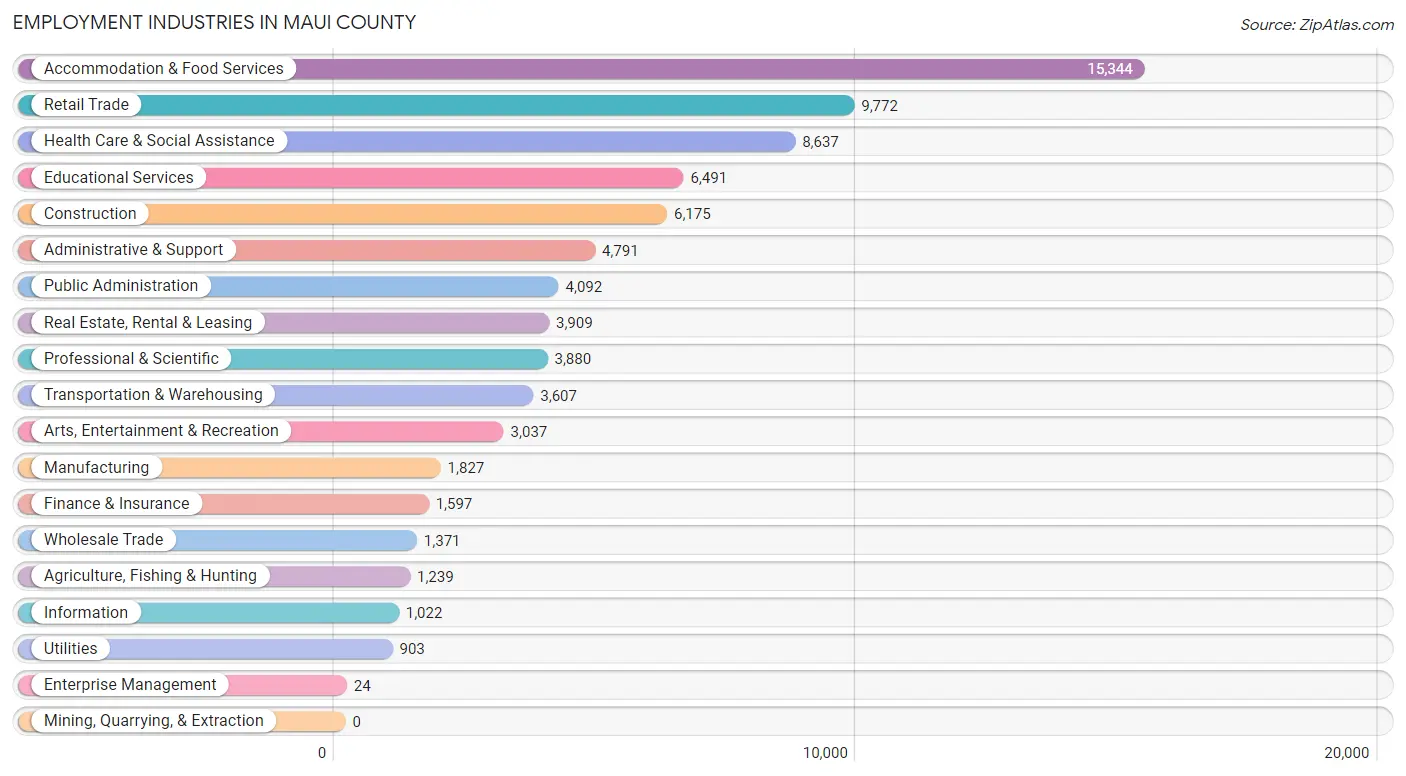
Employment Industries in Maui County
The major employment industries in Maui County include Accommodation & Food Services (15,344 | 18.8%), Retail Trade (9,772 | 12.0%), Health Care & Social Assistance (8,637 | 10.6%), Educational Services (6,491 | 8.0%), and Construction (6,175 | 7.6%).
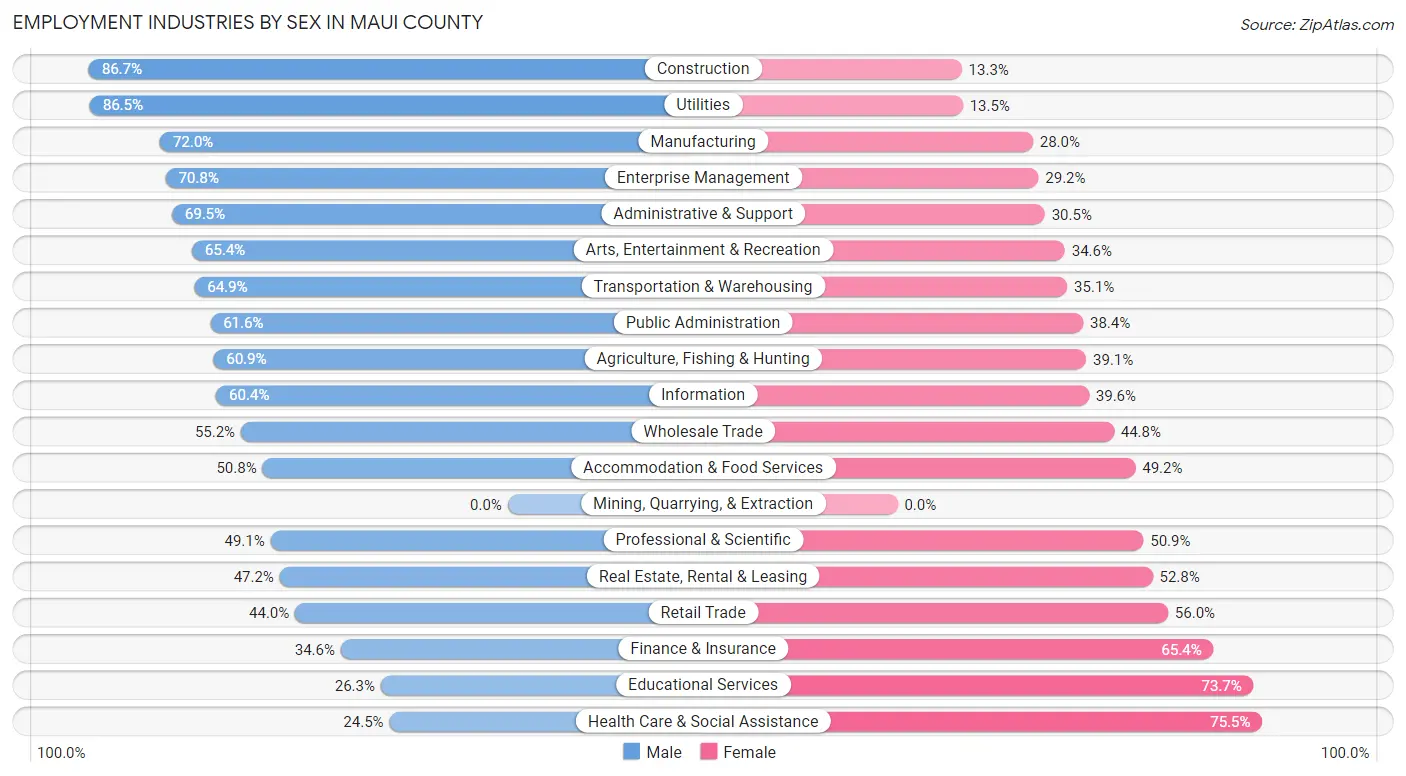
Employment Industries by Sex in Maui County
The Maui County industries that see more men than women are Construction (86.7%), Utilities (86.5%), and Manufacturing (72.0%), whereas the industries that tend to have a higher number of women are Health Care & Social Assistance (75.5%), Educational Services (73.7%), and Finance & Insurance (65.4%).
| Industry | Male | Female |
| Agriculture, Fishing & Hunting | 755 (60.9%) | 484 (39.1%) |
| Mining, Quarrying, & Extraction | 0 (0.0%) | 0 (0.0%) |
| Construction | 5,354 (86.7%) | 821 (13.3%) |
| Manufacturing | 1,315 (72.0%) | 512 (28.0%) |
| Wholesale Trade | 757 (55.2%) | 614 (44.8%) |
| Retail Trade | 4,301 (44.0%) | 5,471 (56.0%) |
| Transportation & Warehousing | 2,340 (64.9%) | 1,267 (35.1%) |
| Utilities | 781 (86.5%) | 122 (13.5%) |
| Information | 617 (60.4%) | 405 (39.6%) |
| Finance & Insurance | 552 (34.6%) | 1,045 (65.4%) |
| Real Estate, Rental & Leasing | 1,845 (47.2%) | 2,064 (52.8%) |
| Professional & Scientific | 1,905 (49.1%) | 1,975 (50.9%) |
| Enterprise Management | 17 (70.8%) | 7 (29.2%) |
| Administrative & Support | 3,330 (69.5%) | 1,461 (30.5%) |
| Educational Services | 1,706 (26.3%) | 4,785 (73.7%) |
| Health Care & Social Assistance | 2,115 (24.5%) | 6,522 (75.5%) |
| Arts, Entertainment & Recreation | 1,985 (65.4%) | 1,052 (34.6%) |
| Accommodation & Food Services | 7,789 (50.8%) | 7,555 (49.2%) |
| Public Administration | 2,520 (61.6%) | 1,572 (38.4%) |
| Total | 41,557 (50.9%) | 40,039 (49.1%) |
Education in Maui County
School Enrollment in Maui County
The most common levels of schooling among the 32,075 students in Maui County are high school (8,007 | 25.0%), elementary school (7,328 | 22.9%), and middle school (7,173 | 22.4%).
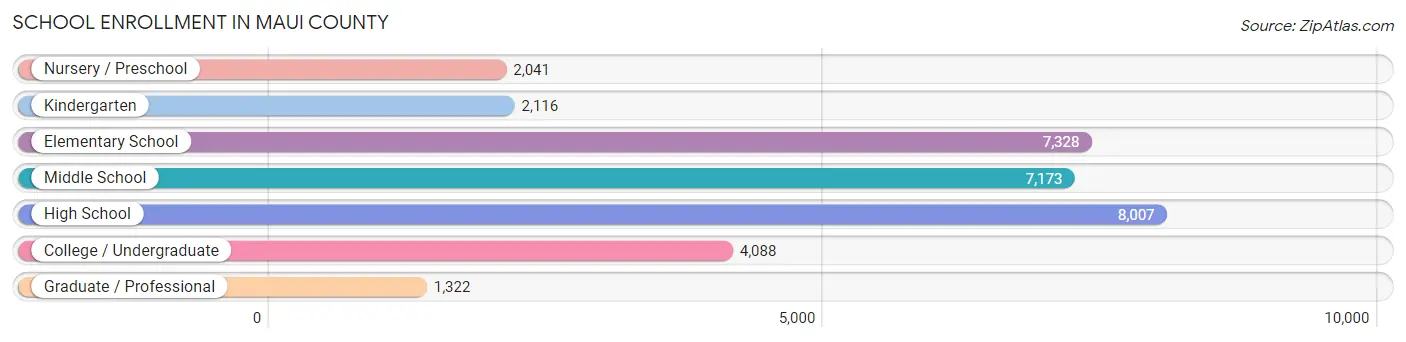
| School Level | # Students | % Students |
| Nursery / Preschool | 2,041 | 6.4% |
| Kindergarten | 2,116 | 6.6% |
| Elementary School | 7,328 | 22.9% |
| Middle School | 7,173 | 22.4% |
| High School | 8,007 | 25.0% |
| College / Undergraduate | 4,088 | 12.8% |
| Graduate / Professional | 1,322 | 4.1% |
| Total | 32,075 | 100.0% |
School Enrollment by Age by Funding Source in Maui County
Out of a total of 32,075 students who are enrolled in schools in Maui County, 6,511 (20.3%) attend a private institution, while the remaining 25,564 (79.7%) are enrolled in public schools. The age group of 3 to 4 year olds has the highest likelihood of being enrolled in private schools, with 824 (59.8% in the age bracket) enrolled. Conversely, the age group of 15 to 17 year olds has the lowest likelihood of being enrolled in a private school, with 4,784 (86.2% in the age bracket) attending a public institution.
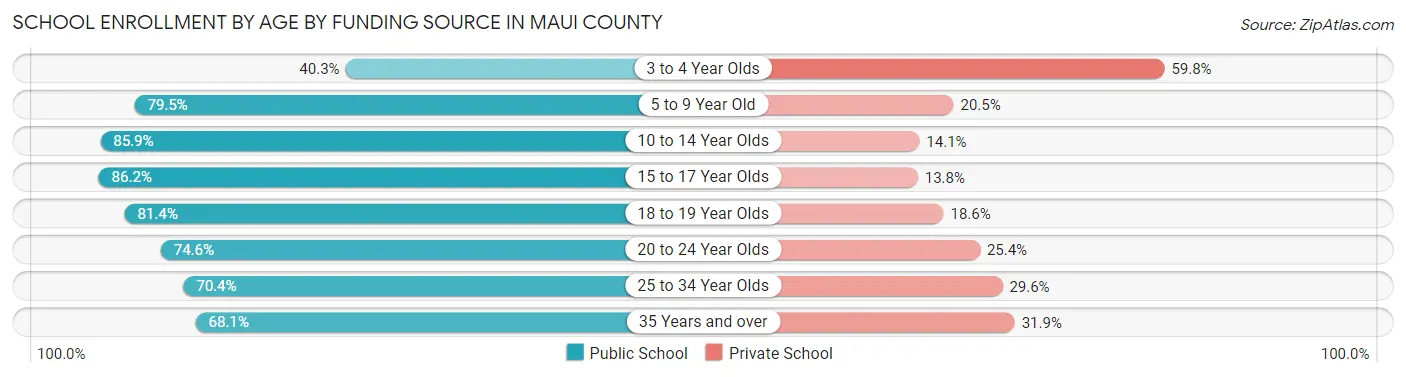
| Age Bracket | Public School | Private School |
| 3 to 4 Year Olds | 555 (40.3%) | 824 (59.8%) |
| 5 to 9 Year Old | 7,291 (79.5%) | 1,877 (20.5%) |
| 10 to 14 Year Olds | 8,155 (85.9%) | 1,340 (14.1%) |
| 15 to 17 Year Olds | 4,784 (86.2%) | 766 (13.8%) |
| 18 to 19 Year Olds | 1,413 (81.4%) | 323 (18.6%) |
| 20 to 24 Year Olds | 1,126 (74.6%) | 383 (25.4%) |
| 25 to 34 Year Olds | 698 (70.4%) | 293 (29.6%) |
| 35 Years and over | 1,531 (68.1%) | 716 (31.9%) |
| Total | 25,564 (79.7%) | 6,511 (20.3%) |
Educational Attainment by Field of Study in Maui County
Business (7,231 | 18.7%), education (4,912 | 12.7%), social sciences (3,483 | 9.0%), science & technology (3,343 | 8.7%), and bio, nature & agricultural (2,835 | 7.3%) are the most common fields of study among 38,583 individuals in Maui County who have obtained a bachelor's degree or higher.
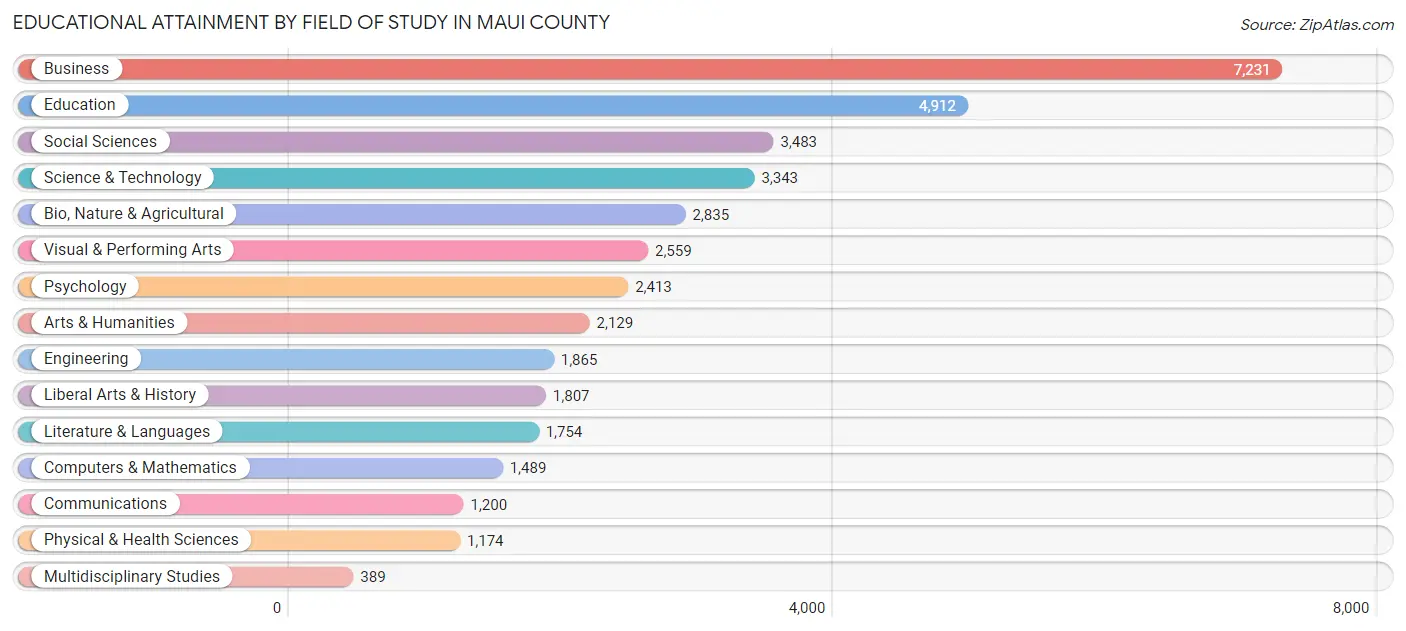
| Field of Study | # Graduates | % Graduates |
| Computers & Mathematics | 1,489 | 3.9% |
| Bio, Nature & Agricultural | 2,835 | 7.3% |
| Physical & Health Sciences | 1,174 | 3.0% |
| Psychology | 2,413 | 6.2% |
| Social Sciences | 3,483 | 9.0% |
| Engineering | 1,865 | 4.8% |
| Multidisciplinary Studies | 389 | 1.0% |
| Science & Technology | 3,343 | 8.7% |
| Business | 7,231 | 18.7% |
| Education | 4,912 | 12.7% |
| Literature & Languages | 1,754 | 4.5% |
| Liberal Arts & History | 1,807 | 4.7% |
| Visual & Performing Arts | 2,559 | 6.6% |
| Communications | 1,200 | 3.1% |
| Arts & Humanities | 2,129 | 5.5% |
| Total | 38,583 | 100.0% |
Transportation & Commute in Maui County
Vehicle Availability by Sex in Maui County
The most prevalent vehicle ownership categories in Maui County are males with 2 vehicles (14,658, accounting for 36.1%) and females with 2 vehicles (13,851, making up 37.7%).

| Vehicles Available | Male | Female |
| No Vehicle | 663 (1.6%) | 560 (1.4%) |
| 1 Vehicle | 6,031 (14.8%) | 6,899 (17.7%) |
| 2 Vehicles | 14,658 (36.1%) | 13,851 (35.6%) |
| 3 Vehicles | 9,402 (23.1%) | 8,402 (21.6%) |
| 4 Vehicles | 5,602 (13.8%) | 5,007 (12.9%) |
| 5 or more Vehicles | 4,280 (10.5%) | 4,143 (10.7%) |
| Total | 40,636 (100.0%) | 38,862 (100.0%) |
Commute Time in Maui County
The most frequently occuring commute durations in Maui County are 10 to 14 minutes (12,572 commuters, 17.2%), 15 to 19 minutes (12,503 commuters, 17.1%), and 5 to 9 minutes (10,452 commuters, 14.3%).
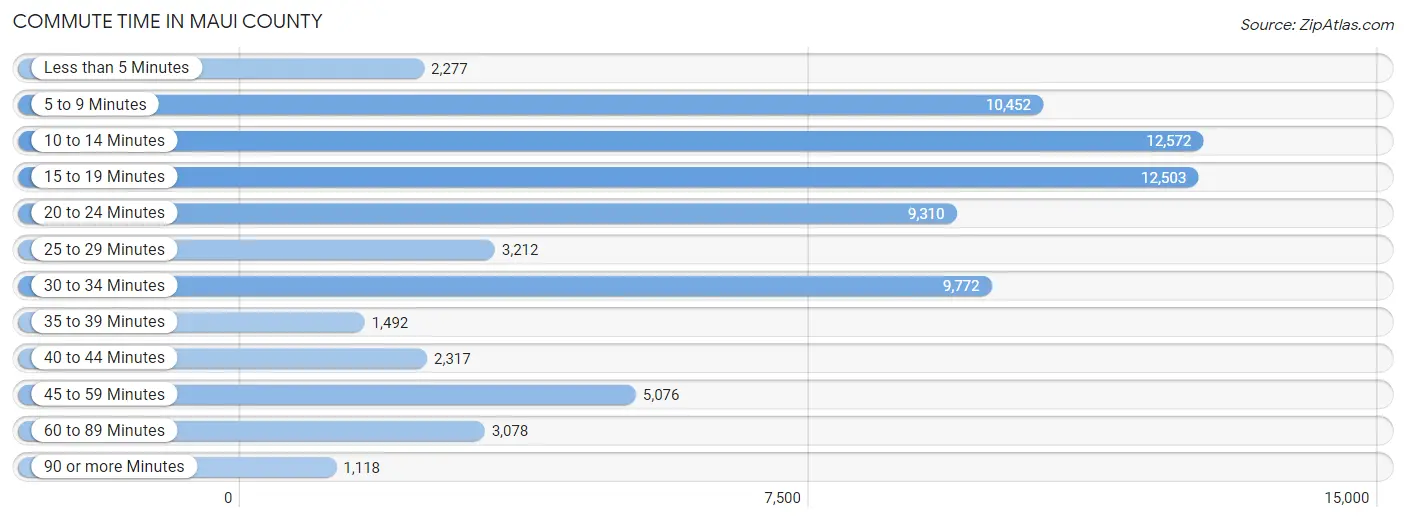
| Commute Time | # Commuters | % Commuters |
| Less than 5 Minutes | 2,277 | 3.1% |
| 5 to 9 Minutes | 10,452 | 14.3% |
| 10 to 14 Minutes | 12,572 | 17.2% |
| 15 to 19 Minutes | 12,503 | 17.1% |
| 20 to 24 Minutes | 9,310 | 12.7% |
| 25 to 29 Minutes | 3,212 | 4.4% |
| 30 to 34 Minutes | 9,772 | 13.4% |
| 35 to 39 Minutes | 1,492 | 2.0% |
| 40 to 44 Minutes | 2,317 | 3.2% |
| 45 to 59 Minutes | 5,076 | 6.9% |
| 60 to 89 Minutes | 3,078 | 4.2% |
| 90 or more Minutes | 1,118 | 1.5% |
Commute Time by Sex in Maui County
The most common commute times in Maui County are 15 to 19 minutes (6,615 commuters, 17.3%) for males and 10 to 14 minutes (6,701 commuters, 19.1%) for females.
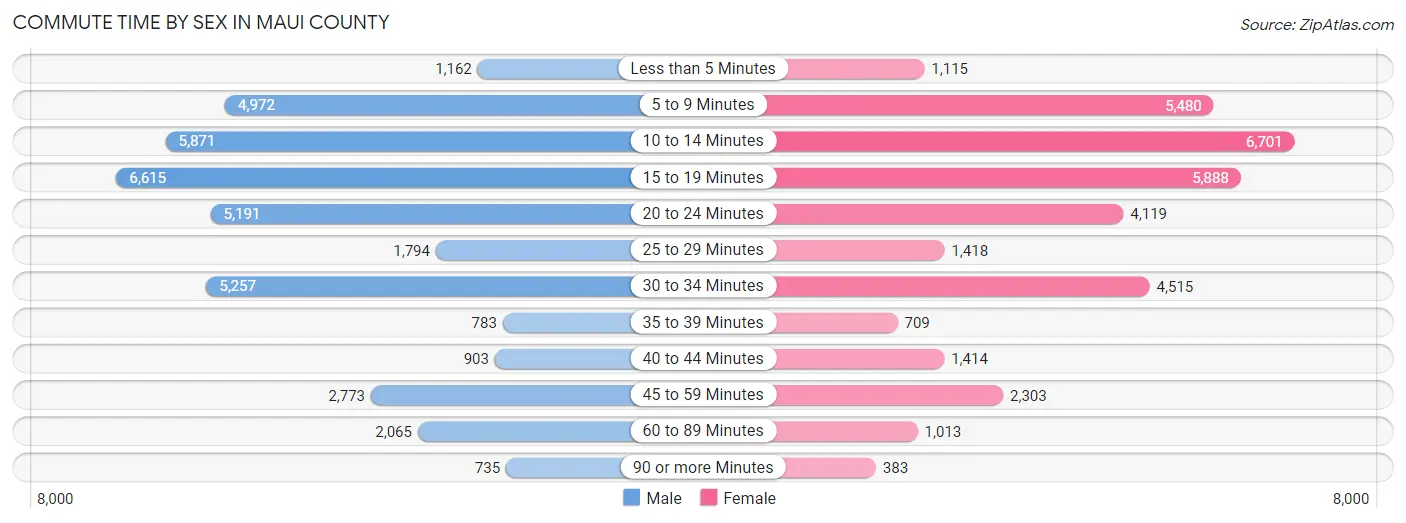
| Commute Time | Male | Female |
| Less than 5 Minutes | 1,162 (3.0%) | 1,115 (3.2%) |
| 5 to 9 Minutes | 4,972 (13.0%) | 5,480 (15.6%) |
| 10 to 14 Minutes | 5,871 (15.4%) | 6,701 (19.1%) |
| 15 to 19 Minutes | 6,615 (17.3%) | 5,888 (16.8%) |
| 20 to 24 Minutes | 5,191 (13.6%) | 4,119 (11.7%) |
| 25 to 29 Minutes | 1,794 (4.7%) | 1,418 (4.0%) |
| 30 to 34 Minutes | 5,257 (13.8%) | 4,515 (12.9%) |
| 35 to 39 Minutes | 783 (2.1%) | 709 (2.0%) |
| 40 to 44 Minutes | 903 (2.4%) | 1,414 (4.0%) |
| 45 to 59 Minutes | 2,773 (7.3%) | 2,303 (6.6%) |
| 60 to 89 Minutes | 2,065 (5.4%) | 1,013 (2.9%) |
| 90 or more Minutes | 735 (1.9%) | 383 (1.1%) |
Time of Departure to Work by Sex in Maui County
The most frequent times of departure to work in Maui County are 7:00 AM to 7:29 AM (5,695, 14.9%) for males and 7:00 AM to 7:29 AM (6,327, 18.0%) for females.
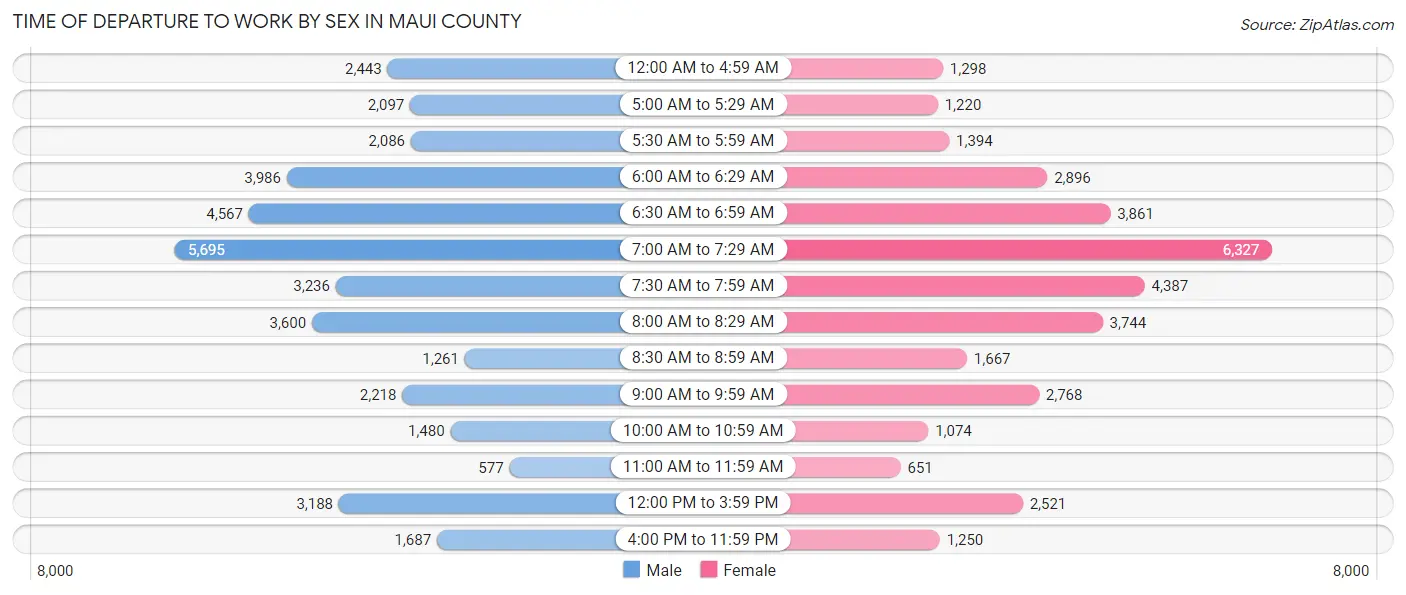
| Time of Departure | Male | Female |
| 12:00 AM to 4:59 AM | 2,443 (6.4%) | 1,298 (3.7%) |
| 5:00 AM to 5:29 AM | 2,097 (5.5%) | 1,220 (3.5%) |
| 5:30 AM to 5:59 AM | 2,086 (5.5%) | 1,394 (4.0%) |
| 6:00 AM to 6:29 AM | 3,986 (10.5%) | 2,896 (8.3%) |
| 6:30 AM to 6:59 AM | 4,567 (12.0%) | 3,861 (11.0%) |
| 7:00 AM to 7:29 AM | 5,695 (14.9%) | 6,327 (18.0%) |
| 7:30 AM to 7:59 AM | 3,236 (8.5%) | 4,387 (12.5%) |
| 8:00 AM to 8:29 AM | 3,600 (9.4%) | 3,744 (10.7%) |
| 8:30 AM to 8:59 AM | 1,261 (3.3%) | 1,667 (4.8%) |
| 9:00 AM to 9:59 AM | 2,218 (5.8%) | 2,768 (7.9%) |
| 10:00 AM to 10:59 AM | 1,480 (3.9%) | 1,074 (3.1%) |
| 11:00 AM to 11:59 AM | 577 (1.5%) | 651 (1.9%) |
| 12:00 PM to 3:59 PM | 3,188 (8.4%) | 2,521 (7.2%) |
| 4:00 PM to 11:59 PM | 1,687 (4.4%) | 1,250 (3.6%) |
| Total | 38,121 (100.0%) | 35,058 (100.0%) |
Housing Occupancy in Maui County
Occupancy by Ownership in Maui County
Of the total 54,728 dwellings in Maui County, owner-occupied units account for 35,758 (65.3%), while renter-occupied units make up 18,970 (34.7%).
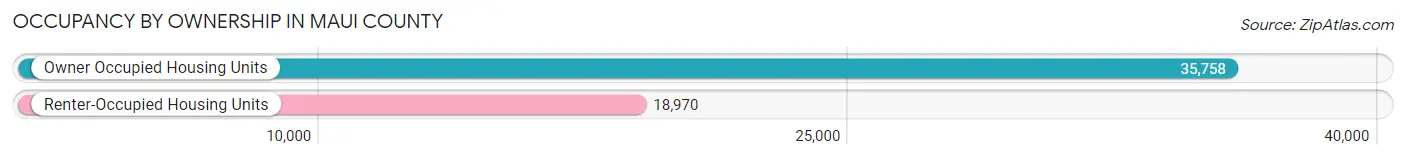
| Occupancy | # Housing Units | % Housing Units |
| Owner Occupied Housing Units | 35,758 | 65.3% |
| Renter-Occupied Housing Units | 18,970 | 34.7% |
| Total Occupied Housing Units | 54,728 | 100.0% |
Occupancy by Household Size in Maui County
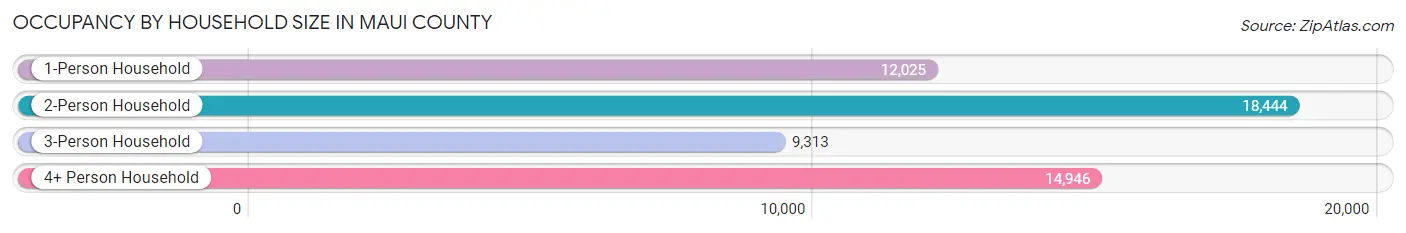
| Household Size | # Housing Units | % Housing Units |
| 1-Person Household | 12,025 | 22.0% |
| 2-Person Household | 18,444 | 33.7% |
| 3-Person Household | 9,313 | 17.0% |
| 4+ Person Household | 14,946 | 27.3% |
| Total Housing Units | 54,728 | 100.0% |
Occupancy by Ownership by Household Size in Maui County
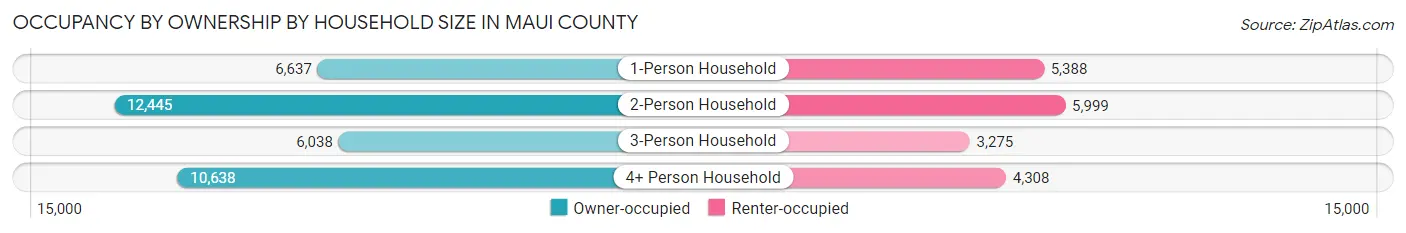
| Household Size | Owner-occupied | Renter-occupied |
| 1-Person Household | 6,637 (55.2%) | 5,388 (44.8%) |
| 2-Person Household | 12,445 (67.5%) | 5,999 (32.5%) |
| 3-Person Household | 6,038 (64.8%) | 3,275 (35.2%) |
| 4+ Person Household | 10,638 (71.2%) | 4,308 (28.8%) |
| Total Housing Units | 35,758 (65.3%) | 18,970 (34.7%) |
Occupancy by Educational Attainment in Maui County
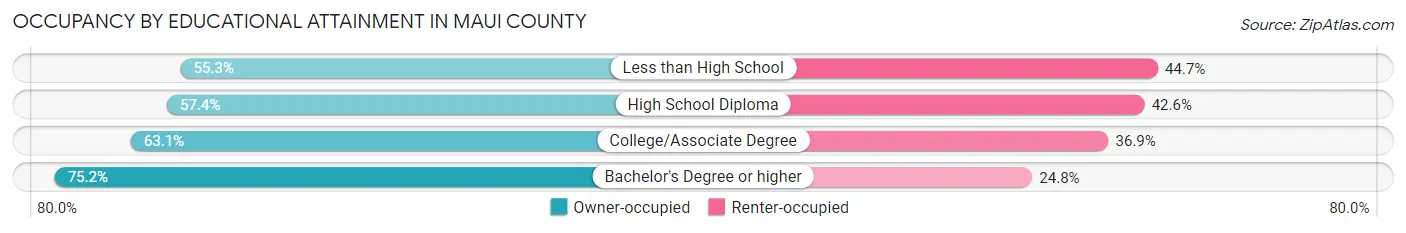
| Household Size | Owner-occupied | Renter-occupied |
| Less than High School | 1,846 (55.3%) | 1,494 (44.7%) |
| High School Diploma | 7,818 (57.4%) | 5,803 (42.6%) |
| College/Associate Degree | 12,085 (63.1%) | 7,058 (36.9%) |
| Bachelor's Degree or higher | 14,009 (75.2%) | 4,615 (24.8%) |
Occupancy by Age of Householder in Maui County
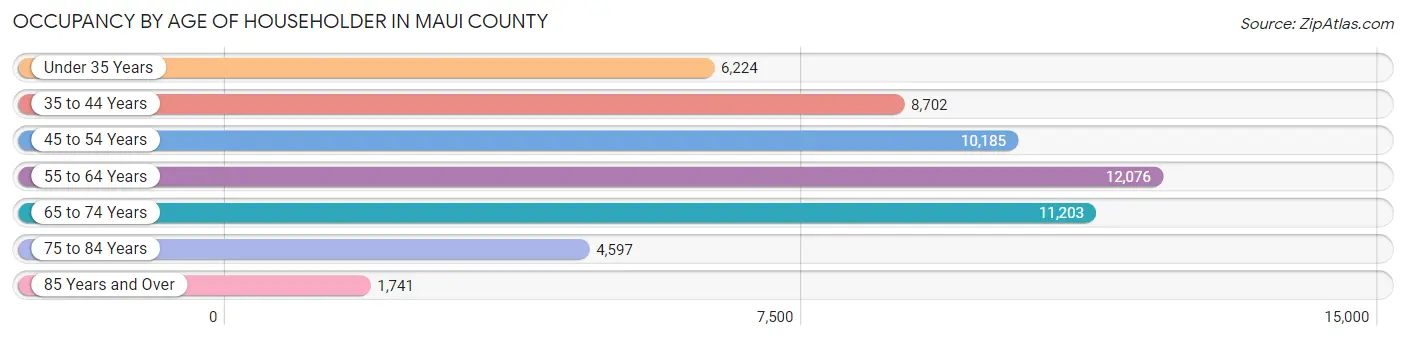
| Age Bracket | # Households | % Households |
| Under 35 Years | 6,224 | 11.4% |
| 35 to 44 Years | 8,702 | 15.9% |
| 45 to 54 Years | 10,185 | 18.6% |
| 55 to 64 Years | 12,076 | 22.1% |
| 65 to 74 Years | 11,203 | 20.5% |
| 75 to 84 Years | 4,597 | 8.4% |
| 85 Years and Over | 1,741 | 3.2% |
| Total | 54,728 | 100.0% |
Housing Finances in Maui County
Median Income by Occupancy in Maui County
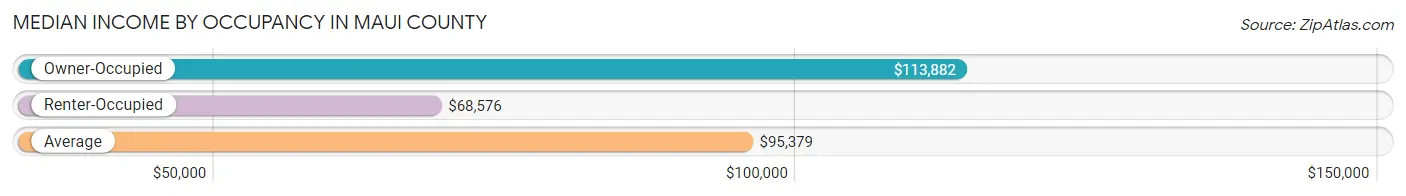
| Occupancy Type | # Households | Median Income |
| Owner-Occupied | 35,758 (65.3%) | $113,882 |
| Renter-Occupied | 18,970 (34.7%) | $68,576 |
| Average | 54,728 (100.0%) | $95,379 |
Occupancy by Householder Income Bracket in Maui County
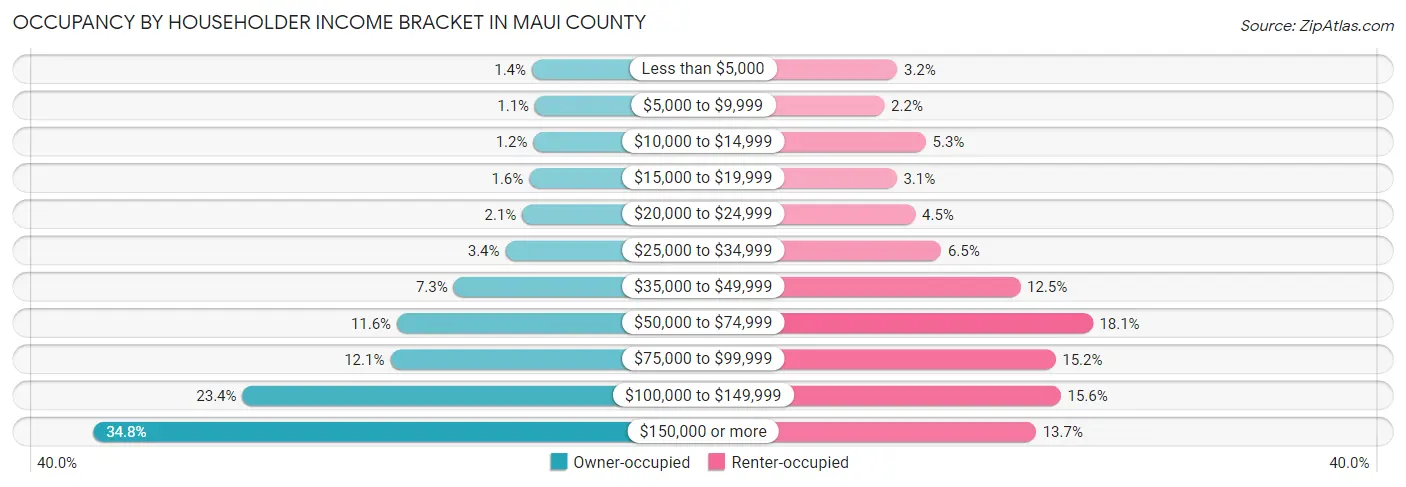
| Income Bracket | Owner-occupied | Renter-occupied |
| Less than $5,000 | 481 (1.3%) | 600 (3.2%) |
| $5,000 to $9,999 | 399 (1.1%) | 414 (2.2%) |
| $10,000 to $14,999 | 442 (1.2%) | 1,013 (5.3%) |
| $15,000 to $19,999 | 559 (1.6%) | 592 (3.1%) |
| $20,000 to $24,999 | 747 (2.1%) | 861 (4.5%) |
| $25,000 to $34,999 | 1,206 (3.4%) | 1,234 (6.5%) |
| $35,000 to $49,999 | 2,618 (7.3%) | 2,377 (12.5%) |
| $50,000 to $74,999 | 4,158 (11.6%) | 3,424 (18.0%) |
| $75,000 to $99,999 | 4,342 (12.1%) | 2,887 (15.2%) |
| $100,000 to $149,999 | 8,372 (23.4%) | 2,964 (15.6%) |
| $150,000 or more | 12,434 (34.8%) | 2,604 (13.7%) |
| Total | 35,758 (100.0%) | 18,970 (100.0%) |
Monthly Housing Cost Tiers in Maui County
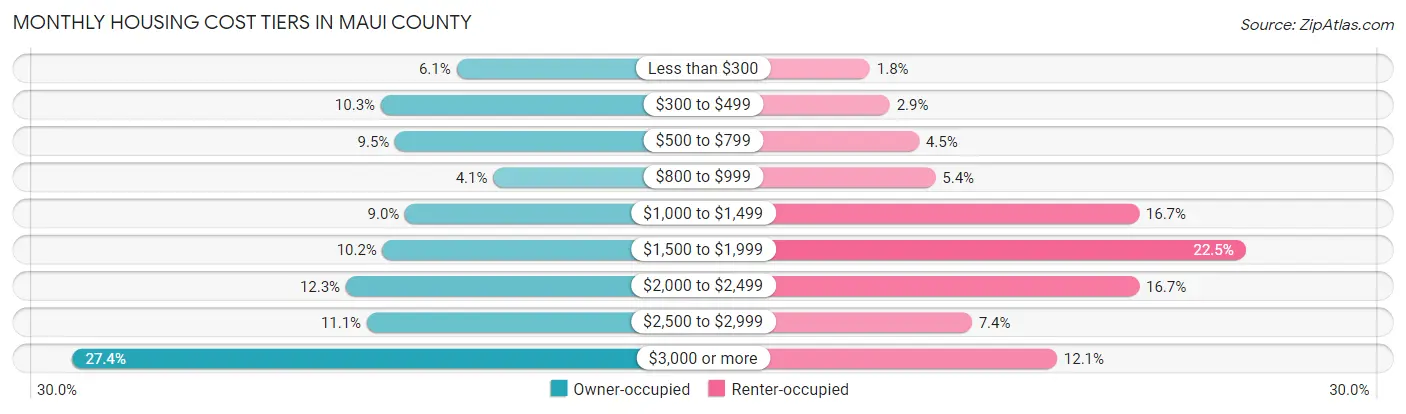
| Monthly Cost | Owner-occupied | Renter-occupied |
| Less than $300 | 2,196 (6.1%) | 339 (1.8%) |
| $300 to $499 | 3,692 (10.3%) | 548 (2.9%) |
| $500 to $799 | 3,409 (9.5%) | 854 (4.5%) |
| $800 to $999 | 1,468 (4.1%) | 1,027 (5.4%) |
| $1,000 to $1,499 | 3,212 (9.0%) | 3,158 (16.7%) |
| $1,500 to $1,999 | 3,656 (10.2%) | 4,275 (22.5%) |
| $2,000 to $2,499 | 4,379 (12.2%) | 3,161 (16.7%) |
| $2,500 to $2,999 | 3,965 (11.1%) | 1,407 (7.4%) |
| $3,000 or more | 9,781 (27.4%) | 2,300 (12.1%) |
| Total | 35,758 (100.0%) | 18,970 (100.0%) |
Physical Housing Characteristics in Maui County
Housing Structures in Maui County
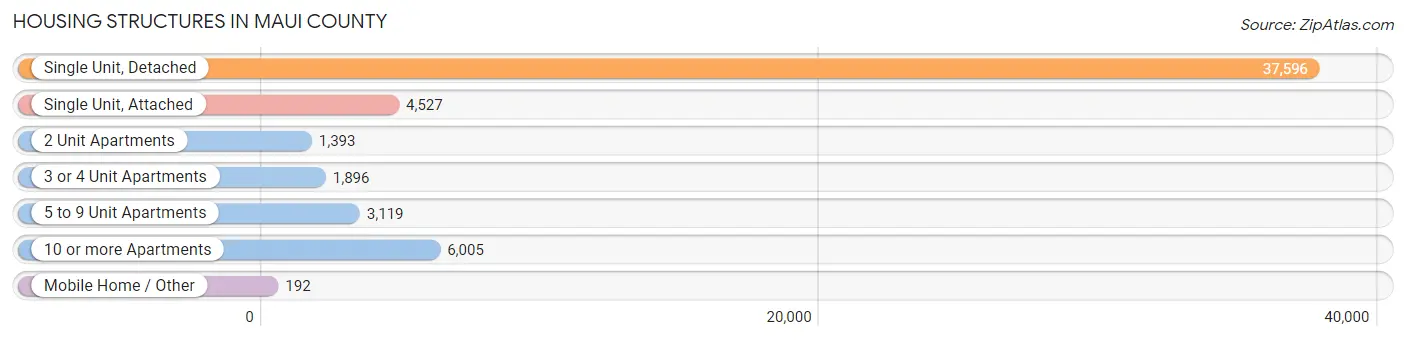
| Structure Type | # Housing Units | % Housing Units |
| Single Unit, Detached | 37,596 | 68.7% |
| Single Unit, Attached | 4,527 | 8.3% |
| 2 Unit Apartments | 1,393 | 2.5% |
| 3 or 4 Unit Apartments | 1,896 | 3.5% |
| 5 to 9 Unit Apartments | 3,119 | 5.7% |
| 10 or more Apartments | 6,005 | 11.0% |
| Mobile Home / Other | 192 | 0.4% |
| Total | 54,728 | 100.0% |
Housing Structures by Occupancy in Maui County
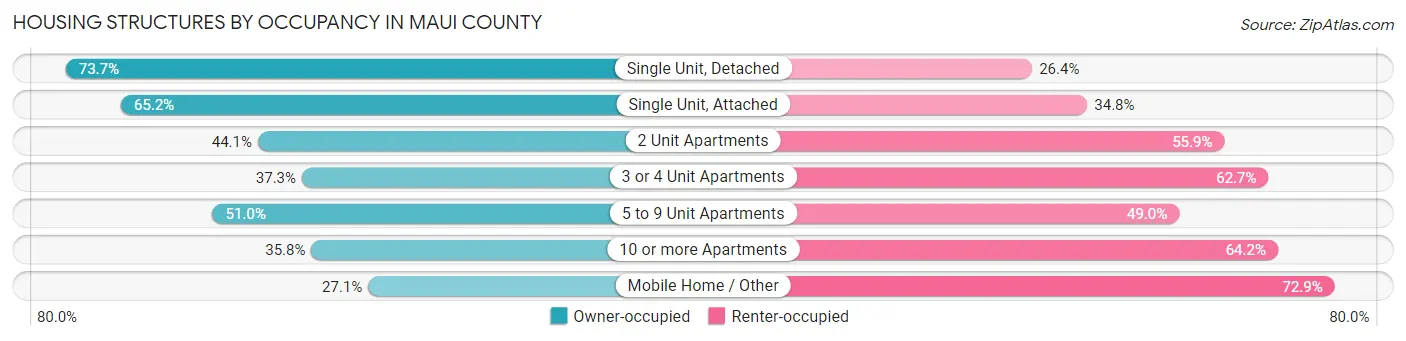
| Structure Type | Owner-occupied | Renter-occupied |
| Single Unit, Detached | 27,691 (73.7%) | 9,905 (26.4%) |
| Single Unit, Attached | 2,950 (65.2%) | 1,577 (34.8%) |
| 2 Unit Apartments | 614 (44.1%) | 779 (55.9%) |
| 3 or 4 Unit Apartments | 707 (37.3%) | 1,189 (62.7%) |
| 5 to 9 Unit Apartments | 1,592 (51.0%) | 1,527 (49.0%) |
| 10 or more Apartments | 2,152 (35.8%) | 3,853 (64.2%) |
| Mobile Home / Other | 52 (27.1%) | 140 (72.9%) |
| Total | 35,758 (65.3%) | 18,970 (34.7%) |
Housing Structures by Number of Rooms in Maui County
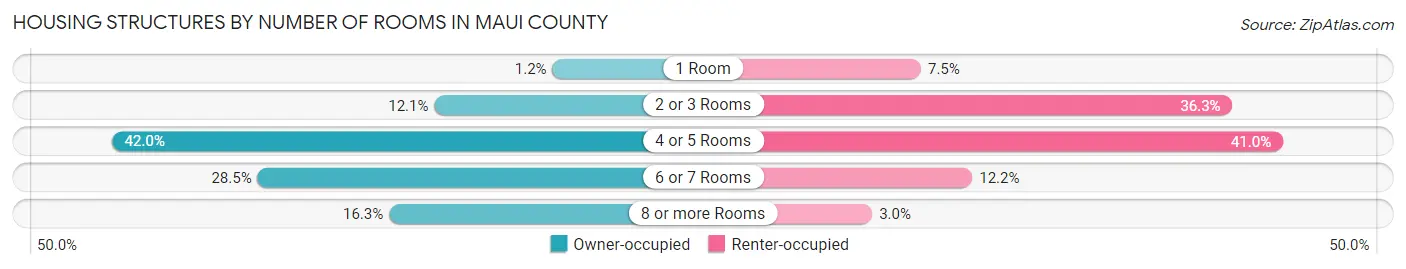
| Number of Rooms | Owner-occupied | Renter-occupied |
| 1 Room | 422 (1.2%) | 1,422 (7.5%) |
| 2 or 3 Rooms | 4,331 (12.1%) | 6,887 (36.3%) |
| 4 or 5 Rooms | 15,003 (42.0%) | 7,773 (41.0%) |
| 6 or 7 Rooms | 10,178 (28.5%) | 2,321 (12.2%) |
| 8 or more Rooms | 5,824 (16.3%) | 567 (3.0%) |
| Total | 35,758 (100.0%) | 18,970 (100.0%) |
Housing Structure by Heating Type in Maui County
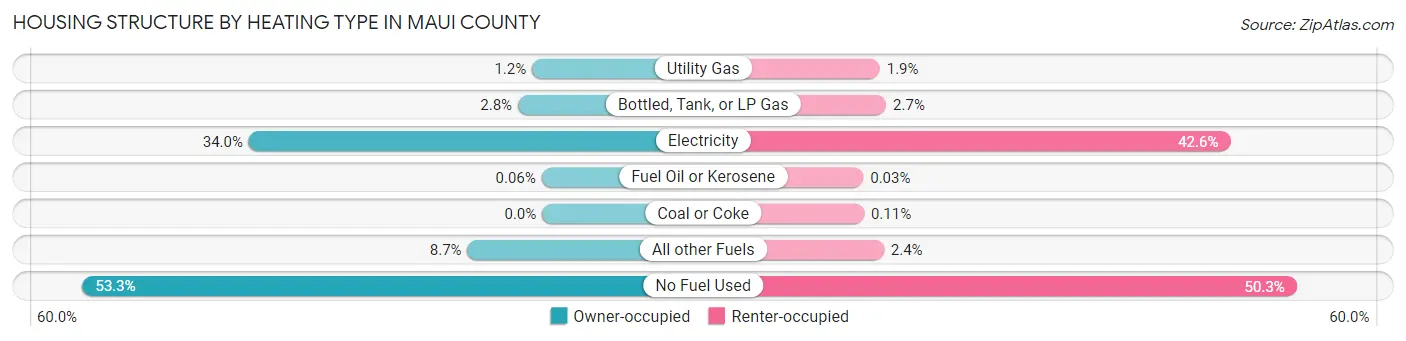
| Heating Type | Owner-occupied | Renter-occupied |
| Utility Gas | 418 (1.2%) | 368 (1.9%) |
| Bottled, Tank, or LP Gas | 1,002 (2.8%) | 508 (2.7%) |
| Electricity | 12,162 (34.0%) | 8,075 (42.6%) |
| Fuel Oil or Kerosene | 20 (0.1%) | 5 (0.0%) |
| Coal or Coke | 0 (0.0%) | 20 (0.1%) |
| All other Fuels | 3,095 (8.7%) | 458 (2.4%) |
| No Fuel Used | 19,061 (53.3%) | 9,536 (50.3%) |
| Total | 35,758 (100.0%) | 18,970 (100.0%) |
Household Vehicle Usage in Maui County
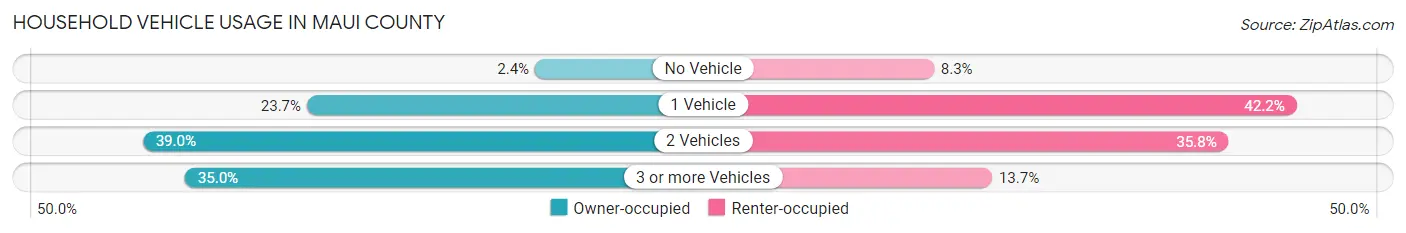
| Vehicles per Household | Owner-occupied | Renter-occupied |
| No Vehicle | 843 (2.4%) | 1,575 (8.3%) |
| 1 Vehicle | 8,455 (23.6%) | 7,998 (42.2%) |
| 2 Vehicles | 13,934 (39.0%) | 6,793 (35.8%) |
| 3 or more Vehicles | 12,526 (35.0%) | 2,604 (13.7%) |
| Total | 35,758 (100.0%) | 18,970 (100.0%) |
Real Estate & Mortgages in Maui County
Real Estate and Mortgage Overview in Maui County
| Characteristic | Without Mortgage | With Mortgage |
| Housing Units | 12,221 | 23,537 |
| Median Property Value | $795,200 | $802,300 |
| Median Household Income | $89,159 | $9,255 |
| Monthly Housing Costs | $527 | $9,667 |
| Real Estate Taxes | $1,400 | $1,223 |
Property Value by Mortgage Status in Maui County
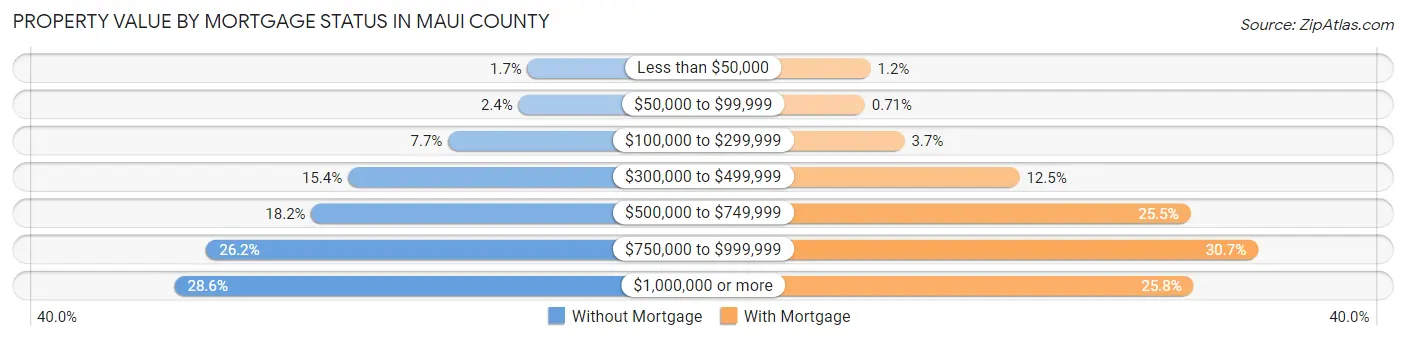
| Property Value | Without Mortgage | With Mortgage |
| Less than $50,000 | 204 (1.7%) | 271 (1.1%) |
| $50,000 to $99,999 | 289 (2.4%) | 166 (0.7%) |
| $100,000 to $299,999 | 945 (7.7%) | 877 (3.7%) |
| $300,000 to $499,999 | 1,877 (15.4%) | 2,939 (12.5%) |
| $500,000 to $749,999 | 2,218 (18.1%) | 6,007 (25.5%) |
| $750,000 to $999,999 | 3,196 (26.2%) | 7,217 (30.7%) |
| $1,000,000 or more | 3,492 (28.6%) | 6,060 (25.8%) |
| Total | 12,221 (100.0%) | 23,537 (100.0%) |
Household Income by Mortgage Status in Maui County
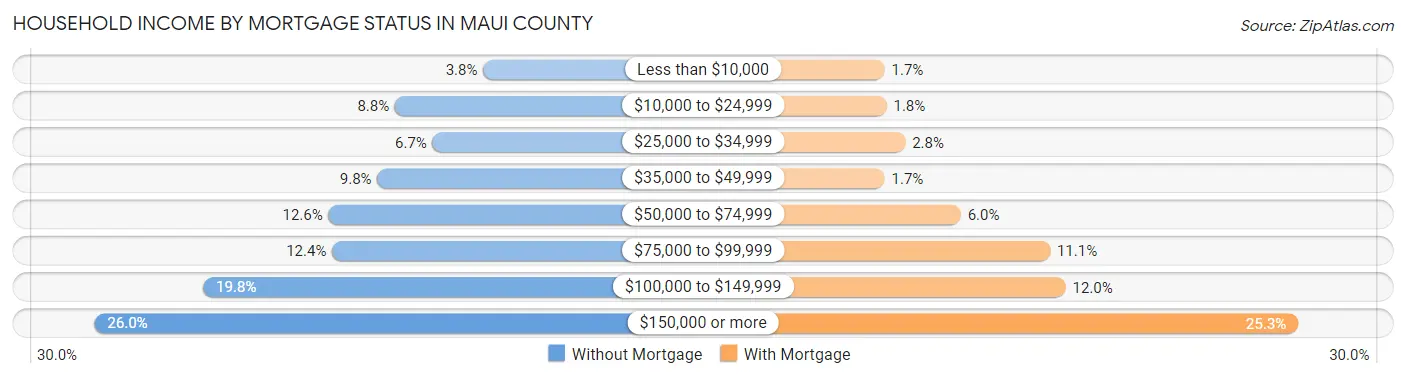
| Household Income | Without Mortgage | With Mortgage |
| Less than $10,000 | 463 (3.8%) | 390 (1.7%) |
| $10,000 to $24,999 | 1,079 (8.8%) | 417 (1.8%) |
| $25,000 to $34,999 | 816 (6.7%) | 669 (2.8%) |
| $35,000 to $49,999 | 1,203 (9.8%) | 390 (1.7%) |
| $50,000 to $74,999 | 1,543 (12.6%) | 1,415 (6.0%) |
| $75,000 to $99,999 | 1,518 (12.4%) | 2,615 (11.1%) |
| $100,000 to $149,999 | 2,420 (19.8%) | 2,824 (12.0%) |
| $150,000 or more | 3,179 (26.0%) | 5,952 (25.3%) |
| Total | 12,221 (100.0%) | 23,537 (100.0%) |
Property Value to Household Income Ratio in Maui County
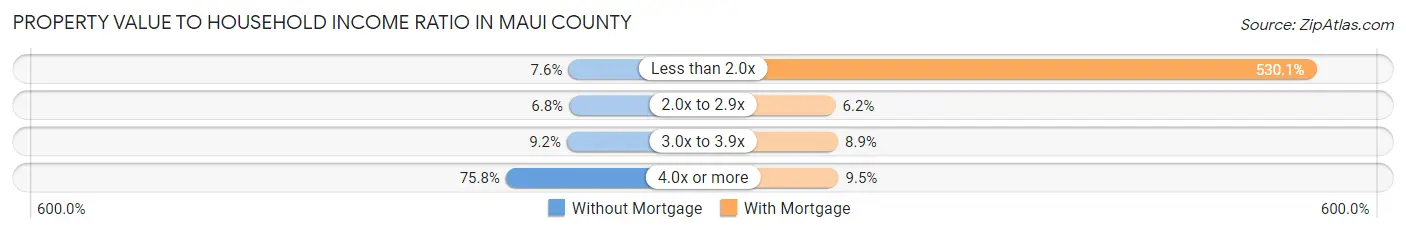
| Value-to-Income Ratio | Without Mortgage | With Mortgage |
| Less than 2.0x | 932 (7.6%) | 124,763 (530.1%) |
| 2.0x to 2.9x | 835 (6.8%) | 1,459 (6.2%) |
| 3.0x to 3.9x | 1,123 (9.2%) | 2,097 (8.9%) |
| 4.0x or more | 9,257 (75.7%) | 2,229 (9.5%) |
| Total | 12,221 (100.0%) | 23,537 (100.0%) |
Real Estate Taxes by Mortgage Status in Maui County
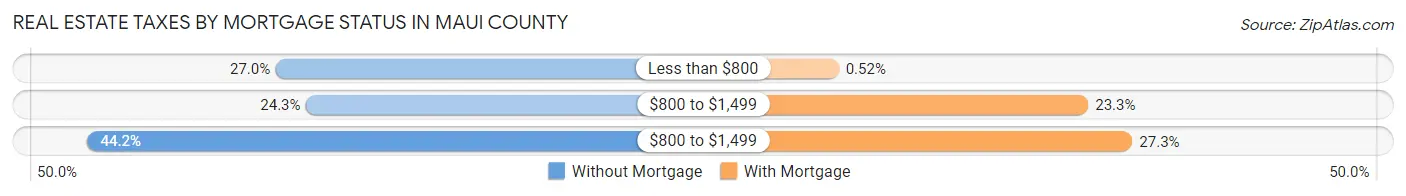
| Property Taxes | Without Mortgage | With Mortgage |
| Less than $800 | 3,305 (27.0%) | 122 (0.5%) |
| $800 to $1,499 | 2,966 (24.3%) | 5,487 (23.3%) |
| $800 to $1,499 | 5,406 (44.2%) | 6,435 (27.3%) |
| Total | 12,221 (100.0%) | 23,537 (100.0%) |
Health & Disability in Maui County
Health Insurance Coverage by Age in Maui County
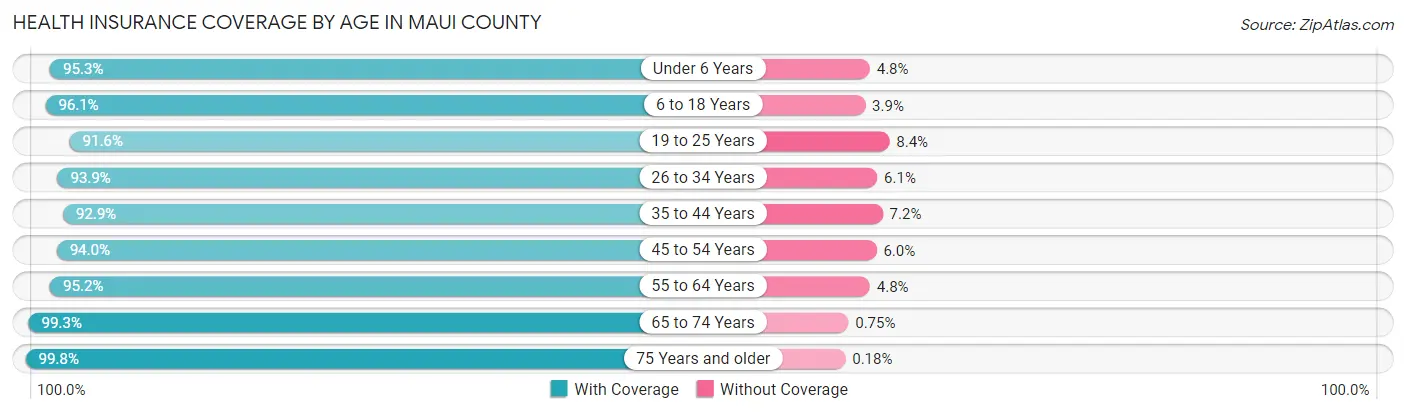
| Age Bracket | With Coverage | Without Coverage |
| Under 6 Years | 10,623 (95.3%) | 530 (4.8%) |
| 6 to 18 Years | 24,935 (96.1%) | 1,008 (3.9%) |
| 19 to 25 Years | 10,027 (91.6%) | 920 (8.4%) |
| 26 to 34 Years | 16,023 (93.9%) | 1,046 (6.1%) |
| 35 to 44 Years | 20,872 (92.8%) | 1,608 (7.1%) |
| 45 to 54 Years | 19,674 (94.0%) | 1,256 (6.0%) |
| 55 to 64 Years | 21,936 (95.2%) | 1,099 (4.8%) |
| 65 to 74 Years | 19,482 (99.3%) | 148 (0.7%) |
| 75 Years and older | 11,807 (99.8%) | 21 (0.2%) |
| Total | 155,379 (95.3%) | 7,636 (4.7%) |
Health Insurance Coverage by Citizenship Status in Maui County
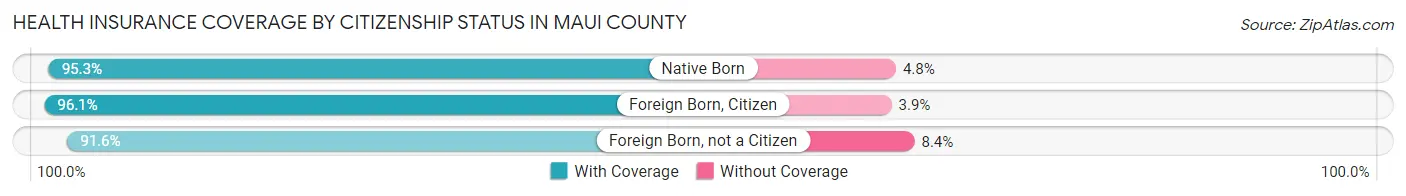
| Citizenship Status | With Coverage | Without Coverage |
| Native Born | 10,623 (95.3%) | 530 (4.8%) |
| Foreign Born, Citizen | 24,935 (96.1%) | 1,008 (3.9%) |
| Foreign Born, not a Citizen | 10,027 (91.6%) | 920 (8.4%) |
Health Insurance Coverage by Household Income in Maui County
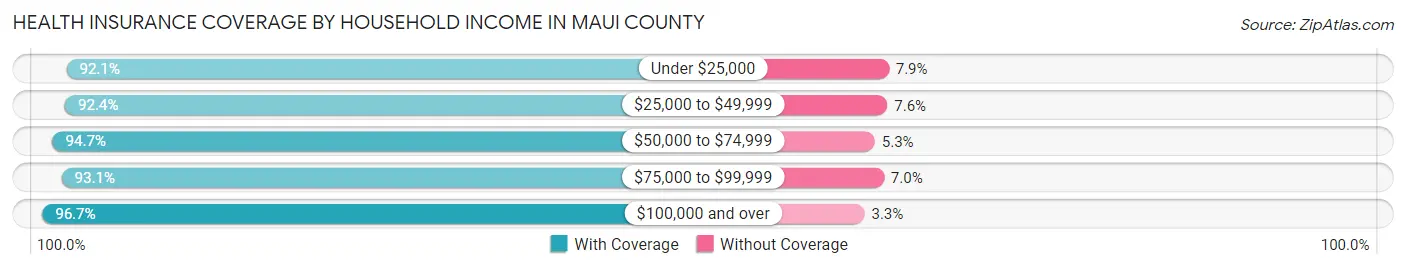
| Household Income | With Coverage | Without Coverage |
| Under $25,000 | 9,308 (92.1%) | 795 (7.9%) |
| $25,000 to $49,999 | 14,424 (92.4%) | 1,186 (7.6%) |
| $50,000 to $74,999 | 18,565 (94.7%) | 1,031 (5.3%) |
| $75,000 to $99,999 | 17,861 (93.0%) | 1,335 (7.0%) |
| $100,000 and over | 93,656 (96.7%) | 3,215 (3.3%) |
Public vs Private Health Insurance Coverage by Age in Maui County
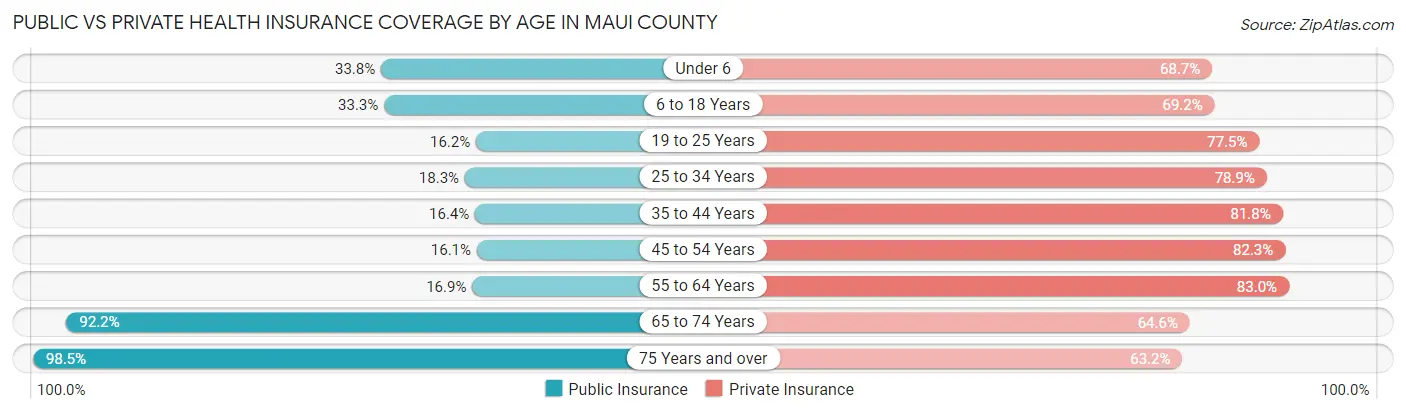
| Age Bracket | Public Insurance | Private Insurance |
| Under 6 | 3,774 (33.8%) | 7,666 (68.7%) |
| 6 to 18 Years | 8,630 (33.3%) | 17,948 (69.2%) |
| 19 to 25 Years | 1,775 (16.2%) | 8,482 (77.5%) |
| 25 to 34 Years | 3,119 (18.3%) | 13,461 (78.9%) |
| 35 to 44 Years | 3,683 (16.4%) | 18,391 (81.8%) |
| 45 to 54 Years | 3,359 (16.1%) | 17,222 (82.3%) |
| 55 to 64 Years | 3,896 (16.9%) | 19,114 (83.0%) |
| 65 to 74 Years | 18,107 (92.2%) | 12,678 (64.6%) |
| 75 Years and over | 11,646 (98.5%) | 7,475 (63.2%) |
| Total | 57,989 (35.6%) | 122,437 (75.1%) |
Disability Status by Sex by Age in Maui County
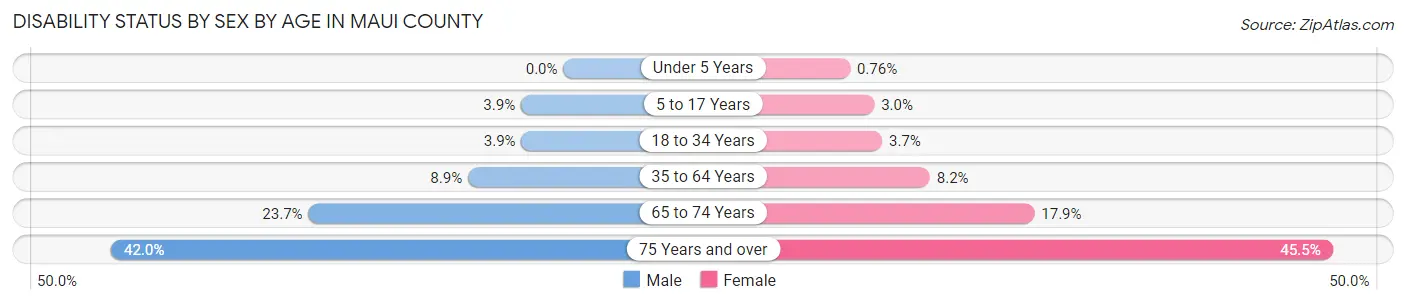
| Age Bracket | Male | Female |
| Under 5 Years | 0 (0.0%) | 33 (0.8%) |
| 5 to 17 Years | 531 (3.9%) | 380 (3.0%) |
| 18 to 34 Years | 562 (3.9%) | 576 (3.7%) |
| 35 to 64 Years | 2,956 (8.8%) | 2,698 (8.2%) |
| 65 to 74 Years | 2,317 (23.7%) | 1,758 (17.9%) |
| 75 Years and over | 2,157 (42.0%) | 3,046 (45.5%) |
Disability Class by Sex by Age in Maui County
Disability Class: Hearing Difficulty
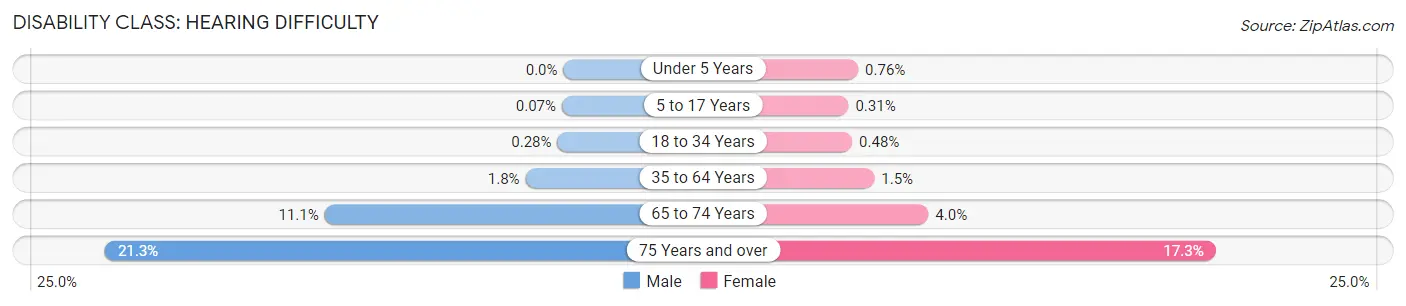
| Age Bracket | Male | Female |
| Under 5 Years | 0 (0.0%) | 33 (0.8%) |
| 5 to 17 Years | 9 (0.1%) | 39 (0.3%) |
| 18 to 34 Years | 41 (0.3%) | 74 (0.5%) |
| 35 to 64 Years | 589 (1.8%) | 499 (1.5%) |
| 65 to 74 Years | 1,085 (11.1%) | 396 (4.0%) |
| 75 Years and over | 1,093 (21.3%) | 1,160 (17.3%) |
Disability Class: Vision Difficulty
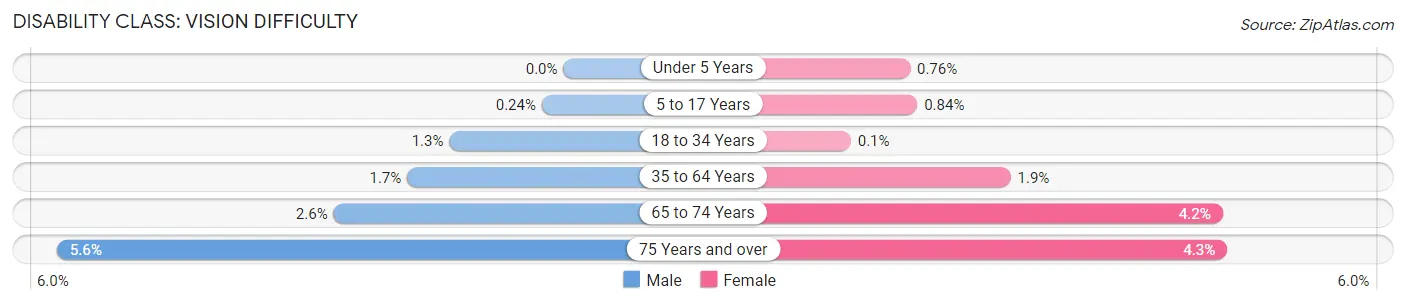
| Age Bracket | Male | Female |
| Under 5 Years | 0 (0.0%) | 33 (0.8%) |
| 5 to 17 Years | 32 (0.2%) | 106 (0.8%) |
| 18 to 34 Years | 184 (1.3%) | 15 (0.1%) |
| 35 to 64 Years | 581 (1.7%) | 622 (1.9%) |
| 65 to 74 Years | 251 (2.6%) | 417 (4.2%) |
| 75 Years and over | 290 (5.6%) | 287 (4.3%) |
Disability Class: Cognitive Difficulty
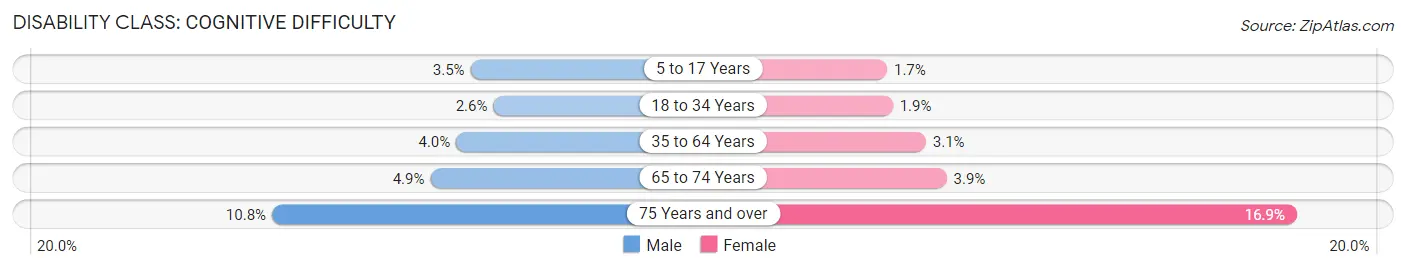
| Age Bracket | Male | Female |
| 5 to 17 Years | 467 (3.5%) | 212 (1.7%) |
| 18 to 34 Years | 376 (2.6%) | 291 (1.9%) |
| 35 to 64 Years | 1,330 (4.0%) | 1,032 (3.1%) |
| 65 to 74 Years | 484 (4.9%) | 383 (3.9%) |
| 75 Years and over | 556 (10.8%) | 1,130 (16.9%) |
Disability Class: Ambulatory Difficulty
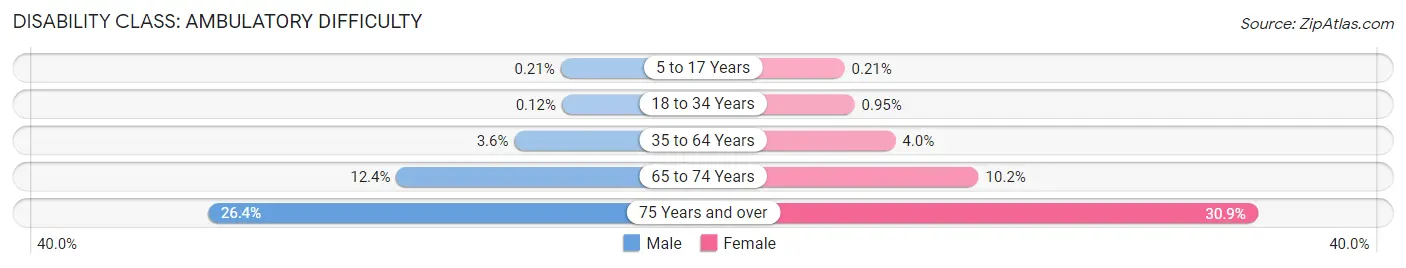
| Age Bracket | Male | Female |
| 5 to 17 Years | 29 (0.2%) | 27 (0.2%) |
| 18 to 34 Years | 18 (0.1%) | 147 (0.9%) |
| 35 to 64 Years | 1,216 (3.6%) | 1,315 (4.0%) |
| 65 to 74 Years | 1,214 (12.4%) | 1,000 (10.2%) |
| 75 Years and over | 1,356 (26.4%) | 2,065 (30.9%) |
Disability Class: Self-Care Difficulty
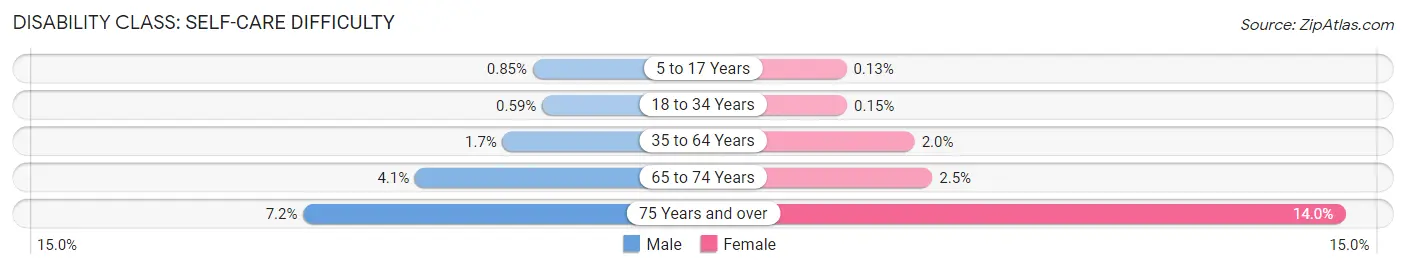
| Age Bracket | Male | Female |
| 5 to 17 Years | 115 (0.9%) | 16 (0.1%) |
| 18 to 34 Years | 85 (0.6%) | 23 (0.2%) |
| 35 to 64 Years | 563 (1.7%) | 670 (2.0%) |
| 65 to 74 Years | 404 (4.1%) | 248 (2.5%) |
| 75 Years and over | 372 (7.2%) | 937 (14.0%) |
Technology Access in Maui County
Computing Device Access in Maui County
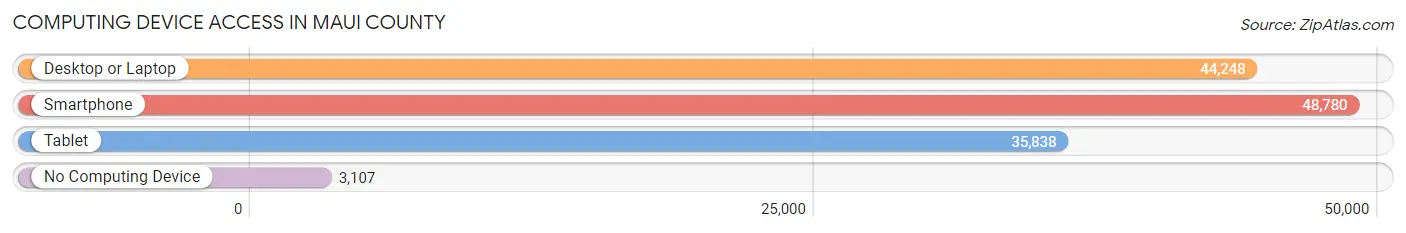
| Device Type | # Households | % Households |
| Desktop or Laptop | 44,248 | 80.8% |
| Smartphone | 48,780 | 89.1% |
| Tablet | 35,838 | 65.5% |
| No Computing Device | 3,107 | 5.7% |
| Total | 54,728 | 100.0% |
Internet Access in Maui County
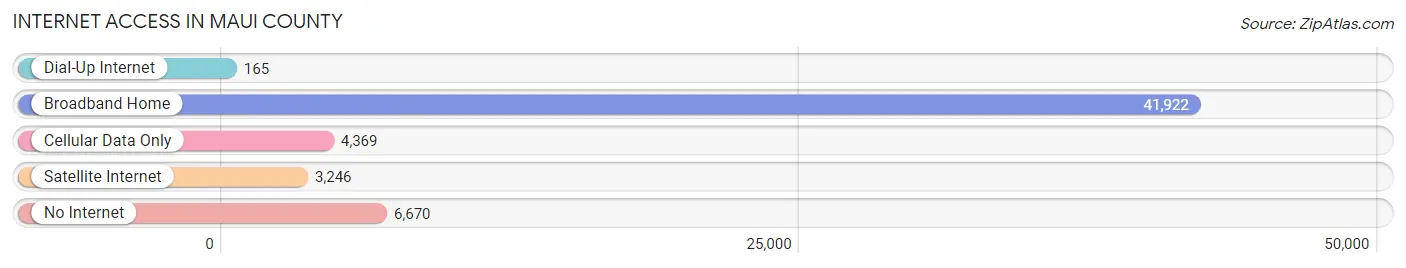
| Internet Type | # Households | % Households |
| Dial-Up Internet | 165 | 0.3% |
| Broadband Home | 41,922 | 76.6% |
| Cellular Data Only | 4,369 | 8.0% |
| Satellite Internet | 3,246 | 5.9% |
| No Internet | 6,670 | 12.2% |
| Total | 54,728 | 100.0% |
Maui County Summary
Maui County is located in the state of Hawaii and is comprised of the islands of Maui, Molokai, Lanai, and Kahoolawe. The county seat is Wailuku, located on the island of Maui. Maui County is the second largest county in the state of Hawaii, with a population of 154,834 as of the 2010 census.
Geography
Maui County is located in the central Pacific Ocean, approximately 2,400 miles southwest of the mainland United States. The county is comprised of four islands: Maui, Molokai, Lanai, and Kahoolawe. Maui is the largest of the four islands, with an area of 727 square miles. Molokai is the second largest island, with an area of 260 square miles. Lanai is the smallest of the four islands, with an area of 140 square miles. Kahoolawe is the smallest of the four islands, with an area of 44 square miles.
The islands of Maui County are surrounded by the Pacific Ocean and are part of the Hawaiian archipelago. The islands are volcanic in origin and are characterized by rugged terrain, lush vegetation, and beautiful beaches. The highest point in Maui County is the summit of Haleakala, located on the island of Maui, which rises to an elevation of 10,023 feet.
History
The islands of Maui County have been inhabited for thousands of years by the native Hawaiian people. The first Europeans to visit the islands were the Spanish, who arrived in 1778. The islands were later visited by British explorer James Cook in 1779.
In 1810, King Kamehameha I unified the Hawaiian Islands and established the Kingdom of Hawaii. In 1848, the islands were ceded to the United States and became part of the Territory of Hawaii. In 1959, the Territory of Hawaii was admitted to the Union as the 50th state.
Maui County was established in 1905 and is the second largest county in the state of Hawaii. The county is named after the island of Maui, which is the largest of the four islands that make up the county.
Economy
Maui County has a diverse economy that is largely driven by tourism. The county is home to some of the most popular tourist destinations in the state, including the islands of Maui, Molokai, Lanai, and Kahoolawe. Tourism is the largest industry in the county, accounting for over 40% of the county’s total economic output.
The county is also home to a number of agricultural operations, including sugarcane, pineapple, and coffee production. The county is also home to a number of manufacturing operations, including electronics, apparel, and food processing.
Demographics
As of the 2010 census, Maui County had a population of 154,834. The population is comprised of a diverse mix of ethnicities, including Native Hawaiian (25.7%), White (21.2%), Asian (19.2%), Hispanic or Latino (14.2%), and other (19.7%).
The median household income in Maui County is $67,845, and the median home value is $541,400. The county has a poverty rate of 11.2%, and the unemployment rate is 4.2%.
Conclusion
Maui County is located in the state of Hawaii and is comprised of the islands of Maui, Molokai, Lanai, and Kahoolawe. The county has a diverse economy that is largely driven by tourism, and the population is comprised of a diverse mix of ethnicities. The county has a median household income of $67,845 and a median home value of $541,400. Maui County is a beautiful and vibrant place to live and visit, and it is a great place to call home.
Common Questions
What is Per Capita Income in Maui County?
Per Capita income in Maui County is $42,607.
What is the Median Family Income in Maui County?
Median Family Income in Maui County is $107,660.
What is the Median Household income in Maui County?
Median Household Income in Maui County is $95,379.
What is Income or Wage Gap in Maui County?
Income or Wage Gap in Maui County is 19.1%.
Women in Maui County earn 80.9 cents for every dollar earned by a man.
What is Family Income Deficit in Maui County?
Family Income Deficit in Maui County is $10,224.
Families that are below poverty line in Maui County earn $10,224 less on average than the poverty threshold level.
What is Inequality or Gini Index in Maui County?
Inequality or Gini Index in Maui County is 0.44.
What is the Total Population of Maui County?
Total Population of Maui County is 164,765.
What is the Total Male Population of Maui County?
Total Male Population of Maui County is 82,304.
What is the Total Female Population of Maui County?
Total Female Population of Maui County is 82,461.
What is the Ratio of Males per 100 Females in Maui County?
There are 99.81 Males per 100 Females in Maui County.
What is the Ratio of Females per 100 Males in Maui County?
There are 100.19 Females per 100 Males in Maui County.
What is the Median Population Age in Maui County?
Median Population Age in Maui County is 42.2 Years.
What is the Average Family Size in Maui County
Average Family Size in Maui County is 3.4 People.
What is the Average Household Size in Maui County
Average Household Size in Maui County is 3.0 People.
How Large is the Labor Force in Maui County?
There are 86,873 People in the Labor Forcein in Maui County.
What is the Percentage of People in the Labor Force in Maui County?
65.2% of People are in the Labor Force in Maui County.
What is the Unemployment Rate in Maui County?
Unemployment Rate in Maui County is 5.4%.