Kailua CDP Hawaii County, HI Map & Demographics
Kailua CDP Hawaii County Overview
$45,746
PER CAPITA INCOME
$91,267
AVG FAMILY INCOME
$87,268
AVG HOUSEHOLD INCOME
21.5%
WAGE / INCOME GAP [ % ]
78.5¢/ $1
WAGE / INCOME GAP [ $ ]
$11,640
FAMILY INCOME DEFICIT
0.50
INEQUALITY / GINI INDEX
21,449
TOTAL POPULATION
11,152
MALE POPULATION
10,297
FEMALE POPULATION
108.30
MALES / 100 FEMALES
92.33
FEMALES / 100 MALES
42.4
MEDIAN AGE
3.3
AVG FAMILY SIZE
2.8
AVG HOUSEHOLD SIZE
11,260
LABOR FORCE [ PEOPLE ]
64.6%
PERCENT IN LABOR FORCE
3.7%
UNEMPLOYMENT RATE
Income in Kailua CDP Hawaii County
Income Overview in Kailua CDP Hawaii County
Per Capita Income in Kailua CDP Hawaii County is $45,746, while median incomes of families and households are $91,267 and $87,268 respectively.
| Characteristic | Number | Measure |
| Per Capita Income | 21,449 | $45,746 |
| Median Family Income | 4,861 | $91,267 |
| Mean Family Income | 4,861 | $118,775 |
| Median Household Income | 7,443 | $87,268 |
| Mean Household Income | 7,443 | $127,283 |
| Income Deficit | 4,861 | $11,640 |
| Wage / Income Gap (%) | 21,449 | 21.54% |
| Wage / Income Gap ($) | 21,449 | 78.46¢ per $1 |
| Gini / Inequality Index | 21,449 | 0.50 |
Earnings by Sex in Kailua CDP Hawaii County
Average Earnings in Kailua CDP Hawaii County are $37,174, $41,545 for men and $32,595 for women, a difference of 21.5%.
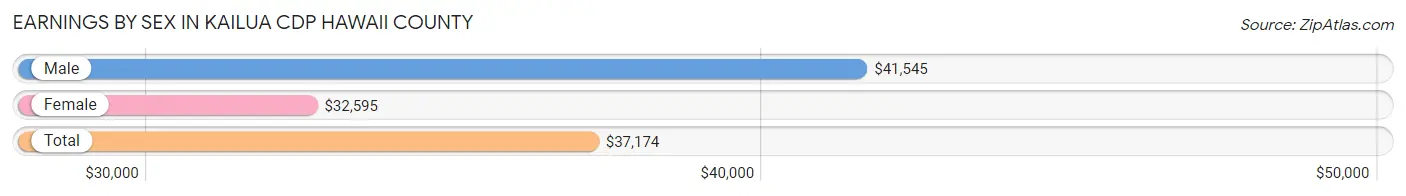
| Sex | Number | Average Earnings |
| Male | 6,408 (53.7%) | $41,545 |
| Female | 5,526 (46.3%) | $32,595 |
| Total | 11,934 (100.0%) | $37,174 |
Earnings by Sex by Income Bracket in Kailua CDP Hawaii County
The most common earnings brackets in Kailua CDP Hawaii County are $100,000+ for men (806 | 12.6%) and $100,000+ for women (634 | 11.5%).
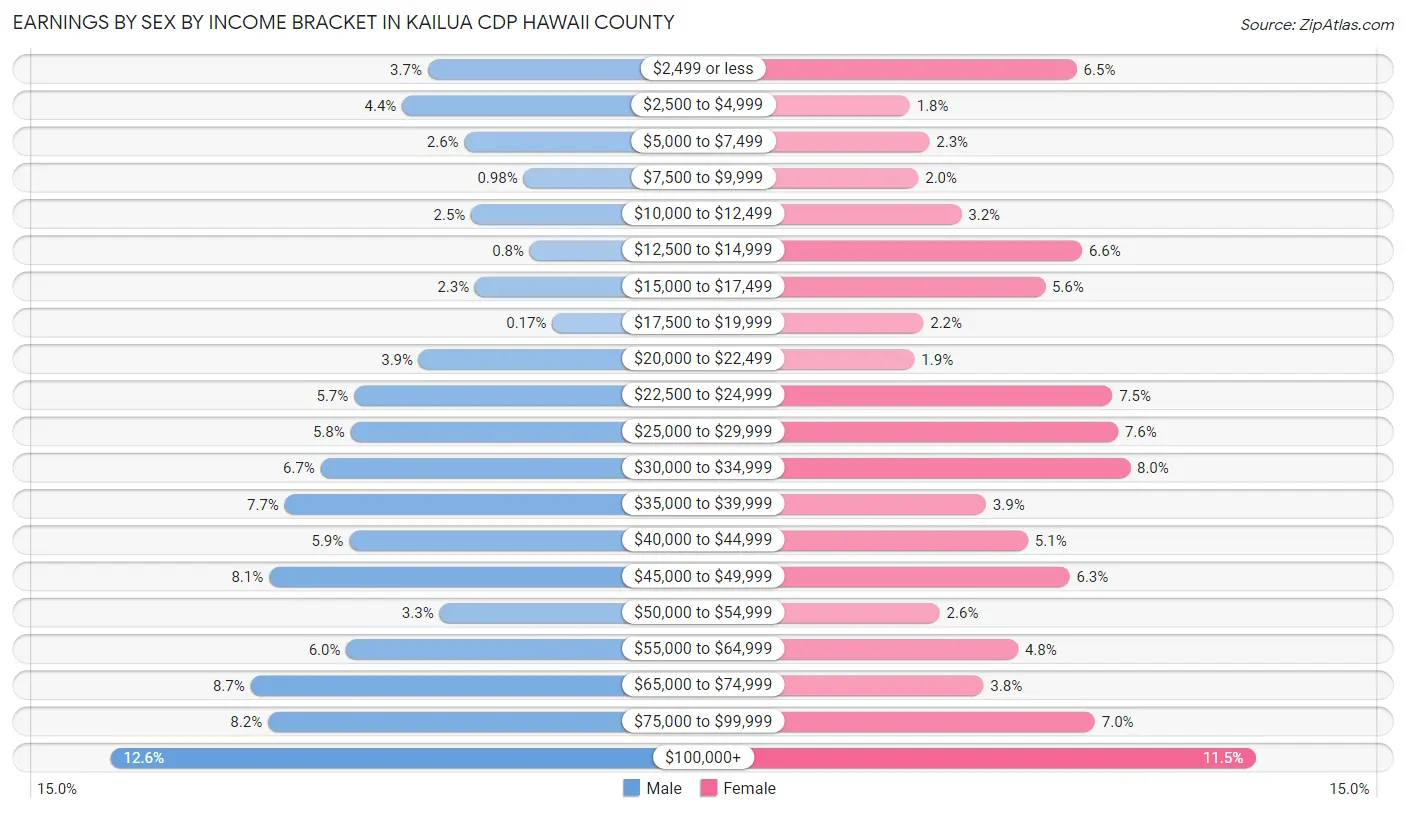
| Income | Male | Female |
| $2,499 or less | 235 (3.7%) | 357 (6.5%) |
| $2,500 to $4,999 | 281 (4.4%) | 98 (1.8%) |
| $5,000 to $7,499 | 169 (2.6%) | 128 (2.3%) |
| $7,500 to $9,999 | 63 (1.0%) | 111 (2.0%) |
| $10,000 to $12,499 | 157 (2.5%) | 178 (3.2%) |
| $12,500 to $14,999 | 51 (0.8%) | 365 (6.6%) |
| $15,000 to $17,499 | 150 (2.3%) | 308 (5.6%) |
| $17,500 to $19,999 | 11 (0.2%) | 119 (2.1%) |
| $20,000 to $22,499 | 251 (3.9%) | 105 (1.9%) |
| $22,500 to $24,999 | 368 (5.7%) | 412 (7.5%) |
| $25,000 to $29,999 | 374 (5.8%) | 421 (7.6%) |
| $30,000 to $34,999 | 428 (6.7%) | 440 (8.0%) |
| $35,000 to $39,999 | 493 (7.7%) | 216 (3.9%) |
| $40,000 to $44,999 | 377 (5.9%) | 281 (5.1%) |
| $45,000 to $49,999 | 521 (8.1%) | 346 (6.3%) |
| $50,000 to $54,999 | 214 (3.3%) | 144 (2.6%) |
| $55,000 to $64,999 | 382 (6.0%) | 266 (4.8%) |
| $65,000 to $74,999 | 554 (8.6%) | 212 (3.8%) |
| $75,000 to $99,999 | 523 (8.2%) | 385 (7.0%) |
| $100,000+ | 806 (12.6%) | 634 (11.5%) |
| Total | 6,408 (100.0%) | 5,526 (100.0%) |
Earnings by Sex by Educational Attainment in Kailua CDP Hawaii County
Average earnings in Kailua CDP Hawaii County are $46,454 for men and $33,216 for women, a difference of 28.5%. Men with an educational attainment of graduate degree enjoy the highest average annual earnings of $70,694, while those with high school diploma education earn the least with $41,864. Women with an educational attainment of bachelor's degree earn the most with the average annual earnings of $62,854, while those with less than high school education have the smallest earnings of $13,244.
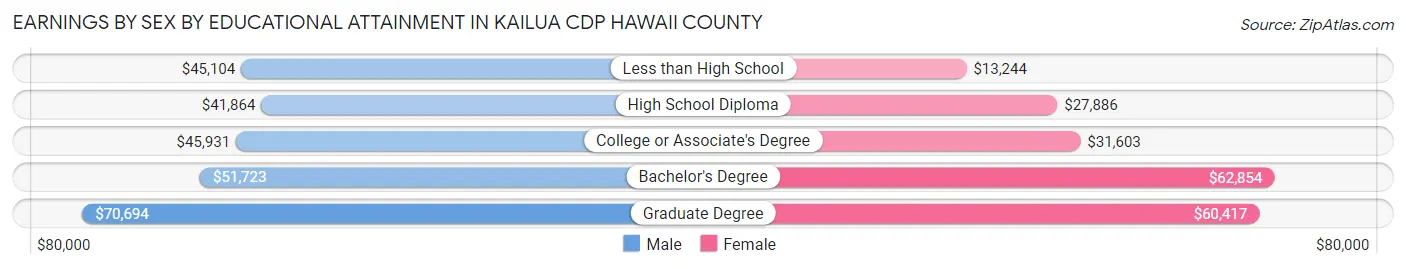
| Educational Attainment | Male Income | Female Income |
| Less than High School | $45,104 | $13,244 |
| High School Diploma | $41,864 | $27,886 |
| College or Associate's Degree | $45,931 | $31,603 |
| Bachelor's Degree | $51,723 | $62,854 |
| Graduate Degree | $70,694 | $60,417 |
| Total | $46,454 | $33,216 |
Family Income in Kailua CDP Hawaii County
Family Income Brackets in Kailua CDP Hawaii County
According to the Kailua CDP Hawaii County family income data, there are 924 families falling into the $100,000 to $149,999 income range, which is the most common income bracket and makes up 19.0% of all families. Conversely, the $10,000 to $14,999 income bracket is the least frequent group with only 63 families (1.3%) belonging to this category.
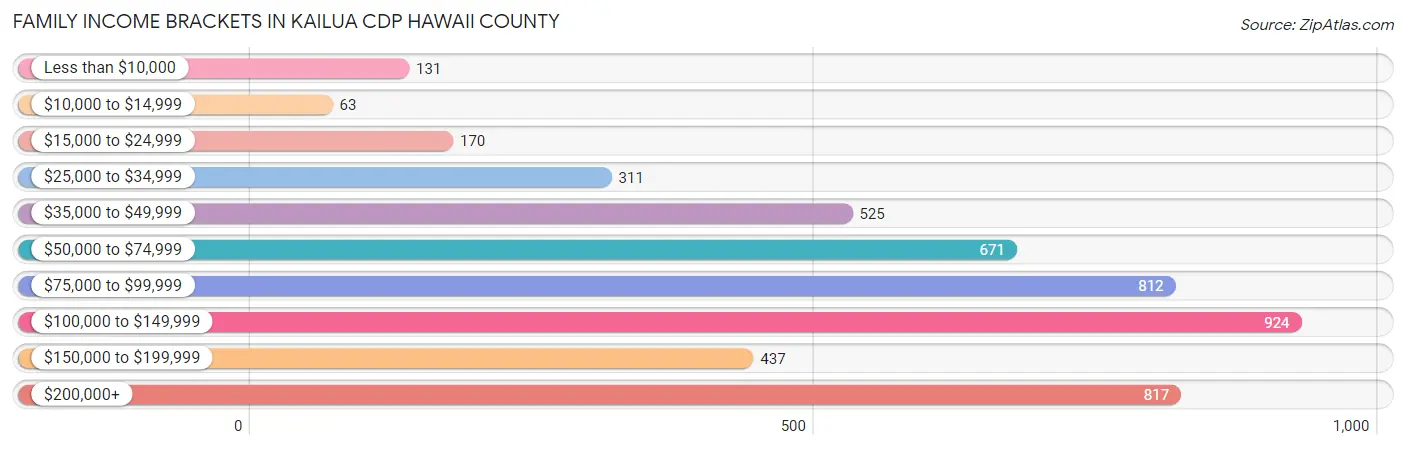
| Income Bracket | # Families | % Families |
| Less than $10,000 | 131 | 2.7% |
| $10,000 to $14,999 | 63 | 1.3% |
| $15,000 to $24,999 | 170 | 3.5% |
| $25,000 to $34,999 | 311 | 6.4% |
| $35,000 to $49,999 | 525 | 10.8% |
| $50,000 to $74,999 | 671 | 13.8% |
| $75,000 to $99,999 | 812 | 16.7% |
| $100,000 to $149,999 | 924 | 19.0% |
| $150,000 to $199,999 | 437 | 9.0% |
| $200,000+ | 817 | 16.8% |
Family Income by Famaliy Size in Kailua CDP Hawaii County
7+ person families (223 | 4.6%) account for the highest median family income in Kailua CDP Hawaii County with $179,205 per family, while 2-person families (2,332 | 48.0%) have the highest median income of $47,332 per family member.
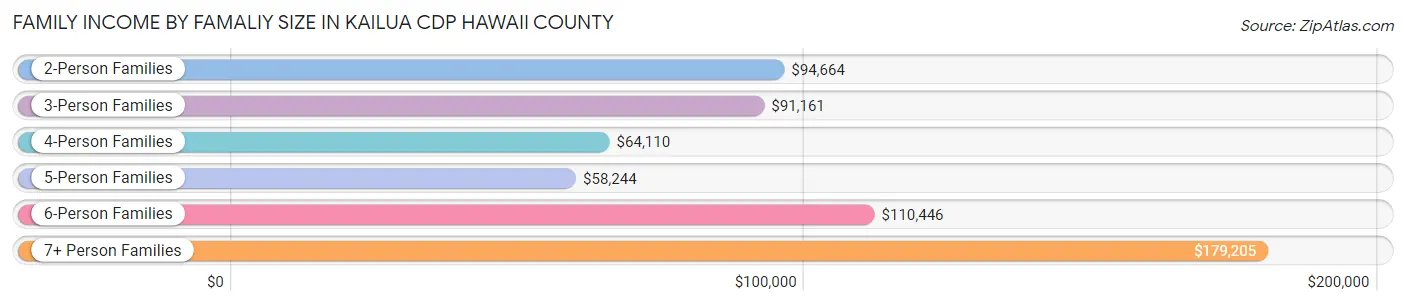
| Income Bracket | # Families | Median Income |
| 2-Person Families | 2,332 (48.0%) | $94,664 |
| 3-Person Families | 971 (20.0%) | $91,161 |
| 4-Person Families | 772 (15.9%) | $64,110 |
| 5-Person Families | 433 (8.9%) | $58,244 |
| 6-Person Families | 130 (2.7%) | $110,446 |
| 7+ Person Families | 223 (4.6%) | $179,205 |
| Total | 4,861 (100.0%) | $91,267 |
Family Income by Number of Earners in Kailua CDP Hawaii County
The median family income in Kailua CDP Hawaii County is $91,267, with families comprising 3+ earners (764) having the highest median family income of $130,000, while families with no earners (672) have the lowest median family income of $47,000, accounting for 15.7% and 13.8% of families, respectively.
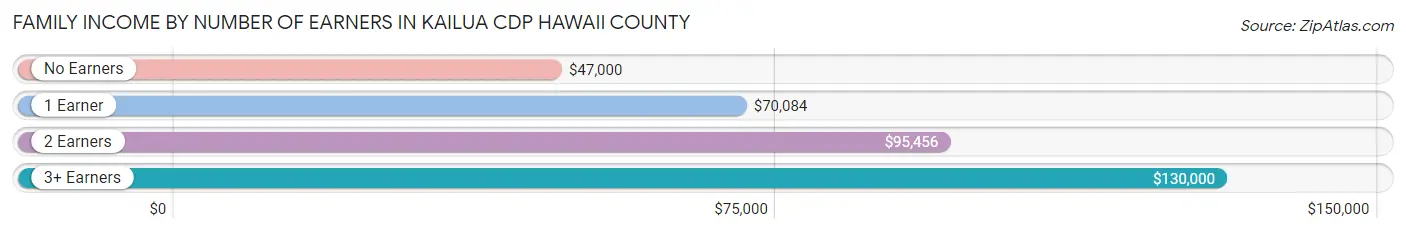
| Number of Earners | # Families | Median Income |
| No Earners | 672 (13.8%) | $47,000 |
| 1 Earner | 1,380 (28.4%) | $70,084 |
| 2 Earners | 2,045 (42.1%) | $95,456 |
| 3+ Earners | 764 (15.7%) | $130,000 |
| Total | 4,861 (100.0%) | $91,267 |
Household Income in Kailua CDP Hawaii County
Household Income Brackets in Kailua CDP Hawaii County
With 1,303 households falling in the category, the $100,000 to $149,999 income range is the most frequent in Kailua CDP Hawaii County, accounting for 17.5% of all households. In contrast, only 246 households (3.3%) fall into the $10,000 to $14,999 income bracket, making it the least populous group.
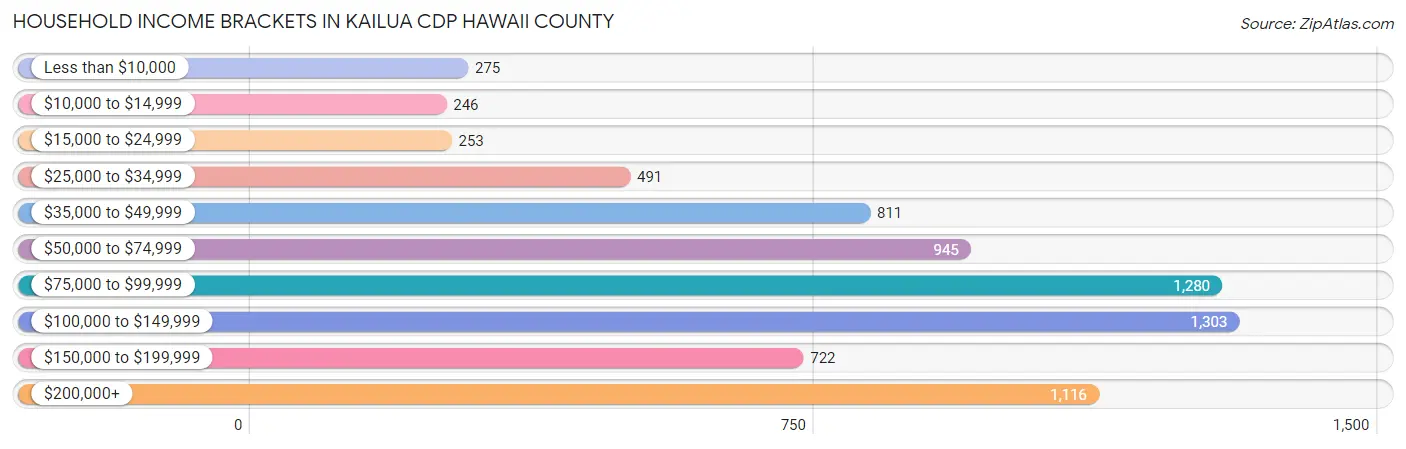
| Income Bracket | # Households | % Households |
| Less than $10,000 | 275 | 3.7% |
| $10,000 to $14,999 | 246 | 3.3% |
| $15,000 to $24,999 | 253 | 3.4% |
| $25,000 to $34,999 | 491 | 6.6% |
| $35,000 to $49,999 | 811 | 10.9% |
| $50,000 to $74,999 | 945 | 12.7% |
| $75,000 to $99,999 | 1,280 | 17.2% |
| $100,000 to $149,999 | 1,303 | 17.5% |
| $150,000 to $199,999 | 722 | 9.7% |
| $200,000+ | 1,116 | 15.0% |
Household Income by Householder Age in Kailua CDP Hawaii County
The median household income in Kailua CDP Hawaii County is $87,268, with the highest median household income of $92,188 found in the 25 to 44 years age bracket for the primary householder. A total of 2,067 households (27.8%) fall into this category. Meanwhile, the 15 to 24 years age bracket for the primary householder has the lowest median household income of $0, with 203 households (2.7%) in this group.
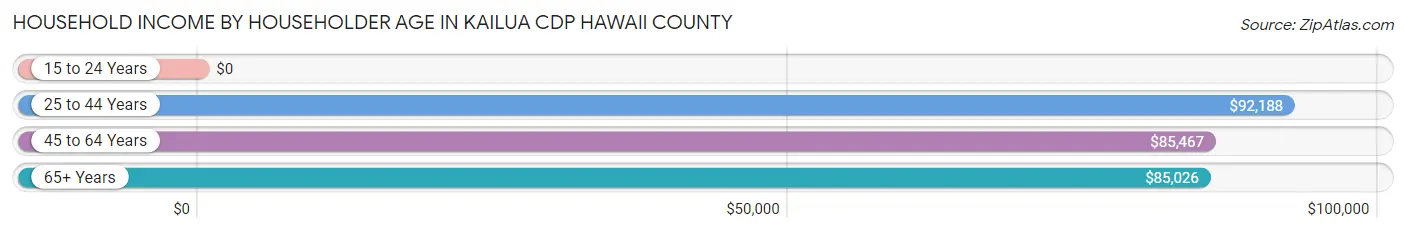
| Income Bracket | # Households | Median Income |
| 15 to 24 Years | 203 (2.7%) | $0 |
| 25 to 44 Years | 2,067 (27.8%) | $92,188 |
| 45 to 64 Years | 2,842 (38.2%) | $85,467 |
| 65+ Years | 2,331 (31.3%) | $85,026 |
| Total | 7,443 (100.0%) | $87,268 |
Poverty in Kailua CDP Hawaii County
Income Below Poverty by Sex and Age in Kailua CDP Hawaii County
With 9.4% poverty level for males and 11.4% for females among the residents of Kailua CDP Hawaii County, 75 year old and over males and 12 to 14 year old females are the most vulnerable to poverty, with 104 males (18.0%) and 88 females (24.1%) in their respective age groups living below the poverty level.
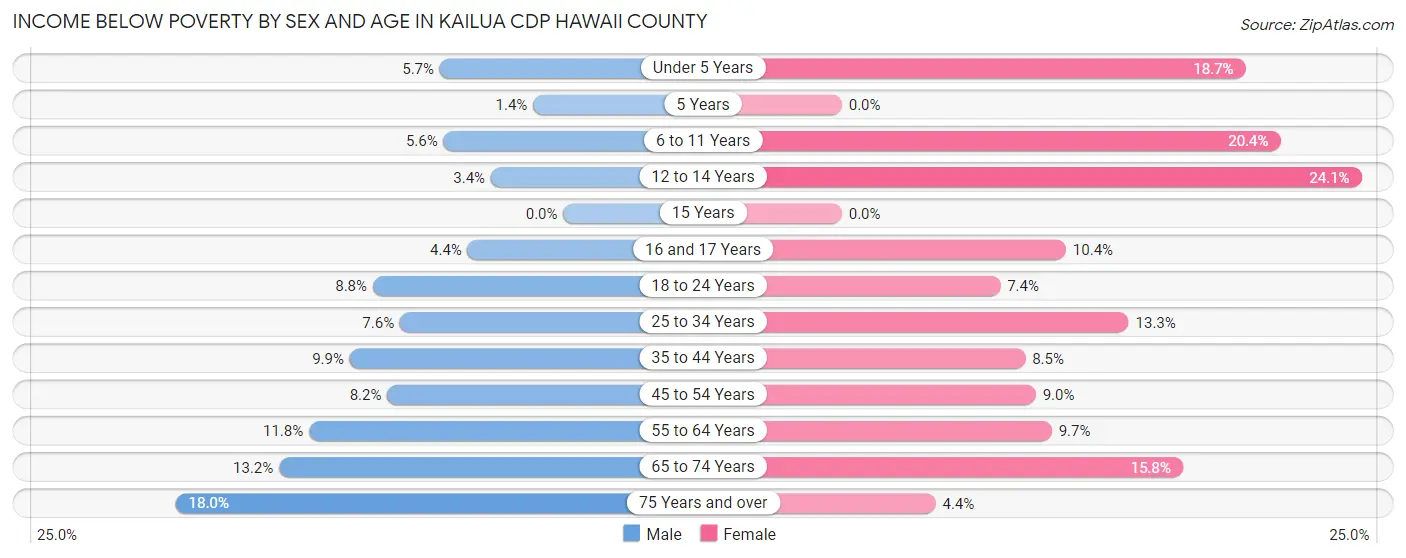
| Age Bracket | Male | Female |
| Under 5 Years | 39 (5.7%) | 100 (18.7%) |
| 5 Years | 2 (1.4%) | 0 (0.0%) |
| 6 to 11 Years | 59 (5.6%) | 128 (20.3%) |
| 12 to 14 Years | 8 (3.4%) | 88 (24.1%) |
| 15 Years | 0 (0.0%) | 0 (0.0%) |
| 16 and 17 Years | 10 (4.4%) | 13 (10.4%) |
| 18 to 24 Years | 89 (8.8%) | 44 (7.3%) |
| 25 to 34 Years | 115 (7.6%) | 185 (13.3%) |
| 35 to 44 Years | 129 (9.9%) | 94 (8.5%) |
| 45 to 54 Years | 87 (8.2%) | 131 (9.0%) |
| 55 to 64 Years | 210 (11.8%) | 167 (9.7%) |
| 65 to 74 Years | 186 (13.2%) | 180 (15.8%) |
| 75 Years and over | 104 (18.0%) | 42 (4.3%) |
| Total | 1,038 (9.4%) | 1,172 (11.4%) |
Income Above Poverty by Sex and Age in Kailua CDP Hawaii County
According to the poverty statistics in Kailua CDP Hawaii County, males aged 15 years and females aged 5 years are the age groups that are most secure financially, with 100.0% of males and 100.0% of females in these age groups living above the poverty line.
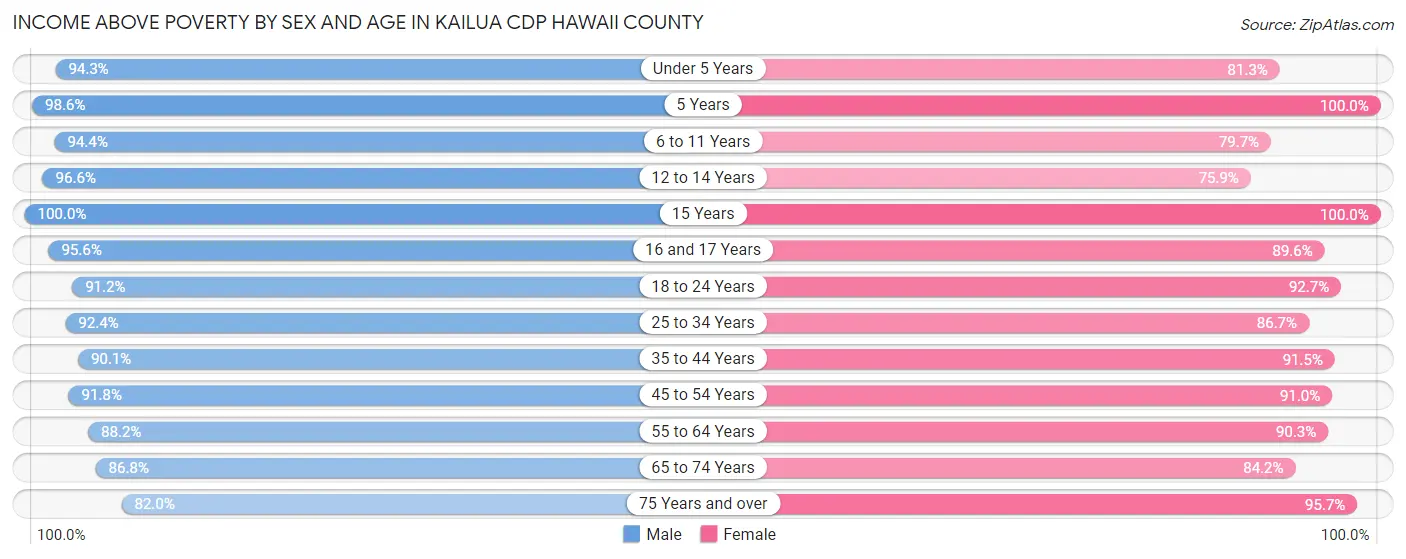
| Age Bracket | Male | Female |
| Under 5 Years | 642 (94.3%) | 434 (81.3%) |
| 5 Years | 141 (98.6%) | 183 (100.0%) |
| 6 to 11 Years | 1,003 (94.4%) | 501 (79.6%) |
| 12 to 14 Years | 230 (96.6%) | 277 (75.9%) |
| 15 Years | 77 (100.0%) | 51 (100.0%) |
| 16 and 17 Years | 215 (95.6%) | 112 (89.6%) |
| 18 to 24 Years | 918 (91.2%) | 555 (92.6%) |
| 25 to 34 Years | 1,402 (92.4%) | 1,205 (86.7%) |
| 35 to 44 Years | 1,173 (90.1%) | 1,011 (91.5%) |
| 45 to 54 Years | 978 (91.8%) | 1,325 (91.0%) |
| 55 to 64 Years | 1,569 (88.2%) | 1,548 (90.3%) |
| 65 to 74 Years | 1,224 (86.8%) | 958 (84.2%) |
| 75 Years and over | 474 (82.0%) | 923 (95.7%) |
| Total | 10,046 (90.6%) | 9,083 (88.6%) |
Income Below Poverty Among Married-Couple Families in Kailua CDP Hawaii County
The poverty statistics for married-couple families in Kailua CDP Hawaii County show that 5.9% or 229 of the total 3,848 families live below the poverty line. Families with 3 or 4 children have the highest poverty rate of 12.9%, comprising of 40 families. On the other hand, families with 5 or more children have the lowest poverty rate of 0.0%, which includes 0 families.
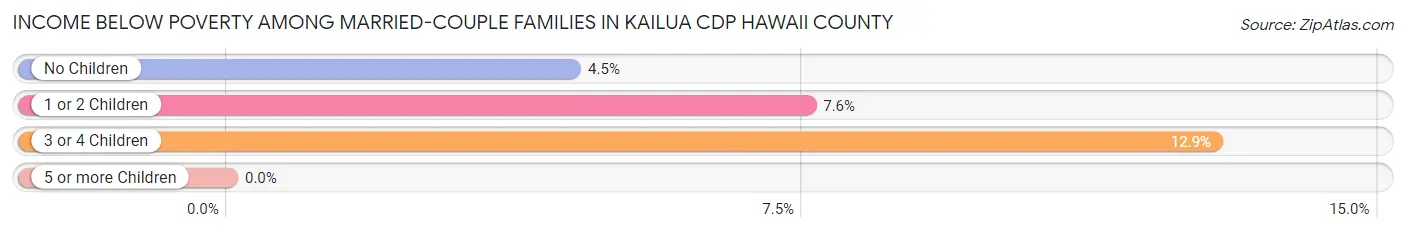
| Children | Above Poverty | Below Poverty |
| No Children | 2,412 (95.5%) | 113 (4.5%) |
| 1 or 2 Children | 931 (92.4%) | 76 (7.5%) |
| 3 or 4 Children | 271 (87.1%) | 40 (12.9%) |
| 5 or more Children | 5 (100.0%) | 0 (0.0%) |
| Total | 3,619 (94.1%) | 229 (5.9%) |
Income Below Poverty Among Single-Parent Households in Kailua CDP Hawaii County
According to the poverty data in Kailua CDP Hawaii County, 5.7% or 23 single-father households and 11.8% or 72 single-mother households are living below the poverty line. Among single-father households, those with 1 or 2 children have the highest poverty rate, with 22 households (7.9%) experiencing poverty. Likewise, among single-mother households, those with 3 or 4 children have the highest poverty rate, with 50 households (35.0%) falling below the poverty line.
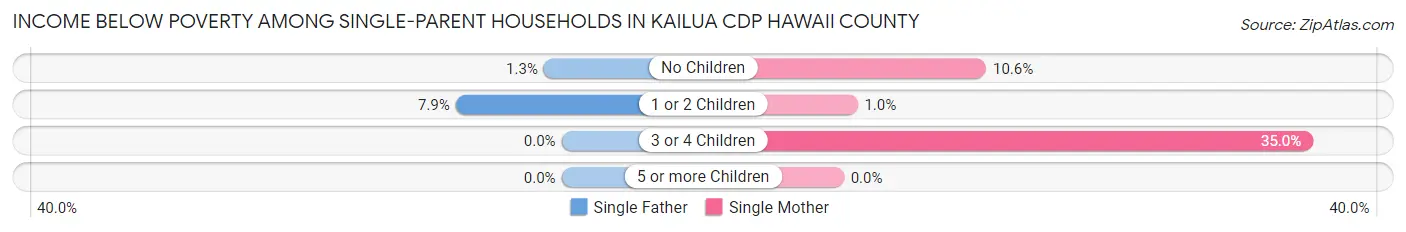
| Children | Single Father | Single Mother |
| No Children | 1 (1.3%) | 19 (10.6%) |
| 1 or 2 Children | 22 (7.9%) | 3 (1.0%) |
| 3 or 4 Children | 0 (0.0%) | 50 (35.0%) |
| 5 or more Children | 0 (0.0%) | 0 (0.0%) |
| Total | 23 (5.7%) | 72 (11.8%) |
Income Below Poverty Among Married-Couple vs Single-Parent Households in Kailua CDP Hawaii County
The poverty data for Kailua CDP Hawaii County shows that 229 of the married-couple family households (5.9%) and 95 of the single-parent households (9.4%) are living below the poverty level. Within the married-couple family households, those with 3 or 4 children have the highest poverty rate, with 40 households (12.9%) falling below the poverty line. Among the single-parent households, those with 3 or 4 children have the highest poverty rate, with 50 household (26.5%) living below poverty.
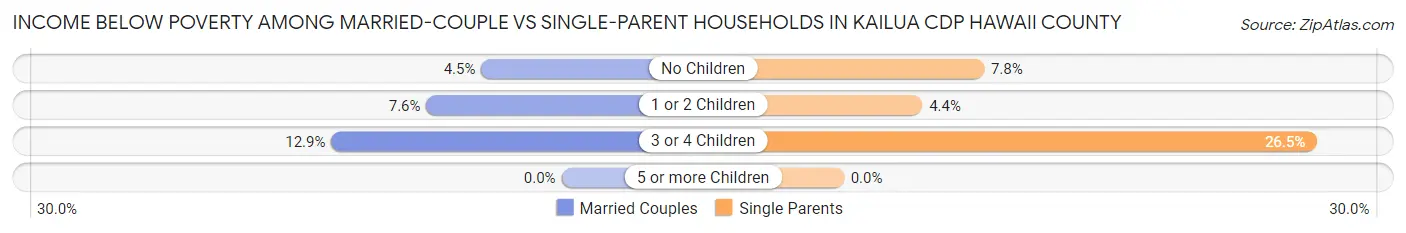
| Children | Married-Couple Families | Single-Parent Households |
| No Children | 113 (4.5%) | 20 (7.8%) |
| 1 or 2 Children | 76 (7.5%) | 25 (4.4%) |
| 3 or 4 Children | 40 (12.9%) | 50 (26.5%) |
| 5 or more Children | 0 (0.0%) | 0 (0.0%) |
| Total | 229 (5.9%) | 95 (9.4%) |
Race in Kailua CDP Hawaii County
The most populous races in Kailua CDP Hawaii County are White / Caucasian (9,022 | 42.1%), Asian (4,181 | 19.5%), and Two or more Races (3,763 | 17.5%).
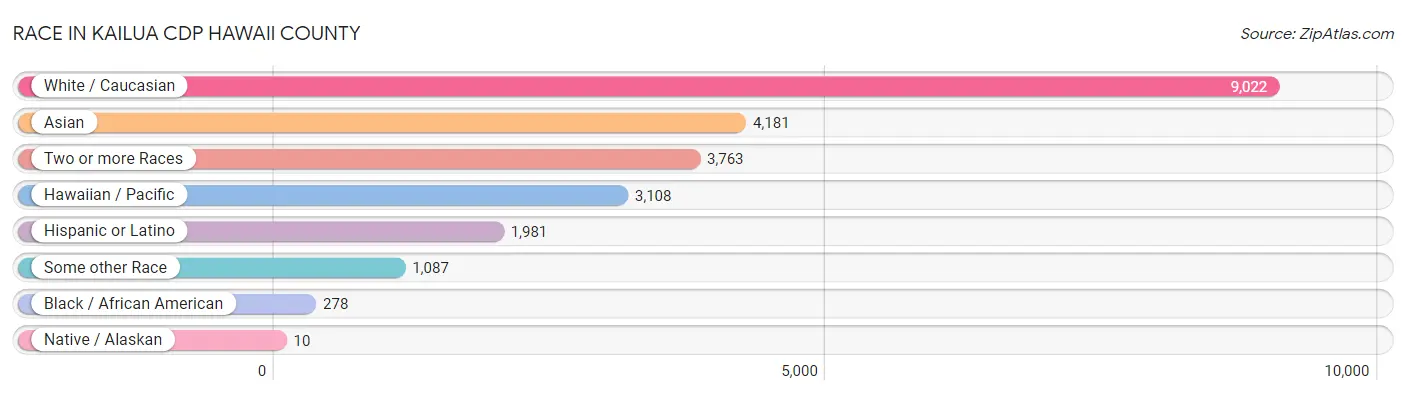
| Race | # Population | % Population |
| Asian | 4,181 | 19.5% |
| Black / African American | 278 | 1.3% |
| Hawaiian / Pacific | 3,108 | 14.5% |
| Hispanic or Latino | 1,981 | 9.2% |
| Native / Alaskan | 10 | 0.1% |
| White / Caucasian | 9,022 | 42.1% |
| Two or more Races | 3,763 | 17.5% |
| Some other Race | 1,087 | 5.1% |
| Total | 21,449 | 100.0% |
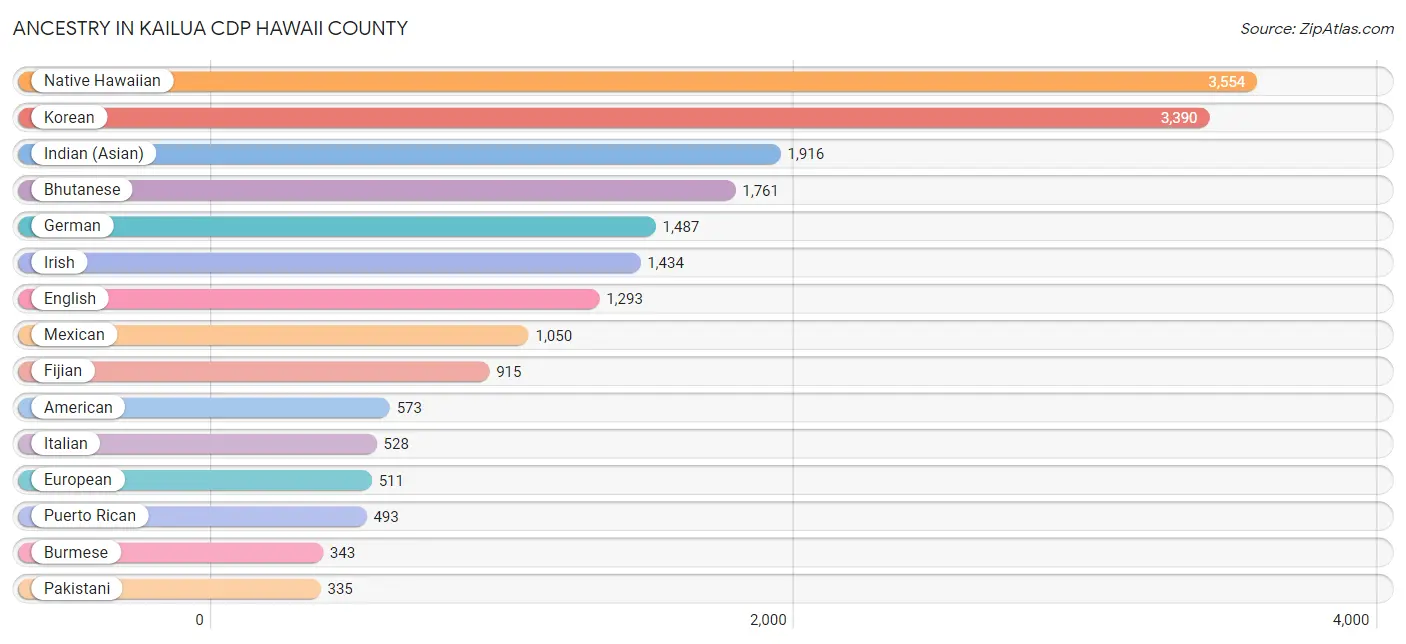
Ancestry in Kailua CDP Hawaii County
The most populous ancestries reported in Kailua CDP Hawaii County are Native Hawaiian (3,554 | 16.6%), Korean (3,390 | 15.8%), Indian (Asian) (1,916 | 8.9%), Bhutanese (1,761 | 8.2%), and German (1,487 | 6.9%), together accounting for 56.4% of all Kailua CDP Hawaii County residents.
| Ancestry | # Population | % Population |
| African | 4 | 0.0% |
| American | 573 | 2.7% |
| Apache | 36 | 0.2% |
| Arab | 51 | 0.2% |
| Armenian | 46 | 0.2% |
| Australian | 12 | 0.1% |
| Austrian | 46 | 0.2% |
| Basque | 42 | 0.2% |
| Bhutanese | 1,761 | 8.2% |
| Brazilian | 46 | 0.2% |
| British | 71 | 0.3% |
| Burmese | 343 | 1.6% |
| Canadian | 13 | 0.1% |
| Central American | 282 | 1.3% |
| Central American Indian | 40 | 0.2% |
| Cherokee | 205 | 1.0% |
| Chilean | 10 | 0.1% |
| Chinese | 9 | 0.0% |
| Choctaw | 62 | 0.3% |
| Colombian | 9 | 0.0% |
| Comanche | 18 | 0.1% |
| Creek | 12 | 0.1% |
| Croatian | 10 | 0.1% |
| Czech | 58 | 0.3% |
| Danish | 264 | 1.2% |
| Dominican | 15 | 0.1% |
| Dutch | 153 | 0.7% |
| Eastern European | 90 | 0.4% |
| Egyptian | 10 | 0.1% |
| English | 1,293 | 6.0% |
| European | 511 | 2.4% |
| Fijian | 915 | 4.3% |
| Filipino | 51 | 0.2% |
| Finnish | 103 | 0.5% |
| French | 238 | 1.1% |
| French Canadian | 60 | 0.3% |
| German | 1,487 | 6.9% |
| Greek | 24 | 0.1% |
| Guamanian / Chamorro | 18 | 0.1% |
| Guatemalan | 279 | 1.3% |
| Haitian | 10 | 0.1% |
| Honduran | 3 | 0.0% |
| Hungarian | 54 | 0.3% |
| Indian (Asian) | 1,916 | 8.9% |
| Iranian | 19 | 0.1% |
| Irish | 1,434 | 6.7% |
| Italian | 528 | 2.5% |
| Jamaican | 3 | 0.0% |
| Japanese | 9 | 0.0% |
| Korean | 3,390 | 15.8% |
| Lithuanian | 123 | 0.6% |
| Marshallese | 136 | 0.6% |
| Mexican | 1,050 | 4.9% |
| Mexican American Indian | 56 | 0.3% |
| Native Hawaiian | 3,554 | 16.6% |
| New Zealander | 14 | 0.1% |
| Northern European | 88 | 0.4% |
| Norwegian | 165 | 0.8% |
| Pakistani | 335 | 1.6% |
| Peruvian | 46 | 0.2% |
| Polish | 171 | 0.8% |
| Portuguese | 236 | 1.1% |
| Puerto Rican | 493 | 2.3% |
| Russian | 209 | 1.0% |
| Samoan | 224 | 1.0% |
| Scandinavian | 234 | 1.1% |
| Scotch-Irish | 81 | 0.4% |
| Scottish | 219 | 1.0% |
| Shoshone | 12 | 0.1% |
| South American | 65 | 0.3% |
| Spaniard | 24 | 0.1% |
| Spanish | 33 | 0.2% |
| Spanish American | 7 | 0.0% |
| Sri Lankan | 59 | 0.3% |
| Subsaharan African | 4 | 0.0% |
| Swedish | 203 | 0.9% |
| Swiss | 64 | 0.3% |
| Thai | 18 | 0.1% |
| Tongan | 79 | 0.4% |
| Ukrainian | 73 | 0.3% |
| Welsh | 96 | 0.4% |
| Yaqui | 4 | 0.0% |
| Yugoslavian | 10 | 0.1% | View All 83 Rows |
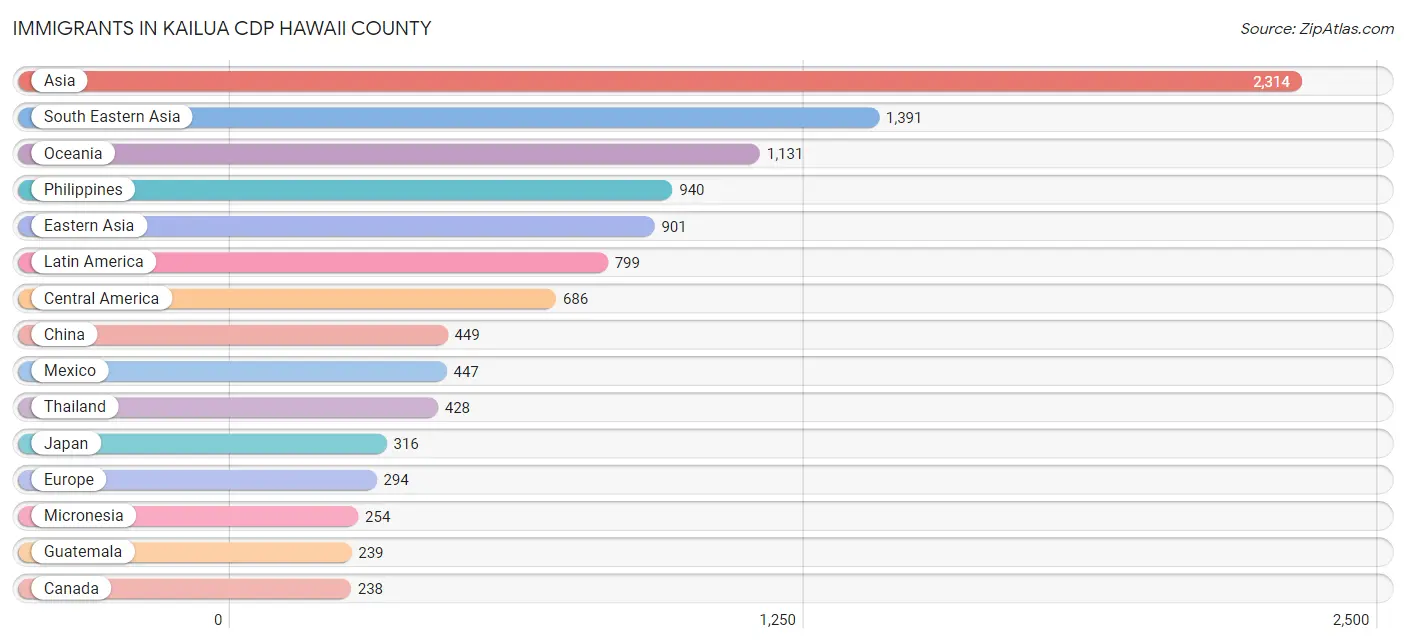
Immigrants in Kailua CDP Hawaii County
The most numerous immigrant groups reported in Kailua CDP Hawaii County came from Asia (2,314 | 10.8%), South Eastern Asia (1,391 | 6.5%), Oceania (1,131 | 5.3%), Philippines (940 | 4.4%), and Eastern Asia (901 | 4.2%), together accounting for 31.1% of all Kailua CDP Hawaii County residents.
| Immigration Origin | # Population | % Population |
| Africa | 31 | 0.1% |
| Asia | 2,314 | 10.8% |
| Australia | 204 | 0.9% |
| Austria | 25 | 0.1% |
| Brazil | 62 | 0.3% |
| Cambodia | 9 | 0.0% |
| Canada | 238 | 1.1% |
| Central America | 686 | 3.2% |
| Chile | 10 | 0.1% |
| China | 449 | 2.1% |
| Colombia | 9 | 0.0% |
| Czechoslovakia | 23 | 0.1% |
| Eastern Asia | 901 | 4.2% |
| Eastern Europe | 160 | 0.7% |
| Europe | 294 | 1.4% |
| France | 33 | 0.2% |
| Germany | 34 | 0.2% |
| Guatemala | 239 | 1.1% |
| Guyana | 14 | 0.1% |
| Iran | 22 | 0.1% |
| Ireland | 18 | 0.1% |
| Italy | 3 | 0.0% |
| Japan | 316 | 1.5% |
| Korea | 136 | 0.6% |
| Latin America | 799 | 3.7% |
| Mexico | 447 | 2.1% |
| Micronesia | 254 | 1.2% |
| Netherlands | 16 | 0.1% |
| Northern Europe | 23 | 0.1% |
| Oceania | 1,131 | 5.3% |
| Peru | 18 | 0.1% |
| Philippines | 940 | 4.4% |
| Russia | 66 | 0.3% |
| South America | 113 | 0.5% |
| South Central Asia | 22 | 0.1% |
| South Eastern Asia | 1,391 | 6.5% |
| Southern Europe | 3 | 0.0% |
| Sweden | 5 | 0.0% |
| Thailand | 428 | 2.0% |
| Ukraine | 20 | 0.1% |
| Vietnam | 14 | 0.1% |
| Western Europe | 108 | 0.5% | View All 42 Rows |
Sex and Age in Kailua CDP Hawaii County
Sex and Age in Kailua CDP Hawaii County
The most populous age groups in Kailua CDP Hawaii County are 60 to 64 Years (921 | 8.3%) for men and 25 to 29 Years (1,005 | 9.8%) for women.
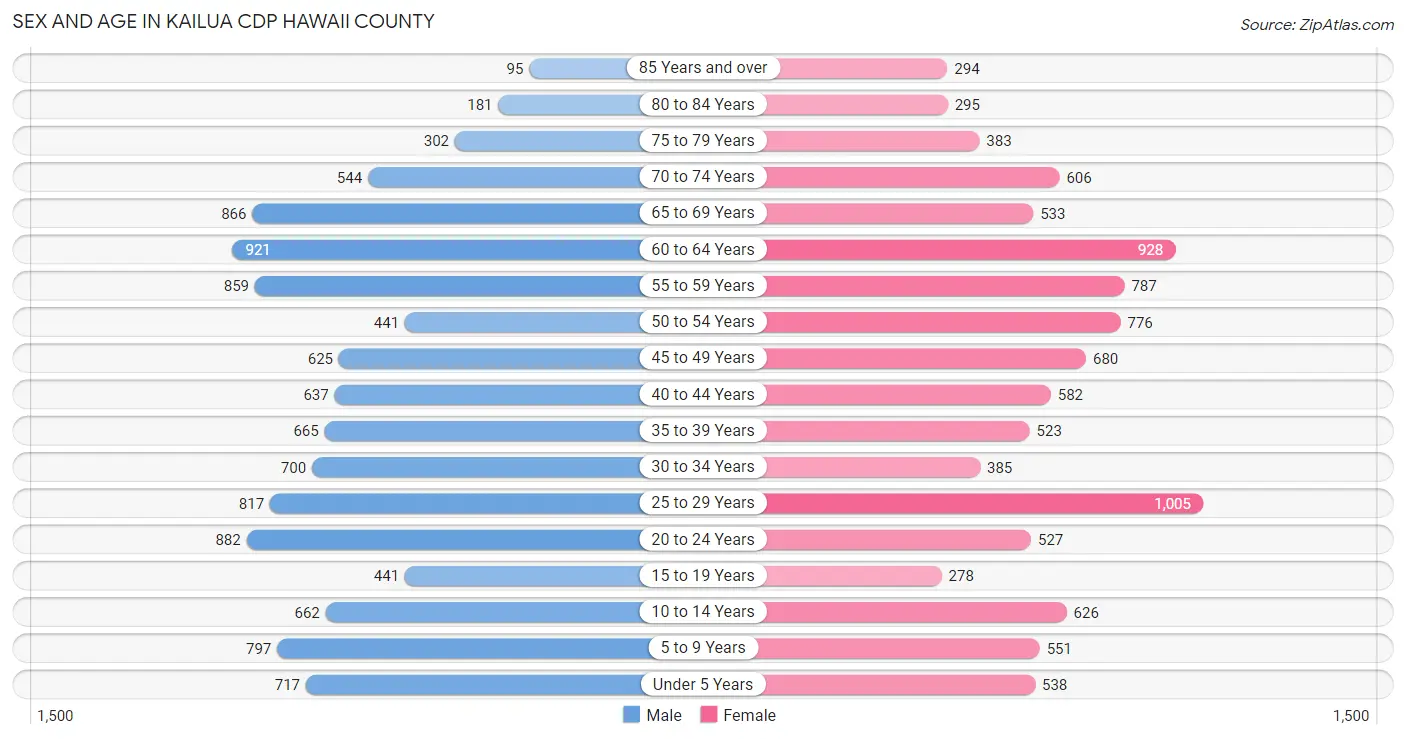
| Age Bracket | Male | Female |
| Under 5 Years | 717 (6.4%) | 538 (5.2%) |
| 5 to 9 Years | 797 (7.1%) | 551 (5.3%) |
| 10 to 14 Years | 662 (5.9%) | 626 (6.1%) |
| 15 to 19 Years | 441 (4.0%) | 278 (2.7%) |
| 20 to 24 Years | 882 (7.9%) | 527 (5.1%) |
| 25 to 29 Years | 817 (7.3%) | 1,005 (9.8%) |
| 30 to 34 Years | 700 (6.3%) | 385 (3.7%) |
| 35 to 39 Years | 665 (6.0%) | 523 (5.1%) |
| 40 to 44 Years | 637 (5.7%) | 582 (5.7%) |
| 45 to 49 Years | 625 (5.6%) | 680 (6.6%) |
| 50 to 54 Years | 441 (4.0%) | 776 (7.5%) |
| 55 to 59 Years | 859 (7.7%) | 787 (7.6%) |
| 60 to 64 Years | 921 (8.3%) | 928 (9.0%) |
| 65 to 69 Years | 866 (7.8%) | 533 (5.2%) |
| 70 to 74 Years | 544 (4.9%) | 606 (5.9%) |
| 75 to 79 Years | 302 (2.7%) | 383 (3.7%) |
| 80 to 84 Years | 181 (1.6%) | 295 (2.9%) |
| 85 Years and over | 95 (0.9%) | 294 (2.9%) |
| Total | 11,152 (100.0%) | 10,297 (100.0%) |
Families and Households in Kailua CDP Hawaii County
Median Family Size in Kailua CDP Hawaii County
The median family size in Kailua CDP Hawaii County is 3.32 persons per family, with single female/mother families (612 | 12.6%) accounting for the largest median family size of 3.93 persons per family. On the other hand, married-couple families (3,848 | 79.2%) represent the smallest median family size with 3.19 persons per family.
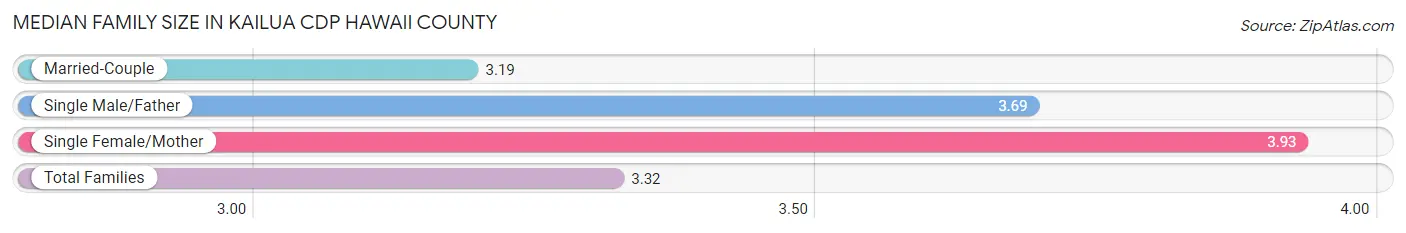
| Family Type | # Families | Family Size |
| Married-Couple | 3,848 (79.2%) | 3.19 |
| Single Male/Father | 401 (8.3%) | 3.69 |
| Single Female/Mother | 612 (12.6%) | 3.93 |
| Total Families | 4,861 (100.0%) | 3.32 |
Median Household Size in Kailua CDP Hawaii County
The median household size in Kailua CDP Hawaii County is 2.84 persons per household, with single female/mother households (612 | 8.2%) accounting for the largest median household size of 4.58 persons per household. non-family households (2,582 | 34.7%) represent the smallest median household size with 1.52 persons per household.
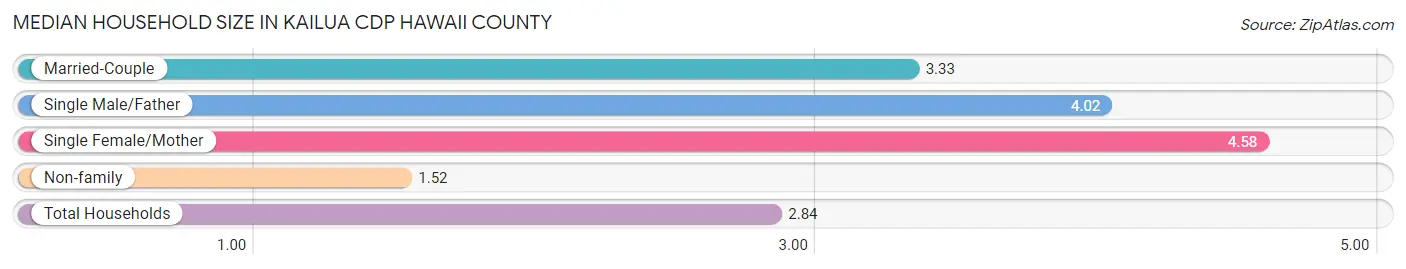
| Household Type | # Households | Household Size |
| Married-Couple | 3,848 (51.7%) | 3.33 |
| Single Male/Father | 401 (5.4%) | 4.02 |
| Single Female/Mother | 612 (8.2%) | 4.58 |
| Non-family | 2,582 (34.7%) | 1.52 |
| Total Households | 7,443 (100.0%) | 2.84 |
Household Size by Marriage Status in Kailua CDP Hawaii County
Out of a total of 7,443 households in Kailua CDP Hawaii County, 4,861 (65.3%) are family households, while 2,582 (34.7%) are nonfamily households. The most numerous type of family households are 2-person households, comprising 2,180, and the most common type of nonfamily households are 1-person households, comprising 1,740.
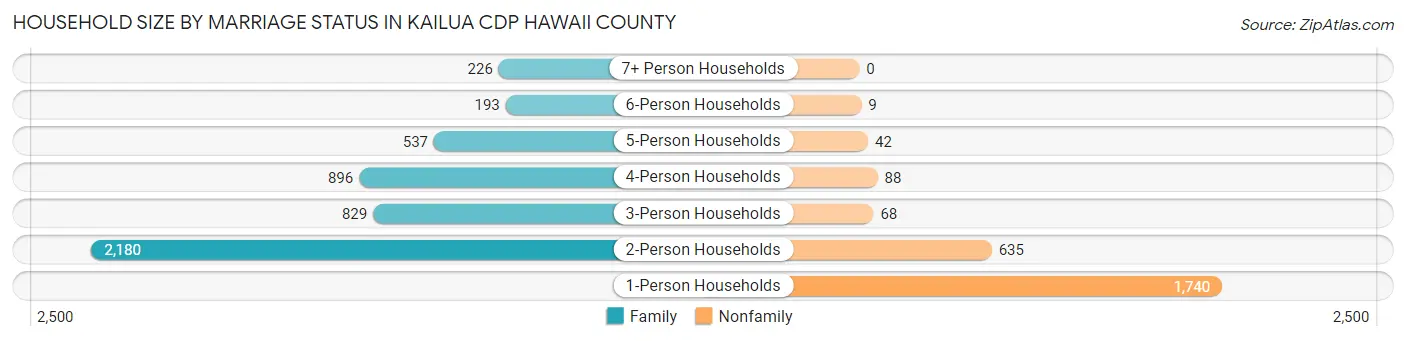
| Household Size | Family Households | Nonfamily Households |
| 1-Person Households | - | 1,740 (23.4%) |
| 2-Person Households | 2,180 (29.3%) | 635 (8.5%) |
| 3-Person Households | 829 (11.1%) | 68 (0.9%) |
| 4-Person Households | 896 (12.0%) | 88 (1.2%) |
| 5-Person Households | 537 (7.2%) | 42 (0.6%) |
| 6-Person Households | 193 (2.6%) | 9 (0.1%) |
| 7+ Person Households | 226 (3.0%) | 0 (0.0%) |
| Total | 4,861 (65.3%) | 2,582 (34.7%) |
Female Fertility in Kailua CDP Hawaii County
Fertility by Age in Kailua CDP Hawaii County
Average fertility rate in Kailua CDP Hawaii County is 56.0 births per 1,000 women. Women in the age bracket of 35 to 50 years have the highest fertility rate with 88.0 births per 1,000 women. Women in the age bracket of 35 to 50 years acount for 75.5% of all women with births.
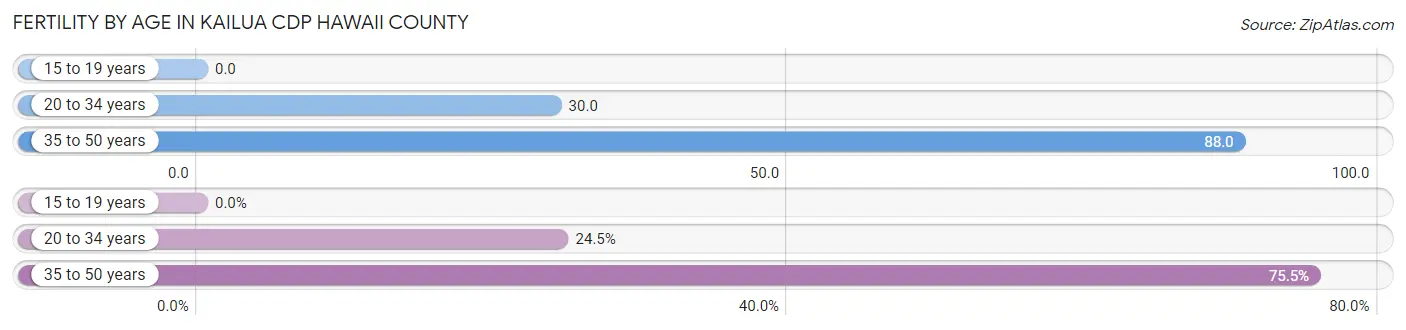
| Age Bracket | Women with Births | Births / 1,000 Women |
| 15 to 19 years | 0 (0.0%) | 0.0 |
| 20 to 34 years | 58 (24.5%) | 30.0 |
| 35 to 50 years | 179 (75.5%) | 88.0 |
| Total | 237 (100.0%) | 56.0 |
Fertility by Age by Marriage Status in Kailua CDP Hawaii County
88.2% of women with births (237) in Kailua CDP Hawaii County are married. The highest percentage of unmarried women with births falls into 20 to 34 years age bracket with 48.3% of them unmarried at the time of birth, while the lowest percentage of unmarried women with births belong to 35 to 50 years age bracket with 0.0% of them unmarried.
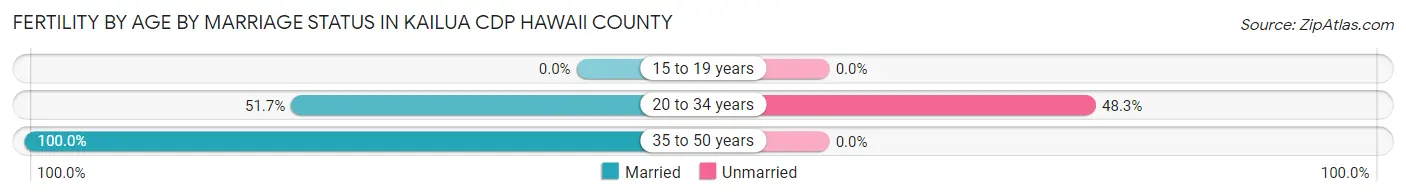
| Age Bracket | Married | Unmarried |
| 15 to 19 years | 0 (0.0%) | 0 (0.0%) |
| 20 to 34 years | 30 (51.7%) | 28 (48.3%) |
| 35 to 50 years | 179 (100.0%) | 0 (0.0%) |
| Total | 209 (88.2%) | 28 (11.8%) |
Fertility by Education in Kailua CDP Hawaii County
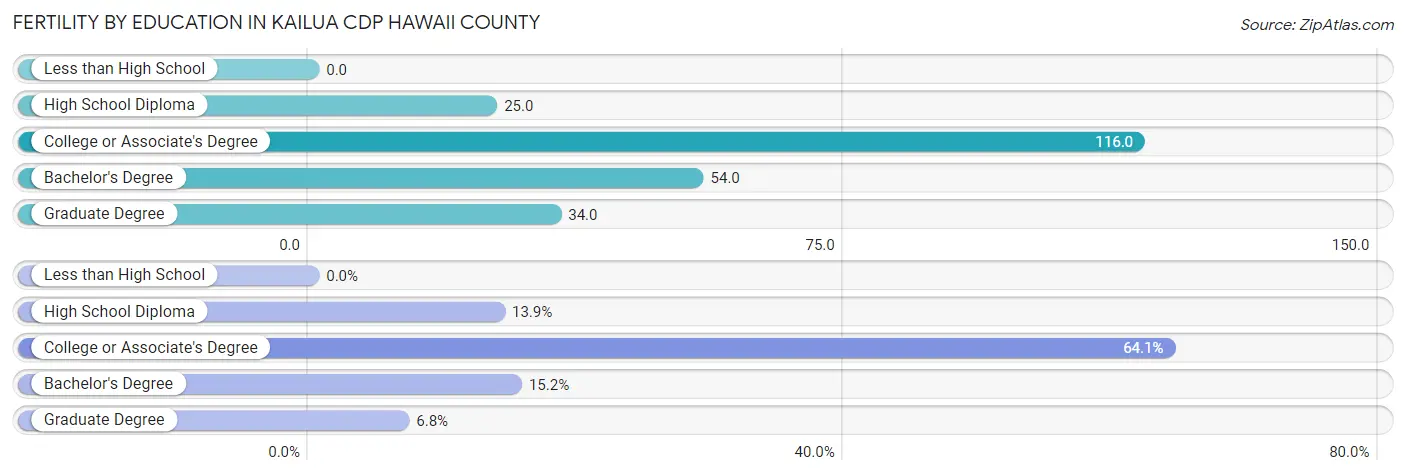
| Educational Attainment | Women with Births | Births / 1,000 Women |
| Less than High School | 0 (0.0%) | 0.0 |
| High School Diploma | 33 (13.9%) | 25.0 |
| College or Associate's Degree | 152 (64.1%) | 116.0 |
| Bachelor's Degree | 36 (15.2%) | 54.0 |
| Graduate Degree | 16 (6.8%) | 34.0 |
| Total | 237 (100.0%) | 56.0 |
Fertility by Education by Marriage Status in Kailua CDP Hawaii County
11.8% of women with births in Kailua CDP Hawaii County are unmarried. Women with the educational attainment of graduate degree are most likely to be married with 100.0% of them married at childbirth, while women with the educational attainment of bachelor's degree are least likely to be married with 58.3% of them unmarried at childbirth.
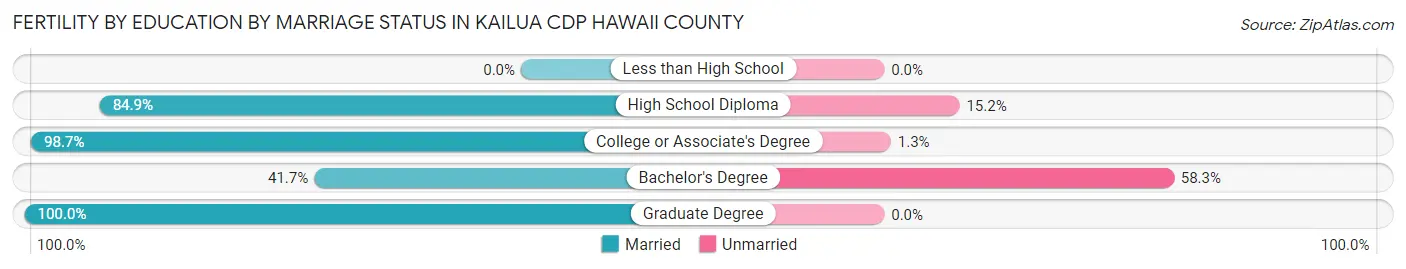
| Educational Attainment | Married | Unmarried |
| Less than High School | 0 (0.0%) | 0 (0.0%) |
| High School Diploma | 28 (84.9%) | 5 (15.1%) |
| College or Associate's Degree | 150 (98.7%) | 2 (1.3%) |
| Bachelor's Degree | 15 (41.7%) | 21 (58.3%) |
| Graduate Degree | 16 (100.0%) | 0 (0.0%) |
| Total | 209 (88.2%) | 28 (11.8%) |
Employment Characteristics in Kailua CDP Hawaii County
Employment by Class of Employer in Kailua CDP Hawaii County
Among the 10,539 employed individuals in Kailua CDP Hawaii County, private company employees (6,902 | 65.5%), self-employed (not incorporated) (1,468 | 13.9%), and self-employed (incorporated) (566 | 5.4%) make up the most common classes of employment.
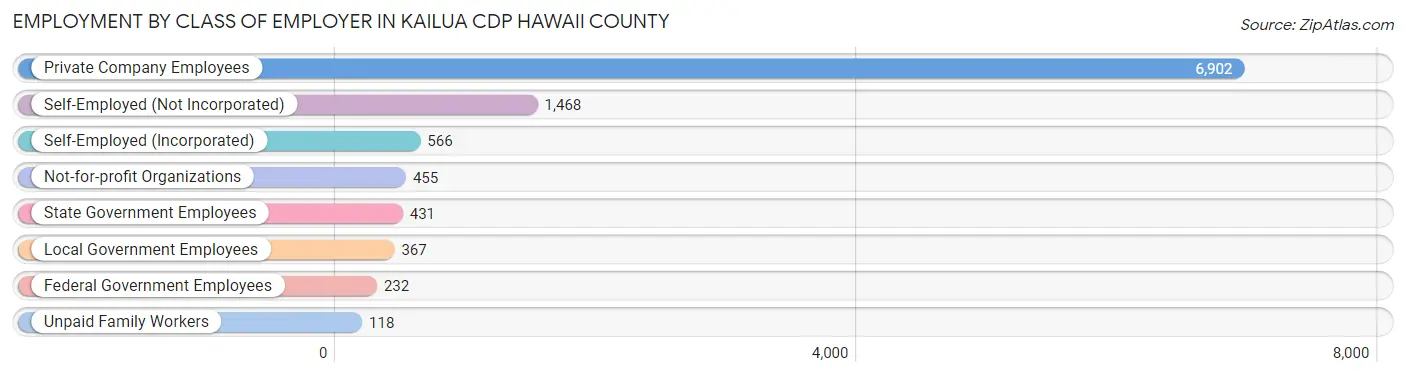
| Employer Class | # Employees | % Employees |
| Private Company Employees | 6,902 | 65.5% |
| Self-Employed (Incorporated) | 566 | 5.4% |
| Self-Employed (Not Incorporated) | 1,468 | 13.9% |
| Not-for-profit Organizations | 455 | 4.3% |
| Local Government Employees | 367 | 3.5% |
| State Government Employees | 431 | 4.1% |
| Federal Government Employees | 232 | 2.2% |
| Unpaid Family Workers | 118 | 1.1% |
| Total | 10,539 | 100.0% |
Employment Status by Age in Kailua CDP Hawaii County
According to the labor force statistics for Kailua CDP Hawaii County, out of the total population over 16 years of age (17,430), 64.6% or 11,260 individuals are in the labor force, with 3.7% or 417 of them unemployed. The age group with the highest labor force participation rate is 20 to 24 years, with 88.1% or 1,241 individuals in the labor force. Within the labor force, the 60 to 64 years age range has the highest percentage of unemployed individuals, with 9.6% or 116 of them being unemployed.
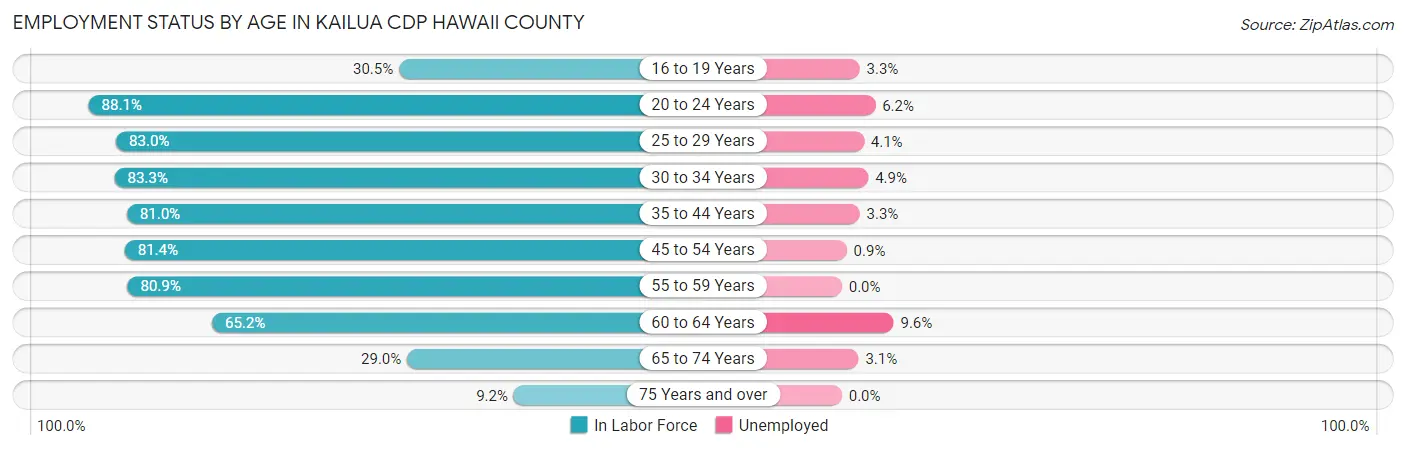
| Age Bracket | In Labor Force | Unemployed |
| 16 to 19 Years | 180 (30.5%) | 6 (3.3%) |
| 20 to 24 Years | 1,241 (88.1%) | 77 (6.2%) |
| 25 to 29 Years | 1,512 (83.0%) | 62 (4.1%) |
| 30 to 34 Years | 904 (83.3%) | 44 (4.9%) |
| 35 to 44 Years | 1,950 (81.0%) | 64 (3.3%) |
| 45 to 54 Years | 2,053 (81.4%) | 18 (0.9%) |
| 55 to 59 Years | 1,332 (80.9%) | 0 (0.0%) |
| 60 to 64 Years | 1,206 (65.2%) | 116 (9.6%) |
| 65 to 74 Years | 739 (29.0%) | 23 (3.1%) |
| 75 Years and over | 143 (9.2%) | 0 (0.0%) |
| Total | 11,260 (64.6%) | 417 (3.7%) |
Employment Status by Educational Attainment in Kailua CDP Hawaii County
According to labor force statistics for Kailua CDP Hawaii County, 79.0% of individuals (8,951) out of the total population between 25 and 64 years of age (11,331) are in the labor force, with 3.4% or 304 of them being unemployed. The group with the highest labor force participation rate are those with the educational attainment of college / associate degree, with 83.7% or 3,428 individuals in the labor force. Within the labor force, individuals with high school diploma education have the highest percentage of unemployment, with 6.2% or 140 of them being unemployed.
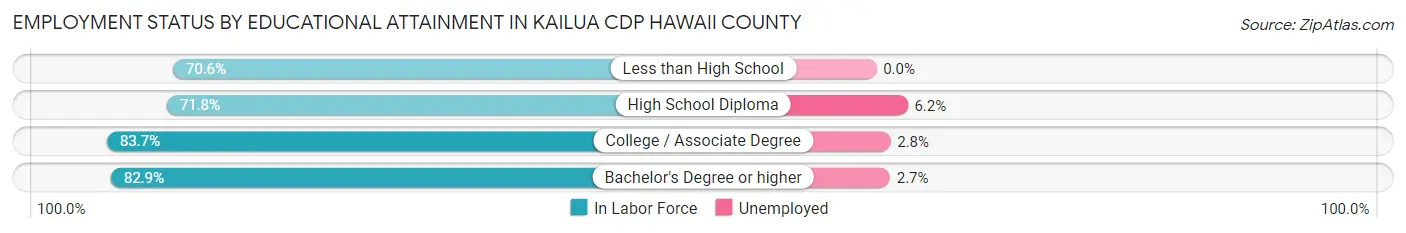
| Educational Attainment | In Labor Force | Unemployed |
| Less than High School | 695 (70.6%) | 0 (0.0%) |
| High School Diploma | 2,263 (71.8%) | 195 (6.2%) |
| College / Associate Degree | 3,428 (83.7%) | 115 (2.8%) |
| Bachelor's Degree or higher | 2,570 (82.9%) | 84 (2.7%) |
| Total | 8,951 (79.0%) | 385 (3.4%) |
Employment Occupations by Sex in Kailua CDP Hawaii County
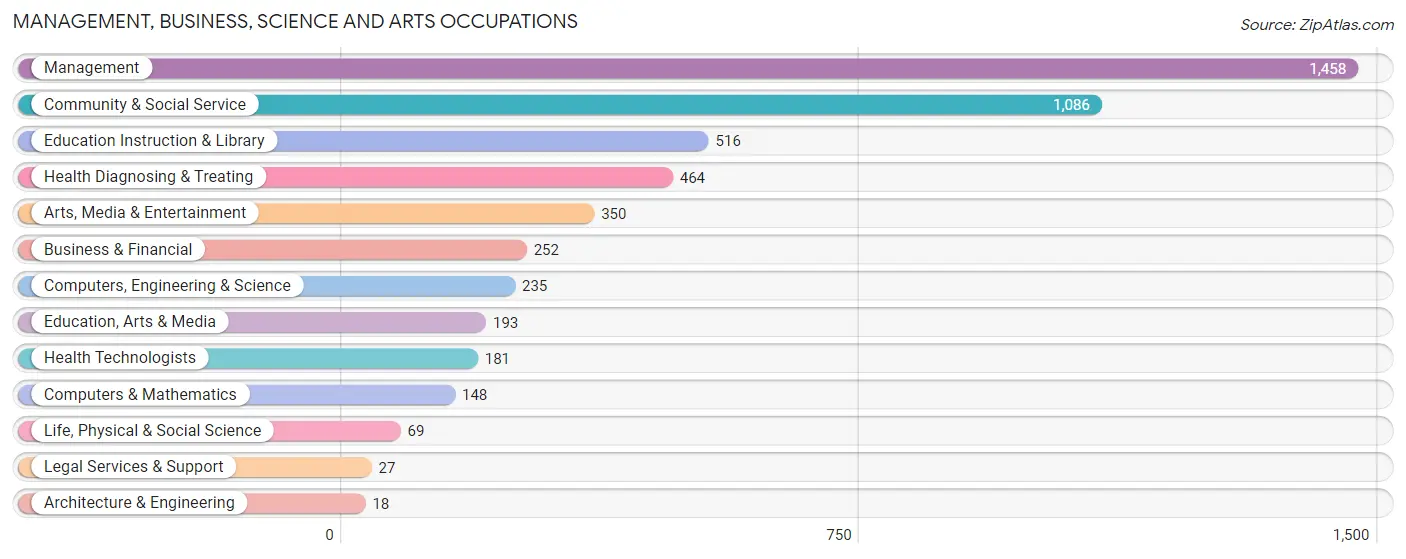
Management, Business, Science and Arts Occupations
The most common Management, Business, Science and Arts occupations in Kailua CDP Hawaii County are Management (1,458 | 13.4%), Community & Social Service (1,086 | 10.0%), Education Instruction & Library (516 | 4.8%), Health Diagnosing & Treating (464 | 4.3%), and Arts, Media & Entertainment (350 | 3.2%).
Management, Business, Science and Arts Occupations by Sex
Within the Management, Business, Science and Arts occupations in Kailua CDP Hawaii County, the most male-oriented occupations are Architecture & Engineering (100.0%), Computers & Mathematics (88.5%), and Computers, Engineering & Science (80.0%), while the most female-oriented occupations are Education Instruction & Library (93.2%), Health Technologists (77.9%), and Health Diagnosing & Treating (75.9%).
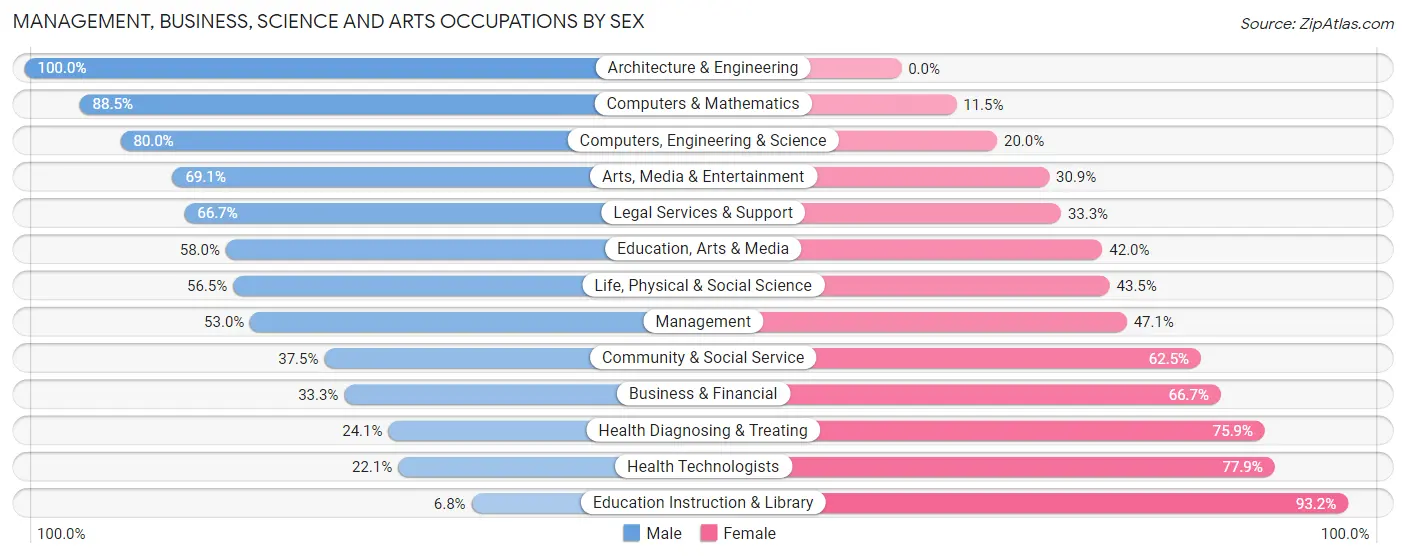
| Occupation | Male | Female |
| Management | 772 (52.9%) | 686 (47.0%) |
| Business & Financial | 84 (33.3%) | 168 (66.7%) |
| Computers, Engineering & Science | 188 (80.0%) | 47 (20.0%) |
| Computers & Mathematics | 131 (88.5%) | 17 (11.5%) |
| Architecture & Engineering | 18 (100.0%) | 0 (0.0%) |
| Life, Physical & Social Science | 39 (56.5%) | 30 (43.5%) |
| Community & Social Service | 407 (37.5%) | 679 (62.5%) |
| Education, Arts & Media | 112 (58.0%) | 81 (42.0%) |
| Legal Services & Support | 18 (66.7%) | 9 (33.3%) |
| Education Instruction & Library | 35 (6.8%) | 481 (93.2%) |
| Arts, Media & Entertainment | 242 (69.1%) | 108 (30.9%) |
| Health Diagnosing & Treating | 112 (24.1%) | 352 (75.9%) |
| Health Technologists | 40 (22.1%) | 141 (77.9%) |
| Total (Category) | 1,563 (44.7%) | 1,932 (55.3%) |
| Total (Overall) | 5,894 (54.3%) | 4,953 (45.7%) |
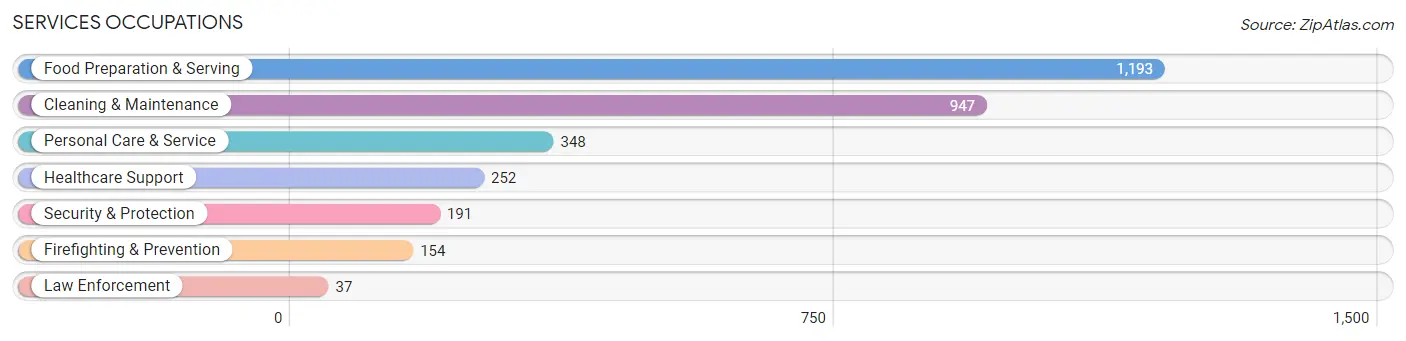
Services Occupations
The most common Services occupations in Kailua CDP Hawaii County are Food Preparation & Serving (1,193 | 11.0%), Cleaning & Maintenance (947 | 8.7%), Personal Care & Service (348 | 3.2%), Healthcare Support (252 | 2.3%), and Security & Protection (191 | 1.8%).
Services Occupations by Sex
Within the Services occupations in Kailua CDP Hawaii County, the most male-oriented occupations are Cleaning & Maintenance (65.5%), Firefighting & Prevention (61.7%), and Security & Protection (60.2%), while the most female-oriented occupations are Healthcare Support (86.1%), Personal Care & Service (53.7%), and Law Enforcement (46.0%).
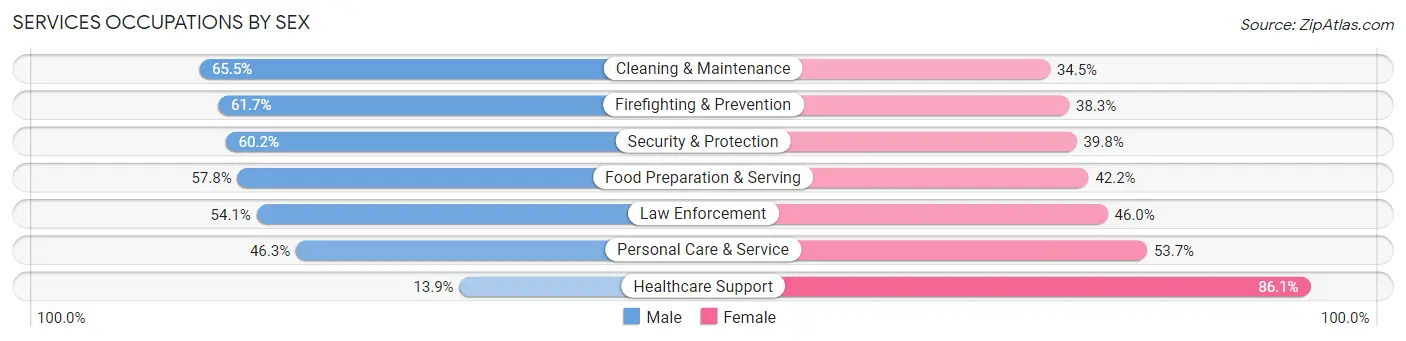
| Occupation | Male | Female |
| Healthcare Support | 35 (13.9%) | 217 (86.1%) |
| Security & Protection | 115 (60.2%) | 76 (39.8%) |
| Firefighting & Prevention | 95 (61.7%) | 59 (38.3%) |
| Law Enforcement | 20 (54.0%) | 17 (46.0%) |
| Food Preparation & Serving | 690 (57.8%) | 503 (42.2%) |
| Cleaning & Maintenance | 620 (65.5%) | 327 (34.5%) |
| Personal Care & Service | 161 (46.3%) | 187 (53.7%) |
| Total (Category) | 1,621 (55.3%) | 1,310 (44.7%) |
| Total (Overall) | 5,894 (54.3%) | 4,953 (45.7%) |
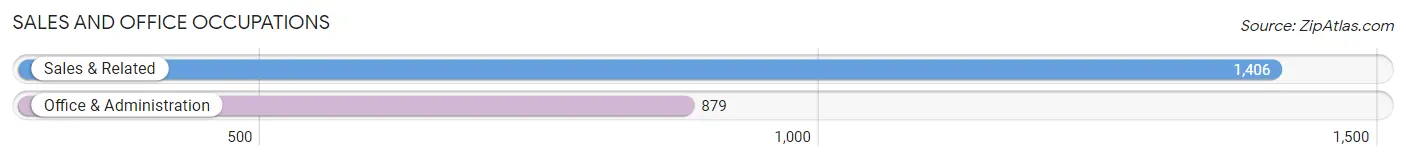
Sales and Office Occupations
The most common Sales and Office occupations in Kailua CDP Hawaii County are Sales & Related (1,406 | 13.0%), and Office & Administration (879 | 8.1%).
Sales and Office Occupations by Sex
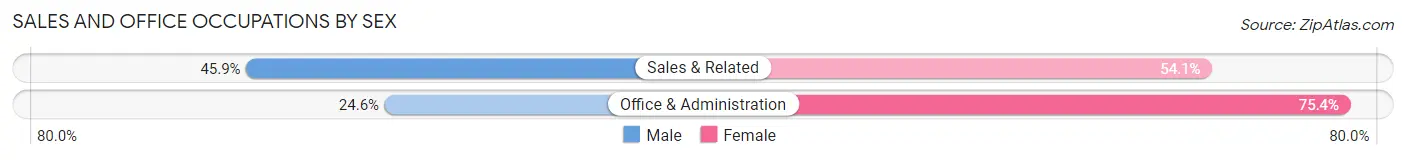
| Occupation | Male | Female |
| Sales & Related | 645 (45.9%) | 761 (54.1%) |
| Office & Administration | 216 (24.6%) | 663 (75.4%) |
| Total (Category) | 861 (37.7%) | 1,424 (62.3%) |
| Total (Overall) | 5,894 (54.3%) | 4,953 (45.7%) |
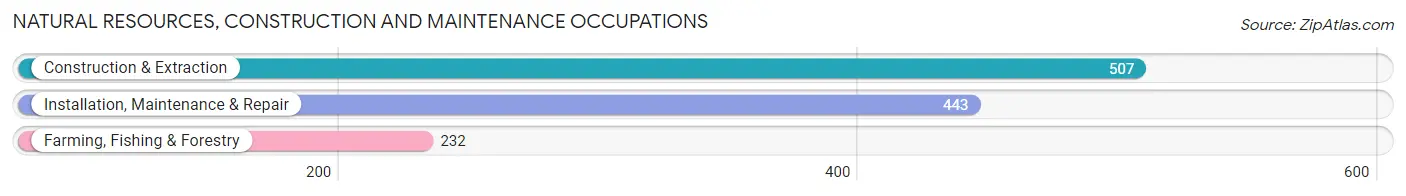
Natural Resources, Construction and Maintenance Occupations
The most common Natural Resources, Construction and Maintenance occupations in Kailua CDP Hawaii County are Construction & Extraction (507 | 4.7%), Installation, Maintenance & Repair (443 | 4.1%), and Farming, Fishing & Forestry (232 | 2.1%).
Natural Resources, Construction and Maintenance Occupations by Sex
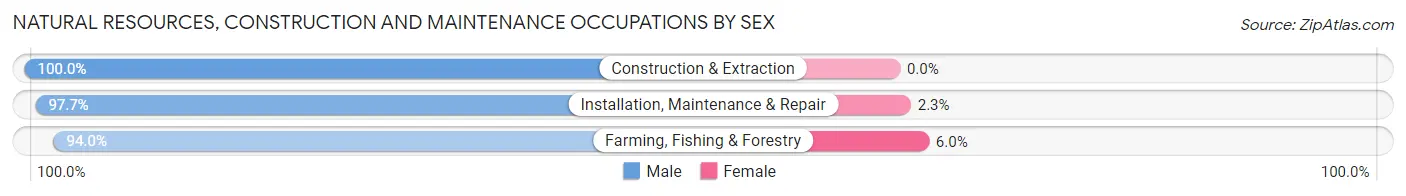
| Occupation | Male | Female |
| Farming, Fishing & Forestry | 218 (94.0%) | 14 (6.0%) |
| Construction & Extraction | 507 (100.0%) | 0 (0.0%) |
| Installation, Maintenance & Repair | 433 (97.7%) | 10 (2.3%) |
| Total (Category) | 1,158 (98.0%) | 24 (2.0%) |
| Total (Overall) | 5,894 (54.3%) | 4,953 (45.7%) |
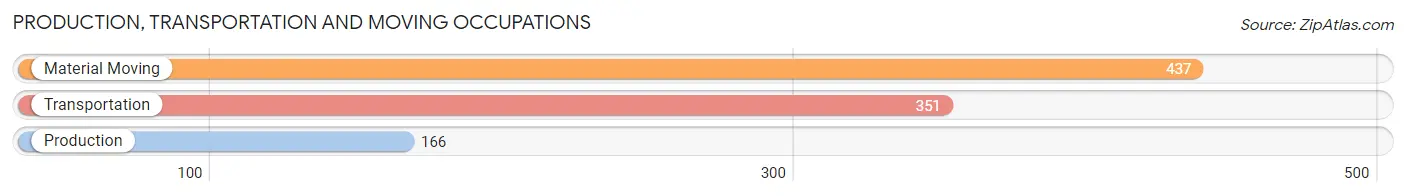
Production, Transportation and Moving Occupations
The most common Production, Transportation and Moving occupations in Kailua CDP Hawaii County are Material Moving (437 | 4.0%), Transportation (351 | 3.2%), and Production (166 | 1.5%).
Production, Transportation and Moving Occupations by Sex
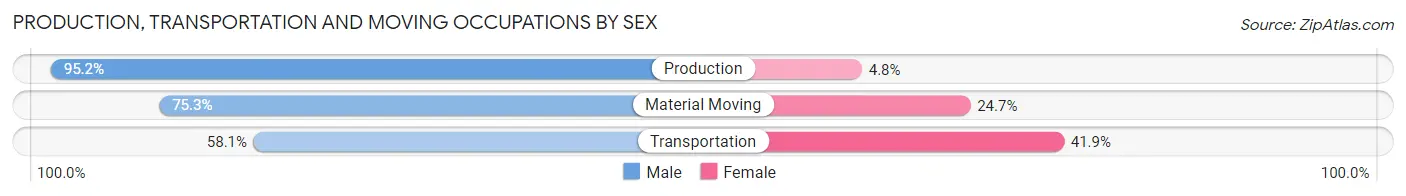
| Occupation | Male | Female |
| Production | 158 (95.2%) | 8 (4.8%) |
| Transportation | 204 (58.1%) | 147 (41.9%) |
| Material Moving | 329 (75.3%) | 108 (24.7%) |
| Total (Category) | 691 (72.4%) | 263 (27.6%) |
| Total (Overall) | 5,894 (54.3%) | 4,953 (45.7%) |
Employment Industries by Sex in Kailua CDP Hawaii County
Employment Industries in Kailua CDP Hawaii County
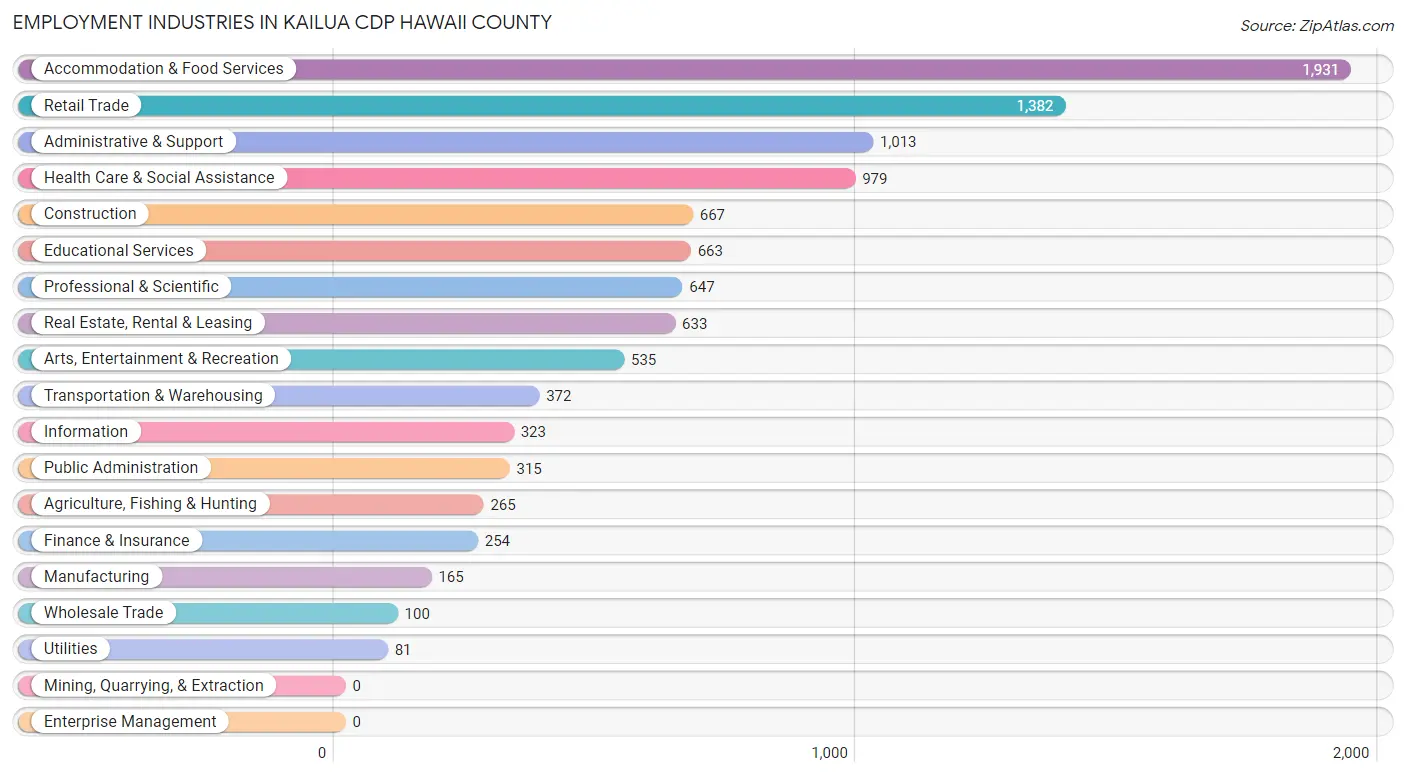
The major employment industries in Kailua CDP Hawaii County include Accommodation & Food Services (1,931 | 17.8%), Retail Trade (1,382 | 12.7%), Administrative & Support (1,013 | 9.3%), Health Care & Social Assistance (979 | 9.0%), and Construction (667 | 6.1%).
Employment Industries by Sex in Kailua CDP Hawaii County
The Kailua CDP Hawaii County industries that see more men than women are Wholesale Trade (100.0%), Agriculture, Fishing & Hunting (94.7%), and Construction (88.8%), whereas the industries that tend to have a higher number of women are Educational Services (85.7%), Health Care & Social Assistance (81.6%), and Information (56.0%).
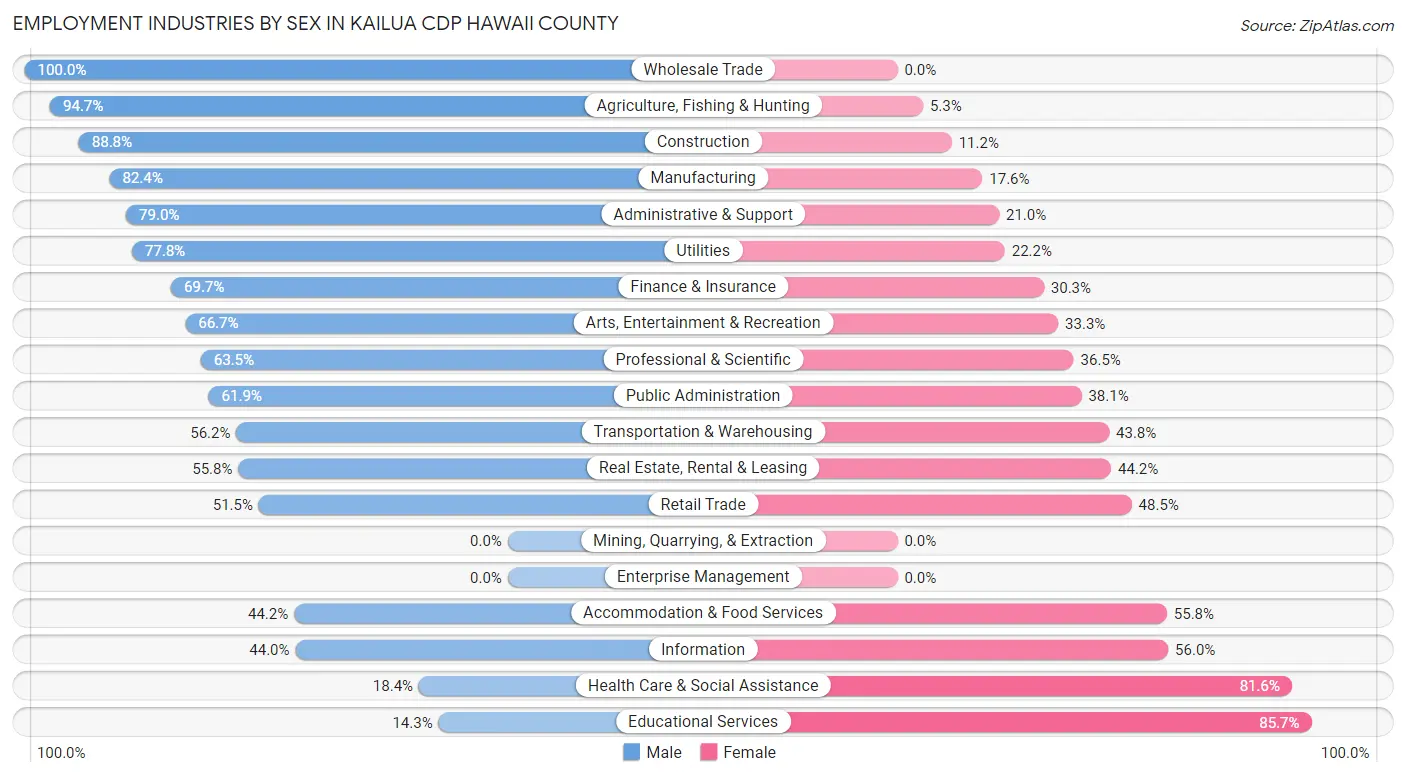
| Industry | Male | Female |
| Agriculture, Fishing & Hunting | 251 (94.7%) | 14 (5.3%) |
| Mining, Quarrying, & Extraction | 0 (0.0%) | 0 (0.0%) |
| Construction | 592 (88.8%) | 75 (11.2%) |
| Manufacturing | 136 (82.4%) | 29 (17.6%) |
| Wholesale Trade | 100 (100.0%) | 0 (0.0%) |
| Retail Trade | 712 (51.5%) | 670 (48.5%) |
| Transportation & Warehousing | 209 (56.2%) | 163 (43.8%) |
| Utilities | 63 (77.8%) | 18 (22.2%) |
| Information | 142 (44.0%) | 181 (56.0%) |
| Finance & Insurance | 177 (69.7%) | 77 (30.3%) |
| Real Estate, Rental & Leasing | 353 (55.8%) | 280 (44.2%) |
| Professional & Scientific | 411 (63.5%) | 236 (36.5%) |
| Enterprise Management | 0 (0.0%) | 0 (0.0%) |
| Administrative & Support | 800 (79.0%) | 213 (21.0%) |
| Educational Services | 95 (14.3%) | 568 (85.7%) |
| Health Care & Social Assistance | 180 (18.4%) | 799 (81.6%) |
| Arts, Entertainment & Recreation | 357 (66.7%) | 178 (33.3%) |
| Accommodation & Food Services | 854 (44.2%) | 1,077 (55.8%) |
| Public Administration | 195 (61.9%) | 120 (38.1%) |
| Total | 5,894 (54.3%) | 4,953 (45.7%) |
Education in Kailua CDP Hawaii County
School Enrollment in Kailua CDP Hawaii County
The most common levels of schooling among the 4,057 students in Kailua CDP Hawaii County are elementary school (1,078 | 26.6%), middle school (917 | 22.6%), and high school (629 | 15.5%).
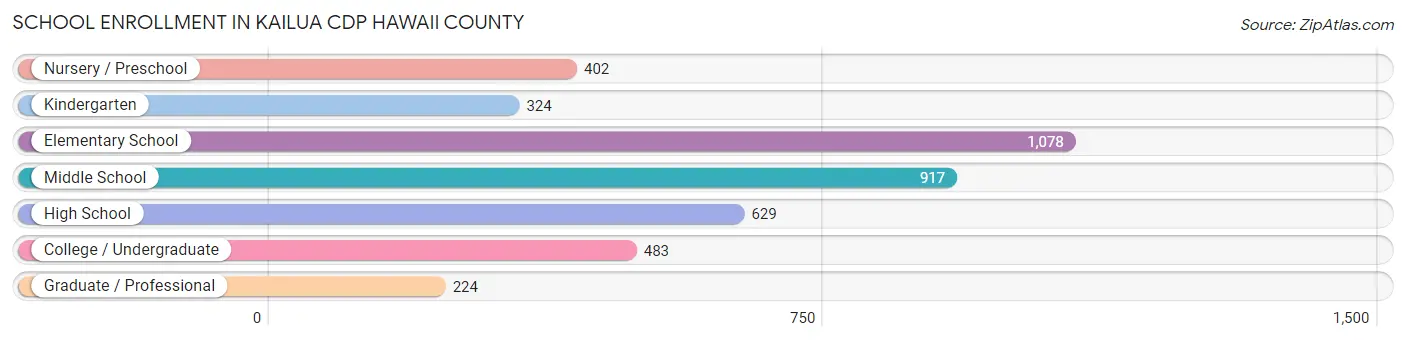
| School Level | # Students | % Students |
| Nursery / Preschool | 402 | 9.9% |
| Kindergarten | 324 | 8.0% |
| Elementary School | 1,078 | 26.6% |
| Middle School | 917 | 22.6% |
| High School | 629 | 15.5% |
| College / Undergraduate | 483 | 11.9% |
| Graduate / Professional | 224 | 5.5% |
| Total | 4,057 | 100.0% |
School Enrollment by Age by Funding Source in Kailua CDP Hawaii County
Out of a total of 4,057 students who are enrolled in schools in Kailua CDP Hawaii County, 661 (16.3%) attend a private institution, while the remaining 3,396 (83.7%) are enrolled in public schools. The age group of 35 years and over has the highest likelihood of being enrolled in private schools, with 123 (39.6% in the age bracket) enrolled. Conversely, the age group of 18 to 19 year olds has the lowest likelihood of being enrolled in a private school, with 104 (93.7% in the age bracket) attending a public institution.
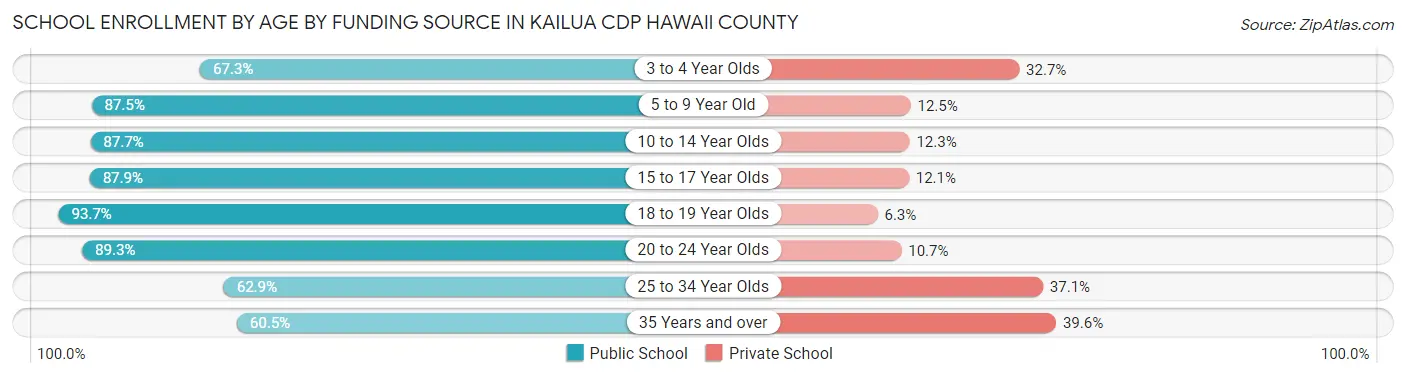
| Age Bracket | Public School | Private School |
| 3 to 4 Year Olds | 210 (67.3%) | 102 (32.7%) |
| 5 to 9 Year Old | 1,124 (87.5%) | 160 (12.5%) |
| 10 to 14 Year Olds | 1,109 (87.7%) | 155 (12.3%) |
| 15 to 17 Year Olds | 391 (87.9%) | 54 (12.1%) |
| 18 to 19 Year Olds | 104 (93.7%) | 7 (6.3%) |
| 20 to 24 Year Olds | 208 (89.3%) | 25 (10.7%) |
| 25 to 34 Year Olds | 61 (62.9%) | 36 (37.1%) |
| 35 Years and over | 188 (60.5%) | 123 (39.6%) |
| Total | 3,396 (83.7%) | 661 (16.3%) |
Educational Attainment by Field of Study in Kailua CDP Hawaii County
Business (958 | 17.4%), education (653 | 11.9%), social sciences (575 | 10.5%), visual & performing arts (479 | 8.7%), and science & technology (448 | 8.2%) are the most common fields of study among 5,496 individuals in Kailua CDP Hawaii County who have obtained a bachelor's degree or higher.
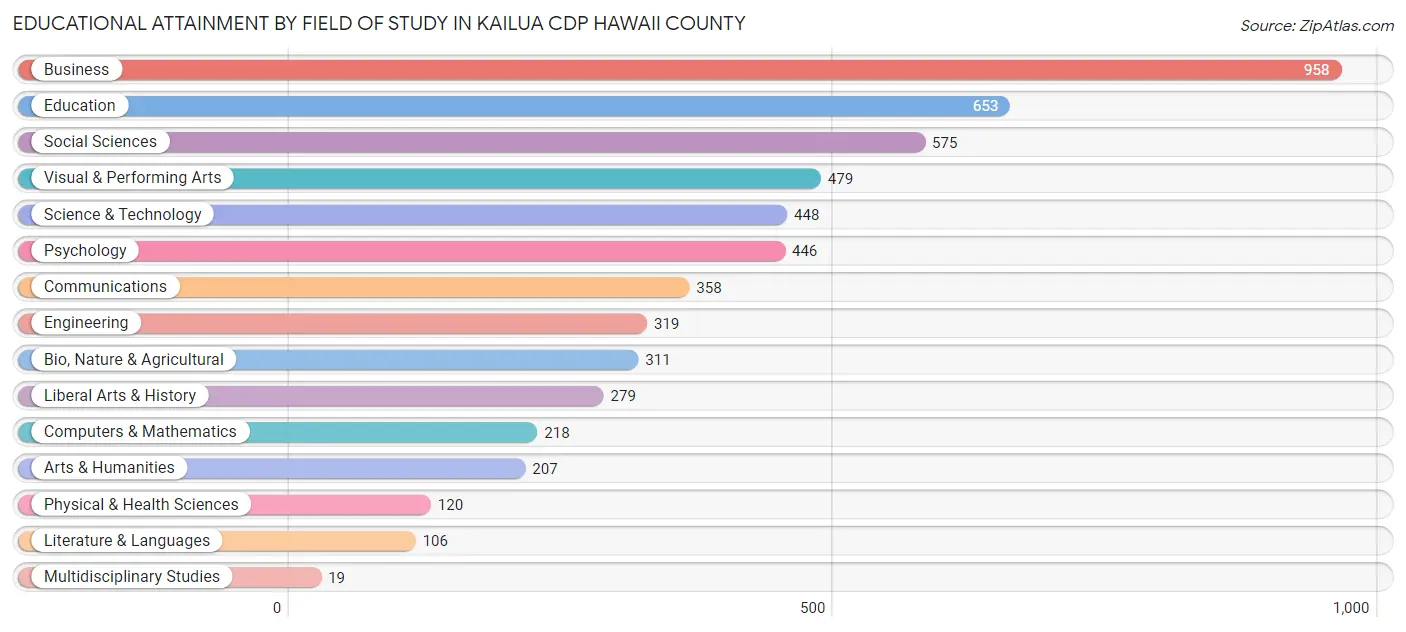
| Field of Study | # Graduates | % Graduates |
| Computers & Mathematics | 218 | 4.0% |
| Bio, Nature & Agricultural | 311 | 5.7% |
| Physical & Health Sciences | 120 | 2.2% |
| Psychology | 446 | 8.1% |
| Social Sciences | 575 | 10.5% |
| Engineering | 319 | 5.8% |
| Multidisciplinary Studies | 19 | 0.4% |
| Science & Technology | 448 | 8.2% |
| Business | 958 | 17.4% |
| Education | 653 | 11.9% |
| Literature & Languages | 106 | 1.9% |
| Liberal Arts & History | 279 | 5.1% |
| Visual & Performing Arts | 479 | 8.7% |
| Communications | 358 | 6.5% |
| Arts & Humanities | 207 | 3.8% |
| Total | 5,496 | 100.0% |
Transportation & Commute in Kailua CDP Hawaii County
Vehicle Availability by Sex in Kailua CDP Hawaii County
The most prevalent vehicle ownership categories in Kailua CDP Hawaii County are males with 2 vehicles (2,536, accounting for 44.4%) and females with 2 vehicles (1,728, making up 53.4%).
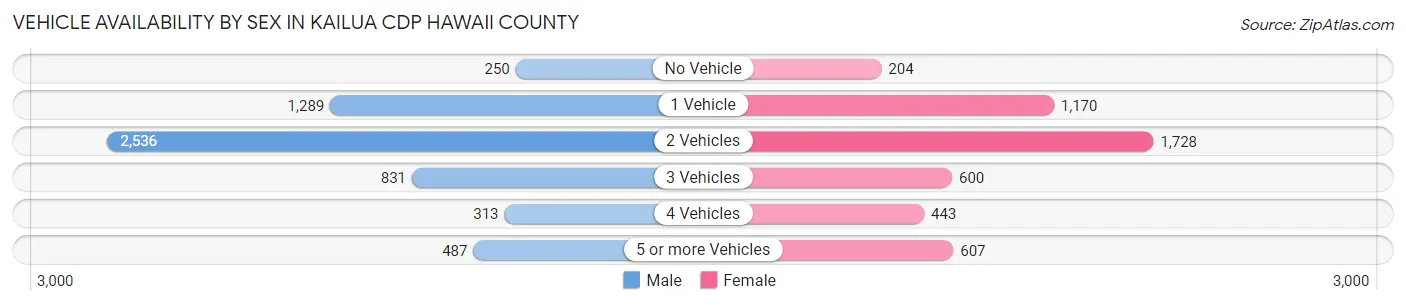
| Vehicles Available | Male | Female |
| No Vehicle | 250 (4.4%) | 204 (4.3%) |
| 1 Vehicle | 1,289 (22.6%) | 1,170 (24.6%) |
| 2 Vehicles | 2,536 (44.4%) | 1,728 (36.4%) |
| 3 Vehicles | 831 (14.6%) | 600 (12.6%) |
| 4 Vehicles | 313 (5.5%) | 443 (9.3%) |
| 5 or more Vehicles | 487 (8.5%) | 607 (12.8%) |
| Total | 5,706 (100.0%) | 4,752 (100.0%) |
Commute Time in Kailua CDP Hawaii County
The most frequently occuring commute durations in Kailua CDP Hawaii County are 15 to 19 minutes (1,708 commuters, 18.3%), 5 to 9 minutes (1,525 commuters, 16.4%), and 30 to 34 minutes (1,456 commuters, 15.7%).
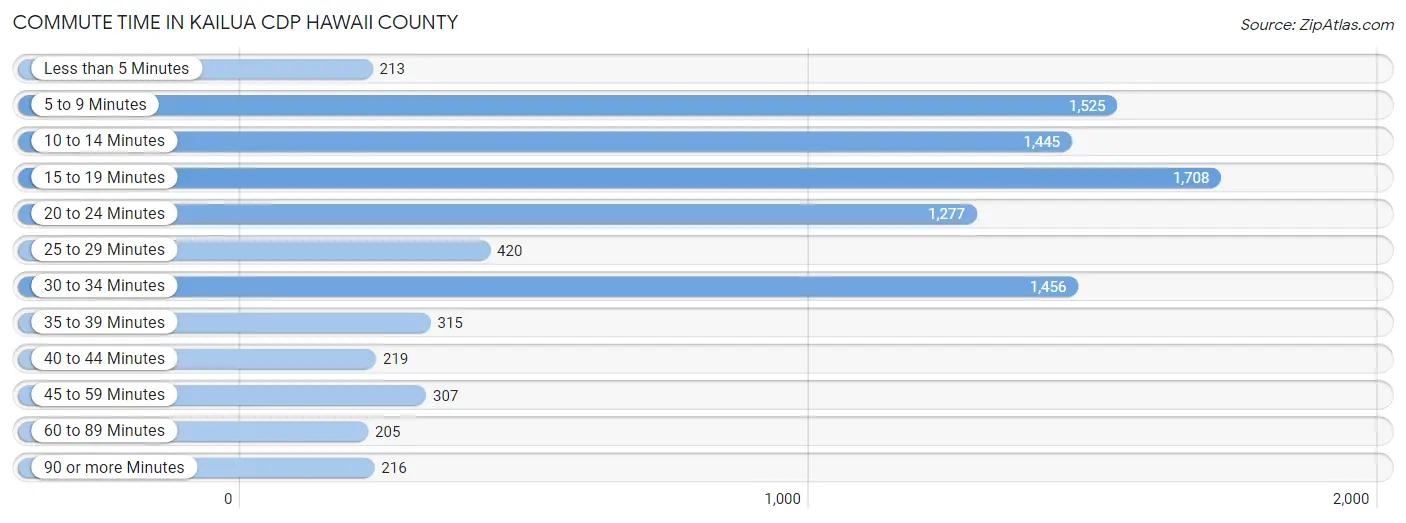
| Commute Time | # Commuters | % Commuters |
| Less than 5 Minutes | 213 | 2.3% |
| 5 to 9 Minutes | 1,525 | 16.4% |
| 10 to 14 Minutes | 1,445 | 15.5% |
| 15 to 19 Minutes | 1,708 | 18.3% |
| 20 to 24 Minutes | 1,277 | 13.7% |
| 25 to 29 Minutes | 420 | 4.5% |
| 30 to 34 Minutes | 1,456 | 15.7% |
| 35 to 39 Minutes | 315 | 3.4% |
| 40 to 44 Minutes | 219 | 2.4% |
| 45 to 59 Minutes | 307 | 3.3% |
| 60 to 89 Minutes | 205 | 2.2% |
| 90 or more Minutes | 216 | 2.3% |
Commute Time by Sex in Kailua CDP Hawaii County
The most common commute times in Kailua CDP Hawaii County are 5 to 9 minutes (898 commuters, 18.4%) for males and 10 to 14 minutes (966 commuters, 21.8%) for females.
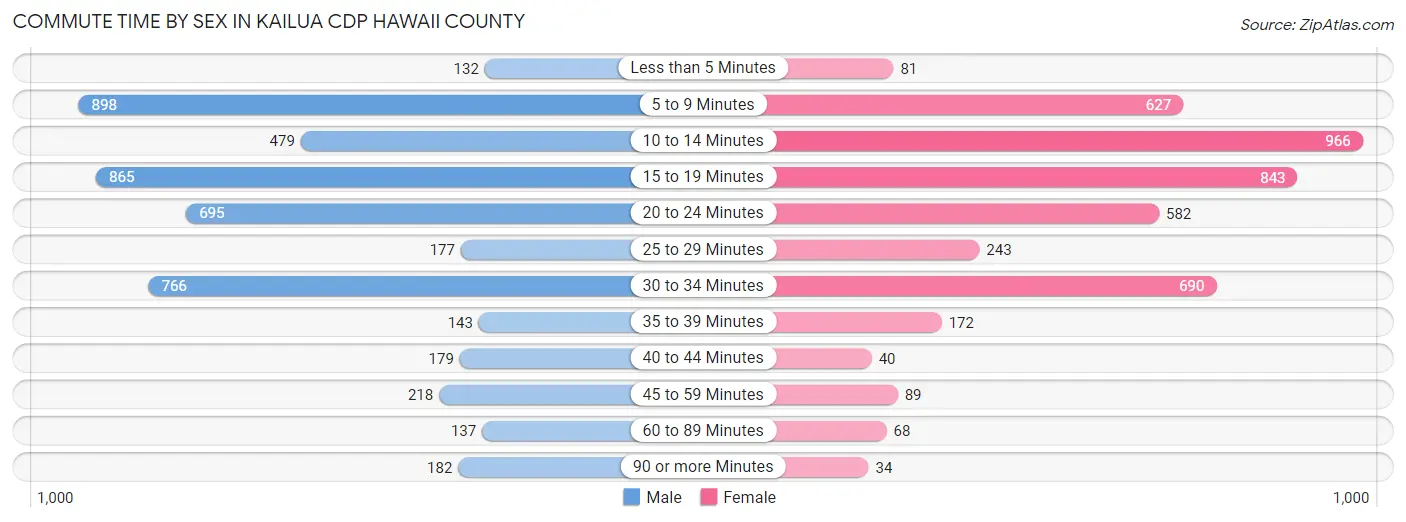
| Commute Time | Male | Female |
| Less than 5 Minutes | 132 (2.7%) | 81 (1.8%) |
| 5 to 9 Minutes | 898 (18.4%) | 627 (14.1%) |
| 10 to 14 Minutes | 479 (9.8%) | 966 (21.8%) |
| 15 to 19 Minutes | 865 (17.8%) | 843 (19.0%) |
| 20 to 24 Minutes | 695 (14.3%) | 582 (13.1%) |
| 25 to 29 Minutes | 177 (3.6%) | 243 (5.5%) |
| 30 to 34 Minutes | 766 (15.7%) | 690 (15.6%) |
| 35 to 39 Minutes | 143 (2.9%) | 172 (3.9%) |
| 40 to 44 Minutes | 179 (3.7%) | 40 (0.9%) |
| 45 to 59 Minutes | 218 (4.5%) | 89 (2.0%) |
| 60 to 89 Minutes | 137 (2.8%) | 68 (1.5%) |
| 90 or more Minutes | 182 (3.7%) | 34 (0.8%) |
Time of Departure to Work by Sex in Kailua CDP Hawaii County
The most frequent times of departure to work in Kailua CDP Hawaii County are 7:00 AM to 7:29 AM (675, 13.9%) for males and 7:30 AM to 7:59 AM (957, 21.6%) for females.
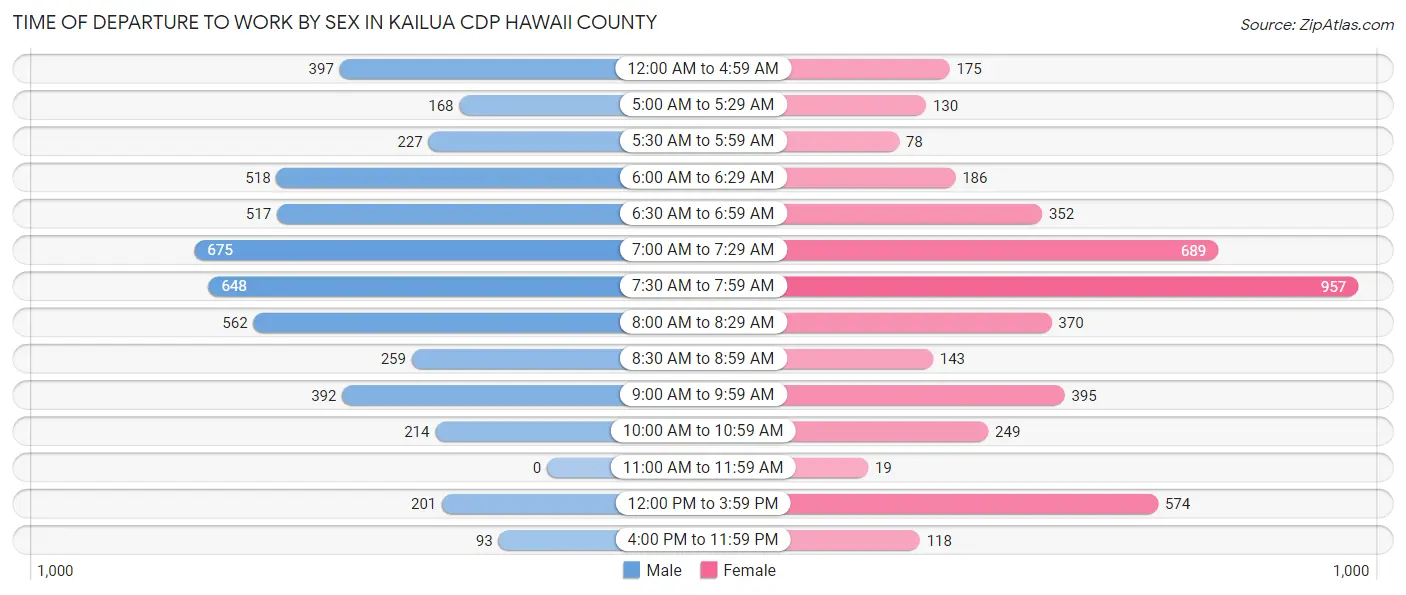
| Time of Departure | Male | Female |
| 12:00 AM to 4:59 AM | 397 (8.2%) | 175 (4.0%) |
| 5:00 AM to 5:29 AM | 168 (3.5%) | 130 (2.9%) |
| 5:30 AM to 5:59 AM | 227 (4.7%) | 78 (1.8%) |
| 6:00 AM to 6:29 AM | 518 (10.6%) | 186 (4.2%) |
| 6:30 AM to 6:59 AM | 517 (10.6%) | 352 (7.9%) |
| 7:00 AM to 7:29 AM | 675 (13.9%) | 689 (15.5%) |
| 7:30 AM to 7:59 AM | 648 (13.3%) | 957 (21.6%) |
| 8:00 AM to 8:29 AM | 562 (11.5%) | 370 (8.3%) |
| 8:30 AM to 8:59 AM | 259 (5.3%) | 143 (3.2%) |
| 9:00 AM to 9:59 AM | 392 (8.1%) | 395 (8.9%) |
| 10:00 AM to 10:59 AM | 214 (4.4%) | 249 (5.6%) |
| 11:00 AM to 11:59 AM | 0 (0.0%) | 19 (0.4%) |
| 12:00 PM to 3:59 PM | 201 (4.1%) | 574 (12.9%) |
| 4:00 PM to 11:59 PM | 93 (1.9%) | 118 (2.7%) |
| Total | 4,871 (100.0%) | 4,435 (100.0%) |
Housing Occupancy in Kailua CDP Hawaii County
Occupancy by Ownership in Kailua CDP Hawaii County
Of the total 7,443 dwellings in Kailua CDP Hawaii County, owner-occupied units account for 4,887 (65.7%), while renter-occupied units make up 2,556 (34.3%).
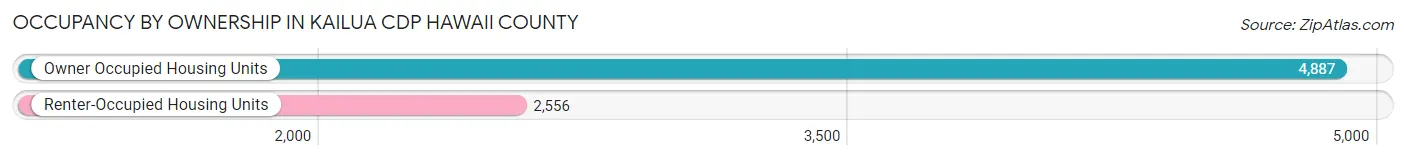
| Occupancy | # Housing Units | % Housing Units |
| Owner Occupied Housing Units | 4,887 | 65.7% |
| Renter-Occupied Housing Units | 2,556 | 34.3% |
| Total Occupied Housing Units | 7,443 | 100.0% |
Occupancy by Household Size in Kailua CDP Hawaii County
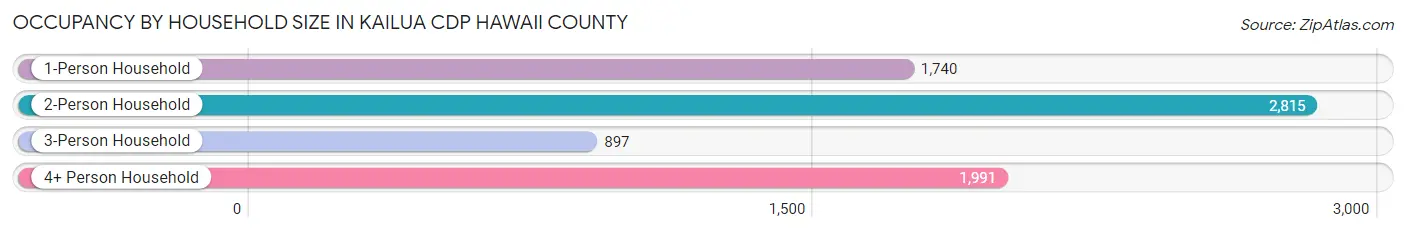
| Household Size | # Housing Units | % Housing Units |
| 1-Person Household | 1,740 | 23.4% |
| 2-Person Household | 2,815 | 37.8% |
| 3-Person Household | 897 | 12.0% |
| 4+ Person Household | 1,991 | 26.8% |
| Total Housing Units | 7,443 | 100.0% |
Occupancy by Ownership by Household Size in Kailua CDP Hawaii County
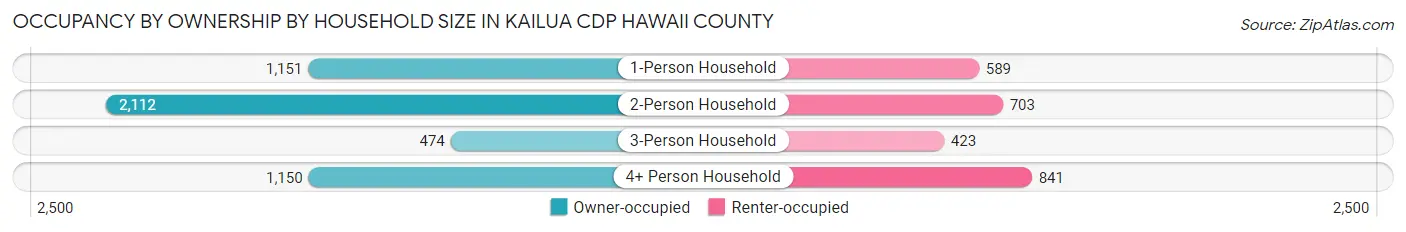
| Household Size | Owner-occupied | Renter-occupied |
| 1-Person Household | 1,151 (66.1%) | 589 (33.9%) |
| 2-Person Household | 2,112 (75.0%) | 703 (25.0%) |
| 3-Person Household | 474 (52.8%) | 423 (47.2%) |
| 4+ Person Household | 1,150 (57.8%) | 841 (42.2%) |
| Total Housing Units | 4,887 (65.7%) | 2,556 (34.3%) |
Occupancy by Educational Attainment in Kailua CDP Hawaii County
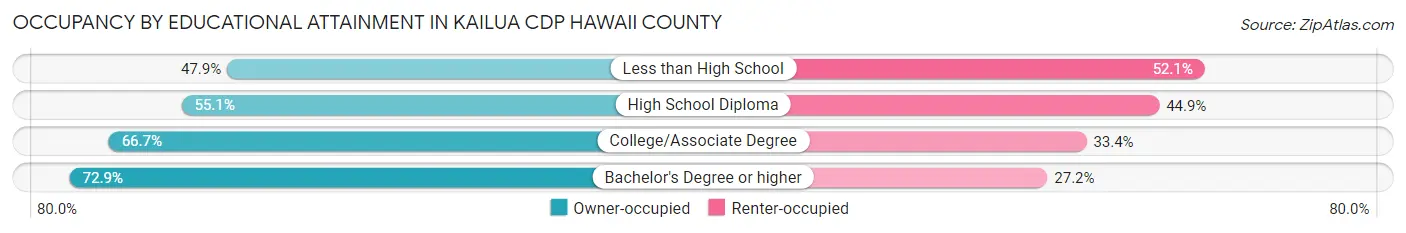
| Household Size | Owner-occupied | Renter-occupied |
| Less than High School | 216 (47.9%) | 235 (52.1%) |
| High School Diploma | 836 (55.1%) | 681 (44.9%) |
| College/Associate Degree | 1,653 (66.6%) | 827 (33.4%) |
| Bachelor's Degree or higher | 2,182 (72.9%) | 813 (27.2%) |
Occupancy by Age of Householder in Kailua CDP Hawaii County
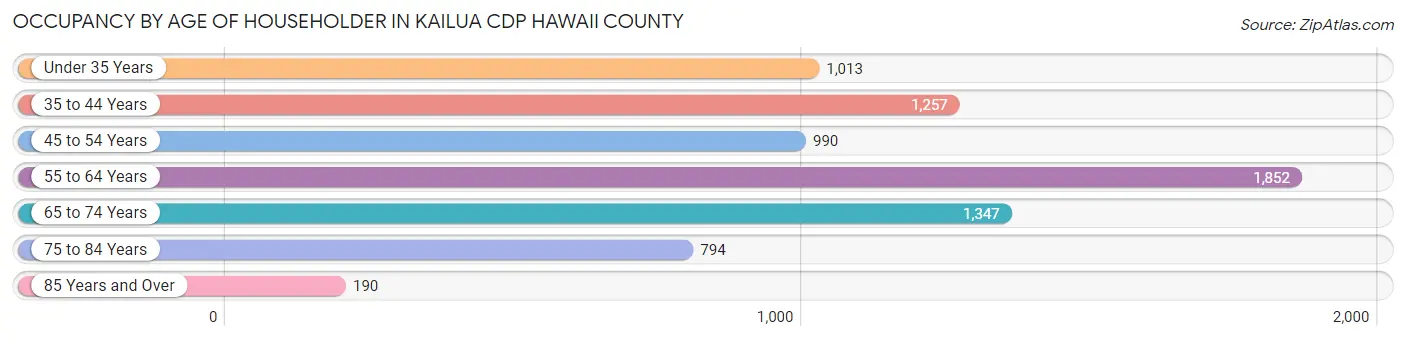
| Age Bracket | # Households | % Households |
| Under 35 Years | 1,013 | 13.6% |
| 35 to 44 Years | 1,257 | 16.9% |
| 45 to 54 Years | 990 | 13.3% |
| 55 to 64 Years | 1,852 | 24.9% |
| 65 to 74 Years | 1,347 | 18.1% |
| 75 to 84 Years | 794 | 10.7% |
| 85 Years and Over | 190 | 2.5% |
| Total | 7,443 | 100.0% |
Housing Finances in Kailua CDP Hawaii County
Median Income by Occupancy in Kailua CDP Hawaii County
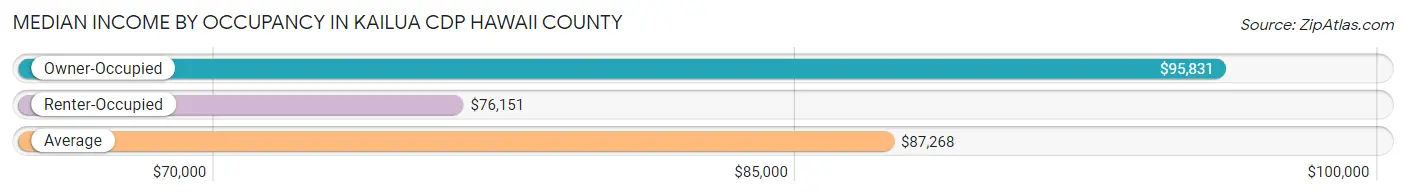
| Occupancy Type | # Households | Median Income |
| Owner-Occupied | 4,887 (65.7%) | $95,831 |
| Renter-Occupied | 2,556 (34.3%) | $76,151 |
| Average | 7,443 (100.0%) | $87,268 |
Occupancy by Householder Income Bracket in Kailua CDP Hawaii County
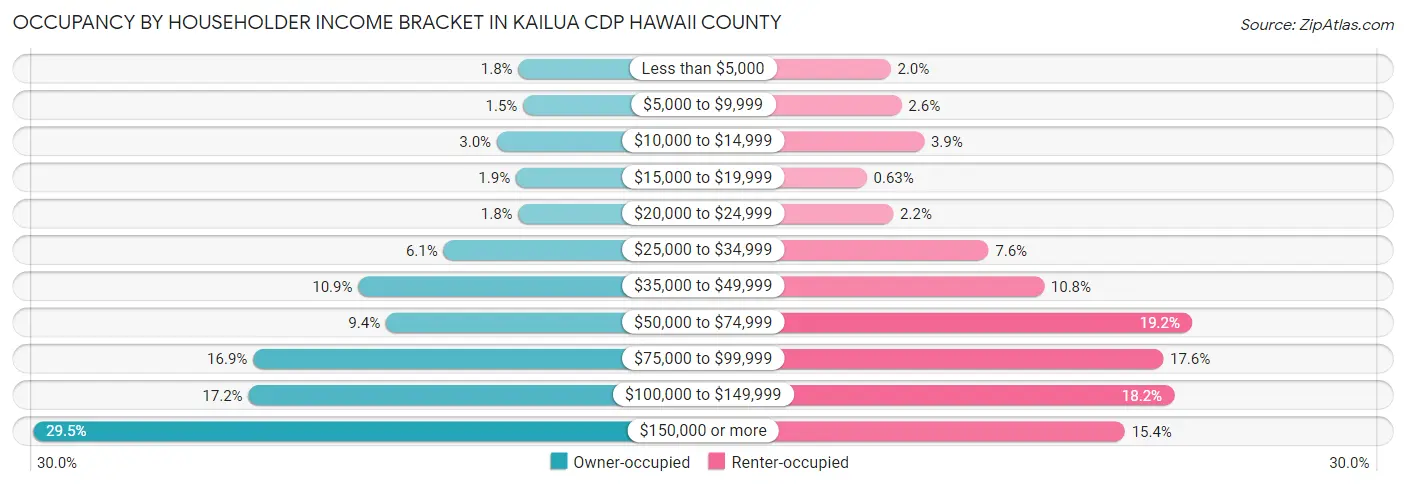
| Income Bracket | Owner-occupied | Renter-occupied |
| Less than $5,000 | 87 (1.8%) | 51 (2.0%) |
| $5,000 to $9,999 | 74 (1.5%) | 67 (2.6%) |
| $10,000 to $14,999 | 147 (3.0%) | 100 (3.9%) |
| $15,000 to $19,999 | 94 (1.9%) | 16 (0.6%) |
| $20,000 to $24,999 | 87 (1.8%) | 55 (2.1%) |
| $25,000 to $34,999 | 296 (6.1%) | 194 (7.6%) |
| $35,000 to $49,999 | 534 (10.9%) | 275 (10.8%) |
| $50,000 to $74,999 | 457 (9.3%) | 491 (19.2%) |
| $75,000 to $99,999 | 828 (16.9%) | 449 (17.6%) |
| $100,000 to $149,999 | 841 (17.2%) | 465 (18.2%) |
| $150,000 or more | 1,442 (29.5%) | 393 (15.4%) |
| Total | 4,887 (100.0%) | 2,556 (100.0%) |
Monthly Housing Cost Tiers in Kailua CDP Hawaii County
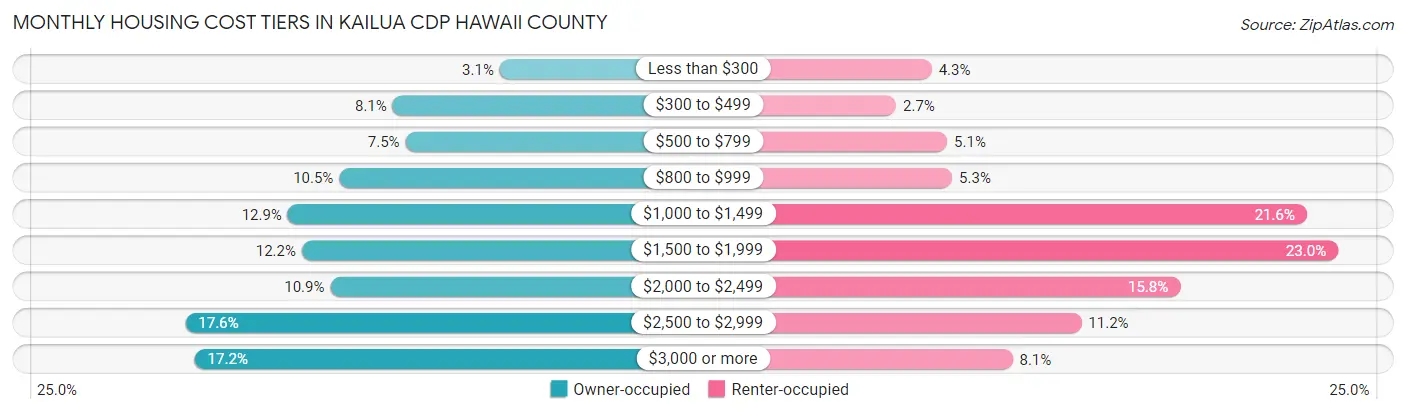
| Monthly Cost | Owner-occupied | Renter-occupied |
| Less than $300 | 153 (3.1%) | 111 (4.3%) |
| $300 to $499 | 394 (8.1%) | 69 (2.7%) |
| $500 to $799 | 365 (7.5%) | 129 (5.1%) |
| $800 to $999 | 514 (10.5%) | 135 (5.3%) |
| $1,000 to $1,499 | 630 (12.9%) | 552 (21.6%) |
| $1,500 to $1,999 | 598 (12.2%) | 589 (23.0%) |
| $2,000 to $2,499 | 534 (10.9%) | 403 (15.8%) |
| $2,500 to $2,999 | 860 (17.6%) | 287 (11.2%) |
| $3,000 or more | 839 (17.2%) | 206 (8.1%) |
| Total | 4,887 (100.0%) | 2,556 (100.0%) |
Physical Housing Characteristics in Kailua CDP Hawaii County
Housing Structures in Kailua CDP Hawaii County
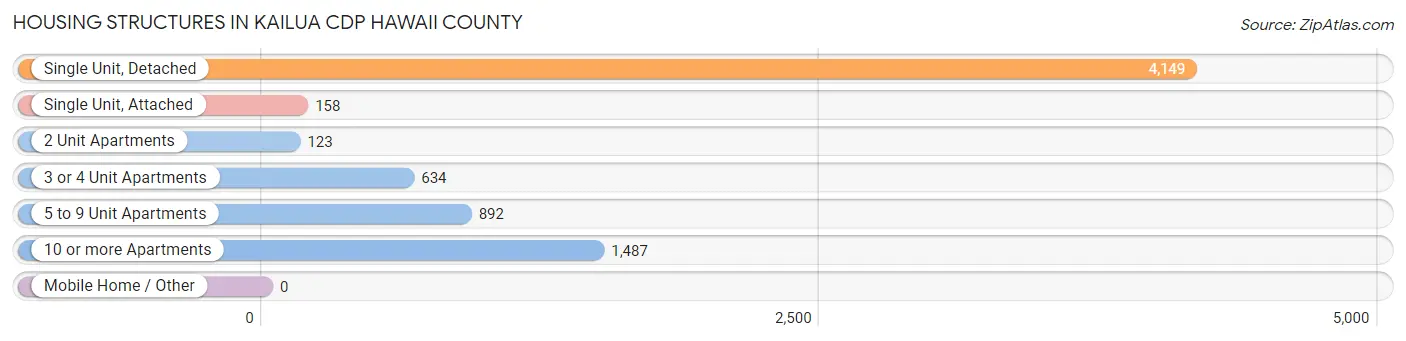
| Structure Type | # Housing Units | % Housing Units |
| Single Unit, Detached | 4,149 | 55.7% |
| Single Unit, Attached | 158 | 2.1% |
| 2 Unit Apartments | 123 | 1.7% |
| 3 or 4 Unit Apartments | 634 | 8.5% |
| 5 to 9 Unit Apartments | 892 | 12.0% |
| 10 or more Apartments | 1,487 | 20.0% |
| Mobile Home / Other | 0 | 0.0% |
| Total | 7,443 | 100.0% |
Housing Structures by Occupancy in Kailua CDP Hawaii County
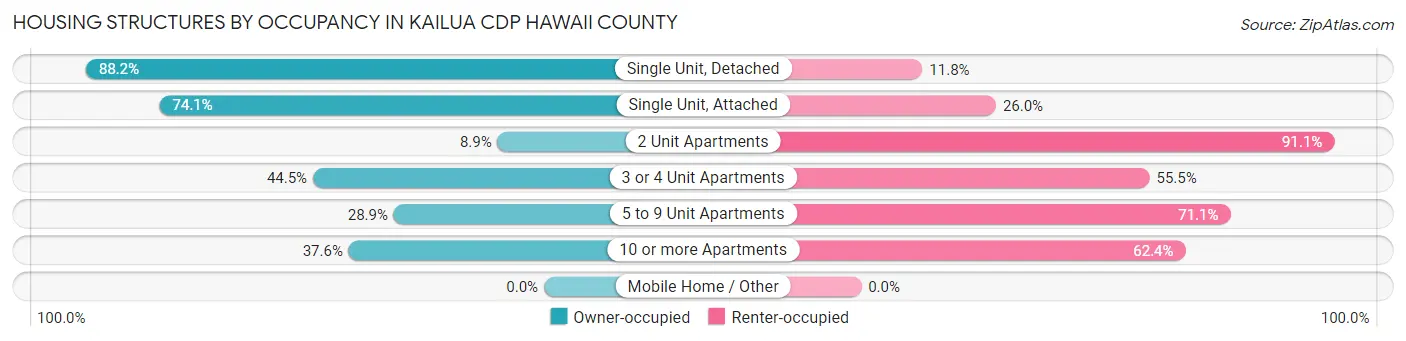
| Structure Type | Owner-occupied | Renter-occupied |
| Single Unit, Detached | 3,660 (88.2%) | 489 (11.8%) |
| Single Unit, Attached | 117 (74.1%) | 41 (26.0%) |
| 2 Unit Apartments | 11 (8.9%) | 112 (91.1%) |
| 3 or 4 Unit Apartments | 282 (44.5%) | 352 (55.5%) |
| 5 to 9 Unit Apartments | 258 (28.9%) | 634 (71.1%) |
| 10 or more Apartments | 559 (37.6%) | 928 (62.4%) |
| Mobile Home / Other | 0 (0.0%) | 0 (0.0%) |
| Total | 4,887 (65.7%) | 2,556 (34.3%) |
Housing Structures by Number of Rooms in Kailua CDP Hawaii County
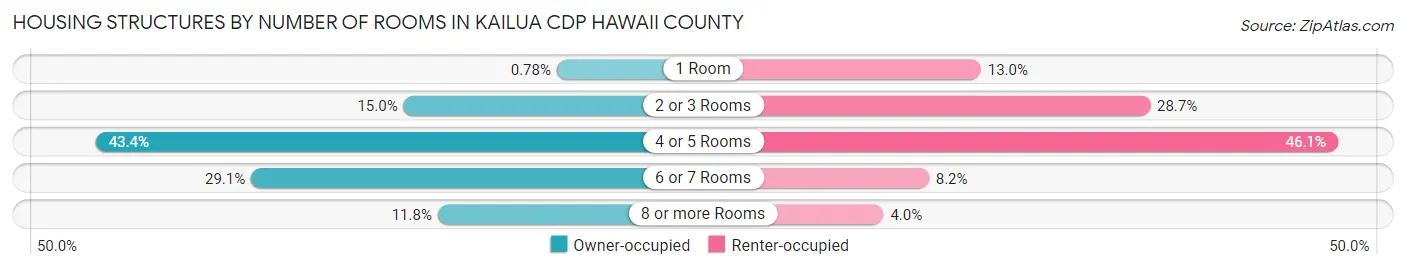
| Number of Rooms | Owner-occupied | Renter-occupied |
| 1 Room | 38 (0.8%) | 333 (13.0%) |
| 2 or 3 Rooms | 731 (15.0%) | 733 (28.7%) |
| 4 or 5 Rooms | 2,122 (43.4%) | 1,177 (46.1%) |
| 6 or 7 Rooms | 1,420 (29.1%) | 210 (8.2%) |
| 8 or more Rooms | 576 (11.8%) | 103 (4.0%) |
| Total | 4,887 (100.0%) | 2,556 (100.0%) |
Housing Structure by Heating Type in Kailua CDP Hawaii County
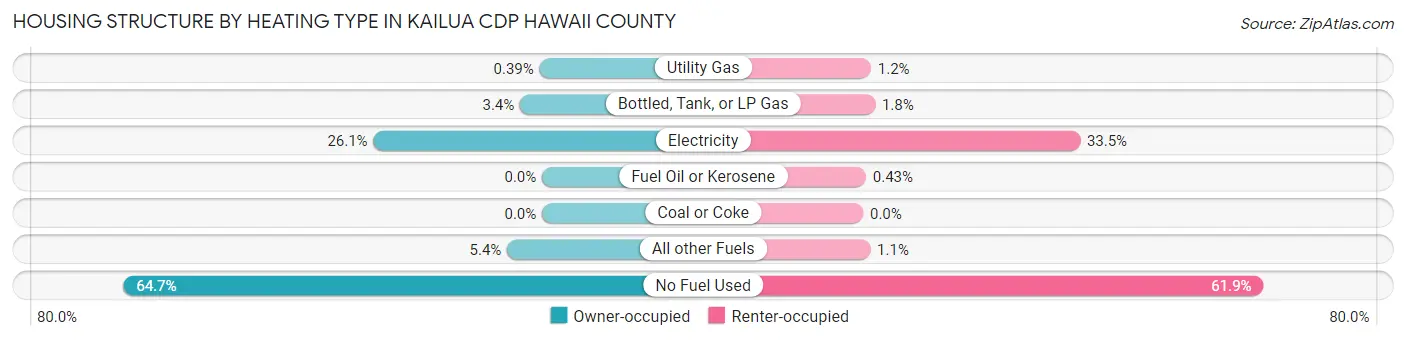
| Heating Type | Owner-occupied | Renter-occupied |
| Utility Gas | 19 (0.4%) | 31 (1.2%) |
| Bottled, Tank, or LP Gas | 166 (3.4%) | 47 (1.8%) |
| Electricity | 1,274 (26.1%) | 857 (33.5%) |
| Fuel Oil or Kerosene | 0 (0.0%) | 11 (0.4%) |
| Coal or Coke | 0 (0.0%) | 0 (0.0%) |
| All other Fuels | 264 (5.4%) | 28 (1.1%) |
| No Fuel Used | 3,164 (64.7%) | 1,582 (61.9%) |
| Total | 4,887 (100.0%) | 2,556 (100.0%) |
Household Vehicle Usage in Kailua CDP Hawaii County
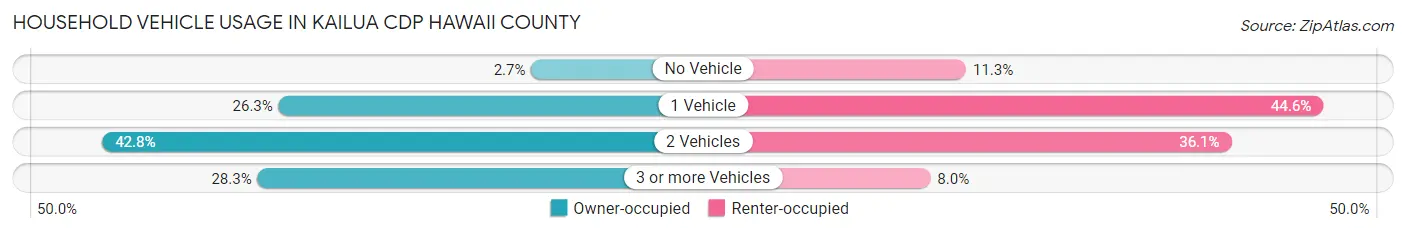
| Vehicles per Household | Owner-occupied | Renter-occupied |
| No Vehicle | 132 (2.7%) | 289 (11.3%) |
| 1 Vehicle | 1,285 (26.3%) | 1,141 (44.6%) |
| 2 Vehicles | 2,089 (42.7%) | 922 (36.1%) |
| 3 or more Vehicles | 1,381 (28.3%) | 204 (8.0%) |
| Total | 4,887 (100.0%) | 2,556 (100.0%) |
Real Estate & Mortgages in Kailua CDP Hawaii County
Real Estate and Mortgage Overview in Kailua CDP Hawaii County
| Characteristic | Without Mortgage | With Mortgage |
| Housing Units | 1,706 | 3,181 |
| Median Property Value | $611,200 | $621,900 |
| Median Household Income | $86,818 | $1,033 |
| Monthly Housing Costs | $768 | $839 |
| Real Estate Taxes | $2,259 | $253 |
Property Value by Mortgage Status in Kailua CDP Hawaii County
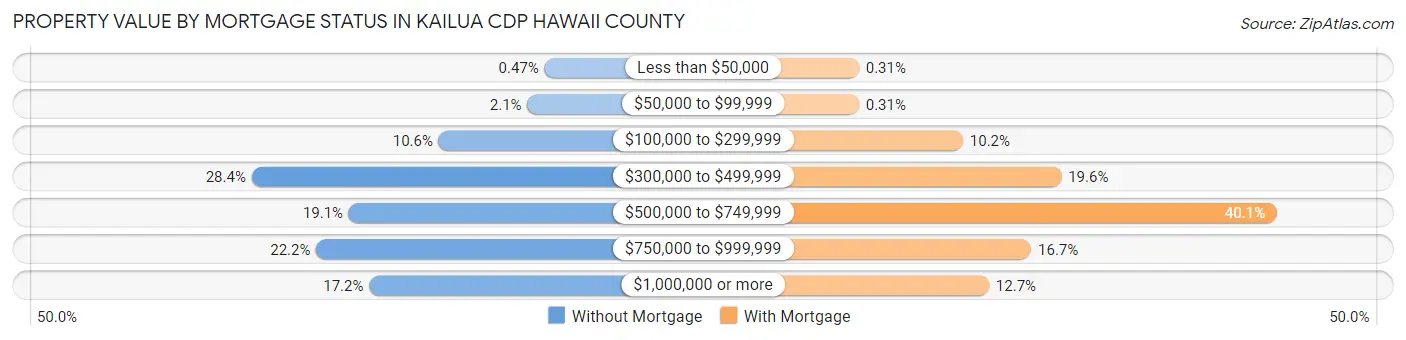
| Property Value | Without Mortgage | With Mortgage |
| Less than $50,000 | 8 (0.5%) | 10 (0.3%) |
| $50,000 to $99,999 | 36 (2.1%) | 10 (0.3%) |
| $100,000 to $299,999 | 180 (10.5%) | 325 (10.2%) |
| $300,000 to $499,999 | 484 (28.4%) | 623 (19.6%) |
| $500,000 to $749,999 | 326 (19.1%) | 1,277 (40.1%) |
| $750,000 to $999,999 | 379 (22.2%) | 532 (16.7%) |
| $1,000,000 or more | 293 (17.2%) | 404 (12.7%) |
| Total | 1,706 (100.0%) | 3,181 (100.0%) |
Household Income by Mortgage Status in Kailua CDP Hawaii County
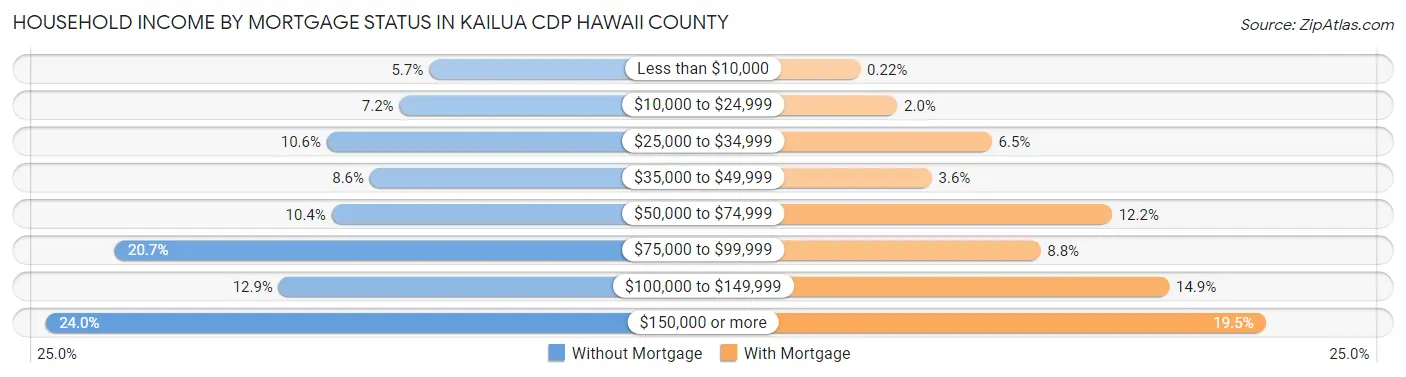
| Household Income | Without Mortgage | With Mortgage |
| Less than $10,000 | 98 (5.7%) | 7 (0.2%) |
| $10,000 to $24,999 | 122 (7.1%) | 63 (2.0%) |
| $25,000 to $34,999 | 181 (10.6%) | 206 (6.5%) |
| $35,000 to $49,999 | 146 (8.6%) | 115 (3.6%) |
| $50,000 to $74,999 | 177 (10.4%) | 388 (12.2%) |
| $75,000 to $99,999 | 353 (20.7%) | 280 (8.8%) |
| $100,000 to $149,999 | 220 (12.9%) | 475 (14.9%) |
| $150,000 or more | 409 (24.0%) | 621 (19.5%) |
| Total | 1,706 (100.0%) | 3,181 (100.0%) |
Property Value to Household Income Ratio in Kailua CDP Hawaii County
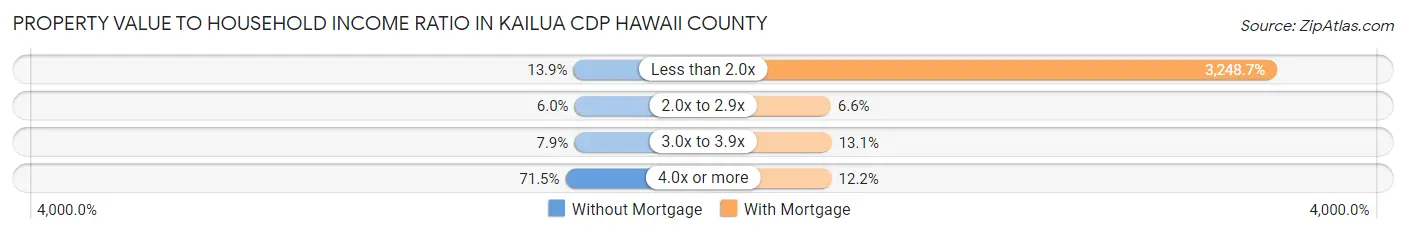
| Value-to-Income Ratio | Without Mortgage | With Mortgage |
| Less than 2.0x | 237 (13.9%) | 103,341 (3,248.7%) |
| 2.0x to 2.9x | 102 (6.0%) | 211 (6.6%) |
| 3.0x to 3.9x | 135 (7.9%) | 417 (13.1%) |
| 4.0x or more | 1,220 (71.5%) | 389 (12.2%) |
| Total | 1,706 (100.0%) | 3,181 (100.0%) |
Real Estate Taxes by Mortgage Status in Kailua CDP Hawaii County
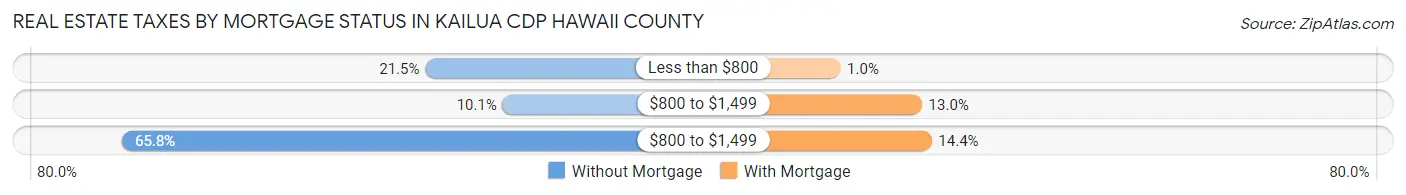
| Property Taxes | Without Mortgage | With Mortgage |
| Less than $800 | 366 (21.4%) | 33 (1.0%) |
| $800 to $1,499 | 173 (10.1%) | 412 (13.0%) |
| $800 to $1,499 | 1,122 (65.8%) | 457 (14.4%) |
| Total | 1,706 (100.0%) | 3,181 (100.0%) |
Health & Disability in Kailua CDP Hawaii County
Health Insurance Coverage by Age in Kailua CDP Hawaii County
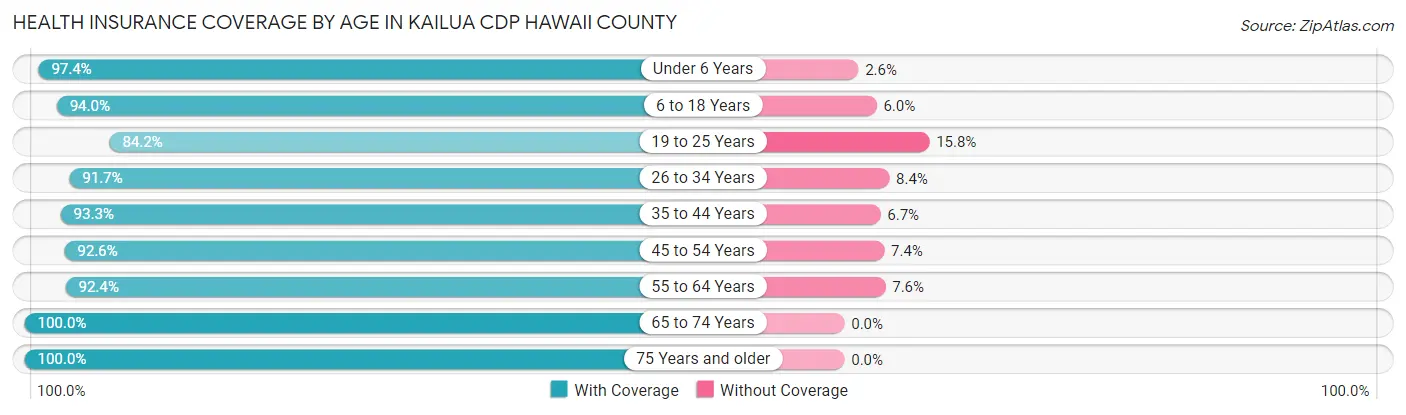
| Age Bracket | With Coverage | Without Coverage |
| Under 6 Years | 1,540 (97.4%) | 41 (2.6%) |
| 6 to 18 Years | 2,789 (94.0%) | 178 (6.0%) |
| 19 to 25 Years | 1,468 (84.2%) | 276 (15.8%) |
| 26 to 34 Years | 2,414 (91.6%) | 220 (8.4%) |
| 35 to 44 Years | 2,245 (93.3%) | 162 (6.7%) |
| 45 to 54 Years | 2,334 (92.6%) | 187 (7.4%) |
| 55 to 64 Years | 3,227 (92.4%) | 267 (7.6%) |
| 65 to 74 Years | 2,548 (100.0%) | 0 (0.0%) |
| 75 Years and older | 1,543 (100.0%) | 0 (0.0%) |
| Total | 20,108 (93.8%) | 1,331 (6.2%) |
Health Insurance Coverage by Citizenship Status in Kailua CDP Hawaii County
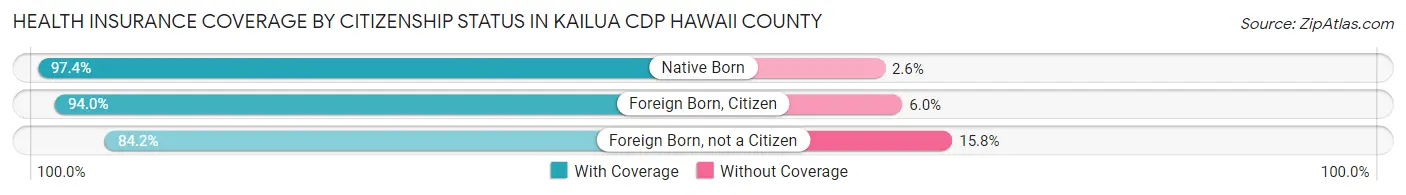
| Citizenship Status | With Coverage | Without Coverage |
| Native Born | 1,540 (97.4%) | 41 (2.6%) |
| Foreign Born, Citizen | 2,789 (94.0%) | 178 (6.0%) |
| Foreign Born, not a Citizen | 1,468 (84.2%) | 276 (15.8%) |
Health Insurance Coverage by Household Income in Kailua CDP Hawaii County
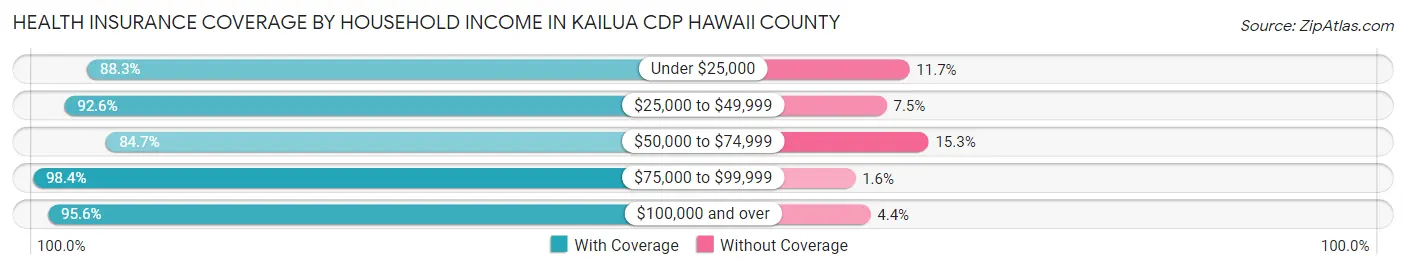
| Household Income | With Coverage | Without Coverage |
| Under $25,000 | 1,182 (88.3%) | 157 (11.7%) |
| $25,000 to $49,999 | 2,857 (92.5%) | 230 (7.4%) |
| $50,000 to $74,999 | 2,242 (84.7%) | 405 (15.3%) |
| $75,000 to $99,999 | 3,431 (98.4%) | 55 (1.6%) |
| $100,000 and over | 10,129 (95.6%) | 468 (4.4%) |
Public vs Private Health Insurance Coverage by Age in Kailua CDP Hawaii County
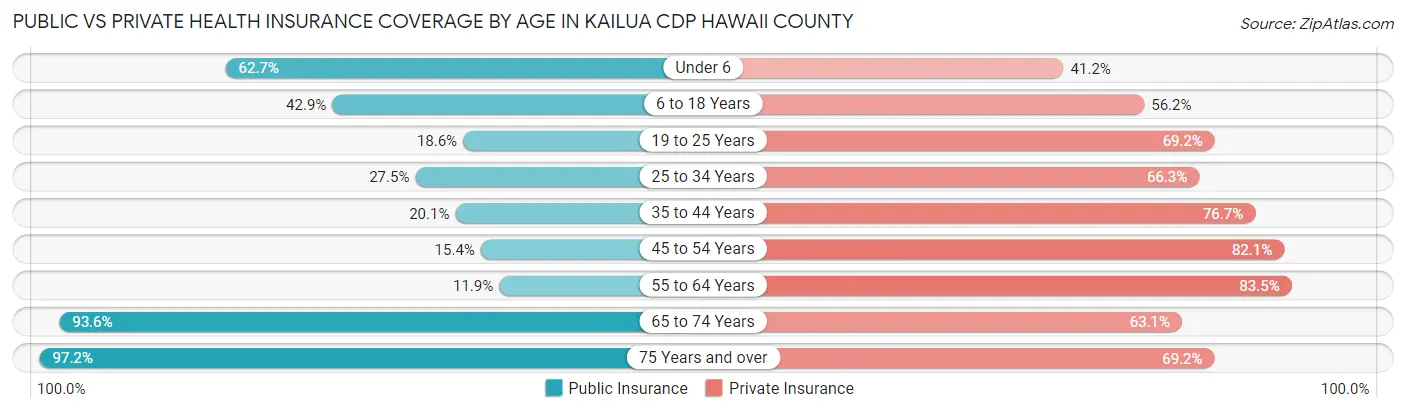
| Age Bracket | Public Insurance | Private Insurance |
| Under 6 | 991 (62.7%) | 651 (41.2%) |
| 6 to 18 Years | 1,273 (42.9%) | 1,666 (56.1%) |
| 19 to 25 Years | 325 (18.6%) | 1,207 (69.2%) |
| 25 to 34 Years | 724 (27.5%) | 1,747 (66.3%) |
| 35 to 44 Years | 483 (20.1%) | 1,846 (76.7%) |
| 45 to 54 Years | 387 (15.3%) | 2,069 (82.1%) |
| 55 to 64 Years | 417 (11.9%) | 2,916 (83.5%) |
| 65 to 74 Years | 2,384 (93.6%) | 1,608 (63.1%) |
| 75 Years and over | 1,500 (97.2%) | 1,067 (69.2%) |
| Total | 8,484 (39.6%) | 14,777 (68.9%) |
Disability Status by Sex by Age in Kailua CDP Hawaii County
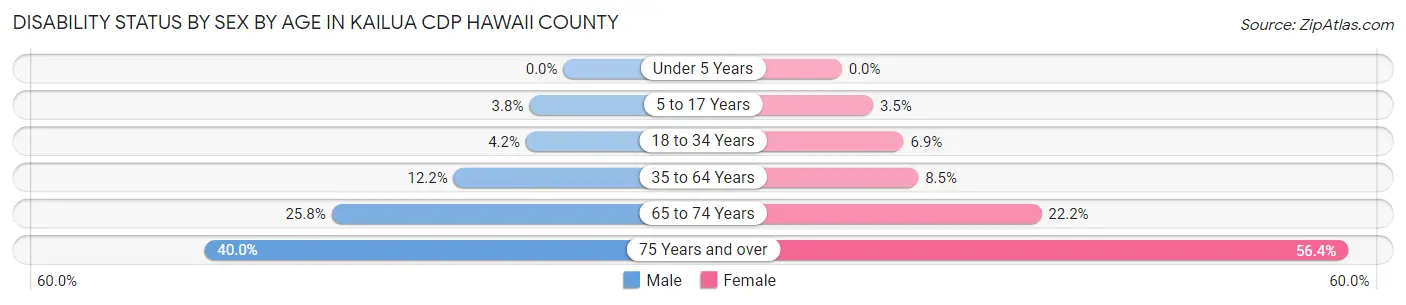
| Age Bracket | Male | Female |
| Under 5 Years | 0 (0.0%) | 0 (0.0%) |
| 5 to 17 Years | 67 (3.8%) | 47 (3.5%) |
| 18 to 34 Years | 106 (4.2%) | 139 (6.9%) |
| 35 to 64 Years | 507 (12.2%) | 364 (8.5%) |
| 65 to 74 Years | 364 (25.8%) | 253 (22.2%) |
| 75 Years and over | 231 (40.0%) | 544 (56.4%) |
Disability Class by Sex by Age in Kailua CDP Hawaii County
Disability Class: Hearing Difficulty
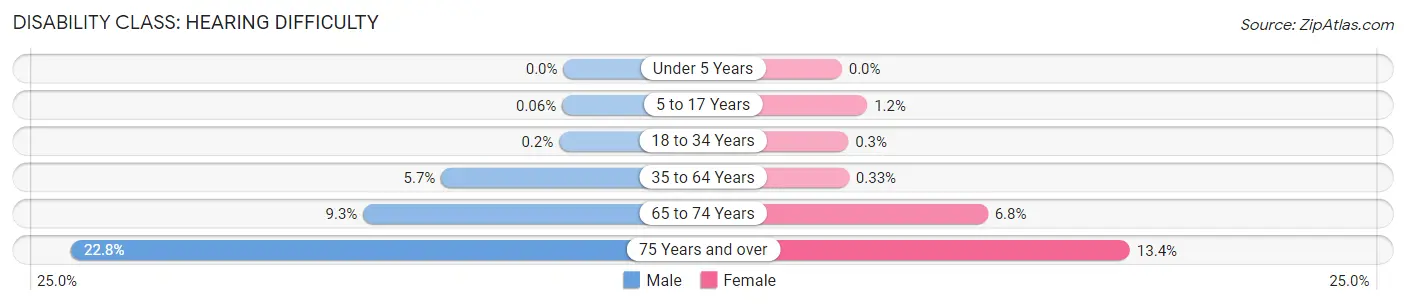
| Age Bracket | Male | Female |
| Under 5 Years | 0 (0.0%) | 0 (0.0%) |
| 5 to 17 Years | 1 (0.1%) | 16 (1.2%) |
| 18 to 34 Years | 5 (0.2%) | 6 (0.3%) |
| 35 to 64 Years | 235 (5.7%) | 14 (0.3%) |
| 65 to 74 Years | 131 (9.3%) | 77 (6.8%) |
| 75 Years and over | 132 (22.8%) | 129 (13.4%) |
Disability Class: Vision Difficulty
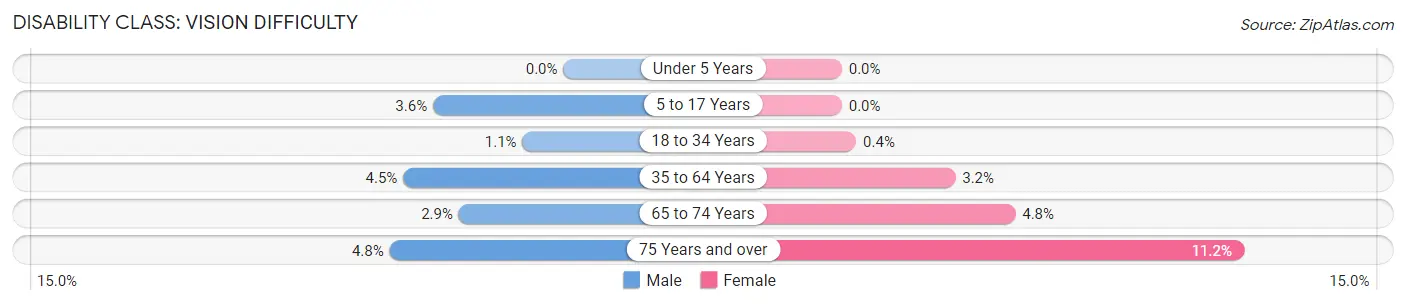
| Age Bracket | Male | Female |
| Under 5 Years | 0 (0.0%) | 0 (0.0%) |
| 5 to 17 Years | 64 (3.6%) | 0 (0.0%) |
| 18 to 34 Years | 29 (1.1%) | 8 (0.4%) |
| 35 to 64 Years | 185 (4.5%) | 135 (3.2%) |
| 65 to 74 Years | 41 (2.9%) | 55 (4.8%) |
| 75 Years and over | 28 (4.8%) | 108 (11.2%) |
Disability Class: Cognitive Difficulty
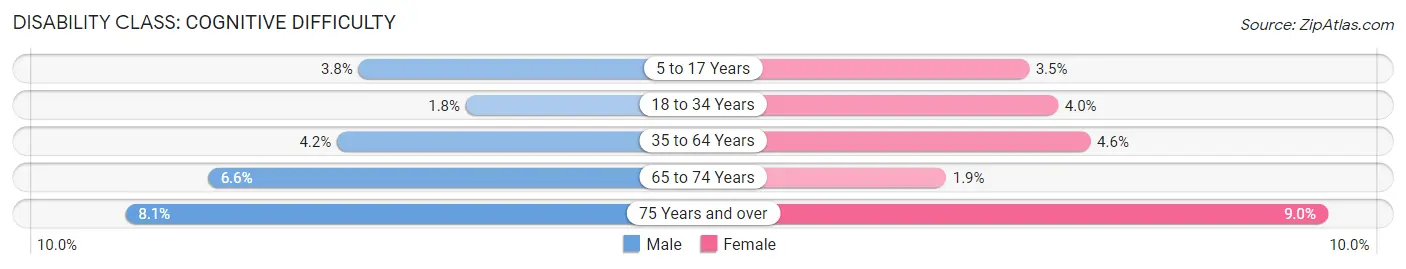
| Age Bracket | Male | Female |
| 5 to 17 Years | 67 (3.8%) | 47 (3.5%) |
| 18 to 34 Years | 46 (1.8%) | 81 (4.0%) |
| 35 to 64 Years | 174 (4.2%) | 197 (4.6%) |
| 65 to 74 Years | 93 (6.6%) | 22 (1.9%) |
| 75 Years and over | 47 (8.1%) | 87 (9.0%) |
Disability Class: Ambulatory Difficulty
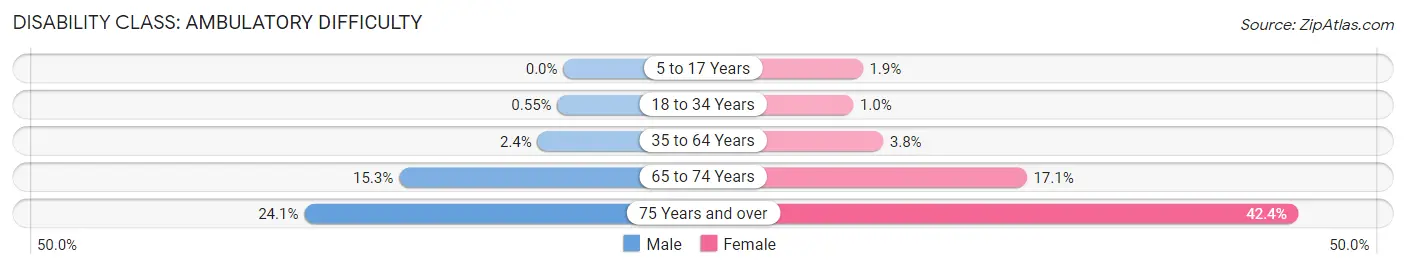
| Age Bracket | Male | Female |
| 5 to 17 Years | 0 (0.0%) | 26 (1.9%) |
| 18 to 34 Years | 14 (0.5%) | 21 (1.0%) |
| 35 to 64 Years | 99 (2.4%) | 163 (3.8%) |
| 65 to 74 Years | 215 (15.2%) | 195 (17.1%) |
| 75 Years and over | 139 (24.0%) | 409 (42.4%) |
Disability Class: Self-Care Difficulty
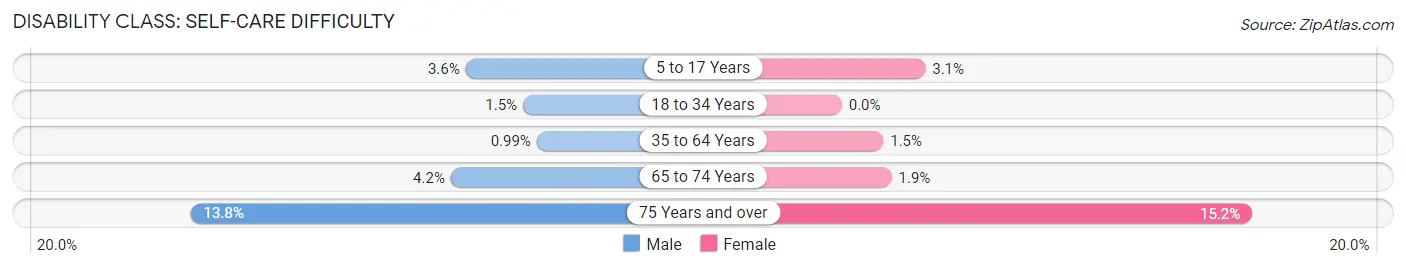
| Age Bracket | Male | Female |
| 5 to 17 Years | 64 (3.6%) | 42 (3.1%) |
| 18 to 34 Years | 38 (1.5%) | 0 (0.0%) |
| 35 to 64 Years | 41 (1.0%) | 66 (1.5%) |
| 65 to 74 Years | 59 (4.2%) | 21 (1.8%) |
| 75 Years and over | 80 (13.8%) | 147 (15.2%) |
Technology Access in Kailua CDP Hawaii County
Computing Device Access in Kailua CDP Hawaii County
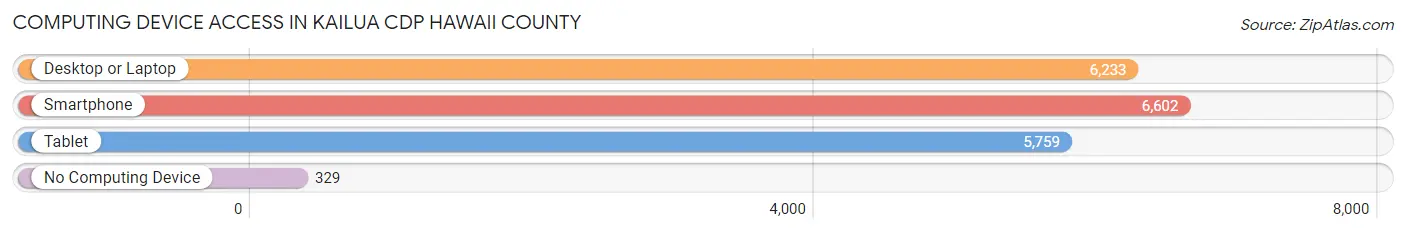
| Device Type | # Households | % Households |
| Desktop or Laptop | 6,233 | 83.7% |
| Smartphone | 6,602 | 88.7% |
| Tablet | 5,759 | 77.4% |
| No Computing Device | 329 | 4.4% |
| Total | 7,443 | 100.0% |
Internet Access in Kailua CDP Hawaii County
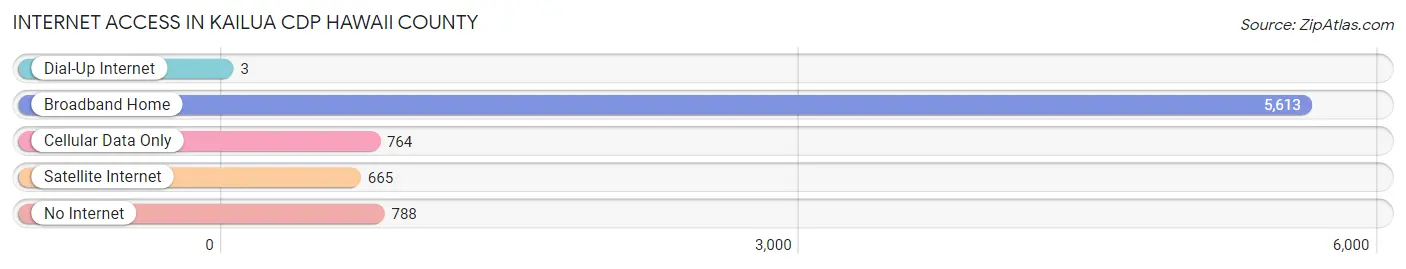
| Internet Type | # Households | % Households |
| Dial-Up Internet | 3 | 0.0% |
| Broadband Home | 5,613 | 75.4% |
| Cellular Data Only | 764 | 10.3% |
| Satellite Internet | 665 | 8.9% |
| No Internet | 788 | 10.6% |
| Total | 7,443 | 100.0% |
Kailua CDP Hawaii County Summary
Kailua Cdp Hawaii County, HI is a census-designated place (CDP) located in Hawaii County, Hawaii, United States. The population was 11,975 at the 2010 census. Kailua Cdp is located on the eastern side of the island of Hawaii, about 12 miles (19 km) north of Hilo.
History
Kailua Cdp was originally settled by Polynesian voyagers in the 13th century. The area was later inhabited by Native Hawaiians, who established a fishing village in the area. The first Europeans to visit the area were Captain James Cook and his crew in 1779. They named the area Kailua, which means “two seas” in Hawaiian.
In the late 19th century, Kailua Cdp became a popular destination for tourists and vacationers. The area was also home to a number of sugar plantations, which provided employment for many of the local residents.
In the early 20th century, Kailua Cdp became a popular destination for surfers. The area is now home to several world-class surfing spots, including Kailua Beach and Lanikai Beach.
Geography
Kailua Cdp is located at 19°39'25"N 155°4'25"W (19.656944, -155.073611). The CDP has a total area of 8.2 square miles (21.2 km2), of which 8.1 square miles (21.0 km2) is land and 0.1 square miles (0.2 km2) (1.25%) is water.
The CDP is located on the eastern side of the island of Hawaii, about 12 miles (19 km) north of Hilo. The terrain is mostly flat, with some hills in the northern part of the CDP. The climate is tropical, with temperatures ranging from the mid-70s to the mid-80s Fahrenheit (21-29 Celsius).
Economy
Kailua Cdp is a popular tourist destination, with many visitors coming to enjoy the beaches, surfing, and other outdoor activities. The area is also home to several resorts and hotels, as well as restaurants and shops.
The economy of Kailua Cdp is also supported by agriculture, with the area being home to several farms and ranches. The area is also home to several industrial and manufacturing businesses.
Demographics
As of the 2010 census, there were 11,975 people, 4,845 households, and 3,072 families residing in the CDP. The population density was 1,467.3 people per square mile (566.7/km2). There were 5,541 housing units at an average density of 681.3 per square mile (263.3/km2). The racial makeup of the CDP was 61.2% White, 0.7% African American, 0.3% Native American, 15.2% Asian, 0.2% Pacific Islander, 0.7% from other races, and 2.0% from two or more races. Hispanic or Latino of any race were 8.2% of the population.
There were 4,845 households, out of which 28.2% had children under the age of 18 living with them, 48.2% were married couples living together, 11.7% had a female householder with no husband present, and 34.7% were non-families. 25.7% of all households were made up of individuals, and 8.2% had someone living alone who was 65 years of age or older. The average household size was 2.45 and the average family size was 2.94.
In the CDP, the population was spread out, with 22.2% under the age of 18, 8.2% from 18 to 24, 25.7% from 25 to 44, 28.2% from 45 to 64, and 15.7% who were 65 years of age or older. The median age was 40 years. For every 100 females, there were 97.2 males. For every 100 females age 18 and over, there were 95.2 males.
The median income for a household in the CDP was $50,945, and the median income for a family was $60,945. Males had a median income of $41,945 versus $30,945 for females. The per capita income for the CDP was $25,945. About 6.2% of families and 8.2% of the population were below the poverty line, including 10.2% of those under age 18 and 6.2% of those age 65 or over.
Common Questions
What is Per Capita Income in Kailua CDP Hawaii County?
Per Capita income in Kailua CDP Hawaii County is $45,746.
What is the Median Family Income in Kailua CDP Hawaii County?
Median Family Income in Kailua CDP Hawaii County is $91,267.
What is the Median Household income in Kailua CDP Hawaii County?
Median Household Income in Kailua CDP Hawaii County is $87,268.
What is Income or Wage Gap in Kailua CDP Hawaii County?
Income or Wage Gap in Kailua CDP Hawaii County is 21.5%.
Women in Kailua CDP Hawaii County earn 78.5 cents for every dollar earned by a man.
What is Family Income Deficit in Kailua CDP Hawaii County?
Family Income Deficit in Kailua CDP Hawaii County is $11,640.
Families that are below poverty line in Kailua CDP Hawaii County earn $11,640 less on average than the poverty threshold level.
What is Inequality or Gini Index in Kailua CDP Hawaii County?
Inequality or Gini Index in Kailua CDP Hawaii County is 0.50.
What is the Total Population of Kailua CDP Hawaii County?
Total Population of Kailua CDP Hawaii County is 21,449.
What is the Total Male Population of Kailua CDP Hawaii County?
Total Male Population of Kailua CDP Hawaii County is 11,152.
What is the Total Female Population of Kailua CDP Hawaii County?
Total Female Population of Kailua CDP Hawaii County is 10,297.
What is the Ratio of Males per 100 Females in Kailua CDP Hawaii County?
There are 108.30 Males per 100 Females in Kailua CDP Hawaii County.
What is the Ratio of Females per 100 Males in Kailua CDP Hawaii County?
There are 92.33 Females per 100 Males in Kailua CDP Hawaii County.
What is the Median Population Age in Kailua CDP Hawaii County?
Median Population Age in Kailua CDP Hawaii County is 42.4 Years.
What is the Average Family Size in Kailua CDP Hawaii County
Average Family Size in Kailua CDP Hawaii County is 3.3 People.
What is the Average Household Size in Kailua CDP Hawaii County
Average Household Size in Kailua CDP Hawaii County is 2.8 People.
How Large is the Labor Force in Kailua CDP Hawaii County?
There are 11,260 People in the Labor Forcein in Kailua CDP Hawaii County.
What is the Percentage of People in the Labor Force in Kailua CDP Hawaii County?
64.6% of People are in the Labor Force in Kailua CDP Hawaii County.
What is the Unemployment Rate in Kailua CDP Hawaii County?
Unemployment Rate in Kailua CDP Hawaii County is 3.7%.