Hawaii County, HI Map & Demographics
Hawaii County Map
Hawaii County Overview
$37,236
PER CAPITA INCOME
$90,234
AVG FAMILY INCOME
$74,238
AVG HOUSEHOLD INCOME
18.7%
WAGE / INCOME GAP [ % ]
81.3¢/ $1
WAGE / INCOME GAP [ $ ]
$10,915
FAMILY INCOME DEFICIT
0.48
INEQUALITY / GINI INDEX
202,163
TOTAL POPULATION
100,828
MALE POPULATION
101,335
FEMALE POPULATION
99.50
MALES / 100 FEMALES
100.50
FEMALES / 100 MALES
43.3
MEDIAN AGE
3.3
AVG FAMILY SIZE
2.8
AVG HOUSEHOLD SIZE
96,331
LABOR FORCE [ PEOPLE ]
58.8%
PERCENT IN LABOR FORCE
6.5%
UNEMPLOYMENT RATE
Hawaii County Area Codes
Income in Hawaii County
Income Overview in Hawaii County
Per Capita Income in Hawaii County is $37,236, while median incomes of families and households are $90,234 and $74,238 respectively.
| Characteristic | Number | Measure |
| Per Capita Income | 202,163 | $37,236 |
| Median Family Income | 47,959 | $90,234 |
| Mean Family Income | 47,959 | $112,618 |
| Median Household Income | 72,468 | $74,238 |
| Mean Household Income | 72,468 | $100,481 |
| Income Deficit | 47,959 | $10,915 |
| Wage / Income Gap (%) | 202,163 | 18.70% |
| Wage / Income Gap ($) | 202,163 | 81.30¢ per $1 |
| Gini / Inequality Index | 202,163 | 0.48 |
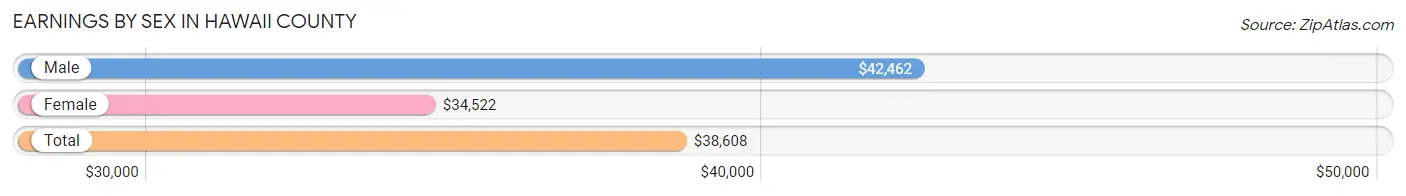
Earnings by Sex in Hawaii County
Average Earnings in Hawaii County are $38,608, $42,462 for men and $34,522 for women, a difference of 18.7%.
| Sex | Number | Average Earnings |
| Male | 51,243 (51.0%) | $42,462 |
| Female | 49,306 (49.0%) | $34,522 |
| Total | 100,549 (100.0%) | $38,608 |
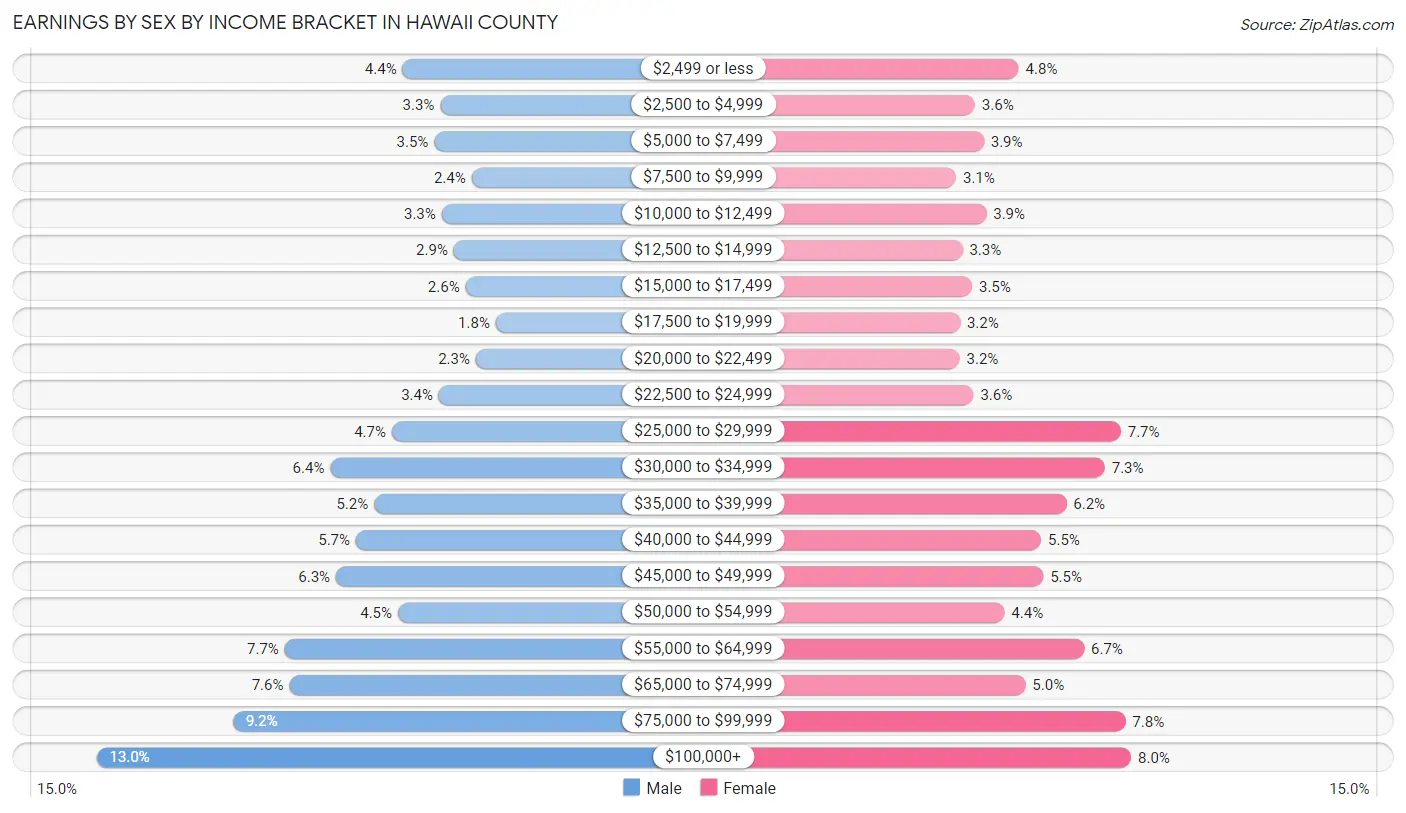
Earnings by Sex by Income Bracket in Hawaii County
The most common earnings brackets in Hawaii County are $100,000+ for men (6,650 | 13.0%) and $100,000+ for women (3,940 | 8.0%).
| Income | Male | Female |
| $2,499 or less | 2,244 (4.4%) | 2,383 (4.8%) |
| $2,500 to $4,999 | 1,700 (3.3%) | 1,777 (3.6%) |
| $5,000 to $7,499 | 1,789 (3.5%) | 1,896 (3.8%) |
| $7,500 to $9,999 | 1,250 (2.4%) | 1,513 (3.1%) |
| $10,000 to $12,499 | 1,679 (3.3%) | 1,931 (3.9%) |
| $12,500 to $14,999 | 1,506 (2.9%) | 1,603 (3.3%) |
| $15,000 to $17,499 | 1,335 (2.6%) | 1,738 (3.5%) |
| $17,500 to $19,999 | 902 (1.8%) | 1,566 (3.2%) |
| $20,000 to $22,499 | 1,191 (2.3%) | 1,562 (3.2%) |
| $22,500 to $24,999 | 1,722 (3.4%) | 1,757 (3.6%) |
| $25,000 to $29,999 | 2,399 (4.7%) | 3,797 (7.7%) |
| $30,000 to $34,999 | 3,287 (6.4%) | 3,575 (7.2%) |
| $35,000 to $39,999 | 2,653 (5.2%) | 3,042 (6.2%) |
| $40,000 to $44,999 | 2,918 (5.7%) | 2,694 (5.5%) |
| $45,000 to $49,999 | 3,205 (6.2%) | 2,723 (5.5%) |
| $50,000 to $54,999 | 2,309 (4.5%) | 2,184 (4.4%) |
| $55,000 to $64,999 | 3,941 (7.7%) | 3,287 (6.7%) |
| $65,000 to $74,999 | 3,874 (7.6%) | 2,477 (5.0%) |
| $75,000 to $99,999 | 4,689 (9.1%) | 3,861 (7.8%) |
| $100,000+ | 6,650 (13.0%) | 3,940 (8.0%) |
| Total | 51,243 (100.0%) | 49,306 (100.0%) |
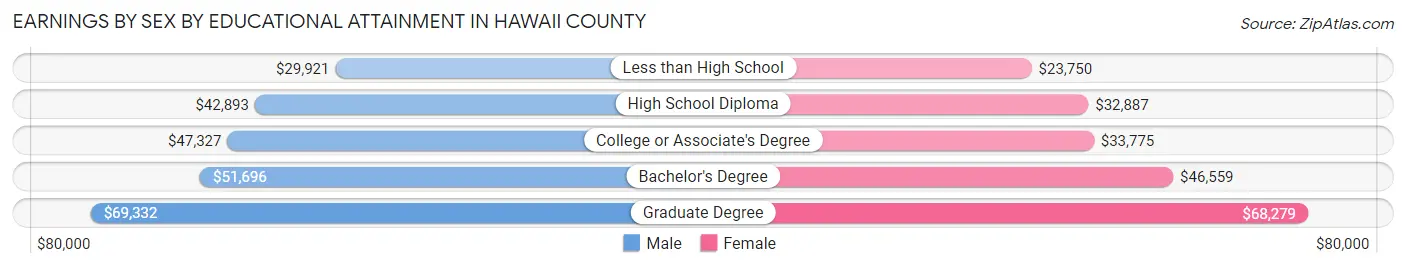
Earnings by Sex by Educational Attainment in Hawaii County
Average earnings in Hawaii County are $46,857 for men and $37,253 for women, a difference of 20.5%. Men with an educational attainment of graduate degree enjoy the highest average annual earnings of $69,332, while those with less than high school education earn the least with $29,921. Women with an educational attainment of graduate degree earn the most with the average annual earnings of $68,279, while those with less than high school education have the smallest earnings of $23,750.
| Educational Attainment | Male Income | Female Income |
| Less than High School | $29,921 | $23,750 |
| High School Diploma | $42,893 | $32,887 |
| College or Associate's Degree | $47,327 | $33,775 |
| Bachelor's Degree | $51,696 | $46,559 |
| Graduate Degree | $69,332 | $68,279 |
| Total | $46,857 | $37,253 |
Family Income in Hawaii County
Family Income Brackets in Hawaii County
According to the Hawaii County family income data, there are 10,407 families falling into the $100,000 to $149,999 income range, which is the most common income bracket and makes up 21.7% of all families. Conversely, the $10,000 to $14,999 income bracket is the least frequent group with only 1,055 families (2.2%) belonging to this category.
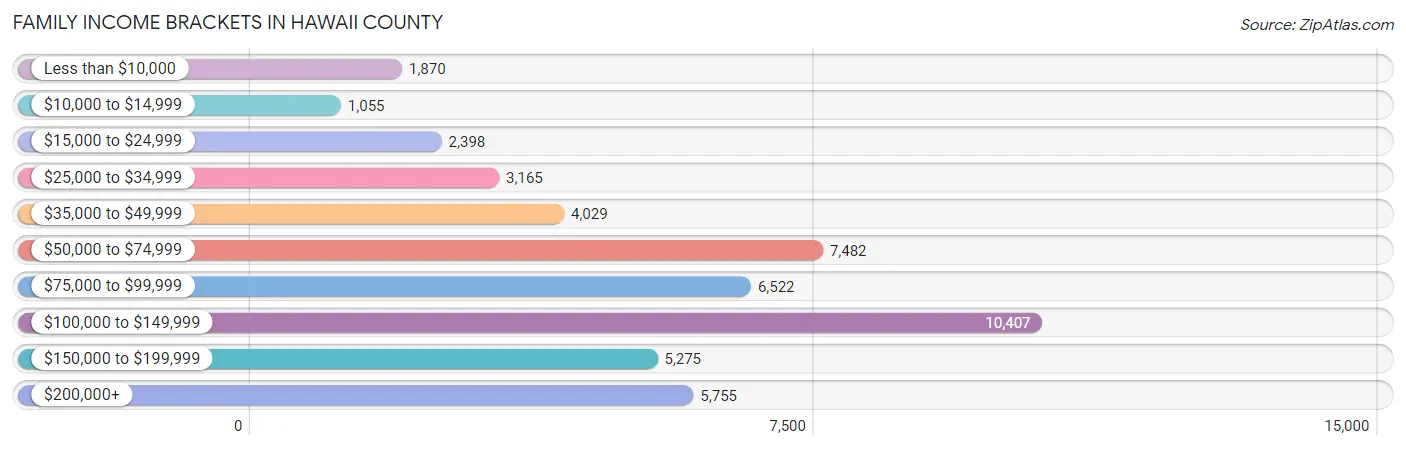
| Income Bracket | # Families | % Families |
| Less than $10,000 | 1,870 | 3.9% |
| $10,000 to $14,999 | 1,055 | 2.2% |
| $15,000 to $24,999 | 2,398 | 5.0% |
| $25,000 to $34,999 | 3,165 | 6.6% |
| $35,000 to $49,999 | 4,029 | 8.4% |
| $50,000 to $74,999 | 7,482 | 15.6% |
| $75,000 to $99,999 | 6,522 | 13.6% |
| $100,000 to $149,999 | 10,407 | 21.7% |
| $150,000 to $199,999 | 5,275 | 11.0% |
| $200,000+ | 5,755 | 12.0% |
Family Income by Famaliy Size in Hawaii County
7+ person families (2,135 | 4.4%) account for the highest median family income in Hawaii County with $165,878 per family, while 2-person families (23,849 | 49.7%) have the highest median income of $40,216 per family member.
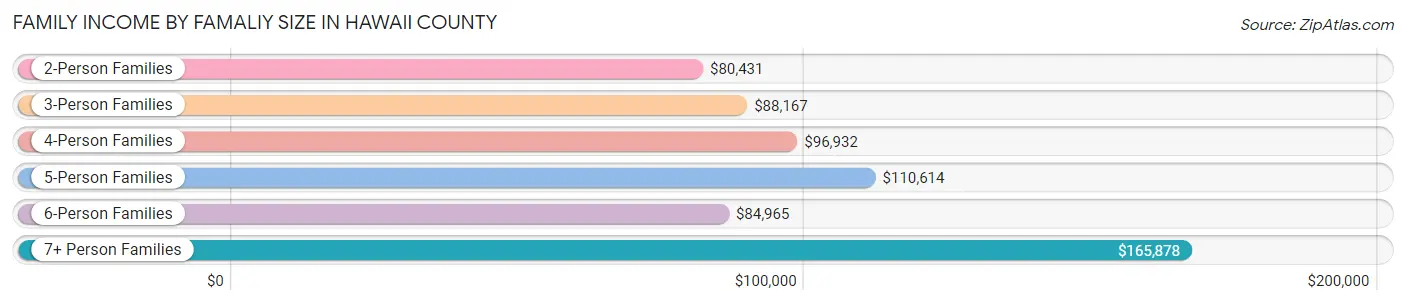
| Income Bracket | # Families | Median Income |
| 2-Person Families | 23,849 (49.7%) | $80,431 |
| 3-Person Families | 9,569 (20.0%) | $88,167 |
| 4-Person Families | 7,220 (15.0%) | $96,932 |
| 5-Person Families | 3,767 (7.9%) | $110,614 |
| 6-Person Families | 1,419 (3.0%) | $84,965 |
| 7+ Person Families | 2,135 (4.4%) | $165,878 |
| Total | 47,959 (100.0%) | $90,234 |
Family Income by Number of Earners in Hawaii County
The median family income in Hawaii County is $90,234, with families comprising 3+ earners (5,851) having the highest median family income of $148,896, while families with no earners (9,008) have the lowest median family income of $45,910, accounting for 12.2% and 18.8% of families, respectively.
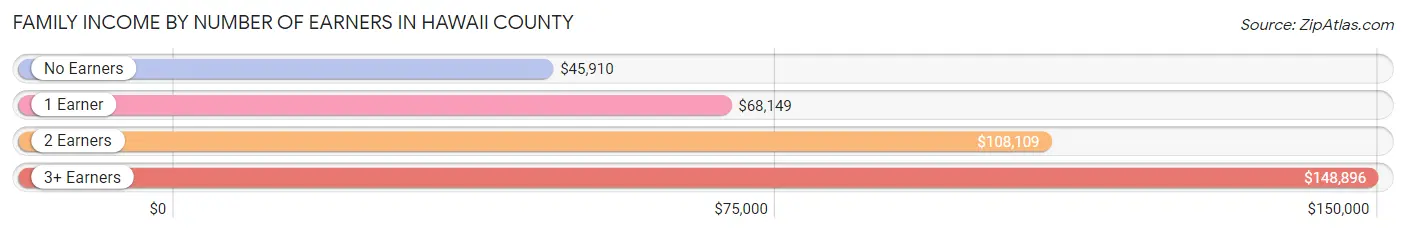
| Number of Earners | # Families | Median Income |
| No Earners | 9,008 (18.8%) | $45,910 |
| 1 Earner | 15,706 (32.8%) | $68,149 |
| 2 Earners | 17,394 (36.3%) | $108,109 |
| 3+ Earners | 5,851 (12.2%) | $148,896 |
| Total | 47,959 (100.0%) | $90,234 |
Household Income in Hawaii County
Household Income Brackets in Hawaii County
With 12,682 households falling in the category, the $100,000 to $149,999 income range is the most frequent in Hawaii County, accounting for 17.5% of all households. In contrast, only 2,899 households (4.0%) fall into the $10,000 to $14,999 income bracket, making it the least populous group.
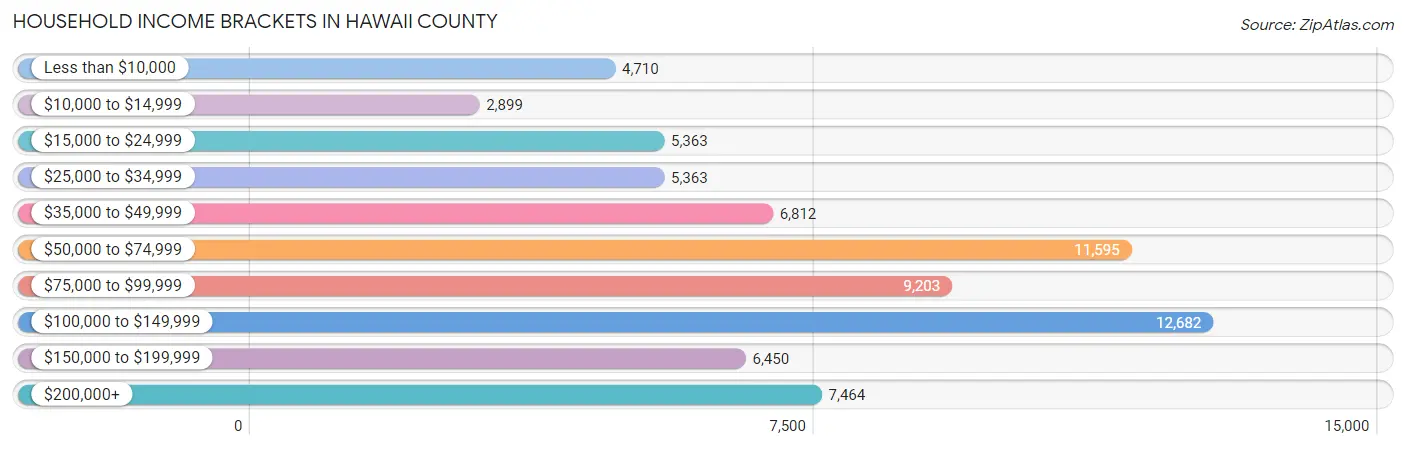
| Income Bracket | # Households | % Households |
| Less than $10,000 | 4,710 | 6.5% |
| $10,000 to $14,999 | 2,899 | 4.0% |
| $15,000 to $24,999 | 5,363 | 7.4% |
| $25,000 to $34,999 | 5,363 | 7.4% |
| $35,000 to $49,999 | 6,812 | 9.4% |
| $50,000 to $74,999 | 11,595 | 16.0% |
| $75,000 to $99,999 | 9,203 | 12.7% |
| $100,000 to $149,999 | 12,682 | 17.5% |
| $150,000 to $199,999 | 6,450 | 8.9% |
| $200,000+ | 7,464 | 10.3% |
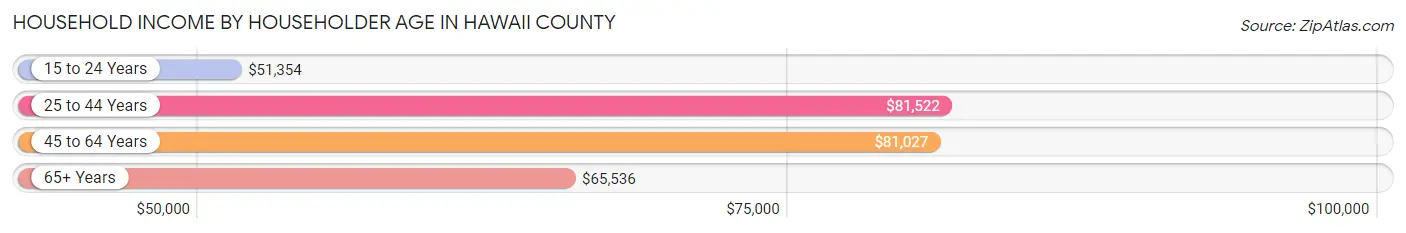
Household Income by Householder Age in Hawaii County
The median household income in Hawaii County is $74,238, with the highest median household income of $81,522 found in the 25 to 44 years age bracket for the primary householder. A total of 17,746 households (24.5%) fall into this category. Meanwhile, the 15 to 24 years age bracket for the primary householder has the lowest median household income of $51,354, with 1,556 households (2.1%) in this group.
| Income Bracket | # Households | Median Income |
| 15 to 24 Years | 1,556 (2.1%) | $51,354 |
| 25 to 44 Years | 17,746 (24.5%) | $81,522 |
| 45 to 64 Years | 26,539 (36.6%) | $81,027 |
| 65+ Years | 26,627 (36.7%) | $65,536 |
| Total | 72,468 (100.0%) | $74,238 |
Poverty in Hawaii County
Income Below Poverty by Sex and Age in Hawaii County
With 13.9% poverty level for males and 14.3% for females among the residents of Hawaii County, 5 year old males and 16 and 17 year old females are the most vulnerable to poverty, with 262 males (23.9%) and 561 females (25.6%) in their respective age groups living below the poverty level.
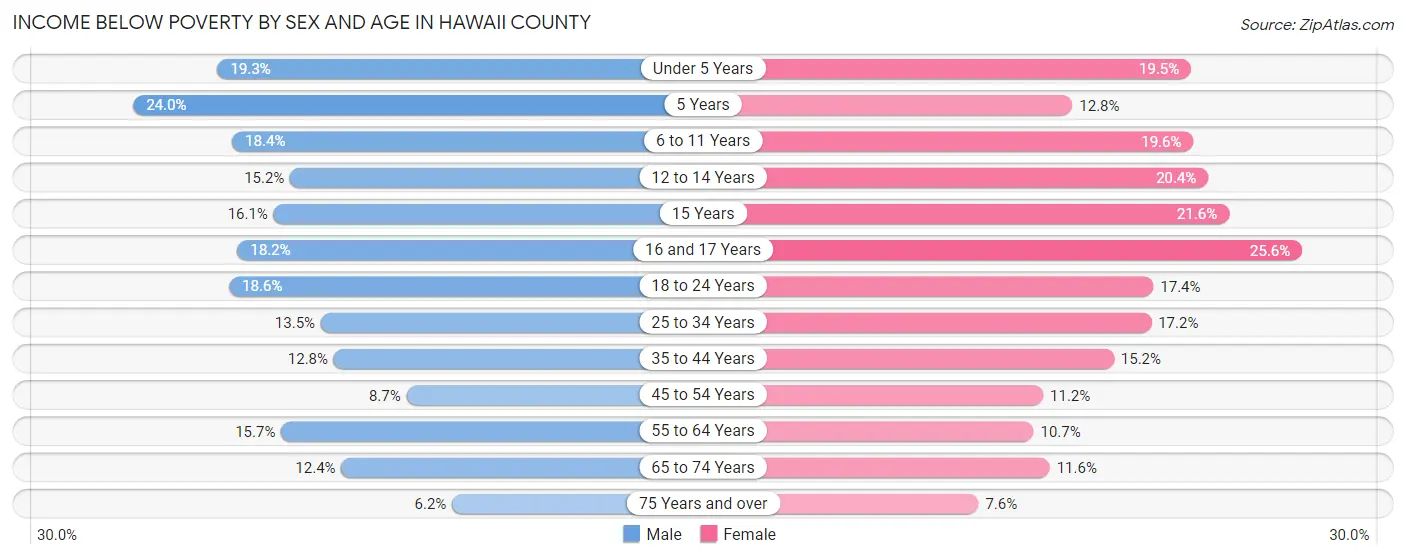
| Age Bracket | Male | Female |
| Under 5 Years | 1,089 (19.3%) | 1,010 (19.5%) |
| 5 Years | 262 (23.9%) | 86 (12.8%) |
| 6 to 11 Years | 1,516 (18.4%) | 1,463 (19.6%) |
| 12 to 14 Years | 484 (15.2%) | 765 (20.4%) |
| 15 Years | 184 (16.1%) | 255 (21.6%) |
| 16 and 17 Years | 453 (18.1%) | 561 (25.6%) |
| 18 to 24 Years | 1,313 (18.6%) | 1,139 (17.3%) |
| 25 to 34 Years | 1,517 (13.5%) | 2,006 (17.2%) |
| 35 to 44 Years | 1,569 (12.8%) | 1,890 (15.1%) |
| 45 to 54 Years | 1,009 (8.7%) | 1,310 (11.2%) |
| 55 to 64 Years | 2,205 (15.7%) | 1,555 (10.7%) |
| 65 to 74 Years | 1,772 (12.4%) | 1,637 (11.6%) |
| 75 Years and over | 449 (6.2%) | 663 (7.6%) |
| Total | 13,822 (13.9%) | 14,340 (14.3%) |
Income Above Poverty by Sex and Age in Hawaii County
According to the poverty statistics in Hawaii County, males aged 75 years and over and females aged 75 years and over are the age groups that are most secure financially, with 93.8% of males and 92.4% of females in these age groups living above the poverty line.
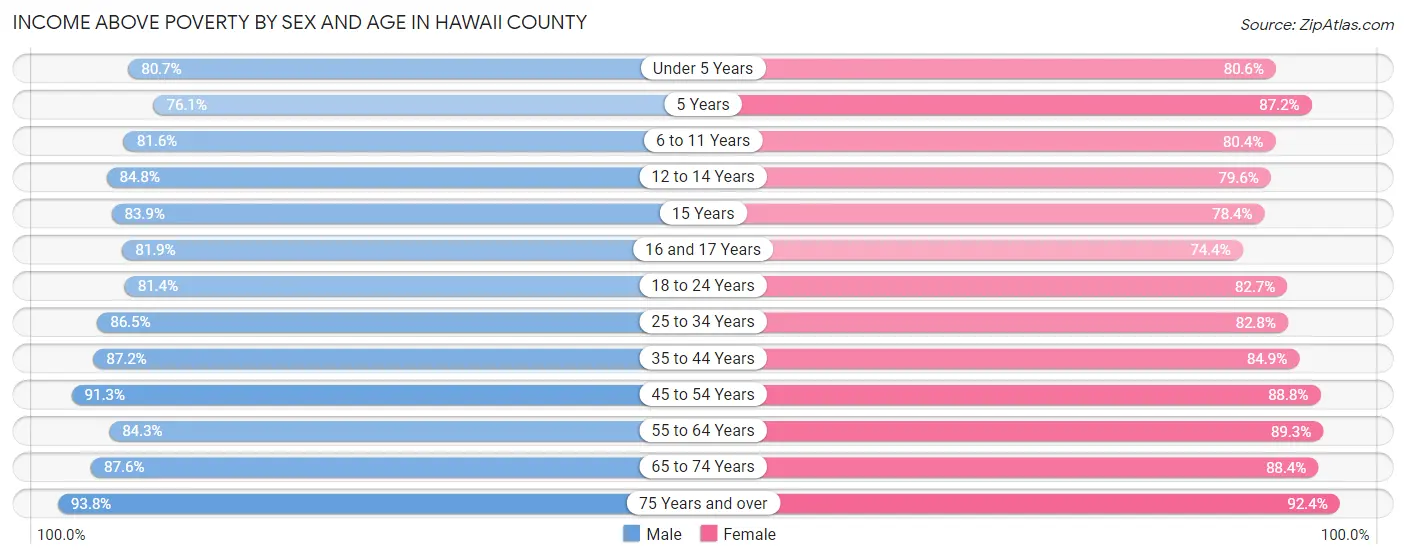
| Age Bracket | Male | Female |
| Under 5 Years | 4,564 (80.7%) | 4,183 (80.5%) |
| 5 Years | 832 (76.0%) | 584 (87.2%) |
| 6 to 11 Years | 6,705 (81.6%) | 6,013 (80.4%) |
| 12 to 14 Years | 2,699 (84.8%) | 2,985 (79.6%) |
| 15 Years | 957 (83.9%) | 928 (78.4%) |
| 16 and 17 Years | 2,043 (81.9%) | 1,628 (74.4%) |
| 18 to 24 Years | 5,743 (81.4%) | 5,427 (82.7%) |
| 25 to 34 Years | 9,721 (86.5%) | 9,637 (82.8%) |
| 35 to 44 Years | 10,711 (87.2%) | 10,588 (84.9%) |
| 45 to 54 Years | 10,551 (91.3%) | 10,377 (88.8%) |
| 55 to 64 Years | 11,829 (84.3%) | 13,009 (89.3%) |
| 65 to 74 Years | 12,562 (87.6%) | 12,503 (88.4%) |
| 75 Years and over | 6,802 (93.8%) | 8,053 (92.4%) |
| Total | 85,719 (86.1%) | 85,915 (85.7%) |
Income Below Poverty Among Married-Couple Families in Hawaii County
The poverty statistics for married-couple families in Hawaii County show that 6.1% or 2,109 of the total 34,744 families live below the poverty line. Families with 5 or more children have the highest poverty rate of 29.9%, comprising of 100 families. On the other hand, families with no children have the lowest poverty rate of 5.2%, which includes 1,177 families.
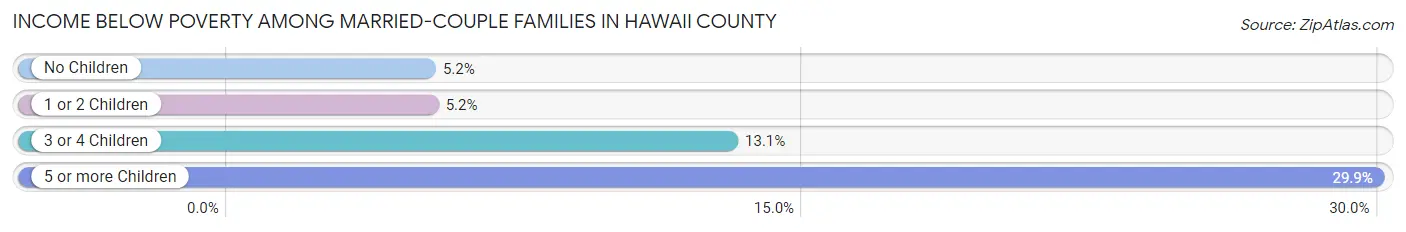
| Children | Above Poverty | Below Poverty |
| No Children | 21,574 (94.8%) | 1,177 (5.2%) |
| 1 or 2 Children | 8,371 (94.8%) | 463 (5.2%) |
| 3 or 4 Children | 2,456 (86.9%) | 369 (13.1%) |
| 5 or more Children | 234 (70.1%) | 100 (29.9%) |
| Total | 32,635 (93.9%) | 2,109 (6.1%) |
Income Below Poverty Among Single-Parent Households in Hawaii County
According to the poverty data in Hawaii County, 18.4% or 733 single-father households and 23.4% or 2,167 single-mother households are living below the poverty line. Among single-father households, those with 5 or more children have the highest poverty rate, with 14 households (31.8%) experiencing poverty. Likewise, among single-mother households, those with 5 or more children have the highest poverty rate, with 217 households (87.2%) falling below the poverty line.
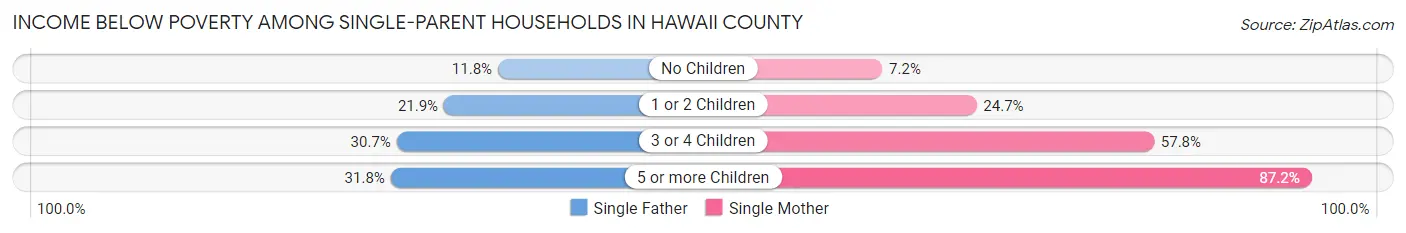
| Children | Single Father | Single Mother |
| No Children | 201 (11.8%) | 251 (7.2%) |
| 1 or 2 Children | 417 (21.9%) | 1,101 (24.7%) |
| 3 or 4 Children | 101 (30.7%) | 598 (57.8%) |
| 5 or more Children | 14 (31.8%) | 217 (87.2%) |
| Total | 733 (18.4%) | 2,167 (23.4%) |
Income Below Poverty Among Married-Couple vs Single-Parent Households in Hawaii County
The poverty data for Hawaii County shows that 2,109 of the married-couple family households (6.1%) and 2,900 of the single-parent households (21.9%) are living below the poverty level. Within the married-couple family households, those with 5 or more children have the highest poverty rate, with 100 households (29.9%) falling below the poverty line. Among the single-parent households, those with 5 or more children have the highest poverty rate, with 231 household (78.8%) living below poverty.
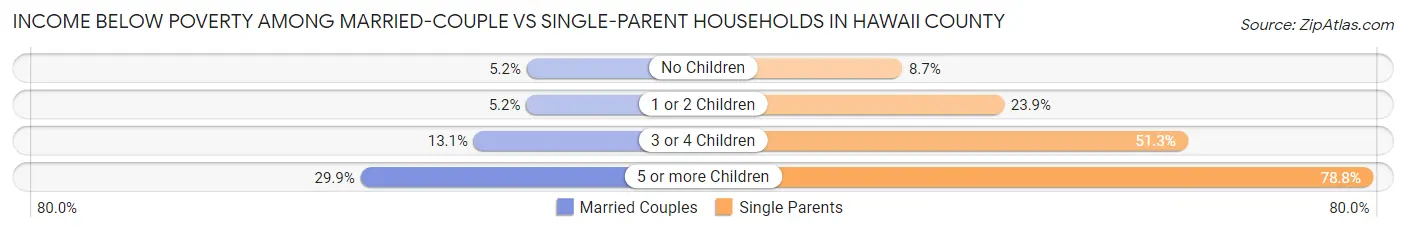
| Children | Married-Couple Families | Single-Parent Households |
| No Children | 1,177 (5.2%) | 452 (8.7%) |
| 1 or 2 Children | 463 (5.2%) | 1,518 (23.9%) |
| 3 or 4 Children | 369 (13.1%) | 699 (51.2%) |
| 5 or more Children | 100 (29.9%) | 231 (78.8%) |
| Total | 2,109 (6.1%) | 2,900 (21.9%) |
Race in Hawaii County
The most populous races in Hawaii County are Two or more Races (63,436 | 31.4%), White / Caucasian (63,416 | 31.4%), and Asian (43,804 | 21.7%).
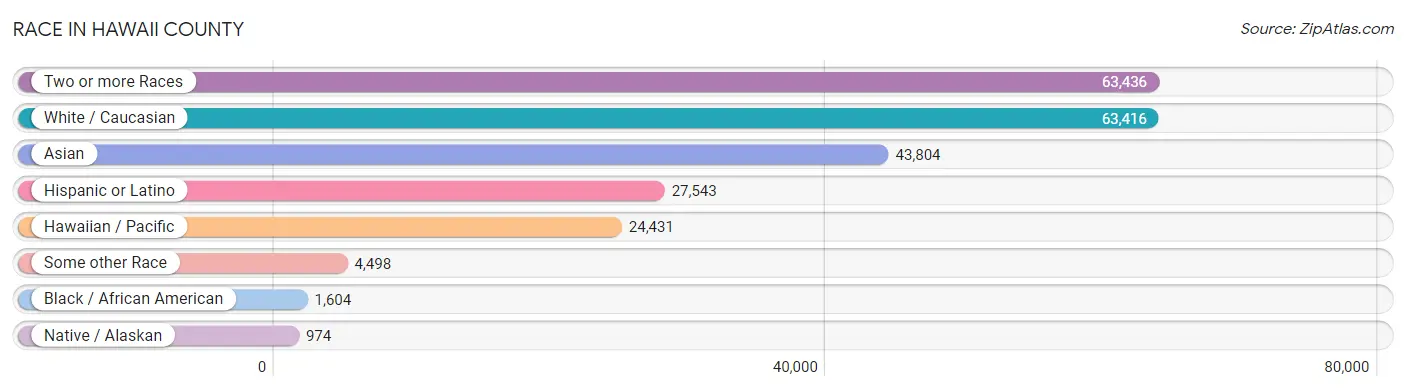
| Race | # Population | % Population |
| Asian | 43,804 | 21.7% |
| Black / African American | 1,604 | 0.8% |
| Hawaiian / Pacific | 24,431 | 12.1% |
| Hispanic or Latino | 27,543 | 13.6% |
| Native / Alaskan | 974 | 0.5% |
| White / Caucasian | 63,416 | 31.4% |
| Two or more Races | 63,436 | 31.4% |
| Some other Race | 4,498 | 2.2% |
| Total | 202,163 | 100.0% |
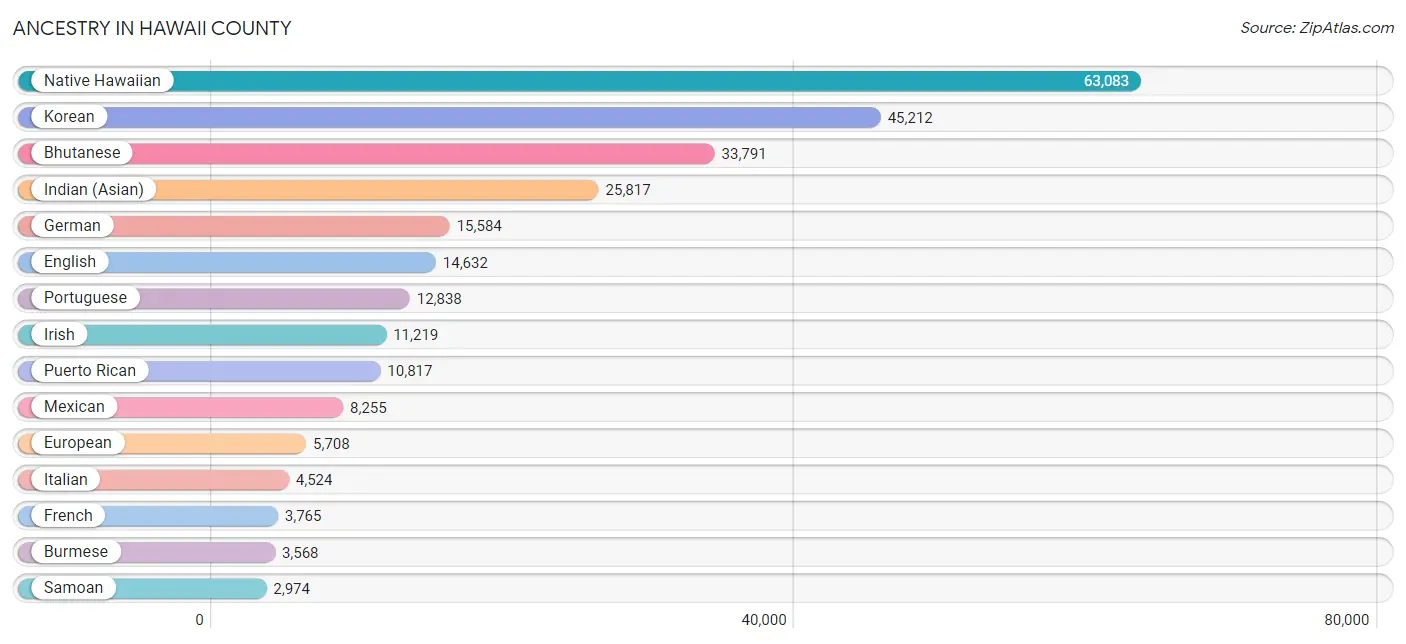
Ancestry in Hawaii County
The most populous ancestries reported in Hawaii County are Native Hawaiian (63,083 | 31.2%), Korean (45,212 | 22.4%), Bhutanese (33,791 | 16.7%), Indian (Asian) (25,817 | 12.8%), and German (15,584 | 7.7%), together accounting for 90.7% of all Hawaii County residents.
| Ancestry | # Population | % Population |
| African | 409 | 0.2% |
| Alaska Native | 6 | 0.0% |
| Alaskan Athabascan | 92 | 0.1% |
| Alsatian | 9 | 0.0% |
| American | 2,195 | 1.1% |
| Apache | 321 | 0.2% |
| Arab | 304 | 0.2% |
| Argentinean | 157 | 0.1% |
| Armenian | 91 | 0.1% |
| Assyrian / Chaldean / Syriac | 10 | 0.0% |
| Australian | 92 | 0.1% |
| Austrian | 442 | 0.2% |
| Bangladeshi | 3 | 0.0% |
| Basque | 66 | 0.0% |
| Belgian | 93 | 0.1% |
| Bhutanese | 33,791 | 16.7% |
| Blackfeet | 278 | 0.1% |
| Brazilian | 85 | 0.0% |
| British | 893 | 0.4% |
| Burmese | 3,568 | 1.8% |
| Cajun | 6 | 0.0% |
| Cambodian | 73 | 0.0% |
| Canadian | 210 | 0.1% |
| Central American | 1,243 | 0.6% |
| Central American Indian | 460 | 0.2% |
| Cherokee | 2,925 | 1.5% |
| Cheyenne | 38 | 0.0% |
| Chickasaw | 82 | 0.0% |
| Chilean | 173 | 0.1% |
| Chinese | 801 | 0.4% |
| Chippewa | 84 | 0.0% |
| Choctaw | 368 | 0.2% |
| Colombian | 149 | 0.1% |
| Comanche | 28 | 0.0% |
| Costa Rican | 22 | 0.0% |
| Cree | 15 | 0.0% |
| Creek | 48 | 0.0% |
| Croatian | 82 | 0.0% |
| Cuban | 376 | 0.2% |
| Czech | 365 | 0.2% |
| Czechoslovakian | 26 | 0.0% |
| Danish | 612 | 0.3% |
| Delaware | 5 | 0.0% |
| Dominican | 211 | 0.1% |
| Dutch | 1,416 | 0.7% |
| Eastern European | 345 | 0.2% |
| Ecuadorian | 14 | 0.0% |
| Egyptian | 26 | 0.0% |
| English | 14,632 | 7.2% |
| Estonian | 8 | 0.0% |
| European | 5,708 | 2.8% |
| Fijian | 1,701 | 0.8% |
| Filipino | 129 | 0.1% |
| Finnish | 387 | 0.2% |
| French | 3,765 | 1.9% |
| French American Indian | 49 | 0.0% |
| French Canadian | 751 | 0.4% |
| German | 15,584 | 7.7% |
| Greek | 394 | 0.2% |
| Guamanian / Chamorro | 429 | 0.2% |
| Guatemalan | 483 | 0.2% |
| Haitian | 251 | 0.1% |
| Honduran | 339 | 0.2% |
| Hungarian | 484 | 0.2% |
| Icelander | 49 | 0.0% |
| Indian (Asian) | 25,817 | 12.8% |
| Indonesian | 46 | 0.0% |
| Inupiat | 25 | 0.0% |
| Iranian | 293 | 0.1% |
| Irish | 11,219 | 5.6% |
| Iroquois | 192 | 0.1% |
| Israeli | 54 | 0.0% |
| Italian | 4,524 | 2.2% |
| Jamaican | 27 | 0.0% |
| Japanese | 81 | 0.0% |
| Korean | 45,212 | 22.4% |
| Laotian | 477 | 0.2% |
| Latvian | 57 | 0.0% |
| Lebanese | 5 | 0.0% |
| Lithuanian | 268 | 0.1% |
| Malaysian | 314 | 0.2% |
| Marshallese | 221 | 0.1% |
| Mexican | 8,255 | 4.1% |
| Mexican American Indian | 935 | 0.5% |
| Mongolian | 9 | 0.0% |
| Moroccan | 26 | 0.0% |
| Native Hawaiian | 63,083 | 31.2% |
| Navajo | 265 | 0.1% |
| New Zealander | 39 | 0.0% |
| Nicaraguan | 91 | 0.1% |
| Northern European | 491 | 0.2% |
| Norwegian | 2,466 | 1.2% |
| Osage | 19 | 0.0% |
| Ottawa | 20 | 0.0% |
| Paiute | 37 | 0.0% |
| Pakistani | 1,024 | 0.5% |
| Palestinian | 25 | 0.0% |
| Panamanian | 140 | 0.1% |
| Pennsylvania German | 146 | 0.1% |
| Peruvian | 118 | 0.1% |
| Polish | 1,871 | 0.9% |
| Portuguese | 12,838 | 6.4% |
| Potawatomi | 62 | 0.0% |
| Pueblo | 13 | 0.0% |
| Puerto Rican | 10,817 | 5.3% |
| Romanian | 145 | 0.1% |
| Russian | 1,868 | 0.9% |
| Salvadoran | 168 | 0.1% |
| Samoan | 2,974 | 1.5% |
| Scandinavian | 1,023 | 0.5% |
| Scotch-Irish | 1,416 | 0.7% |
| Scottish | 2,954 | 1.5% |
| Seminole | 119 | 0.1% |
| Serbian | 4 | 0.0% |
| Shoshone | 81 | 0.0% |
| Sioux | 169 | 0.1% |
| Slavic | 63 | 0.0% |
| Slovak | 83 | 0.0% |
| Slovene | 60 | 0.0% |
| South American | 625 | 0.3% |
| South American Indian | 20 | 0.0% |
| Spaniard | 2,271 | 1.1% |
| Spanish | 2,452 | 1.2% |
| Spanish American | 238 | 0.1% |
| Sri Lankan | 878 | 0.4% |
| Subsaharan African | 429 | 0.2% |
| Sudanese | 11 | 0.0% |
| Swedish | 1,628 | 0.8% |
| Swiss | 704 | 0.4% |
| Syrian | 45 | 0.0% |
| Thai | 629 | 0.3% |
| Tlingit-Haida | 134 | 0.1% |
| Tohono O'Odham | 17 | 0.0% |
| Tongan | 594 | 0.3% |
| Tsimshian | 22 | 0.0% |
| Turkish | 89 | 0.0% |
| Ukrainian | 584 | 0.3% |
| Ute | 68 | 0.0% |
| Welsh | 1,134 | 0.6% |
| West Indian | 42 | 0.0% |
| Yaqui | 4 | 0.0% |
| Yugoslavian | 40 | 0.0% |
| Yup'ik | 10 | 0.0% | View All 143 Rows |
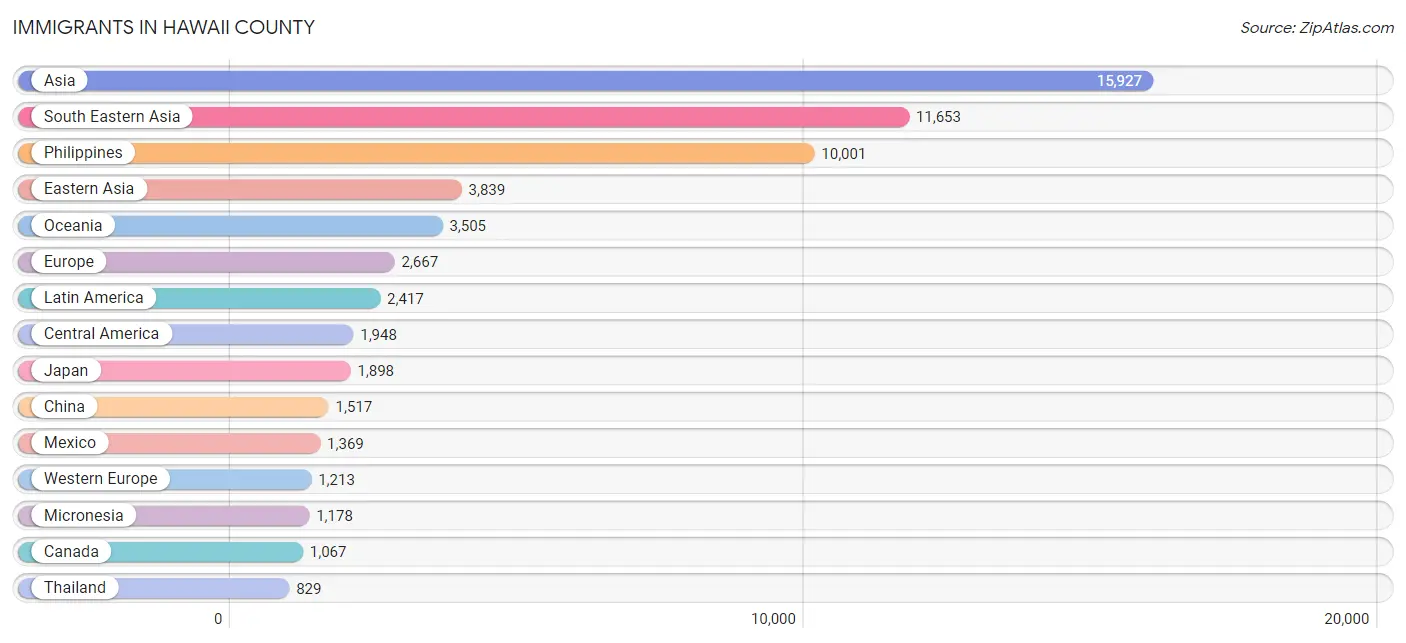
Immigrants in Hawaii County
The most numerous immigrant groups reported in Hawaii County came from Asia (15,927 | 7.9%), South Eastern Asia (11,653 | 5.8%), Philippines (10,001 | 5.0%), Eastern Asia (3,839 | 1.9%), and Oceania (3,505 | 1.7%), together accounting for 22.2% of all Hawaii County residents.
| Immigration Origin | # Population | % Population |
| Africa | 396 | 0.2% |
| Argentina | 22 | 0.0% |
| Asia | 15,927 | 7.9% |
| Australia | 326 | 0.2% |
| Austria | 25 | 0.0% |
| Bangladesh | 2 | 0.0% |
| Belarus | 18 | 0.0% |
| Belgium | 12 | 0.0% |
| Brazil | 72 | 0.0% |
| Cambodia | 19 | 0.0% |
| Canada | 1,067 | 0.5% |
| Caribbean | 90 | 0.0% |
| Central America | 1,948 | 1.0% |
| Chile | 154 | 0.1% |
| China | 1,517 | 0.7% |
| Colombia | 69 | 0.0% |
| Croatia | 23 | 0.0% |
| Cuba | 38 | 0.0% |
| Czechoslovakia | 70 | 0.0% |
| Denmark | 25 | 0.0% |
| Eastern Africa | 24 | 0.0% |
| Eastern Asia | 3,839 | 1.9% |
| Eastern Europe | 666 | 0.3% |
| Ecuador | 14 | 0.0% |
| El Salvador | 40 | 0.0% |
| England | 121 | 0.1% |
| Europe | 2,667 | 1.3% |
| Fiji | 1 | 0.0% |
| France | 313 | 0.2% |
| Germany | 615 | 0.3% |
| Ghana | 21 | 0.0% |
| Greece | 19 | 0.0% |
| Guatemala | 276 | 0.1% |
| Guyana | 18 | 0.0% |
| Honduras | 212 | 0.1% |
| Hong Kong | 168 | 0.1% |
| India | 143 | 0.1% |
| Indonesia | 180 | 0.1% |
| Iran | 175 | 0.1% |
| Iraq | 4 | 0.0% |
| Ireland | 27 | 0.0% |
| Israel | 73 | 0.0% |
| Italy | 35 | 0.0% |
| Jamaica | 19 | 0.0% |
| Japan | 1,898 | 0.9% |
| Korea | 413 | 0.2% |
| Laos | 158 | 0.1% |
| Latin America | 2,417 | 1.2% |
| Liberia | 2 | 0.0% |
| Malaysia | 28 | 0.0% |
| Mexico | 1,369 | 0.7% |
| Micronesia | 1,178 | 0.6% |
| Moldova | 10 | 0.0% |
| Netherlands | 166 | 0.1% |
| Nicaragua | 31 | 0.0% |
| Northern Africa | 4 | 0.0% |
| Northern Europe | 587 | 0.3% |
| Norway | 21 | 0.0% |
| Oceania | 3,505 | 1.7% |
| Panama | 20 | 0.0% |
| Peru | 27 | 0.0% |
| Philippines | 10,001 | 5.0% |
| Poland | 8 | 0.0% |
| Portugal | 10 | 0.0% |
| Romania | 46 | 0.0% |
| Russia | 238 | 0.1% |
| Singapore | 12 | 0.0% |
| South Africa | 314 | 0.2% |
| South America | 379 | 0.2% |
| South Central Asia | 328 | 0.2% |
| South Eastern Asia | 11,653 | 5.8% |
| Southern Europe | 189 | 0.1% |
| Spain | 125 | 0.1% |
| Sri Lanka | 8 | 0.0% |
| Sweden | 28 | 0.0% |
| Switzerland | 82 | 0.0% |
| Taiwan | 94 | 0.1% |
| Thailand | 829 | 0.4% |
| Trinidad and Tobago | 10 | 0.0% |
| Turkey | 2 | 0.0% |
| Ukraine | 134 | 0.1% |
| Venezuela | 3 | 0.0% |
| Vietnam | 426 | 0.2% |
| West Indies | 23 | 0.0% |
| Western Africa | 23 | 0.0% |
| Western Asia | 107 | 0.1% |
| Western Europe | 1,213 | 0.6% |
| Zimbabwe | 15 | 0.0% | View All 88 Rows |
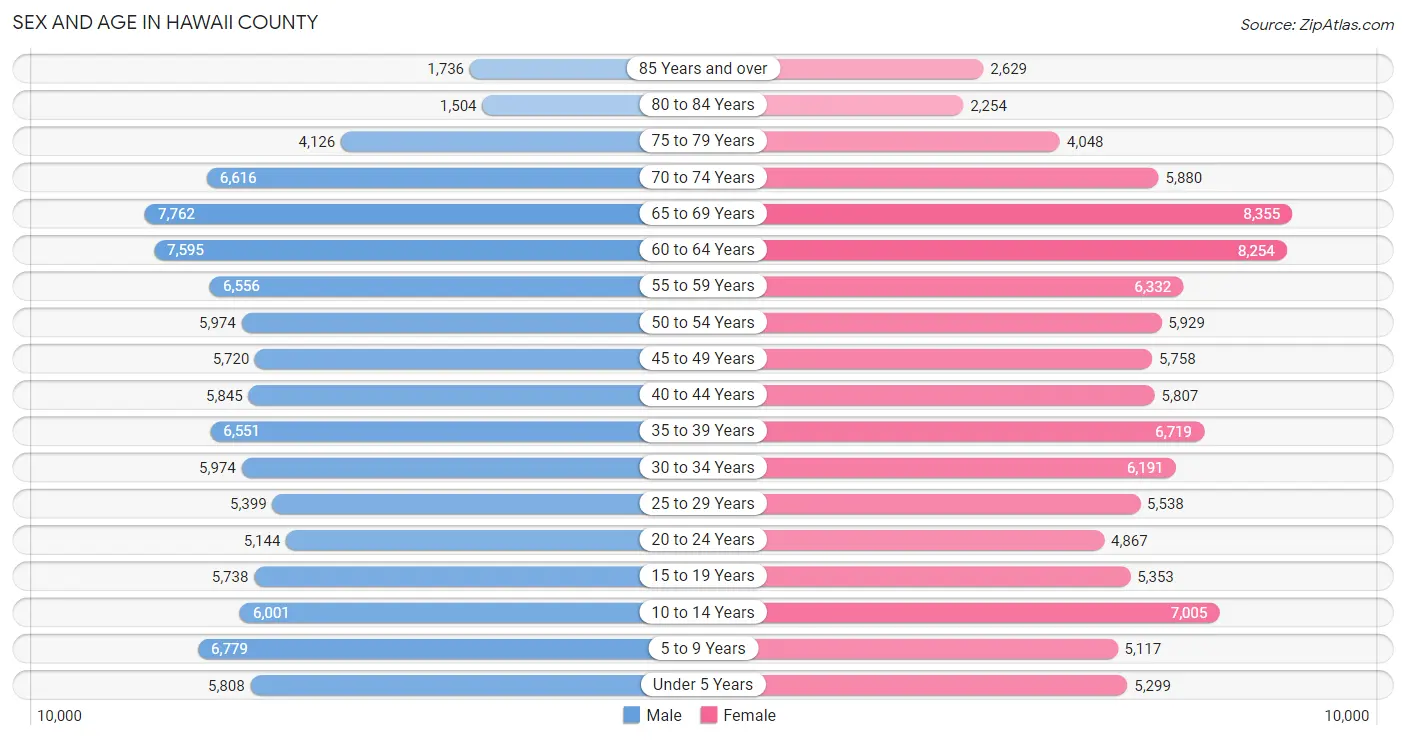
Sex and Age in Hawaii County
Sex and Age in Hawaii County
The most populous age groups in Hawaii County are 65 to 69 Years (7,762 | 7.7%) for men and 65 to 69 Years (8,355 | 8.2%) for women.
| Age Bracket | Male | Female |
| Under 5 Years | 5,808 (5.8%) | 5,299 (5.2%) |
| 5 to 9 Years | 6,779 (6.7%) | 5,117 (5.1%) |
| 10 to 14 Years | 6,001 (5.9%) | 7,005 (6.9%) |
| 15 to 19 Years | 5,738 (5.7%) | 5,353 (5.3%) |
| 20 to 24 Years | 5,144 (5.1%) | 4,867 (4.8%) |
| 25 to 29 Years | 5,399 (5.3%) | 5,538 (5.5%) |
| 30 to 34 Years | 5,974 (5.9%) | 6,191 (6.1%) |
| 35 to 39 Years | 6,551 (6.5%) | 6,719 (6.6%) |
| 40 to 44 Years | 5,845 (5.8%) | 5,807 (5.7%) |
| 45 to 49 Years | 5,720 (5.7%) | 5,758 (5.7%) |
| 50 to 54 Years | 5,974 (5.9%) | 5,929 (5.9%) |
| 55 to 59 Years | 6,556 (6.5%) | 6,332 (6.2%) |
| 60 to 64 Years | 7,595 (7.5%) | 8,254 (8.2%) |
| 65 to 69 Years | 7,762 (7.7%) | 8,355 (8.2%) |
| 70 to 74 Years | 6,616 (6.6%) | 5,880 (5.8%) |
| 75 to 79 Years | 4,126 (4.1%) | 4,048 (4.0%) |
| 80 to 84 Years | 1,504 (1.5%) | 2,254 (2.2%) |
| 85 Years and over | 1,736 (1.7%) | 2,629 (2.6%) |
| Total | 100,828 (100.0%) | 101,335 (100.0%) |
Families and Households in Hawaii County
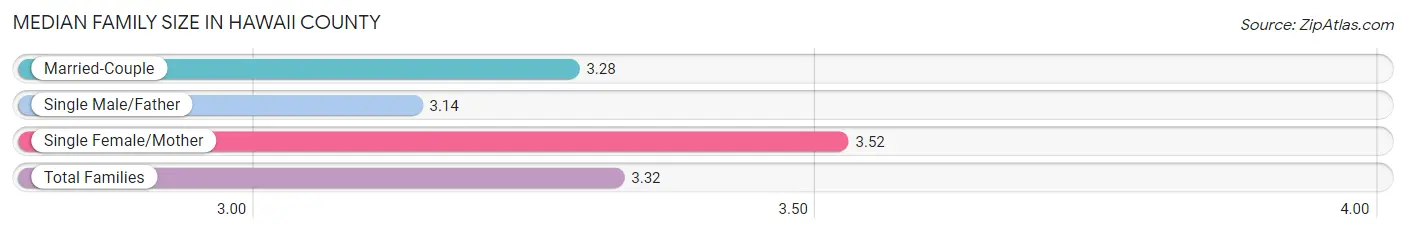
Median Family Size in Hawaii County
The median family size in Hawaii County is 3.32 persons per family, with single female/mother families (9,239 | 19.3%) accounting for the largest median family size of 3.52 persons per family. On the other hand, single male/father families (3,976 | 8.3%) represent the smallest median family size with 3.14 persons per family.
| Family Type | # Families | Family Size |
| Married-Couple | 34,744 (72.5%) | 3.28 |
| Single Male/Father | 3,976 (8.3%) | 3.14 |
| Single Female/Mother | 9,239 (19.3%) | 3.52 |
| Total Families | 47,959 (100.0%) | 3.32 |
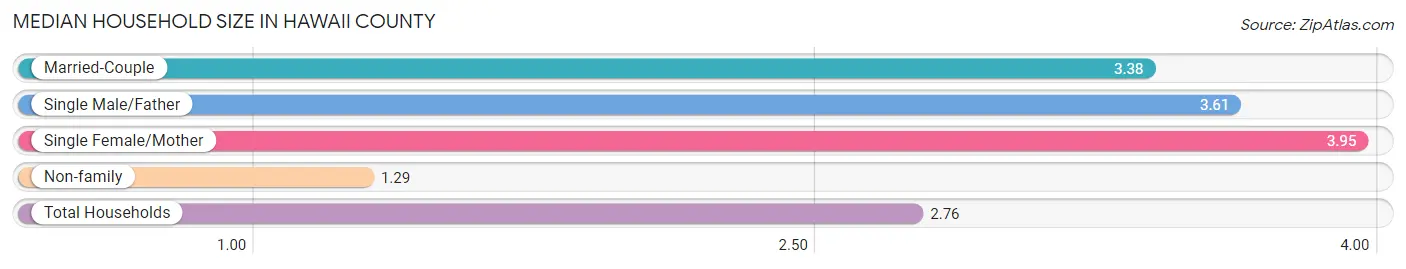
Median Household Size in Hawaii County
The median household size in Hawaii County is 2.76 persons per household, with single female/mother households (9,239 | 12.8%) accounting for the largest median household size of 3.95 persons per household. non-family households (24,509 | 33.8%) represent the smallest median household size with 1.29 persons per household.
| Household Type | # Households | Household Size |
| Married-Couple | 34,744 (47.9%) | 3.38 |
| Single Male/Father | 3,976 (5.5%) | 3.61 |
| Single Female/Mother | 9,239 (12.8%) | 3.95 |
| Non-family | 24,509 (33.8%) | 1.29 |
| Total Households | 72,468 (100.0%) | 2.76 |
Household Size by Marriage Status in Hawaii County
Out of a total of 72,468 households in Hawaii County, 47,959 (66.2%) are family households, while 24,509 (33.8%) are nonfamily households. The most numerous type of family households are 2-person households, comprising 21,504, and the most common type of nonfamily households are 1-person households, comprising 19,174.
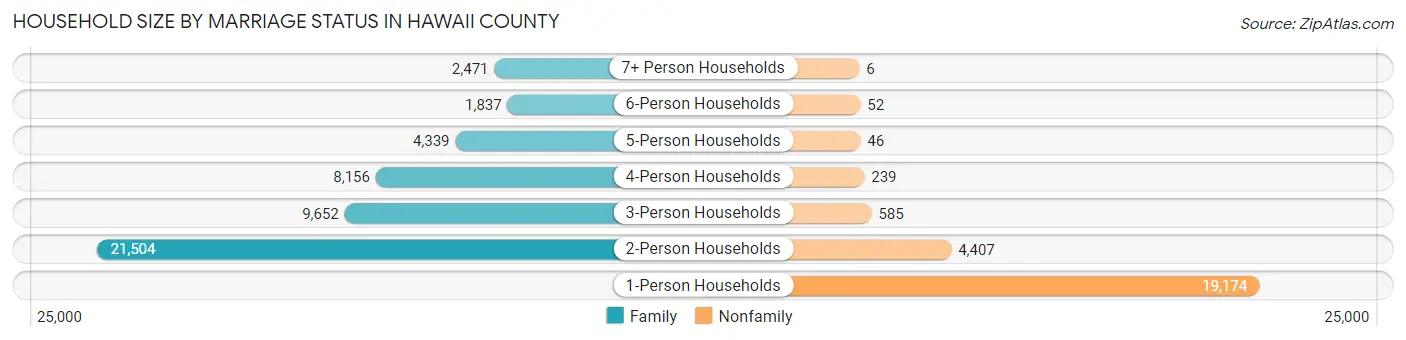
| Household Size | Family Households | Nonfamily Households |
| 1-Person Households | - | 19,174 (26.5%) |
| 2-Person Households | 21,504 (29.7%) | 4,407 (6.1%) |
| 3-Person Households | 9,652 (13.3%) | 585 (0.8%) |
| 4-Person Households | 8,156 (11.3%) | 239 (0.3%) |
| 5-Person Households | 4,339 (6.0%) | 46 (0.1%) |
| 6-Person Households | 1,837 (2.5%) | 52 (0.1%) |
| 7+ Person Households | 2,471 (3.4%) | 6 (0.0%) |
| Total | 47,959 (66.2%) | 24,509 (33.8%) |
Female Fertility in Hawaii County
Fertility by Age in Hawaii County
Average fertility rate in Hawaii County is 52.0 births per 1,000 women. Women in the age bracket of 20 to 34 years have the highest fertility rate with 84.0 births per 1,000 women. Women in the age bracket of 20 to 34 years acount for 63.8% of all women with births.
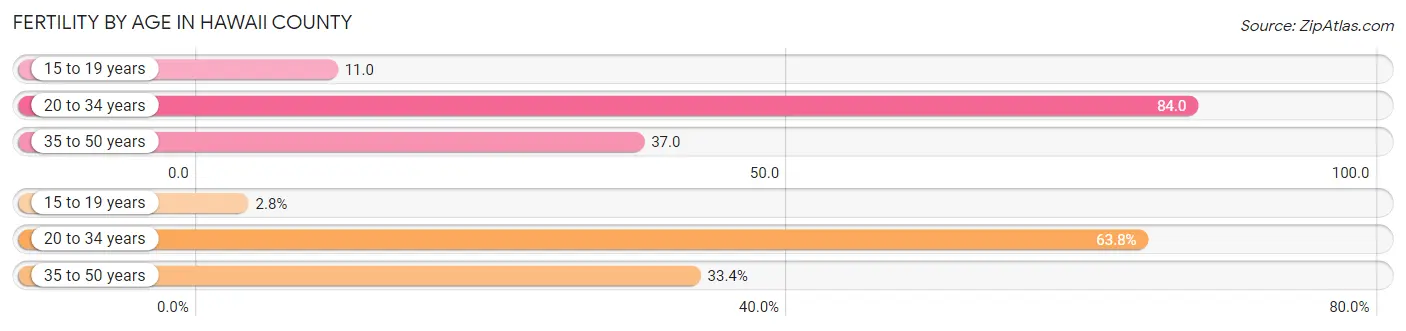
| Age Bracket | Women with Births | Births / 1,000 Women |
| 15 to 19 years | 60 (2.8%) | 11.0 |
| 20 to 34 years | 1,392 (63.8%) | 84.0 |
| 35 to 50 years | 729 (33.4%) | 37.0 |
| Total | 2,181 (100.0%) | 52.0 |
Fertility by Age by Marriage Status in Hawaii County
55.9% of women with births (2,181) in Hawaii County are married. The highest percentage of unmarried women with births falls into 15 to 19 years age bracket with 100.0% of them unmarried at the time of birth, while the lowest percentage of unmarried women with births belong to 35 to 50 years age bracket with 23.3% of them unmarried.
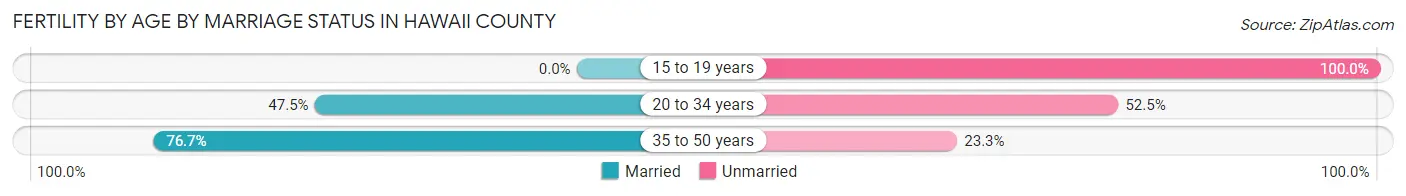
| Age Bracket | Married | Unmarried |
| 15 to 19 years | 0 (0.0%) | 60 (100.0%) |
| 20 to 34 years | 661 (47.5%) | 731 (52.5%) |
| 35 to 50 years | 559 (76.7%) | 170 (23.3%) |
| Total | 1,219 (55.9%) | 962 (44.1%) |
Fertility by Education in Hawaii County
Average fertility rate in Hawaii County is 52.0 births per 1,000 women. Women with the education attainment of graduate degree have the highest fertility rate of 64.0 births per 1,000 women, while women with the education attainment of bachelor's degree have the lowest fertility at 41.0 births per 1,000 women. Women with the education attainment of college or associate's degree represent 34.7% of all women with births.
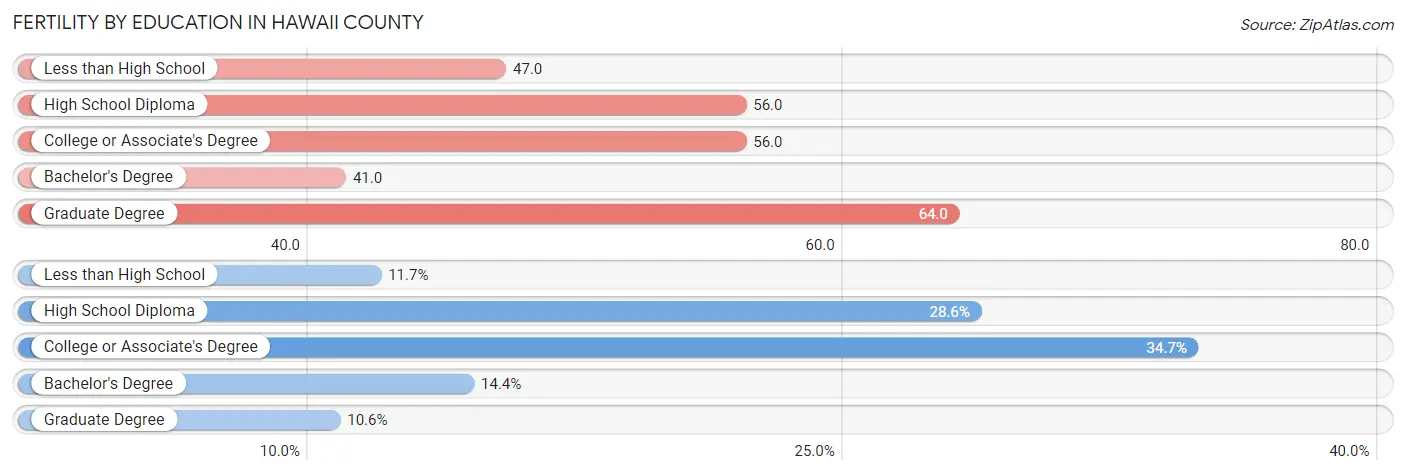
| Educational Attainment | Women with Births | Births / 1,000 Women |
| Less than High School | 256 (11.7%) | 47.0 |
| High School Diploma | 624 (28.6%) | 56.0 |
| College or Associate's Degree | 757 (34.7%) | 56.0 |
| Bachelor's Degree | 313 (14.3%) | 41.0 |
| Graduate Degree | 231 (10.6%) | 64.0 |
| Total | 2,181 (100.0%) | 52.0 |
Fertility by Education by Marriage Status in Hawaii County
44.1% of women with births in Hawaii County are unmarried. Women with the educational attainment of graduate degree are most likely to be married with 91.8% of them married at childbirth, while women with the educational attainment of high school diploma are least likely to be married with 70.0% of them unmarried at childbirth.
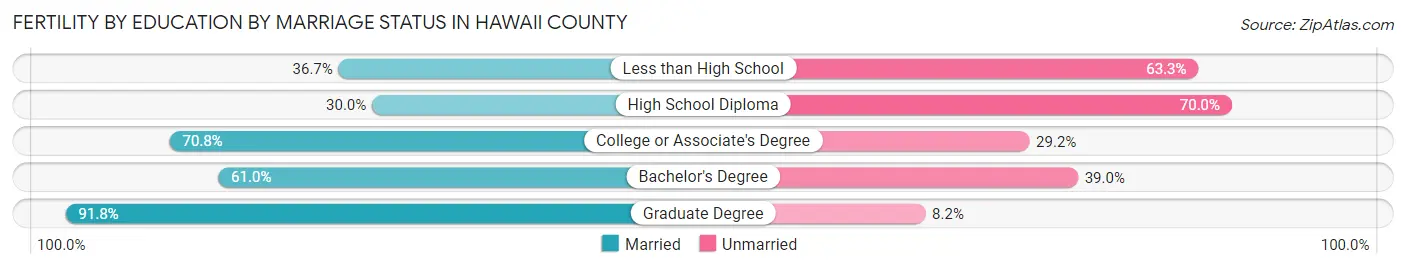
| Educational Attainment | Married | Unmarried |
| Less than High School | 94 (36.7%) | 162 (63.3%) |
| High School Diploma | 187 (30.0%) | 437 (70.0%) |
| College or Associate's Degree | 536 (70.8%) | 221 (29.2%) |
| Bachelor's Degree | 191 (61.0%) | 122 (39.0%) |
| Graduate Degree | 212 (91.8%) | 19 (8.2%) |
| Total | 1,219 (55.9%) | 962 (44.1%) |
Employment Characteristics in Hawaii County
Employment by Class of Employer in Hawaii County
Among the 87,270 employed individuals in Hawaii County, private company employees (49,432 | 56.6%), self-employed (not incorporated) (9,851 | 11.3%), and state government employees (8,771 | 10.1%) make up the most common classes of employment.
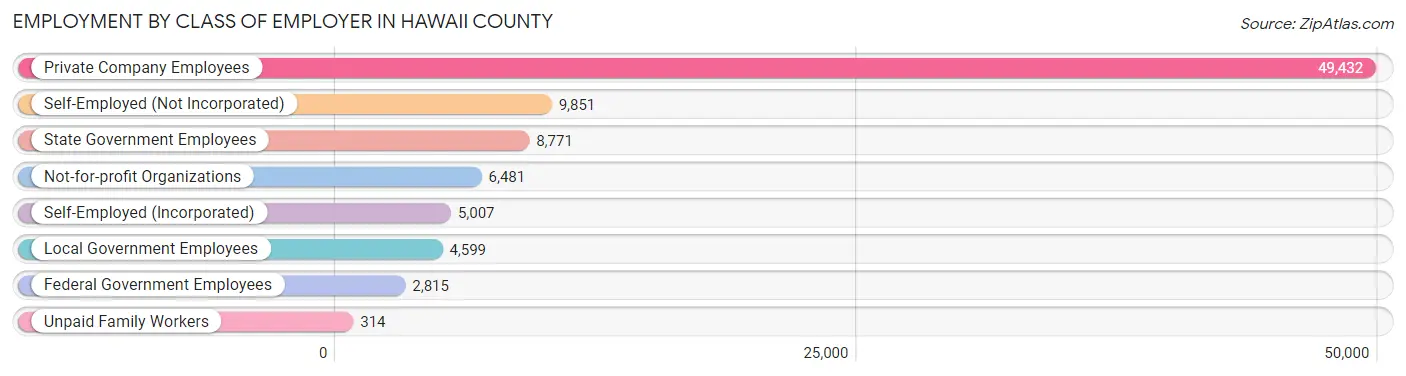
| Employer Class | # Employees | % Employees |
| Private Company Employees | 49,432 | 56.6% |
| Self-Employed (Incorporated) | 5,007 | 5.7% |
| Self-Employed (Not Incorporated) | 9,851 | 11.3% |
| Not-for-profit Organizations | 6,481 | 7.4% |
| Local Government Employees | 4,599 | 5.3% |
| State Government Employees | 8,771 | 10.1% |
| Federal Government Employees | 2,815 | 3.2% |
| Unpaid Family Workers | 314 | 0.4% |
| Total | 87,270 | 100.0% |
Employment Status by Age in Hawaii County
According to the labor force statistics for Hawaii County, out of the total population over 16 years of age (163,829), 58.8% or 96,331 individuals are in the labor force, with 6.5% or 6,262 of them unemployed. The age group with the highest labor force participation rate is 35 to 44 years, with 82.1% or 20,461 individuals in the labor force. Within the labor force, the 16 to 19 years age range has the highest percentage of unemployed individuals, with 24.1% or 678 of them being unemployed.
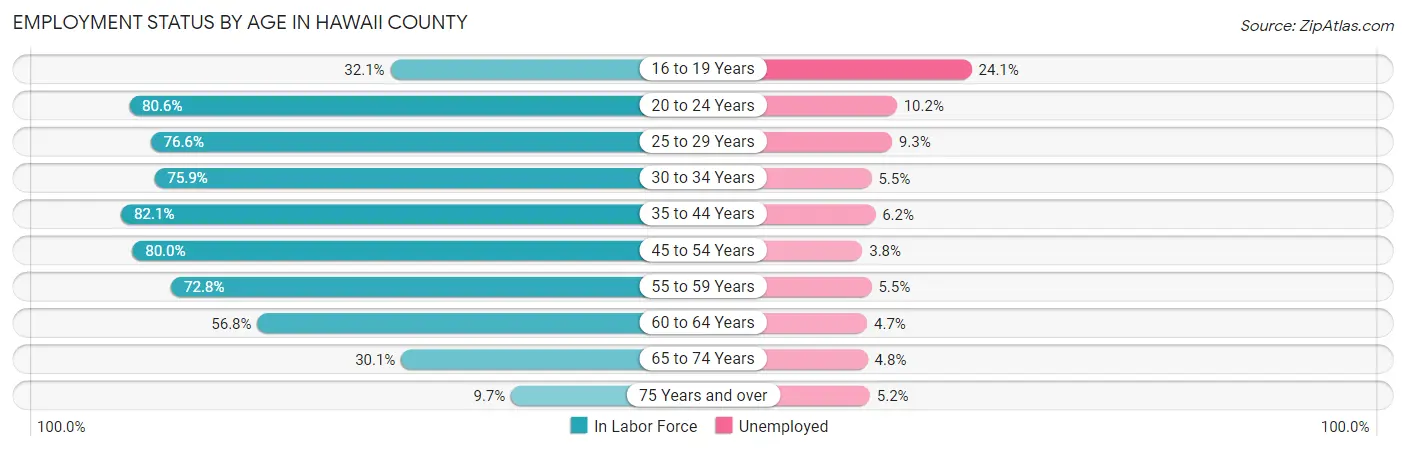
| Age Bracket | In Labor Force | Unemployed |
| 16 to 19 Years | 2,814 (32.1%) | 678 (24.1%) |
| 20 to 24 Years | 8,069 (80.6%) | 823 (10.2%) |
| 25 to 29 Years | 8,378 (76.6%) | 779 (9.3%) |
| 30 to 34 Years | 9,233 (75.9%) | 508 (5.5%) |
| 35 to 44 Years | 20,461 (82.1%) | 1,269 (6.2%) |
| 45 to 54 Years | 18,705 (80.0%) | 711 (3.8%) |
| 55 to 59 Years | 9,382 (72.8%) | 516 (5.5%) |
| 60 to 64 Years | 9,002 (56.8%) | 423 (4.7%) |
| 65 to 74 Years | 8,613 (30.1%) | 413 (4.8%) |
| 75 Years and over | 1,581 (9.7%) | 82 (5.2%) |
| Total | 96,331 (58.8%) | 6,262 (6.5%) |
Employment Status by Educational Attainment in Hawaii County
According to labor force statistics for Hawaii County, 75.1% of individuals (75,207) out of the total population between 25 and 64 years of age (100,142) are in the labor force, with 5.6% or 4,212 of them being unemployed. The group with the highest labor force participation rate are those with the educational attainment of bachelor's degree or higher, with 81.0% or 23,573 individuals in the labor force. Within the labor force, individuals with less than high school education have the highest percentage of unemployment, with 8.8% or 361 of them being unemployed.
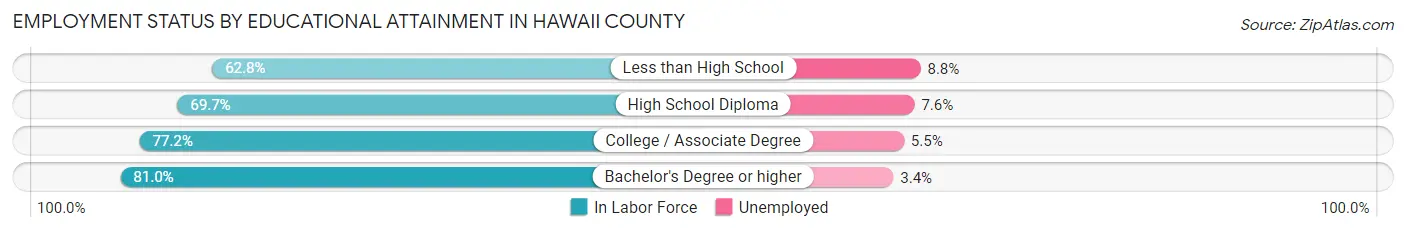
| Educational Attainment | In Labor Force | Unemployed |
| Less than High School | 4,105 (62.8%) | 575 (8.8%) |
| High School Diploma | 21,317 (69.7%) | 2,324 (7.6%) |
| College / Associate Degree | 26,185 (77.2%) | 1,866 (5.5%) |
| Bachelor's Degree or higher | 23,573 (81.0%) | 989 (3.4%) |
| Total | 75,207 (75.1%) | 5,608 (5.6%) |
Employment Occupations by Sex in Hawaii County
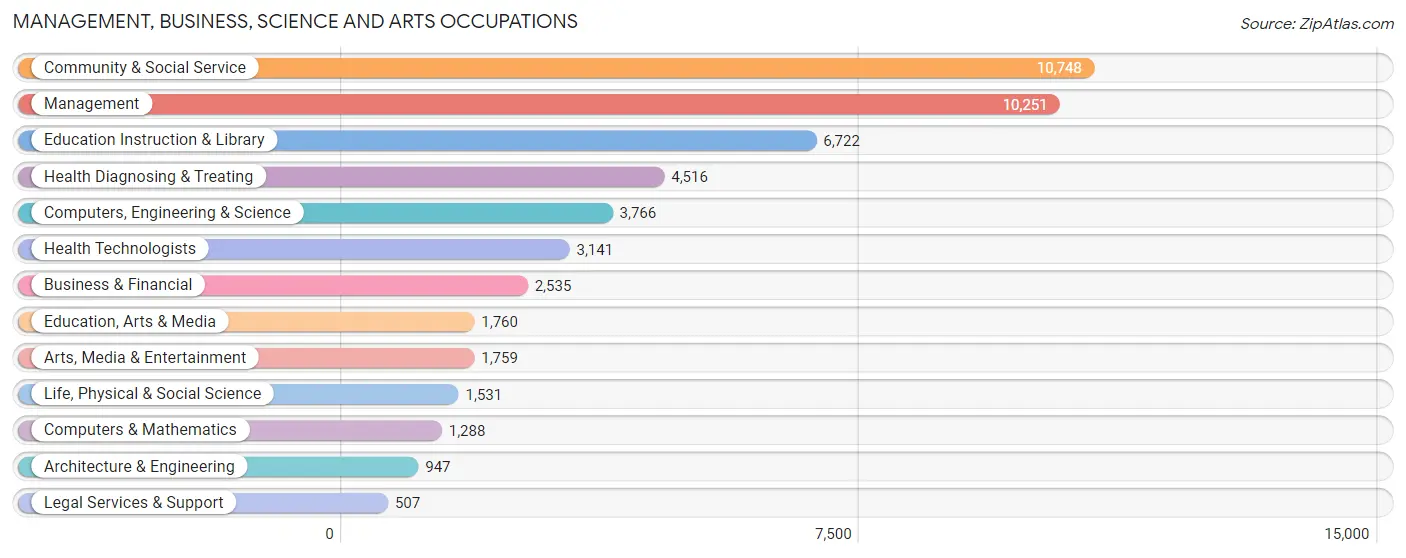
Management, Business, Science and Arts Occupations
The most common Management, Business, Science and Arts occupations in Hawaii County are Community & Social Service (10,748 | 12.0%), Management (10,251 | 11.4%), Education Instruction & Library (6,722 | 7.5%), Health Diagnosing & Treating (4,516 | 5.0%), and Computers, Engineering & Science (3,766 | 4.2%).
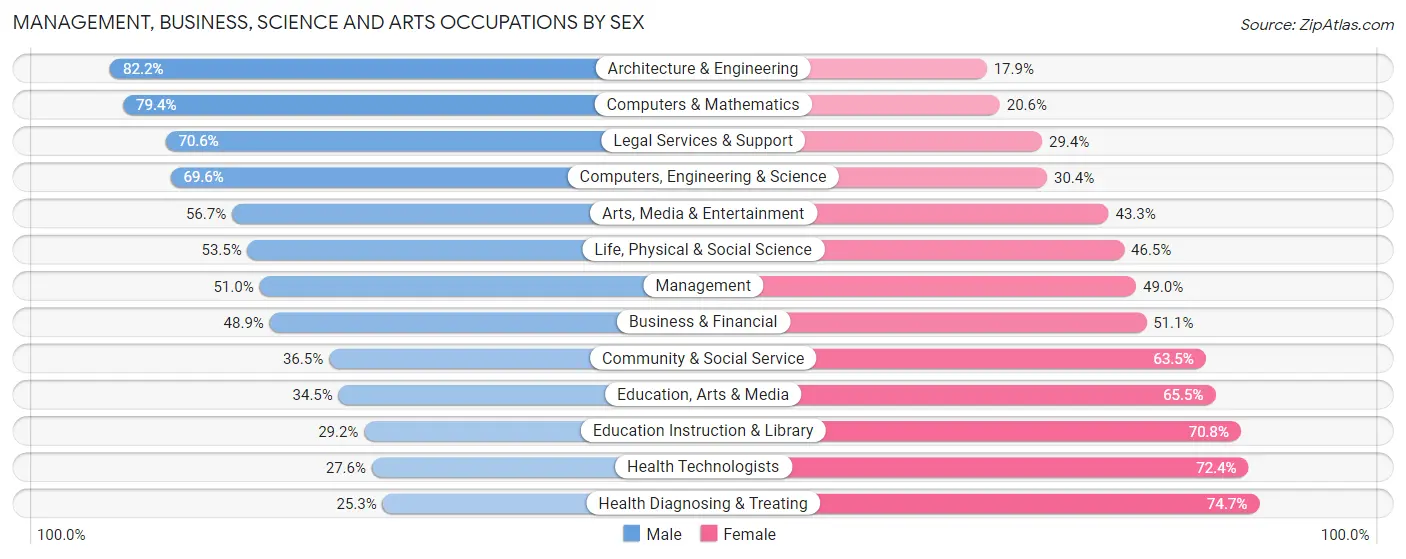
Management, Business, Science and Arts Occupations by Sex
Within the Management, Business, Science and Arts occupations in Hawaii County, the most male-oriented occupations are Architecture & Engineering (82.2%), Computers & Mathematics (79.4%), and Legal Services & Support (70.6%), while the most female-oriented occupations are Health Diagnosing & Treating (74.7%), Health Technologists (72.4%), and Education Instruction & Library (70.8%).
| Occupation | Male | Female |
| Management | 5,228 (51.0%) | 5,023 (49.0%) |
| Business & Financial | 1,239 (48.9%) | 1,296 (51.1%) |
| Computers, Engineering & Science | 2,620 (69.6%) | 1,146 (30.4%) |
| Computers & Mathematics | 1,023 (79.4%) | 265 (20.6%) |
| Architecture & Engineering | 778 (82.2%) | 169 (17.8%) |
| Life, Physical & Social Science | 819 (53.5%) | 712 (46.5%) |
| Community & Social Service | 3,923 (36.5%) | 6,825 (63.5%) |
| Education, Arts & Media | 607 (34.5%) | 1,153 (65.5%) |
| Legal Services & Support | 358 (70.6%) | 149 (29.4%) |
| Education Instruction & Library | 1,960 (29.2%) | 4,762 (70.8%) |
| Arts, Media & Entertainment | 998 (56.7%) | 761 (43.3%) |
| Health Diagnosing & Treating | 1,144 (25.3%) | 3,372 (74.7%) |
| Health Technologists | 866 (27.6%) | 2,275 (72.4%) |
| Total (Category) | 14,154 (44.5%) | 17,662 (55.5%) |
| Total (Overall) | 45,626 (50.9%) | 44,017 (49.1%) |
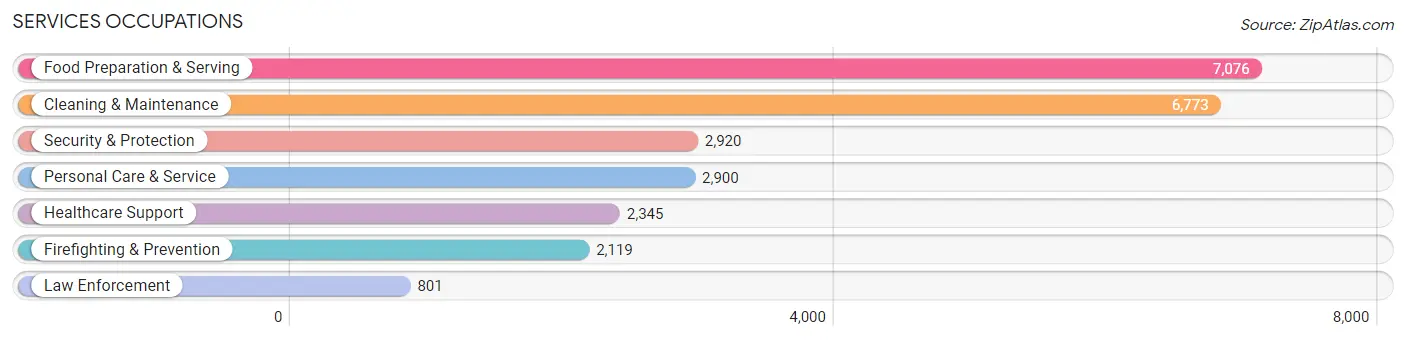
Services Occupations
The most common Services occupations in Hawaii County are Food Preparation & Serving (7,076 | 7.9%), Cleaning & Maintenance (6,773 | 7.6%), Security & Protection (2,920 | 3.3%), Personal Care & Service (2,900 | 3.2%), and Healthcare Support (2,345 | 2.6%).
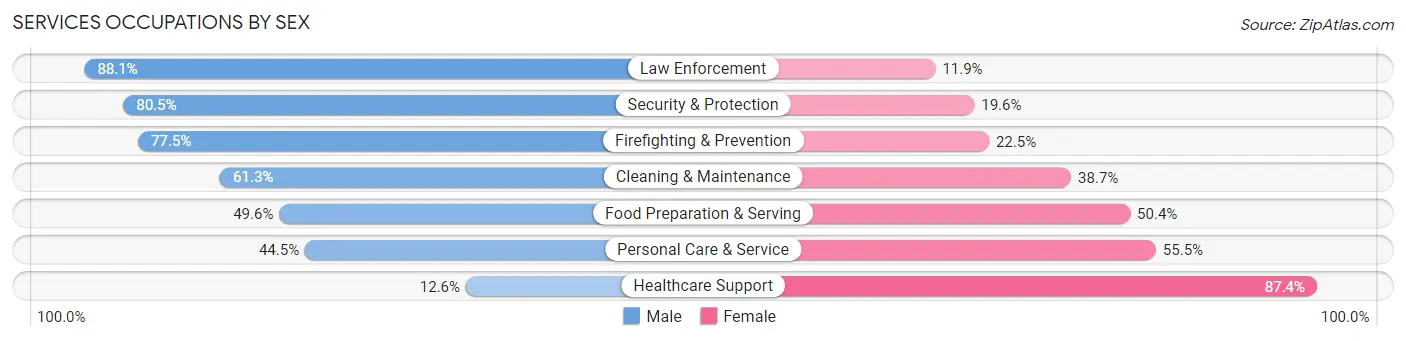
Services Occupations by Sex
Within the Services occupations in Hawaii County, the most male-oriented occupations are Law Enforcement (88.1%), Security & Protection (80.4%), and Firefighting & Prevention (77.5%), while the most female-oriented occupations are Healthcare Support (87.4%), Personal Care & Service (55.5%), and Food Preparation & Serving (50.4%).
| Occupation | Male | Female |
| Healthcare Support | 296 (12.6%) | 2,049 (87.4%) |
| Security & Protection | 2,349 (80.4%) | 571 (19.6%) |
| Firefighting & Prevention | 1,643 (77.5%) | 476 (22.5%) |
| Law Enforcement | 706 (88.1%) | 95 (11.9%) |
| Food Preparation & Serving | 3,508 (49.6%) | 3,568 (50.4%) |
| Cleaning & Maintenance | 4,150 (61.3%) | 2,623 (38.7%) |
| Personal Care & Service | 1,290 (44.5%) | 1,610 (55.5%) |
| Total (Category) | 11,593 (52.7%) | 10,421 (47.3%) |
| Total (Overall) | 45,626 (50.9%) | 44,017 (49.1%) |
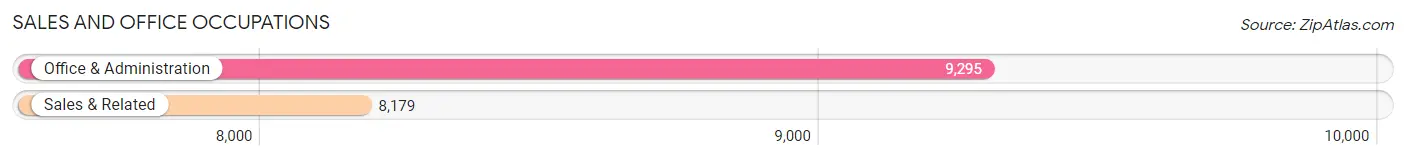
Sales and Office Occupations
The most common Sales and Office occupations in Hawaii County are Office & Administration (9,295 | 10.4%), and Sales & Related (8,179 | 9.1%).
Sales and Office Occupations by Sex
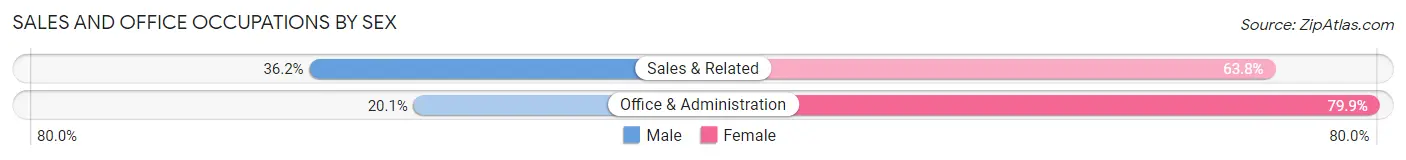
| Occupation | Male | Female |
| Sales & Related | 2,959 (36.2%) | 5,220 (63.8%) |
| Office & Administration | 1,872 (20.1%) | 7,423 (79.9%) |
| Total (Category) | 4,831 (27.7%) | 12,643 (72.4%) |
| Total (Overall) | 45,626 (50.9%) | 44,017 (49.1%) |
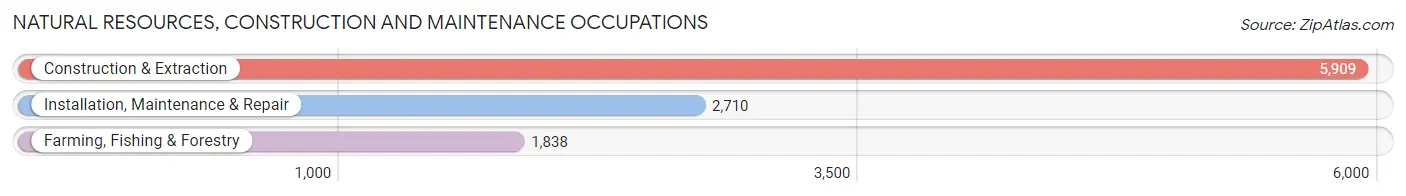
Natural Resources, Construction and Maintenance Occupations
The most common Natural Resources, Construction and Maintenance occupations in Hawaii County are Construction & Extraction (5,909 | 6.6%), Installation, Maintenance & Repair (2,710 | 3.0%), and Farming, Fishing & Forestry (1,838 | 2.1%).
Natural Resources, Construction and Maintenance Occupations by Sex
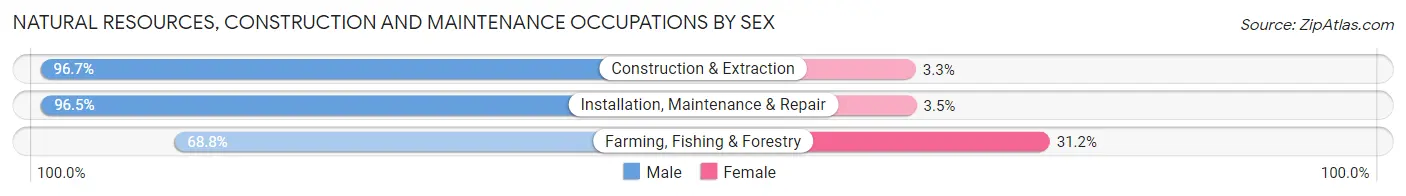
| Occupation | Male | Female |
| Farming, Fishing & Forestry | 1,265 (68.8%) | 573 (31.2%) |
| Construction & Extraction | 5,712 (96.7%) | 197 (3.3%) |
| Installation, Maintenance & Repair | 2,616 (96.5%) | 94 (3.5%) |
| Total (Category) | 9,593 (91.7%) | 864 (8.3%) |
| Total (Overall) | 45,626 (50.9%) | 44,017 (49.1%) |
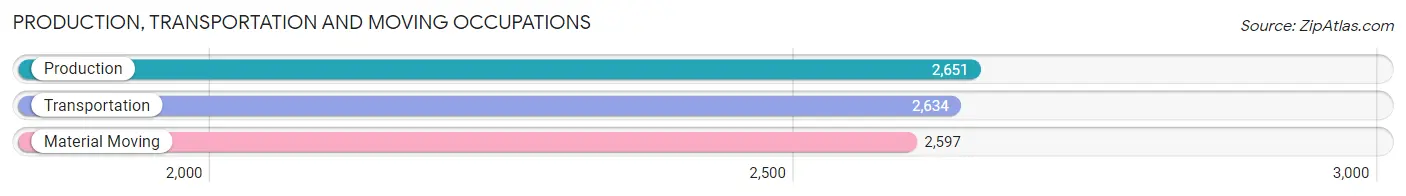
Production, Transportation and Moving Occupations
The most common Production, Transportation and Moving occupations in Hawaii County are Production (2,651 | 3.0%), Transportation (2,634 | 2.9%), and Material Moving (2,597 | 2.9%).
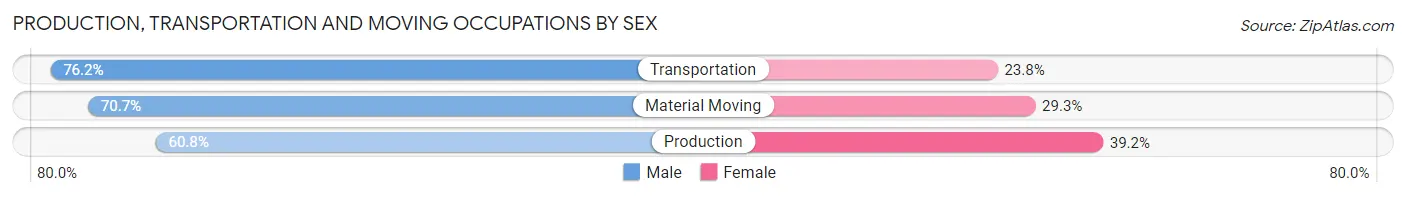
Production, Transportation and Moving Occupations by Sex
| Occupation | Male | Female |
| Production | 1,611 (60.8%) | 1,040 (39.2%) |
| Transportation | 2,008 (76.2%) | 626 (23.8%) |
| Material Moving | 1,836 (70.7%) | 761 (29.3%) |
| Total (Category) | 5,455 (69.2%) | 2,427 (30.8%) |
| Total (Overall) | 45,626 (50.9%) | 44,017 (49.1%) |
Employment Industries by Sex in Hawaii County
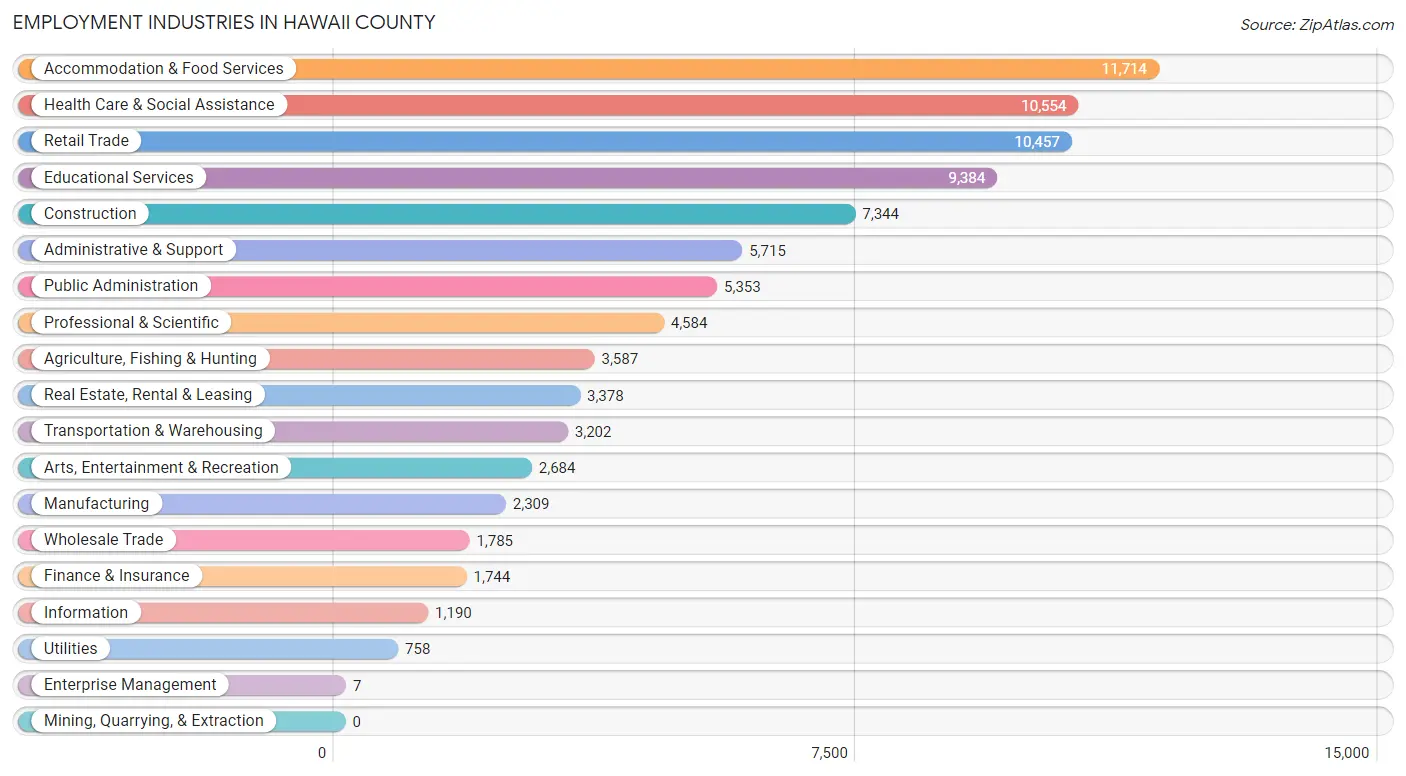
Employment Industries in Hawaii County
The major employment industries in Hawaii County include Accommodation & Food Services (11,714 | 13.1%), Health Care & Social Assistance (10,554 | 11.8%), Retail Trade (10,457 | 11.7%), Educational Services (9,384 | 10.5%), and Construction (7,344 | 8.2%).
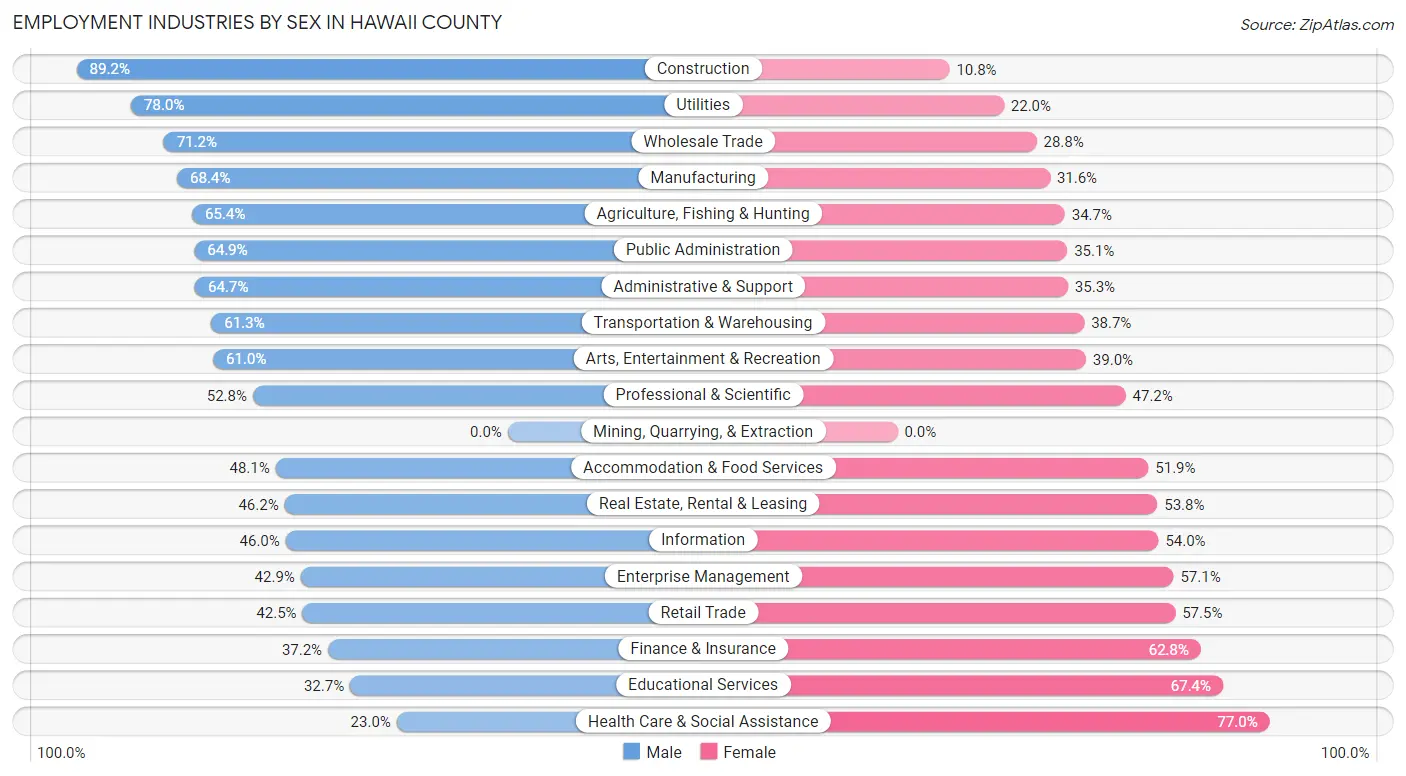
Employment Industries by Sex in Hawaii County
The Hawaii County industries that see more men than women are Construction (89.2%), Utilities (78.0%), and Wholesale Trade (71.2%), whereas the industries that tend to have a higher number of women are Health Care & Social Assistance (77.0%), Educational Services (67.3%), and Finance & Insurance (62.8%).
| Industry | Male | Female |
| Agriculture, Fishing & Hunting | 2,344 (65.3%) | 1,243 (34.6%) |
| Mining, Quarrying, & Extraction | 0 (0.0%) | 0 (0.0%) |
| Construction | 6,553 (89.2%) | 791 (10.8%) |
| Manufacturing | 1,580 (68.4%) | 729 (31.6%) |
| Wholesale Trade | 1,271 (71.2%) | 514 (28.8%) |
| Retail Trade | 4,444 (42.5%) | 6,013 (57.5%) |
| Transportation & Warehousing | 1,964 (61.3%) | 1,238 (38.7%) |
| Utilities | 591 (78.0%) | 167 (22.0%) |
| Information | 547 (46.0%) | 643 (54.0%) |
| Finance & Insurance | 649 (37.2%) | 1,095 (62.8%) |
| Real Estate, Rental & Leasing | 1,561 (46.2%) | 1,817 (53.8%) |
| Professional & Scientific | 2,419 (52.8%) | 2,165 (47.2%) |
| Enterprise Management | 3 (42.9%) | 4 (57.1%) |
| Administrative & Support | 3,698 (64.7%) | 2,017 (35.3%) |
| Educational Services | 3,064 (32.7%) | 6,320 (67.3%) |
| Health Care & Social Assistance | 2,426 (23.0%) | 8,128 (77.0%) |
| Arts, Entertainment & Recreation | 1,637 (61.0%) | 1,047 (39.0%) |
| Accommodation & Food Services | 5,630 (48.1%) | 6,084 (51.9%) |
| Public Administration | 3,472 (64.9%) | 1,881 (35.1%) |
| Total | 45,626 (50.9%) | 44,017 (49.1%) |
Education in Hawaii County
School Enrollment in Hawaii County
The most common levels of schooling among the 42,933 students in Hawaii County are elementary school (10,238 | 23.8%), middle school (9,628 | 22.4%), and high school (9,047 | 21.1%).
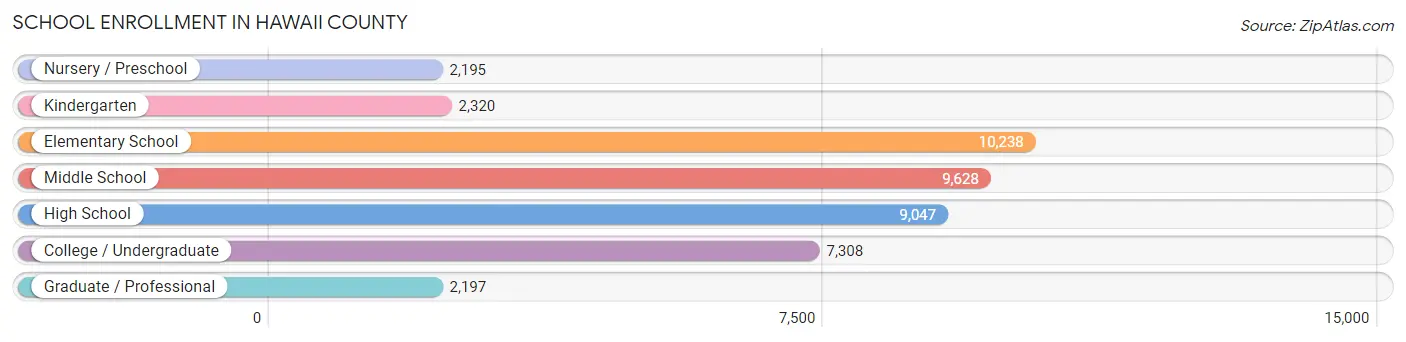
| School Level | # Students | % Students |
| Nursery / Preschool | 2,195 | 5.1% |
| Kindergarten | 2,320 | 5.4% |
| Elementary School | 10,238 | 23.8% |
| Middle School | 9,628 | 22.4% |
| High School | 9,047 | 21.1% |
| College / Undergraduate | 7,308 | 17.0% |
| Graduate / Professional | 2,197 | 5.1% |
| Total | 42,933 | 100.0% |
School Enrollment by Age by Funding Source in Hawaii County
Out of a total of 42,933 students who are enrolled in schools in Hawaii County, 8,200 (19.1%) attend a private institution, while the remaining 34,733 (80.9%) are enrolled in public schools. The age group of 3 to 4 year olds has the highest likelihood of being enrolled in private schools, with 1,021 (56.4% in the age bracket) enrolled. Conversely, the age group of 20 to 24 year olds has the lowest likelihood of being enrolled in a private school, with 2,545 (89.4% in the age bracket) attending a public institution.
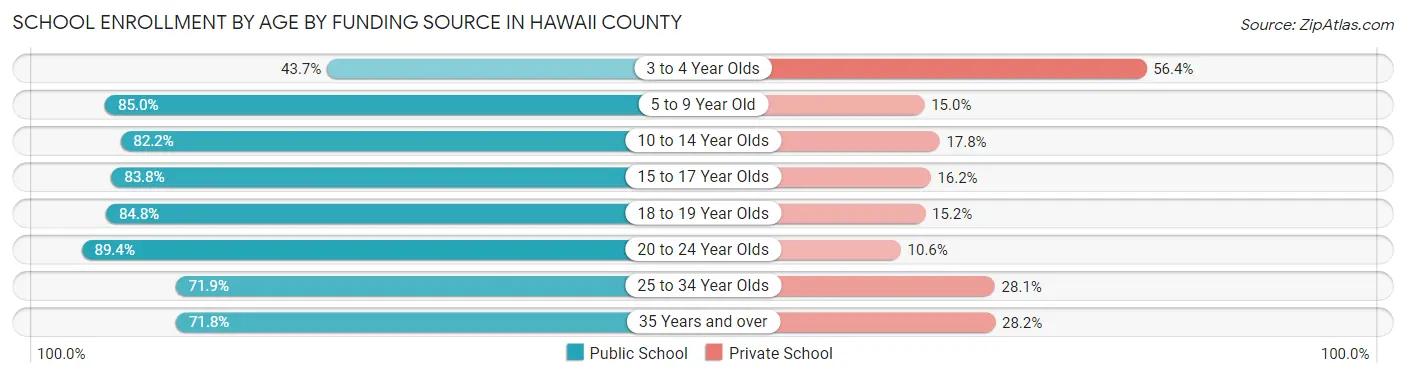
| Age Bracket | Public School | Private School |
| 3 to 4 Year Olds | 791 (43.6%) | 1,021 (56.4%) |
| 5 to 9 Year Old | 9,651 (85.0%) | 1,704 (15.0%) |
| 10 to 14 Year Olds | 10,185 (82.2%) | 2,212 (17.8%) |
| 15 to 17 Year Olds | 5,495 (83.8%) | 1,059 (16.2%) |
| 18 to 19 Year Olds | 2,116 (84.8%) | 378 (15.2%) |
| 20 to 24 Year Olds | 2,545 (89.4%) | 302 (10.6%) |
| 25 to 34 Year Olds | 1,442 (71.9%) | 564 (28.1%) |
| 35 Years and over | 2,490 (71.8%) | 978 (28.2%) |
| Total | 34,733 (80.9%) | 8,200 (19.1%) |
Educational Attainment by Field of Study in Hawaii County
Social sciences (6,514 | 13.5%), business (6,317 | 13.1%), education (5,658 | 11.7%), bio, nature & agricultural (4,649 | 9.7%), and science & technology (4,357 | 9.0%) are the most common fields of study among 48,160 individuals in Hawaii County who have obtained a bachelor's degree or higher.
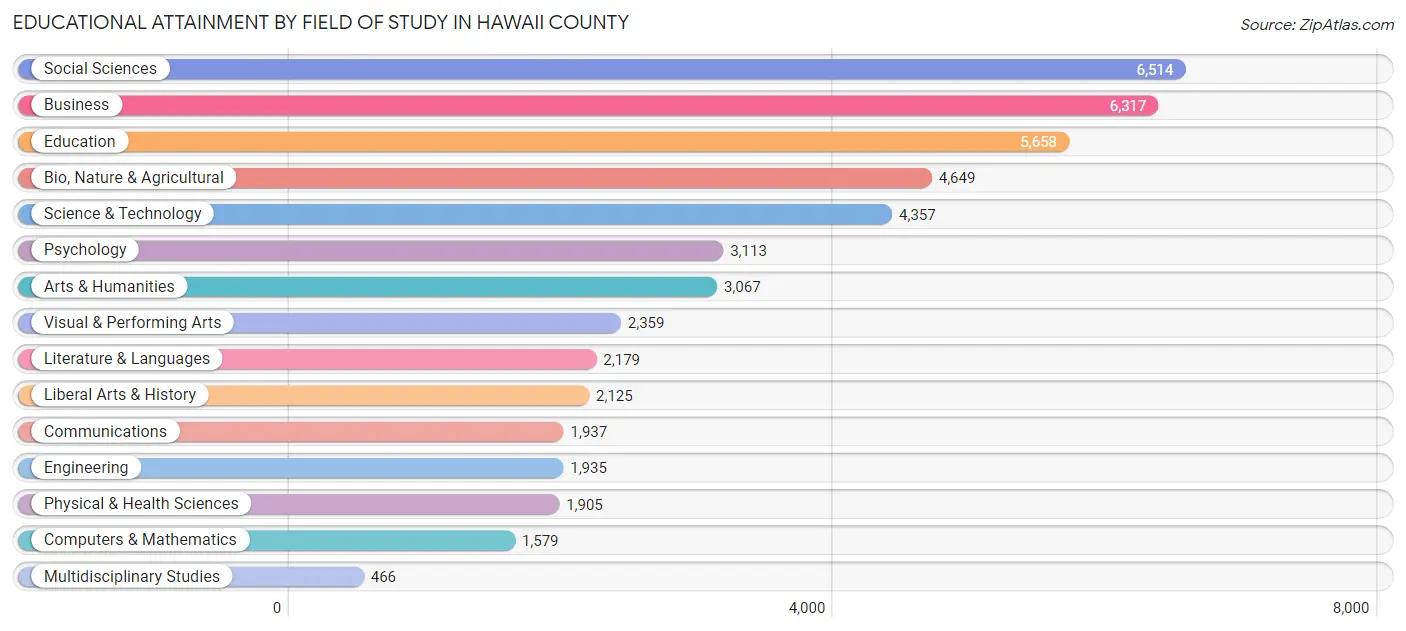
| Field of Study | # Graduates | % Graduates |
| Computers & Mathematics | 1,579 | 3.3% |
| Bio, Nature & Agricultural | 4,649 | 9.7% |
| Physical & Health Sciences | 1,905 | 4.0% |
| Psychology | 3,113 | 6.5% |
| Social Sciences | 6,514 | 13.5% |
| Engineering | 1,935 | 4.0% |
| Multidisciplinary Studies | 466 | 1.0% |
| Science & Technology | 4,357 | 9.0% |
| Business | 6,317 | 13.1% |
| Education | 5,658 | 11.7% |
| Literature & Languages | 2,179 | 4.5% |
| Liberal Arts & History | 2,125 | 4.4% |
| Visual & Performing Arts | 2,359 | 4.9% |
| Communications | 1,937 | 4.0% |
| Arts & Humanities | 3,067 | 6.4% |
| Total | 48,160 | 100.0% |
Transportation & Commute in Hawaii County
Vehicle Availability by Sex in Hawaii County
The most prevalent vehicle ownership categories in Hawaii County are males with 2 vehicles (15,757, accounting for 35.3%) and females with 2 vehicles (15,041, making up 37.3%).
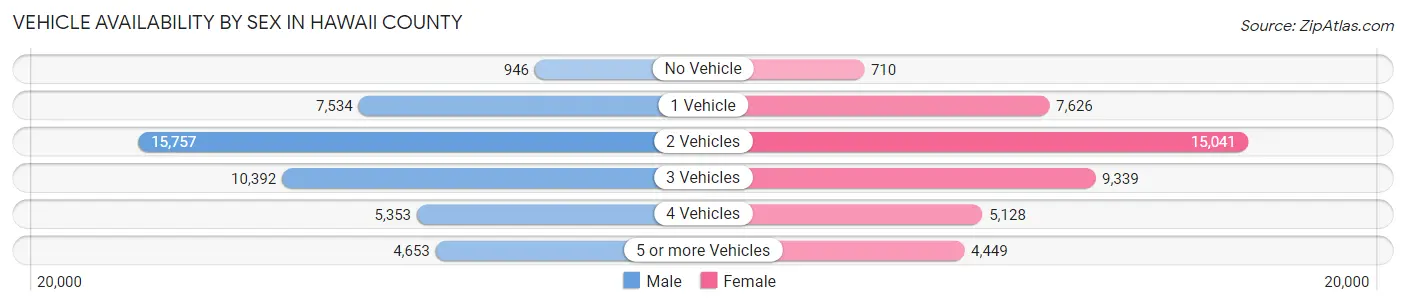
| Vehicles Available | Male | Female |
| No Vehicle | 946 (2.1%) | 710 (1.7%) |
| 1 Vehicle | 7,534 (16.9%) | 7,626 (18.0%) |
| 2 Vehicles | 15,757 (35.3%) | 15,041 (35.6%) |
| 3 Vehicles | 10,392 (23.3%) | 9,339 (22.1%) |
| 4 Vehicles | 5,353 (12.0%) | 5,128 (12.1%) |
| 5 or more Vehicles | 4,653 (10.4%) | 4,449 (10.5%) |
| Total | 44,635 (100.0%) | 42,293 (100.0%) |
Commute Time in Hawaii County
The most frequently occuring commute durations in Hawaii County are 10 to 14 minutes (12,263 commuters, 15.7%), 15 to 19 minutes (12,224 commuters, 15.6%), and 30 to 34 minutes (10,509 commuters, 13.4%).
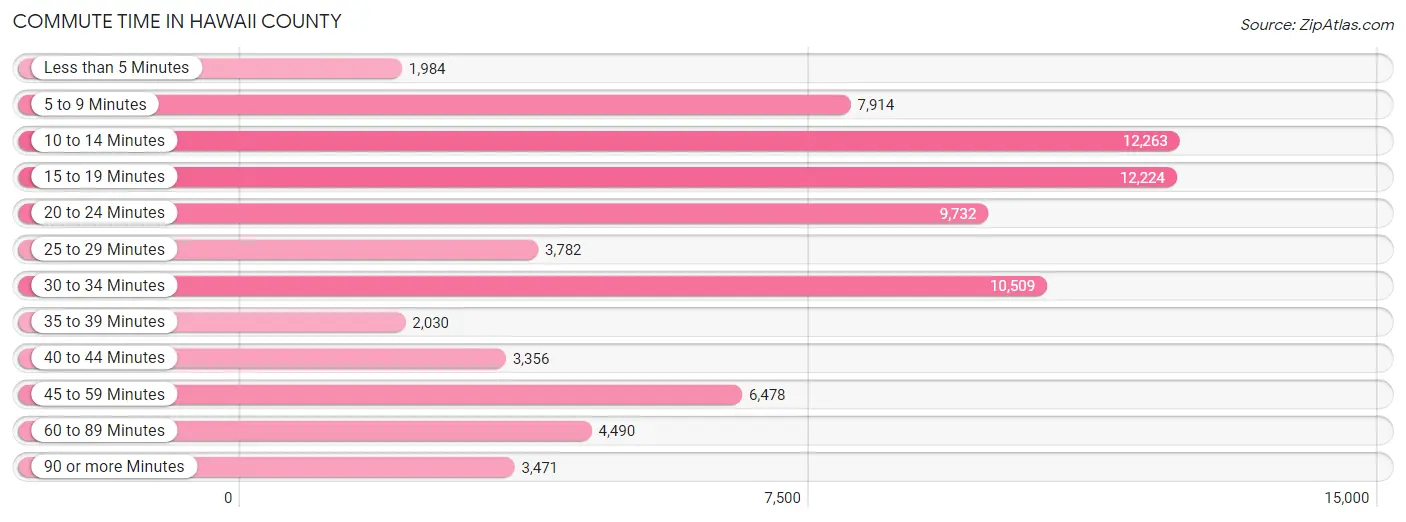
| Commute Time | # Commuters | % Commuters |
| Less than 5 Minutes | 1,984 | 2.5% |
| 5 to 9 Minutes | 7,914 | 10.1% |
| 10 to 14 Minutes | 12,263 | 15.7% |
| 15 to 19 Minutes | 12,224 | 15.6% |
| 20 to 24 Minutes | 9,732 | 12.4% |
| 25 to 29 Minutes | 3,782 | 4.8% |
| 30 to 34 Minutes | 10,509 | 13.4% |
| 35 to 39 Minutes | 2,030 | 2.6% |
| 40 to 44 Minutes | 3,356 | 4.3% |
| 45 to 59 Minutes | 6,478 | 8.3% |
| 60 to 89 Minutes | 4,490 | 5.7% |
| 90 or more Minutes | 3,471 | 4.4% |
Commute Time by Sex in Hawaii County
The most common commute times in Hawaii County are 15 to 19 minutes (6,458 commuters, 16.1%) for males and 10 to 14 minutes (6,400 commuters, 16.8%) for females.
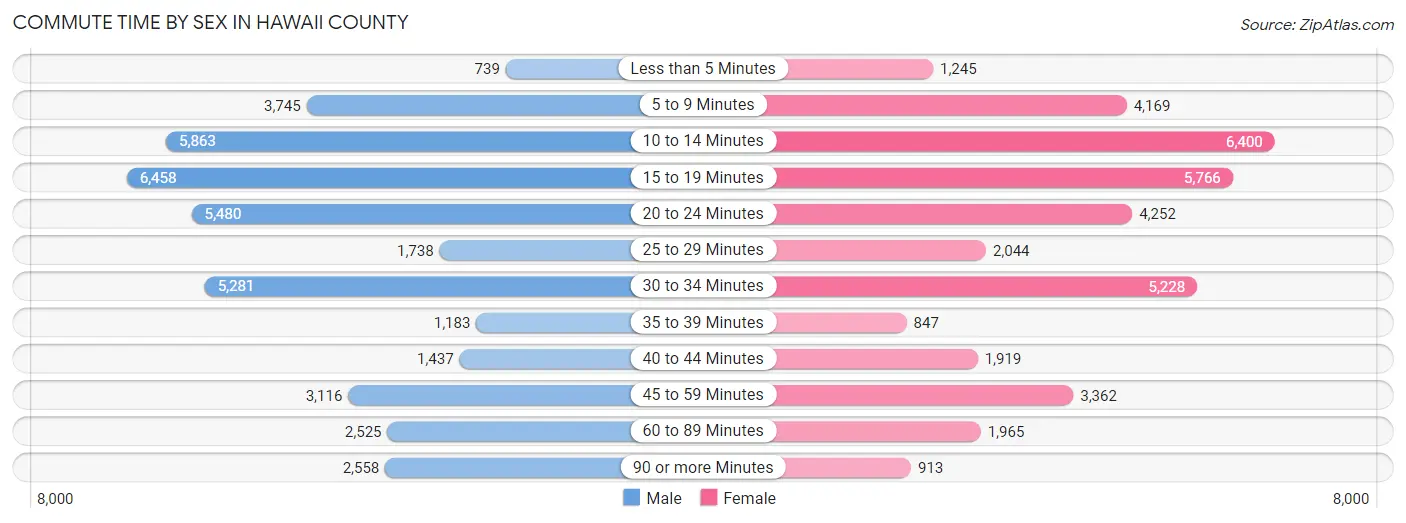
| Commute Time | Male | Female |
| Less than 5 Minutes | 739 (1.8%) | 1,245 (3.3%) |
| 5 to 9 Minutes | 3,745 (9.3%) | 4,169 (10.9%) |
| 10 to 14 Minutes | 5,863 (14.6%) | 6,400 (16.8%) |
| 15 to 19 Minutes | 6,458 (16.1%) | 5,766 (15.1%) |
| 20 to 24 Minutes | 5,480 (13.7%) | 4,252 (11.2%) |
| 25 to 29 Minutes | 1,738 (4.3%) | 2,044 (5.4%) |
| 30 to 34 Minutes | 5,281 (13.2%) | 5,228 (13.7%) |
| 35 to 39 Minutes | 1,183 (2.9%) | 847 (2.2%) |
| 40 to 44 Minutes | 1,437 (3.6%) | 1,919 (5.0%) |
| 45 to 59 Minutes | 3,116 (7.8%) | 3,362 (8.8%) |
| 60 to 89 Minutes | 2,525 (6.3%) | 1,965 (5.2%) |
| 90 or more Minutes | 2,558 (6.4%) | 913 (2.4%) |
Time of Departure to Work by Sex in Hawaii County
The most frequent times of departure to work in Hawaii County are 7:00 AM to 7:29 AM (5,745, 14.3%) for males and 7:00 AM to 7:29 AM (6,321, 16.6%) for females.
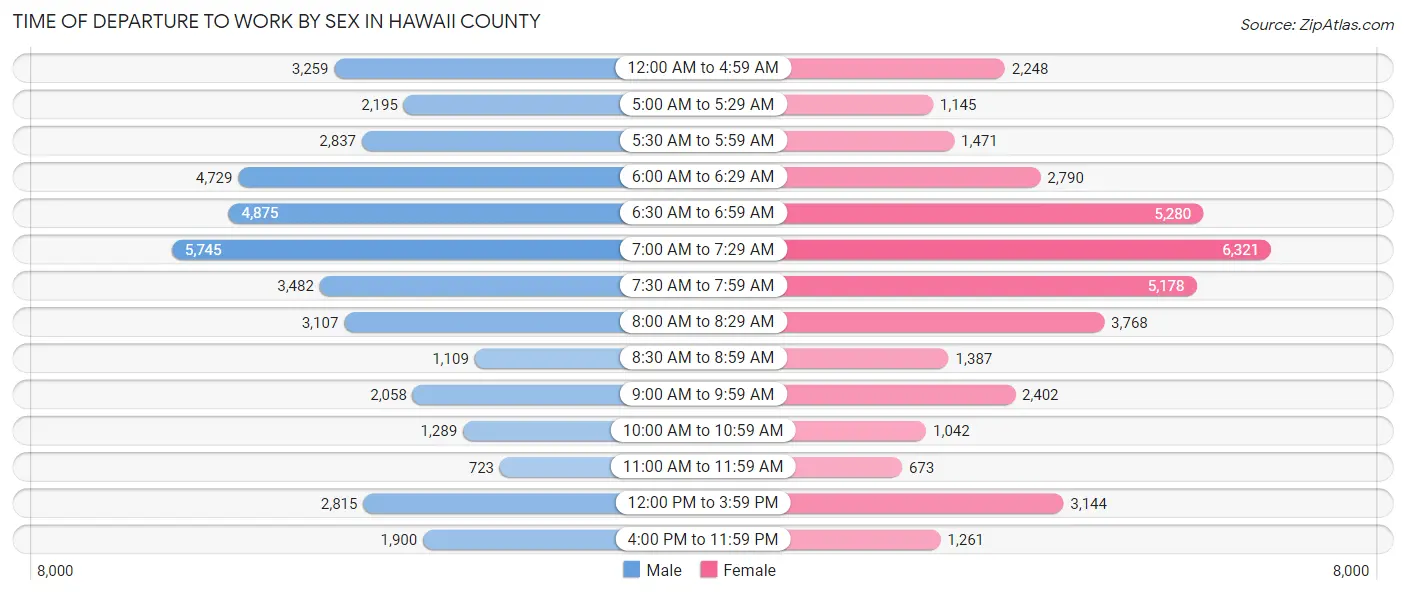
| Time of Departure | Male | Female |
| 12:00 AM to 4:59 AM | 3,259 (8.1%) | 2,248 (5.9%) |
| 5:00 AM to 5:29 AM | 2,195 (5.5%) | 1,145 (3.0%) |
| 5:30 AM to 5:59 AM | 2,837 (7.1%) | 1,471 (3.9%) |
| 6:00 AM to 6:29 AM | 4,729 (11.8%) | 2,790 (7.3%) |
| 6:30 AM to 6:59 AM | 4,875 (12.1%) | 5,280 (13.9%) |
| 7:00 AM to 7:29 AM | 5,745 (14.3%) | 6,321 (16.6%) |
| 7:30 AM to 7:59 AM | 3,482 (8.7%) | 5,178 (13.6%) |
| 8:00 AM to 8:29 AM | 3,107 (7.7%) | 3,768 (9.9%) |
| 8:30 AM to 8:59 AM | 1,109 (2.8%) | 1,387 (3.6%) |
| 9:00 AM to 9:59 AM | 2,058 (5.1%) | 2,402 (6.3%) |
| 10:00 AM to 10:59 AM | 1,289 (3.2%) | 1,042 (2.7%) |
| 11:00 AM to 11:59 AM | 723 (1.8%) | 673 (1.8%) |
| 12:00 PM to 3:59 PM | 2,815 (7.0%) | 3,144 (8.3%) |
| 4:00 PM to 11:59 PM | 1,900 (4.7%) | 1,261 (3.3%) |
| Total | 40,123 (100.0%) | 38,110 (100.0%) |
Housing Occupancy in Hawaii County
Occupancy by Ownership in Hawaii County
Of the total 72,468 dwellings in Hawaii County, owner-occupied units account for 51,778 (71.5%), while renter-occupied units make up 20,690 (28.5%).
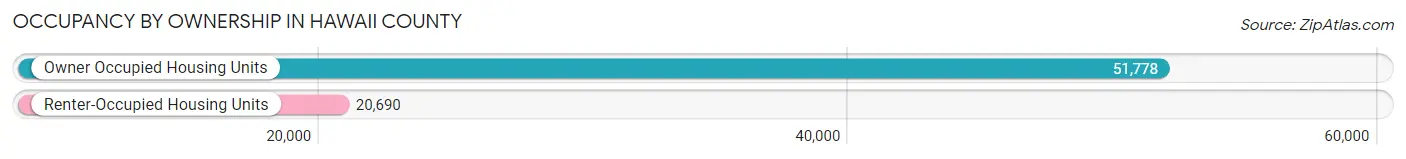
| Occupancy | # Housing Units | % Housing Units |
| Owner Occupied Housing Units | 51,778 | 71.5% |
| Renter-Occupied Housing Units | 20,690 | 28.5% |
| Total Occupied Housing Units | 72,468 | 100.0% |
Occupancy by Household Size in Hawaii County
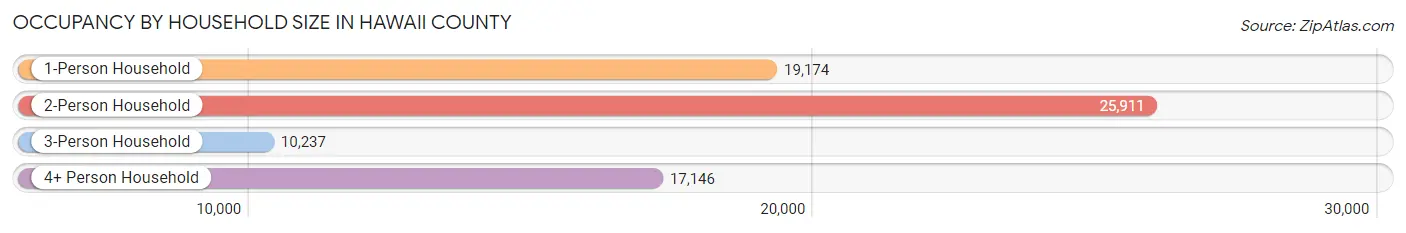
| Household Size | # Housing Units | % Housing Units |
| 1-Person Household | 19,174 | 26.5% |
| 2-Person Household | 25,911 | 35.8% |
| 3-Person Household | 10,237 | 14.1% |
| 4+ Person Household | 17,146 | 23.7% |
| Total Housing Units | 72,468 | 100.0% |
Occupancy by Ownership by Household Size in Hawaii County
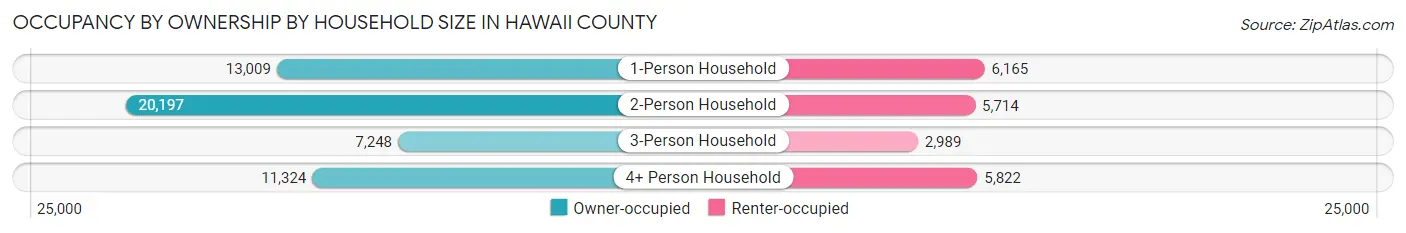
| Household Size | Owner-occupied | Renter-occupied |
| 1-Person Household | 13,009 (67.8%) | 6,165 (32.2%) |
| 2-Person Household | 20,197 (77.9%) | 5,714 (22.1%) |
| 3-Person Household | 7,248 (70.8%) | 2,989 (29.2%) |
| 4+ Person Household | 11,324 (66.0%) | 5,822 (34.0%) |
| Total Housing Units | 51,778 (71.5%) | 20,690 (28.5%) |
Occupancy by Educational Attainment in Hawaii County
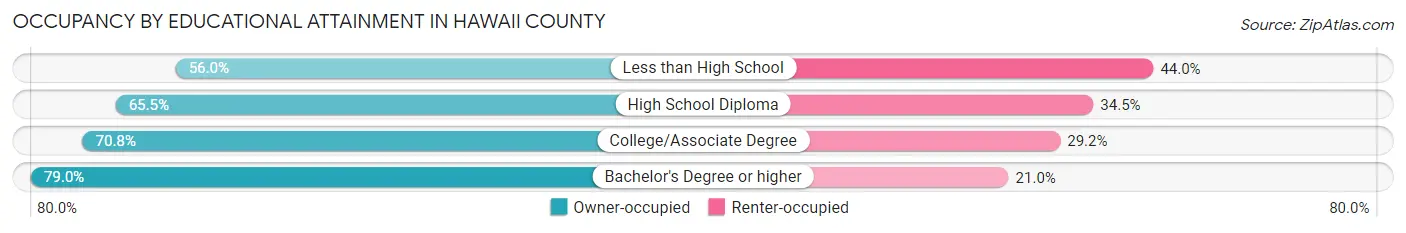
| Household Size | Owner-occupied | Renter-occupied |
| Less than High School | 2,384 (56.0%) | 1,872 (44.0%) |
| High School Diploma | 11,821 (65.5%) | 6,215 (34.5%) |
| College/Associate Degree | 17,801 (70.8%) | 7,345 (29.2%) |
| Bachelor's Degree or higher | 19,772 (79.0%) | 5,258 (21.0%) |
Occupancy by Age of Householder in Hawaii County
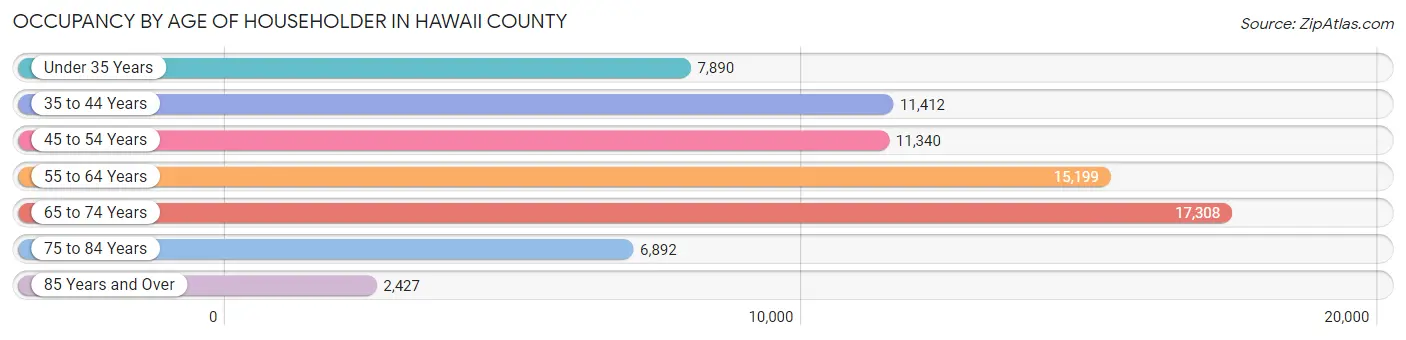
| Age Bracket | # Households | % Households |
| Under 35 Years | 7,890 | 10.9% |
| 35 to 44 Years | 11,412 | 15.8% |
| 45 to 54 Years | 11,340 | 15.7% |
| 55 to 64 Years | 15,199 | 21.0% |
| 65 to 74 Years | 17,308 | 23.9% |
| 75 to 84 Years | 6,892 | 9.5% |
| 85 Years and Over | 2,427 | 3.4% |
| Total | 72,468 | 100.0% |
Housing Finances in Hawaii County
Median Income by Occupancy in Hawaii County
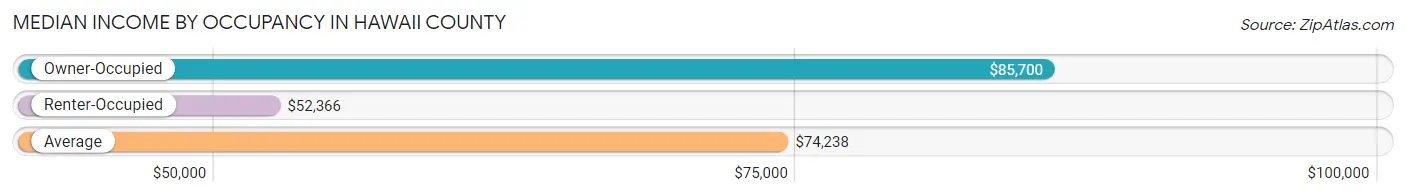
| Occupancy Type | # Households | Median Income |
| Owner-Occupied | 51,778 (71.5%) | $85,700 |
| Renter-Occupied | 20,690 (28.5%) | $52,366 |
| Average | 72,468 (100.0%) | $74,238 |
Occupancy by Householder Income Bracket in Hawaii County
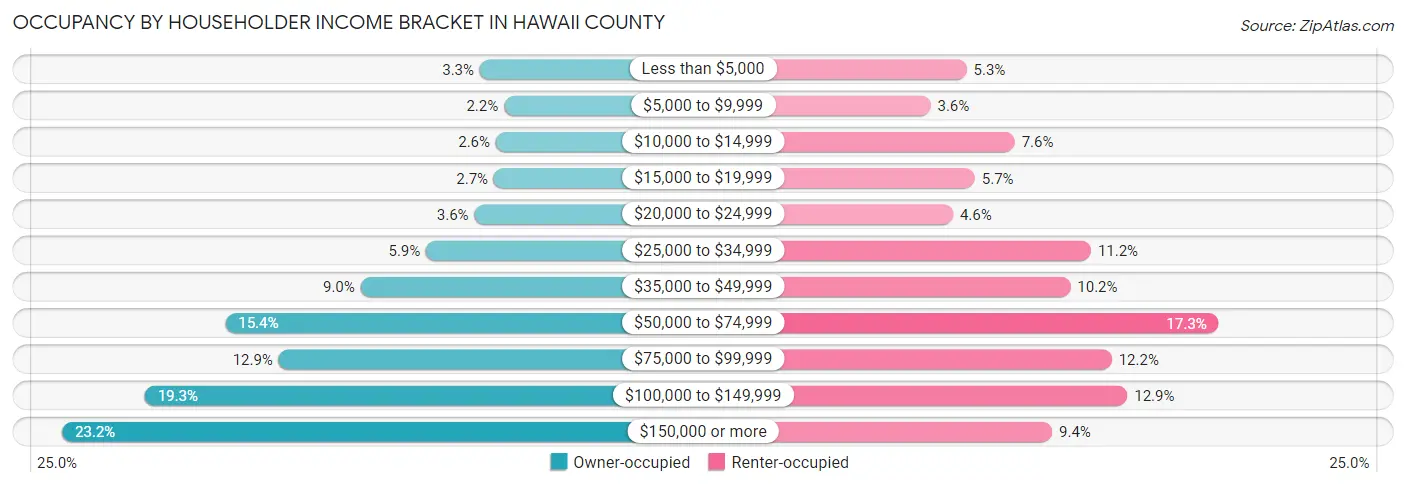
| Income Bracket | Owner-occupied | Renter-occupied |
| Less than $5,000 | 1,721 (3.3%) | 1,095 (5.3%) |
| $5,000 to $9,999 | 1,125 (2.2%) | 738 (3.6%) |
| $10,000 to $14,999 | 1,324 (2.6%) | 1,569 (7.6%) |
| $15,000 to $19,999 | 1,371 (2.6%) | 1,175 (5.7%) |
| $20,000 to $24,999 | 1,854 (3.6%) | 961 (4.6%) |
| $25,000 to $34,999 | 3,043 (5.9%) | 2,319 (11.2%) |
| $35,000 to $49,999 | 4,660 (9.0%) | 2,117 (10.2%) |
| $50,000 to $74,999 | 7,993 (15.4%) | 3,577 (17.3%) |
| $75,000 to $99,999 | 6,677 (12.9%) | 2,524 (12.2%) |
| $100,000 to $149,999 | 9,985 (19.3%) | 2,678 (12.9%) |
| $150,000 or more | 12,025 (23.2%) | 1,937 (9.4%) |
| Total | 51,778 (100.0%) | 20,690 (100.0%) |
Monthly Housing Cost Tiers in Hawaii County
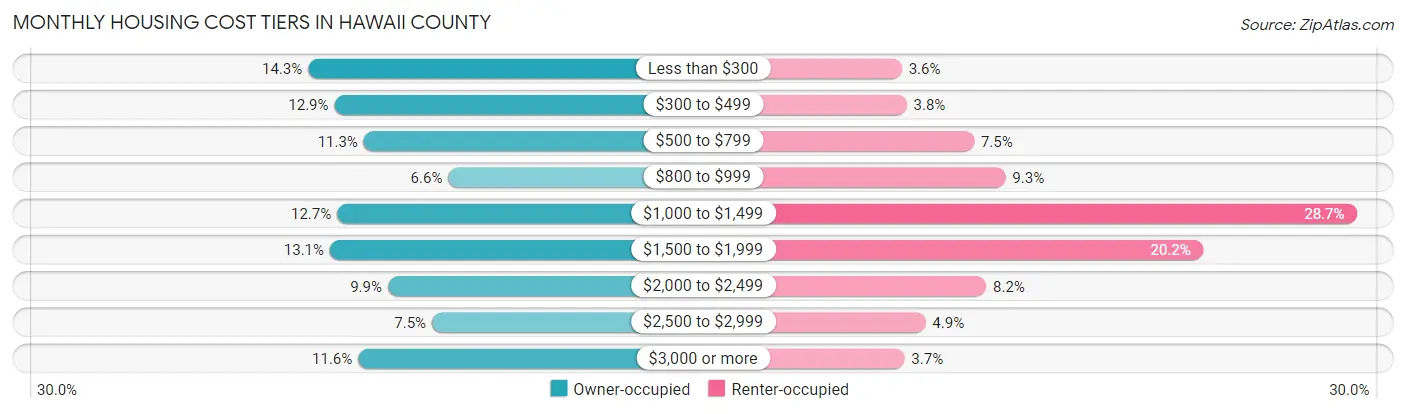
| Monthly Cost | Owner-occupied | Renter-occupied |
| Less than $300 | 7,423 (14.3%) | 735 (3.5%) |
| $300 to $499 | 6,675 (12.9%) | 790 (3.8%) |
| $500 to $799 | 5,833 (11.3%) | 1,561 (7.5%) |
| $800 to $999 | 3,419 (6.6%) | 1,921 (9.3%) |
| $1,000 to $1,499 | 6,595 (12.7%) | 5,929 (28.7%) |
| $1,500 to $1,999 | 6,806 (13.1%) | 4,173 (20.2%) |
| $2,000 to $2,499 | 5,149 (9.9%) | 1,699 (8.2%) |
| $2,500 to $2,999 | 3,883 (7.5%) | 1,005 (4.9%) |
| $3,000 or more | 5,995 (11.6%) | 765 (3.7%) |
| Total | 51,778 (100.0%) | 20,690 (100.0%) |
Physical Housing Characteristics in Hawaii County
Housing Structures in Hawaii County
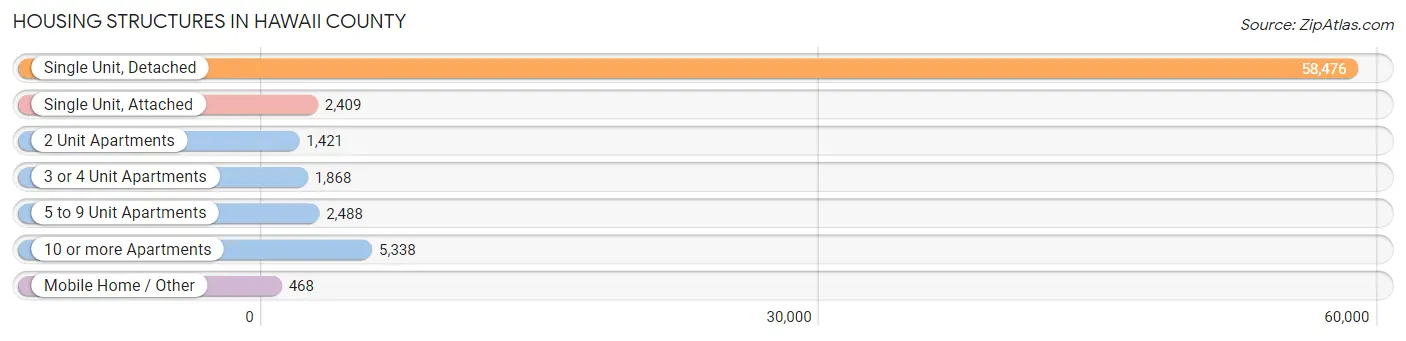
| Structure Type | # Housing Units | % Housing Units |
| Single Unit, Detached | 58,476 | 80.7% |
| Single Unit, Attached | 2,409 | 3.3% |
| 2 Unit Apartments | 1,421 | 2.0% |
| 3 or 4 Unit Apartments | 1,868 | 2.6% |
| 5 to 9 Unit Apartments | 2,488 | 3.4% |
| 10 or more Apartments | 5,338 | 7.4% |
| Mobile Home / Other | 468 | 0.6% |
| Total | 72,468 | 100.0% |
Housing Structures by Occupancy in Hawaii County
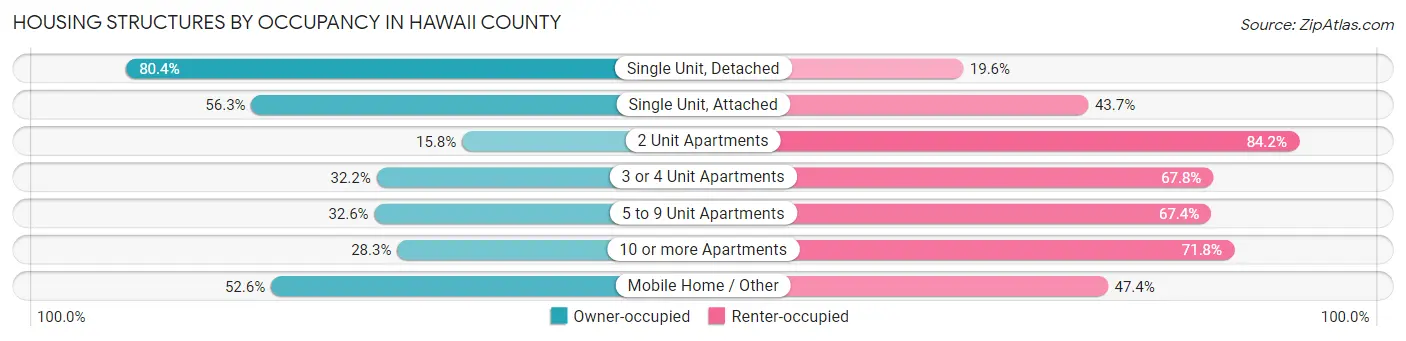
| Structure Type | Owner-occupied | Renter-occupied |
| Single Unit, Detached | 47,029 (80.4%) | 11,447 (19.6%) |
| Single Unit, Attached | 1,357 (56.3%) | 1,052 (43.7%) |
| 2 Unit Apartments | 224 (15.8%) | 1,197 (84.2%) |
| 3 or 4 Unit Apartments | 602 (32.2%) | 1,266 (67.8%) |
| 5 to 9 Unit Apartments | 812 (32.6%) | 1,676 (67.4%) |
| 10 or more Apartments | 1,508 (28.2%) | 3,830 (71.8%) |
| Mobile Home / Other | 246 (52.6%) | 222 (47.4%) |
| Total | 51,778 (71.5%) | 20,690 (28.5%) |
Housing Structures by Number of Rooms in Hawaii County
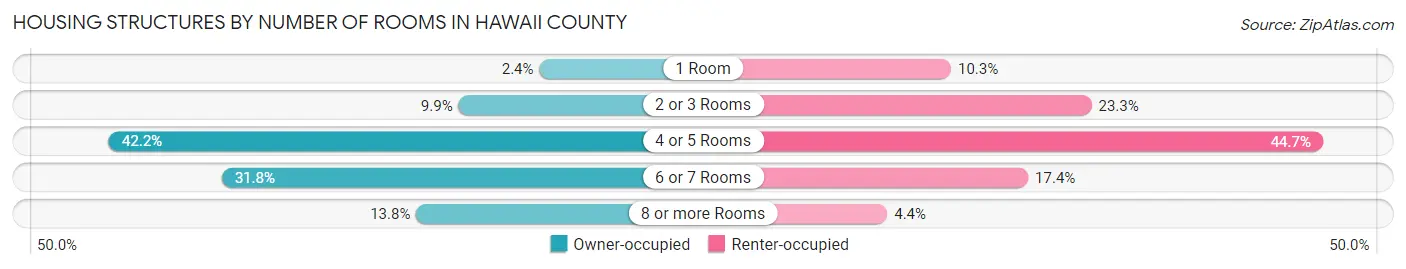
| Number of Rooms | Owner-occupied | Renter-occupied |
| 1 Room | 1,235 (2.4%) | 2,127 (10.3%) |
| 2 or 3 Rooms | 5,110 (9.9%) | 4,815 (23.3%) |
| 4 or 5 Rooms | 21,848 (42.2%) | 9,238 (44.7%) |
| 6 or 7 Rooms | 16,448 (31.8%) | 3,603 (17.4%) |
| 8 or more Rooms | 7,137 (13.8%) | 907 (4.4%) |
| Total | 51,778 (100.0%) | 20,690 (100.0%) |
Housing Structure by Heating Type in Hawaii County
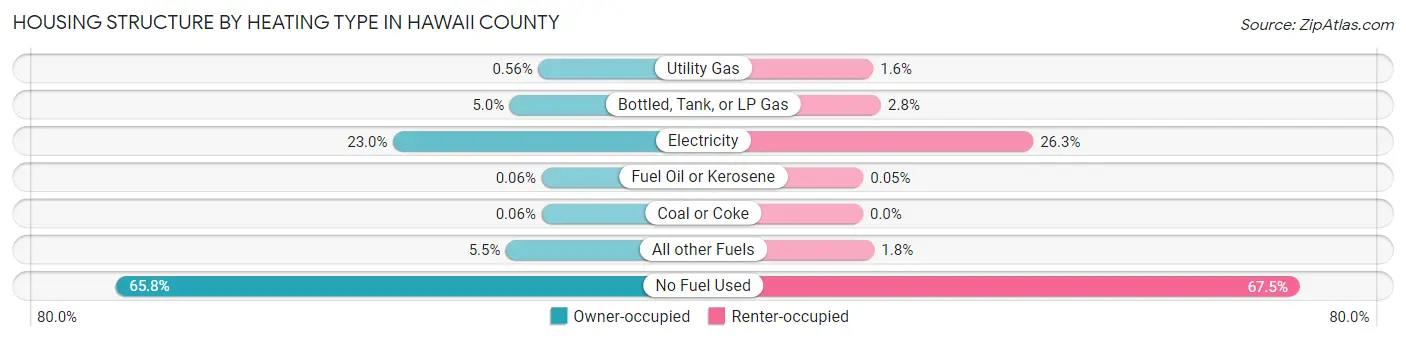
| Heating Type | Owner-occupied | Renter-occupied |
| Utility Gas | 288 (0.6%) | 326 (1.6%) |
| Bottled, Tank, or LP Gas | 2,566 (5.0%) | 580 (2.8%) |
| Electricity | 11,908 (23.0%) | 5,443 (26.3%) |
| Fuel Oil or Kerosene | 33 (0.1%) | 11 (0.1%) |
| Coal or Coke | 31 (0.1%) | 0 (0.0%) |
| All other Fuels | 2,871 (5.5%) | 365 (1.8%) |
| No Fuel Used | 34,081 (65.8%) | 13,965 (67.5%) |
| Total | 51,778 (100.0%) | 20,690 (100.0%) |
Household Vehicle Usage in Hawaii County
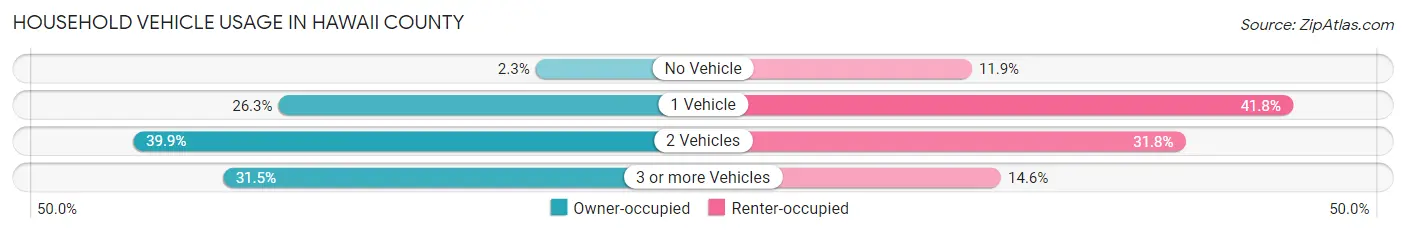
| Vehicles per Household | Owner-occupied | Renter-occupied |
| No Vehicle | 1,194 (2.3%) | 2,453 (11.9%) |
| 1 Vehicle | 13,630 (26.3%) | 8,648 (41.8%) |
| 2 Vehicles | 20,642 (39.9%) | 6,573 (31.8%) |
| 3 or more Vehicles | 16,312 (31.5%) | 3,016 (14.6%) |
| Total | 51,778 (100.0%) | 20,690 (100.0%) |
Real Estate & Mortgages in Hawaii County
Real Estate and Mortgage Overview in Hawaii County
| Characteristic | Without Mortgage | With Mortgage |
| Housing Units | 22,401 | 29,377 |
| Median Property Value | $393,700 | $490,200 |
| Median Household Income | $62,433 | $7,958 |
| Monthly Housing Costs | $411 | $5,917 |
| Real Estate Taxes | $999 | $1,217 |
Property Value by Mortgage Status in Hawaii County
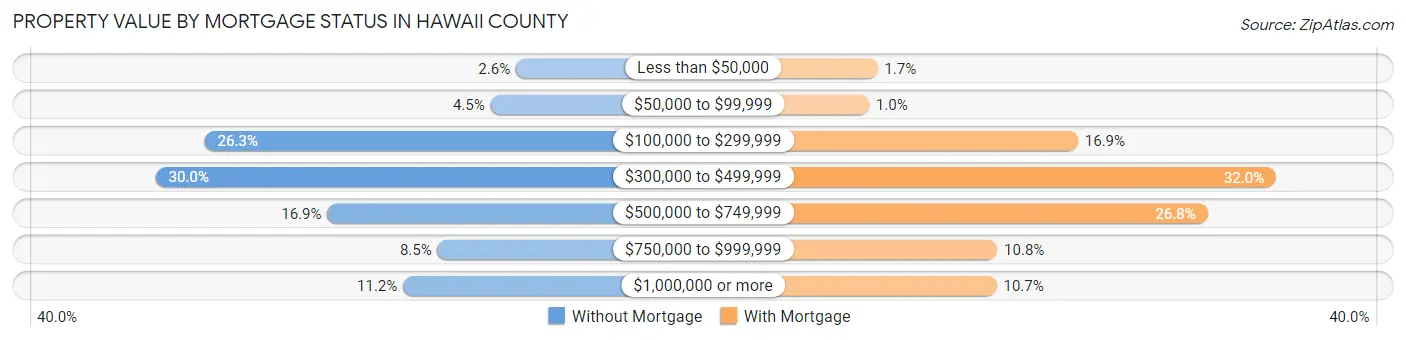
| Property Value | Without Mortgage | With Mortgage |
| Less than $50,000 | 573 (2.6%) | 490 (1.7%) |
| $50,000 to $99,999 | 1,008 (4.5%) | 301 (1.0%) |
| $100,000 to $299,999 | 5,886 (26.3%) | 4,975 (16.9%) |
| $300,000 to $499,999 | 6,725 (30.0%) | 9,408 (32.0%) |
| $500,000 to $749,999 | 3,795 (16.9%) | 7,878 (26.8%) |
| $750,000 to $999,999 | 1,913 (8.5%) | 3,171 (10.8%) |
| $1,000,000 or more | 2,501 (11.2%) | 3,154 (10.7%) |
| Total | 22,401 (100.0%) | 29,377 (100.0%) |
Household Income by Mortgage Status in Hawaii County
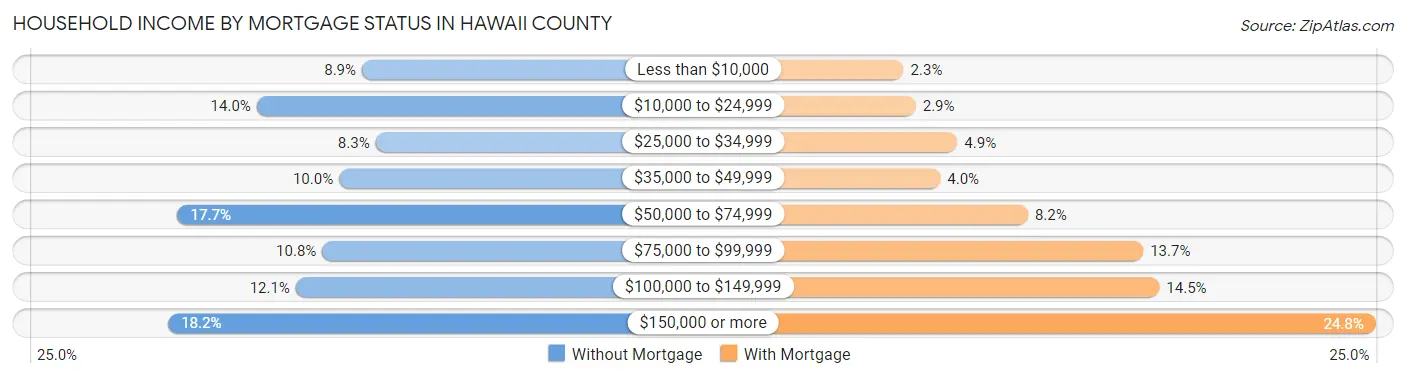
| Household Income | Without Mortgage | With Mortgage |
| Less than $10,000 | 2,002 (8.9%) | 674 (2.3%) |
| $10,000 to $24,999 | 3,125 (14.0%) | 844 (2.9%) |
| $25,000 to $34,999 | 1,856 (8.3%) | 1,424 (4.9%) |
| $35,000 to $49,999 | 2,247 (10.0%) | 1,187 (4.0%) |
| $50,000 to $74,999 | 3,968 (17.7%) | 2,413 (8.2%) |
| $75,000 to $99,999 | 2,427 (10.8%) | 4,025 (13.7%) |
| $100,000 to $149,999 | 2,709 (12.1%) | 4,250 (14.5%) |
| $150,000 or more | 4,067 (18.2%) | 7,276 (24.8%) |
| Total | 22,401 (100.0%) | 29,377 (100.0%) |
Property Value to Household Income Ratio in Hawaii County
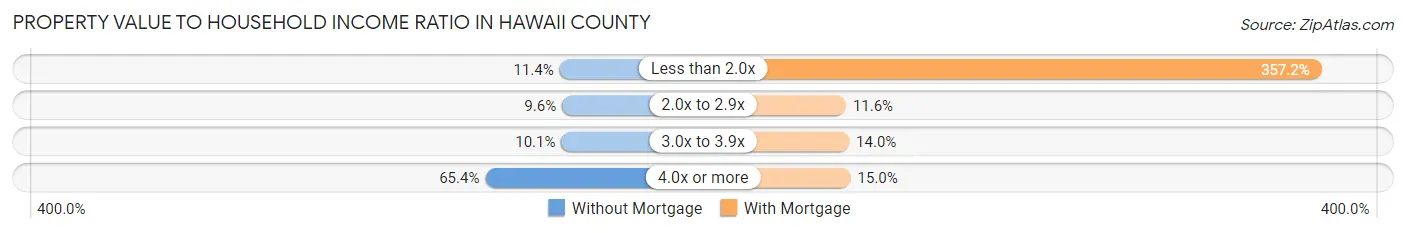
| Value-to-Income Ratio | Without Mortgage | With Mortgage |
| Less than 2.0x | 2,553 (11.4%) | 104,929 (357.2%) |
| 2.0x to 2.9x | 2,154 (9.6%) | 3,419 (11.6%) |
| 3.0x to 3.9x | 2,266 (10.1%) | 4,108 (14.0%) |
| 4.0x or more | 14,642 (65.4%) | 4,402 (15.0%) |
| Total | 22,401 (100.0%) | 29,377 (100.0%) |
Real Estate Taxes by Mortgage Status in Hawaii County
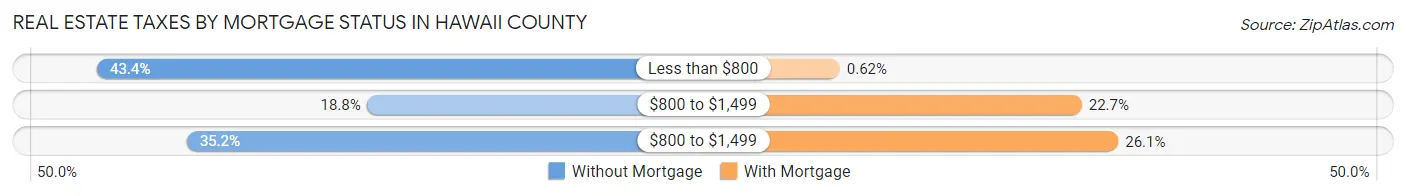
| Property Taxes | Without Mortgage | With Mortgage |
| Less than $800 | 9,717 (43.4%) | 183 (0.6%) |
| $800 to $1,499 | 4,204 (18.8%) | 6,675 (22.7%) |
| $800 to $1,499 | 7,884 (35.2%) | 7,652 (26.1%) |
| Total | 22,401 (100.0%) | 29,377 (100.0%) |
Health & Disability in Hawaii County
Health Insurance Coverage by Age in Hawaii County
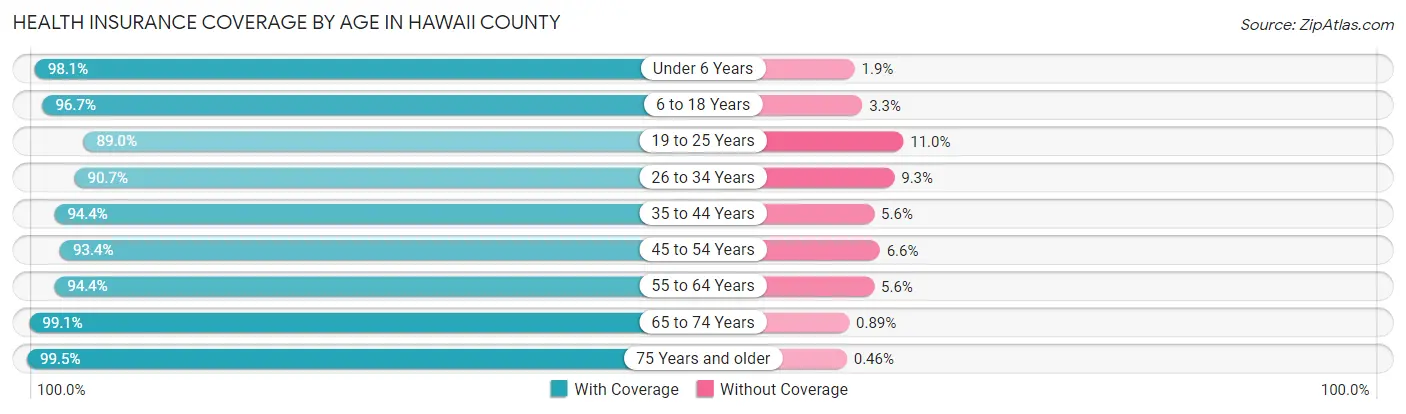
| Age Bracket | With Coverage | Without Coverage |
| Under 6 Years | 12,659 (98.1%) | 248 (1.9%) |
| 6 to 18 Years | 31,189 (96.7%) | 1,078 (3.3%) |
| 19 to 25 Years | 12,271 (89.0%) | 1,518 (11.0%) |
| 26 to 34 Years | 18,975 (90.7%) | 1,950 (9.3%) |
| 35 to 44 Years | 23,087 (94.4%) | 1,361 (5.6%) |
| 45 to 54 Years | 21,707 (93.4%) | 1,537 (6.6%) |
| 55 to 64 Years | 27,011 (94.4%) | 1,589 (5.6%) |
| 65 to 74 Years | 28,220 (99.1%) | 254 (0.9%) |
| 75 Years and older | 15,894 (99.5%) | 73 (0.5%) |
| Total | 191,013 (95.2%) | 9,608 (4.8%) |
Health Insurance Coverage by Citizenship Status in Hawaii County
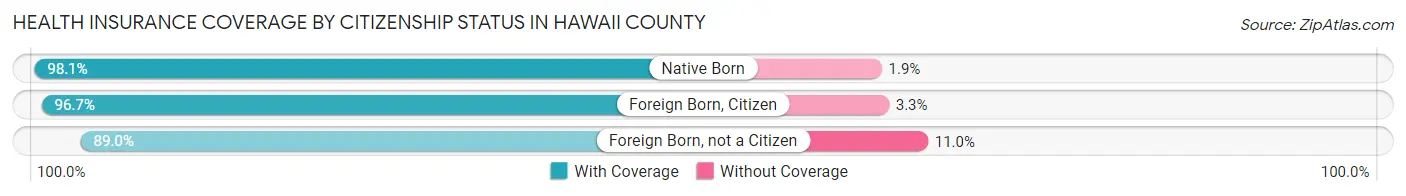
| Citizenship Status | With Coverage | Without Coverage |
| Native Born | 12,659 (98.1%) | 248 (1.9%) |
| Foreign Born, Citizen | 31,189 (96.7%) | 1,078 (3.3%) |
| Foreign Born, not a Citizen | 12,271 (89.0%) | 1,518 (11.0%) |
Health Insurance Coverage by Household Income in Hawaii County
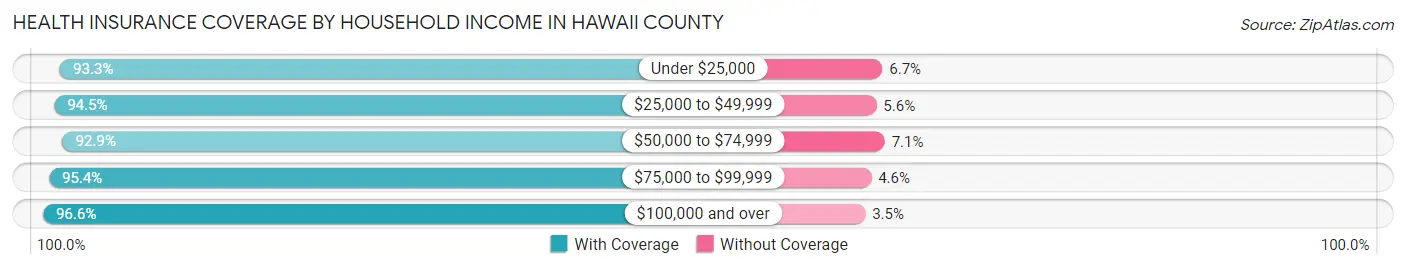
| Household Income | With Coverage | Without Coverage |
| Under $25,000 | 21,134 (93.3%) | 1,509 (6.7%) |
| $25,000 to $49,999 | 24,373 (94.5%) | 1,431 (5.6%) |
| $50,000 to $74,999 | 27,008 (92.9%) | 2,064 (7.1%) |
| $75,000 to $99,999 | 25,420 (95.4%) | 1,217 (4.6%) |
| $100,000 and over | 91,918 (96.6%) | 3,284 (3.5%) |
Public vs Private Health Insurance Coverage by Age in Hawaii County
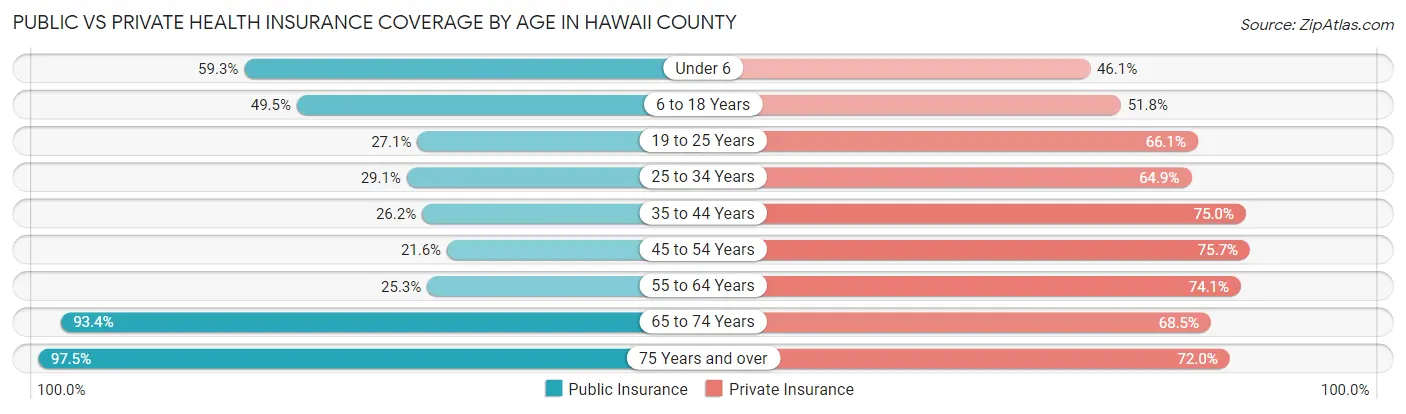
| Age Bracket | Public Insurance | Private Insurance |
| Under 6 | 7,647 (59.3%) | 5,946 (46.1%) |
| 6 to 18 Years | 15,965 (49.5%) | 16,707 (51.8%) |
| 19 to 25 Years | 3,740 (27.1%) | 9,111 (66.1%) |
| 25 to 34 Years | 6,086 (29.1%) | 13,569 (64.8%) |
| 35 to 44 Years | 6,416 (26.2%) | 18,331 (75.0%) |
| 45 to 54 Years | 5,023 (21.6%) | 17,604 (75.7%) |
| 55 to 64 Years | 7,234 (25.3%) | 21,185 (74.1%) |
| 65 to 74 Years | 26,589 (93.4%) | 19,504 (68.5%) |
| 75 Years and over | 15,575 (97.5%) | 11,494 (72.0%) |
| Total | 94,275 (47.0%) | 133,451 (66.5%) |
Disability Status by Sex by Age in Hawaii County
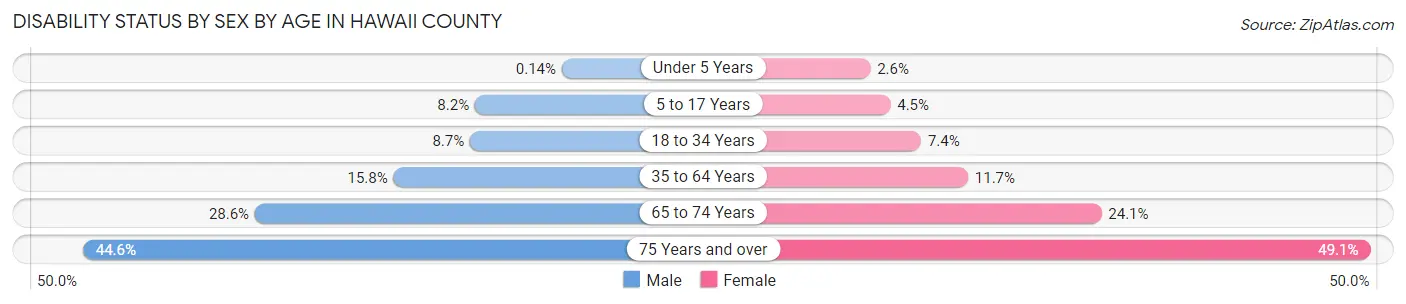
| Age Bracket | Male | Female |
| Under 5 Years | 8 (0.1%) | 140 (2.6%) |
| 5 to 17 Years | 1,346 (8.2%) | 697 (4.5%) |
| 18 to 34 Years | 1,594 (8.7%) | 1,358 (7.3%) |
| 35 to 64 Years | 5,940 (15.8%) | 4,514 (11.7%) |
| 65 to 74 Years | 4,102 (28.6%) | 3,406 (24.1%) |
| 75 Years and over | 3,234 (44.6%) | 4,275 (49.0%) |
Disability Class by Sex by Age in Hawaii County
Disability Class: Hearing Difficulty
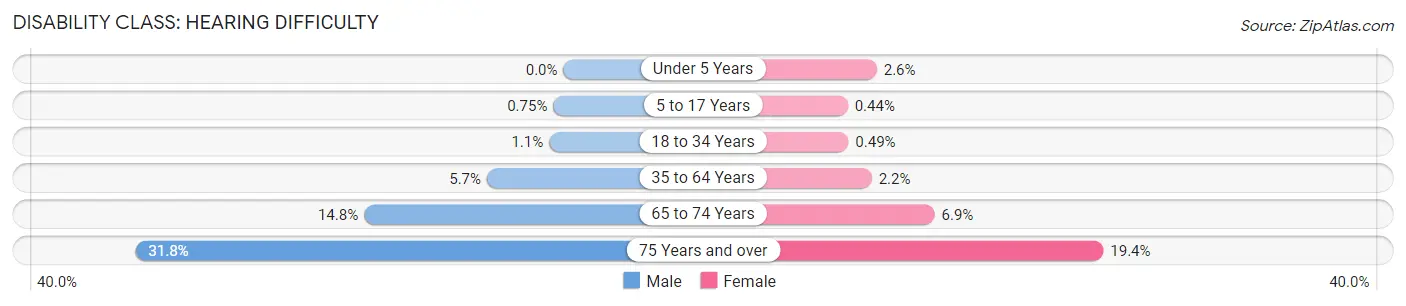
| Age Bracket | Male | Female |
| Under 5 Years | 0 (0.0%) | 138 (2.6%) |
| 5 to 17 Years | 123 (0.7%) | 68 (0.4%) |
| 18 to 34 Years | 195 (1.1%) | 90 (0.5%) |
| 35 to 64 Years | 2,140 (5.7%) | 857 (2.2%) |
| 65 to 74 Years | 2,122 (14.8%) | 974 (6.9%) |
| 75 Years and over | 2,304 (31.8%) | 1,693 (19.4%) |
Disability Class: Vision Difficulty
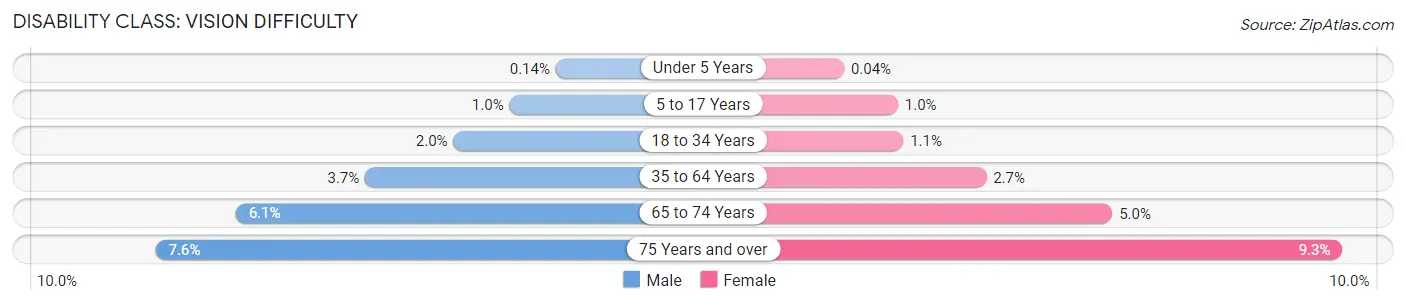
| Age Bracket | Male | Female |
| Under 5 Years | 8 (0.1%) | 2 (0.0%) |
| 5 to 17 Years | 164 (1.0%) | 161 (1.0%) |
| 18 to 34 Years | 375 (2.0%) | 211 (1.1%) |
| 35 to 64 Years | 1,389 (3.7%) | 1,033 (2.7%) |
| 65 to 74 Years | 871 (6.1%) | 710 (5.0%) |
| 75 Years and over | 549 (7.6%) | 810 (9.3%) |
Disability Class: Cognitive Difficulty
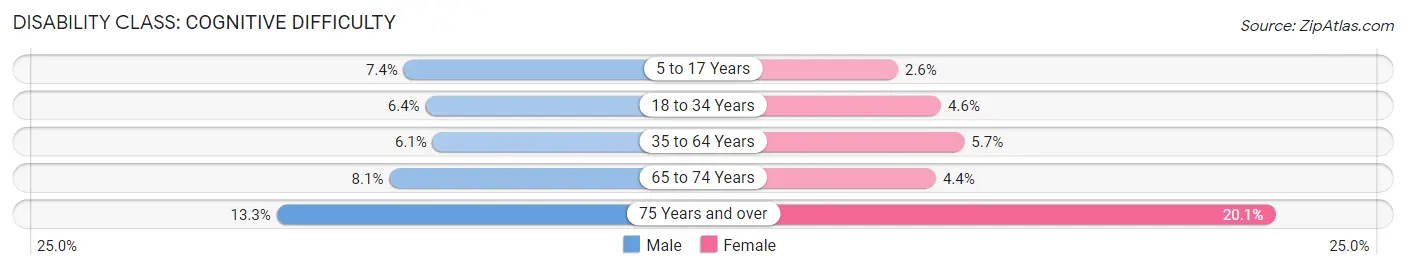
| Age Bracket | Male | Female |
| 5 to 17 Years | 1,216 (7.4%) | 405 (2.6%) |
| 18 to 34 Years | 1,177 (6.4%) | 852 (4.6%) |
| 35 to 64 Years | 2,290 (6.1%) | 2,195 (5.7%) |
| 65 to 74 Years | 1,158 (8.1%) | 618 (4.4%) |
| 75 Years and over | 965 (13.3%) | 1,752 (20.1%) |
Disability Class: Ambulatory Difficulty
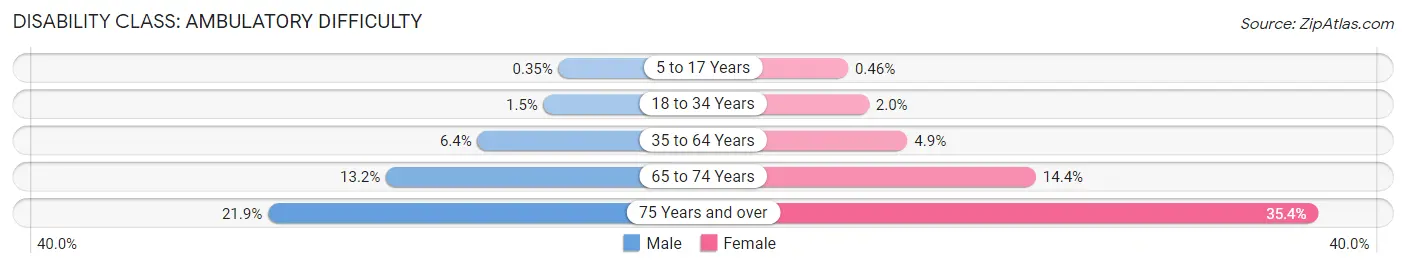
| Age Bracket | Male | Female |
| 5 to 17 Years | 58 (0.4%) | 71 (0.5%) |
| 18 to 34 Years | 268 (1.5%) | 372 (2.0%) |
| 35 to 64 Years | 2,401 (6.4%) | 1,879 (4.9%) |
| 65 to 74 Years | 1,886 (13.2%) | 2,037 (14.4%) |
| 75 Years and over | 1,590 (21.9%) | 3,084 (35.4%) |
Disability Class: Self-Care Difficulty
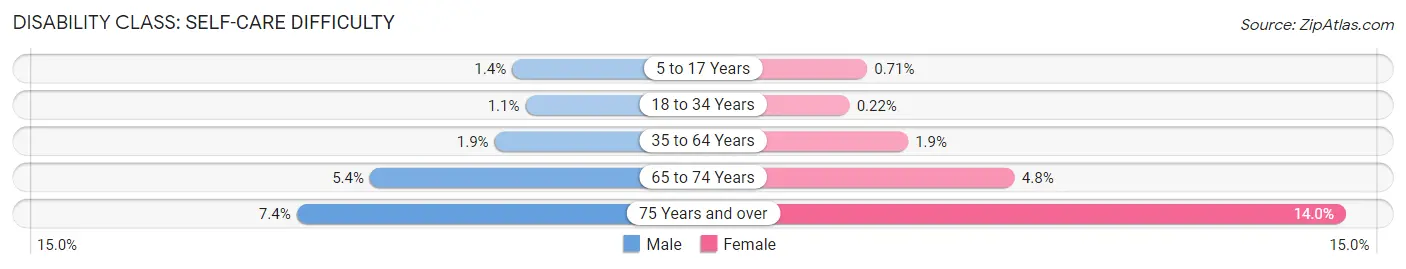
| Age Bracket | Male | Female |
| 5 to 17 Years | 235 (1.4%) | 110 (0.7%) |
| 18 to 34 Years | 195 (1.1%) | 40 (0.2%) |
| 35 to 64 Years | 723 (1.9%) | 713 (1.8%) |
| 65 to 74 Years | 773 (5.4%) | 681 (4.8%) |
| 75 Years and over | 539 (7.4%) | 1,223 (14.0%) |
Technology Access in Hawaii County
Computing Device Access in Hawaii County
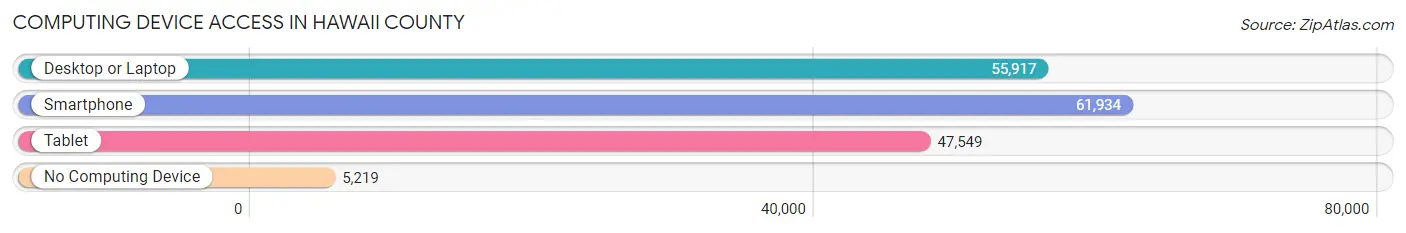
| Device Type | # Households | % Households |
| Desktop or Laptop | 55,917 | 77.2% |
| Smartphone | 61,934 | 85.5% |
| Tablet | 47,549 | 65.6% |
| No Computing Device | 5,219 | 7.2% |
| Total | 72,468 | 100.0% |
Internet Access in Hawaii County
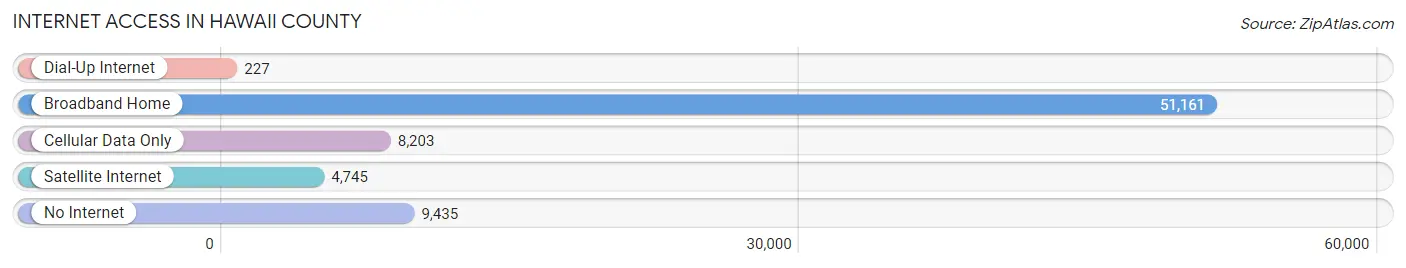
| Internet Type | # Households | % Households |
| Dial-Up Internet | 227 | 0.3% |
| Broadband Home | 51,161 | 70.6% |
| Cellular Data Only | 8,203 | 11.3% |
| Satellite Internet | 4,745 | 6.6% |
| No Internet | 9,435 | 13.0% |
| Total | 72,468 | 100.0% |
Hawaii County Summary
Hawaii County, located in the state of Hawaii, is the largest county in the state by area. It is the only county in the United States that is entirely composed of islands. The county is home to the Big Island of Hawaii, which is the largest island in the state. Hawaii County is known for its diverse geography, ranging from lush rainforests to snow-capped mountains. The county is also home to some of the most active volcanoes in the world, including Kilauea and Mauna Loa.
History
Hawaii County was established in 1905, when the Territory of Hawaii was divided into five counties. The county was named after the island of Hawaii, which was the largest island in the territory. The county was initially divided into two districts, Hilo and Kona. In 1959, Hawaii became the 50th state of the United States, and Hawaii County was officially established.
Geography
Hawaii County is located in the southeastern part of the state of Hawaii. It is the largest county in the state, covering an area of 4,028 square miles. The county is composed of the Big Island of Hawaii, as well as several smaller islands, including Maui, Lanai, Molokai, and Kahoolawe. The county is home to two of the world’s most active volcanoes, Kilauea and Mauna Loa. The county is also home to several national parks, including Hawaii Volcanoes National Park, Haleakala National Park, and Puuhonua o Honaunau National Historical Park.
Economy
Hawaii County’s economy is largely driven by tourism. The county is home to several popular tourist destinations, including the Hawaii Volcanoes National Park, the Mauna Kea Observatory, and the Kona Coast. The county is also home to several resorts, including the Four Seasons Resort Hualalai, the Mauna Lani Bay Hotel & Bungalows, and the Hilton Waikoloa Village. Agriculture is also an important part of the county’s economy, with coffee, macadamia nuts, and papaya being the main crops.
Demographics
As of the 2010 census, Hawaii County had a population of 185,079. The population is composed of a variety of ethnic groups, including Native Hawaiian, White, Asian, and Hispanic. The median household income in the county is $60,837, and the median age is 40.7 years. The county has a higher-than-average poverty rate, with 17.3% of the population living below the poverty line.
Hawaii County is a diverse and vibrant county with a rich history and culture. The county is home to some of the most active volcanoes in the world, as well as several national parks and tourist destinations. The county’s economy is largely driven by tourism, agriculture, and other industries. The county is also home to a diverse population, with a variety of ethnic groups and a median age of 40.7 years.
Common Questions
What is Per Capita Income in Hawaii County?
Per Capita income in Hawaii County is $37,236.
What is the Median Family Income in Hawaii County?
Median Family Income in Hawaii County is $90,234.
What is the Median Household income in Hawaii County?
Median Household Income in Hawaii County is $74,238.
What is Income or Wage Gap in Hawaii County?
Income or Wage Gap in Hawaii County is 18.7%.
Women in Hawaii County earn 81.3 cents for every dollar earned by a man.
What is Family Income Deficit in Hawaii County?
Family Income Deficit in Hawaii County is $10,915.
Families that are below poverty line in Hawaii County earn $10,915 less on average than the poverty threshold level.
What is Inequality or Gini Index in Hawaii County?
Inequality or Gini Index in Hawaii County is 0.48.
What is the Total Population of Hawaii County?
Total Population of Hawaii County is 202,163.
What is the Total Male Population of Hawaii County?
Total Male Population of Hawaii County is 100,828.
What is the Total Female Population of Hawaii County?
Total Female Population of Hawaii County is 101,335.
What is the Ratio of Males per 100 Females in Hawaii County?
There are 99.50 Males per 100 Females in Hawaii County.
What is the Ratio of Females per 100 Males in Hawaii County?
There are 100.50 Females per 100 Males in Hawaii County.
What is the Median Population Age in Hawaii County?
Median Population Age in Hawaii County is 43.3 Years.
What is the Average Family Size in Hawaii County
Average Family Size in Hawaii County is 3.3 People.
What is the Average Household Size in Hawaii County
Average Household Size in Hawaii County is 2.8 People.
How Large is the Labor Force in Hawaii County?
There are 96,331 People in the Labor Forcein in Hawaii County.
What is the Percentage of People in the Labor Force in Hawaii County?
58.8% of People are in the Labor Force in Hawaii County.
What is the Unemployment Rate in Hawaii County?
Unemployment Rate in Hawaii County is 6.5%.