Honolulu County, HI Map & Demographics
Honolulu County Map
Honolulu County Overview
$44,026
PER CAPITA INCOME
$117,769
AVG FAMILY INCOME
$99,816
AVG HOUSEHOLD INCOME
23.3%
WAGE / INCOME GAP [ % ]
76.7¢/ $1
WAGE / INCOME GAP [ $ ]
$11,676
FAMILY INCOME DEFICIT
0.44
INEQUALITY / GINI INDEX
1,010,100
TOTAL POPULATION
512,085
MALE POPULATION
498,015
FEMALE POPULATION
102.83
MALES / 100 FEMALES
97.25
FEMALES / 100 MALES
38.8
MEDIAN AGE
3.5
AVG FAMILY SIZE
2.9
AVG HOUSEHOLD SIZE
539,959
LABOR FORCE [ PEOPLE ]
65.8%
PERCENT IN LABOR FORCE
4.8%
UNEMPLOYMENT RATE
Honolulu County Area Codes
Income in Honolulu County
Income Overview in Honolulu County
Per Capita Income in Honolulu County is $44,026, while median incomes of families and households are $117,769 and $99,816 respectively.
| Characteristic | Number | Measure |
| Per Capita Income | 1,010,100 | $44,026 |
| Median Family Income | 229,484 | $117,769 |
| Mean Family Income | 229,484 | $144,644 |
| Median Household Income | 333,700 | $99,816 |
| Mean Household Income | 333,700 | $128,036 |
| Income Deficit | 229,484 | $11,676 |
| Wage / Income Gap (%) | 1,010,100 | 23.26% |
| Wage / Income Gap ($) | 1,010,100 | 76.74¢ per $1 |
| Gini / Inequality Index | 1,010,100 | 0.44 |
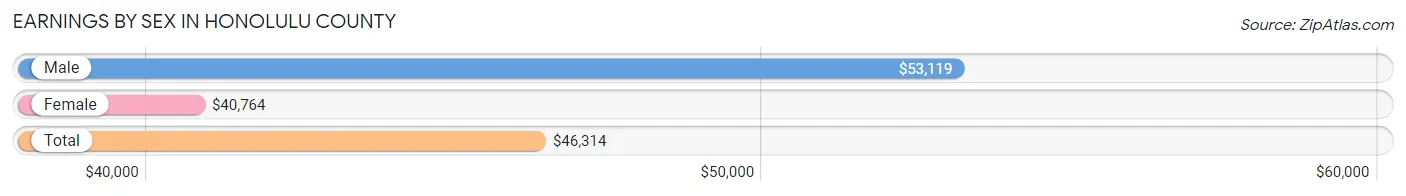
Earnings by Sex in Honolulu County
Average Earnings in Honolulu County are $46,314, $53,119 for men and $40,764 for women, a difference of 23.3%.
| Sex | Number | Average Earnings |
| Male | 301,383 (54.2%) | $53,119 |
| Female | 254,932 (45.8%) | $40,764 |
| Total | 556,315 (100.0%) | $46,314 |
Earnings by Sex by Income Bracket in Honolulu County
The most common earnings brackets in Honolulu County are $100,000+ for men (62,126 | 20.6%) and $100,000+ for women (28,288 | 11.1%).
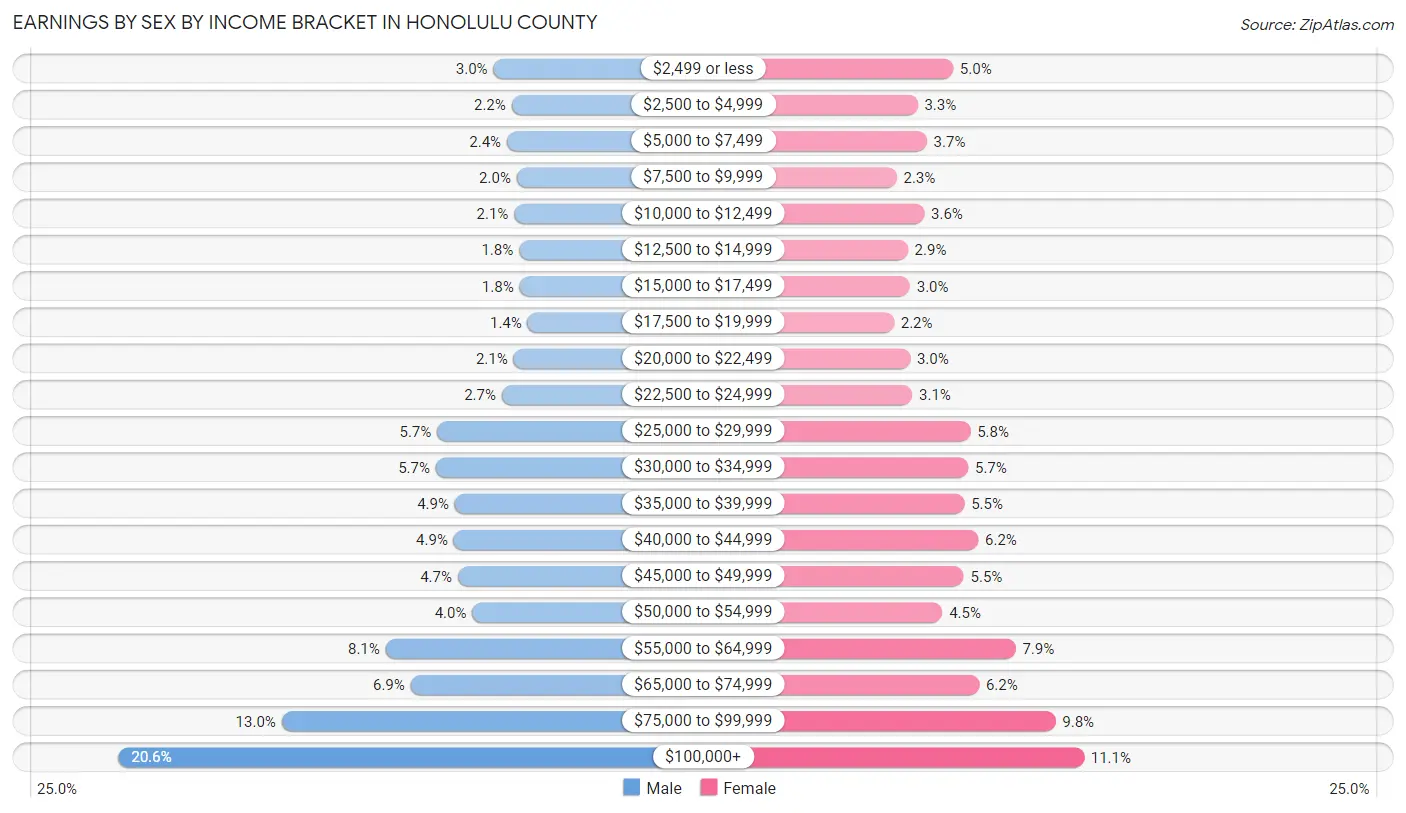
| Income | Male | Female |
| $2,499 or less | 9,170 (3.0%) | 12,682 (5.0%) |
| $2,500 to $4,999 | 6,614 (2.2%) | 8,430 (3.3%) |
| $5,000 to $7,499 | 7,250 (2.4%) | 9,544 (3.7%) |
| $7,500 to $9,999 | 5,862 (1.9%) | 5,947 (2.3%) |
| $10,000 to $12,499 | 6,236 (2.1%) | 9,229 (3.6%) |
| $12,500 to $14,999 | 5,532 (1.8%) | 7,262 (2.9%) |
| $15,000 to $17,499 | 5,500 (1.8%) | 7,517 (2.9%) |
| $17,500 to $19,999 | 4,345 (1.4%) | 5,621 (2.2%) |
| $20,000 to $22,499 | 6,332 (2.1%) | 7,537 (3.0%) |
| $22,500 to $24,999 | 7,981 (2.6%) | 7,797 (3.1%) |
| $25,000 to $29,999 | 17,115 (5.7%) | 14,746 (5.8%) |
| $30,000 to $34,999 | 17,303 (5.7%) | 14,475 (5.7%) |
| $35,000 to $39,999 | 14,629 (4.9%) | 14,027 (5.5%) |
| $40,000 to $44,999 | 14,767 (4.9%) | 15,668 (6.1%) |
| $45,000 to $49,999 | 14,194 (4.7%) | 13,957 (5.5%) |
| $50,000 to $54,999 | 12,131 (4.0%) | 11,390 (4.5%) |
| $55,000 to $64,999 | 24,384 (8.1%) | 20,143 (7.9%) |
| $65,000 to $74,999 | 20,841 (6.9%) | 15,773 (6.2%) |
| $75,000 to $99,999 | 39,071 (13.0%) | 24,899 (9.8%) |
| $100,000+ | 62,126 (20.6%) | 28,288 (11.1%) |
| Total | 301,383 (100.0%) | 254,932 (100.0%) |
Earnings by Sex by Educational Attainment in Honolulu County
Average earnings in Honolulu County are $60,287 for men and $45,410 for women, a difference of 24.7%. Men with an educational attainment of graduate degree enjoy the highest average annual earnings of $99,748, while those with less than high school education earn the least with $36,271. Women with an educational attainment of graduate degree earn the most with the average annual earnings of $73,263, while those with less than high school education have the smallest earnings of $26,873.
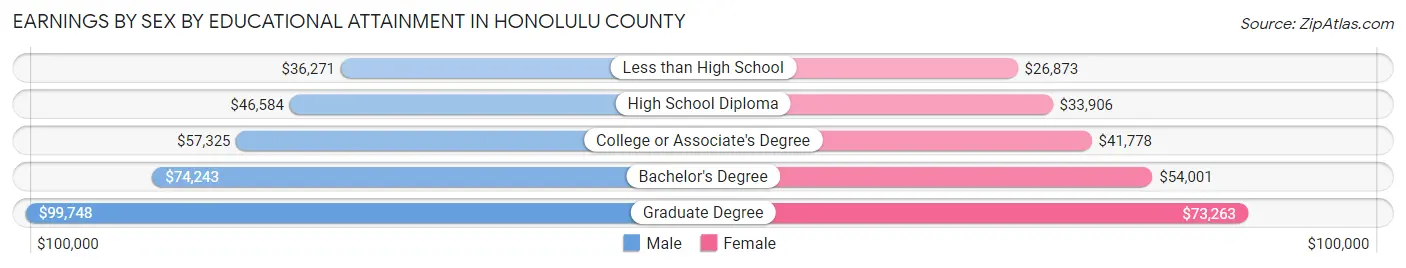
| Educational Attainment | Male Income | Female Income |
| Less than High School | $36,271 | $26,873 |
| High School Diploma | $46,584 | $33,906 |
| College or Associate's Degree | $57,325 | $41,778 |
| Bachelor's Degree | $74,243 | $54,001 |
| Graduate Degree | $99,748 | $73,263 |
| Total | $60,287 | $45,410 |
Family Income in Honolulu County
Family Income Brackets in Honolulu County
According to the Honolulu County family income data, there are 53,240 families falling into the $100,000 to $149,999 income range, which is the most common income bracket and makes up 23.2% of all families. Conversely, the $10,000 to $14,999 income bracket is the least frequent group with only 2,754 families (1.2%) belonging to this category.
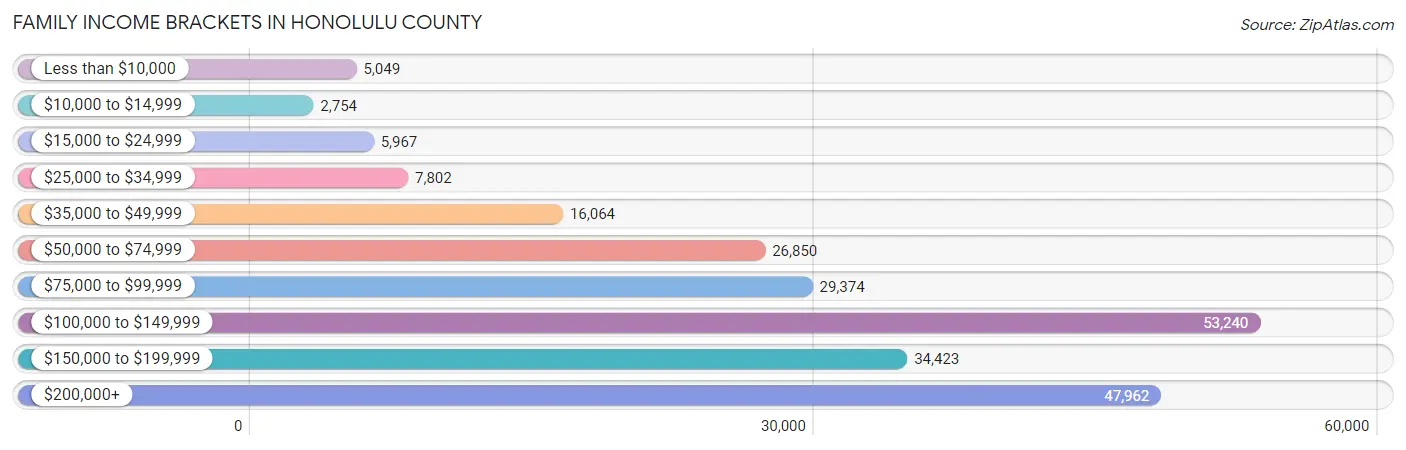
| Income Bracket | # Families | % Families |
| Less than $10,000 | 5,049 | 2.2% |
| $10,000 to $14,999 | 2,754 | 1.2% |
| $15,000 to $24,999 | 5,967 | 2.6% |
| $25,000 to $34,999 | 7,802 | 3.4% |
| $35,000 to $49,999 | 16,064 | 7.0% |
| $50,000 to $74,999 | 26,850 | 11.7% |
| $75,000 to $99,999 | 29,374 | 12.8% |
| $100,000 to $149,999 | 53,240 | 23.2% |
| $150,000 to $199,999 | 34,423 | 15.0% |
| $200,000+ | 47,962 | 20.9% |
Family Income by Famaliy Size in Honolulu County
7+ person families (10,611 | 4.6%) account for the highest median family income in Honolulu County with $192,311 per family, while 2-person families (93,141 | 40.6%) have the highest median income of $48,414 per family member.
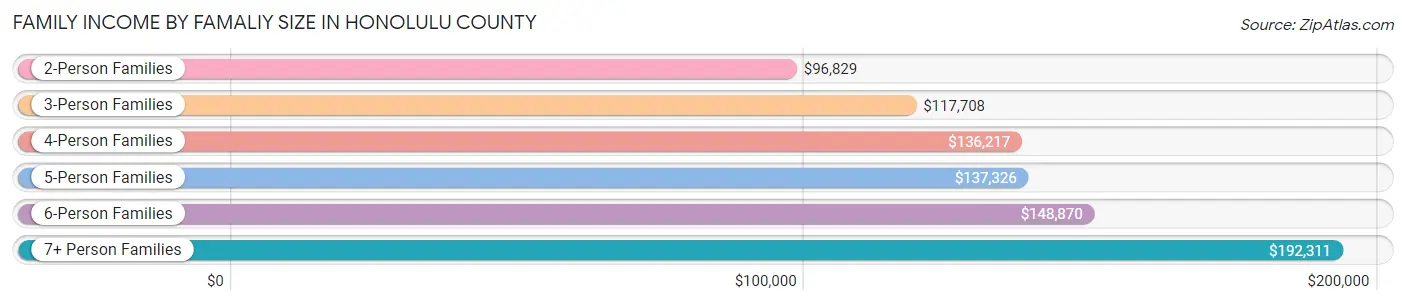
| Income Bracket | # Families | Median Income |
| 2-Person Families | 93,141 (40.6%) | $96,829 |
| 3-Person Families | 52,143 (22.7%) | $117,708 |
| 4-Person Families | 42,061 (18.3%) | $136,217 |
| 5-Person Families | 20,769 (9.0%) | $137,326 |
| 6-Person Families | 10,759 (4.7%) | $148,870 |
| 7+ Person Families | 10,611 (4.6%) | $192,311 |
| Total | 229,484 (100.0%) | $117,769 |
Family Income by Number of Earners in Honolulu County
The median family income in Honolulu County is $117,769, with families comprising 3+ earners (41,508) having the highest median family income of $182,606, while families with no earners (27,135) have the lowest median family income of $65,063, accounting for 18.1% and 11.8% of families, respectively.
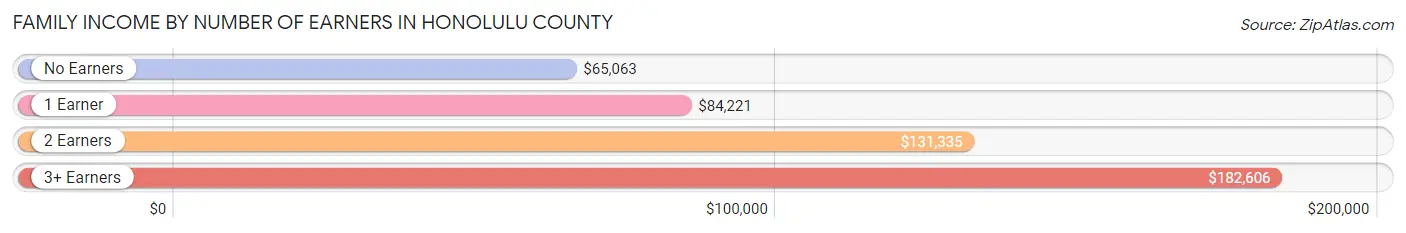
| Number of Earners | # Families | Median Income |
| No Earners | 27,135 (11.8%) | $65,063 |
| 1 Earner | 64,858 (28.3%) | $84,221 |
| 2 Earners | 95,983 (41.8%) | $131,335 |
| 3+ Earners | 41,508 (18.1%) | $182,606 |
| Total | 229,484 (100.0%) | $117,769 |
Household Income in Honolulu County
Household Income Brackets in Honolulu County
With 67,407 households falling in the category, the $100,000 to $149,999 income range is the most frequent in Honolulu County, accounting for 20.2% of all households. In contrast, only 7,675 households (2.3%) fall into the $10,000 to $14,999 income bracket, making it the least populous group.
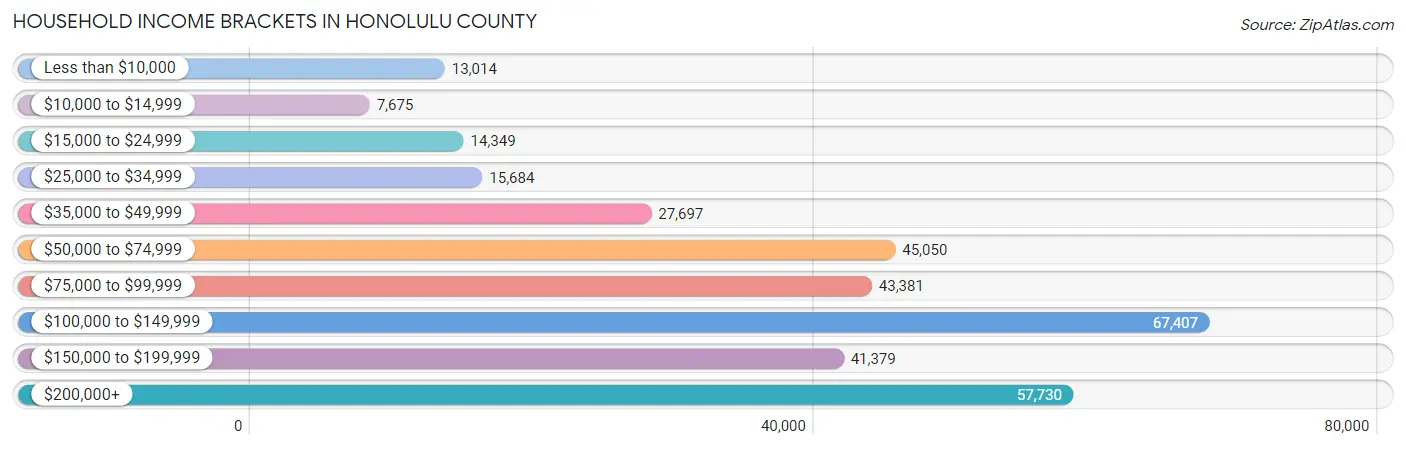
| Income Bracket | # Households | % Households |
| Less than $10,000 | 13,014 | 3.9% |
| $10,000 to $14,999 | 7,675 | 2.3% |
| $15,000 to $24,999 | 14,349 | 4.3% |
| $25,000 to $34,999 | 15,684 | 4.7% |
| $35,000 to $49,999 | 27,697 | 8.3% |
| $50,000 to $74,999 | 45,050 | 13.5% |
| $75,000 to $99,999 | 43,381 | 13.0% |
| $100,000 to $149,999 | 67,407 | 20.2% |
| $150,000 to $199,999 | 41,379 | 12.4% |
| $200,000+ | 57,730 | 17.3% |
Household Income by Householder Age in Honolulu County
The median household income in Honolulu County is $99,816, with the highest median household income of $118,509 found in the 45 to 64 years age bracket for the primary householder. A total of 115,171 households (34.5%) fall into this category. Meanwhile, the 15 to 24 years age bracket for the primary householder has the lowest median household income of $55,215, with 11,423 households (3.4%) in this group.
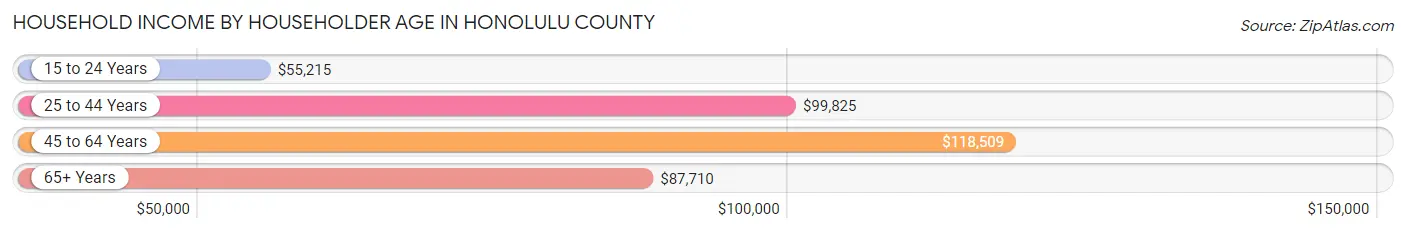
| Income Bracket | # Households | Median Income |
| 15 to 24 Years | 11,423 (3.4%) | $55,215 |
| 25 to 44 Years | 104,335 (31.3%) | $99,825 |
| 45 to 64 Years | 115,171 (34.5%) | $118,509 |
| 65+ Years | 102,771 (30.8%) | $87,710 |
| Total | 333,700 (100.0%) | $99,816 |
Poverty in Honolulu County
Income Below Poverty by Sex and Age in Honolulu County
With 8.1% poverty level for males and 9.6% for females among the residents of Honolulu County, 6 to 11 year old males and 18 to 24 year old females are the most vulnerable to poverty, with 4,506 males (12.6%) and 5,437 females (14.8%) in their respective age groups living below the poverty level.
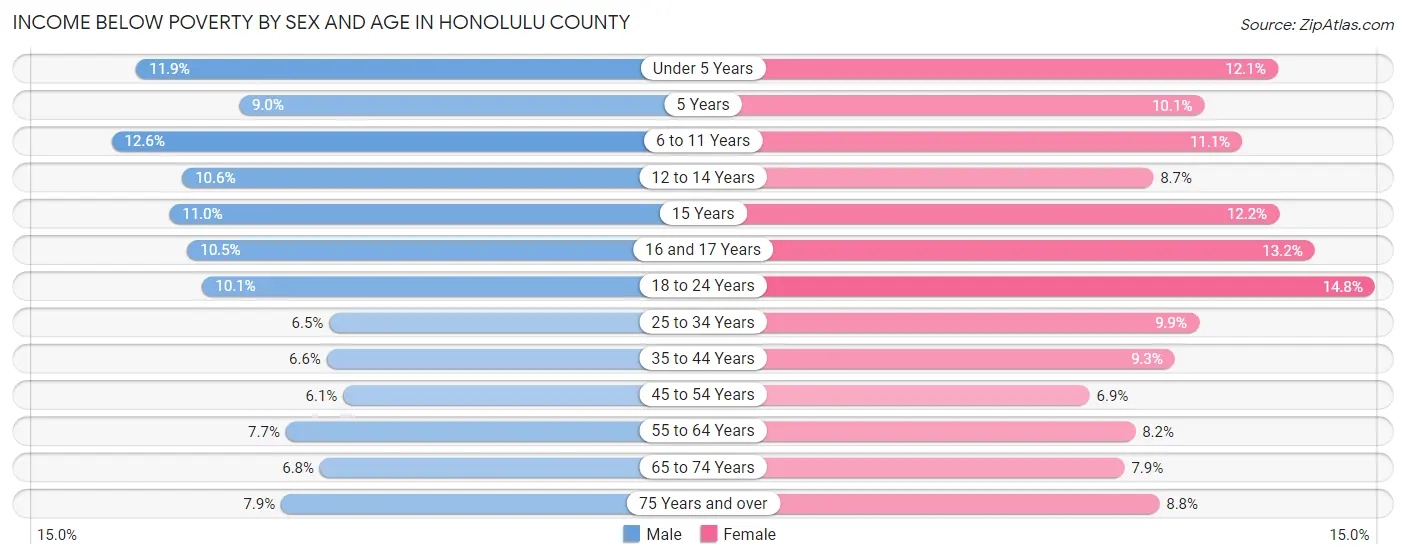
| Age Bracket | Male | Female |
| Under 5 Years | 3,531 (11.9%) | 3,422 (12.1%) |
| 5 Years | 518 (9.0%) | 532 (10.1%) |
| 6 to 11 Years | 4,506 (12.6%) | 3,748 (11.1%) |
| 12 to 14 Years | 1,921 (10.6%) | 1,467 (8.7%) |
| 15 Years | 612 (11.0%) | 631 (12.2%) |
| 16 and 17 Years | 1,153 (10.5%) | 1,394 (13.2%) |
| 18 to 24 Years | 4,077 (10.1%) | 5,437 (14.8%) |
| 25 to 34 Years | 4,871 (6.5%) | 6,783 (9.9%) |
| 35 to 44 Years | 4,443 (6.6%) | 5,908 (9.3%) |
| 45 to 54 Years | 3,667 (6.1%) | 4,040 (6.9%) |
| 55 to 64 Years | 4,605 (7.7%) | 4,912 (8.2%) |
| 65 to 74 Years | 3,217 (6.8%) | 4,120 (7.9%) |
| 75 Years and over | 2,709 (7.9%) | 4,388 (8.8%) |
| Total | 39,830 (8.1%) | 46,782 (9.6%) |
Income Above Poverty by Sex and Age in Honolulu County
According to the poverty statistics in Honolulu County, males aged 45 to 54 years and females aged 45 to 54 years are the age groups that are most secure financially, with 93.9% of males and 93.1% of females in these age groups living above the poverty line.
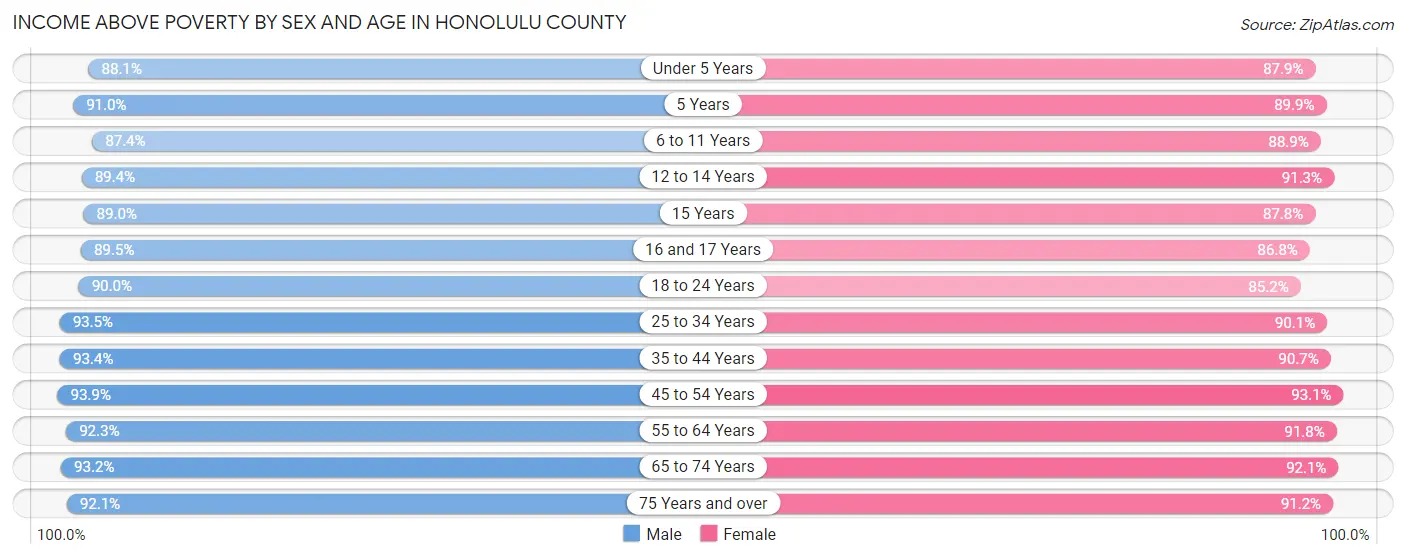
| Age Bracket | Male | Female |
| Under 5 Years | 26,158 (88.1%) | 24,793 (87.9%) |
| 5 Years | 5,216 (91.0%) | 4,738 (89.9%) |
| 6 to 11 Years | 31,321 (87.4%) | 29,910 (88.9%) |
| 12 to 14 Years | 16,192 (89.4%) | 15,462 (91.3%) |
| 15 Years | 4,969 (89.0%) | 4,556 (87.8%) |
| 16 and 17 Years | 9,855 (89.5%) | 9,198 (86.8%) |
| 18 to 24 Years | 36,472 (89.9%) | 31,204 (85.2%) |
| 25 to 34 Years | 69,888 (93.5%) | 61,439 (90.1%) |
| 35 to 44 Years | 62,961 (93.4%) | 57,857 (90.7%) |
| 45 to 54 Years | 56,114 (93.9%) | 54,495 (93.1%) |
| 55 to 64 Years | 54,976 (92.3%) | 55,243 (91.8%) |
| 65 to 74 Years | 44,210 (93.2%) | 48,236 (92.1%) |
| 75 Years and over | 31,769 (92.1%) | 45,238 (91.2%) |
| Total | 450,101 (91.9%) | 442,369 (90.4%) |
Income Below Poverty Among Married-Couple Families in Honolulu County
The poverty statistics for married-couple families in Honolulu County show that 3.4% or 5,747 of the total 169,591 families live below the poverty line. Families with 5 or more children have the highest poverty rate of 21.8%, comprising of 382 families. On the other hand, families with no children have the lowest poverty rate of 2.7%, which includes 2,641 families.
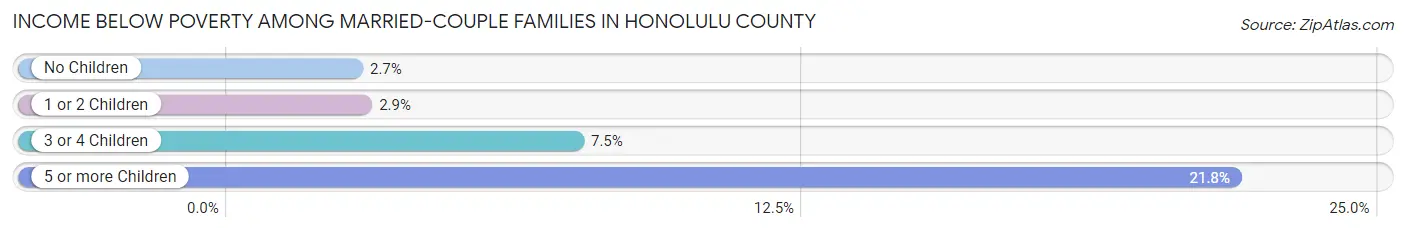
| Children | Above Poverty | Below Poverty |
| No Children | 94,340 (97.3%) | 2,641 (2.7%) |
| 1 or 2 Children | 54,999 (97.1%) | 1,654 (2.9%) |
| 3 or 4 Children | 13,138 (92.5%) | 1,070 (7.5%) |
| 5 or more Children | 1,367 (78.2%) | 382 (21.8%) |
| Total | 163,844 (96.6%) | 5,747 (3.4%) |
Income Below Poverty Among Single-Parent Households in Honolulu County
According to the poverty data in Honolulu County, 8.0% or 1,441 single-father households and 14.5% or 6,053 single-mother households are living below the poverty line. Among single-father households, those with 3 or 4 children have the highest poverty rate, with 215 households (15.1%) experiencing poverty. Likewise, among single-mother households, those with 5 or more children have the highest poverty rate, with 201 households (54.0%) falling below the poverty line.
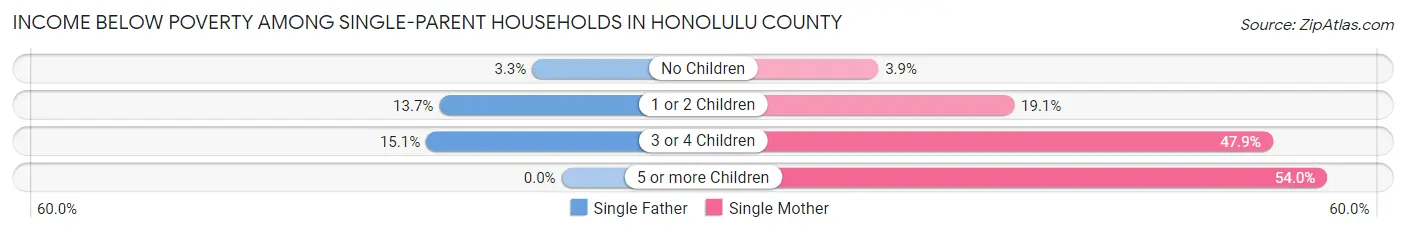
| Children | Single Father | Single Mother |
| No Children | 326 (3.3%) | 791 (3.9%) |
| 1 or 2 Children | 900 (13.7%) | 3,288 (19.1%) |
| 3 or 4 Children | 215 (15.1%) | 1,773 (47.9%) |
| 5 or more Children | 0 (0.0%) | 201 (54.0%) |
| Total | 1,441 (8.0%) | 6,053 (14.5%) |
Income Below Poverty Among Married-Couple vs Single-Parent Households in Honolulu County
The poverty data for Honolulu County shows that 5,747 of the married-couple family households (3.4%) and 7,494 of the single-parent households (12.5%) are living below the poverty level. Within the married-couple family households, those with 5 or more children have the highest poverty rate, with 382 households (21.8%) falling below the poverty line. Among the single-parent households, those with 5 or more children have the highest poverty rate, with 201 household (41.4%) living below poverty.
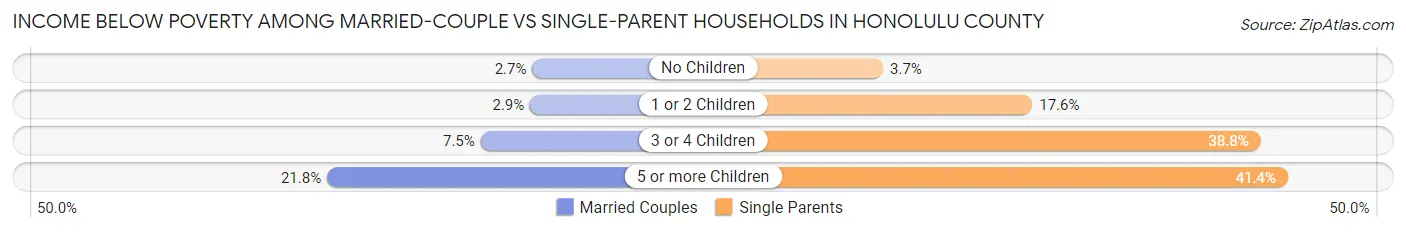
| Children | Married-Couple Families | Single-Parent Households |
| No Children | 2,641 (2.7%) | 1,117 (3.7%) |
| 1 or 2 Children | 1,654 (2.9%) | 4,188 (17.6%) |
| 3 or 4 Children | 1,070 (7.5%) | 1,988 (38.8%) |
| 5 or more Children | 382 (21.8%) | 201 (41.4%) |
| Total | 5,747 (3.4%) | 7,494 (12.5%) |
Race in Honolulu County
The most populous races in Honolulu County are Asian (426,815 | 42.2%), Two or more Races (243,062 | 24.1%), and White / Caucasian (195,246 | 19.3%).
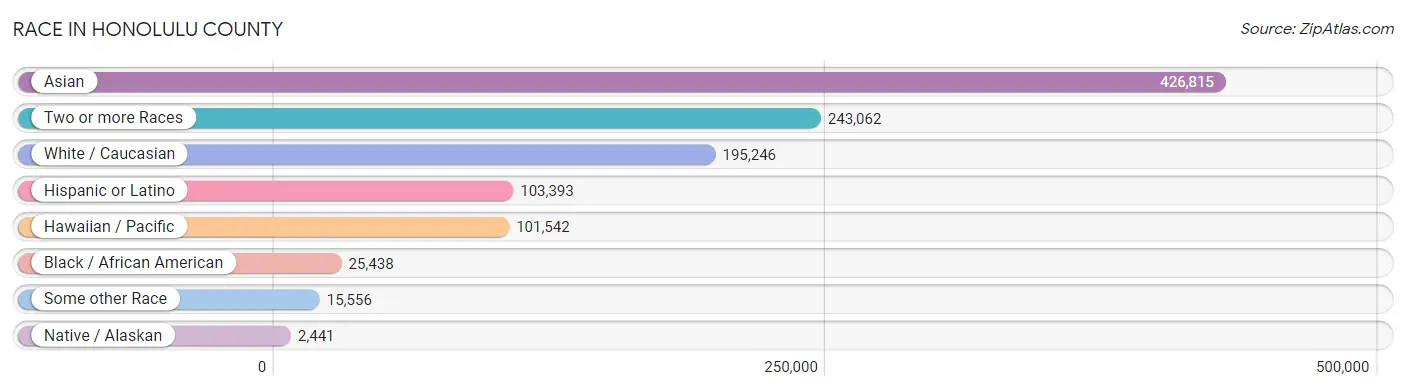
| Race | # Population | % Population |
| Asian | 426,815 | 42.2% |
| Black / African American | 25,438 | 2.5% |
| Hawaiian / Pacific | 101,542 | 10.1% |
| Hispanic or Latino | 103,393 | 10.2% |
| Native / Alaskan | 2,441 | 0.2% |
| White / Caucasian | 195,246 | 19.3% |
| Two or more Races | 243,062 | 24.1% |
| Some other Race | 15,556 | 1.5% |
| Total | 1,010,100 | 100.0% |
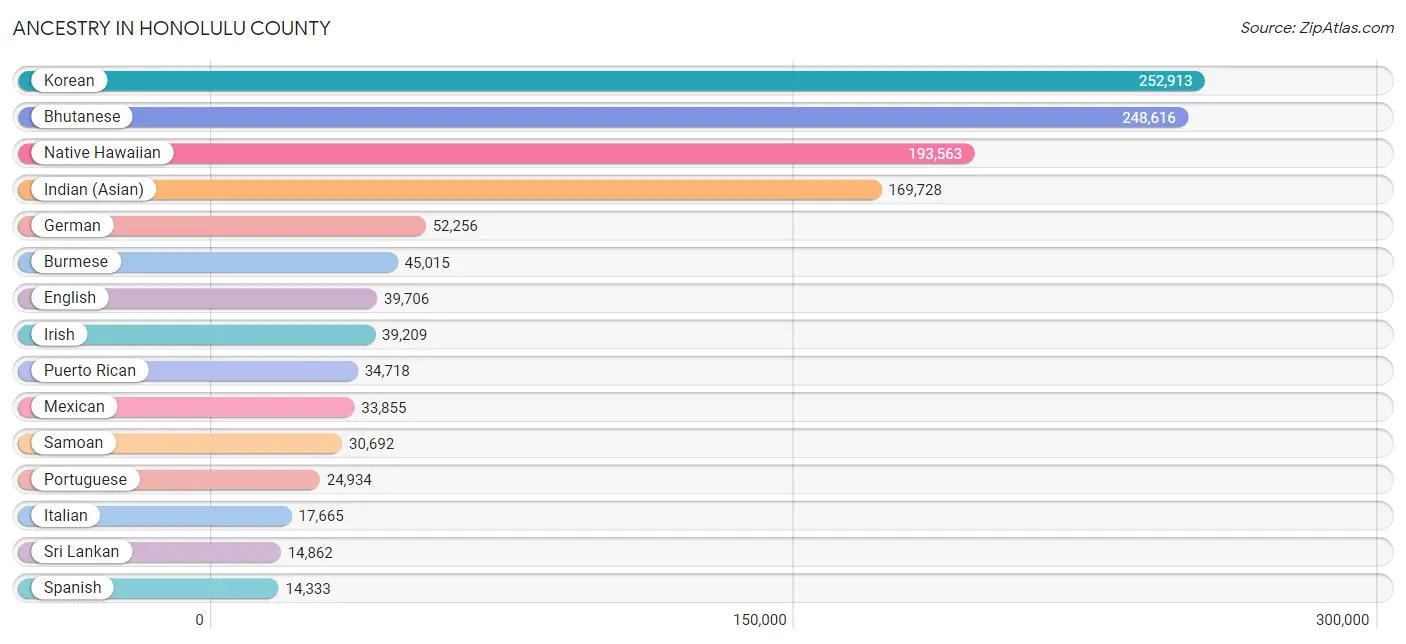
Ancestry in Honolulu County
The most populous ancestries reported in Honolulu County are Korean (252,913 | 25.0%), Bhutanese (248,616 | 24.6%), Native Hawaiian (193,563 | 19.2%), Indian (Asian) (169,728 | 16.8%), and German (52,256 | 5.2%), together accounting for 90.8% of all Honolulu County residents.
| Ancestry | # Population | % Population |
| Afghan | 90 | 0.0% |
| African | 1,712 | 0.2% |
| Alaska Native | 51 | 0.0% |
| Alaskan Athabascan | 10 | 0.0% |
| Albanian | 60 | 0.0% |
| Aleut | 53 | 0.0% |
| Alsatian | 25 | 0.0% |
| American | 13,391 | 1.3% |
| Apache | 661 | 0.1% |
| Arab | 1,660 | 0.2% |
| Argentinean | 400 | 0.0% |
| Armenian | 180 | 0.0% |
| Assyrian / Chaldean / Syriac | 10 | 0.0% |
| Australian | 486 | 0.1% |
| Austrian | 787 | 0.1% |
| Bangladeshi | 124 | 0.0% |
| Barbadian | 20 | 0.0% |
| Basque | 25 | 0.0% |
| Belgian | 454 | 0.0% |
| Belizean | 164 | 0.0% |
| Bermudan | 39 | 0.0% |
| Bhutanese | 248,616 | 24.6% |
| Blackfeet | 1,432 | 0.1% |
| Bolivian | 109 | 0.0% |
| Brazilian | 610 | 0.1% |
| British | 2,304 | 0.2% |
| British West Indian | 85 | 0.0% |
| Bulgarian | 410 | 0.0% |
| Burmese | 45,015 | 4.5% |
| Cajun | 21 | 0.0% |
| Cambodian | 216 | 0.0% |
| Canadian | 904 | 0.1% |
| Cape Verdean | 56 | 0.0% |
| Celtic | 39 | 0.0% |
| Central American | 2,692 | 0.3% |
| Central American Indian | 740 | 0.1% |
| Cherokee | 5,735 | 0.6% |
| Cheyenne | 153 | 0.0% |
| Chickasaw | 134 | 0.0% |
| Chilean | 290 | 0.0% |
| Chinese | 8,828 | 0.9% |
| Chippewa | 553 | 0.1% |
| Choctaw | 440 | 0.0% |
| Colombian | 1,089 | 0.1% |
| Colville | 43 | 0.0% |
| Comanche | 45 | 0.0% |
| Costa Rican | 172 | 0.0% |
| Cree | 17 | 0.0% |
| Creek | 147 | 0.0% |
| Croatian | 482 | 0.1% |
| Crow | 26 | 0.0% |
| Cuban | 1,345 | 0.1% |
| Czech | 1,133 | 0.1% |
| Czechoslovakian | 415 | 0.0% |
| Danish | 1,916 | 0.2% |
| Delaware | 87 | 0.0% |
| Dominican | 1,150 | 0.1% |
| Dutch | 3,471 | 0.3% |
| Eastern European | 649 | 0.1% |
| Ecuadorian | 433 | 0.0% |
| Egyptian | 258 | 0.0% |
| English | 39,706 | 3.9% |
| Estonian | 95 | 0.0% |
| Ethiopian | 56 | 0.0% |
| European | 6,637 | 0.7% |
| Fijian | 5,880 | 0.6% |
| Filipino | 2,008 | 0.2% |
| Finnish | 999 | 0.1% |
| French | 10,859 | 1.1% |
| French American Indian | 39 | 0.0% |
| French Canadian | 1,334 | 0.1% |
| German | 52,256 | 5.2% |
| German Russian | 17 | 0.0% |
| Ghanaian | 203 | 0.0% |
| Greek | 1,763 | 0.2% |
| Guamanian / Chamorro | 5,452 | 0.5% |
| Guatemalan | 489 | 0.1% |
| Guyanese | 79 | 0.0% |
| Haitian | 659 | 0.1% |
| Honduran | 407 | 0.0% |
| Hopi | 24 | 0.0% |
| Hungarian | 1,175 | 0.1% |
| Icelander | 123 | 0.0% |
| Indian (Asian) | 169,728 | 16.8% |
| Indonesian | 130 | 0.0% |
| Inupiat | 74 | 0.0% |
| Iranian | 658 | 0.1% |
| Iraqi | 16 | 0.0% |
| Irish | 39,209 | 3.9% |
| Iroquois | 408 | 0.0% |
| Israeli | 145 | 0.0% |
| Italian | 17,665 | 1.8% |
| Jamaican | 1,082 | 0.1% |
| Japanese | 763 | 0.1% |
| Jordanian | 18 | 0.0% |
| Kenyan | 81 | 0.0% |
| Kiowa | 5 | 0.0% |
| Korean | 252,913 | 25.0% |
| Laotian | 560 | 0.1% |
| Latvian | 156 | 0.0% |
| Lebanese | 608 | 0.1% |
| Liberian | 42 | 0.0% |
| Lithuanian | 476 | 0.1% |
| Lumbee | 207 | 0.0% |
| Luxembourger | 61 | 0.0% |
| Macedonian | 21 | 0.0% |
| Malaysian | 2,334 | 0.2% |
| Marshallese | 3,715 | 0.4% |
| Mexican | 33,855 | 3.4% |
| Mexican American Indian | 589 | 0.1% |
| Mongolian | 162 | 0.0% |
| Moroccan | 62 | 0.0% |
| Native Hawaiian | 193,563 | 19.2% |
| Navajo | 865 | 0.1% |
| Nepalese | 20 | 0.0% |
| New Zealander | 141 | 0.0% |
| Nicaraguan | 207 | 0.0% |
| Nigerian | 336 | 0.0% |
| Northern European | 765 | 0.1% |
| Norwegian | 5,501 | 0.5% |
| Okinawan | 55 | 0.0% |
| Osage | 38 | 0.0% |
| Paiute | 35 | 0.0% |
| Pakistani | 4,120 | 0.4% |
| Palestinian | 150 | 0.0% |
| Panamanian | 344 | 0.0% |
| Paraguayan | 38 | 0.0% |
| Pennsylvania German | 71 | 0.0% |
| Peruvian | 724 | 0.1% |
| Polish | 8,295 | 0.8% |
| Portuguese | 24,934 | 2.5% |
| Potawatomi | 12 | 0.0% |
| Pueblo | 326 | 0.0% |
| Puerto Rican | 34,718 | 3.4% |
| Puget Sound Salish | 7 | 0.0% |
| Romanian | 570 | 0.1% |
| Russian | 3,390 | 0.3% |
| Salvadoran | 1,062 | 0.1% |
| Samoan | 30,692 | 3.0% |
| Scandinavian | 1,532 | 0.2% |
| Scotch-Irish | 3,357 | 0.3% |
| Scottish | 6,971 | 0.7% |
| Seminole | 67 | 0.0% |
| Serbian | 362 | 0.0% |
| Shoshone | 65 | 0.0% |
| Sierra Leonean | 4 | 0.0% |
| Sioux | 388 | 0.0% |
| Slavic | 227 | 0.0% |
| Slovak | 441 | 0.0% |
| Slovene | 131 | 0.0% |
| South African | 207 | 0.0% |
| South American | 3,704 | 0.4% |
| South American Indian | 245 | 0.0% |
| Soviet Union | 19 | 0.0% |
| Spaniard | 7,752 | 0.8% |
| Spanish | 14,333 | 1.4% |
| Spanish American | 74 | 0.0% |
| Spanish American Indian | 63 | 0.0% |
| Sri Lankan | 14,862 | 1.5% |
| Subsaharan African | 3,059 | 0.3% |
| Sudanese | 12 | 0.0% |
| Swedish | 5,284 | 0.5% |
| Swiss | 1,064 | 0.1% |
| Syrian | 129 | 0.0% |
| Taiwanese | 42 | 0.0% |
| Thai | 4,122 | 0.4% |
| Tlingit-Haida | 219 | 0.0% |
| Tohono O'Odham | 48 | 0.0% |
| Tongan | 6,854 | 0.7% |
| Trinidadian and Tobagonian | 125 | 0.0% |
| Turkish | 176 | 0.0% |
| Ukrainian | 985 | 0.1% |
| Uruguayan | 29 | 0.0% |
| Ute | 21 | 0.0% |
| Venezuelan | 549 | 0.1% |
| Vietnamese | 139 | 0.0% |
| Welsh | 1,943 | 0.2% |
| West Indian | 428 | 0.0% |
| Yaqui | 242 | 0.0% |
| Yugoslavian | 196 | 0.0% |
| Yup'ik | 30 | 0.0% |
| Zimbabwean | 118 | 0.0% | View All 182 Rows |
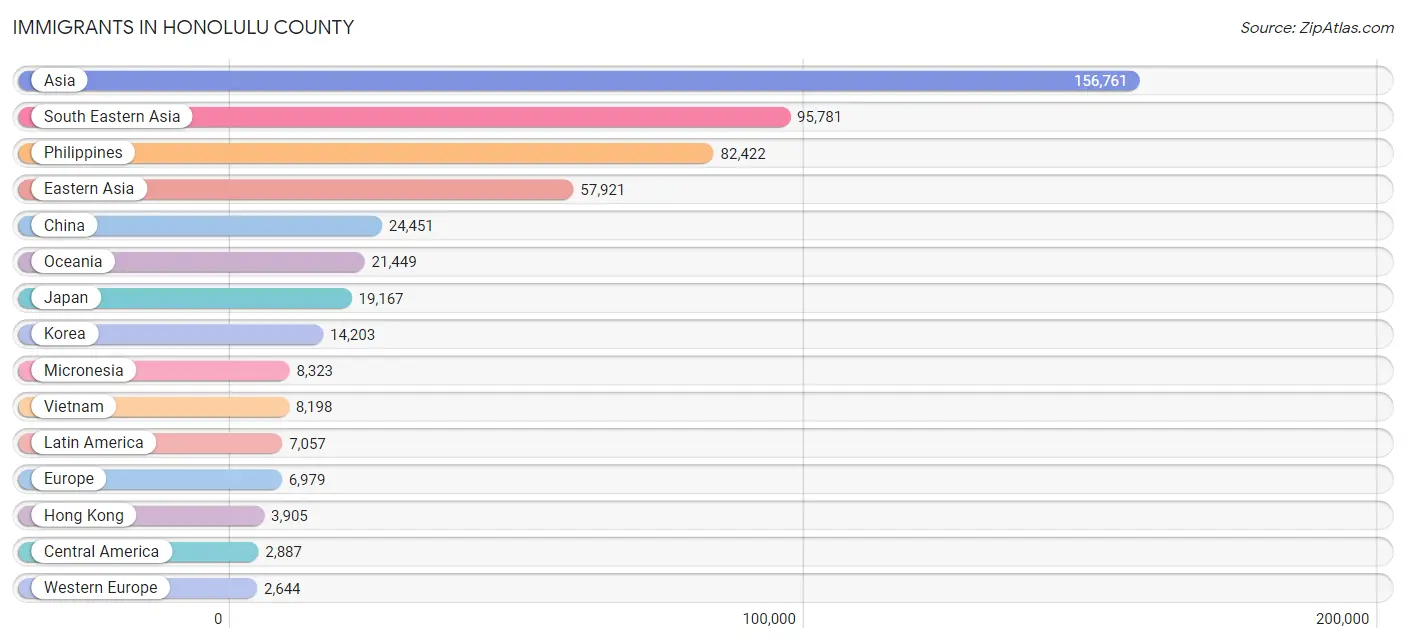
Immigrants in Honolulu County
The most numerous immigrant groups reported in Honolulu County came from Asia (156,761 | 15.5%), South Eastern Asia (95,781 | 9.5%), Philippines (82,422 | 8.2%), Eastern Asia (57,921 | 5.7%), and China (24,451 | 2.4%), together accounting for 41.3% of all Honolulu County residents.
| Immigration Origin | # Population | % Population |
| Afghanistan | 49 | 0.0% |
| Africa | 1,427 | 0.1% |
| Albania | 4 | 0.0% |
| Argentina | 131 | 0.0% |
| Asia | 156,761 | 15.5% |
| Australia | 635 | 0.1% |
| Austria | 86 | 0.0% |
| Bangladesh | 78 | 0.0% |
| Belarus | 59 | 0.0% |
| Belgium | 148 | 0.0% |
| Belize | 121 | 0.0% |
| Bolivia | 13 | 0.0% |
| Bosnia and Herzegovina | 59 | 0.0% |
| Brazil | 1,023 | 0.1% |
| Bulgaria | 465 | 0.1% |
| Cabo Verde | 19 | 0.0% |
| Cambodia | 283 | 0.0% |
| Cameroon | 101 | 0.0% |
| Canada | 2,144 | 0.2% |
| Caribbean | 1,580 | 0.2% |
| Central America | 2,887 | 0.3% |
| Chile | 194 | 0.0% |
| China | 24,451 | 2.4% |
| Colombia | 446 | 0.0% |
| Congo | 120 | 0.0% |
| Costa Rica | 35 | 0.0% |
| Croatia | 99 | 0.0% |
| Cuba | 110 | 0.0% |
| Czechoslovakia | 115 | 0.0% |
| Denmark | 58 | 0.0% |
| Dominica | 1 | 0.0% |
| Dominican Republic | 191 | 0.0% |
| Eastern Africa | 274 | 0.0% |
| Eastern Asia | 57,921 | 5.7% |
| Eastern Europe | 2,283 | 0.2% |
| Ecuador | 151 | 0.0% |
| Egypt | 169 | 0.0% |
| El Salvador | 141 | 0.0% |
| England | 525 | 0.1% |
| Eritrea | 31 | 0.0% |
| Ethiopia | 17 | 0.0% |
| Europe | 6,979 | 0.7% |
| Fiji | 388 | 0.0% |
| France | 481 | 0.1% |
| Germany | 1,732 | 0.2% |
| Ghana | 153 | 0.0% |
| Greece | 31 | 0.0% |
| Grenada | 89 | 0.0% |
| Guatemala | 132 | 0.0% |
| Guyana | 34 | 0.0% |
| Haiti | 354 | 0.0% |
| Honduras | 156 | 0.0% |
| Hong Kong | 3,905 | 0.4% |
| Hungary | 60 | 0.0% |
| India | 1,087 | 0.1% |
| Indonesia | 500 | 0.1% |
| Iran | 510 | 0.1% |
| Iraq | 29 | 0.0% |
| Ireland | 123 | 0.0% |
| Israel | 110 | 0.0% |
| Italy | 200 | 0.0% |
| Jamaica | 438 | 0.0% |
| Japan | 19,167 | 1.9% |
| Jordan | 9 | 0.0% |
| Kazakhstan | 61 | 0.0% |
| Kenya | 103 | 0.0% |
| Korea | 14,203 | 1.4% |
| Laos | 907 | 0.1% |
| Latin America | 7,057 | 0.7% |
| Latvia | 26 | 0.0% |
| Lebanon | 34 | 0.0% |
| Liberia | 33 | 0.0% |
| Lithuania | 66 | 0.0% |
| Malaysia | 936 | 0.1% |
| Mexico | 2,121 | 0.2% |
| Micronesia | 8,323 | 0.8% |
| Middle Africa | 238 | 0.0% |
| Moldova | 19 | 0.0% |
| Nepal | 191 | 0.0% |
| Netherlands | 48 | 0.0% |
| Nicaragua | 100 | 0.0% |
| Nigeria | 55 | 0.0% |
| Northern Africa | 241 | 0.0% |
| Northern Europe | 1,683 | 0.2% |
| Norway | 117 | 0.0% |
| Oceania | 21,449 | 2.1% |
| Pakistan | 82 | 0.0% |
| Panama | 81 | 0.0% |
| Peru | 214 | 0.0% |
| Philippines | 82,422 | 8.2% |
| Poland | 307 | 0.0% |
| Portugal | 14 | 0.0% |
| Romania | 223 | 0.0% |
| Russia | 443 | 0.0% |
| Saudi Arabia | 57 | 0.0% |
| Scotland | 2 | 0.0% |
| Serbia | 94 | 0.0% |
| Sierra Leone | 26 | 0.0% |
| Singapore | 254 | 0.0% |
| South Africa | 271 | 0.0% |
| South America | 2,590 | 0.3% |
| South Central Asia | 2,417 | 0.2% |
| South Eastern Asia | 95,781 | 9.5% |
| Southern Europe | 369 | 0.0% |
| Spain | 124 | 0.0% |
| Sri Lanka | 210 | 0.0% |
| Sudan | 21 | 0.0% |
| Sweden | 183 | 0.0% |
| Switzerland | 149 | 0.0% |
| Taiwan | 2,475 | 0.3% |
| Thailand | 2,146 | 0.2% |
| Trinidad and Tobago | 336 | 0.0% |
| Turkey | 158 | 0.0% |
| Ukraine | 173 | 0.0% |
| Uzbekistan | 34 | 0.0% |
| Venezuela | 354 | 0.0% |
| Vietnam | 8,198 | 0.8% |
| Western Africa | 365 | 0.0% |
| Western Asia | 404 | 0.0% |
| Western Europe | 2,644 | 0.3% |
| Yemen | 3 | 0.0% |
| Zaire | 5 | 0.0% |
| Zimbabwe | 78 | 0.0% | View All 123 Rows |
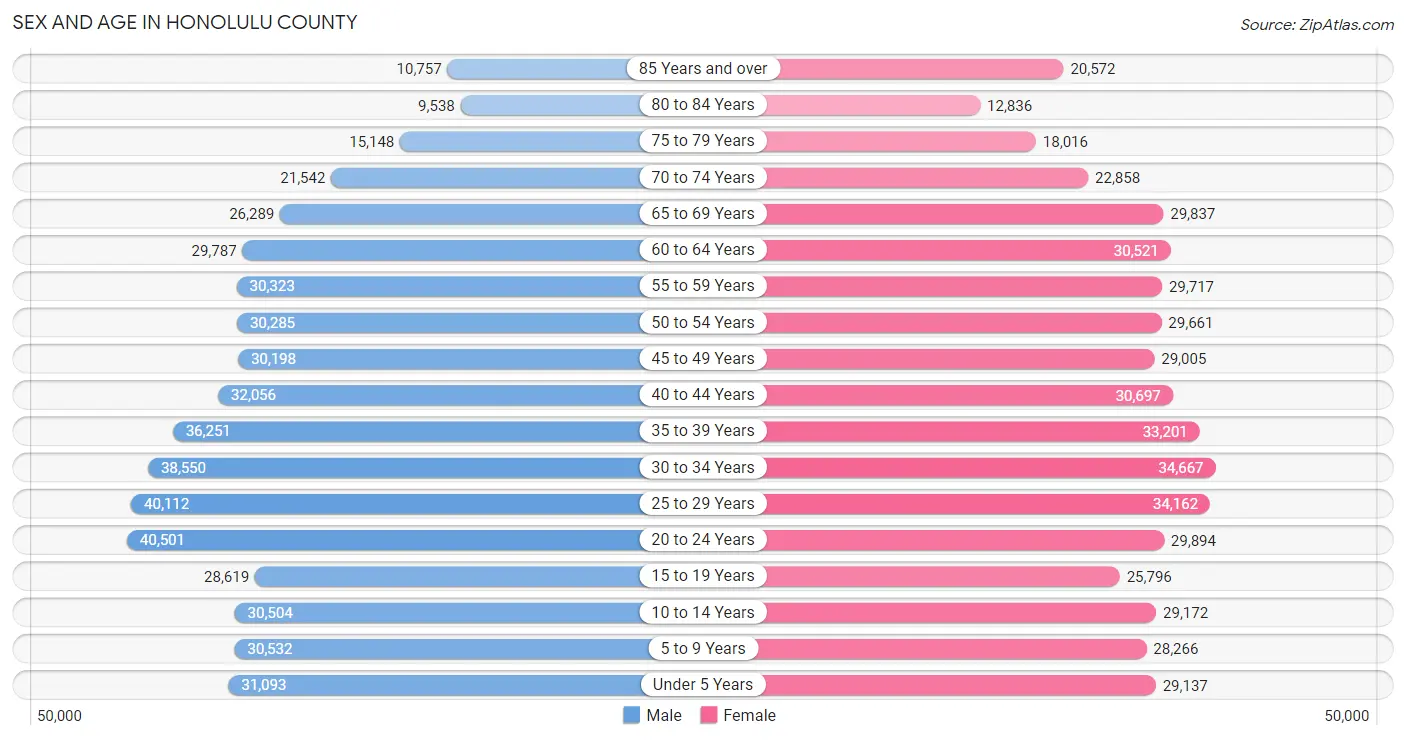
Sex and Age in Honolulu County
Sex and Age in Honolulu County
The most populous age groups in Honolulu County are 20 to 24 Years (40,501 | 7.9%) for men and 30 to 34 Years (34,667 | 7.0%) for women.
| Age Bracket | Male | Female |
| Under 5 Years | 31,093 (6.1%) | 29,137 (5.9%) |
| 5 to 9 Years | 30,532 (6.0%) | 28,266 (5.7%) |
| 10 to 14 Years | 30,504 (6.0%) | 29,172 (5.9%) |
| 15 to 19 Years | 28,619 (5.6%) | 25,796 (5.2%) |
| 20 to 24 Years | 40,501 (7.9%) | 29,894 (6.0%) |
| 25 to 29 Years | 40,112 (7.8%) | 34,162 (6.9%) |
| 30 to 34 Years | 38,550 (7.5%) | 34,667 (7.0%) |
| 35 to 39 Years | 36,251 (7.1%) | 33,201 (6.7%) |
| 40 to 44 Years | 32,056 (6.3%) | 30,697 (6.2%) |
| 45 to 49 Years | 30,198 (5.9%) | 29,005 (5.8%) |
| 50 to 54 Years | 30,285 (5.9%) | 29,661 (6.0%) |
| 55 to 59 Years | 30,323 (5.9%) | 29,717 (6.0%) |
| 60 to 64 Years | 29,787 (5.8%) | 30,521 (6.1%) |
| 65 to 69 Years | 26,289 (5.1%) | 29,837 (6.0%) |
| 70 to 74 Years | 21,542 (4.2%) | 22,858 (4.6%) |
| 75 to 79 Years | 15,148 (3.0%) | 18,016 (3.6%) |
| 80 to 84 Years | 9,538 (1.9%) | 12,836 (2.6%) |
| 85 Years and over | 10,757 (2.1%) | 20,572 (4.1%) |
| Total | 512,085 (100.0%) | 498,015 (100.0%) |
Families and Households in Honolulu County
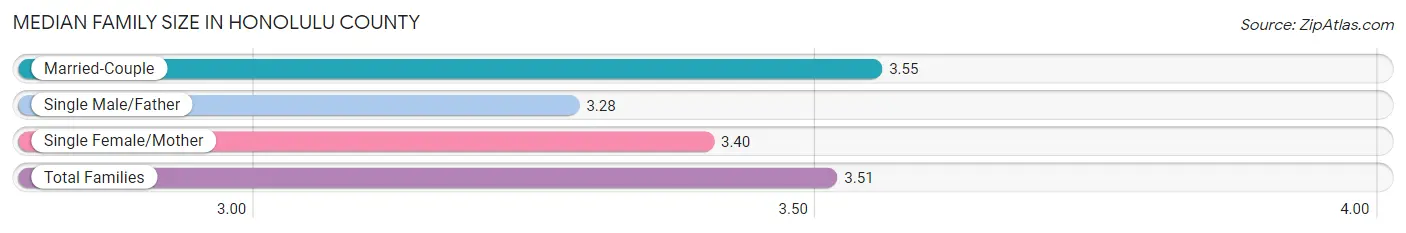
Median Family Size in Honolulu County
The median family size in Honolulu County is 3.51 persons per family, with married-couple families (169,591 | 73.9%) accounting for the largest median family size of 3.55 persons per family. On the other hand, single male/father families (18,047 | 7.9%) represent the smallest median family size with 3.28 persons per family.
| Family Type | # Families | Family Size |
| Married-Couple | 169,591 (73.9%) | 3.55 |
| Single Male/Father | 18,047 (7.9%) | 3.28 |
| Single Female/Mother | 41,846 (18.2%) | 3.40 |
| Total Families | 229,484 (100.0%) | 3.51 |
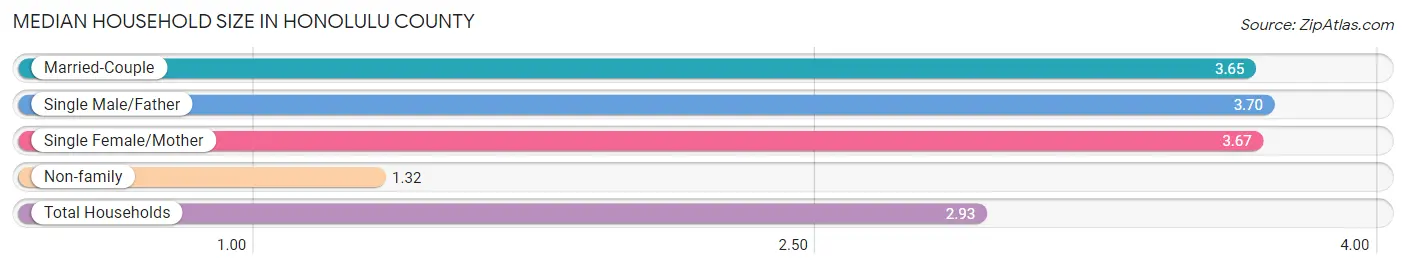
Median Household Size in Honolulu County
The median household size in Honolulu County is 2.93 persons per household, with single male/father households (18,047 | 5.4%) accounting for the largest median household size of 3.7 persons per household. non-family households (104,216 | 31.2%) represent the smallest median household size with 1.32 persons per household.
| Household Type | # Households | Household Size |
| Married-Couple | 169,591 (50.8%) | 3.65 |
| Single Male/Father | 18,047 (5.4%) | 3.70 |
| Single Female/Mother | 41,846 (12.5%) | 3.67 |
| Non-family | 104,216 (31.2%) | 1.32 |
| Total Households | 333,700 (100.0%) | 2.93 |
Household Size by Marriage Status in Honolulu County
Out of a total of 333,700 households in Honolulu County, 229,484 (68.8%) are family households, while 104,216 (31.2%) are nonfamily households. The most numerous type of family households are 2-person households, comprising 86,290, and the most common type of nonfamily households are 1-person households, comprising 82,669.
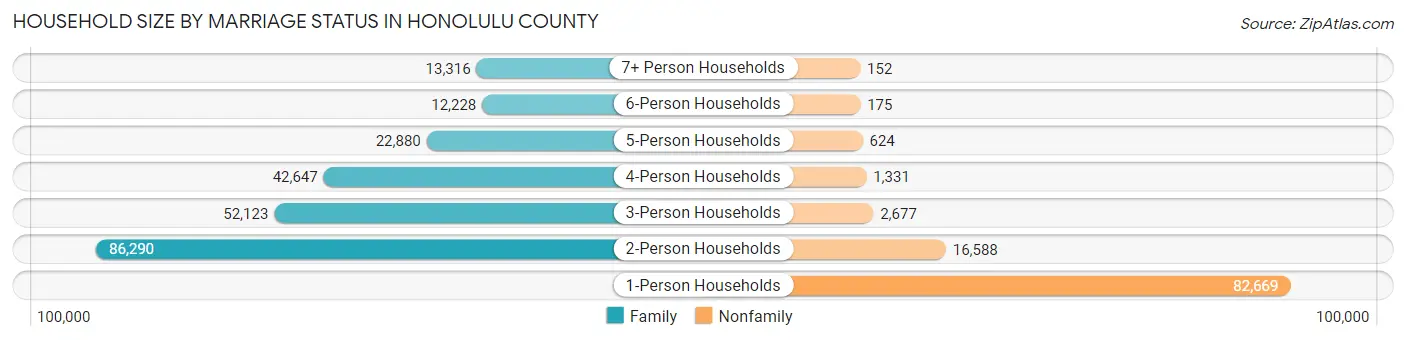
| Household Size | Family Households | Nonfamily Households |
| 1-Person Households | - | 82,669 (24.8%) |
| 2-Person Households | 86,290 (25.9%) | 16,588 (5.0%) |
| 3-Person Households | 52,123 (15.6%) | 2,677 (0.8%) |
| 4-Person Households | 42,647 (12.8%) | 1,331 (0.4%) |
| 5-Person Households | 22,880 (6.9%) | 624 (0.2%) |
| 6-Person Households | 12,228 (3.7%) | 175 (0.1%) |
| 7+ Person Households | 13,316 (4.0%) | 152 (0.1%) |
| Total | 229,484 (68.8%) | 104,216 (31.2%) |
Female Fertility in Honolulu County
Fertility by Age in Honolulu County
Average fertility rate in Honolulu County is 57.0 births per 1,000 women. Women in the age bracket of 20 to 34 years have the highest fertility rate with 81.0 births per 1,000 women. Women in the age bracket of 20 to 34 years acount for 62.3% of all women with births.
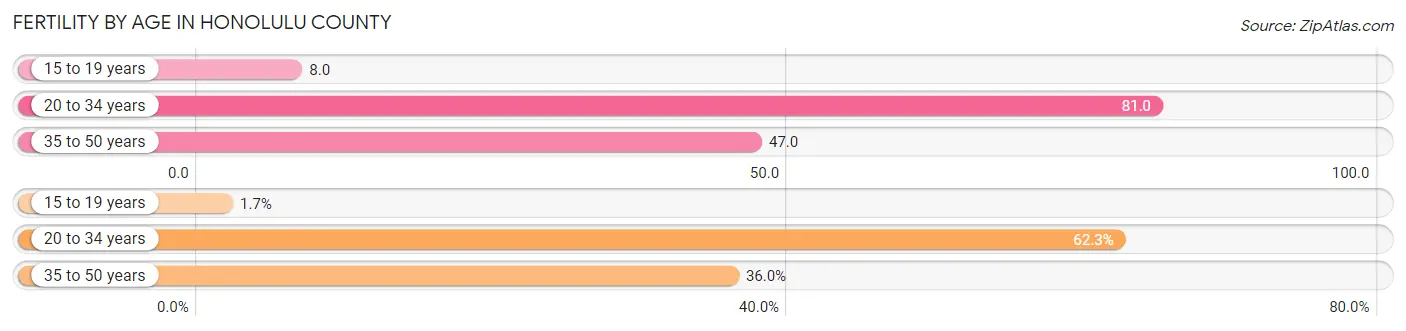
| Age Bracket | Women with Births | Births / 1,000 Women |
| 15 to 19 years | 218 (1.7%) | 8.0 |
| 20 to 34 years | 7,990 (62.3%) | 81.0 |
| 35 to 50 years | 4,623 (36.0%) | 47.0 |
| Total | 12,831 (100.0%) | 57.0 |
Fertility by Age by Marriage Status in Honolulu County
75.1% of women with births (12,831) in Honolulu County are married. The highest percentage of unmarried women with births falls into 15 to 19 years age bracket with 82.1% of them unmarried at the time of birth, while the lowest percentage of unmarried women with births belong to 35 to 50 years age bracket with 16.1% of them unmarried.
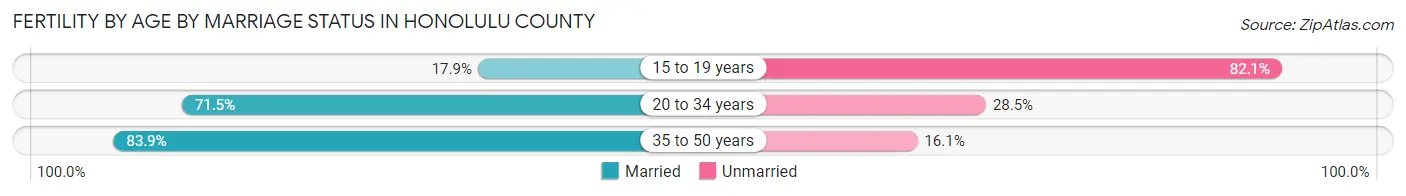
| Age Bracket | Married | Unmarried |
| 15 to 19 years | 39 (17.9%) | 179 (82.1%) |
| 20 to 34 years | 5,713 (71.5%) | 2,277 (28.5%) |
| 35 to 50 years | 3,879 (83.9%) | 744 (16.1%) |
| Total | 9,636 (75.1%) | 3,195 (24.9%) |
Fertility by Education in Honolulu County
Average fertility rate in Honolulu County is 57.0 births per 1,000 women. Women with the education attainment of high school diploma have the highest fertility rate of 64.0 births per 1,000 women, while women with the education attainment of less than high school have the lowest fertility at 29.0 births per 1,000 women. Women with the education attainment of college or associate's degree represent 31.8% of all women with births.
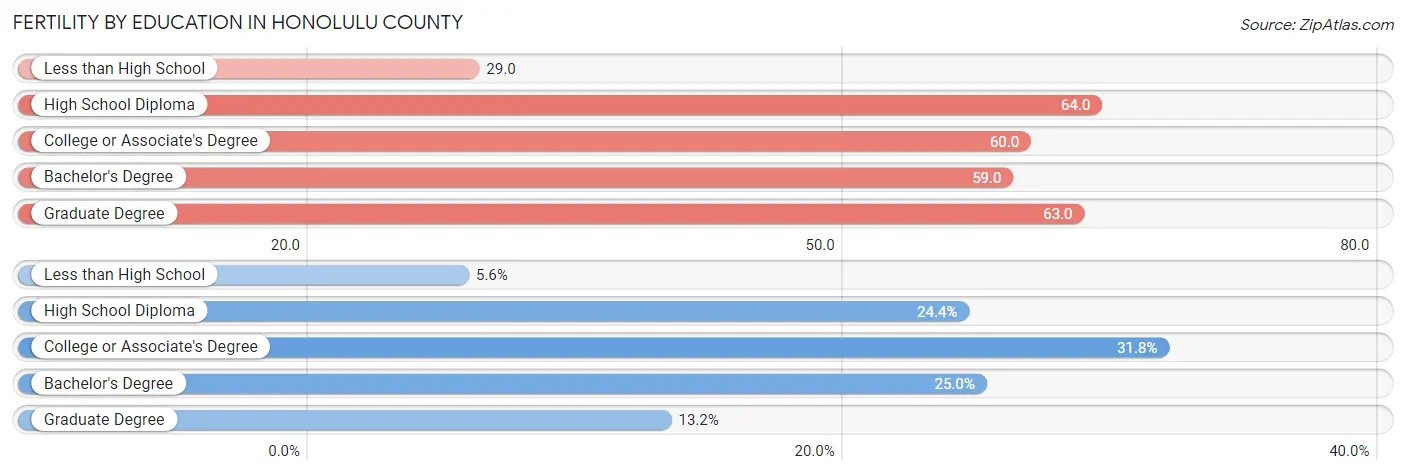
| Educational Attainment | Women with Births | Births / 1,000 Women |
| Less than High School | 720 (5.6%) | 29.0 |
| High School Diploma | 3,124 (24.3%) | 64.0 |
| College or Associate's Degree | 4,085 (31.8%) | 60.0 |
| Bachelor's Degree | 3,208 (25.0%) | 59.0 |
| Graduate Degree | 1,694 (13.2%) | 63.0 |
| Total | 12,831 (100.0%) | 57.0 |
Fertility by Education by Marriage Status in Honolulu County
24.9% of women with births in Honolulu County are unmarried. Women with the educational attainment of graduate degree are most likely to be married with 89.1% of them married at childbirth, while women with the educational attainment of less than high school are least likely to be married with 67.2% of them unmarried at childbirth.
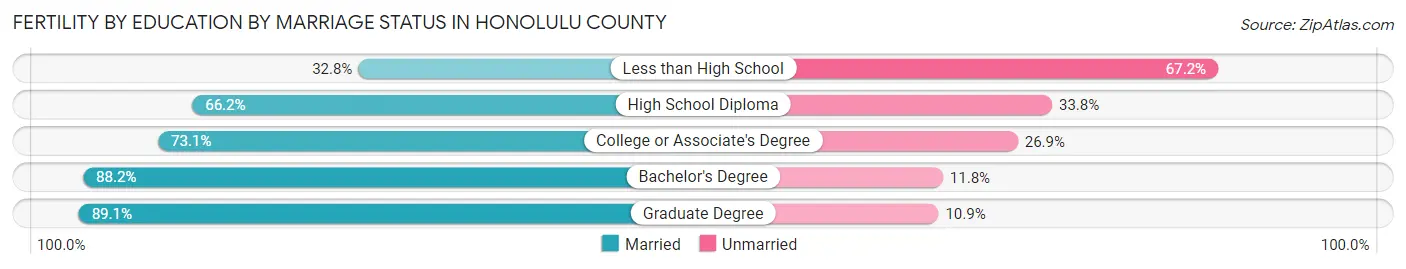
| Educational Attainment | Married | Unmarried |
| Less than High School | 236 (32.8%) | 484 (67.2%) |
| High School Diploma | 2,068 (66.2%) | 1,056 (33.8%) |
| College or Associate's Degree | 2,986 (73.1%) | 1,099 (26.9%) |
| Bachelor's Degree | 2,829 (88.2%) | 379 (11.8%) |
| Graduate Degree | 1,509 (89.1%) | 185 (10.9%) |
| Total | 9,636 (75.1%) | 3,195 (24.9%) |
Employment Characteristics in Honolulu County
Employment by Class of Employer in Honolulu County
Among the 503,138 employed individuals in Honolulu County, private company employees (266,369 | 52.9%), federal government employees (89,428 | 17.8%), and state government employees (44,838 | 8.9%) make up the most common classes of employment.
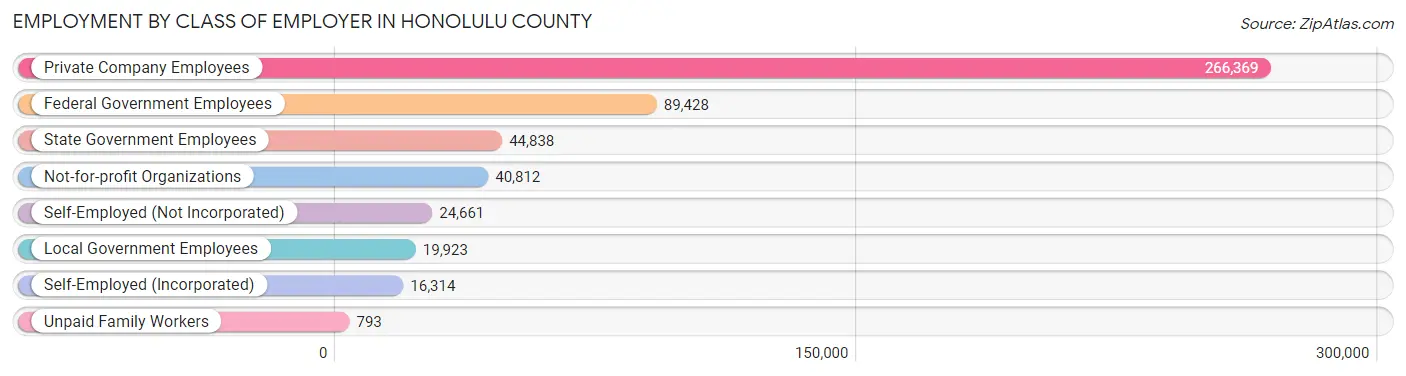
| Employer Class | # Employees | % Employees |
| Private Company Employees | 266,369 | 52.9% |
| Self-Employed (Incorporated) | 16,314 | 3.2% |
| Self-Employed (Not Incorporated) | 24,661 | 4.9% |
| Not-for-profit Organizations | 40,812 | 8.1% |
| Local Government Employees | 19,923 | 4.0% |
| State Government Employees | 44,838 | 8.9% |
| Federal Government Employees | 89,428 | 17.8% |
| Unpaid Family Workers | 793 | 0.2% |
| Total | 503,138 | 100.0% |
Employment Status by Age in Honolulu County
According to the labor force statistics for Honolulu County, out of the total population over 16 years of age (820,606), 65.8% or 539,959 individuals are in the labor force, with 4.8% or 25,918 of them unemployed. The age group with the highest labor force participation rate is 35 to 44 years, with 85.0% or 112,374 individuals in the labor force. Within the labor force, the 16 to 19 years age range has the highest percentage of unemployed individuals, with 15.8% or 2,730 of them being unemployed.
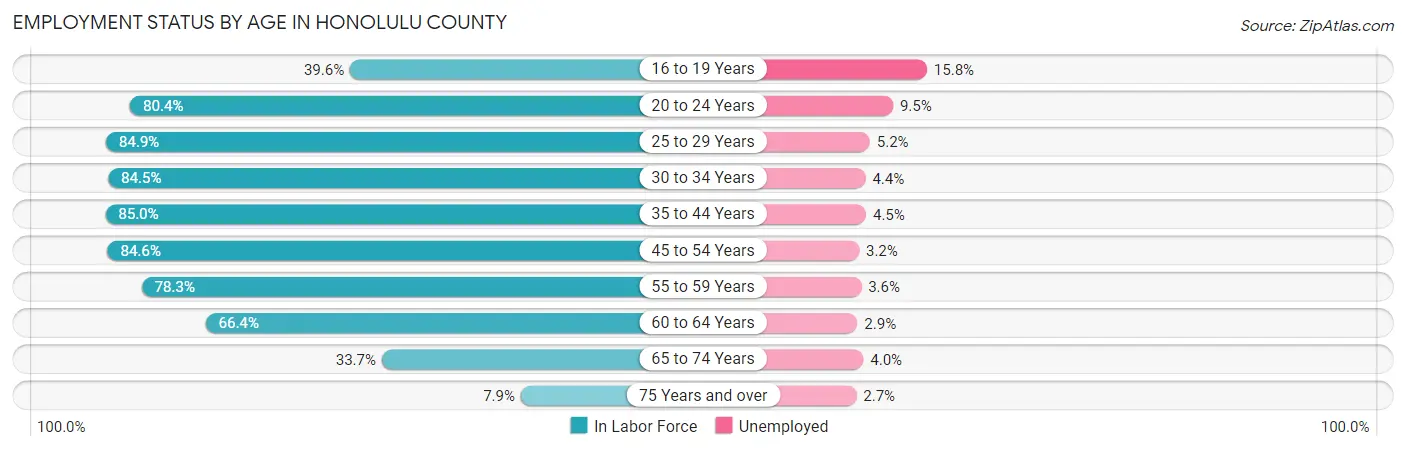
| Age Bracket | In Labor Force | Unemployed |
| 16 to 19 Years | 17,276 (39.6%) | 2,730 (15.8%) |
| 20 to 24 Years | 56,598 (80.4%) | 5,377 (9.5%) |
| 25 to 29 Years | 63,059 (84.9%) | 3,279 (5.2%) |
| 30 to 34 Years | 61,868 (84.5%) | 2,722 (4.4%) |
| 35 to 44 Years | 112,374 (85.0%) | 5,057 (4.5%) |
| 45 to 54 Years | 100,800 (84.6%) | 3,226 (3.2%) |
| 55 to 59 Years | 47,011 (78.3%) | 1,692 (3.6%) |
| 60 to 64 Years | 40,045 (66.4%) | 1,161 (2.9%) |
| 65 to 74 Years | 33,877 (33.7%) | 1,355 (4.0%) |
| 75 Years and over | 6,862 (7.9%) | 185 (2.7%) |
| Total | 539,959 (65.8%) | 25,918 (4.8%) |
Employment Status by Educational Attainment in Honolulu County
According to labor force statistics for Honolulu County, 81.9% of individuals (425,219) out of the total population between 25 and 64 years of age (519,193) are in the labor force, with 4.0% or 17,009 of them being unemployed. The group with the highest labor force participation rate are those with the educational attainment of bachelor's degree or higher, with 88.2% or 174,815 individuals in the labor force. Within the labor force, individuals with less than high school education have the highest percentage of unemployment, with 6.8% or 1,175 of them being unemployed.
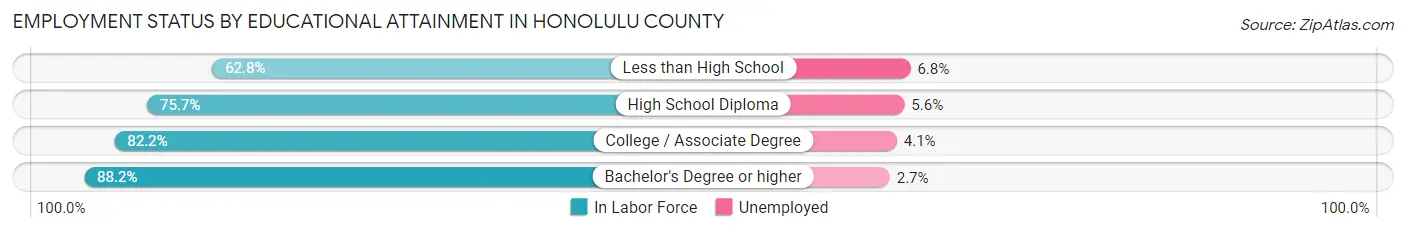
| Educational Attainment | In Labor Force | Unemployed |
| Less than High School | 17,275 (62.8%) | 1,871 (6.8%) |
| High School Diploma | 96,701 (75.7%) | 7,154 (5.6%) |
| College / Associate Degree | 136,237 (82.2%) | 6,795 (4.1%) |
| Bachelor's Degree or higher | 174,815 (88.2%) | 5,351 (2.7%) |
| Total | 425,219 (81.9%) | 20,768 (4.0%) |
Employment Occupations by Sex in Honolulu County
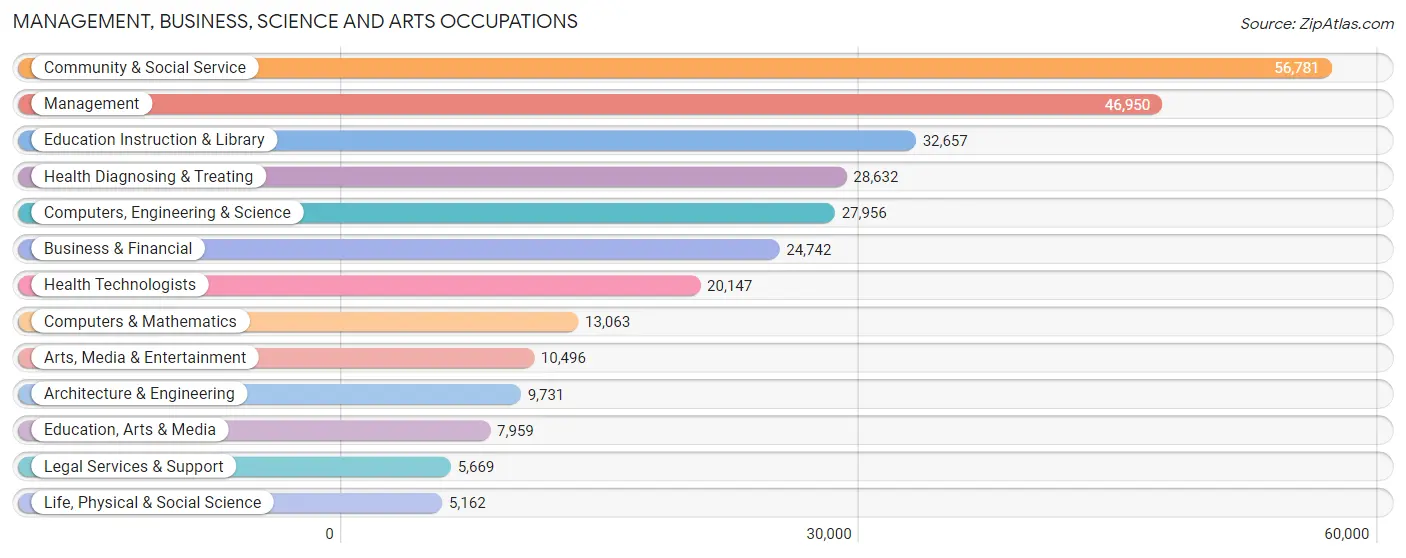
Management, Business, Science and Arts Occupations
The most common Management, Business, Science and Arts occupations in Honolulu County are Community & Social Service (56,781 | 12.1%), Management (46,950 | 10.0%), Education Instruction & Library (32,657 | 7.0%), Health Diagnosing & Treating (28,632 | 6.1%), and Computers, Engineering & Science (27,956 | 6.0%).
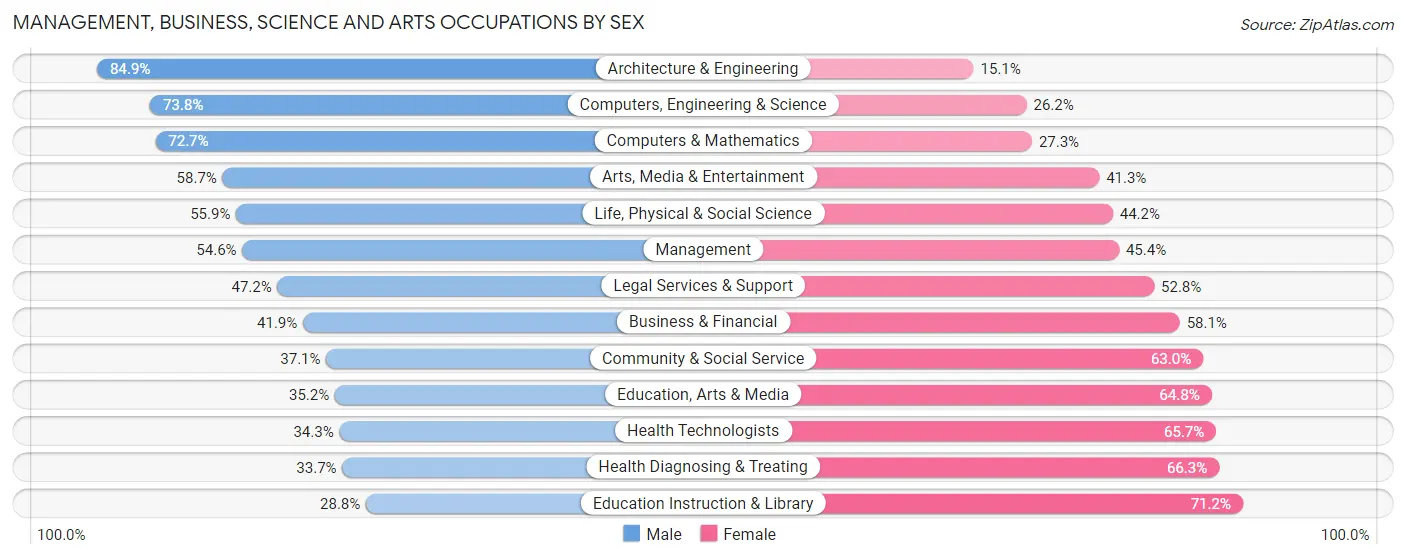
Management, Business, Science and Arts Occupations by Sex
Within the Management, Business, Science and Arts occupations in Honolulu County, the most male-oriented occupations are Architecture & Engineering (84.9%), Computers, Engineering & Science (73.8%), and Computers & Mathematics (72.7%), while the most female-oriented occupations are Education Instruction & Library (71.2%), Health Diagnosing & Treating (66.3%), and Health Technologists (65.7%).
| Occupation | Male | Female |
| Management | 25,614 (54.6%) | 21,336 (45.4%) |
| Business & Financial | 10,366 (41.9%) | 14,376 (58.1%) |
| Computers, Engineering & Science | 20,644 (73.8%) | 7,312 (26.2%) |
| Computers & Mathematics | 9,500 (72.7%) | 3,563 (27.3%) |
| Architecture & Engineering | 8,261 (84.9%) | 1,470 (15.1%) |
| Life, Physical & Social Science | 2,883 (55.8%) | 2,279 (44.2%) |
| Community & Social Service | 21,035 (37.0%) | 35,746 (62.9%) |
| Education, Arts & Media | 2,805 (35.2%) | 5,154 (64.8%) |
| Legal Services & Support | 2,678 (47.2%) | 2,991 (52.8%) |
| Education Instruction & Library | 9,392 (28.8%) | 23,265 (71.2%) |
| Arts, Media & Entertainment | 6,160 (58.7%) | 4,336 (41.3%) |
| Health Diagnosing & Treating | 9,649 (33.7%) | 18,983 (66.3%) |
| Health Technologists | 6,913 (34.3%) | 13,234 (65.7%) |
| Total (Category) | 87,308 (47.2%) | 97,753 (52.8%) |
| Total (Overall) | 240,663 (51.4%) | 227,450 (48.6%) |
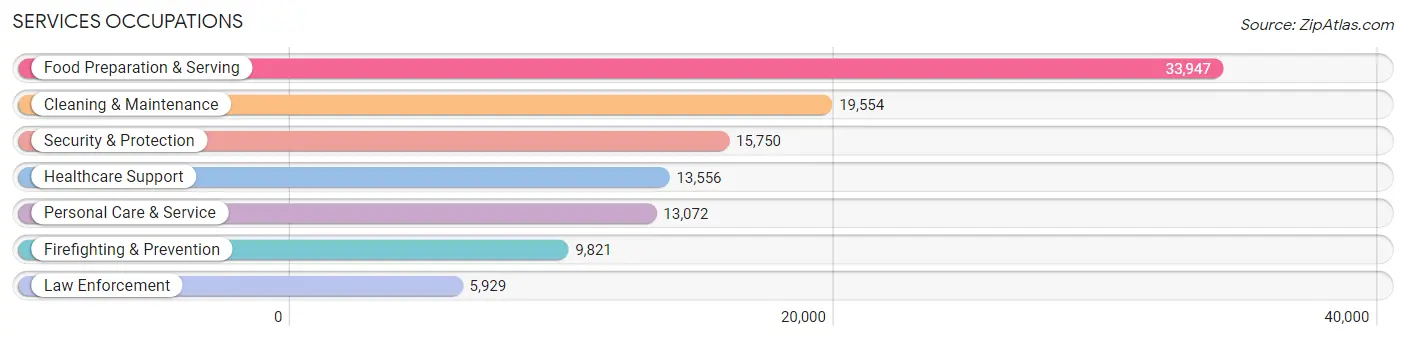
Services Occupations
The most common Services occupations in Honolulu County are Food Preparation & Serving (33,947 | 7.2%), Cleaning & Maintenance (19,554 | 4.2%), Security & Protection (15,750 | 3.4%), Healthcare Support (13,556 | 2.9%), and Personal Care & Service (13,072 | 2.8%).
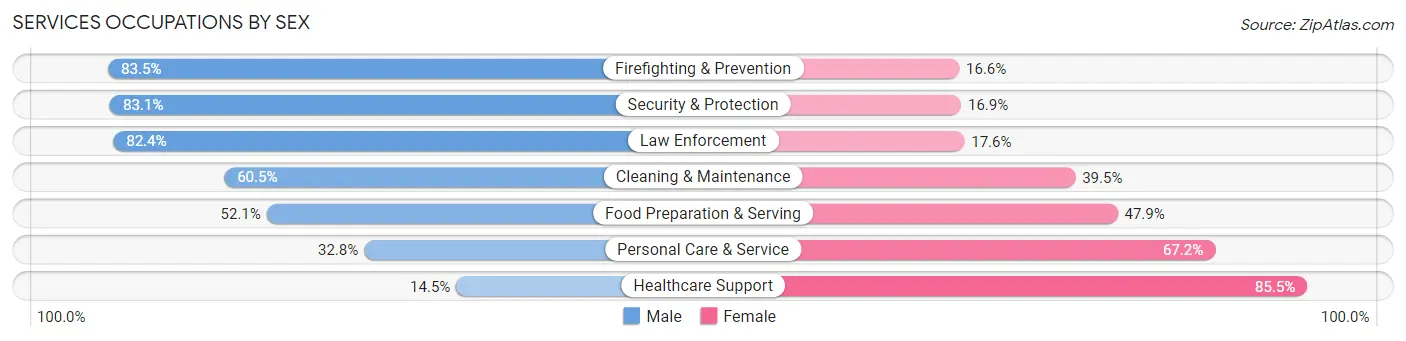
Services Occupations by Sex
Within the Services occupations in Honolulu County, the most male-oriented occupations are Firefighting & Prevention (83.5%), Security & Protection (83.1%), and Law Enforcement (82.4%), while the most female-oriented occupations are Healthcare Support (85.5%), Personal Care & Service (67.2%), and Food Preparation & Serving (47.9%).
| Occupation | Male | Female |
| Healthcare Support | 1,971 (14.5%) | 11,585 (85.5%) |
| Security & Protection | 13,083 (83.1%) | 2,667 (16.9%) |
| Firefighting & Prevention | 8,196 (83.5%) | 1,625 (16.6%) |
| Law Enforcement | 4,887 (82.4%) | 1,042 (17.6%) |
| Food Preparation & Serving | 17,681 (52.1%) | 16,266 (47.9%) |
| Cleaning & Maintenance | 11,822 (60.5%) | 7,732 (39.5%) |
| Personal Care & Service | 4,285 (32.8%) | 8,787 (67.2%) |
| Total (Category) | 48,842 (50.9%) | 47,037 (49.1%) |
| Total (Overall) | 240,663 (51.4%) | 227,450 (48.6%) |
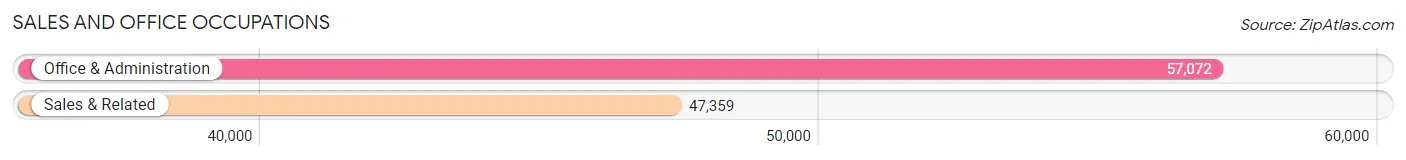
Sales and Office Occupations
The most common Sales and Office occupations in Honolulu County are Office & Administration (57,072 | 12.2%), and Sales & Related (47,359 | 10.1%).
Sales and Office Occupations by Sex
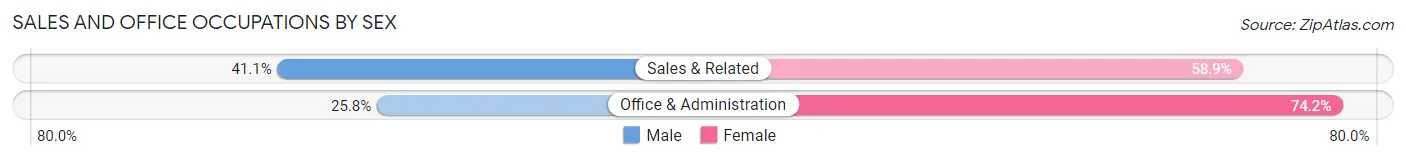
| Occupation | Male | Female |
| Sales & Related | 19,453 (41.1%) | 27,906 (58.9%) |
| Office & Administration | 14,709 (25.8%) | 42,363 (74.2%) |
| Total (Category) | 34,162 (32.7%) | 70,269 (67.3%) |
| Total (Overall) | 240,663 (51.4%) | 227,450 (48.6%) |
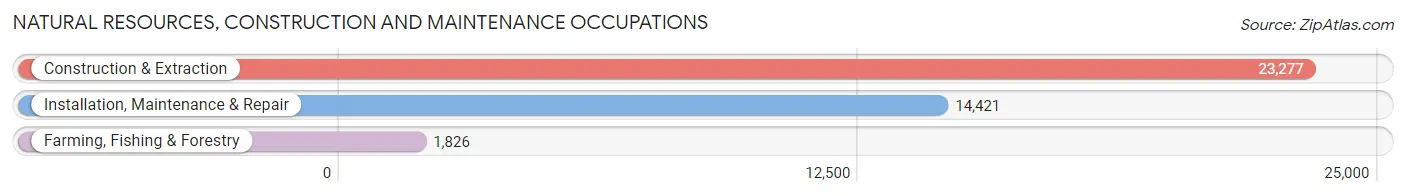
Natural Resources, Construction and Maintenance Occupations
The most common Natural Resources, Construction and Maintenance occupations in Honolulu County are Construction & Extraction (23,277 | 5.0%), Installation, Maintenance & Repair (14,421 | 3.1%), and Farming, Fishing & Forestry (1,826 | 0.4%).
Natural Resources, Construction and Maintenance Occupations by Sex
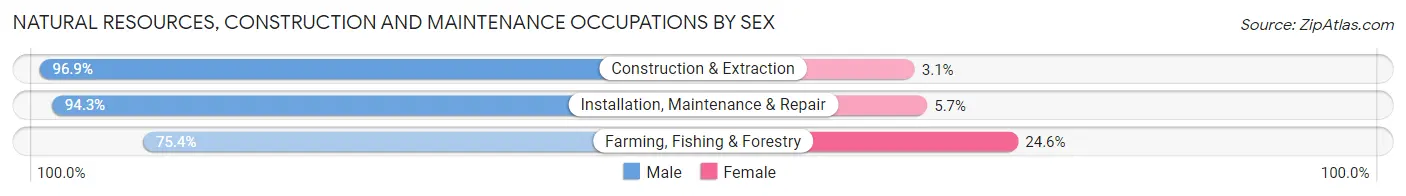
| Occupation | Male | Female |
| Farming, Fishing & Forestry | 1,376 (75.4%) | 450 (24.6%) |
| Construction & Extraction | 22,554 (96.9%) | 723 (3.1%) |
| Installation, Maintenance & Repair | 13,601 (94.3%) | 820 (5.7%) |
| Total (Category) | 37,531 (95.0%) | 1,993 (5.0%) |
| Total (Overall) | 240,663 (51.4%) | 227,450 (48.6%) |
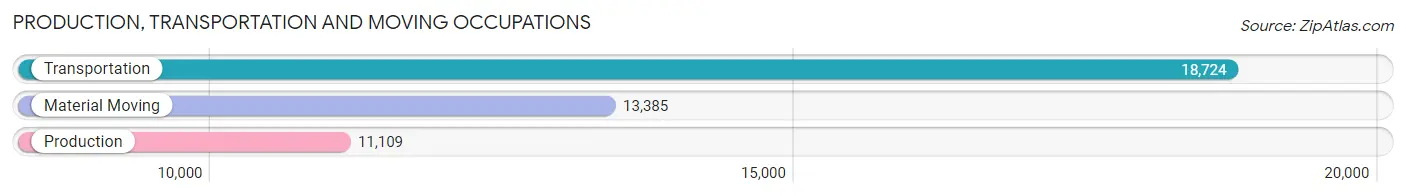
Production, Transportation and Moving Occupations
The most common Production, Transportation and Moving occupations in Honolulu County are Transportation (18,724 | 4.0%), Material Moving (13,385 | 2.9%), and Production (11,109 | 2.4%).
Production, Transportation and Moving Occupations by Sex
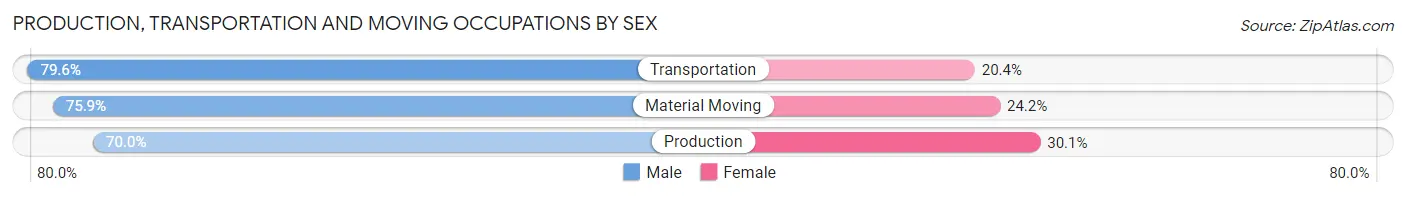
| Occupation | Male | Female |
| Production | 7,771 (70.0%) | 3,338 (30.0%) |
| Transportation | 14,897 (79.6%) | 3,827 (20.4%) |
| Material Moving | 10,152 (75.8%) | 3,233 (24.1%) |
| Total (Category) | 32,820 (75.9%) | 10,398 (24.1%) |
| Total (Overall) | 240,663 (51.4%) | 227,450 (48.6%) |
Employment Industries by Sex in Honolulu County
Employment Industries in Honolulu County
The major employment industries in Honolulu County include Health Care & Social Assistance (60,429 | 12.9%), Accommodation & Food Services (54,275 | 11.6%), Retail Trade (49,859 | 10.6%), Educational Services (47,310 | 10.1%), and Public Administration (46,141 | 9.9%).
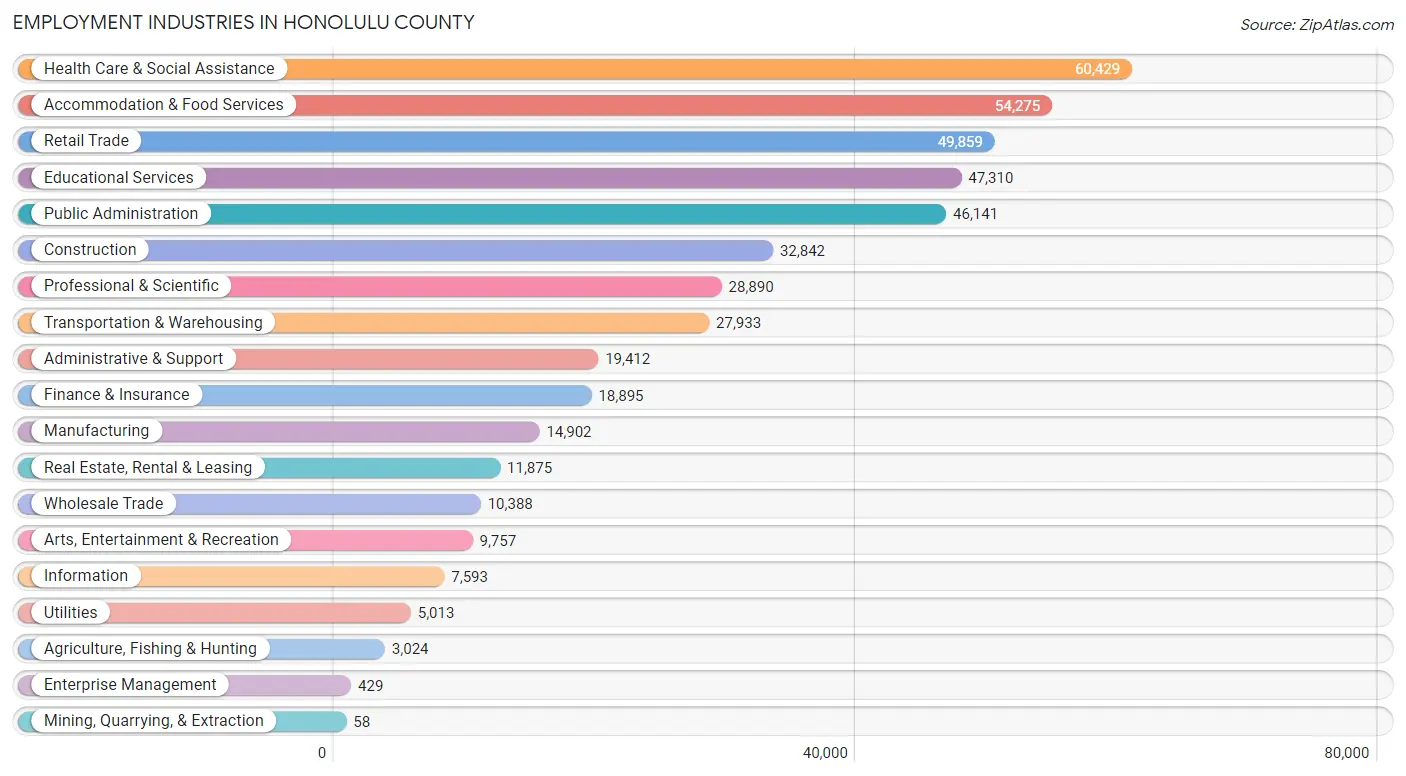
Employment Industries by Sex in Honolulu County
The Honolulu County industries that see more men than women are Mining, Quarrying, & Extraction (96.6%), Construction (86.5%), and Utilities (74.1%), whereas the industries that tend to have a higher number of women are Health Care & Social Assistance (72.4%), Educational Services (63.5%), and Finance & Insurance (60.9%).
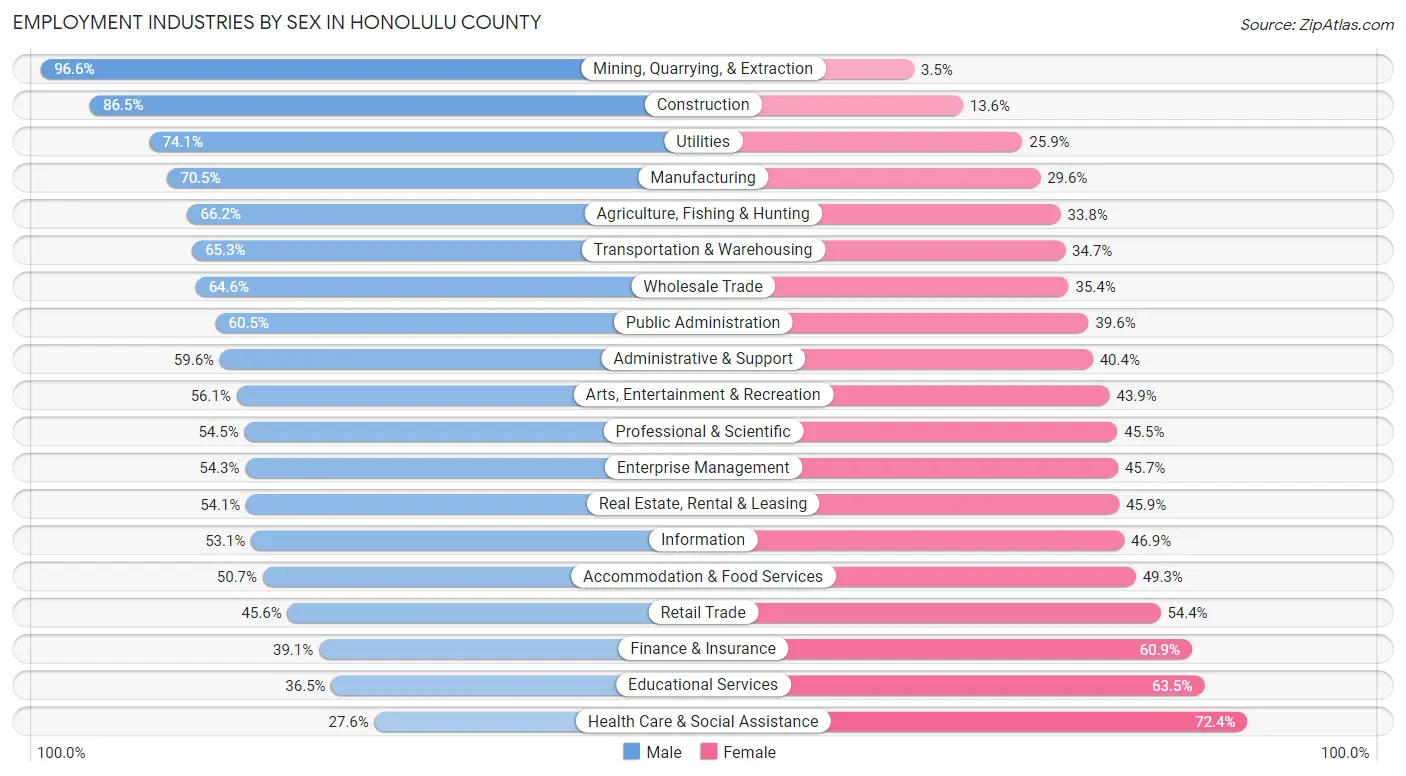
| Industry | Male | Female |
| Agriculture, Fishing & Hunting | 2,003 (66.2%) | 1,021 (33.8%) |
| Mining, Quarrying, & Extraction | 56 (96.6%) | 2 (3.5%) |
| Construction | 28,392 (86.5%) | 4,450 (13.6%) |
| Manufacturing | 10,498 (70.5%) | 4,404 (29.5%) |
| Wholesale Trade | 6,709 (64.6%) | 3,679 (35.4%) |
| Retail Trade | 22,717 (45.6%) | 27,142 (54.4%) |
| Transportation & Warehousing | 18,241 (65.3%) | 9,692 (34.7%) |
| Utilities | 3,716 (74.1%) | 1,297 (25.9%) |
| Information | 4,032 (53.1%) | 3,561 (46.9%) |
| Finance & Insurance | 7,380 (39.1%) | 11,515 (60.9%) |
| Real Estate, Rental & Leasing | 6,428 (54.1%) | 5,447 (45.9%) |
| Professional & Scientific | 15,741 (54.5%) | 13,149 (45.5%) |
| Enterprise Management | 233 (54.3%) | 196 (45.7%) |
| Administrative & Support | 11,563 (59.6%) | 7,849 (40.4%) |
| Educational Services | 17,269 (36.5%) | 30,041 (63.5%) |
| Health Care & Social Assistance | 16,656 (27.6%) | 43,773 (72.4%) |
| Arts, Entertainment & Recreation | 5,473 (56.1%) | 4,284 (43.9%) |
| Accommodation & Food Services | 27,505 (50.7%) | 26,770 (49.3%) |
| Public Administration | 27,892 (60.5%) | 18,249 (39.6%) |
| Total | 240,663 (51.4%) | 227,450 (48.6%) |
Education in Honolulu County
School Enrollment in Honolulu County
The most common levels of schooling among the 232,786 students in Honolulu County are college / undergraduate (56,390 | 24.2%), middle school (45,625 | 19.6%), and elementary school (44,959 | 19.3%).
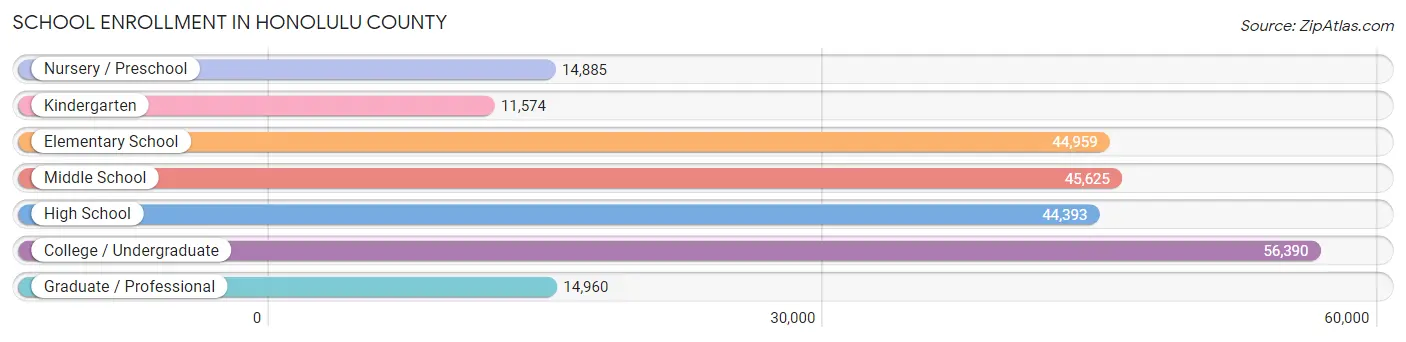
| School Level | # Students | % Students |
| Nursery / Preschool | 14,885 | 6.4% |
| Kindergarten | 11,574 | 5.0% |
| Elementary School | 44,959 | 19.3% |
| Middle School | 45,625 | 19.6% |
| High School | 44,393 | 19.1% |
| College / Undergraduate | 56,390 | 24.2% |
| Graduate / Professional | 14,960 | 6.4% |
| Total | 232,786 | 100.0% |
School Enrollment by Age by Funding Source in Honolulu County
Out of a total of 232,786 students who are enrolled in schools in Honolulu County, 59,360 (25.5%) attend a private institution, while the remaining 173,426 (74.5%) are enrolled in public schools. The age group of 3 to 4 year olds has the highest likelihood of being enrolled in private schools, with 7,507 (63.3% in the age bracket) enrolled. Conversely, the age group of 10 to 14 year olds has the lowest likelihood of being enrolled in a private school, with 45,421 (78.5% in the age bracket) attending a public institution.
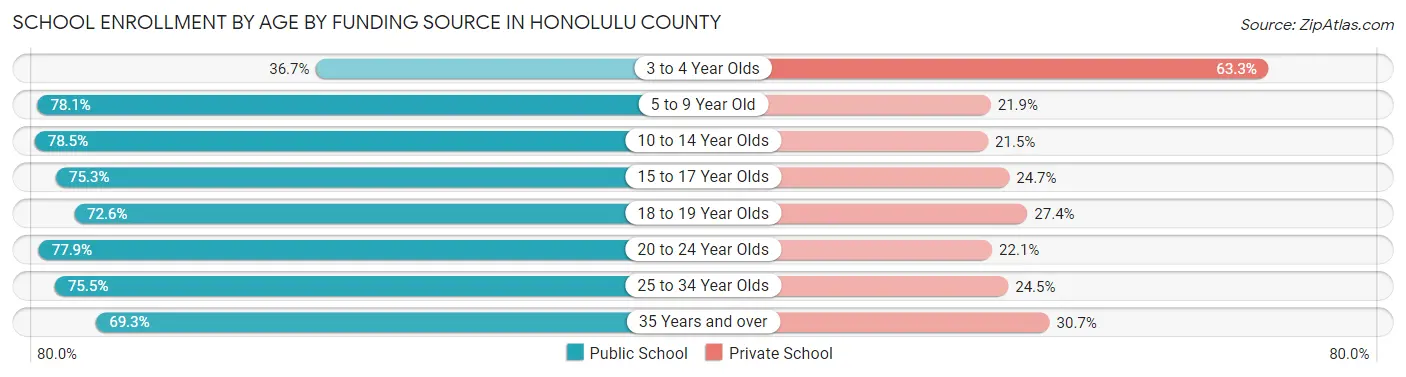
| Age Bracket | Public School | Private School |
| 3 to 4 Year Olds | 4,348 (36.7%) | 7,507 (63.3%) |
| 5 to 9 Year Old | 42,985 (78.1%) | 12,064 (21.9%) |
| 10 to 14 Year Olds | 45,421 (78.5%) | 12,460 (21.5%) |
| 15 to 17 Year Olds | 23,571 (75.3%) | 7,729 (24.7%) |
| 18 to 19 Year Olds | 10,072 (72.6%) | 3,798 (27.4%) |
| 20 to 24 Year Olds | 19,167 (77.9%) | 5,446 (22.1%) |
| 25 to 34 Year Olds | 15,928 (75.5%) | 5,178 (24.5%) |
| 35 Years and over | 11,861 (69.3%) | 5,251 (30.7%) |
| Total | 173,426 (74.5%) | 59,360 (25.5%) |
Educational Attainment by Field of Study in Honolulu County
Business (53,788 | 19.5%), social sciences (29,060 | 10.5%), science & technology (28,176 | 10.2%), education (27,102 | 9.8%), and engineering (19,550 | 7.1%) are the most common fields of study among 276,094 individuals in Honolulu County who have obtained a bachelor's degree or higher.
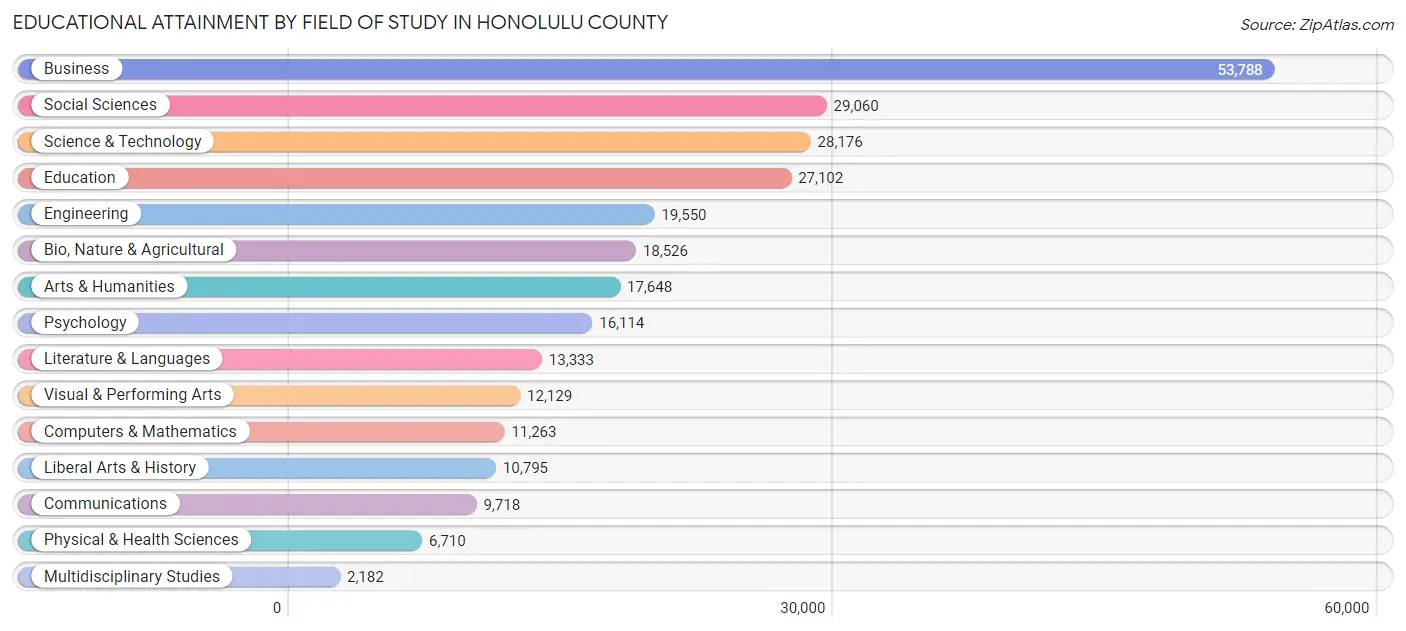
| Field of Study | # Graduates | % Graduates |
| Computers & Mathematics | 11,263 | 4.1% |
| Bio, Nature & Agricultural | 18,526 | 6.7% |
| Physical & Health Sciences | 6,710 | 2.4% |
| Psychology | 16,114 | 5.8% |
| Social Sciences | 29,060 | 10.5% |
| Engineering | 19,550 | 7.1% |
| Multidisciplinary Studies | 2,182 | 0.8% |
| Science & Technology | 28,176 | 10.2% |
| Business | 53,788 | 19.5% |
| Education | 27,102 | 9.8% |
| Literature & Languages | 13,333 | 4.8% |
| Liberal Arts & History | 10,795 | 3.9% |
| Visual & Performing Arts | 12,129 | 4.4% |
| Communications | 9,718 | 3.5% |
| Arts & Humanities | 17,648 | 6.4% |
| Total | 276,094 | 100.0% |
Transportation & Commute in Honolulu County
Vehicle Availability by Sex in Honolulu County
The most prevalent vehicle ownership categories in Honolulu County are males with 2 vehicles (93,565, accounting for 35.7%) and females with 2 vehicles (76,064, making up 41.8%).
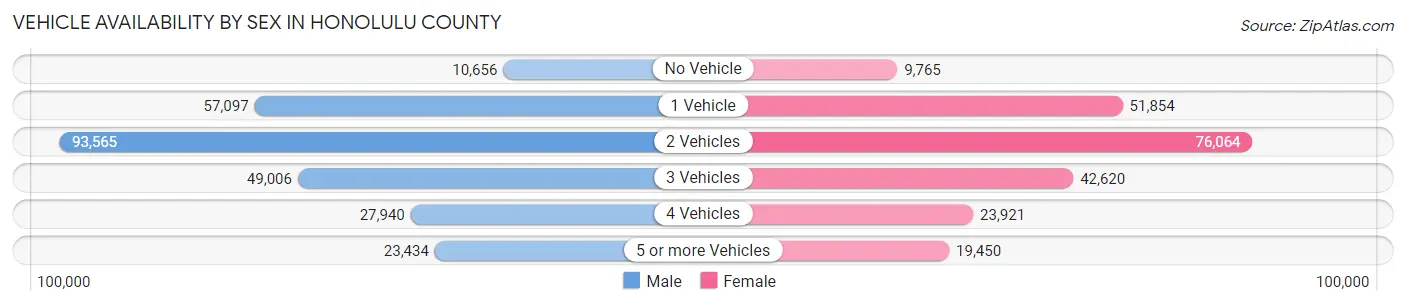
| Vehicles Available | Male | Female |
| No Vehicle | 10,656 (4.1%) | 9,765 (4.4%) |
| 1 Vehicle | 57,097 (21.8%) | 51,854 (23.2%) |
| 2 Vehicles | 93,565 (35.7%) | 76,064 (34.0%) |
| 3 Vehicles | 49,006 (18.7%) | 42,620 (19.1%) |
| 4 Vehicles | 27,940 (10.7%) | 23,921 (10.7%) |
| 5 or more Vehicles | 23,434 (8.9%) | 19,450 (8.7%) |
| Total | 261,698 (100.0%) | 223,674 (100.0%) |
Commute Time in Honolulu County
The most frequently occuring commute durations in Honolulu County are 30 to 34 minutes (87,056 commuters, 18.7%), 15 to 19 minutes (67,954 commuters, 14.6%), and 20 to 24 minutes (65,828 commuters, 14.1%).
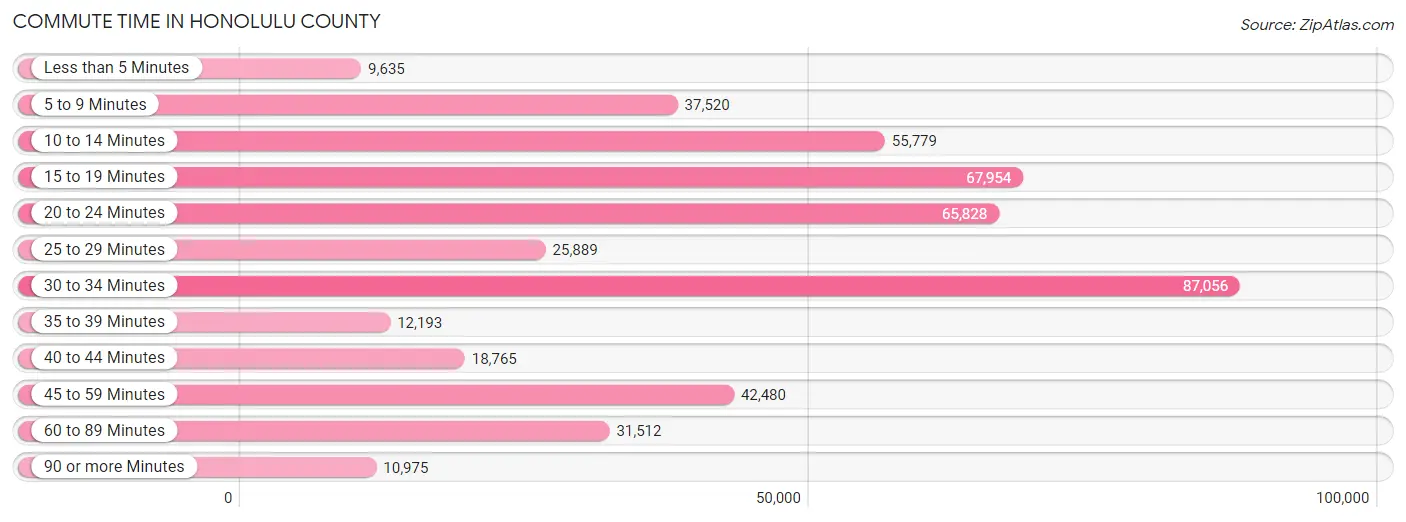
| Commute Time | # Commuters | % Commuters |
| Less than 5 Minutes | 9,635 | 2.1% |
| 5 to 9 Minutes | 37,520 | 8.1% |
| 10 to 14 Minutes | 55,779 | 12.0% |
| 15 to 19 Minutes | 67,954 | 14.6% |
| 20 to 24 Minutes | 65,828 | 14.1% |
| 25 to 29 Minutes | 25,889 | 5.6% |
| 30 to 34 Minutes | 87,056 | 18.7% |
| 35 to 39 Minutes | 12,193 | 2.6% |
| 40 to 44 Minutes | 18,765 | 4.0% |
| 45 to 59 Minutes | 42,480 | 9.1% |
| 60 to 89 Minutes | 31,512 | 6.8% |
| 90 or more Minutes | 10,975 | 2.4% |
Commute Time by Sex in Honolulu County
The most common commute times in Honolulu County are 30 to 34 minutes (50,541 commuters, 19.5%) for males and 30 to 34 minutes (36,515 commuters, 17.7%) for females.
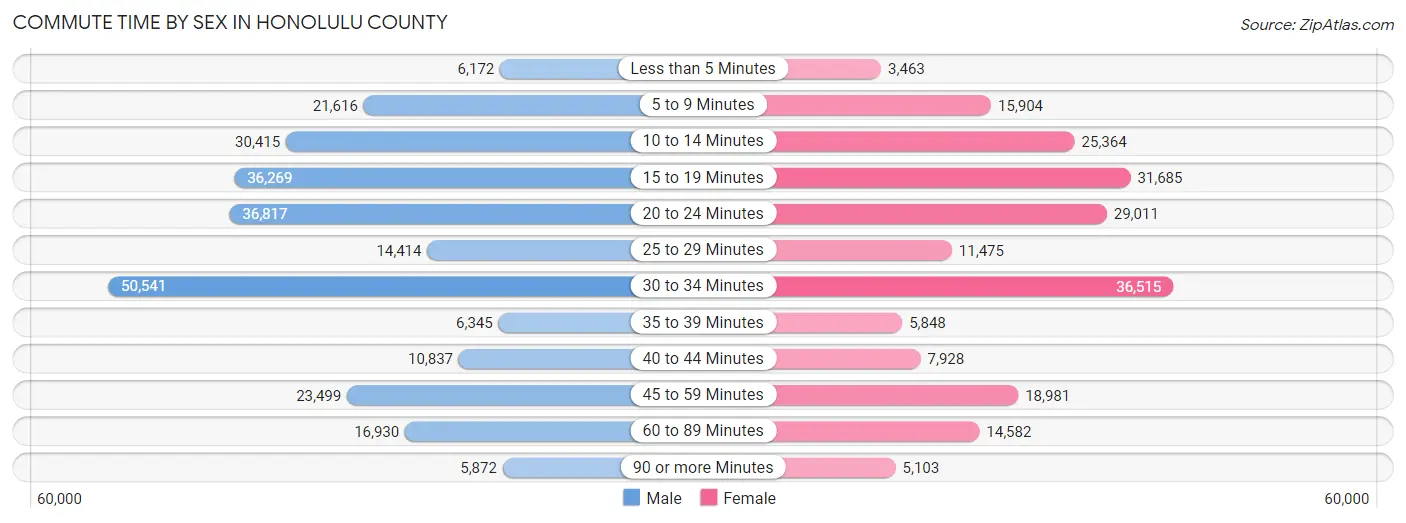
| Commute Time | Male | Female |
| Less than 5 Minutes | 6,172 (2.4%) | 3,463 (1.7%) |
| 5 to 9 Minutes | 21,616 (8.3%) | 15,904 (7.7%) |
| 10 to 14 Minutes | 30,415 (11.7%) | 25,364 (12.3%) |
| 15 to 19 Minutes | 36,269 (14.0%) | 31,685 (15.4%) |
| 20 to 24 Minutes | 36,817 (14.2%) | 29,011 (14.1%) |
| 25 to 29 Minutes | 14,414 (5.6%) | 11,475 (5.6%) |
| 30 to 34 Minutes | 50,541 (19.5%) | 36,515 (17.7%) |
| 35 to 39 Minutes | 6,345 (2.4%) | 5,848 (2.8%) |
| 40 to 44 Minutes | 10,837 (4.2%) | 7,928 (3.8%) |
| 45 to 59 Minutes | 23,499 (9.0%) | 18,981 (9.2%) |
| 60 to 89 Minutes | 16,930 (6.5%) | 14,582 (7.1%) |
| 90 or more Minutes | 5,872 (2.3%) | 5,103 (2.5%) |
Time of Departure to Work by Sex in Honolulu County
The most frequent times of departure to work in Honolulu County are 6:00 AM to 6:29 AM (32,490, 12.5%) for males and 7:00 AM to 7:29 AM (31,551, 15.3%) for females.
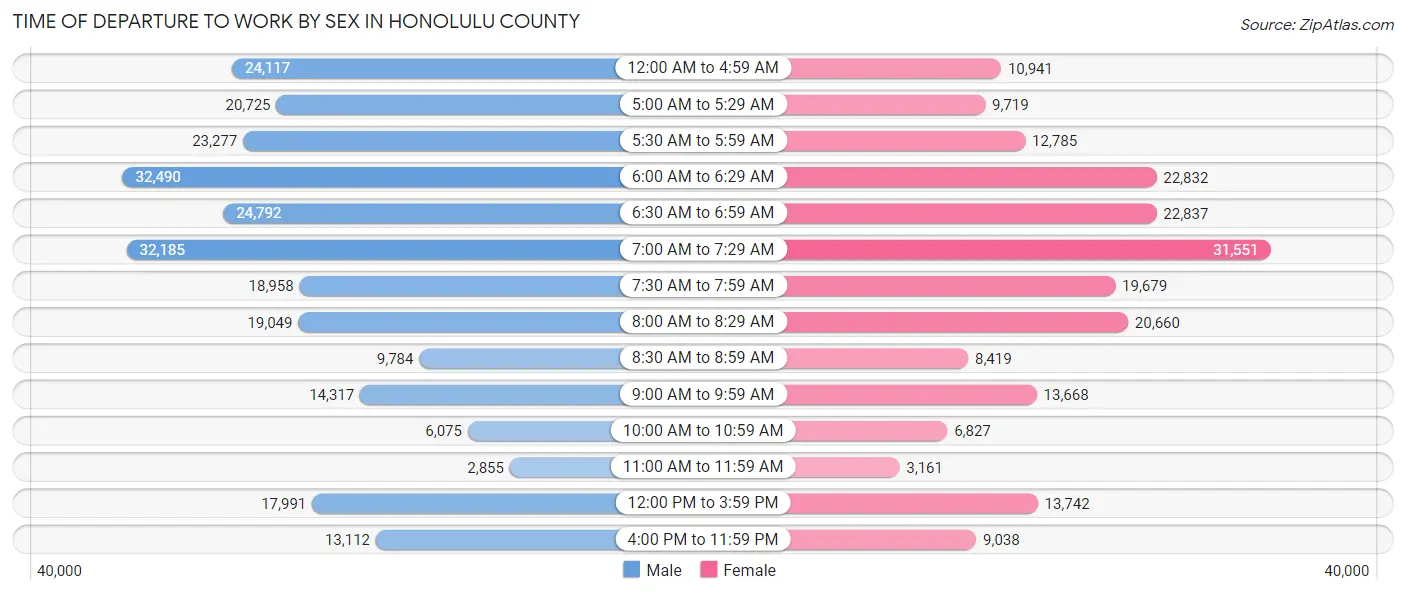
| Time of Departure | Male | Female |
| 12:00 AM to 4:59 AM | 24,117 (9.3%) | 10,941 (5.3%) |
| 5:00 AM to 5:29 AM | 20,725 (8.0%) | 9,719 (4.7%) |
| 5:30 AM to 5:59 AM | 23,277 (9.0%) | 12,785 (6.2%) |
| 6:00 AM to 6:29 AM | 32,490 (12.5%) | 22,832 (11.1%) |
| 6:30 AM to 6:59 AM | 24,792 (9.6%) | 22,837 (11.1%) |
| 7:00 AM to 7:29 AM | 32,185 (12.4%) | 31,551 (15.3%) |
| 7:30 AM to 7:59 AM | 18,958 (7.3%) | 19,679 (9.6%) |
| 8:00 AM to 8:29 AM | 19,049 (7.3%) | 20,660 (10.0%) |
| 8:30 AM to 8:59 AM | 9,784 (3.8%) | 8,419 (4.1%) |
| 9:00 AM to 9:59 AM | 14,317 (5.5%) | 13,668 (6.6%) |
| 10:00 AM to 10:59 AM | 6,075 (2.3%) | 6,827 (3.3%) |
| 11:00 AM to 11:59 AM | 2,855 (1.1%) | 3,161 (1.5%) |
| 12:00 PM to 3:59 PM | 17,991 (6.9%) | 13,742 (6.7%) |
| 4:00 PM to 11:59 PM | 13,112 (5.1%) | 9,038 (4.4%) |
| Total | 259,727 (100.0%) | 205,859 (100.0%) |
Housing Occupancy in Honolulu County
Occupancy by Ownership in Honolulu County
Of the total 333,700 dwellings in Honolulu County, owner-occupied units account for 196,384 (58.9%), while renter-occupied units make up 137,316 (41.1%).
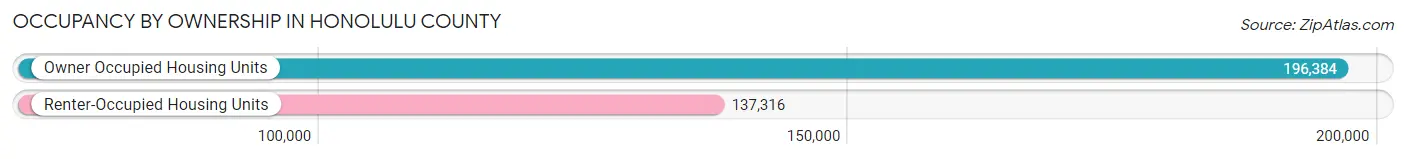
| Occupancy | # Housing Units | % Housing Units |
| Owner Occupied Housing Units | 196,384 | 58.9% |
| Renter-Occupied Housing Units | 137,316 | 41.1% |
| Total Occupied Housing Units | 333,700 | 100.0% |
Occupancy by Household Size in Honolulu County
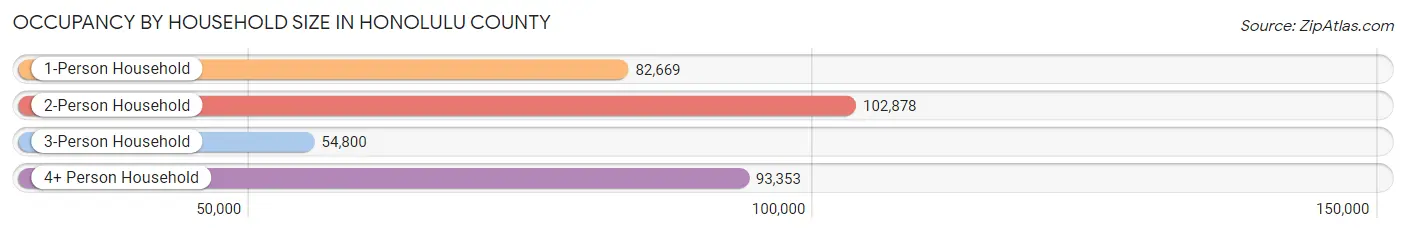
| Household Size | # Housing Units | % Housing Units |
| 1-Person Household | 82,669 | 24.8% |
| 2-Person Household | 102,878 | 30.8% |
| 3-Person Household | 54,800 | 16.4% |
| 4+ Person Household | 93,353 | 28.0% |
| Total Housing Units | 333,700 | 100.0% |
Occupancy by Ownership by Household Size in Honolulu County
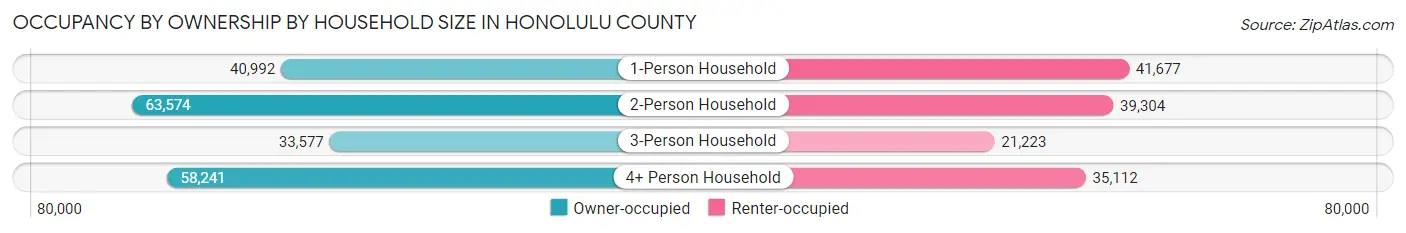
| Household Size | Owner-occupied | Renter-occupied |
| 1-Person Household | 40,992 (49.6%) | 41,677 (50.4%) |
| 2-Person Household | 63,574 (61.8%) | 39,304 (38.2%) |
| 3-Person Household | 33,577 (61.3%) | 21,223 (38.7%) |
| 4+ Person Household | 58,241 (62.4%) | 35,112 (37.6%) |
| Total Housing Units | 196,384 (58.9%) | 137,316 (41.1%) |
Occupancy by Educational Attainment in Honolulu County
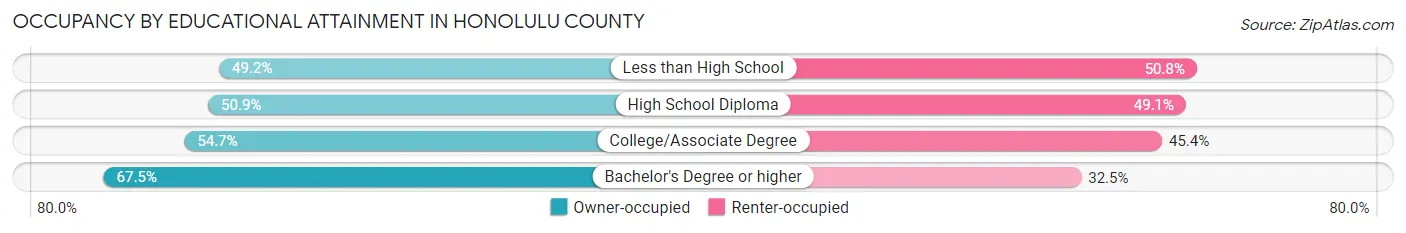
| Household Size | Owner-occupied | Renter-occupied |
| Less than High School | 8,637 (49.2%) | 8,931 (50.8%) |
| High School Diploma | 35,404 (50.9%) | 34,176 (49.1%) |
| College/Associate Degree | 59,617 (54.6%) | 49,472 (45.4%) |
| Bachelor's Degree or higher | 92,726 (67.5%) | 44,737 (32.5%) |
Occupancy by Age of Householder in Honolulu County
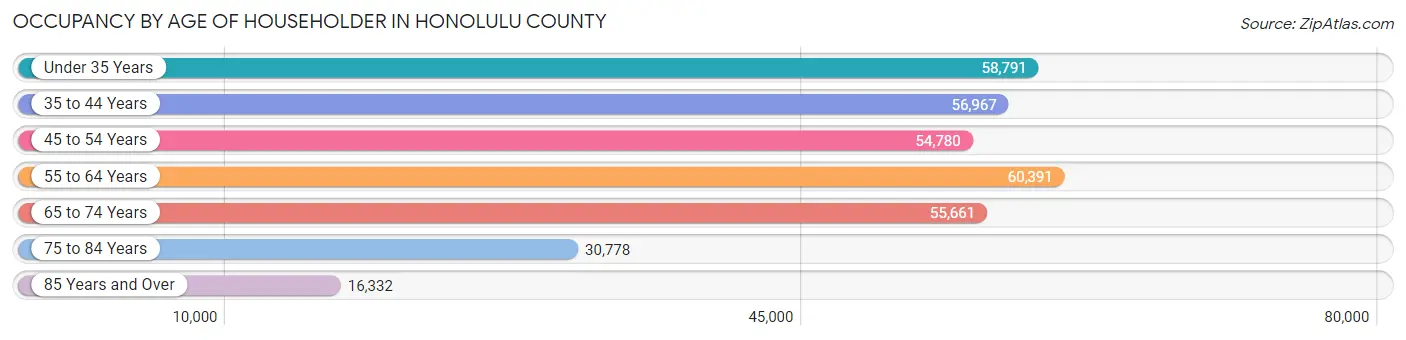
| Age Bracket | # Households | % Households |
| Under 35 Years | 58,791 | 17.6% |
| 35 to 44 Years | 56,967 | 17.1% |
| 45 to 54 Years | 54,780 | 16.4% |
| 55 to 64 Years | 60,391 | 18.1% |
| 65 to 74 Years | 55,661 | 16.7% |
| 75 to 84 Years | 30,778 | 9.2% |
| 85 Years and Over | 16,332 | 4.9% |
| Total | 333,700 | 100.0% |
Housing Finances in Honolulu County
Median Income by Occupancy in Honolulu County
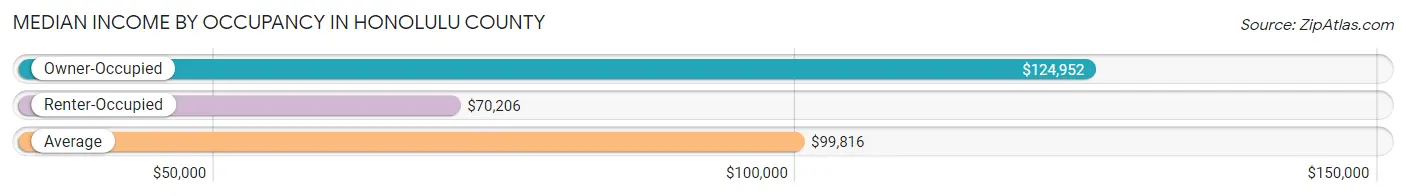
| Occupancy Type | # Households | Median Income |
| Owner-Occupied | 196,384 (58.9%) | $124,952 |
| Renter-Occupied | 137,316 (41.1%) | $70,206 |
| Average | 333,700 (100.0%) | $99,816 |
Occupancy by Householder Income Bracket in Honolulu County
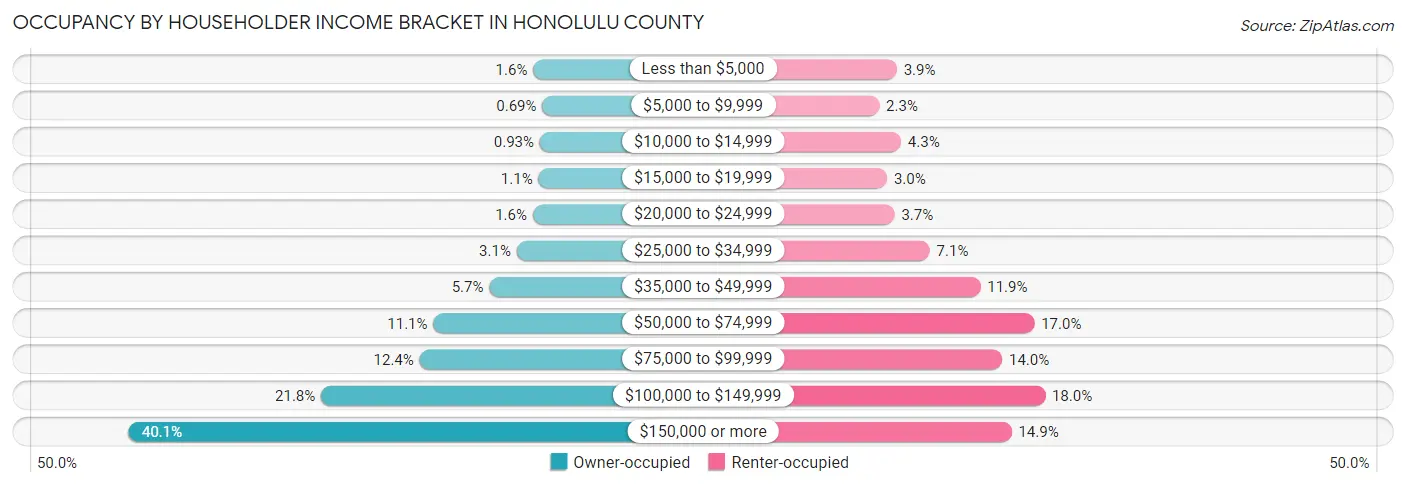
| Income Bracket | Owner-occupied | Renter-occupied |
| Less than $5,000 | 3,072 (1.6%) | 5,377 (3.9%) |
| $5,000 to $9,999 | 1,348 (0.7%) | 3,095 (2.2%) |
| $10,000 to $14,999 | 1,834 (0.9%) | 5,936 (4.3%) |
| $15,000 to $19,999 | 2,086 (1.1%) | 4,106 (3.0%) |
| $20,000 to $24,999 | 3,145 (1.6%) | 5,100 (3.7%) |
| $25,000 to $34,999 | 6,151 (3.1%) | 9,691 (7.1%) |
| $35,000 to $49,999 | 11,282 (5.7%) | 16,319 (11.9%) |
| $50,000 to $74,999 | 21,730 (11.1%) | 23,369 (17.0%) |
| $75,000 to $99,999 | 24,308 (12.4%) | 19,161 (14.0%) |
| $100,000 to $149,999 | 42,739 (21.8%) | 24,773 (18.0%) |
| $150,000 or more | 78,689 (40.1%) | 20,389 (14.8%) |
| Total | 196,384 (100.0%) | 137,316 (100.0%) |
Monthly Housing Cost Tiers in Honolulu County
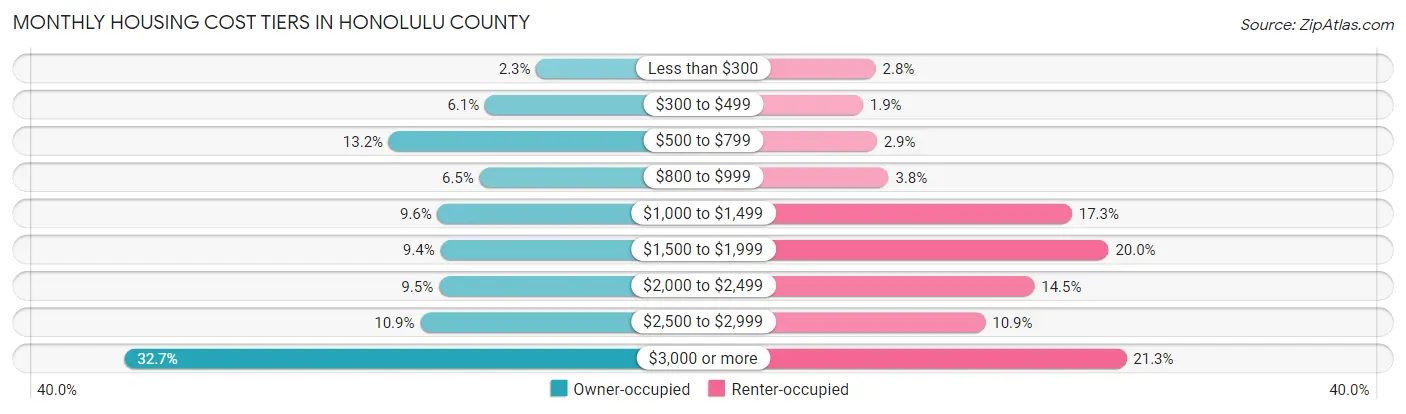
| Monthly Cost | Owner-occupied | Renter-occupied |
| Less than $300 | 4,536 (2.3%) | 3,857 (2.8%) |
| $300 to $499 | 11,960 (6.1%) | 2,569 (1.9%) |
| $500 to $799 | 25,855 (13.2%) | 3,982 (2.9%) |
| $800 to $999 | 12,746 (6.5%) | 5,162 (3.8%) |
| $1,000 to $1,499 | 18,816 (9.6%) | 23,704 (17.3%) |
| $1,500 to $1,999 | 18,396 (9.4%) | 27,412 (20.0%) |
| $2,000 to $2,499 | 18,618 (9.5%) | 19,917 (14.5%) |
| $2,500 to $2,999 | 21,328 (10.9%) | 14,960 (10.9%) |
| $3,000 or more | 64,129 (32.7%) | 29,215 (21.3%) |
| Total | 196,384 (100.0%) | 137,316 (100.0%) |
Physical Housing Characteristics in Honolulu County
Housing Structures in Honolulu County
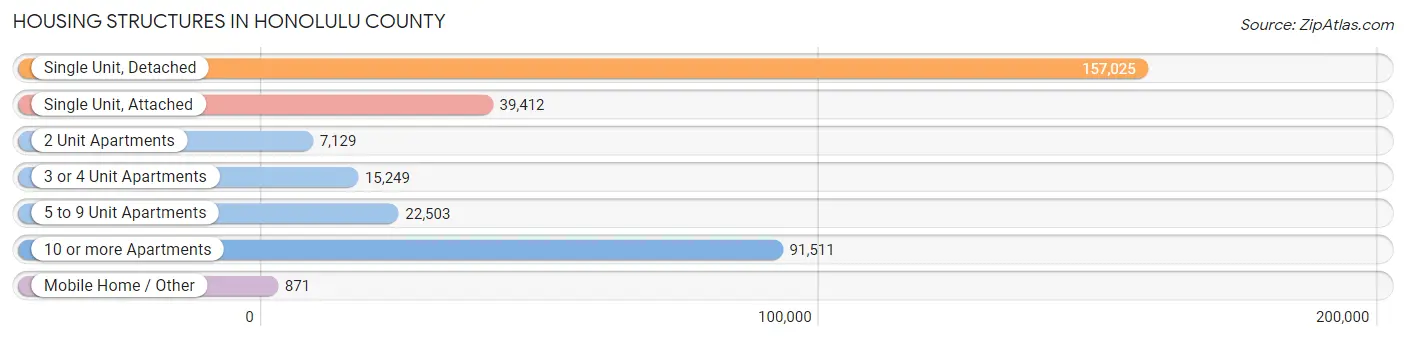
| Structure Type | # Housing Units | % Housing Units |
| Single Unit, Detached | 157,025 | 47.1% |
| Single Unit, Attached | 39,412 | 11.8% |
| 2 Unit Apartments | 7,129 | 2.1% |
| 3 or 4 Unit Apartments | 15,249 | 4.6% |
| 5 to 9 Unit Apartments | 22,503 | 6.7% |
| 10 or more Apartments | 91,511 | 27.4% |
| Mobile Home / Other | 871 | 0.3% |
| Total | 333,700 | 100.0% |
Housing Structures by Occupancy in Honolulu County
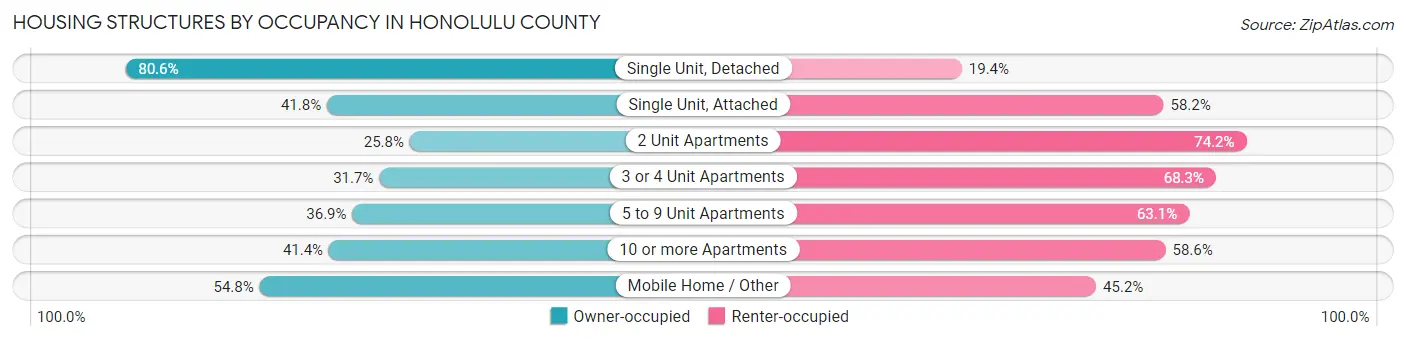
| Structure Type | Owner-occupied | Renter-occupied |
| Single Unit, Detached | 126,572 (80.6%) | 30,453 (19.4%) |
| Single Unit, Attached | 16,467 (41.8%) | 22,945 (58.2%) |
| 2 Unit Apartments | 1,842 (25.8%) | 5,287 (74.2%) |
| 3 or 4 Unit Apartments | 4,838 (31.7%) | 10,411 (68.3%) |
| 5 to 9 Unit Apartments | 8,301 (36.9%) | 14,202 (63.1%) |
| 10 or more Apartments | 37,887 (41.4%) | 53,624 (58.6%) |
| Mobile Home / Other | 477 (54.8%) | 394 (45.2%) |
| Total | 196,384 (58.9%) | 137,316 (41.1%) |
Housing Structures by Number of Rooms in Honolulu County
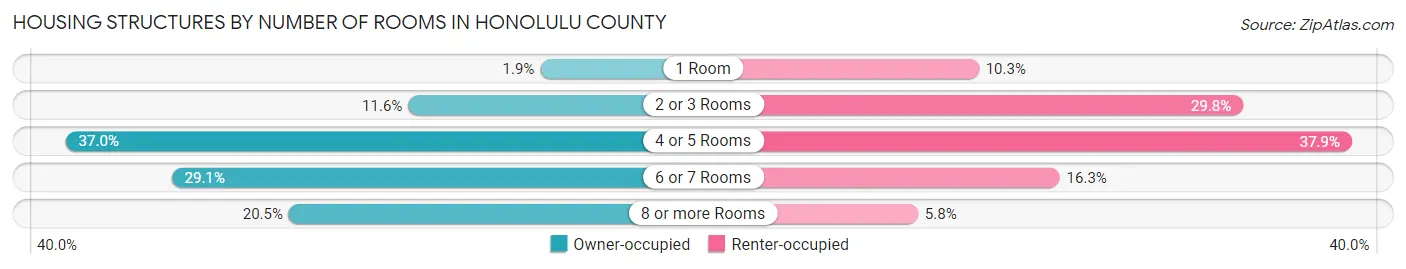
| Number of Rooms | Owner-occupied | Renter-occupied |
| 1 Room | 3,627 (1.8%) | 14,104 (10.3%) |
| 2 or 3 Rooms | 22,812 (11.6%) | 40,959 (29.8%) |
| 4 or 5 Rooms | 72,591 (37.0%) | 52,006 (37.9%) |
| 6 or 7 Rooms | 57,190 (29.1%) | 22,326 (16.3%) |
| 8 or more Rooms | 40,164 (20.4%) | 7,921 (5.8%) |
| Total | 196,384 (100.0%) | 137,316 (100.0%) |
Housing Structure by Heating Type in Honolulu County
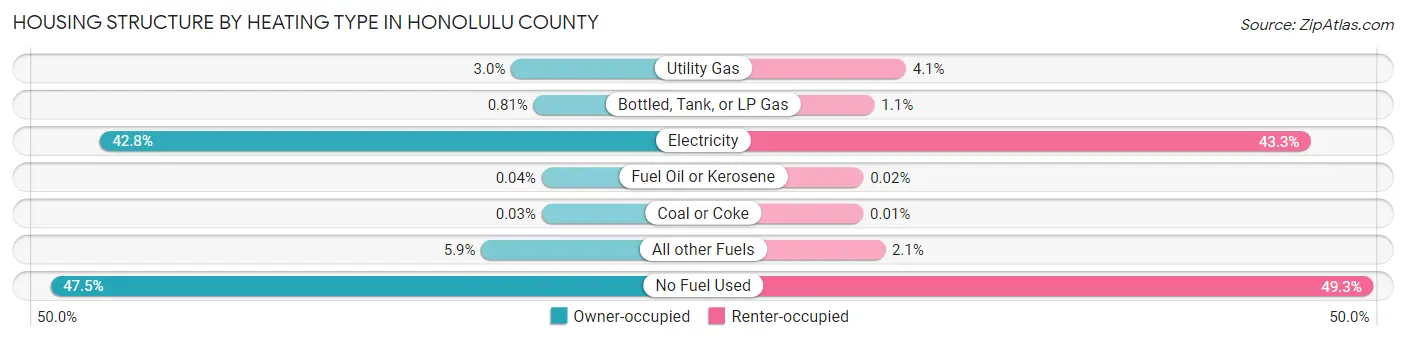
| Heating Type | Owner-occupied | Renter-occupied |
| Utility Gas | 5,849 (3.0%) | 5,670 (4.1%) |
| Bottled, Tank, or LP Gas | 1,595 (0.8%) | 1,515 (1.1%) |
| Electricity | 83,973 (42.8%) | 59,450 (43.3%) |
| Fuel Oil or Kerosene | 75 (0.0%) | 28 (0.0%) |
| Coal or Coke | 52 (0.0%) | 11 (0.0%) |
| All other Fuels | 11,528 (5.9%) | 2,917 (2.1%) |
| No Fuel Used | 93,312 (47.5%) | 67,725 (49.3%) |
| Total | 196,384 (100.0%) | 137,316 (100.0%) |
Household Vehicle Usage in Honolulu County
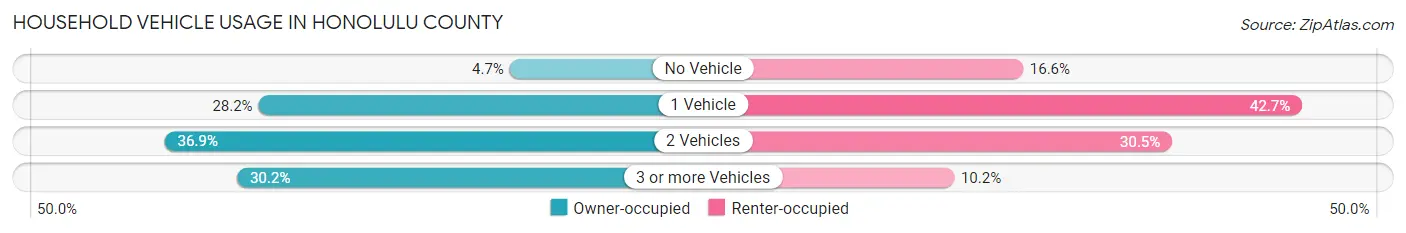
| Vehicles per Household | Owner-occupied | Renter-occupied |
| No Vehicle | 9,279 (4.7%) | 22,812 (16.6%) |
| 1 Vehicle | 55,331 (28.2%) | 58,586 (42.7%) |
| 2 Vehicles | 72,531 (36.9%) | 41,934 (30.5%) |
| 3 or more Vehicles | 59,243 (30.2%) | 13,984 (10.2%) |
| Total | 196,384 (100.0%) | 137,316 (100.0%) |
Real Estate & Mortgages in Honolulu County
Real Estate and Mortgage Overview in Honolulu County
| Characteristic | Without Mortgage | With Mortgage |
| Housing Units | 66,507 | 129,877 |
| Median Property Value | $837,400 | $829,800 |
| Median Household Income | $96,025 | $59,725 |
| Monthly Housing Costs | $708 | $63,671 |
| Real Estate Taxes | $2,410 | $7,790 |
Property Value by Mortgage Status in Honolulu County
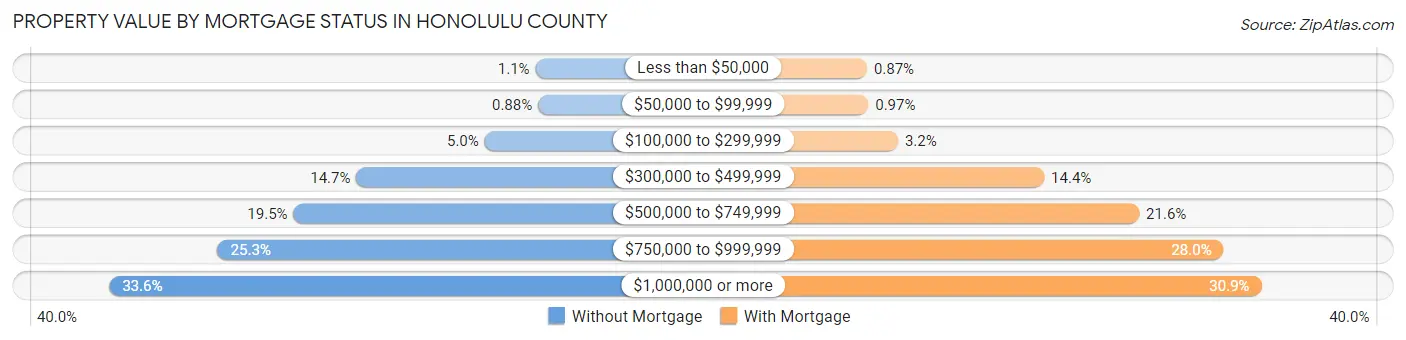
| Property Value | Without Mortgage | With Mortgage |
| Less than $50,000 | 719 (1.1%) | 1,135 (0.9%) |
| $50,000 to $99,999 | 586 (0.9%) | 1,255 (1.0%) |
| $100,000 to $299,999 | 3,292 (5.0%) | 4,199 (3.2%) |
| $300,000 to $499,999 | 9,796 (14.7%) | 18,664 (14.4%) |
| $500,000 to $749,999 | 12,980 (19.5%) | 28,060 (21.6%) |
| $750,000 to $999,999 | 16,818 (25.3%) | 36,411 (28.0%) |
| $1,000,000 or more | 22,316 (33.6%) | 40,153 (30.9%) |
| Total | 66,507 (100.0%) | 129,877 (100.0%) |
Household Income by Mortgage Status in Honolulu County
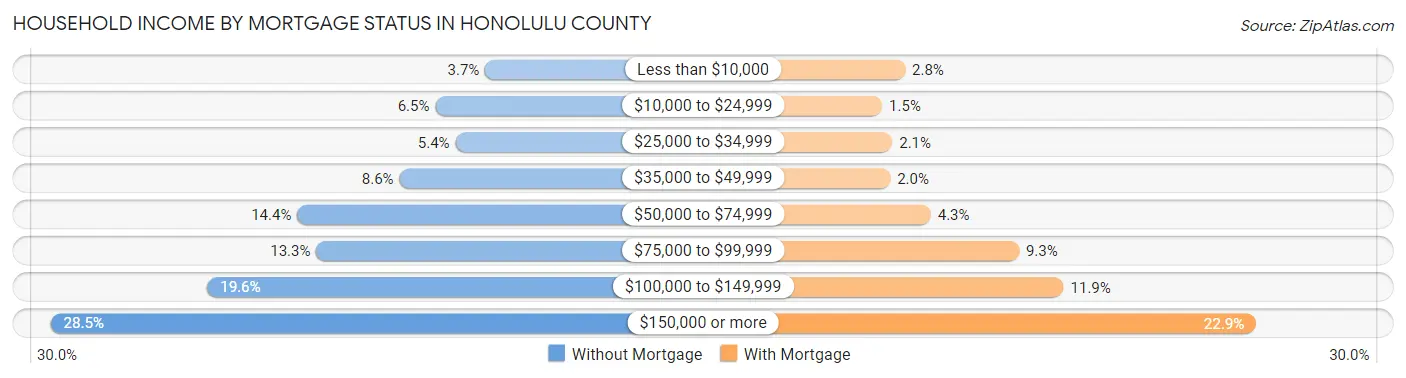
| Household Income | Without Mortgage | With Mortgage |
| Less than $10,000 | 2,449 (3.7%) | 3,679 (2.8%) |
| $10,000 to $24,999 | 4,343 (6.5%) | 1,971 (1.5%) |
| $25,000 to $34,999 | 3,578 (5.4%) | 2,722 (2.1%) |
| $35,000 to $49,999 | 5,703 (8.6%) | 2,573 (2.0%) |
| $50,000 to $74,999 | 9,593 (14.4%) | 5,579 (4.3%) |
| $75,000 to $99,999 | 8,868 (13.3%) | 12,137 (9.3%) |
| $100,000 to $149,999 | 13,009 (19.6%) | 15,440 (11.9%) |
| $150,000 or more | 18,964 (28.5%) | 29,730 (22.9%) |
| Total | 66,507 (100.0%) | 129,877 (100.0%) |
Property Value to Household Income Ratio in Honolulu County
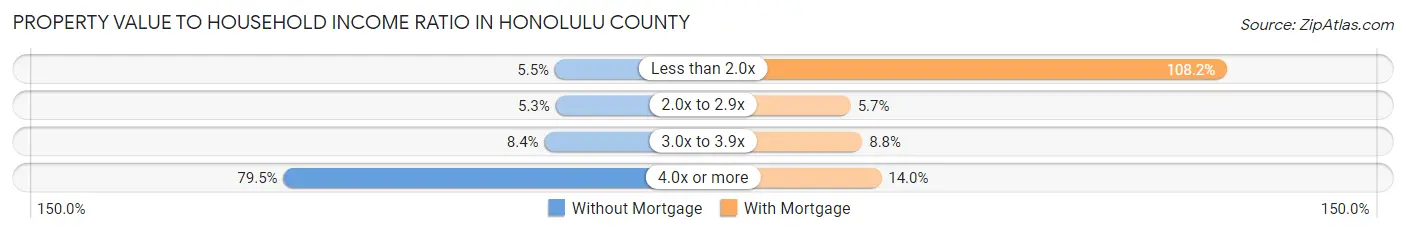
| Value-to-Income Ratio | Without Mortgage | With Mortgage |
| Less than 2.0x | 3,677 (5.5%) | 140,545 (108.2%) |
| 2.0x to 2.9x | 3,552 (5.3%) | 7,364 (5.7%) |
| 3.0x to 3.9x | 5,583 (8.4%) | 11,450 (8.8%) |
| 4.0x or more | 52,873 (79.5%) | 18,182 (14.0%) |
| Total | 66,507 (100.0%) | 129,877 (100.0%) |
Real Estate Taxes by Mortgage Status in Honolulu County
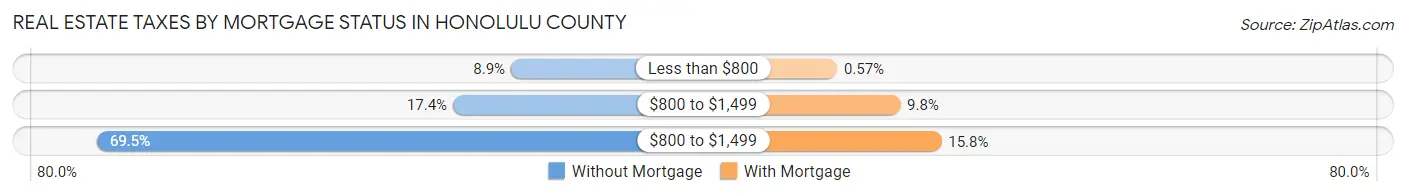
| Property Taxes | Without Mortgage | With Mortgage |
| Less than $800 | 5,949 (8.9%) | 740 (0.6%) |
| $800 to $1,499 | 11,579 (17.4%) | 12,723 (9.8%) |
| $800 to $1,499 | 46,191 (69.5%) | 20,547 (15.8%) |
| Total | 66,507 (100.0%) | 129,877 (100.0%) |
Health & Disability in Honolulu County
Health Insurance Coverage by Age in Honolulu County
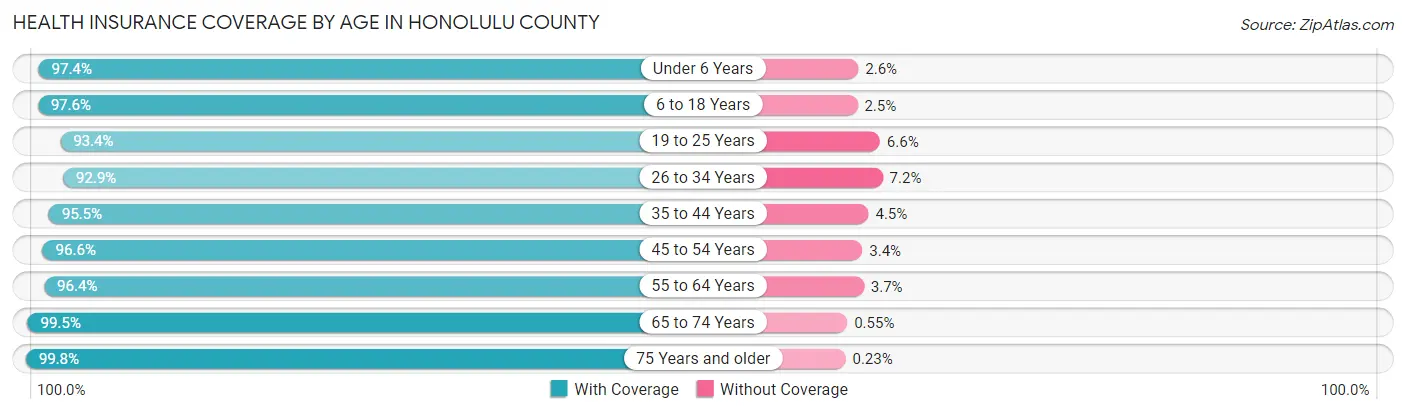
| Age Bracket | With Coverage | Without Coverage |
| Under 6 Years | 69,621 (97.4%) | 1,873 (2.6%) |
| 6 to 18 Years | 145,983 (97.6%) | 3,660 (2.5%) |
| 19 to 25 Years | 70,505 (93.4%) | 5,011 (6.6%) |
| 26 to 34 Years | 107,638 (92.8%) | 8,285 (7.1%) |
| 35 to 44 Years | 116,930 (95.5%) | 5,537 (4.5%) |
| 45 to 54 Years | 111,940 (96.6%) | 3,906 (3.4%) |
| 55 to 64 Years | 115,207 (96.4%) | 4,366 (3.6%) |
| 65 to 74 Years | 99,233 (99.5%) | 550 (0.5%) |
| 75 Years and older | 83,911 (99.8%) | 193 (0.2%) |
| Total | 920,968 (96.5%) | 33,381 (3.5%) |
Health Insurance Coverage by Citizenship Status in Honolulu County
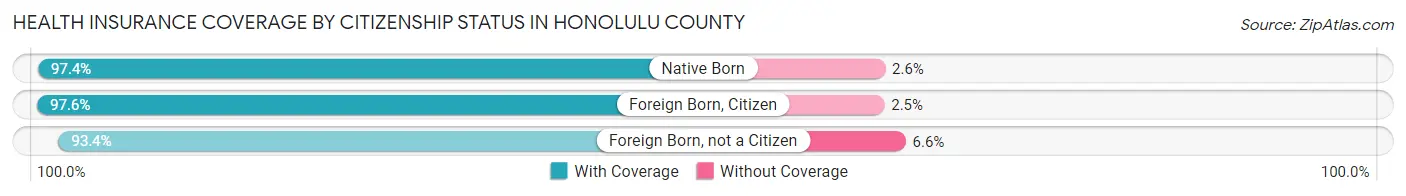
| Citizenship Status | With Coverage | Without Coverage |
| Native Born | 69,621 (97.4%) | 1,873 (2.6%) |
| Foreign Born, Citizen | 145,983 (97.6%) | 3,660 (2.5%) |
| Foreign Born, not a Citizen | 70,505 (93.4%) | 5,011 (6.6%) |
Health Insurance Coverage by Household Income in Honolulu County
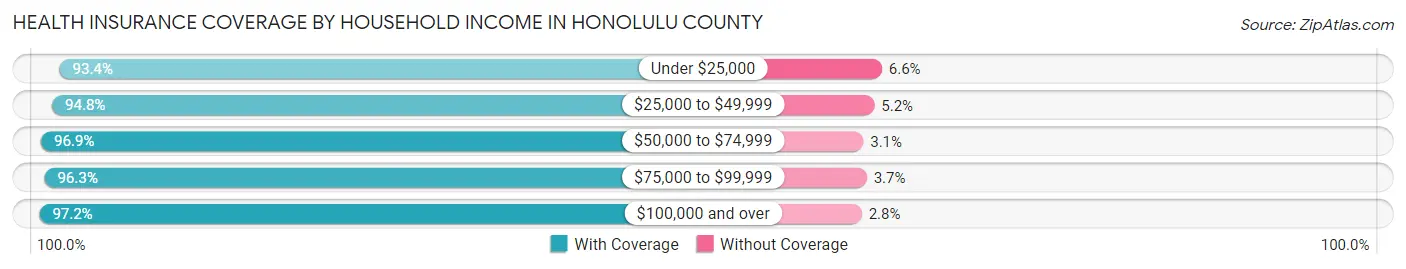
| Household Income | With Coverage | Without Coverage |
| Under $25,000 | 56,417 (93.4%) | 3,967 (6.6%) |
| $25,000 to $49,999 | 85,897 (94.8%) | 4,682 (5.2%) |
| $50,000 to $74,999 | 94,790 (96.9%) | 3,022 (3.1%) |
| $75,000 to $99,999 | 104,398 (96.3%) | 4,047 (3.7%) |
| $100,000 and over | 568,846 (97.2%) | 16,343 (2.8%) |
Public vs Private Health Insurance Coverage by Age in Honolulu County
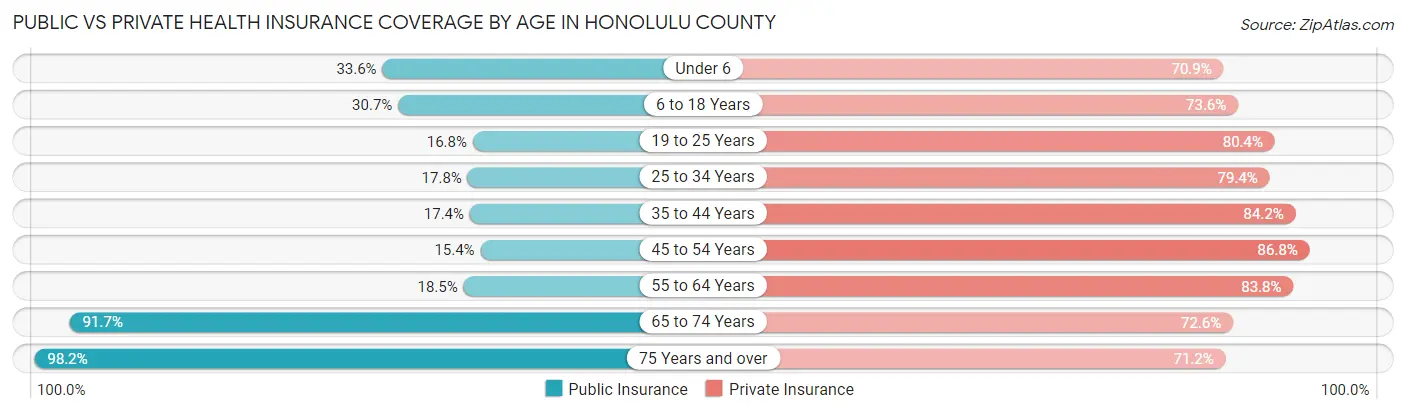
| Age Bracket | Public Insurance | Private Insurance |
| Under 6 | 24,005 (33.6%) | 50,655 (70.9%) |
| 6 to 18 Years | 45,880 (30.7%) | 110,055 (73.6%) |
| 19 to 25 Years | 12,683 (16.8%) | 60,694 (80.4%) |
| 25 to 34 Years | 20,593 (17.8%) | 92,058 (79.4%) |
| 35 to 44 Years | 21,254 (17.3%) | 103,165 (84.2%) |
| 45 to 54 Years | 17,830 (15.4%) | 100,606 (86.8%) |
| 55 to 64 Years | 22,146 (18.5%) | 100,212 (83.8%) |
| 65 to 74 Years | 91,462 (91.7%) | 72,477 (72.6%) |
| 75 Years and over | 82,575 (98.2%) | 59,917 (71.2%) |
| Total | 338,428 (35.5%) | 749,839 (78.6%) |
Disability Status by Sex by Age in Honolulu County
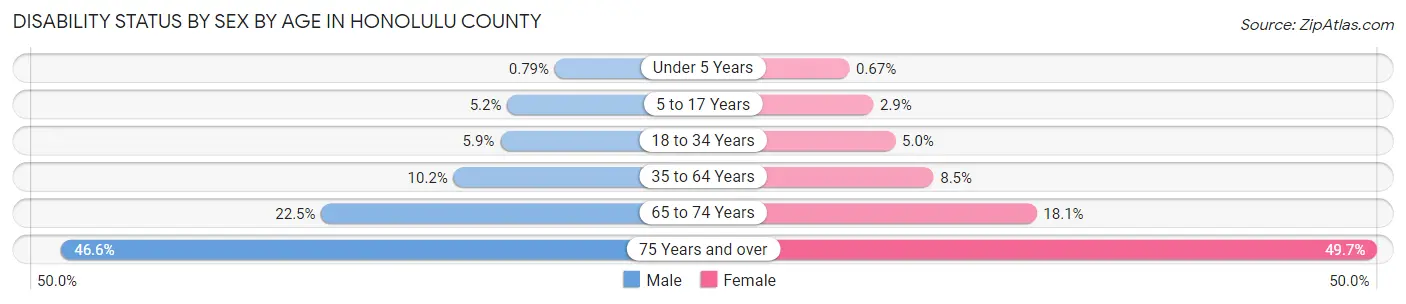
| Age Bracket | Male | Female |
| Under 5 Years | 247 (0.8%) | 196 (0.7%) |
| 5 to 17 Years | 4,038 (5.2%) | 2,126 (2.9%) |
| 18 to 34 Years | 5,773 (5.9%) | 5,092 (5.0%) |
| 35 to 64 Years | 18,026 (10.2%) | 15,354 (8.5%) |
| 65 to 74 Years | 10,652 (22.5%) | 9,458 (18.1%) |
| 75 Years and over | 16,063 (46.6%) | 24,661 (49.7%) |
Disability Class by Sex by Age in Honolulu County
Disability Class: Hearing Difficulty
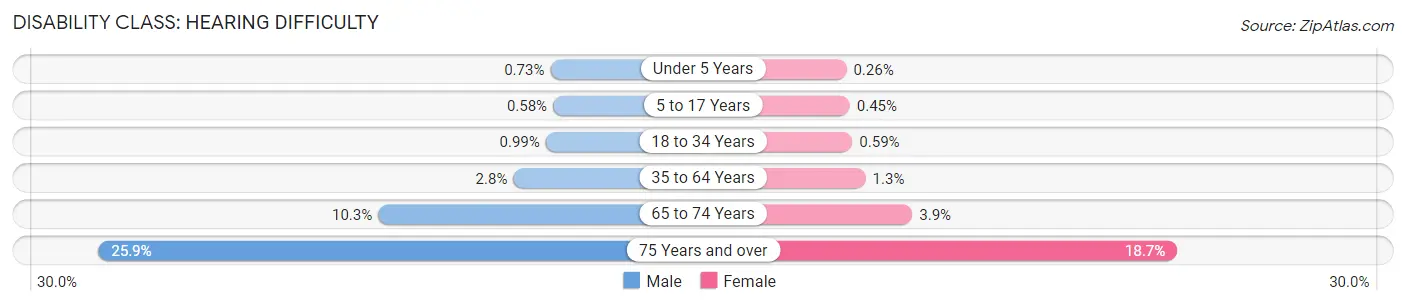
| Age Bracket | Male | Female |
| Under 5 Years | 227 (0.7%) | 77 (0.3%) |
| 5 to 17 Years | 451 (0.6%) | 326 (0.4%) |
| 18 to 34 Years | 975 (1.0%) | 606 (0.6%) |
| 35 to 64 Years | 4,938 (2.8%) | 2,401 (1.3%) |
| 65 to 74 Years | 4,894 (10.3%) | 2,055 (3.9%) |
| 75 Years and over | 8,925 (25.9%) | 9,264 (18.7%) |
Disability Class: Vision Difficulty
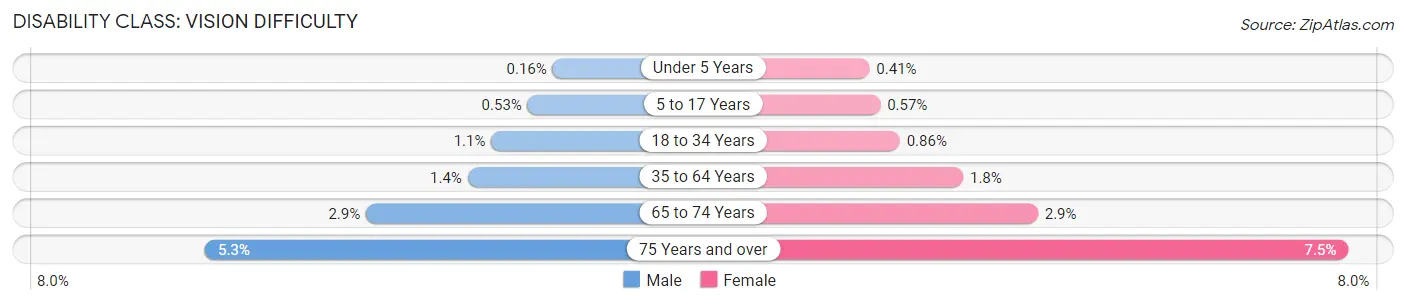
| Age Bracket | Male | Female |
| Under 5 Years | 49 (0.2%) | 119 (0.4%) |
| 5 to 17 Years | 414 (0.5%) | 421 (0.6%) |
| 18 to 34 Years | 1,050 (1.1%) | 887 (0.9%) |
| 35 to 64 Years | 2,515 (1.4%) | 3,254 (1.8%) |
| 65 to 74 Years | 1,391 (2.9%) | 1,523 (2.9%) |
| 75 Years and over | 1,833 (5.3%) | 3,730 (7.5%) |
Disability Class: Cognitive Difficulty
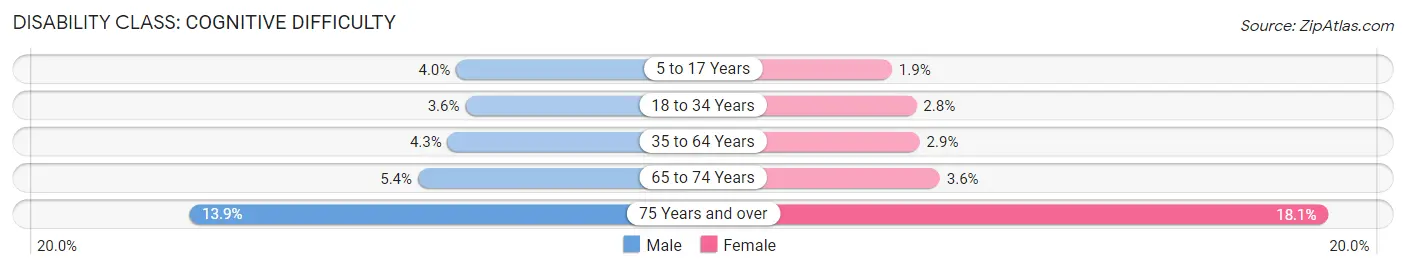
| Age Bracket | Male | Female |
| 5 to 17 Years | 3,090 (4.0%) | 1,362 (1.9%) |
| 18 to 34 Years | 3,586 (3.6%) | 2,853 (2.8%) |
| 35 to 64 Years | 7,618 (4.3%) | 5,218 (2.9%) |
| 65 to 74 Years | 2,563 (5.4%) | 1,905 (3.6%) |
| 75 Years and over | 4,790 (13.9%) | 8,962 (18.1%) |
Disability Class: Ambulatory Difficulty
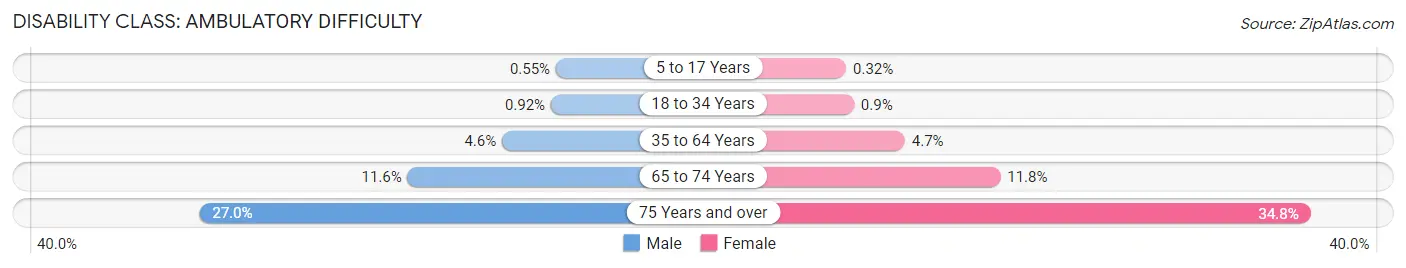
| Age Bracket | Male | Female |
| 5 to 17 Years | 425 (0.5%) | 234 (0.3%) |
| 18 to 34 Years | 907 (0.9%) | 925 (0.9%) |
| 35 to 64 Years | 8,056 (4.5%) | 8,465 (4.7%) |
| 65 to 74 Years | 5,485 (11.6%) | 6,161 (11.8%) |
| 75 Years and over | 9,320 (27.0%) | 17,269 (34.8%) |
Disability Class: Self-Care Difficulty
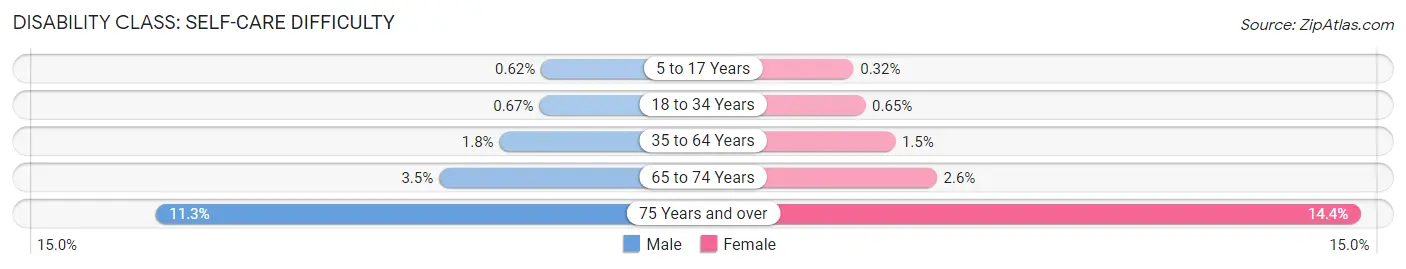
| Age Bracket | Male | Female |
| 5 to 17 Years | 485 (0.6%) | 236 (0.3%) |
| 18 to 34 Years | 656 (0.7%) | 667 (0.6%) |
| 35 to 64 Years | 3,159 (1.8%) | 2,673 (1.5%) |
| 65 to 74 Years | 1,642 (3.5%) | 1,383 (2.6%) |
| 75 Years and over | 3,907 (11.3%) | 7,159 (14.4%) |
Technology Access in Honolulu County
Computing Device Access in Honolulu County
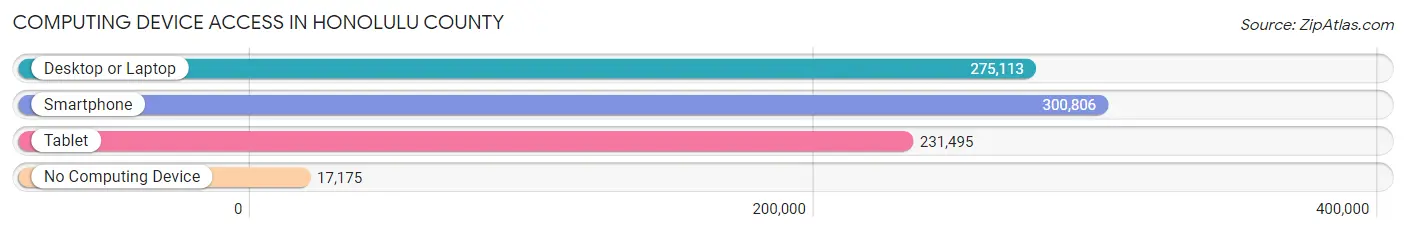
| Device Type | # Households | % Households |
| Desktop or Laptop | 275,113 | 82.4% |
| Smartphone | 300,806 | 90.1% |
| Tablet | 231,495 | 69.4% |
| No Computing Device | 17,175 | 5.1% |
| Total | 333,700 | 100.0% |
Internet Access in Honolulu County
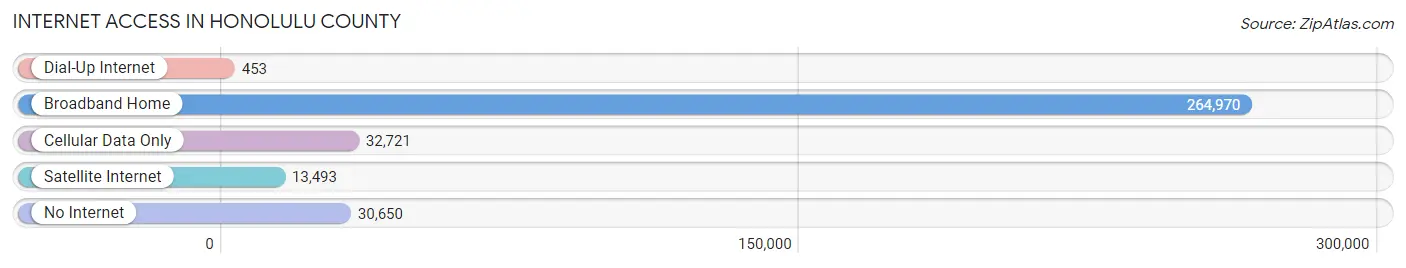
| Internet Type | # Households | % Households |
| Dial-Up Internet | 453 | 0.1% |
| Broadband Home | 264,970 | 79.4% |
| Cellular Data Only | 32,721 | 9.8% |
| Satellite Internet | 13,493 | 4.0% |
| No Internet | 30,650 | 9.2% |
| Total | 333,700 | 100.0% |
Honolulu County Summary
Honolulu County, Hawaii is the most populous county in the state of Hawaii and is located on the island of Oahu. It is the only county in the state and is the center of the state’s government and economy. The county is home to the state capital, Honolulu, and is the most populous city in the state. The county is also home to the University of Hawaii at Manoa, the largest university in the state.
Geography
Honolulu County is located on the island of Oahu in the Hawaiian Islands. The county is bordered by the Pacific Ocean to the east, the Hawaiian Sea to the south, and the Koolau Mountains to the west. The county covers an area of 597 square miles and is the most populous county in the state. The county is divided into four districts: Honolulu, Koolaupoko, Koolauloa, and Waialua. The county is home to numerous beaches, parks, and other attractions, including Diamond Head, Waikiki Beach, and the Honolulu Zoo.
Economy
Honolulu County is the economic center of the state of Hawaii. The county is home to the state’s largest port, Honolulu Harbor, and is the hub of the state’s tourism industry. The county is also home to numerous military bases, including Pearl Harbor, Hickam Air Force Base, and Schofield Barracks. The county is also home to the University of Hawaii at Manoa, the largest university in the state.
The county’s economy is largely driven by tourism, with visitors coming to the county to enjoy its beaches, parks, and other attractions. The county is also home to numerous businesses, including banks, insurance companies, and other financial institutions. The county is also home to numerous manufacturing and technology companies, including Hawaiian Airlines, Hawaiian Electric Company, and Hawaiian Telcom.
Demographics
As of the 2010 census, the population of Honolulu County was 953,207, making it the most populous county in the state. The population is composed of a diverse mix of ethnicities, including Native Hawaiian, Asian, and Pacific Islander. The median household income in the county is $71,945, and the median age is 38.7 years.
The county is home to numerous religious institutions, including churches, temples, and mosques. The county is also home to numerous cultural institutions, including the Honolulu Museum of Art, the Bishop Museum, and the Waikiki Aquarium.
Conclusion
Honolulu County, Hawaii is the most populous county in the state and is the center of the state’s government and economy. The county is located on the island of Oahu and is bordered by the Pacific Ocean to the east, the Hawaiian Sea to the south, and the Koolau Mountains to the west. The county’s economy is largely driven by tourism, with visitors coming to the county to enjoy its beaches, parks, and other attractions. The population of the county is composed of a diverse mix of ethnicities, and the median household income is $71,945. The county is home to numerous religious institutions, cultural institutions, and businesses, making it an important center of the state’s economy.
Common Questions
What is Per Capita Income in Honolulu County?
Per Capita income in Honolulu County is $44,026.
What is the Median Family Income in Honolulu County?
Median Family Income in Honolulu County is $117,769.
What is the Median Household income in Honolulu County?
Median Household Income in Honolulu County is $99,816.
What is Income or Wage Gap in Honolulu County?
Income or Wage Gap in Honolulu County is 23.3%.
Women in Honolulu County earn 76.7 cents for every dollar earned by a man.
What is Family Income Deficit in Honolulu County?
Family Income Deficit in Honolulu County is $11,676.
Families that are below poverty line in Honolulu County earn $11,676 less on average than the poverty threshold level.
What is Inequality or Gini Index in Honolulu County?
Inequality or Gini Index in Honolulu County is 0.44.
What is the Total Population of Honolulu County?
Total Population of Honolulu County is 1,010,100.
What is the Total Male Population of Honolulu County?
Total Male Population of Honolulu County is 512,085.
What is the Total Female Population of Honolulu County?
Total Female Population of Honolulu County is 498,015.
What is the Ratio of Males per 100 Females in Honolulu County?
There are 102.83 Males per 100 Females in Honolulu County.
What is the Ratio of Females per 100 Males in Honolulu County?
There are 97.25 Females per 100 Males in Honolulu County.
What is the Median Population Age in Honolulu County?
Median Population Age in Honolulu County is 38.8 Years.
What is the Average Family Size in Honolulu County
Average Family Size in Honolulu County is 3.5 People.
What is the Average Household Size in Honolulu County
Average Household Size in Honolulu County is 2.9 People.
How Large is the Labor Force in Honolulu County?
There are 539,959 People in the Labor Forcein in Honolulu County.
What is the Percentage of People in the Labor Force in Honolulu County?
65.8% of People are in the Labor Force in Honolulu County.
What is the Unemployment Rate in Honolulu County?
Unemployment Rate in Honolulu County is 4.8%.