Kalawao County, HI Map & Demographics
Kalawao County Map
Kalawao County Overview
$54,390
PER CAPITA INCOME
$87,813
AVG HOUSEHOLD INCOME
0.27
INEQUALITY / GINI INDEX
50
TOTAL POPULATION
34
MALE POPULATION
16
FEMALE POPULATION
212.50
MALES / 100 FEMALES
47.06
FEMALES / 100 MALES
43.3
MEDIAN AGE
1.3
AVG FAMILY SIZE
1.1
AVG HOUSEHOLD SIZE
36
LABOR FORCE [ PEOPLE ]
72.0%
PERCENT IN LABOR FORCE
Kalawao County Area Codes
Income in Kalawao County
Income Overview in Kalawao County
| Characteristic | Number | Measure |
| Per Capita Income | 50 | $54,390 |
| Median Family Income | 3 | $0 |
| Mean Family Income | 3 | $0 |
| Median Household Income | 32 | $87,813 |
| Mean Household Income | 32 | $82,150 |
| Income Deficit | 3 | $0 |
| Wage / Income Gap (%) | 50 | 0.00% |
| Wage / Income Gap ($) | 50 | 100.00¢ per $1 |
| Gini / Inequality Index | 50 | 0.27 |
Earnings by Sex in Kalawao County
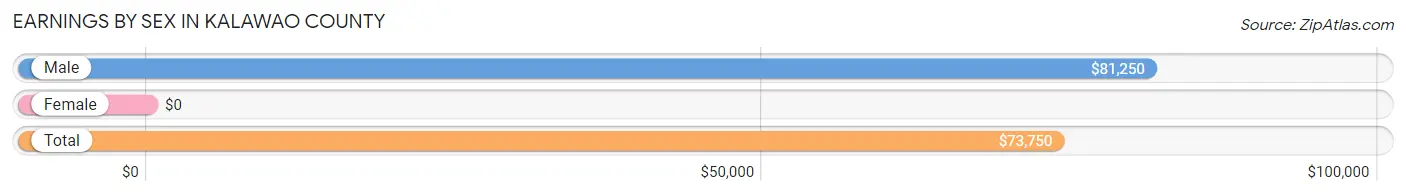
| Sex | Number | Average Earnings |
| Male | 27 (75.0%) | $81,250 |
| Female | 9 (25.0%) | $0 |
| Total | 36 (100.0%) | $73,750 |
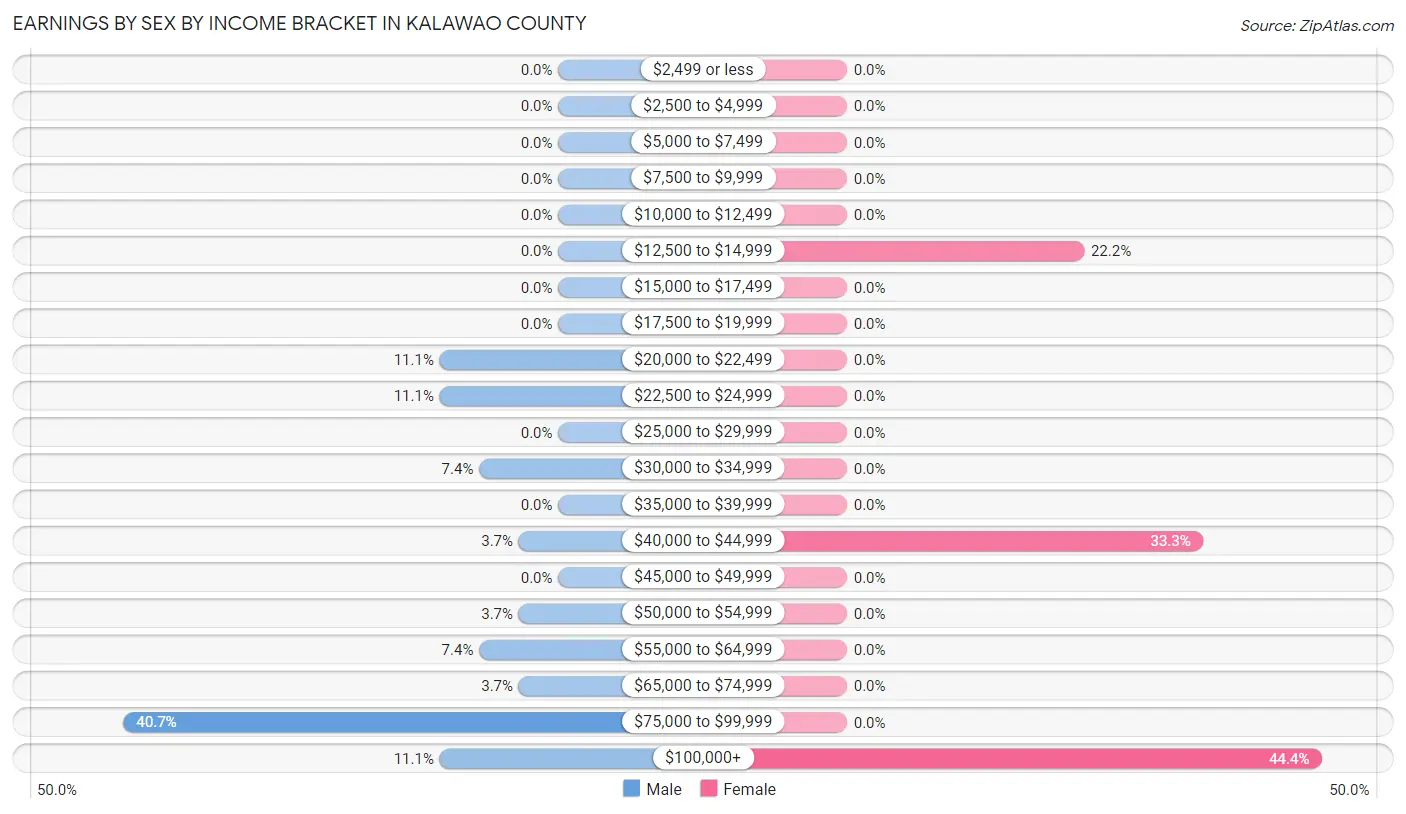
Earnings by Sex by Income Bracket in Kalawao County
The most common earnings brackets in Kalawao County are $75,000 to $99,999 for men (11 | 40.7%) and $100,000+ for women (4 | 44.4%).
| Income | Male | Female |
| $2,499 or less | 0 (0.0%) | 0 (0.0%) |
| $2,500 to $4,999 | 0 (0.0%) | 0 (0.0%) |
| $5,000 to $7,499 | 0 (0.0%) | 0 (0.0%) |
| $7,500 to $9,999 | 0 (0.0%) | 0 (0.0%) |
| $10,000 to $12,499 | 0 (0.0%) | 0 (0.0%) |
| $12,500 to $14,999 | 0 (0.0%) | 2 (22.2%) |
| $15,000 to $17,499 | 0 (0.0%) | 0 (0.0%) |
| $17,500 to $19,999 | 0 (0.0%) | 0 (0.0%) |
| $20,000 to $22,499 | 3 (11.1%) | 0 (0.0%) |
| $22,500 to $24,999 | 3 (11.1%) | 0 (0.0%) |
| $25,000 to $29,999 | 0 (0.0%) | 0 (0.0%) |
| $30,000 to $34,999 | 2 (7.4%) | 0 (0.0%) |
| $35,000 to $39,999 | 0 (0.0%) | 0 (0.0%) |
| $40,000 to $44,999 | 1 (3.7%) | 3 (33.3%) |
| $45,000 to $49,999 | 0 (0.0%) | 0 (0.0%) |
| $50,000 to $54,999 | 1 (3.7%) | 0 (0.0%) |
| $55,000 to $64,999 | 2 (7.4%) | 0 (0.0%) |
| $65,000 to $74,999 | 1 (3.7%) | 0 (0.0%) |
| $75,000 to $99,999 | 11 (40.7%) | 0 (0.0%) |
| $100,000+ | 3 (11.1%) | 4 (44.4%) |
| Total | 27 (100.0%) | 9 (100.0%) |
Earnings by Sex by Educational Attainment in Kalawao County
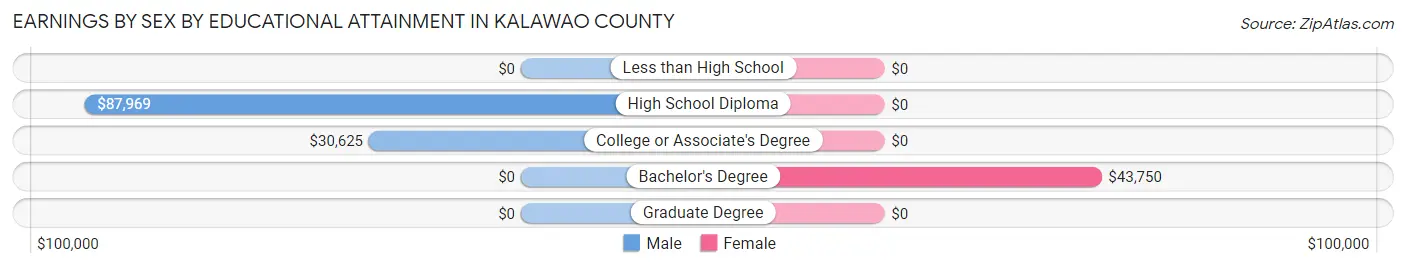
| Educational Attainment | Male Income | Female Income |
| Less than High School | - | - |
| High School Diploma | $87,969 | $0 |
| College or Associate's Degree | $30,625 | $0 |
| Bachelor's Degree | - | - |
| Graduate Degree | - | - |
| Total | $81,250 | $0 |
Family Income in Kalawao County
Family Income Brackets in Kalawao County
According to the Kalawao County family income data, there are 3 families falling into the $75,000 to $99,999 income range, which is the most common income bracket and makes up 100.0% of all families.
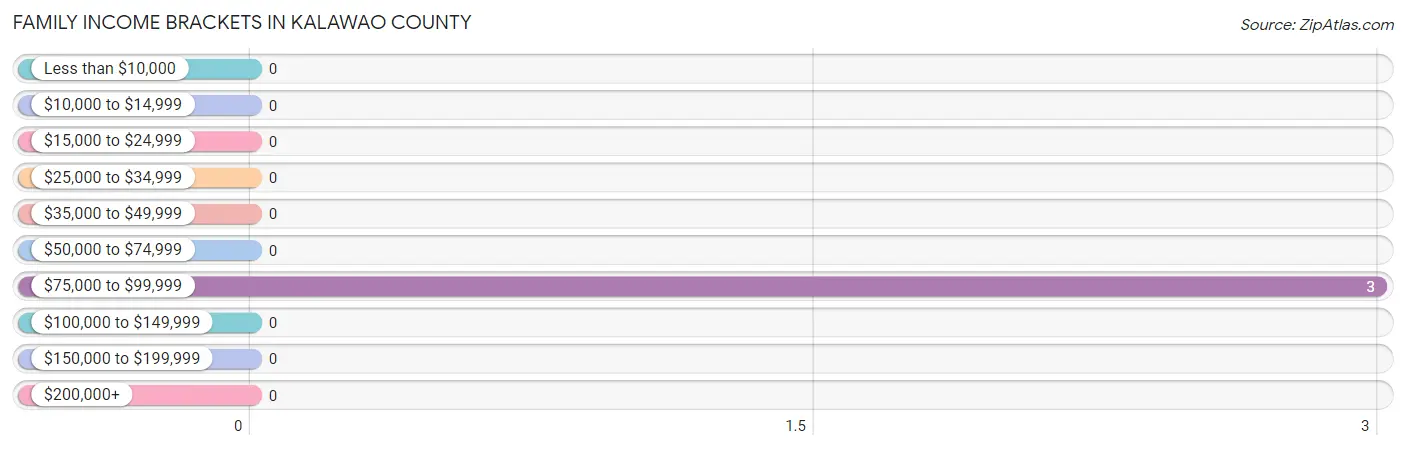
| Income Bracket | # Families | % Families |
| Less than $10,000 | 0 | 0.0% |
| $10,000 to $14,999 | 0 | 0.0% |
| $15,000 to $24,999 | 0 | 0.0% |
| $25,000 to $34,999 | 0 | 0.0% |
| $35,000 to $49,999 | 0 | 0.0% |
| $50,000 to $74,999 | 0 | 0.0% |
| $75,000 to $99,999 | 3 | 100.0% |
| $100,000 to $149,999 | 0 | 0.0% |
| $150,000 to $199,999 | 0 | 0.0% |
| $200,000+ | 0 | 0.0% |
Family Income by Famaliy Size in Kalawao County
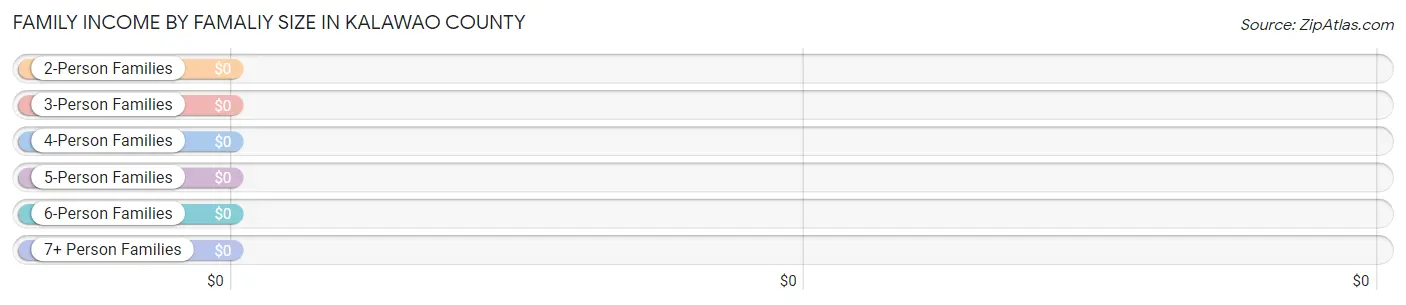
| Income Bracket | # Families | Median Income |
| 2-Person Families | 3 (100.0%) | $0 |
| 3-Person Families | 0 (0.0%) | $0 |
| 4-Person Families | 0 (0.0%) | $0 |
| 5-Person Families | 0 (0.0%) | $0 |
| 6-Person Families | 0 (0.0%) | $0 |
| 7+ Person Families | 0 (0.0%) | $0 |
| Total | 3 (100.0%) | $0 |
Family Income by Number of Earners in Kalawao County
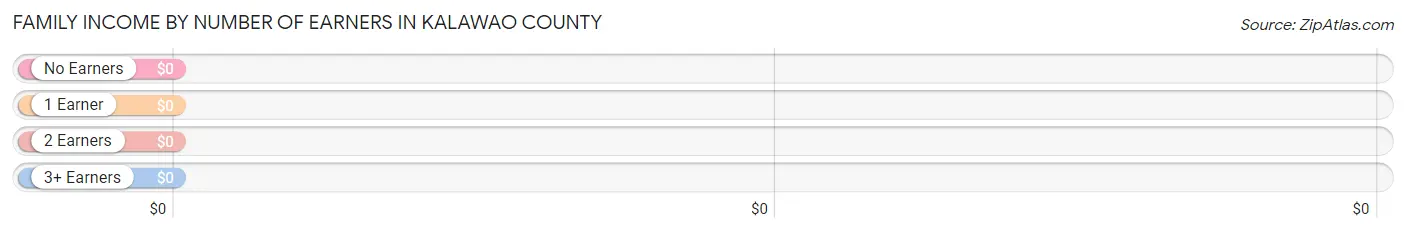
| Number of Earners | # Families | Median Income |
| No Earners | 0 (0.0%) | $0 |
| 1 Earner | 0 (0.0%) | $0 |
| 2 Earners | 3 (100.0%) | $0 |
| 3+ Earners | 0 (0.0%) | $0 |
| Total | 3 (100.0%) | $0 |
Household Income in Kalawao County
Household Income Brackets in Kalawao County
With 14 households falling in the category, the $75,000 to $99,999 income range is the most frequent in Kalawao County, accounting for 43.8% of all households.
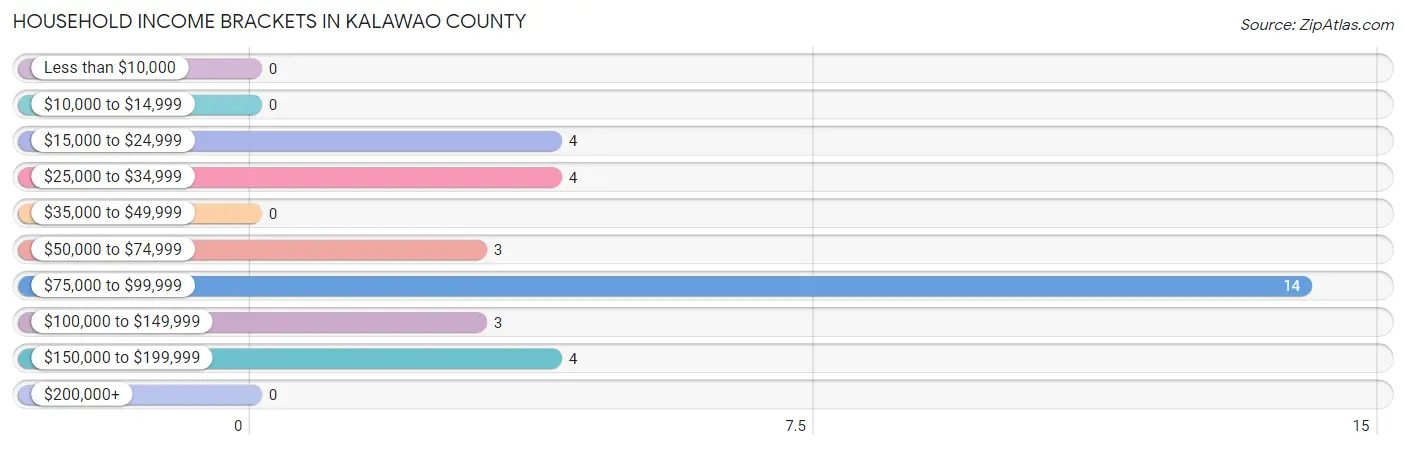
| Income Bracket | # Households | % Households |
| Less than $10,000 | 0 | 0.0% |
| $10,000 to $14,999 | 0 | 0.0% |
| $15,000 to $24,999 | 4 | 12.5% |
| $25,000 to $34,999 | 4 | 12.5% |
| $35,000 to $49,999 | 0 | 0.0% |
| $50,000 to $74,999 | 3 | 9.4% |
| $75,000 to $99,999 | 14 | 43.8% |
| $100,000 to $149,999 | 3 | 9.4% |
| $150,000 to $199,999 | 4 | 12.5% |
| $200,000+ | 0 | 0.0% |
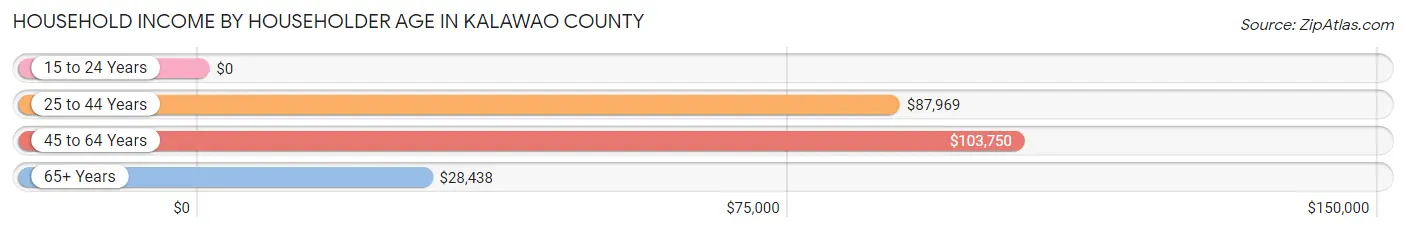
Household Income by Householder Age in Kalawao County
The median household income in Kalawao County is $87,813, with the highest median household income of $103,750 found in the 45 to 64 years age bracket for the primary householder. A total of 10 households (31.2%) fall into this category.
| Income Bracket | # Households | Median Income |
| 15 to 24 Years | 0 (0.0%) | $0 |
| 25 to 44 Years | 17 (53.1%) | $87,969 |
| 45 to 64 Years | 10 (31.2%) | $103,750 |
| 65+ Years | 5 (15.6%) | $28,438 |
| Total | 32 (100.0%) | $87,813 |
Poverty in Kalawao County
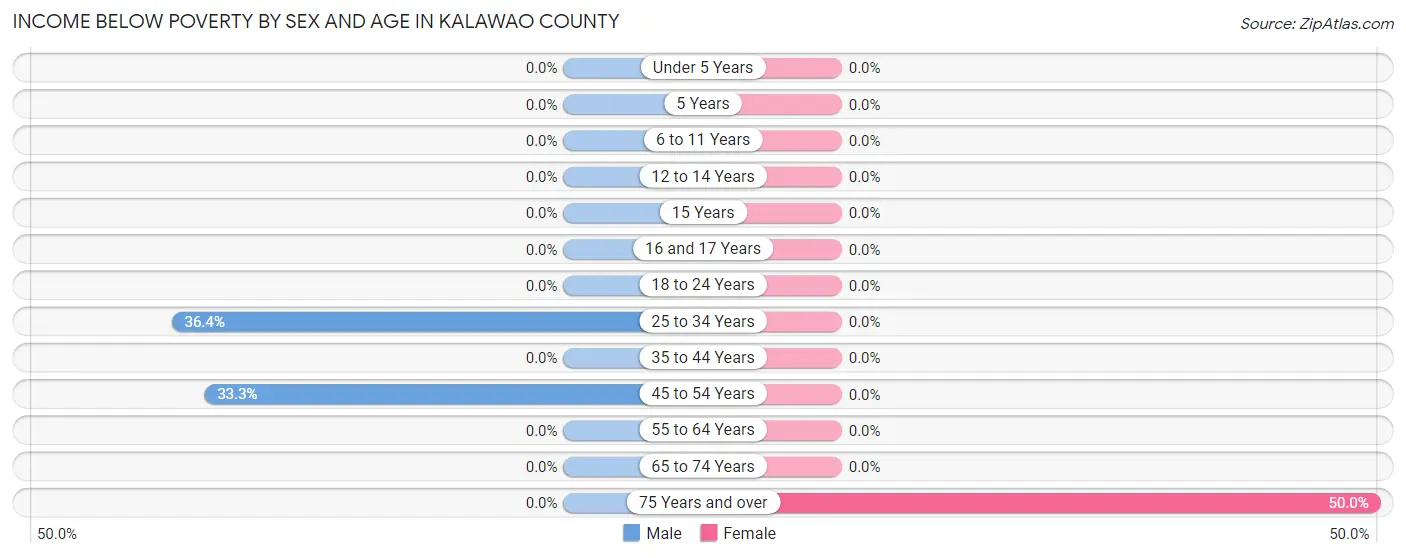
Income Below Poverty by Sex and Age in Kalawao County
With 14.7% poverty level for males and 15.4% for females among the residents of Kalawao County, 25 to 34 year old males and 75 year old and over females are the most vulnerable to poverty, with 4 males (36.4%) and 2 females (50.0%) in their respective age groups living below the poverty level.
| Age Bracket | Male | Female |
| Under 5 Years | 0 (0.0%) | 0 (0.0%) |
| 5 Years | 0 (0.0%) | 0 (0.0%) |
| 6 to 11 Years | 0 (0.0%) | 0 (0.0%) |
| 12 to 14 Years | 0 (0.0%) | 0 (0.0%) |
| 15 Years | 0 (0.0%) | 0 (0.0%) |
| 16 and 17 Years | 0 (0.0%) | 0 (0.0%) |
| 18 to 24 Years | 0 (0.0%) | 0 (0.0%) |
| 25 to 34 Years | 4 (36.4%) | 0 (0.0%) |
| 35 to 44 Years | 0 (0.0%) | 0 (0.0%) |
| 45 to 54 Years | 1 (33.3%) | 0 (0.0%) |
| 55 to 64 Years | 0 (0.0%) | 0 (0.0%) |
| 65 to 74 Years | 0 (0.0%) | 0 (0.0%) |
| 75 Years and over | 0 (0.0%) | 2 (50.0%) |
| Total | 5 (14.7%) | 2 (15.4%) |
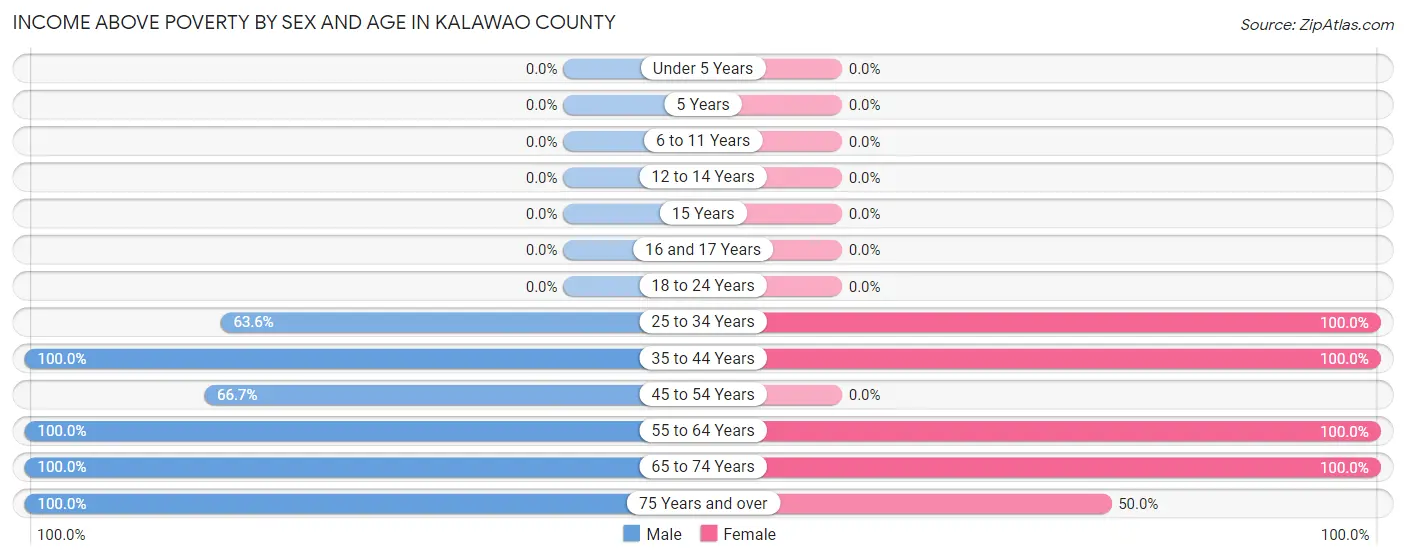
Income Above Poverty by Sex and Age in Kalawao County
According to the poverty statistics in Kalawao County, males aged 35 to 44 years and females aged 25 to 34 years are the age groups that are most secure financially, with 100.0% of males and 100.0% of females in these age groups living above the poverty line.
| Age Bracket | Male | Female |
| Under 5 Years | 0 (0.0%) | 0 (0.0%) |
| 5 Years | 0 (0.0%) | 0 (0.0%) |
| 6 to 11 Years | 0 (0.0%) | 0 (0.0%) |
| 12 to 14 Years | 0 (0.0%) | 0 (0.0%) |
| 15 Years | 0 (0.0%) | 0 (0.0%) |
| 16 and 17 Years | 0 (0.0%) | 0 (0.0%) |
| 18 to 24 Years | 0 (0.0%) | 0 (0.0%) |
| 25 to 34 Years | 7 (63.6%) | 2 (100.0%) |
| 35 to 44 Years | 11 (100.0%) | 3 (100.0%) |
| 45 to 54 Years | 2 (66.7%) | 0 (0.0%) |
| 55 to 64 Years | 7 (100.0%) | 2 (100.0%) |
| 65 to 74 Years | 1 (100.0%) | 2 (100.0%) |
| 75 Years and over | 1 (100.0%) | 2 (50.0%) |
| Total | 29 (85.3%) | 11 (84.6%) |
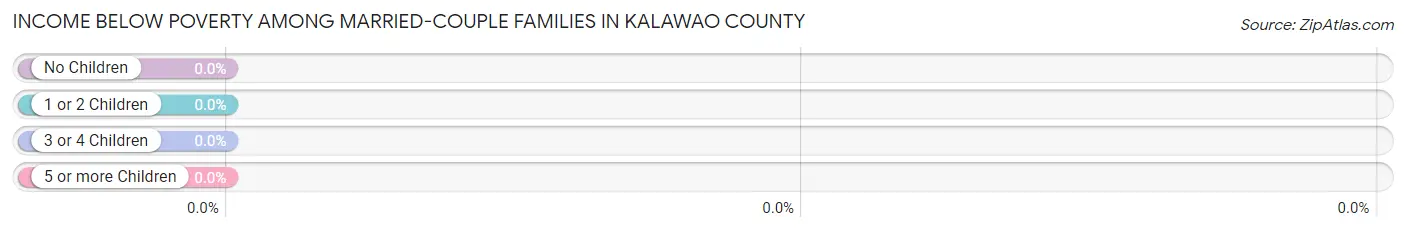
Income Below Poverty Among Married-Couple Families in Kalawao County
| Children | Above Poverty | Below Poverty |
| No Children | 3 (100.0%) | 0 (0.0%) |
| 1 or 2 Children | 0 (0.0%) | 0 (0.0%) |
| 3 or 4 Children | 0 (0.0%) | 0 (0.0%) |
| 5 or more Children | 0 (0.0%) | 0 (0.0%) |
| Total | 3 (100.0%) | 0 (0.0%) |
Income Below Poverty Among Single-Parent Households in Kalawao County
| Children | Single Father | Single Mother |
| No Children | 0 (0.0%) | 0 (0.0%) |
| 1 or 2 Children | 0 (0.0%) | 0 (0.0%) |
| 3 or 4 Children | 0 (0.0%) | 0 (0.0%) |
| 5 or more Children | 0 (0.0%) | 0 (0.0%) |
| Total | 0 (0.0%) | 0 (0.0%) |
Income Below Poverty Among Married-Couple vs Single-Parent Households in Kalawao County
| Children | Married-Couple Families | Single-Parent Households |
| No Children | 0 (0.0%) | 0 (0.0%) |
| 1 or 2 Children | 0 (0.0%) | 0 (0.0%) |
| 3 or 4 Children | 0 (0.0%) | 0 (0.0%) |
| 5 or more Children | 0 (0.0%) | 0 (0.0%) |
| Total | 0 (0.0%) | 0 (0.0%) |
Race in Kalawao County
The most populous races in Kalawao County are White / Caucasian (19 | 38.0%), Native / Alaskan (9 | 18.0%), and Two or more Races (9 | 18.0%).
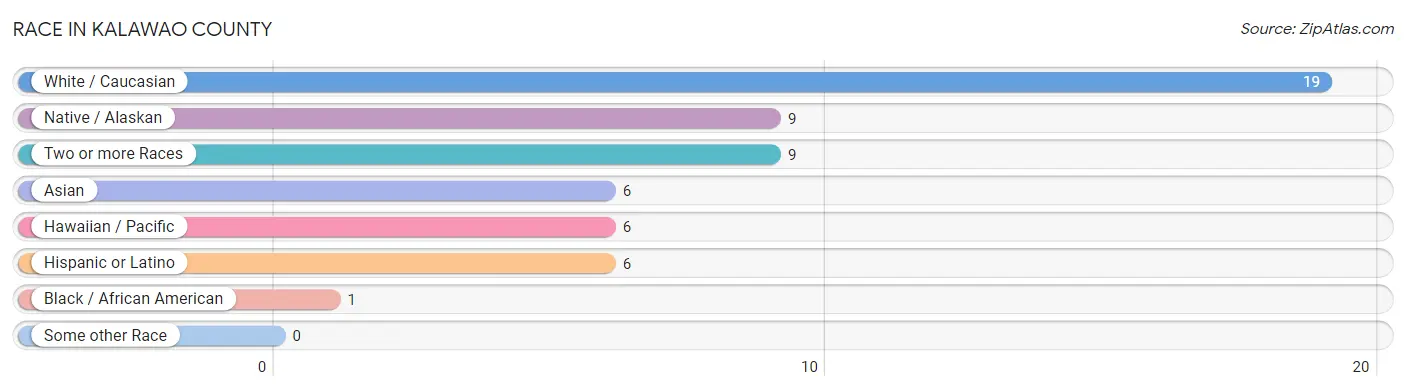
| Race | # Population | % Population |
| Asian | 6 | 12.0% |
| Black / African American | 1 | 2.0% |
| Hawaiian / Pacific | 6 | 12.0% |
| Hispanic or Latino | 6 | 12.0% |
| Native / Alaskan | 9 | 18.0% |
| White / Caucasian | 19 | 38.0% |
| Two or more Races | 9 | 18.0% |
| Some other Race | 0 | 0.0% |
| Total | 50 | 100.0% |
Ancestry in Kalawao County
The most populous ancestries reported in Kalawao County are Navajo (9 | 18.0%), Native Hawaiian (7 | 14.0%), English (6 | 12.0%), Indian (Asian) (6 | 12.0%), and Portuguese (5 | 10.0%), together accounting for 66.0% of all Kalawao County residents.
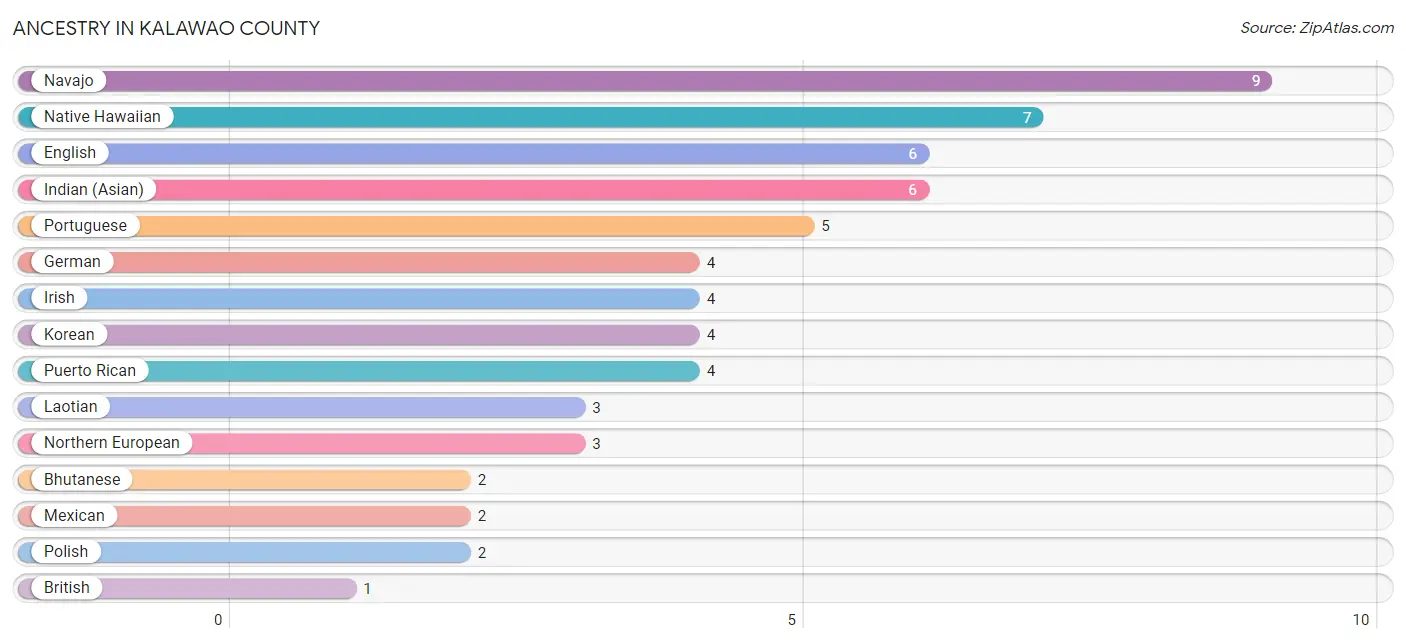
| Ancestry | # Population | % Population |
| Bhutanese | 2 | 4.0% |
| British | 1 | 2.0% |
| Burmese | 1 | 2.0% |
| English | 6 | 12.0% |
| German | 4 | 8.0% |
| Indian (Asian) | 6 | 12.0% |
| Irish | 4 | 8.0% |
| Korean | 4 | 8.0% |
| Laotian | 3 | 6.0% |
| Mexican | 2 | 4.0% |
| Native Hawaiian | 7 | 14.0% |
| Navajo | 9 | 18.0% |
| Northern European | 3 | 6.0% |
| Polish | 2 | 4.0% |
| Portuguese | 5 | 10.0% |
| Puerto Rican | 4 | 8.0% |
| Subsaharan African | 1 | 2.0% | View All 17 Rows |
Immigrants in Kalawao County
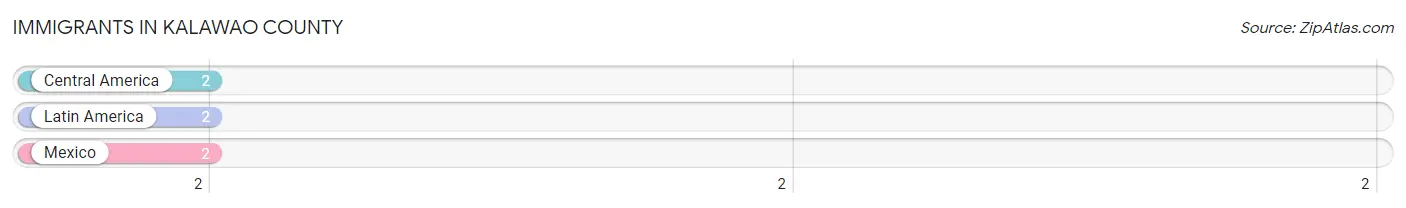
The most numerous immigrant groups reported in Kalawao County came from Central America (2 | 4.0%), Latin America (2 | 4.0%), and Mexico (2 | 4.0%), together accounting for 12.0% of all Kalawao County residents.
| Immigration Origin | # Population | % Population |
| Central America | 2 | 4.0% |
| Latin America | 2 | 4.0% |
| Mexico | 2 | 4.0% | View All 3 Rows |
Sex and Age in Kalawao County
Sex and Age in Kalawao County
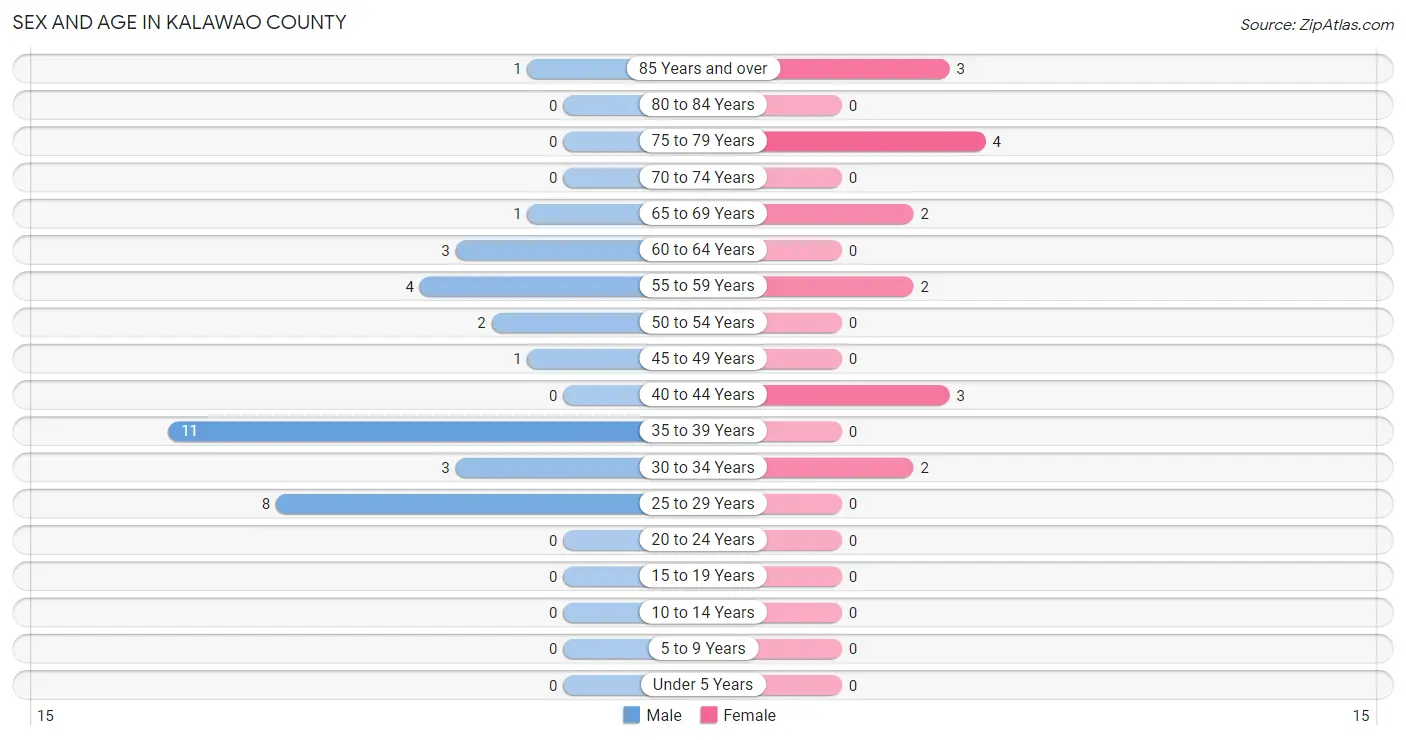
The most populous age groups in Kalawao County are 35 to 39 Years (11 | 32.4%) for men and 75 to 79 Years (4 | 25.0%) for women.
| Age Bracket | Male | Female |
| Under 5 Years | 0 (0.0%) | 0 (0.0%) |
| 5 to 9 Years | 0 (0.0%) | 0 (0.0%) |
| 10 to 14 Years | 0 (0.0%) | 0 (0.0%) |
| 15 to 19 Years | 0 (0.0%) | 0 (0.0%) |
| 20 to 24 Years | 0 (0.0%) | 0 (0.0%) |
| 25 to 29 Years | 8 (23.5%) | 0 (0.0%) |
| 30 to 34 Years | 3 (8.8%) | 2 (12.5%) |
| 35 to 39 Years | 11 (32.4%) | 0 (0.0%) |
| 40 to 44 Years | 0 (0.0%) | 3 (18.8%) |
| 45 to 49 Years | 1 (2.9%) | 0 (0.0%) |
| 50 to 54 Years | 2 (5.9%) | 0 (0.0%) |
| 55 to 59 Years | 4 (11.8%) | 2 (12.5%) |
| 60 to 64 Years | 3 (8.8%) | 0 (0.0%) |
| 65 to 69 Years | 1 (2.9%) | 2 (12.5%) |
| 70 to 74 Years | 0 (0.0%) | 0 (0.0%) |
| 75 to 79 Years | 0 (0.0%) | 4 (25.0%) |
| 80 to 84 Years | 0 (0.0%) | 0 (0.0%) |
| 85 Years and over | 1 (2.9%) | 3 (18.8%) |
| Total | 34 (100.0%) | 16 (100.0%) |
Families and Households in Kalawao County
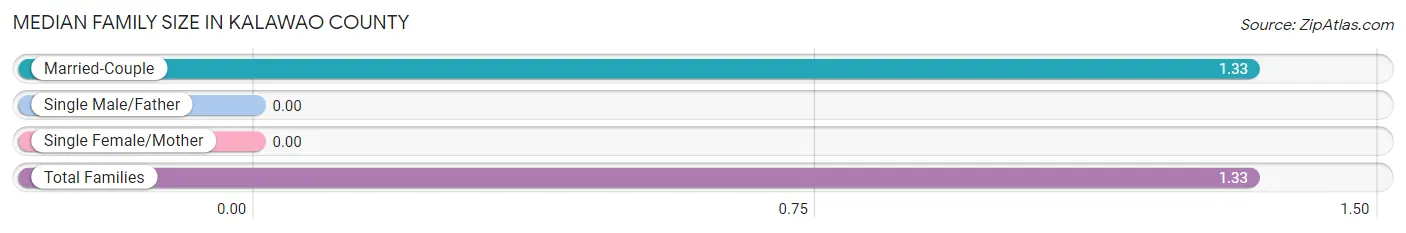
Median Family Size in Kalawao County
| Family Type | # Families | Family Size |
| Married-Couple | 3 (100.0%) | 1.33 |
| Single Male/Father | 0 (0.0%) | - |
| Single Female/Mother | 0 (0.0%) | - |
| Total Families | 3 (100.0%) | 1.33 |
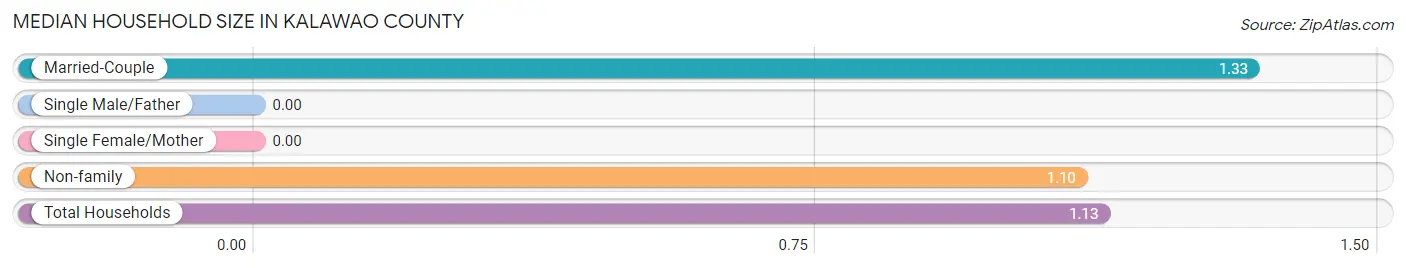
Median Household Size in Kalawao County
| Household Type | # Households | Household Size |
| Married-Couple | 3 (9.4%) | 1.33 |
| Single Male/Father | 0 (0.0%) | - |
| Single Female/Mother | 0 (0.0%) | - |
| Non-family | 29 (90.6%) | 1.10 |
| Total Households | 32 (100.0%) | 1.13 |
Household Size by Marriage Status in Kalawao County
Out of a total of 32 households in Kalawao County, 3 (9.4%) are family households, while 29 (90.6%) are nonfamily households. The most numerous type of family households are 2-person households, comprising 3, and the most common type of nonfamily households are 1-person households, comprising 25.
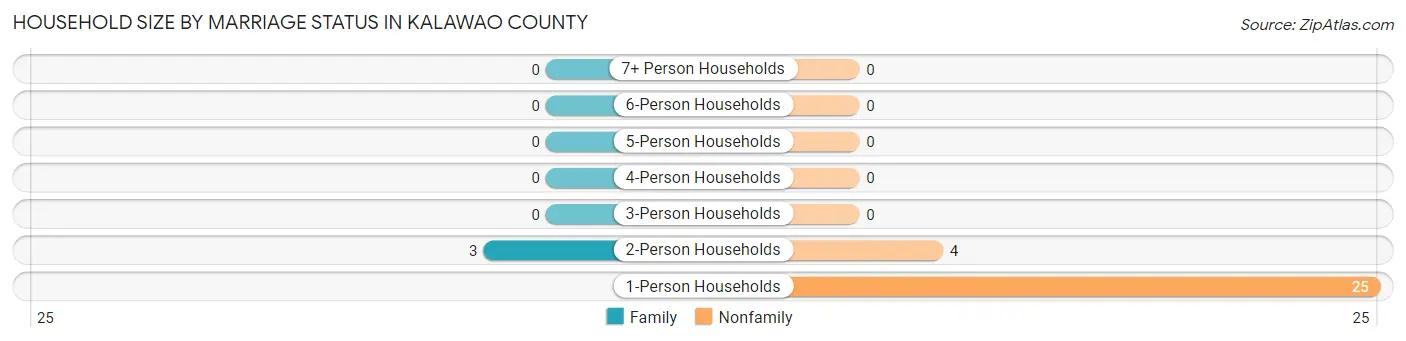
| Household Size | Family Households | Nonfamily Households |
| 1-Person Households | - | 25 (78.1%) |
| 2-Person Households | 3 (9.4%) | 4 (12.5%) |
| 3-Person Households | 0 (0.0%) | 0 (0.0%) |
| 4-Person Households | 0 (0.0%) | 0 (0.0%) |
| 5-Person Households | 0 (0.0%) | 0 (0.0%) |
| 6-Person Households | 0 (0.0%) | 0 (0.0%) |
| 7+ Person Households | 0 (0.0%) | 0 (0.0%) |
| Total | 3 (9.4%) | 29 (90.6%) |
Female Fertility in Kalawao County
Fertility by Age in Kalawao County
| Age Bracket | Women with Births | Births / 1,000 Women |
| 15 to 19 years | 0 (0.0%) | 0.0 |
| 20 to 34 years | 0 (0.0%) | 0.0 |
| 35 to 50 years | 0 (0.0%) | 0.0 |
| Total | 0 (0.0%) | 0.0 |
Fertility by Age by Marriage Status in Kalawao County
| Age Bracket | Married | Unmarried |
| 15 to 19 years | 0 (0.0%) | 0 (0.0%) |
| 20 to 34 years | 0 (0.0%) | 0 (0.0%) |
| 35 to 50 years | 0 (0.0%) | 0 (0.0%) |
| Total | 0 (0.0%) | 0 (0.0%) |
Fertility by Education in Kalawao County
| Educational Attainment | Women with Births | Births / 1,000 Women |
| Less than High School | 0 (0.0%) | 0.0 |
| High School Diploma | 0 (0.0%) | 0.0 |
| College or Associate's Degree | 0 (0.0%) | 0.0 |
| Bachelor's Degree | 0 (0.0%) | 0.0 |
| Graduate Degree | 0 (0.0%) | 0.0 |
| Total | 0 (0.0%) | 0.0 |
Fertility by Education by Marriage Status in Kalawao County
| Educational Attainment | Married | Unmarried |
| Less than High School | 0 (0.0%) | 0 (0.0%) |
| High School Diploma | 0 (0.0%) | 0 (0.0%) |
| College or Associate's Degree | 0 (0.0%) | 0 (0.0%) |
| Bachelor's Degree | 0 (0.0%) | 0 (0.0%) |
| Graduate Degree | 0 (0.0%) | 0 (0.0%) |
| Total | 0 (0.0%) | 0 (0.0%) |
Employment Characteristics in Kalawao County
Employment by Class of Employer in Kalawao County
Among the 36 employed individuals in Kalawao County, private company employees (18 | 50.0%), not-for-profit organizations (7 | 19.4%), and state government employees (7 | 19.4%) make up the most common classes of employment.
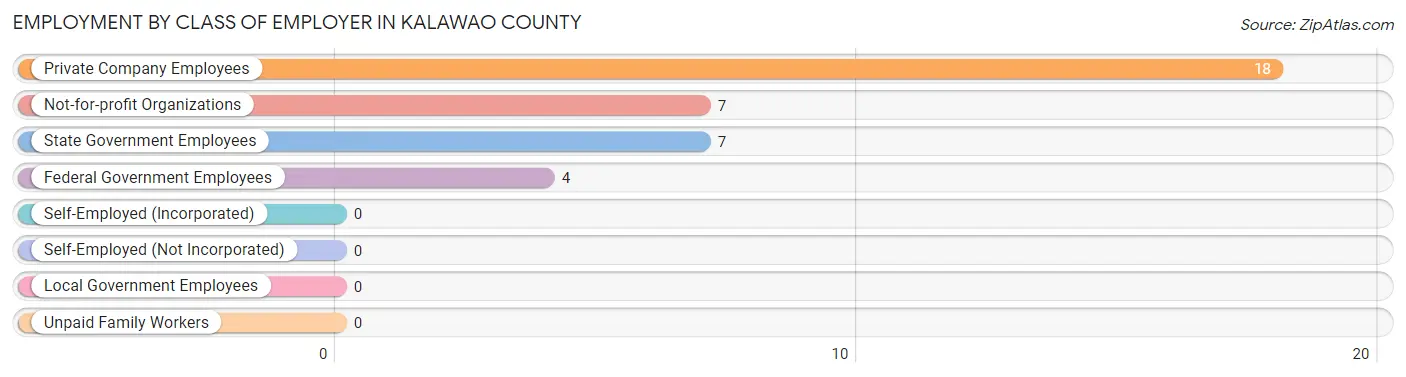
| Employer Class | # Employees | % Employees |
| Private Company Employees | 18 | 50.0% |
| Self-Employed (Incorporated) | 0 | 0.0% |
| Self-Employed (Not Incorporated) | 0 | 0.0% |
| Not-for-profit Organizations | 7 | 19.4% |
| Local Government Employees | 0 | 0.0% |
| State Government Employees | 7 | 19.4% |
| Federal Government Employees | 4 | 11.1% |
| Unpaid Family Workers | 0 | 0.0% |
| Total | 36 | 100.0% |
Employment Status by Age in Kalawao County
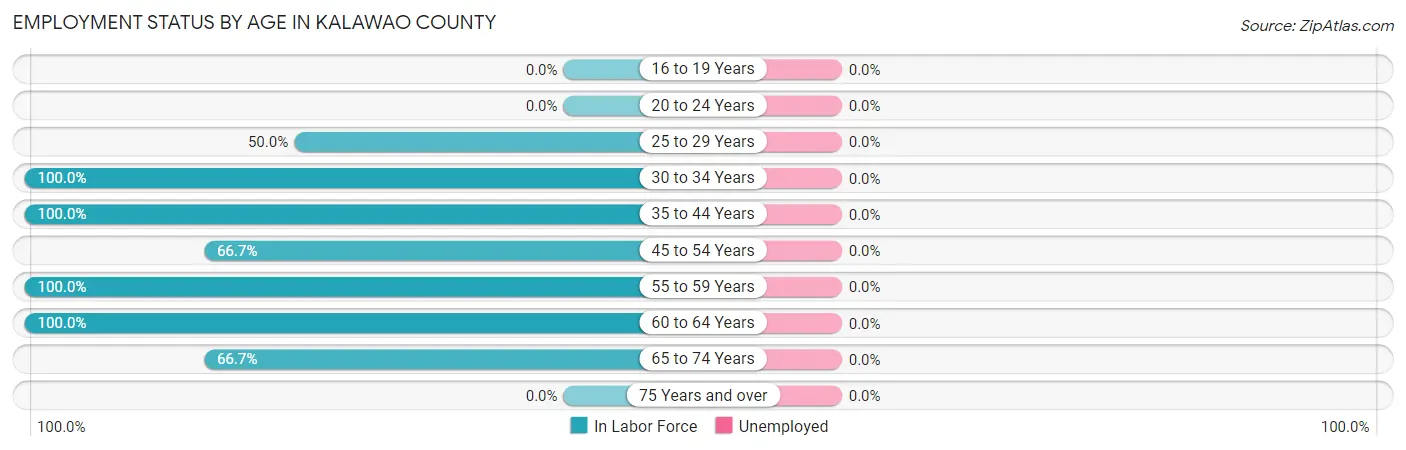
| Age Bracket | In Labor Force | Unemployed |
| 16 to 19 Years | 0 (0.0%) | 0 (0.0%) |
| 20 to 24 Years | 0 (0.0%) | 0 (0.0%) |
| 25 to 29 Years | 4 (50.0%) | 0 (0.0%) |
| 30 to 34 Years | 5 (100.0%) | 0 (0.0%) |
| 35 to 44 Years | 14 (100.0%) | 0 (0.0%) |
| 45 to 54 Years | 2 (66.7%) | 0 (0.0%) |
| 55 to 59 Years | 6 (100.0%) | 0 (0.0%) |
| 60 to 64 Years | 3 (100.0%) | 0 (0.0%) |
| 65 to 74 Years | 2 (66.7%) | 0 (0.0%) |
| 75 Years and over | 0 (0.0%) | 0 (0.0%) |
| Total | 36 (72.0%) | 0 (0.0%) |
Employment Status by Educational Attainment in Kalawao County
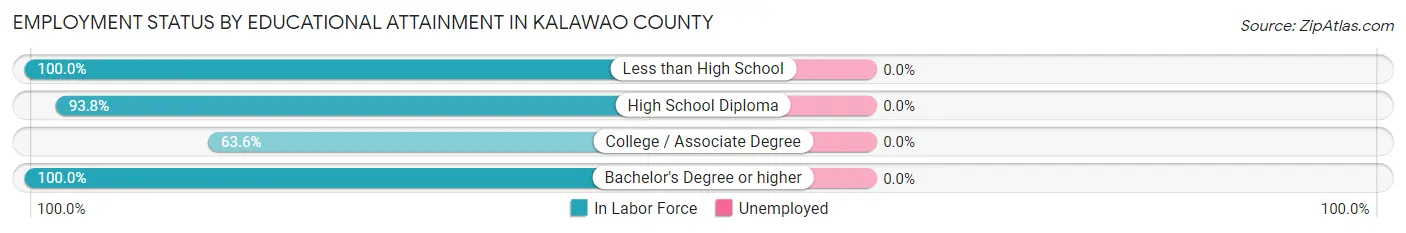
| Educational Attainment | In Labor Force | Unemployed |
| Less than High School | 2 (100.0%) | 0 (0.0%) |
| High School Diploma | 15 (93.8%) | 0 (0.0%) |
| College / Associate Degree | 7 (63.6%) | 0 (0.0%) |
| Bachelor's Degree or higher | 10 (100.0%) | 0 (0.0%) |
| Total | 34 (87.2%) | 0 (0.0%) |
Employment Occupations by Sex in Kalawao County
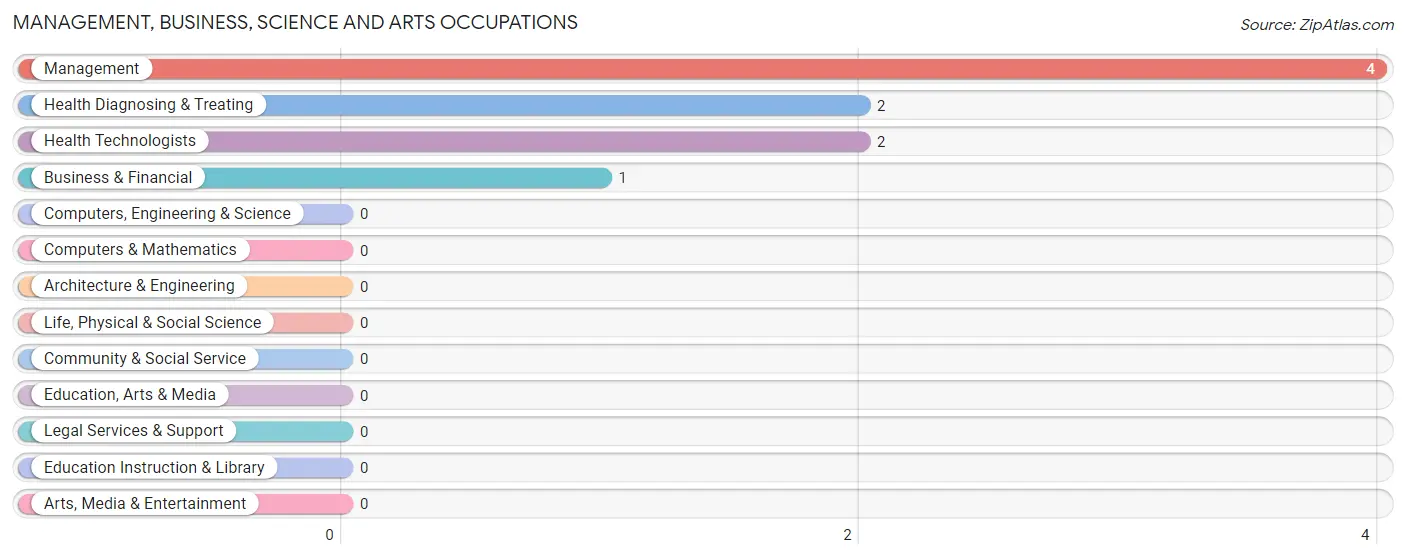
Management, Business, Science and Arts Occupations
The most common Management, Business, Science and Arts occupations in Kalawao County are Management (4 | 11.1%), Health Diagnosing & Treating (2 | 5.6%), Health Technologists (2 | 5.6%), and Business & Financial (1 | 2.8%).
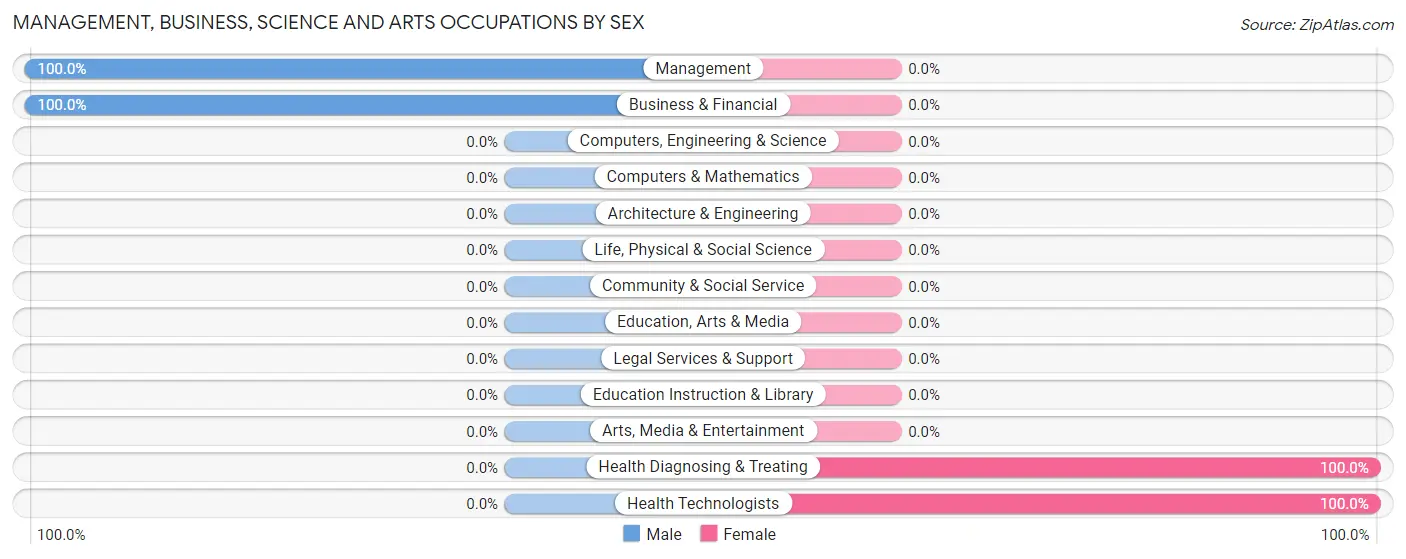
Management, Business, Science and Arts Occupations by Sex
Within the Management, Business, Science and Arts occupations in Kalawao County, the most male-oriented occupations are Management (100.0%), and Business & Financial (100.0%), while the most female-oriented occupations are Health Diagnosing & Treating (100.0%), and Health Technologists (100.0%).
| Occupation | Male | Female |
| Management | 4 (100.0%) | 0 (0.0%) |
| Business & Financial | 1 (100.0%) | 0 (0.0%) |
| Computers, Engineering & Science | 0 (0.0%) | 0 (0.0%) |
| Computers & Mathematics | 0 (0.0%) | 0 (0.0%) |
| Architecture & Engineering | 0 (0.0%) | 0 (0.0%) |
| Life, Physical & Social Science | 0 (0.0%) | 0 (0.0%) |
| Community & Social Service | 0 (0.0%) | 0 (0.0%) |
| Education, Arts & Media | 0 (0.0%) | 0 (0.0%) |
| Legal Services & Support | 0 (0.0%) | 0 (0.0%) |
| Education Instruction & Library | 0 (0.0%) | 0 (0.0%) |
| Arts, Media & Entertainment | 0 (0.0%) | 0 (0.0%) |
| Health Diagnosing & Treating | 0 (0.0%) | 2 (100.0%) |
| Health Technologists | 0 (0.0%) | 2 (100.0%) |
| Total (Category) | 5 (71.4%) | 2 (28.6%) |
| Total (Overall) | 27 (75.0%) | 9 (25.0%) |
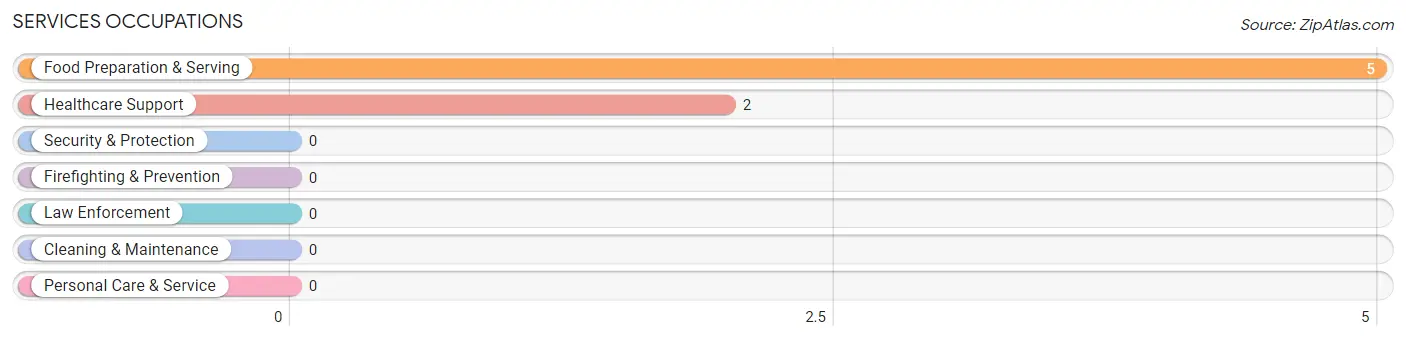
Services Occupations
The most common Services occupations in Kalawao County are Food Preparation & Serving (5 | 13.9%), and Healthcare Support (2 | 5.6%).
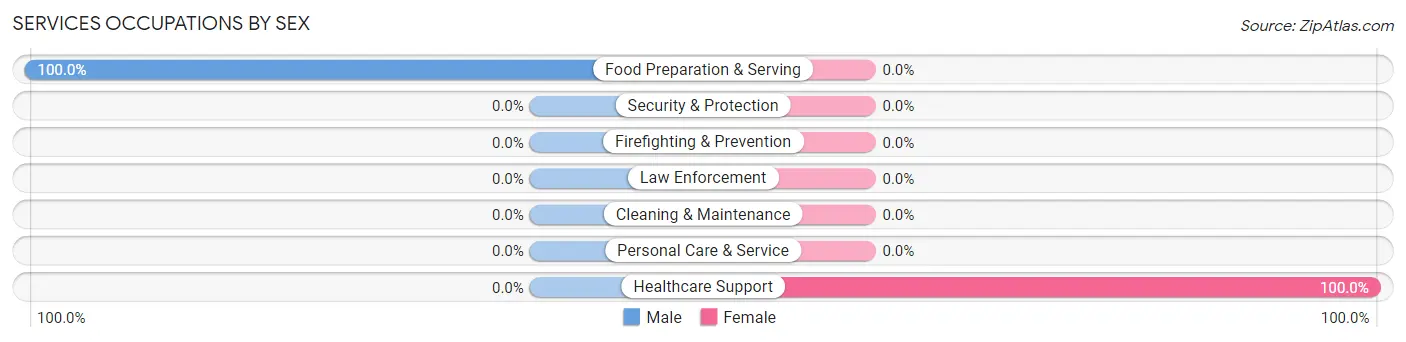
Services Occupations by Sex
| Occupation | Male | Female |
| Healthcare Support | 0 (0.0%) | 2 (100.0%) |
| Security & Protection | 0 (0.0%) | 0 (0.0%) |
| Firefighting & Prevention | 0 (0.0%) | 0 (0.0%) |
| Law Enforcement | 0 (0.0%) | 0 (0.0%) |
| Food Preparation & Serving | 5 (100.0%) | 0 (0.0%) |
| Cleaning & Maintenance | 0 (0.0%) | 0 (0.0%) |
| Personal Care & Service | 0 (0.0%) | 0 (0.0%) |
| Total (Category) | 5 (71.4%) | 2 (28.6%) |
| Total (Overall) | 27 (75.0%) | 9 (25.0%) |
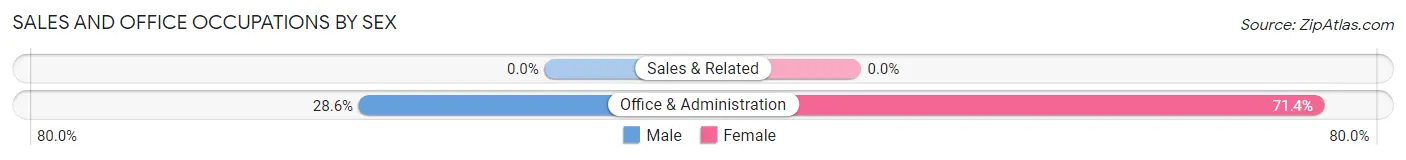
Sales and Office Occupations
The most common Sales and Office occupations in Kalawao County are , and Office & Administration (7 | 19.4%).
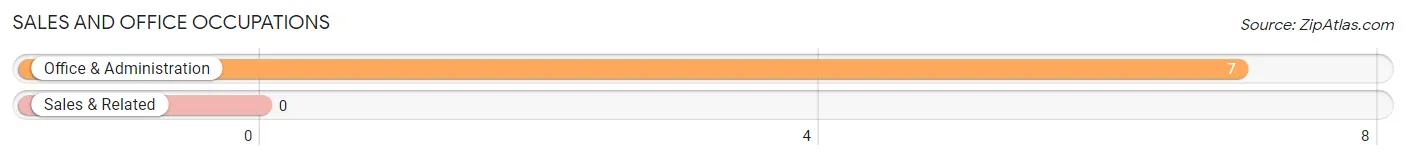
Sales and Office Occupations by Sex
| Occupation | Male | Female |
| Sales & Related | 0 (0.0%) | 0 (0.0%) |
| Office & Administration | 2 (28.6%) | 5 (71.4%) |
| Total (Category) | 2 (28.6%) | 5 (71.4%) |
| Total (Overall) | 27 (75.0%) | 9 (25.0%) |
Natural Resources, Construction and Maintenance Occupations
The most common Natural Resources, Construction and Maintenance occupations in Kalawao County are Farming, Fishing & Forestry (3 | 8.3%), and Construction & Extraction (1 | 2.8%).
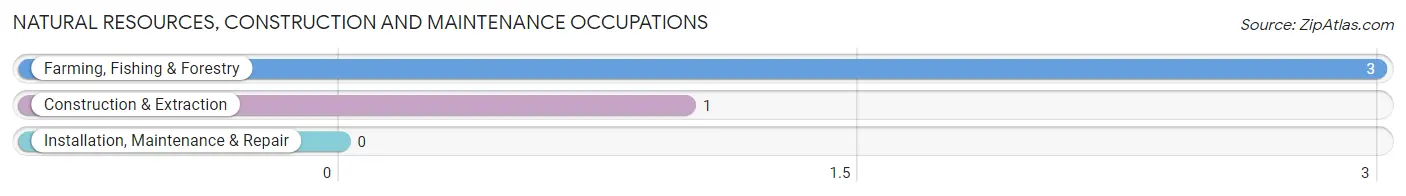
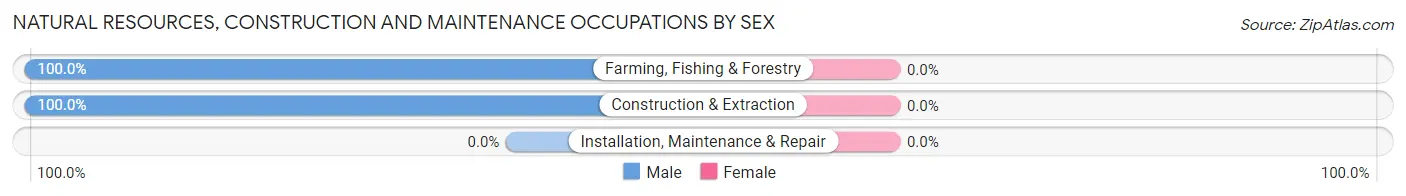
Natural Resources, Construction and Maintenance Occupations by Sex
| Occupation | Male | Female |
| Farming, Fishing & Forestry | 3 (100.0%) | 0 (0.0%) |
| Construction & Extraction | 1 (100.0%) | 0 (0.0%) |
| Installation, Maintenance & Repair | 0 (0.0%) | 0 (0.0%) |
| Total (Category) | 4 (100.0%) | 0 (0.0%) |
| Total (Overall) | 27 (75.0%) | 9 (25.0%) |
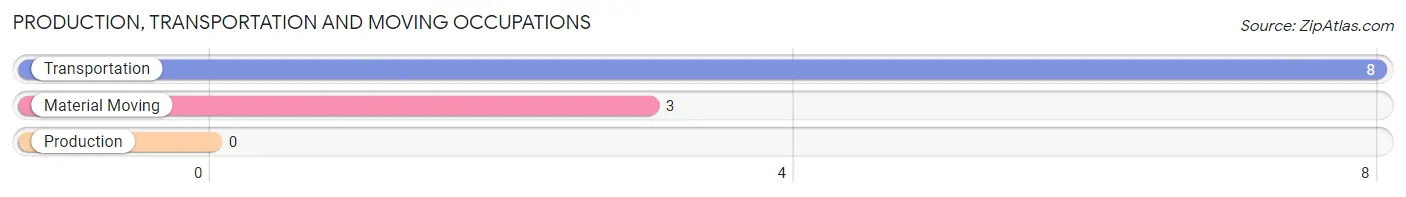
Production, Transportation and Moving Occupations
The most common Production, Transportation and Moving occupations in Kalawao County are Transportation (8 | 22.2%), and Material Moving (3 | 8.3%).
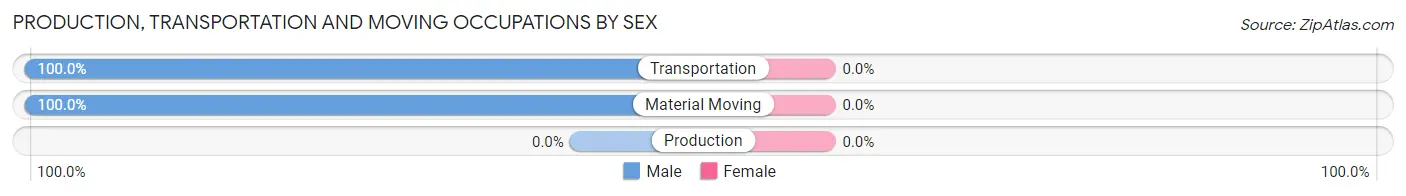
Production, Transportation and Moving Occupations by Sex
| Occupation | Male | Female |
| Production | 0 (0.0%) | 0 (0.0%) |
| Transportation | 8 (100.0%) | 0 (0.0%) |
| Material Moving | 3 (100.0%) | 0 (0.0%) |
| Total (Category) | 11 (100.0%) | 0 (0.0%) |
| Total (Overall) | 27 (75.0%) | 9 (25.0%) |
Employment Industries by Sex in Kalawao County
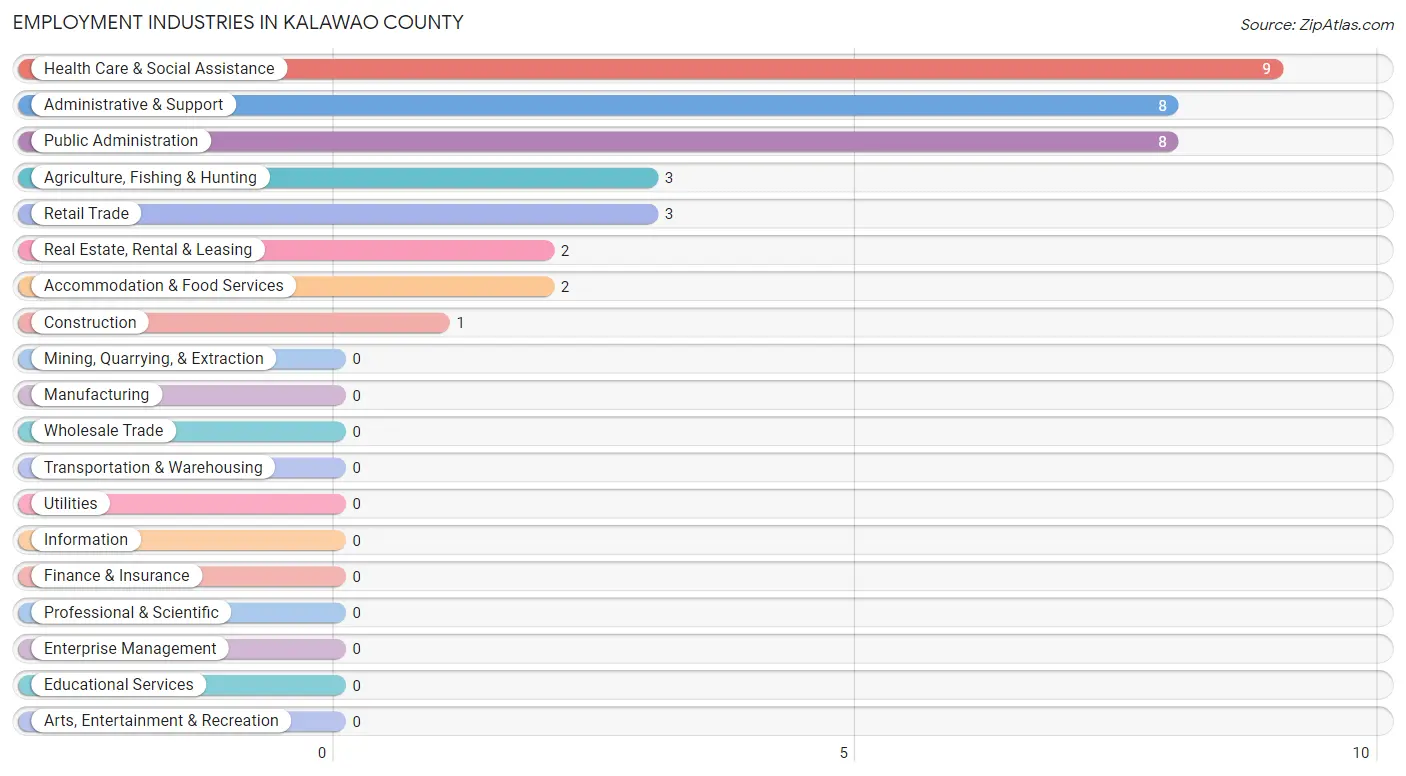
Employment Industries in Kalawao County
The major employment industries in Kalawao County include Health Care & Social Assistance (9 | 25.0%), Administrative & Support (8 | 22.2%), Public Administration (8 | 22.2%), Agriculture, Fishing & Hunting (3 | 8.3%), and Retail Trade (3 | 8.3%).
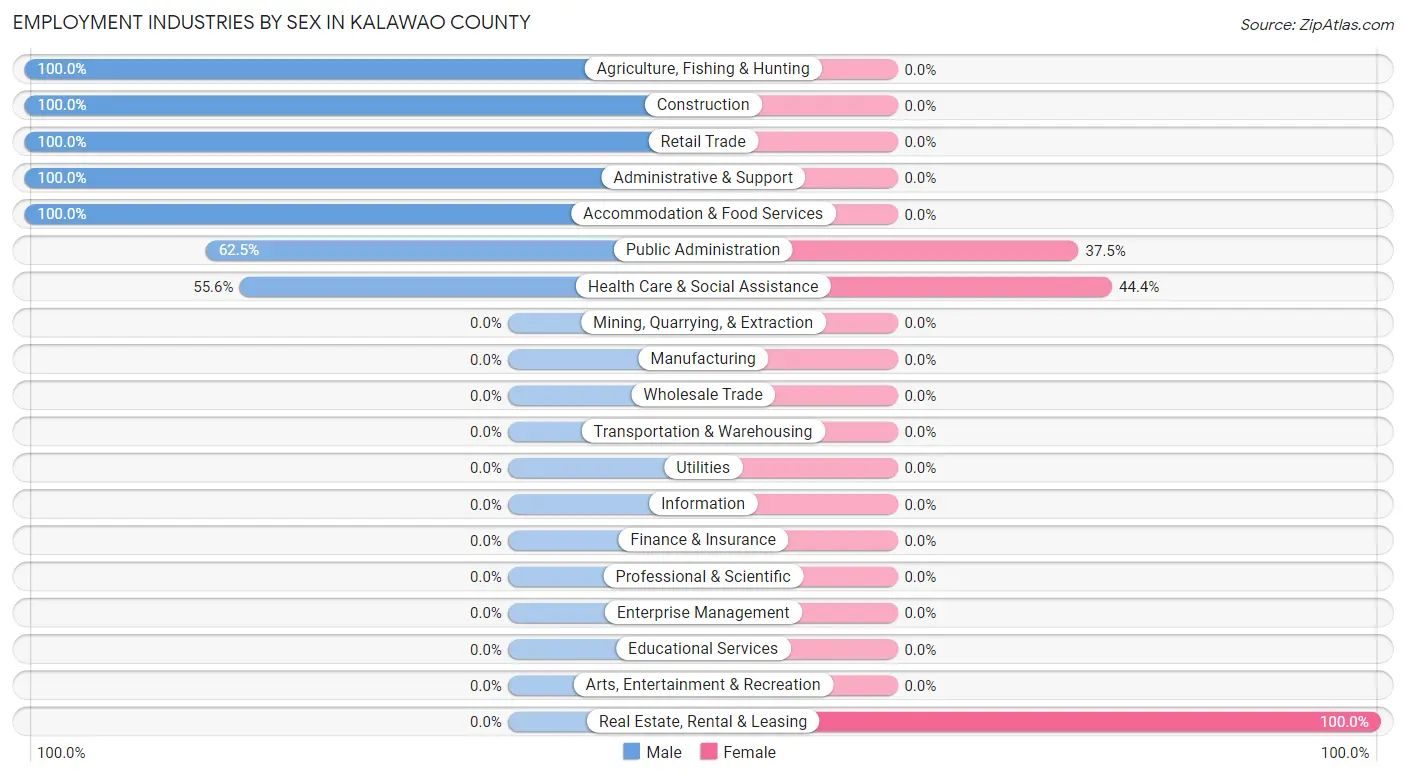
Employment Industries by Sex in Kalawao County
The Kalawao County industries that see more men than women are Agriculture, Fishing & Hunting (100.0%), Construction (100.0%), and Retail Trade (100.0%), whereas the industries that tend to have a higher number of women are Real Estate, Rental & Leasing (100.0%), Health Care & Social Assistance (44.4%), and Public Administration (37.5%).
| Industry | Male | Female |
| Agriculture, Fishing & Hunting | 3 (100.0%) | 0 (0.0%) |
| Mining, Quarrying, & Extraction | 0 (0.0%) | 0 (0.0%) |
| Construction | 1 (100.0%) | 0 (0.0%) |
| Manufacturing | 0 (0.0%) | 0 (0.0%) |
| Wholesale Trade | 0 (0.0%) | 0 (0.0%) |
| Retail Trade | 3 (100.0%) | 0 (0.0%) |
| Transportation & Warehousing | 0 (0.0%) | 0 (0.0%) |
| Utilities | 0 (0.0%) | 0 (0.0%) |
| Information | 0 (0.0%) | 0 (0.0%) |
| Finance & Insurance | 0 (0.0%) | 0 (0.0%) |
| Real Estate, Rental & Leasing | 0 (0.0%) | 2 (100.0%) |
| Professional & Scientific | 0 (0.0%) | 0 (0.0%) |
| Enterprise Management | 0 (0.0%) | 0 (0.0%) |
| Administrative & Support | 8 (100.0%) | 0 (0.0%) |
| Educational Services | 0 (0.0%) | 0 (0.0%) |
| Health Care & Social Assistance | 5 (55.6%) | 4 (44.4%) |
| Arts, Entertainment & Recreation | 0 (0.0%) | 0 (0.0%) |
| Accommodation & Food Services | 2 (100.0%) | 0 (0.0%) |
| Public Administration | 5 (62.5%) | 3 (37.5%) |
| Total | 27 (75.0%) | 9 (25.0%) |
Education in Kalawao County
School Enrollment in Kalawao County
| School Level | # Students | % Students |
| Nursery / Preschool | 0 | 0.0% |
| Kindergarten | 0 | 0.0% |
| Elementary School | 0 | 0.0% |
| Middle School | 0 | 0.0% |
| High School | 0 | 0.0% |
| College / Undergraduate | 0 | 0.0% |
| Graduate / Professional | 0 | 0.0% |
| Total | 0 | 0.0% |
School Enrollment by Age by Funding Source in Kalawao County
| Age Bracket | Public School | Private School |
| 3 to 4 Year Olds | 0 (0.0%) | 0 (0.0%) |
| 5 to 9 Year Old | 0 (0.0%) | 0 (0.0%) |
| 10 to 14 Year Olds | 0 (0.0%) | 0 (0.0%) |
| 15 to 17 Year Olds | 0 (0.0%) | 0 (0.0%) |
| 18 to 19 Year Olds | 0 (0.0%) | 0 (0.0%) |
| 20 to 24 Year Olds | 0 (0.0%) | 0 (0.0%) |
| 25 to 34 Year Olds | 0 (0.0%) | 0 (0.0%) |
| 35 Years and over | 0 (0.0%) | 0 (0.0%) |
| Total | 0 (0.0%) | 0 (0.0%) |
Educational Attainment by Field of Study in Kalawao County
Science & technology (4 | 23.5%), business (3 | 17.6%), education (3 | 17.6%), arts & humanities (3 | 17.6%), and social sciences (2 | 11.8%) are the most common fields of study among 17 individuals in Kalawao County who have obtained a bachelor's degree or higher.
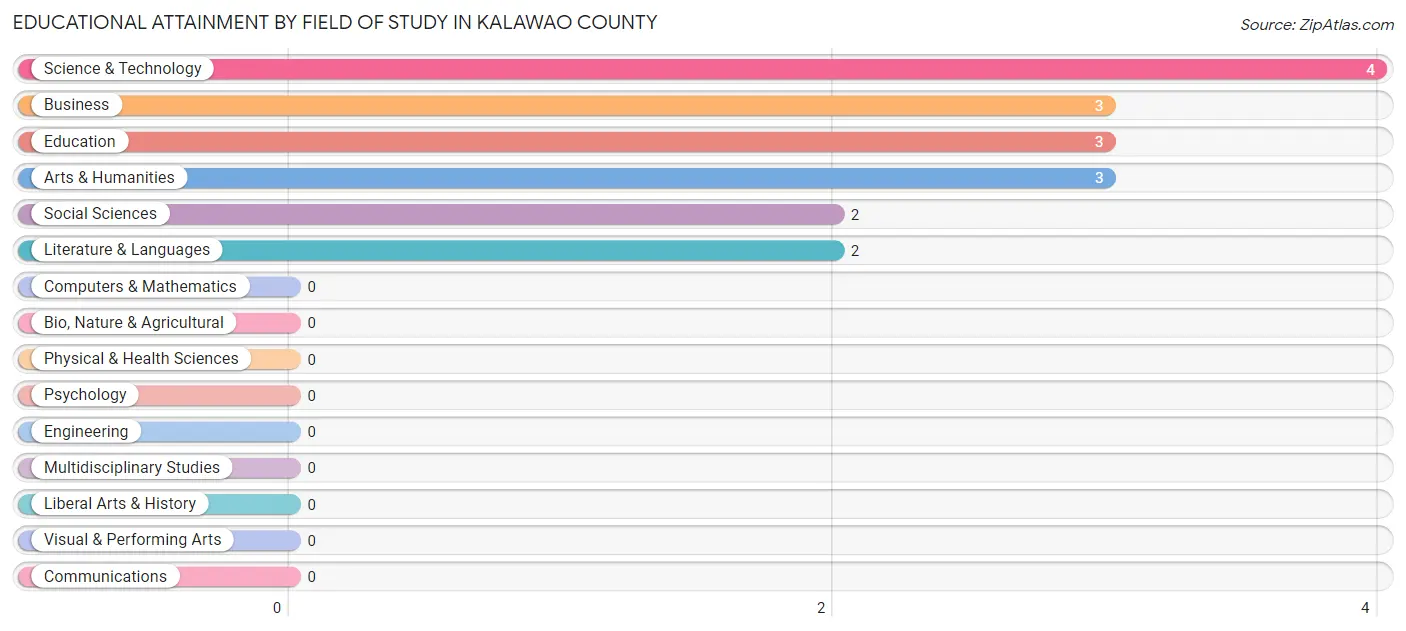
| Field of Study | # Graduates | % Graduates |
| Computers & Mathematics | 0 | 0.0% |
| Bio, Nature & Agricultural | 0 | 0.0% |
| Physical & Health Sciences | 0 | 0.0% |
| Psychology | 0 | 0.0% |
| Social Sciences | 2 | 11.8% |
| Engineering | 0 | 0.0% |
| Multidisciplinary Studies | 0 | 0.0% |
| Science & Technology | 4 | 23.5% |
| Business | 3 | 17.6% |
| Education | 3 | 17.6% |
| Literature & Languages | 2 | 11.8% |
| Liberal Arts & History | 0 | 0.0% |
| Visual & Performing Arts | 0 | 0.0% |
| Communications | 0 | 0.0% |
| Arts & Humanities | 3 | 17.6% |
| Total | 17 | 100.0% |
Transportation & Commute in Kalawao County
Vehicle Availability by Sex in Kalawao County
The most prevalent vehicle ownership categories in Kalawao County are males with 1 vehicle (19, accounting for 86.4%) and females with 1 vehicle (9, making up 211.1%).
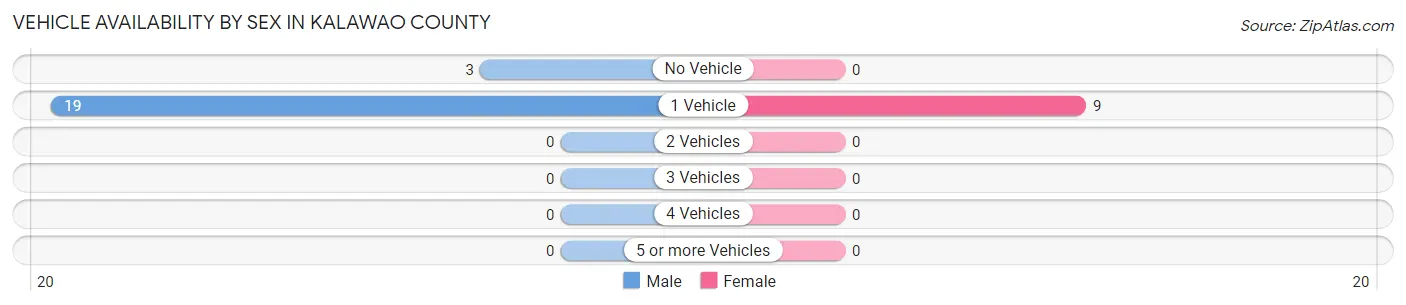
| Vehicles Available | Male | Female |
| No Vehicle | 3 (13.6%) | 0 (0.0%) |
| 1 Vehicle | 19 (86.4%) | 9 (100.0%) |
| 2 Vehicles | 0 (0.0%) | 0 (0.0%) |
| 3 Vehicles | 0 (0.0%) | 0 (0.0%) |
| 4 Vehicles | 0 (0.0%) | 0 (0.0%) |
| 5 or more Vehicles | 0 (0.0%) | 0 (0.0%) |
| Total | 22 (100.0%) | 9 (100.0%) |
Commute Time in Kalawao County
The most frequently occuring commute durations in Kalawao County are less than 5 minutes (14 commuters, 45.2%), 5 to 9 minutes (12 commuters, 38.7%), and 10 to 14 minutes (3 commuters, 9.7%).
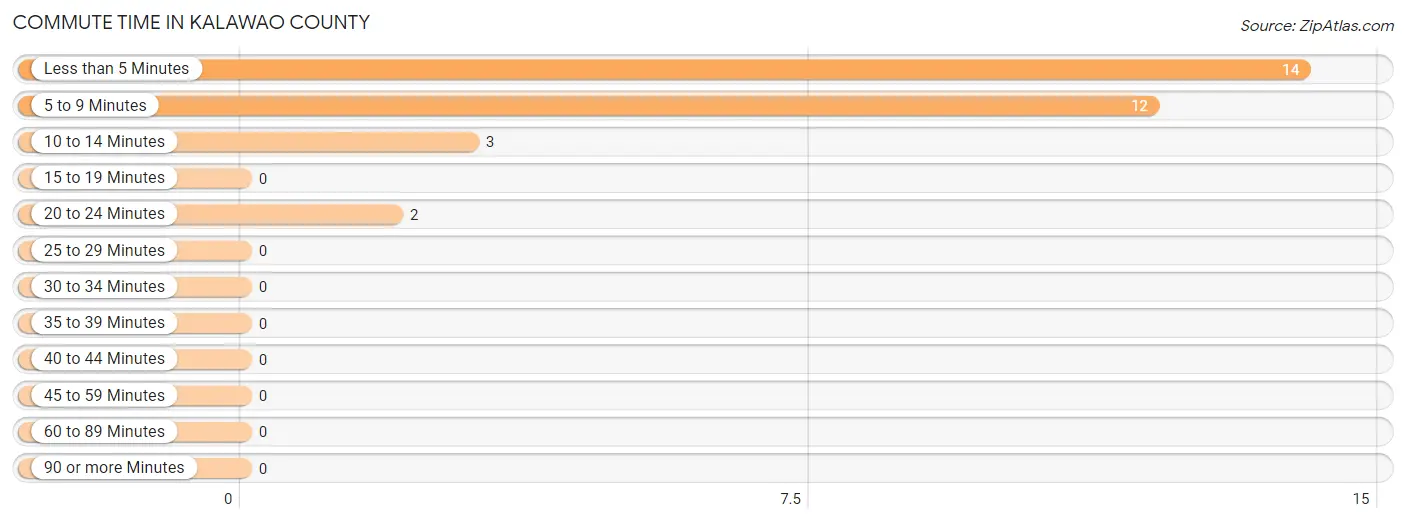
| Commute Time | # Commuters | % Commuters |
| Less than 5 Minutes | 14 | 45.2% |
| 5 to 9 Minutes | 12 | 38.7% |
| 10 to 14 Minutes | 3 | 9.7% |
| 15 to 19 Minutes | 0 | 0.0% |
| 20 to 24 Minutes | 2 | 6.5% |
| 25 to 29 Minutes | 0 | 0.0% |
| 30 to 34 Minutes | 0 | 0.0% |
| 35 to 39 Minutes | 0 | 0.0% |
| 40 to 44 Minutes | 0 | 0.0% |
| 45 to 59 Minutes | 0 | 0.0% |
| 60 to 89 Minutes | 0 | 0.0% |
| 90 or more Minutes | 0 | 0.0% |
Commute Time by Sex in Kalawao County
The most common commute times in Kalawao County are less than 5 minutes (12 commuters, 50.0%) for males and 5 to 9 minutes (5 commuters, 71.4%) for females.
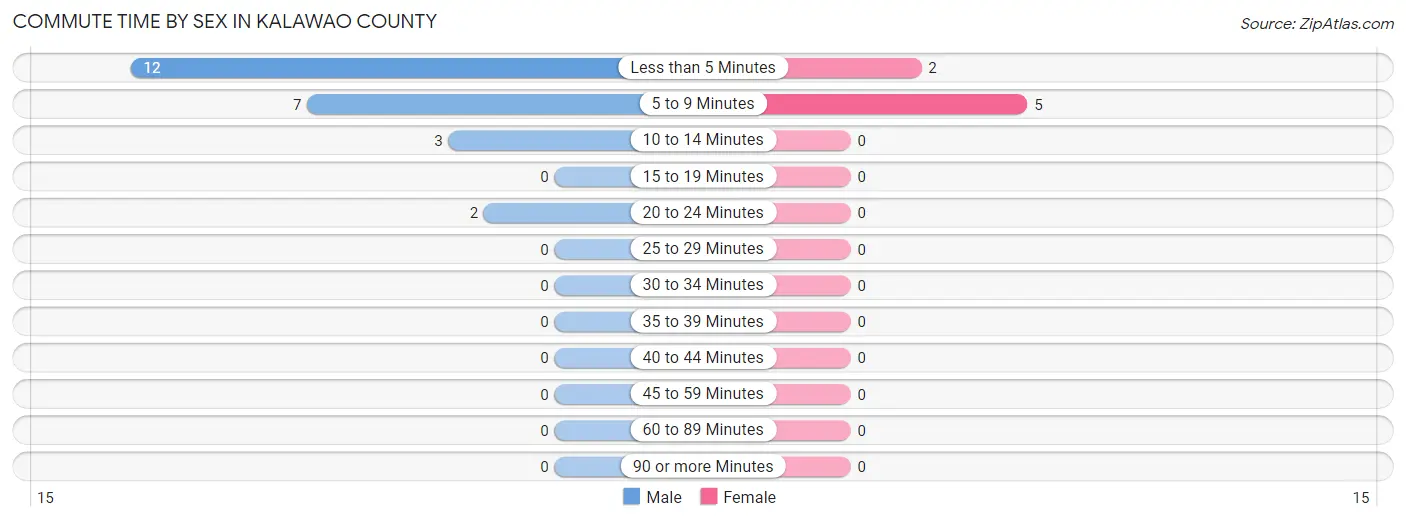
| Commute Time | Male | Female |
| Less than 5 Minutes | 12 (50.0%) | 2 (28.6%) |
| 5 to 9 Minutes | 7 (29.2%) | 5 (71.4%) |
| 10 to 14 Minutes | 3 (12.5%) | 0 (0.0%) |
| 15 to 19 Minutes | 0 (0.0%) | 0 (0.0%) |
| 20 to 24 Minutes | 2 (8.3%) | 0 (0.0%) |
| 25 to 29 Minutes | 0 (0.0%) | 0 (0.0%) |
| 30 to 34 Minutes | 0 (0.0%) | 0 (0.0%) |
| 35 to 39 Minutes | 0 (0.0%) | 0 (0.0%) |
| 40 to 44 Minutes | 0 (0.0%) | 0 (0.0%) |
| 45 to 59 Minutes | 0 (0.0%) | 0 (0.0%) |
| 60 to 89 Minutes | 0 (0.0%) | 0 (0.0%) |
| 90 or more Minutes | 0 (0.0%) | 0 (0.0%) |
Time of Departure to Work by Sex in Kalawao County
The most frequent times of departure to work in Kalawao County are 7:00 AM to 7:29 AM (8, 33.3%) for males and 7:00 AM to 7:29 AM (3, 42.9%) for females.
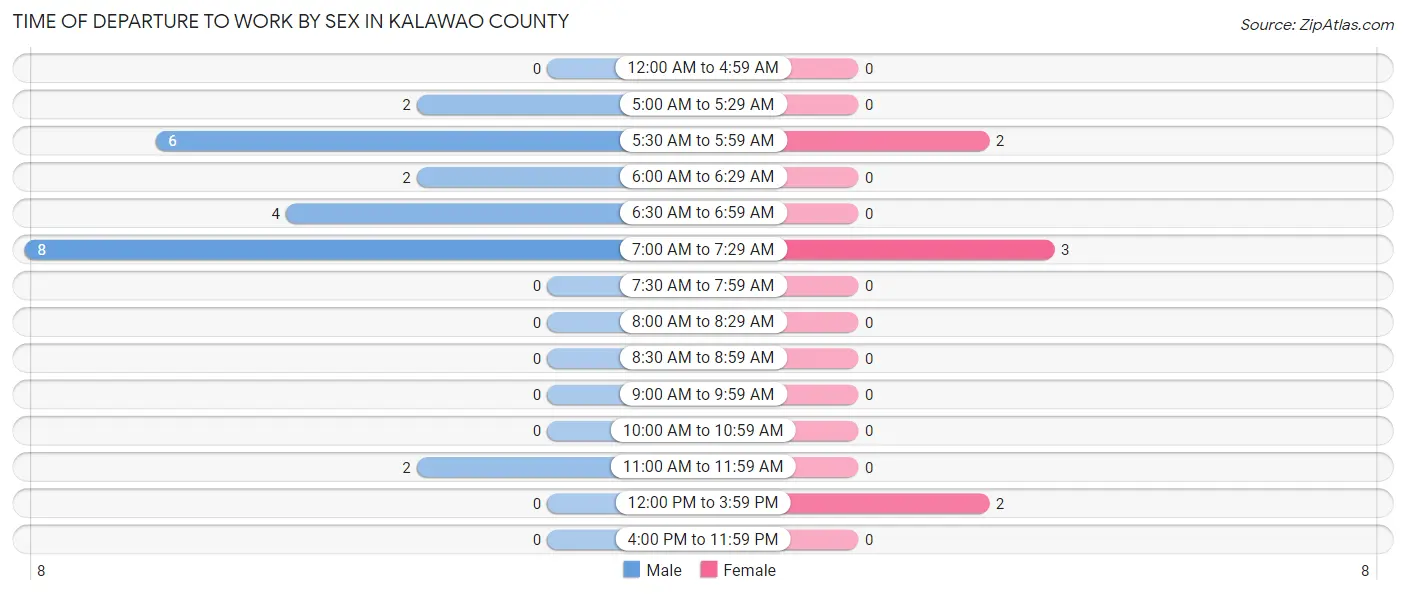
| Time of Departure | Male | Female |
| 12:00 AM to 4:59 AM | 0 (0.0%) | 0 (0.0%) |
| 5:00 AM to 5:29 AM | 2 (8.3%) | 0 (0.0%) |
| 5:30 AM to 5:59 AM | 6 (25.0%) | 2 (28.6%) |
| 6:00 AM to 6:29 AM | 2 (8.3%) | 0 (0.0%) |
| 6:30 AM to 6:59 AM | 4 (16.7%) | 0 (0.0%) |
| 7:00 AM to 7:29 AM | 8 (33.3%) | 3 (42.9%) |
| 7:30 AM to 7:59 AM | 0 (0.0%) | 0 (0.0%) |
| 8:00 AM to 8:29 AM | 0 (0.0%) | 0 (0.0%) |
| 8:30 AM to 8:59 AM | 0 (0.0%) | 0 (0.0%) |
| 9:00 AM to 9:59 AM | 0 (0.0%) | 0 (0.0%) |
| 10:00 AM to 10:59 AM | 0 (0.0%) | 0 (0.0%) |
| 11:00 AM to 11:59 AM | 2 (8.3%) | 0 (0.0%) |
| 12:00 PM to 3:59 PM | 0 (0.0%) | 2 (28.6%) |
| 4:00 PM to 11:59 PM | 0 (0.0%) | 0 (0.0%) |
| Total | 24 (100.0%) | 7 (100.0%) |
Housing Occupancy in Kalawao County
Occupancy by Ownership in Kalawao County
Of the total 32 dwellings in Kalawao County, owner-occupied units account for 0 (0.0%), while renter-occupied units make up 32 (100.0%).
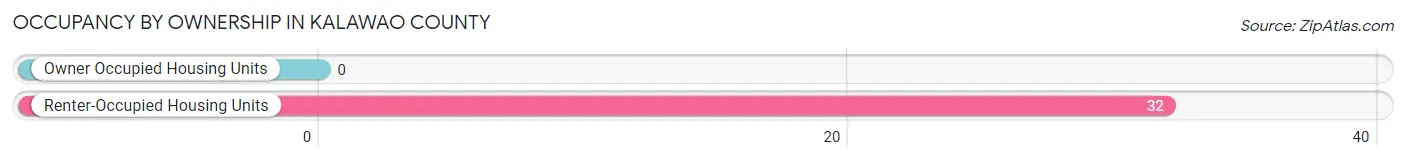
| Occupancy | # Housing Units | % Housing Units |
| Owner Occupied Housing Units | 0 | 0.0% |
| Renter-Occupied Housing Units | 32 | 100.0% |
| Total Occupied Housing Units | 32 | 100.0% |
Occupancy by Household Size in Kalawao County
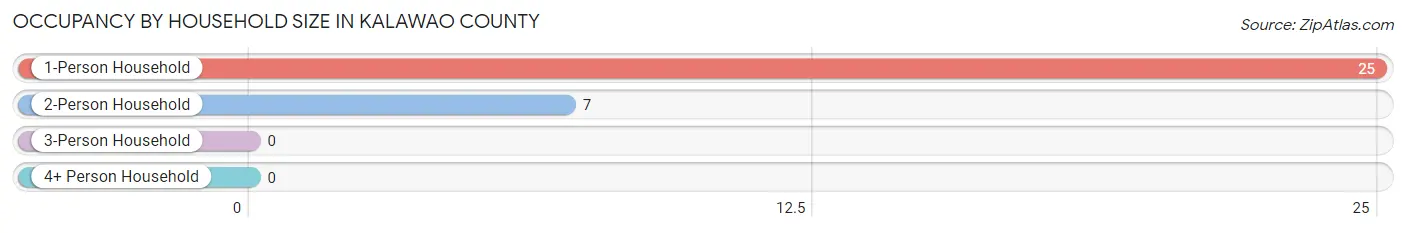
| Household Size | # Housing Units | % Housing Units |
| 1-Person Household | 25 | 78.1% |
| 2-Person Household | 7 | 21.9% |
| 3-Person Household | 0 | 0.0% |
| 4+ Person Household | 0 | 0.0% |
| Total Housing Units | 32 | 100.0% |
Occupancy by Ownership by Household Size in Kalawao County
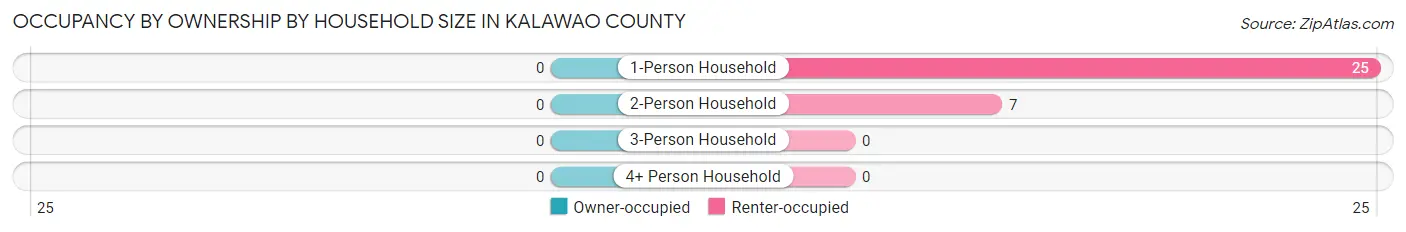
| Household Size | Owner-occupied | Renter-occupied |
| 1-Person Household | 0 (0.0%) | 25 (100.0%) |
| 2-Person Household | 0 (0.0%) | 7 (100.0%) |
| 3-Person Household | 0 (0.0%) | 0 (0.0%) |
| 4+ Person Household | 0 (0.0%) | 0 (0.0%) |
| Total Housing Units | 0 (0.0%) | 32 (100.0%) |
Occupancy by Educational Attainment in Kalawao County
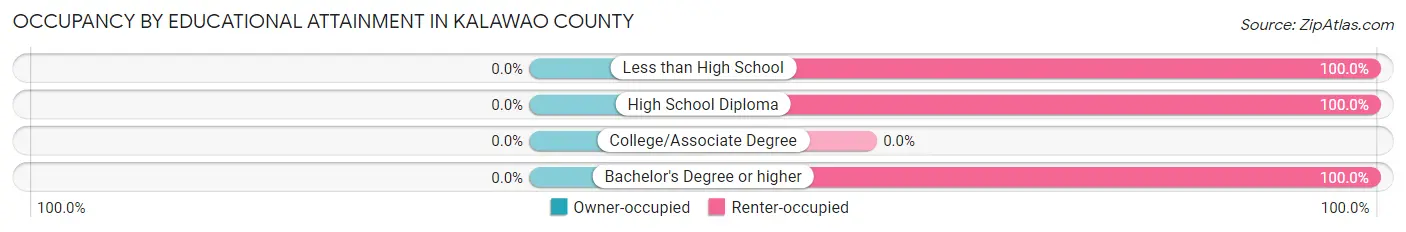
| Household Size | Owner-occupied | Renter-occupied |
| Less than High School | 0 (0.0%) | 3 (100.0%) |
| High School Diploma | 0 (0.0%) | 15 (100.0%) |
| College/Associate Degree | 0 (0.0%) | 0 (0.0%) |
| Bachelor's Degree or higher | 0 (0.0%) | 14 (100.0%) |
Occupancy by Age of Householder in Kalawao County

| Age Bracket | # Households | % Households |
| Under 35 Years | 6 | 18.8% |
| 35 to 44 Years | 11 | 34.4% |
| 45 to 54 Years | 1 | 3.1% |
| 55 to 64 Years | 9 | 28.1% |
| 65 to 74 Years | 2 | 6.2% |
| 75 to 84 Years | 2 | 6.2% |
| 85 Years and Over | 1 | 3.1% |
| Total | 32 | 100.0% |
Housing Finances in Kalawao County
Median Income by Occupancy in Kalawao County
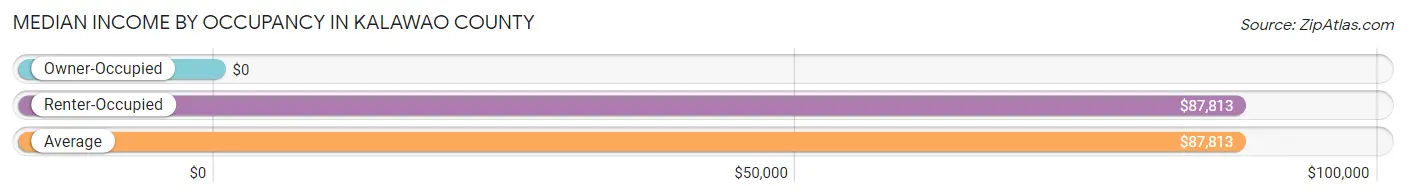
| Occupancy Type | # Households | Median Income |
| Owner-Occupied | 0 (0.0%) | $0 |
| Renter-Occupied | 32 (100.0%) | $87,813 |
| Average | 32 (100.0%) | $87,813 |
Occupancy by Householder Income Bracket in Kalawao County
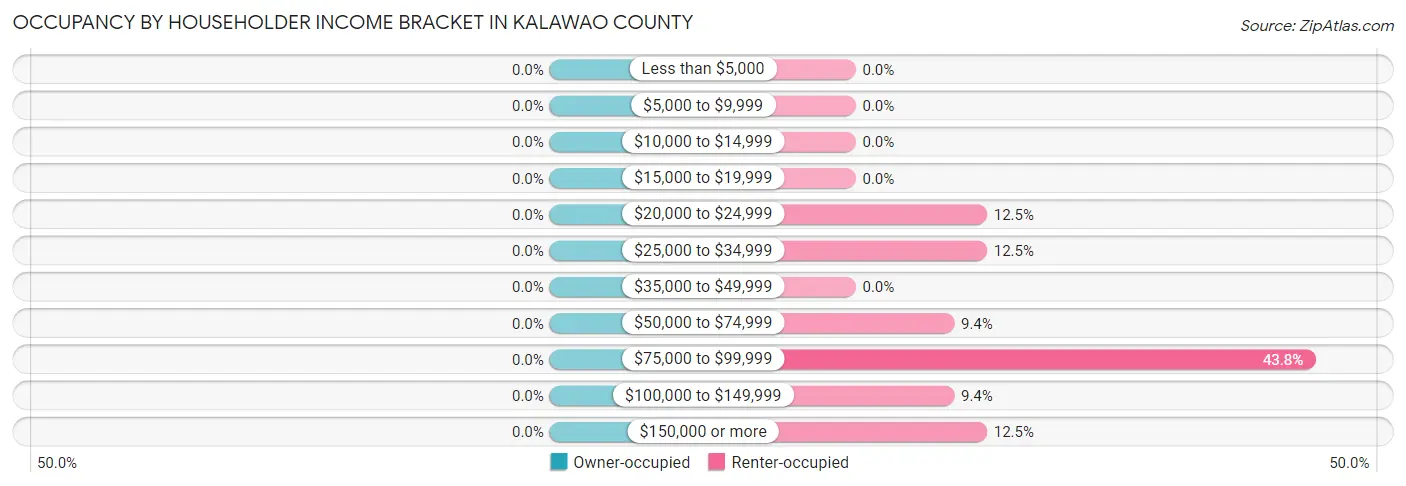
| Income Bracket | Owner-occupied | Renter-occupied |
| Less than $5,000 | 0 (0.0%) | 0 (0.0%) |
| $5,000 to $9,999 | 0 (0.0%) | 0 (0.0%) |
| $10,000 to $14,999 | 0 (0.0%) | 0 (0.0%) |
| $15,000 to $19,999 | 0 (0.0%) | 0 (0.0%) |
| $20,000 to $24,999 | 0 (0.0%) | 4 (12.5%) |
| $25,000 to $34,999 | 0 (0.0%) | 4 (12.5%) |
| $35,000 to $49,999 | 0 (0.0%) | 0 (0.0%) |
| $50,000 to $74,999 | 0 (0.0%) | 3 (9.4%) |
| $75,000 to $99,999 | 0 (0.0%) | 14 (43.8%) |
| $100,000 to $149,999 | 0 (0.0%) | 3 (9.4%) |
| $150,000 or more | 0 (0.0%) | 4 (12.5%) |
| Total | 0 (0.0%) | 32 (100.0%) |
Monthly Housing Cost Tiers in Kalawao County
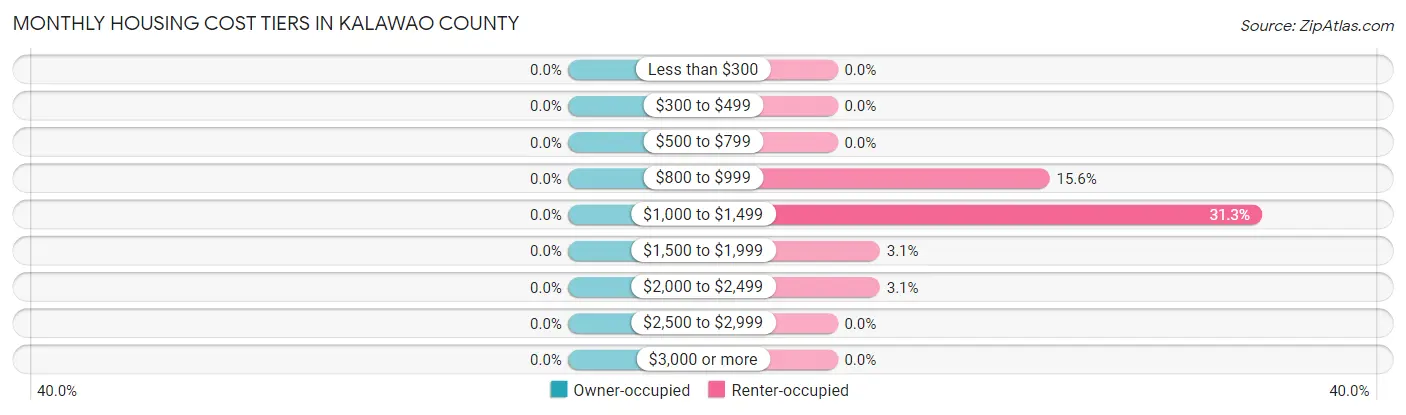
| Monthly Cost | Owner-occupied | Renter-occupied |
| Less than $300 | 0 (0.0%) | 0 (0.0%) |
| $300 to $499 | 0 (0.0%) | 0 (0.0%) |
| $500 to $799 | 0 (0.0%) | 0 (0.0%) |
| $800 to $999 | 0 (0.0%) | 5 (15.6%) |
| $1,000 to $1,499 | 0 (0.0%) | 10 (31.2%) |
| $1,500 to $1,999 | 0 (0.0%) | 1 (3.1%) |
| $2,000 to $2,499 | 0 (0.0%) | 1 (3.1%) |
| $2,500 to $2,999 | 0 (0.0%) | 0 (0.0%) |
| $3,000 or more | 0 (0.0%) | 0 (0.0%) |
| Total | 0 (0.0%) | 32 (100.0%) |
Physical Housing Characteristics in Kalawao County
Housing Structures in Kalawao County
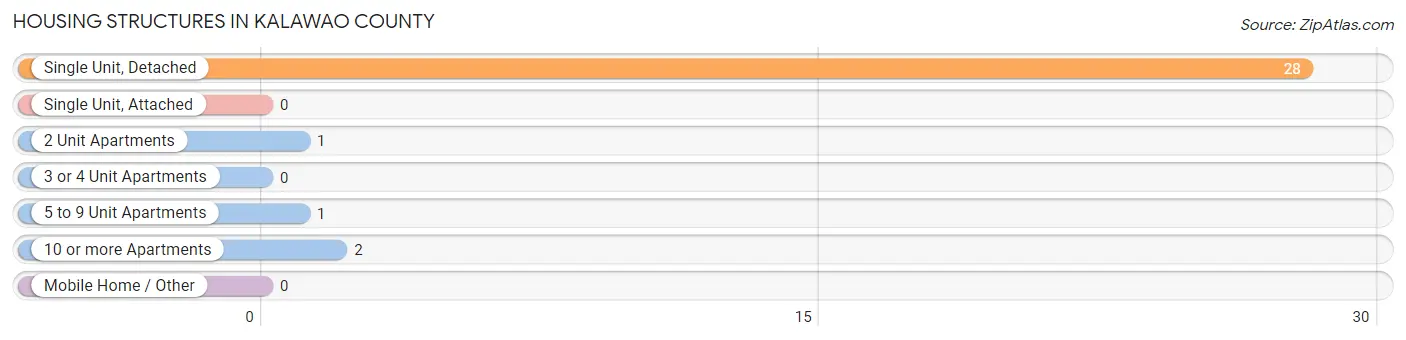
| Structure Type | # Housing Units | % Housing Units |
| Single Unit, Detached | 28 | 87.5% |
| Single Unit, Attached | 0 | 0.0% |
| 2 Unit Apartments | 1 | 3.1% |
| 3 or 4 Unit Apartments | 0 | 0.0% |
| 5 to 9 Unit Apartments | 1 | 3.1% |
| 10 or more Apartments | 2 | 6.2% |
| Mobile Home / Other | 0 | 0.0% |
| Total | 32 | 100.0% |
Housing Structures by Occupancy in Kalawao County
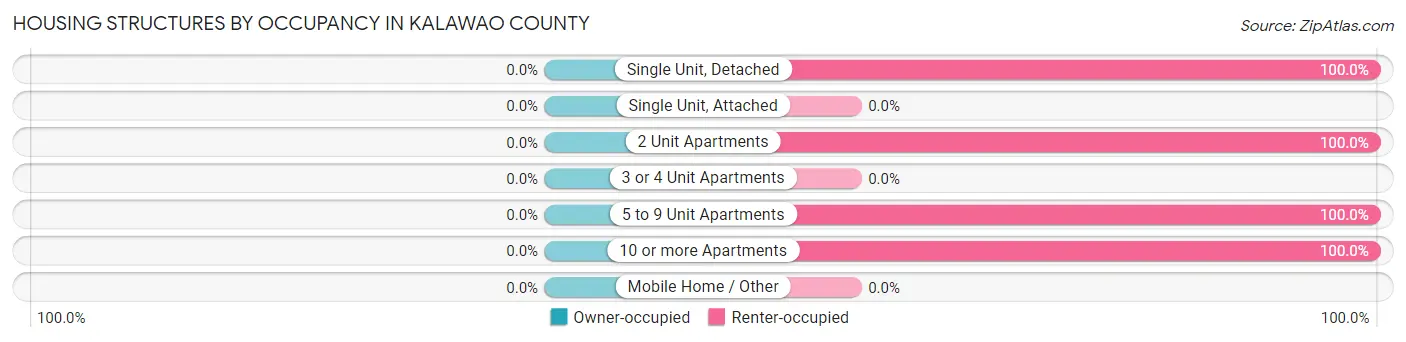
| Structure Type | Owner-occupied | Renter-occupied |
| Single Unit, Detached | 0 (0.0%) | 28 (100.0%) |
| Single Unit, Attached | 0 (0.0%) | 0 (0.0%) |
| 2 Unit Apartments | 0 (0.0%) | 1 (100.0%) |
| 3 or 4 Unit Apartments | 0 (0.0%) | 0 (0.0%) |
| 5 to 9 Unit Apartments | 0 (0.0%) | 1 (100.0%) |
| 10 or more Apartments | 0 (0.0%) | 2 (100.0%) |
| Mobile Home / Other | 0 (0.0%) | 0 (0.0%) |
| Total | 0 (0.0%) | 32 (100.0%) |
Housing Structures by Number of Rooms in Kalawao County
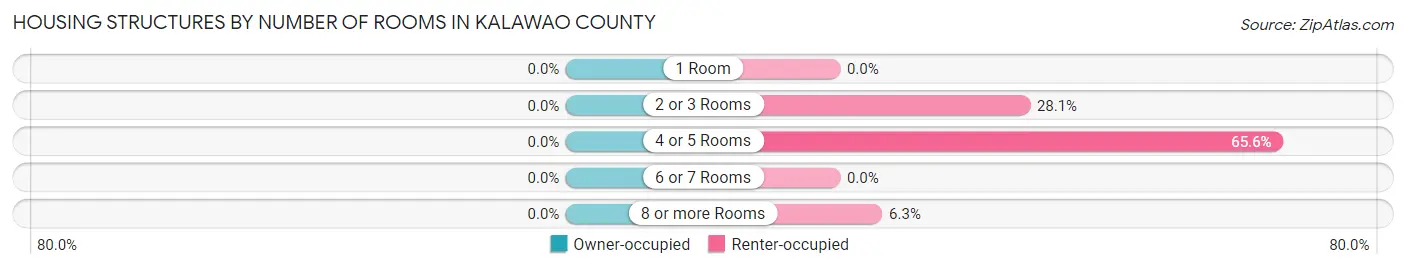
| Number of Rooms | Owner-occupied | Renter-occupied |
| 1 Room | 0 (0.0%) | 0 (0.0%) |
| 2 or 3 Rooms | 0 (0.0%) | 9 (28.1%) |
| 4 or 5 Rooms | 0 (0.0%) | 21 (65.6%) |
| 6 or 7 Rooms | 0 (0.0%) | 0 (0.0%) |
| 8 or more Rooms | 0 (0.0%) | 2 (6.2%) |
| Total | 0 (0.0%) | 32 (100.0%) |
Housing Structure by Heating Type in Kalawao County
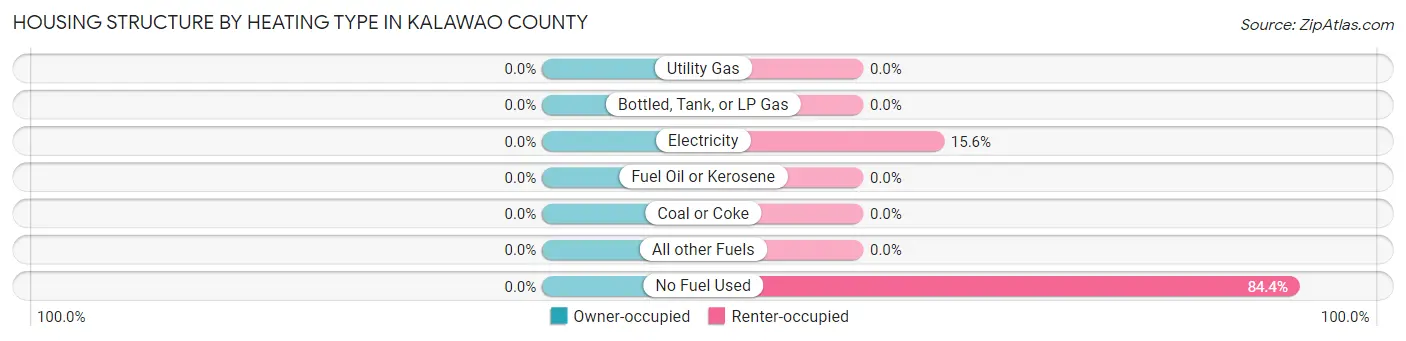
| Heating Type | Owner-occupied | Renter-occupied |
| Utility Gas | 0 (0.0%) | 0 (0.0%) |
| Bottled, Tank, or LP Gas | 0 (0.0%) | 0 (0.0%) |
| Electricity | 0 (0.0%) | 5 (15.6%) |
| Fuel Oil or Kerosene | 0 (0.0%) | 0 (0.0%) |
| Coal or Coke | 0 (0.0%) | 0 (0.0%) |
| All other Fuels | 0 (0.0%) | 0 (0.0%) |
| No Fuel Used | 0 (0.0%) | 27 (84.4%) |
| Total | 0 (0.0%) | 32 (100.0%) |
Household Vehicle Usage in Kalawao County
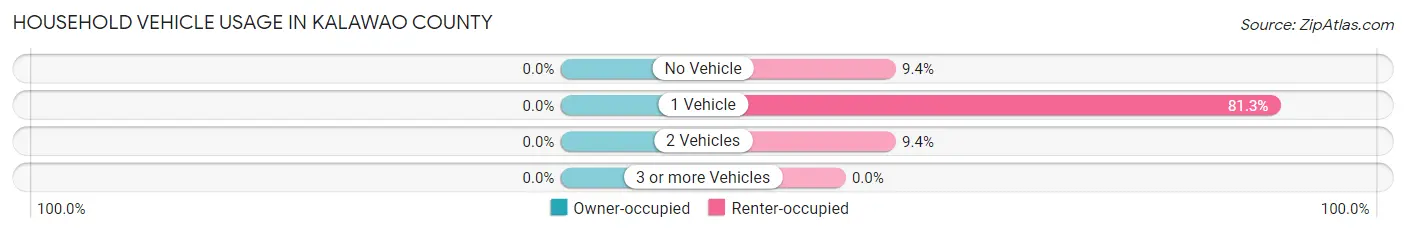
| Vehicles per Household | Owner-occupied | Renter-occupied |
| No Vehicle | 0 (0.0%) | 3 (9.4%) |
| 1 Vehicle | 0 (0.0%) | 26 (81.2%) |
| 2 Vehicles | 0 (0.0%) | 3 (9.4%) |
| 3 or more Vehicles | 0 (0.0%) | 0 (0.0%) |
| Total | 0 (0.0%) | 32 (100.0%) |
Real Estate & Mortgages in Kalawao County
Real Estate and Mortgage Overview in Kalawao County
| Characteristic | Without Mortgage | With Mortgage |
| Housing Units | 0 | 0 |
| Median Property Value | - | - |
| Median Household Income | - | - |
| Monthly Housing Costs | - | - |
| Real Estate Taxes | - | - |
Property Value by Mortgage Status in Kalawao County
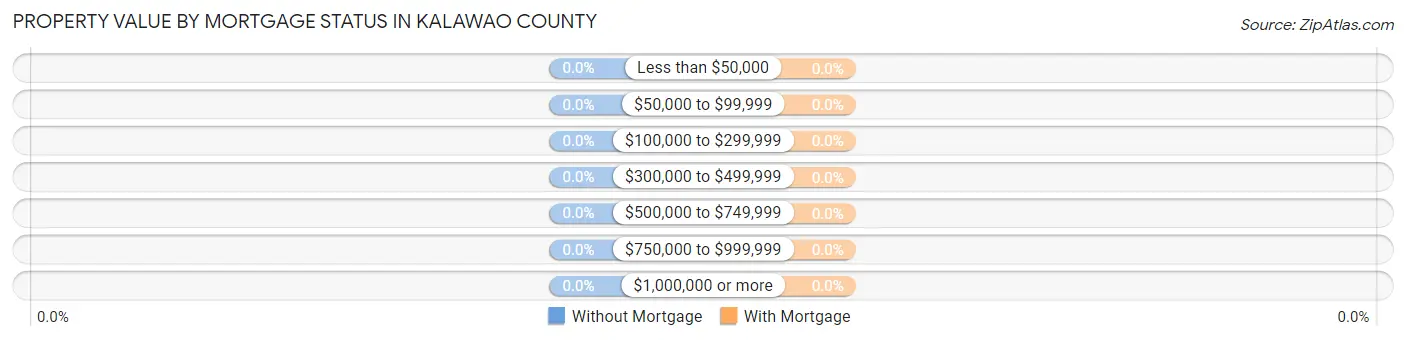
| Property Value | Without Mortgage | With Mortgage |
| Less than $50,000 | 0 (0.0%) | 0 (0.0%) |
| $50,000 to $99,999 | 0 (0.0%) | 0 (0.0%) |
| $100,000 to $299,999 | 0 (0.0%) | 0 (0.0%) |
| $300,000 to $499,999 | 0 (0.0%) | 0 (0.0%) |
| $500,000 to $749,999 | 0 (0.0%) | 0 (0.0%) |
| $750,000 to $999,999 | 0 (0.0%) | 0 (0.0%) |
| $1,000,000 or more | 0 (0.0%) | 0 (0.0%) |
| Total | 0 (0.0%) | 0 (0.0%) |
Household Income by Mortgage Status in Kalawao County
| Household Income | Without Mortgage | With Mortgage |
| Less than $10,000 | 0 (0.0%) | 0 (0.0%) |
| $10,000 to $24,999 | 0 (0.0%) | 0 (0.0%) |
| $25,000 to $34,999 | 0 (0.0%) | 0 (0.0%) |
| $35,000 to $49,999 | 0 (0.0%) | 0 (0.0%) |
| $50,000 to $74,999 | 0 (0.0%) | 0 (0.0%) |
| $75,000 to $99,999 | 0 (0.0%) | 0 (0.0%) |
| $100,000 to $149,999 | 0 (0.0%) | 0 (0.0%) |
| $150,000 or more | 0 (0.0%) | 0 (0.0%) |
| Total | 0 (0.0%) | 0 (0.0%) |
Property Value to Household Income Ratio in Kalawao County
| Value-to-Income Ratio | Without Mortgage | With Mortgage |
| Less than 2.0x | 0 (0.0%) | 0 (0.0%) |
| 2.0x to 2.9x | 0 (0.0%) | 0 (0.0%) |
| 3.0x to 3.9x | 0 (0.0%) | 0 (0.0%) |
| 4.0x or more | 0 (0.0%) | 0 (0.0%) |
| Total | 0 (0.0%) | 0 (0.0%) |
Real Estate Taxes by Mortgage Status in Kalawao County
| Property Taxes | Without Mortgage | With Mortgage |
| Less than $800 | 0 (0.0%) | 0 (0.0%) |
| $800 to $1,499 | 0 (0.0%) | 0 (0.0%) |
| $800 to $1,499 | 0 (0.0%) | 0 (0.0%) |
| Total | 0 (0.0%) | 0 (0.0%) |
Health & Disability in Kalawao County
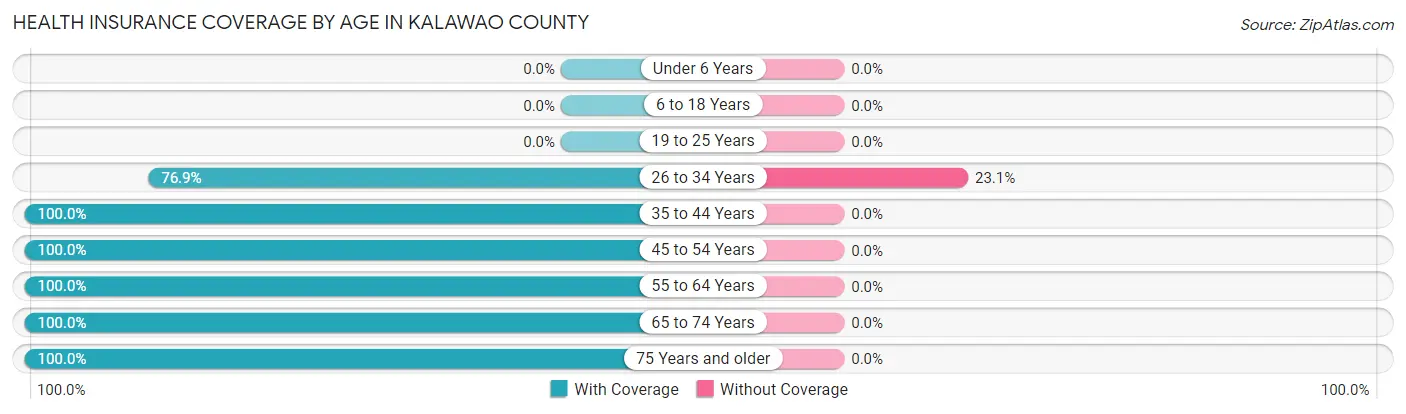
Health Insurance Coverage by Age in Kalawao County
| Age Bracket | With Coverage | Without Coverage |
| Under 6 Years | 0 (0.0%) | 0 (0.0%) |
| 6 to 18 Years | 0 (0.0%) | 0 (0.0%) |
| 19 to 25 Years | 0 (0.0%) | 0 (0.0%) |
| 26 to 34 Years | 10 (76.9%) | 3 (23.1%) |
| 35 to 44 Years | 14 (100.0%) | 0 (0.0%) |
| 45 to 54 Years | 3 (100.0%) | 0 (0.0%) |
| 55 to 64 Years | 9 (100.0%) | 0 (0.0%) |
| 65 to 74 Years | 3 (100.0%) | 0 (0.0%) |
| 75 Years and older | 5 (100.0%) | 0 (0.0%) |
| Total | 44 (93.6%) | 3 (6.4%) |
Health Insurance Coverage by Citizenship Status in Kalawao County
| Citizenship Status | With Coverage | Without Coverage |
| Native Born | 0 (0.0%) | 0 (0.0%) |
| Foreign Born, Citizen | 0 (0.0%) | 0 (0.0%) |
| Foreign Born, not a Citizen | 0 (0.0%) | 0 (0.0%) |
Health Insurance Coverage by Household Income in Kalawao County
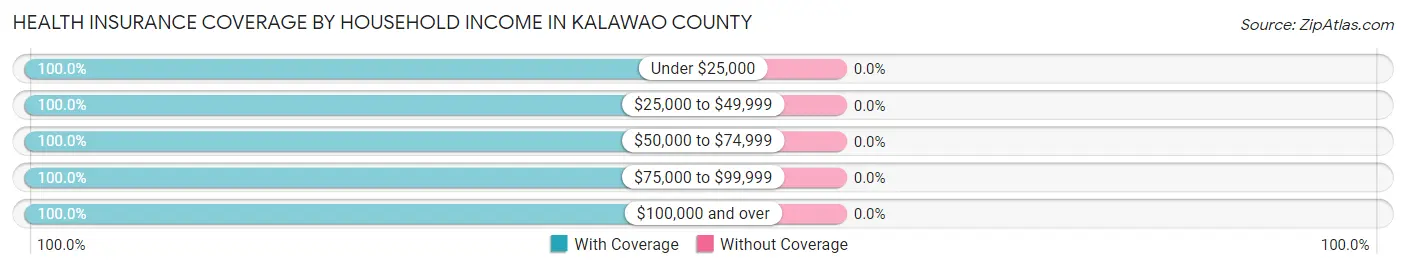
| Household Income | With Coverage | Without Coverage |
| Under $25,000 | 4 (100.0%) | 0 (0.0%) |
| $25,000 to $49,999 | 6 (100.0%) | 0 (0.0%) |
| $50,000 to $74,999 | 3 (100.0%) | 0 (0.0%) |
| $75,000 to $99,999 | 15 (100.0%) | 0 (0.0%) |
| $100,000 and over | 8 (100.0%) | 0 (0.0%) |
Public vs Private Health Insurance Coverage by Age in Kalawao County
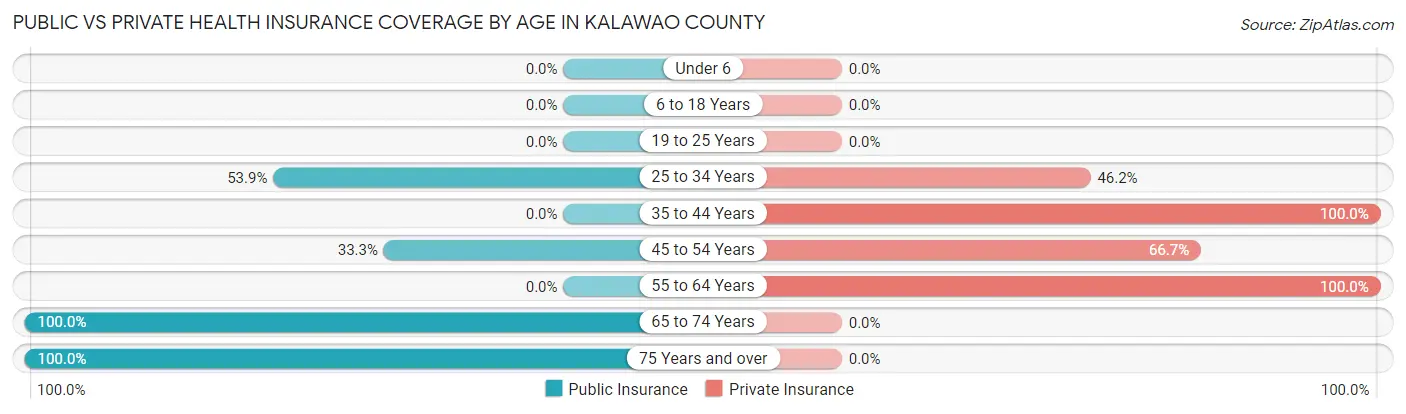
| Age Bracket | Public Insurance | Private Insurance |
| Under 6 | 0 (0.0%) | 0 (0.0%) |
| 6 to 18 Years | 0 (0.0%) | 0 (0.0%) |
| 19 to 25 Years | 0 (0.0%) | 0 (0.0%) |
| 25 to 34 Years | 7 (53.8%) | 6 (46.2%) |
| 35 to 44 Years | 0 (0.0%) | 14 (100.0%) |
| 45 to 54 Years | 1 (33.3%) | 2 (66.7%) |
| 55 to 64 Years | 0 (0.0%) | 9 (100.0%) |
| 65 to 74 Years | 3 (100.0%) | 0 (0.0%) |
| 75 Years and over | 5 (100.0%) | 0 (0.0%) |
| Total | 16 (34.0%) | 31 (66.0%) |
Disability Status by Sex by Age in Kalawao County
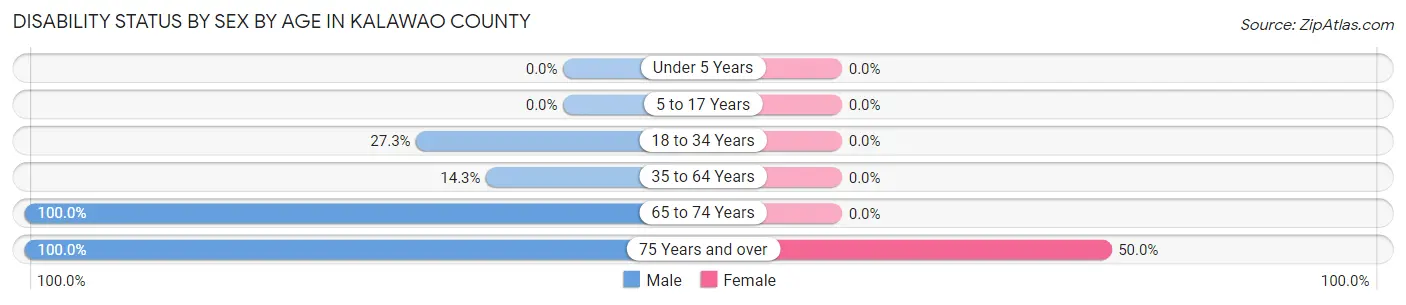
| Age Bracket | Male | Female |
| Under 5 Years | 0 (0.0%) | 0 (0.0%) |
| 5 to 17 Years | 0 (0.0%) | 0 (0.0%) |
| 18 to 34 Years | 3 (27.3%) | 0 (0.0%) |
| 35 to 64 Years | 3 (14.3%) | 0 (0.0%) |
| 65 to 74 Years | 1 (100.0%) | 0 (0.0%) |
| 75 Years and over | 1 (100.0%) | 2 (50.0%) |
Disability Class by Sex by Age in Kalawao County
Disability Class: Hearing Difficulty
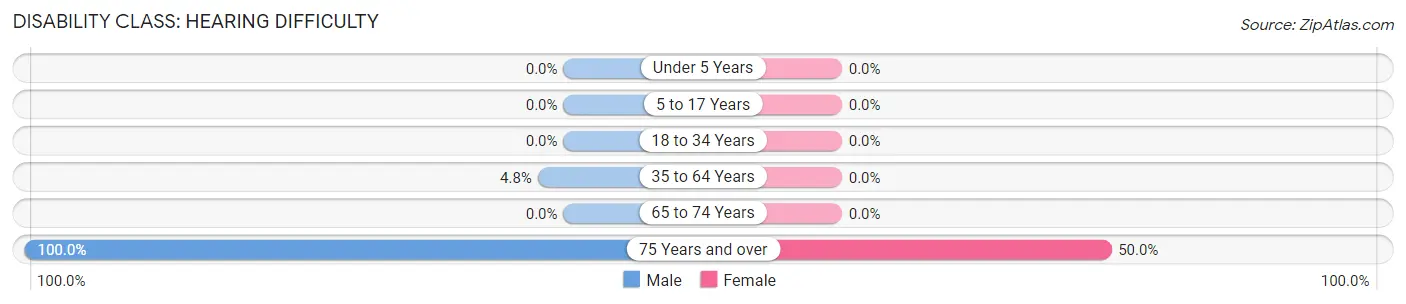
| Age Bracket | Male | Female |
| Under 5 Years | 0 (0.0%) | 0 (0.0%) |
| 5 to 17 Years | 0 (0.0%) | 0 (0.0%) |
| 18 to 34 Years | 0 (0.0%) | 0 (0.0%) |
| 35 to 64 Years | 1 (4.8%) | 0 (0.0%) |
| 65 to 74 Years | 0 (0.0%) | 0 (0.0%) |
| 75 Years and over | 1 (100.0%) | 2 (50.0%) |
Disability Class: Vision Difficulty
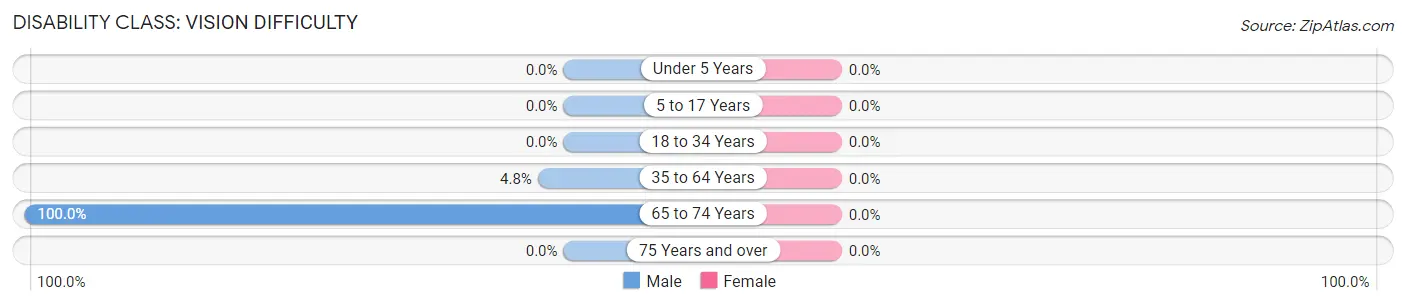
| Age Bracket | Male | Female |
| Under 5 Years | 0 (0.0%) | 0 (0.0%) |
| 5 to 17 Years | 0 (0.0%) | 0 (0.0%) |
| 18 to 34 Years | 0 (0.0%) | 0 (0.0%) |
| 35 to 64 Years | 1 (4.8%) | 0 (0.0%) |
| 65 to 74 Years | 1 (100.0%) | 0 (0.0%) |
| 75 Years and over | 0 (0.0%) | 0 (0.0%) |
Disability Class: Cognitive Difficulty
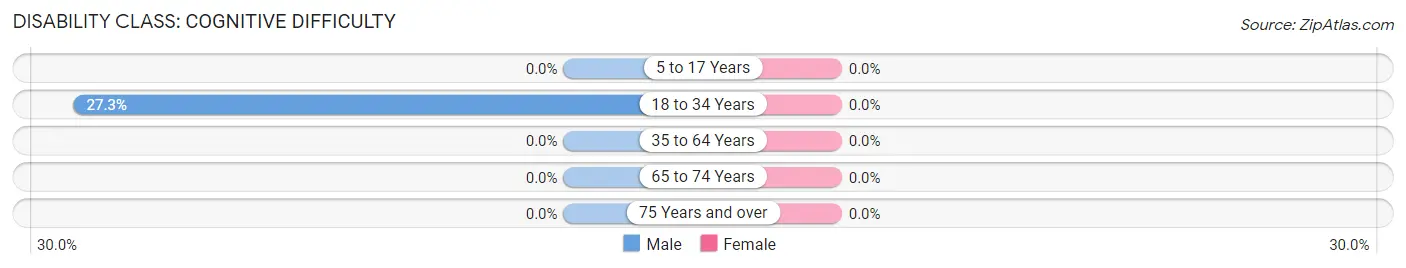
| Age Bracket | Male | Female |
| 5 to 17 Years | 0 (0.0%) | 0 (0.0%) |
| 18 to 34 Years | 3 (27.3%) | 0 (0.0%) |
| 35 to 64 Years | 0 (0.0%) | 0 (0.0%) |
| 65 to 74 Years | 0 (0.0%) | 0 (0.0%) |
| 75 Years and over | 0 (0.0%) | 0 (0.0%) |
Disability Class: Ambulatory Difficulty
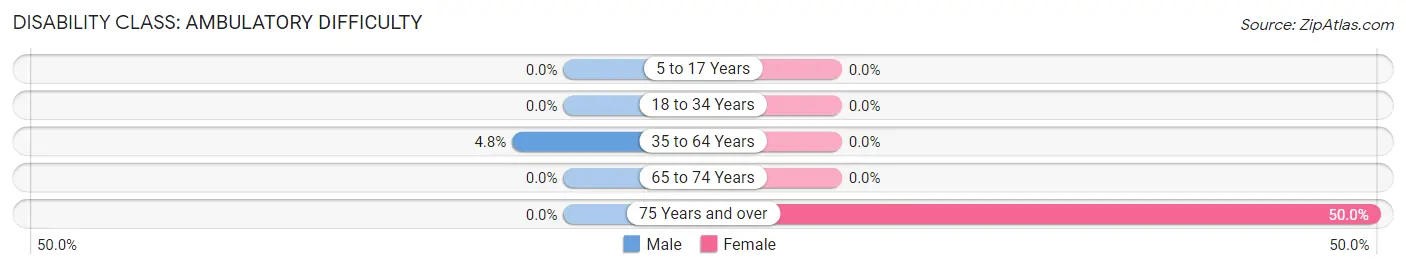
| Age Bracket | Male | Female |
| 5 to 17 Years | 0 (0.0%) | 0 (0.0%) |
| 18 to 34 Years | 0 (0.0%) | 0 (0.0%) |
| 35 to 64 Years | 1 (4.8%) | 0 (0.0%) |
| 65 to 74 Years | 0 (0.0%) | 0 (0.0%) |
| 75 Years and over | 0 (0.0%) | 2 (50.0%) |
Disability Class: Self-Care Difficulty
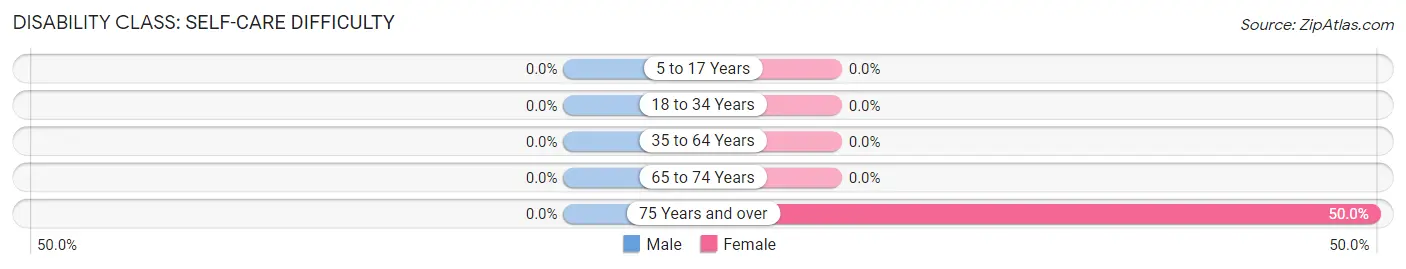
| Age Bracket | Male | Female |
| 5 to 17 Years | 0 (0.0%) | 0 (0.0%) |
| 18 to 34 Years | 0 (0.0%) | 0 (0.0%) |
| 35 to 64 Years | 0 (0.0%) | 0 (0.0%) |
| 65 to 74 Years | 0 (0.0%) | 0 (0.0%) |
| 75 Years and over | 0 (0.0%) | 2 (50.0%) |
Technology Access in Kalawao County
Computing Device Access in Kalawao County
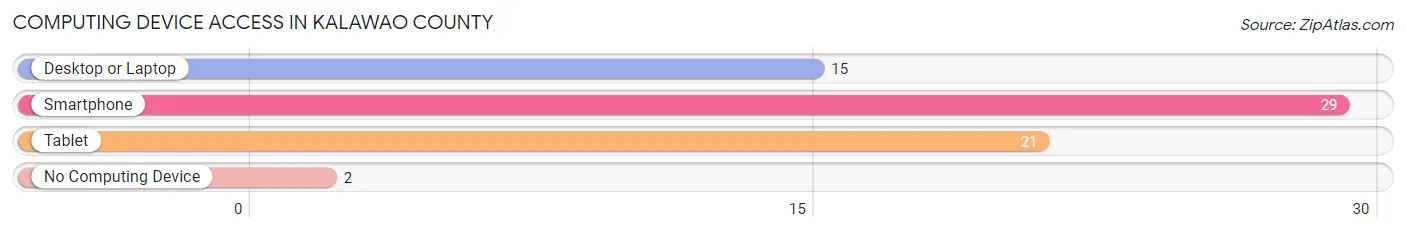
| Device Type | # Households | % Households |
| Desktop or Laptop | 15 | 46.9% |
| Smartphone | 29 | 90.6% |
| Tablet | 21 | 65.6% |
| No Computing Device | 2 | 6.2% |
| Total | 32 | 100.0% |
Internet Access in Kalawao County
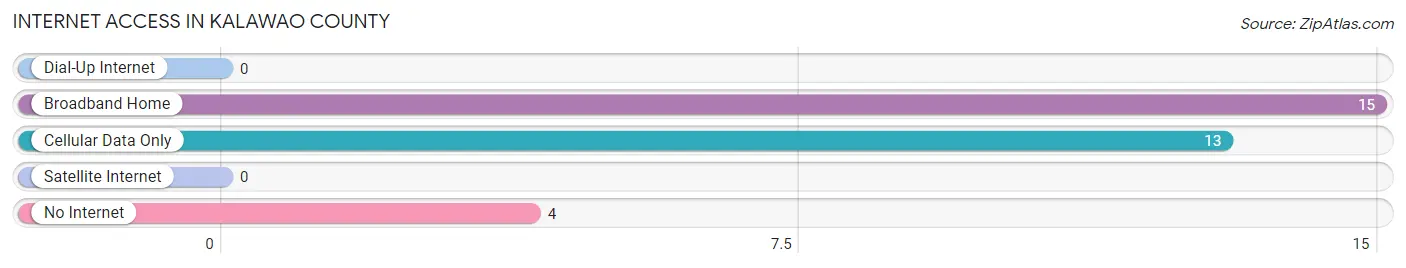
| Internet Type | # Households | % Households |
| Dial-Up Internet | 0 | 0.0% |
| Broadband Home | 15 | 46.9% |
| Cellular Data Only | 13 | 40.6% |
| Satellite Internet | 0 | 0.0% |
| No Internet | 4 | 12.5% |
| Total | 32 | 100.0% |
Kalawao County Summary
Kalawao County is a county located in the U.S. state of Hawaii. It is the smallest county in the United States by population, with only 88 people as of the 2010 census. The county seat is the unincorporated community of Kalaupapa, located on the island of Molokai. Kalawao County is part of the Maui County, HI Metropolitan Statistical Area.
History
Kalawao County was established in 1866 as a leper colony. The county was named after the Hawaiian chief Kalawao, who was the first to be diagnosed with leprosy in the area. The county was originally part of the larger Maui County, but was separated in 1866 to create a separate county for the leper colony.
The county was home to the Kalaupapa Leprosy Settlement, which was established in 1866 and operated until 1969. The settlement was home to over 8,000 people with leprosy, and was the only place in the United States where people with leprosy were forcibly quarantined. The settlement was closed in 1969, and the remaining residents were allowed to stay in the area.
Geography
Kalawao County is located on the island of Molokai, in the Hawaiian Islands. The county is bordered by Maui County to the north and east, and the Pacific Ocean to the south and west. The county covers an area of approximately 26 square miles, and is the smallest county in the United States by population.
The county is divided into two parts: Kalaupapa Peninsula and Kalawao County. The Kalaupapa Peninsula is located on the northern side of the island, and is home to the Kalaupapa Leprosy Settlement. The Kalawao County is located on the southern side of the island, and is home to the unincorporated community of Kalaupapa.
The county is home to several beaches, including Papohaku Beach, Halawa Beach, and Kalaupapa Beach. The county is also home to several parks, including Kalaupapa National Historical Park, Kalaupapa State Park, and Halawa Valley State Park.
Economy
The economy of Kalawao County is largely based on tourism. The county is home to several tourist attractions, including the Kalaupapa Leprosy Settlement, Kalaupapa National Historical Park, and several beaches. The county also has several restaurants, hotels, and other businesses that cater to tourists.
The county also has a small agricultural sector, with some farms producing coffee, macadamia nuts, and other crops.
Demographics
As of the 2010 census, there were 88 people living in Kalawao County. The population was spread out, with 44.3% male and 55.7% female. The median age was 56.7 years.
The racial makeup of the county was 100% Native Hawaiian or Pacific Islander. The median household income was $25,000, and the median family income was $25,000. The per capita income was $14,000.
Conclusion
Kalawao County is a small county located in the U.S. state of Hawaii. It is the smallest county in the United States by population, with only 88 people as of the 2010 census. The county was established in 1866 as a leper colony, and was home to the Kalaupapa Leprosy Settlement until 1969. The economy of the county is largely based on tourism, with some agricultural production. The population of the county is 100% Native Hawaiian or Pacific Islander, with a median age of 56.7 years.
Common Questions
What is Per Capita Income in Kalawao County?
Per Capita income in Kalawao County is $54,390.
What is the Median Household income in Kalawao County?
Median Household Income in Kalawao County is $87,813.
What is Inequality or Gini Index in Kalawao County?
Inequality or Gini Index in Kalawao County is 0.27.
What is the Total Population of Kalawao County?
Total Population of Kalawao County is 50.
What is the Total Male Population of Kalawao County?
Total Male Population of Kalawao County is 34.
What is the Total Female Population of Kalawao County?
Total Female Population of Kalawao County is 16.
What is the Ratio of Males per 100 Females in Kalawao County?
There are 212.50 Males per 100 Females in Kalawao County.
What is the Ratio of Females per 100 Males in Kalawao County?
There are 47.06 Females per 100 Males in Kalawao County.
What is the Median Population Age in Kalawao County?
Median Population Age in Kalawao County is 43.3 Years.
What is the Average Family Size in Kalawao County
Average Family Size in Kalawao County is 1.3 People.
What is the Average Household Size in Kalawao County
Average Household Size in Kalawao County is 1.1 People.
How Large is the Labor Force in Kalawao County?
There are 36 People in the Labor Forcein in Kalawao County.
What is the Percentage of People in the Labor Force in Kalawao County?
72.0% of People are in the Labor Force in Kalawao County.