North Miami Beach, FL Map & Demographics
North Miami Beach Map
North Miami Beach Overview
$28,146
PER CAPITA INCOME
$59,156
AVG FAMILY INCOME
$56,122
AVG HOUSEHOLD INCOME
19.4%
WAGE / INCOME GAP [ % ]
80.6¢/ $1
WAGE / INCOME GAP [ $ ]
$9,578
FAMILY INCOME DEFICIT
0.46
INEQUALITY / GINI INDEX
43,269
TOTAL POPULATION
21,221
MALE POPULATION
22,048
FEMALE POPULATION
96.25
MALES / 100 FEMALES
103.90
FEMALES / 100 MALES
38.1
MEDIAN AGE
3.4
AVG FAMILY SIZE
2.9
AVG HOUSEHOLD SIZE
23,306
LABOR FORCE [ PEOPLE ]
67.8%
PERCENT IN LABOR FORCE
5.3%
UNEMPLOYMENT RATE
North Miami Beach Zip Codes
Income in North Miami Beach
Income Overview in North Miami Beach
Per Capita Income in North Miami Beach is $28,146, while median incomes of families and households are $59,156 and $56,122 respectively.
| Characteristic | Number | Measure |
| Per Capita Income | 43,269 | $28,146 |
| Median Family Income | 10,546 | $59,156 |
| Mean Family Income | 10,546 | $85,436 |
| Median Household Income | 14,899 | $56,122 |
| Mean Household Income | 14,899 | $77,527 |
| Income Deficit | 10,546 | $9,578 |
| Wage / Income Gap (%) | 43,269 | 19.43% |
| Wage / Income Gap ($) | 43,269 | 80.57¢ per $1 |
| Gini / Inequality Index | 43,269 | 0.46 |
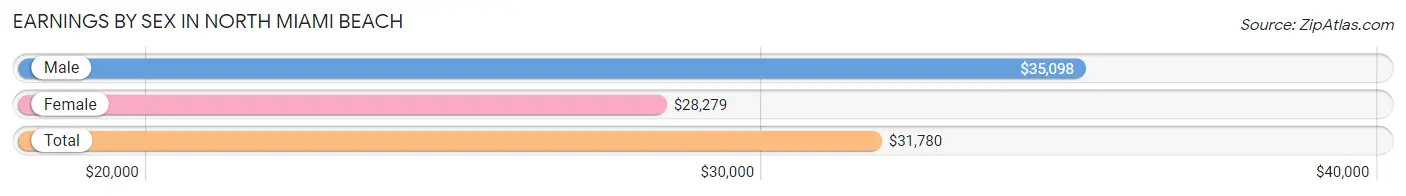
Earnings by Sex in North Miami Beach
Average Earnings in North Miami Beach are $31,780, $35,098 for men and $28,279 for women, a difference of 19.4%.
| Sex | Number | Average Earnings |
| Male | 12,181 (52.5%) | $35,098 |
| Female | 11,029 (47.5%) | $28,279 |
| Total | 23,210 (100.0%) | $31,780 |
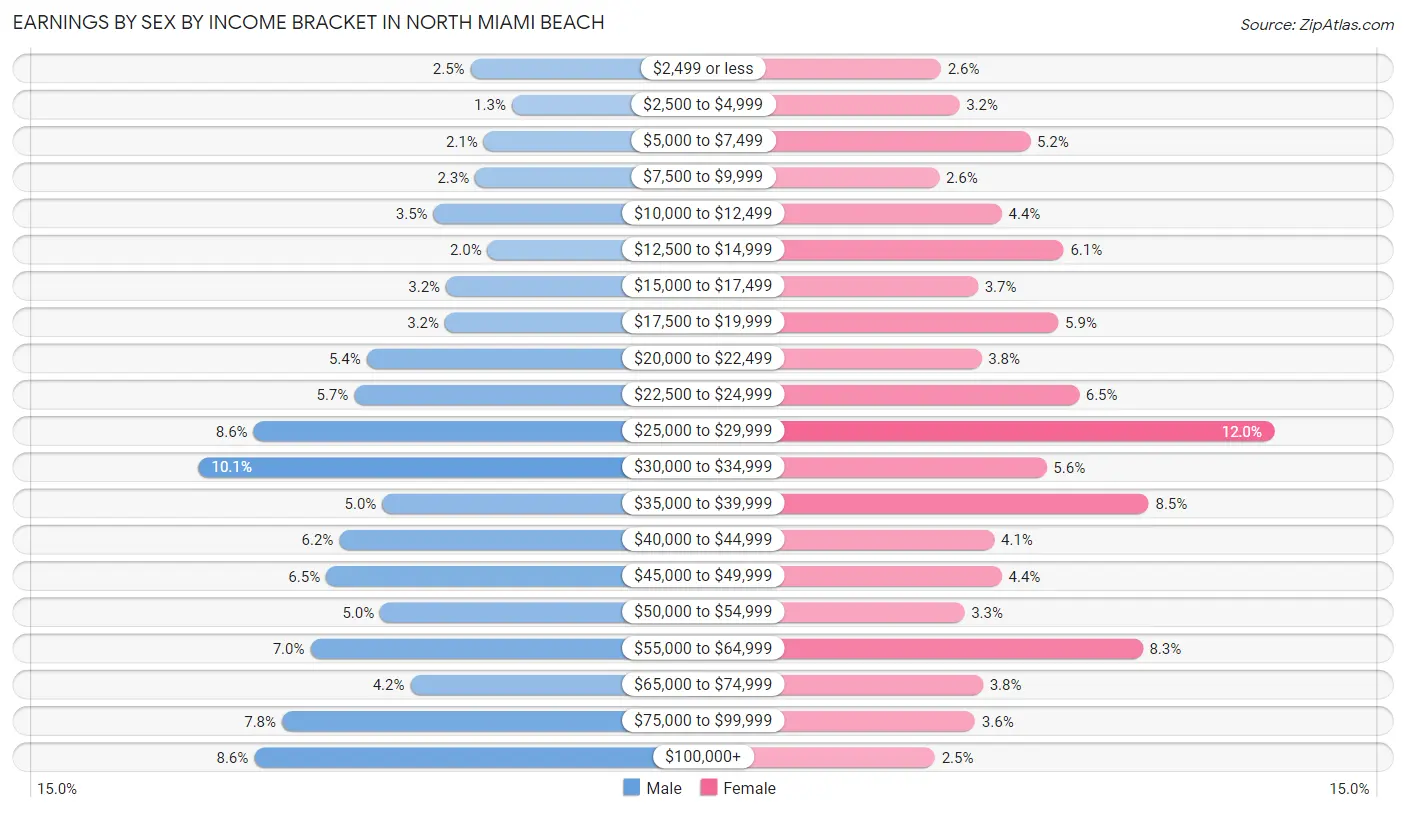
Earnings by Sex by Income Bracket in North Miami Beach
The most common earnings brackets in North Miami Beach are $30,000 to $34,999 for men (1,232 | 10.1%) and $25,000 to $29,999 for women (1,324 | 12.0%).
| Income | Male | Female |
| $2,499 or less | 301 (2.5%) | 291 (2.6%) |
| $2,500 to $4,999 | 160 (1.3%) | 349 (3.2%) |
| $5,000 to $7,499 | 256 (2.1%) | 568 (5.1%) |
| $7,500 to $9,999 | 285 (2.3%) | 286 (2.6%) |
| $10,000 to $12,499 | 427 (3.5%) | 480 (4.3%) |
| $12,500 to $14,999 | 243 (2.0%) | 672 (6.1%) |
| $15,000 to $17,499 | 385 (3.2%) | 406 (3.7%) |
| $17,500 to $19,999 | 388 (3.2%) | 655 (5.9%) |
| $20,000 to $22,499 | 657 (5.4%) | 417 (3.8%) |
| $22,500 to $24,999 | 699 (5.7%) | 719 (6.5%) |
| $25,000 to $29,999 | 1,044 (8.6%) | 1,324 (12.0%) |
| $30,000 to $34,999 | 1,232 (10.1%) | 619 (5.6%) |
| $35,000 to $39,999 | 603 (5.0%) | 935 (8.5%) |
| $40,000 to $44,999 | 750 (6.2%) | 457 (4.1%) |
| $45,000 to $49,999 | 796 (6.5%) | 480 (4.3%) |
| $50,000 to $54,999 | 610 (5.0%) | 364 (3.3%) |
| $55,000 to $64,999 | 849 (7.0%) | 917 (8.3%) |
| $65,000 to $74,999 | 507 (4.2%) | 421 (3.8%) |
| $75,000 to $99,999 | 947 (7.8%) | 397 (3.6%) |
| $100,000+ | 1,042 (8.6%) | 272 (2.5%) |
| Total | 12,181 (100.0%) | 11,029 (100.0%) |
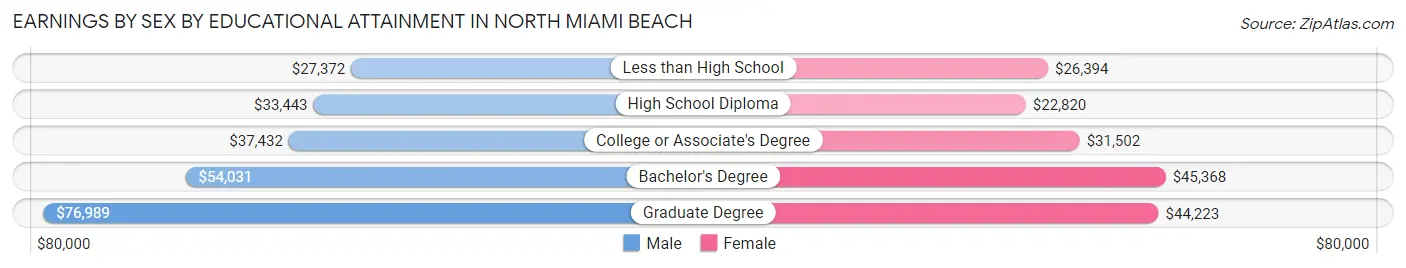
Earnings by Sex by Educational Attainment in North Miami Beach
Average earnings in North Miami Beach are $37,228 for men and $29,297 for women, a difference of 21.3%. Men with an educational attainment of graduate degree enjoy the highest average annual earnings of $76,989, while those with less than high school education earn the least with $27,372. Women with an educational attainment of bachelor's degree earn the most with the average annual earnings of $45,368, while those with high school diploma education have the smallest earnings of $22,820.
| Educational Attainment | Male Income | Female Income |
| Less than High School | $27,372 | $26,394 |
| High School Diploma | $33,443 | $22,820 |
| College or Associate's Degree | $37,432 | $31,502 |
| Bachelor's Degree | $54,031 | $45,368 |
| Graduate Degree | $76,989 | $44,223 |
| Total | $37,228 | $29,297 |
Family Income in North Miami Beach
Family Income Brackets in North Miami Beach
According to the North Miami Beach family income data, there are 2,795 families falling into the $50,000 to $74,999 income range, which is the most common income bracket and makes up 26.5% of all families. Conversely, the less than $10,000 income bracket is the least frequent group with only 316 families (3.0%) belonging to this category.
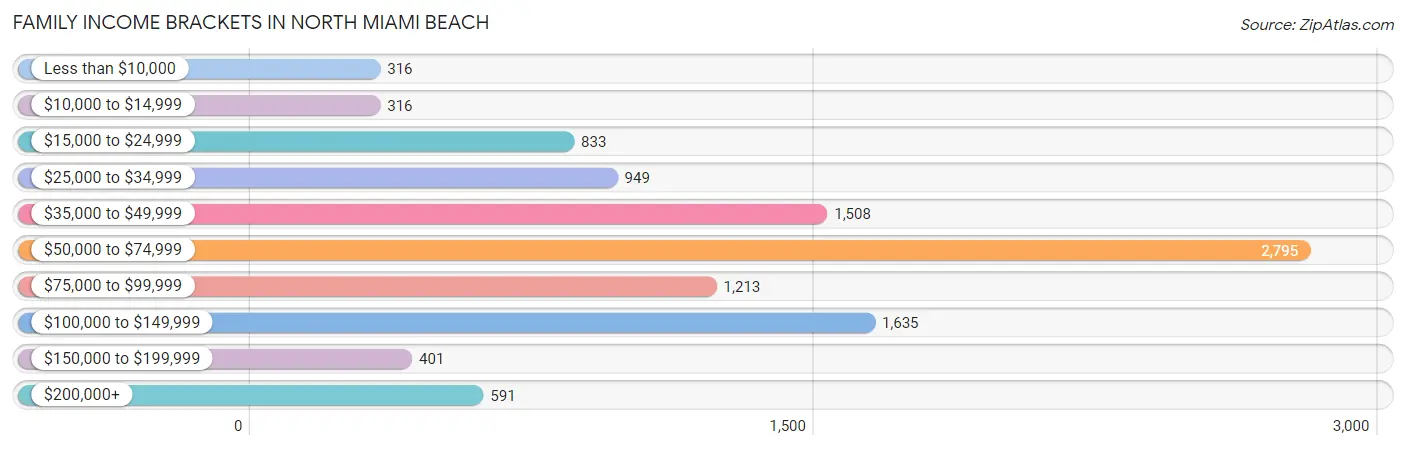
| Income Bracket | # Families | % Families |
| Less than $10,000 | 316 | 3.0% |
| $10,000 to $14,999 | 316 | 3.0% |
| $15,000 to $24,999 | 833 | 7.9% |
| $25,000 to $34,999 | 949 | 9.0% |
| $35,000 to $49,999 | 1,508 | 14.3% |
| $50,000 to $74,999 | 2,795 | 26.5% |
| $75,000 to $99,999 | 1,213 | 11.5% |
| $100,000 to $149,999 | 1,635 | 15.5% |
| $150,000 to $199,999 | 401 | 3.8% |
| $200,000+ | 591 | 5.6% |
Family Income by Famaliy Size in North Miami Beach
7+ person families (232 | 2.2%) account for the highest median family income in North Miami Beach with $114,265 per family, while 2-person families (4,729 | 44.8%) have the highest median income of $26,536 per family member.
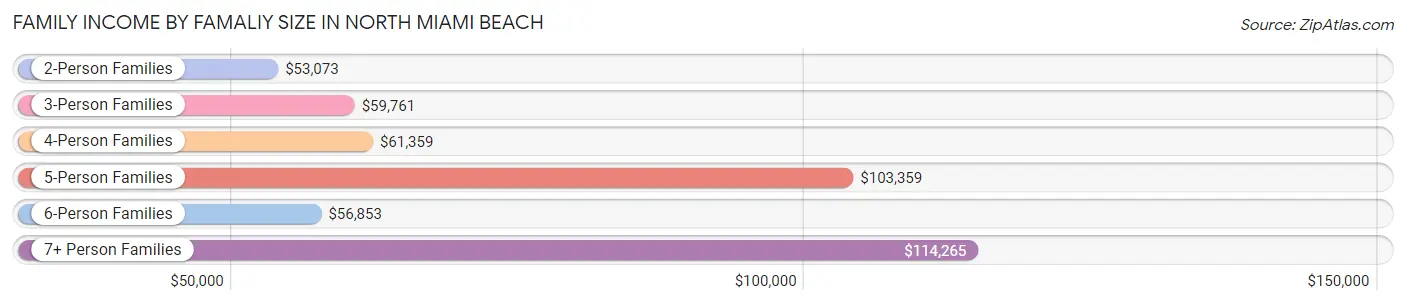
| Income Bracket | # Families | Median Income |
| 2-Person Families | 4,729 (44.8%) | $53,073 |
| 3-Person Families | 2,181 (20.7%) | $59,761 |
| 4-Person Families | 2,118 (20.1%) | $61,359 |
| 5-Person Families | 707 (6.7%) | $103,359 |
| 6-Person Families | 579 (5.5%) | $56,853 |
| 7+ Person Families | 232 (2.2%) | $114,265 |
| Total | 10,546 (100.0%) | $59,156 |
Family Income by Number of Earners in North Miami Beach
The median family income in North Miami Beach is $59,156, with families comprising 3+ earners (1,388) having the highest median family income of $113,953, while families with no earners (802) have the lowest median family income of $21,304, accounting for 13.2% and 7.6% of families, respectively.
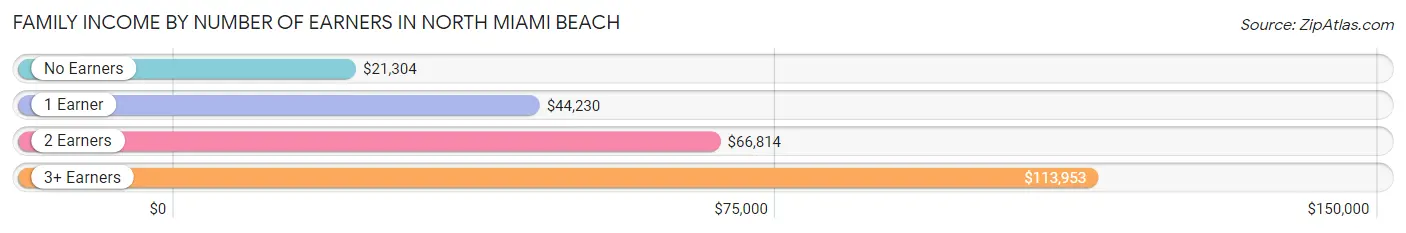
| Number of Earners | # Families | Median Income |
| No Earners | 802 (7.6%) | $21,304 |
| 1 Earner | 3,805 (36.1%) | $44,230 |
| 2 Earners | 4,551 (43.1%) | $66,814 |
| 3+ Earners | 1,388 (13.2%) | $113,953 |
| Total | 10,546 (100.0%) | $59,156 |
Household Income in North Miami Beach
Household Income Brackets in North Miami Beach
With 3,561 households falling in the category, the $50,000 to $74,999 income range is the most frequent in North Miami Beach, accounting for 23.9% of all households. In contrast, only 551 households (3.7%) fall into the $150,000 to $199,999 income bracket, making it the least populous group.
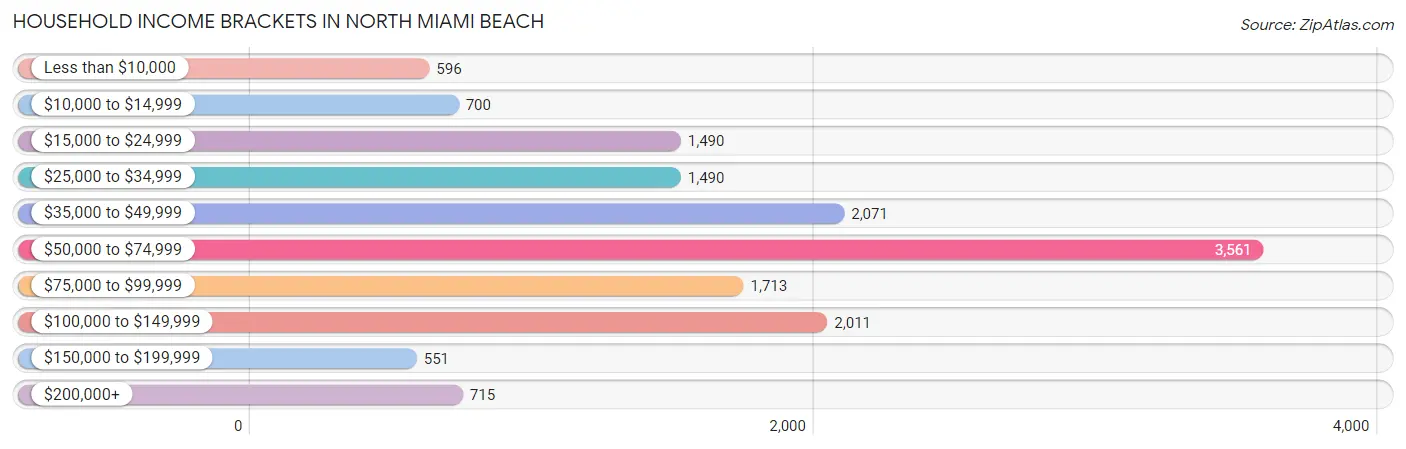
| Income Bracket | # Households | % Households |
| Less than $10,000 | 596 | 4.0% |
| $10,000 to $14,999 | 700 | 4.7% |
| $15,000 to $24,999 | 1,490 | 10.0% |
| $25,000 to $34,999 | 1,490 | 10.0% |
| $35,000 to $49,999 | 2,071 | 13.9% |
| $50,000 to $74,999 | 3,561 | 23.9% |
| $75,000 to $99,999 | 1,713 | 11.5% |
| $100,000 to $149,999 | 2,011 | 13.5% |
| $150,000 to $199,999 | 551 | 3.7% |
| $200,000+ | 715 | 4.8% |
Household Income by Householder Age in North Miami Beach
The median household income in North Miami Beach is $56,122, with the highest median household income of $63,219 found in the 45 to 64 years age bracket for the primary householder. A total of 6,253 households (42.0%) fall into this category. Meanwhile, the 65+ years age bracket for the primary householder has the lowest median household income of $37,165, with 3,379 households (22.7%) in this group.
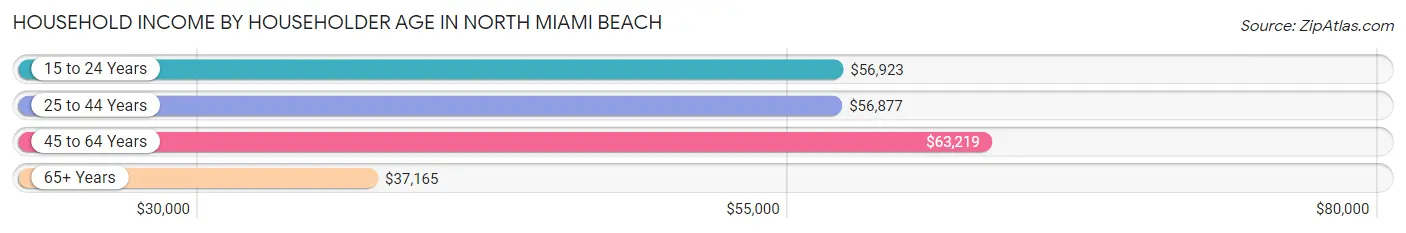
| Income Bracket | # Households | Median Income |
| 15 to 24 Years | 272 (1.8%) | $56,923 |
| 25 to 44 Years | 4,995 (33.5%) | $56,877 |
| 45 to 64 Years | 6,253 (42.0%) | $63,219 |
| 65+ Years | 3,379 (22.7%) | $37,165 |
| Total | 14,899 (100.0%) | $56,122 |
Poverty in North Miami Beach
Income Below Poverty by Sex and Age in North Miami Beach
With 13.9% poverty level for males and 13.2% for females among the residents of North Miami Beach, 15 year old males and 5 year old females are the most vulnerable to poverty, with 151 males (39.4%) and 76 females (22.0%) in their respective age groups living below the poverty level.
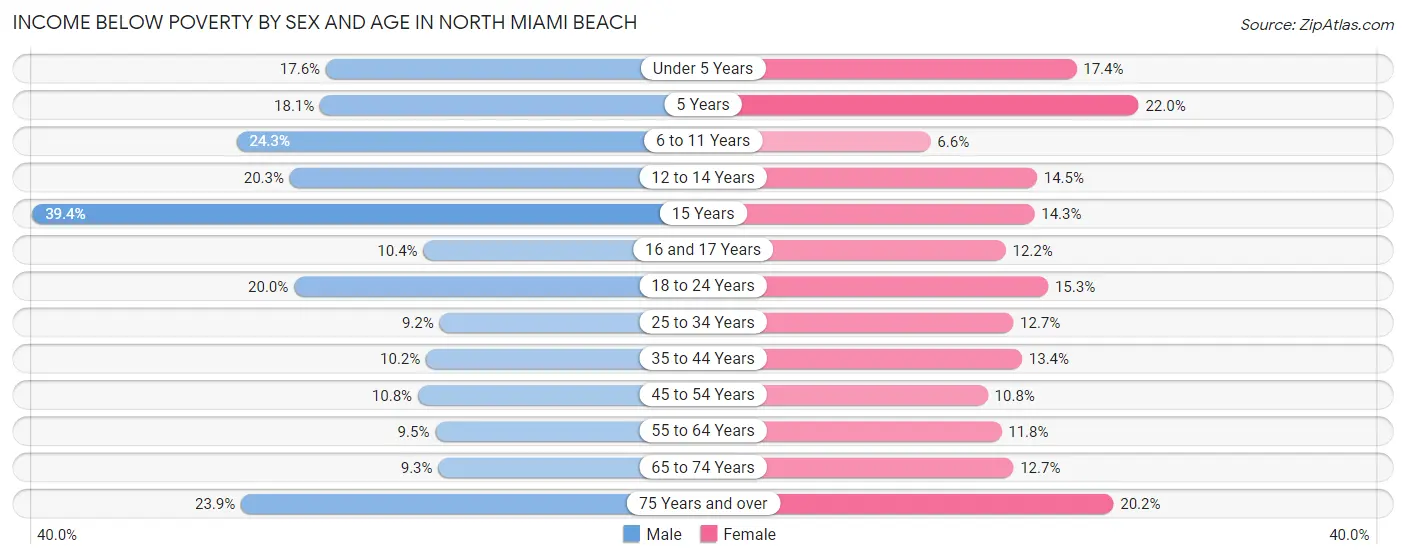
| Age Bracket | Male | Female |
| Under 5 Years | 232 (17.6%) | 250 (17.4%) |
| 5 Years | 39 (18.1%) | 76 (22.0%) |
| 6 to 11 Years | 434 (24.3%) | 117 (6.6%) |
| 12 to 14 Years | 104 (20.3%) | 98 (14.5%) |
| 15 Years | 151 (39.4%) | 40 (14.3%) |
| 16 and 17 Years | 80 (10.4%) | 62 (12.2%) |
| 18 to 24 Years | 340 (20.0%) | 263 (15.3%) |
| 25 to 34 Years | 301 (9.2%) | 409 (12.7%) |
| 35 to 44 Years | 298 (10.2%) | 374 (13.4%) |
| 45 to 54 Years | 320 (10.8%) | 365 (10.8%) |
| 55 to 64 Years | 239 (9.5%) | 279 (11.8%) |
| 65 to 74 Years | 165 (9.3%) | 226 (12.7%) |
| 75 Years and over | 212 (23.9%) | 320 (20.2%) |
| Total | 2,915 (13.9%) | 2,879 (13.2%) |
Income Above Poverty by Sex and Age in North Miami Beach
According to the poverty statistics in North Miami Beach, males aged 25 to 34 years and females aged 6 to 11 years are the age groups that are most secure financially, with 90.8% of males and 93.4% of females in these age groups living above the poverty line.
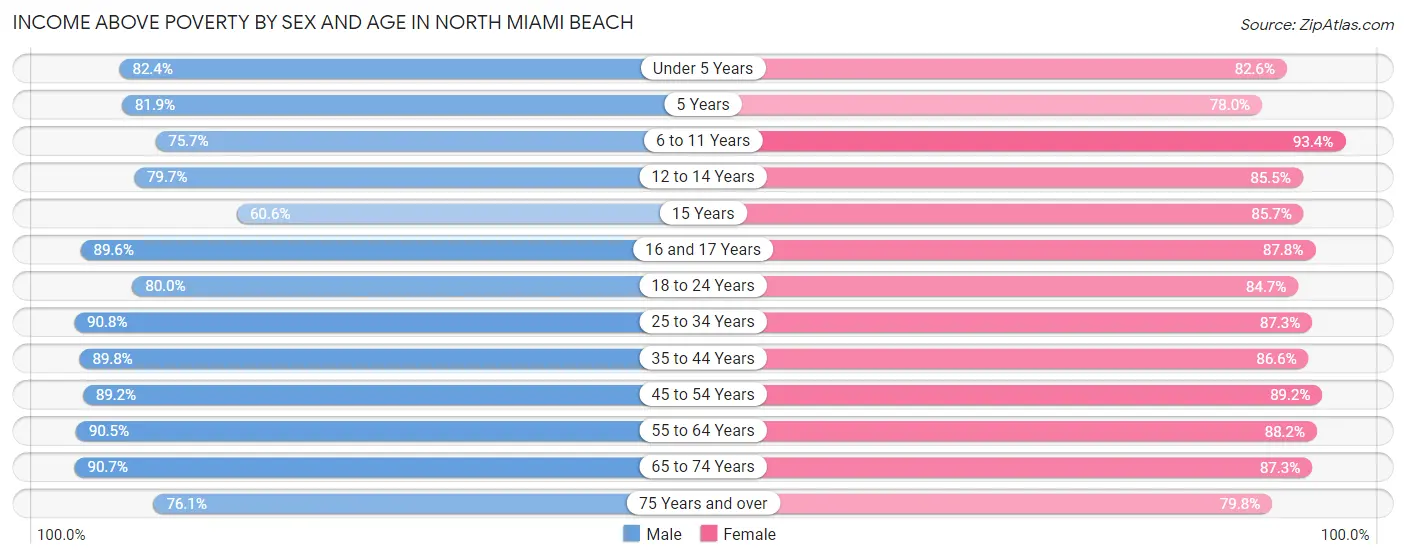
| Age Bracket | Male | Female |
| Under 5 Years | 1,084 (82.4%) | 1,186 (82.6%) |
| 5 Years | 177 (81.9%) | 269 (78.0%) |
| 6 to 11 Years | 1,355 (75.7%) | 1,660 (93.4%) |
| 12 to 14 Years | 408 (79.7%) | 579 (85.5%) |
| 15 Years | 232 (60.6%) | 240 (85.7%) |
| 16 and 17 Years | 690 (89.6%) | 448 (87.8%) |
| 18 to 24 Years | 1,361 (80.0%) | 1,455 (84.7%) |
| 25 to 34 Years | 2,973 (90.8%) | 2,806 (87.3%) |
| 35 to 44 Years | 2,626 (89.8%) | 2,424 (86.6%) |
| 45 to 54 Years | 2,643 (89.2%) | 3,005 (89.2%) |
| 55 to 64 Years | 2,274 (90.5%) | 2,077 (88.2%) |
| 65 to 74 Years | 1,613 (90.7%) | 1,550 (87.3%) |
| 75 Years and over | 674 (76.1%) | 1,267 (79.8%) |
| Total | 18,110 (86.1%) | 18,966 (86.8%) |
Income Below Poverty Among Married-Couple Families in North Miami Beach
The poverty statistics for married-couple families in North Miami Beach show that 7.4% or 461 of the total 6,266 families live below the poverty line. Families with 5 or more children have the highest poverty rate of 40.2%, comprising of 35 families. On the other hand, families with no children have the lowest poverty rate of 5.6%, which includes 195 families.
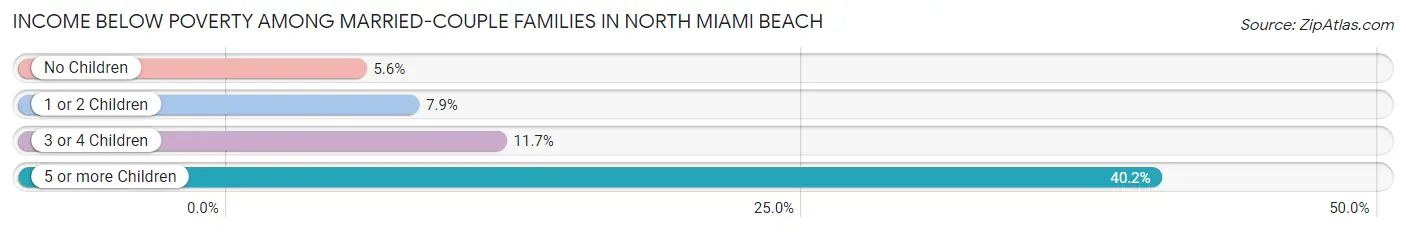
| Children | Above Poverty | Below Poverty |
| No Children | 3,292 (94.4%) | 195 (5.6%) |
| 1 or 2 Children | 2,023 (92.1%) | 173 (7.9%) |
| 3 or 4 Children | 438 (88.3%) | 58 (11.7%) |
| 5 or more Children | 52 (59.8%) | 35 (40.2%) |
| Total | 5,805 (92.6%) | 461 (7.4%) |
Income Below Poverty Among Single-Parent Households in North Miami Beach
According to the poverty data in North Miami Beach, 16.0% or 215 single-father households and 17.7% or 521 single-mother households are living below the poverty line. Among single-father households, those with 1 or 2 children have the highest poverty rate, with 149 households (20.6%) experiencing poverty. Likewise, among single-mother households, those with 3 or 4 children have the highest poverty rate, with 95 households (64.6%) falling below the poverty line.
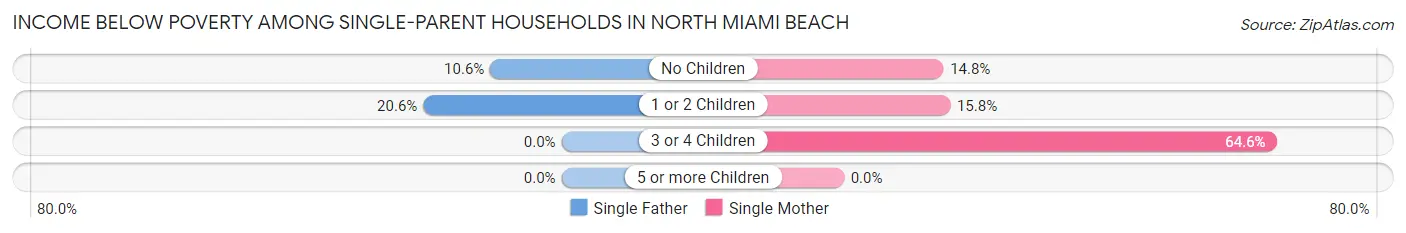
| Children | Single Father | Single Mother |
| No Children | 66 (10.6%) | 232 (14.8%) |
| 1 or 2 Children | 149 (20.6%) | 194 (15.8%) |
| 3 or 4 Children | 0 (0.0%) | 95 (64.6%) |
| 5 or more Children | 0 (0.0%) | 0 (0.0%) |
| Total | 215 (16.0%) | 521 (17.7%) |
Income Below Poverty Among Married-Couple vs Single-Parent Households in North Miami Beach
The poverty data for North Miami Beach shows that 461 of the married-couple family households (7.4%) and 736 of the single-parent households (17.2%) are living below the poverty level. Within the married-couple family households, those with 5 or more children have the highest poverty rate, with 35 households (40.2%) falling below the poverty line. Among the single-parent households, those with 3 or 4 children have the highest poverty rate, with 95 household (64.6%) living below poverty.
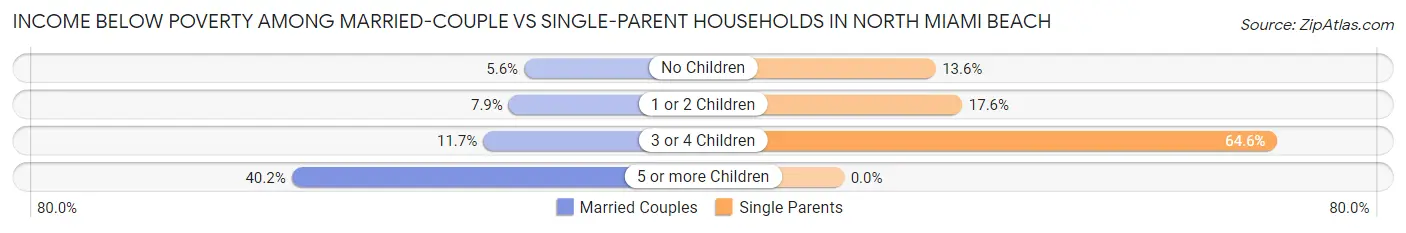
| Children | Married-Couple Families | Single-Parent Households |
| No Children | 195 (5.6%) | 298 (13.6%) |
| 1 or 2 Children | 173 (7.9%) | 343 (17.6%) |
| 3 or 4 Children | 58 (11.7%) | 95 (64.6%) |
| 5 or more Children | 35 (40.2%) | 0 (0.0%) |
| Total | 461 (7.4%) | 736 (17.2%) |
Race in North Miami Beach
The most populous races in North Miami Beach are Hispanic or Latino (17,550 | 40.6%), Black / African American (16,833 | 38.9%), and White / Caucasian (15,725 | 36.3%).
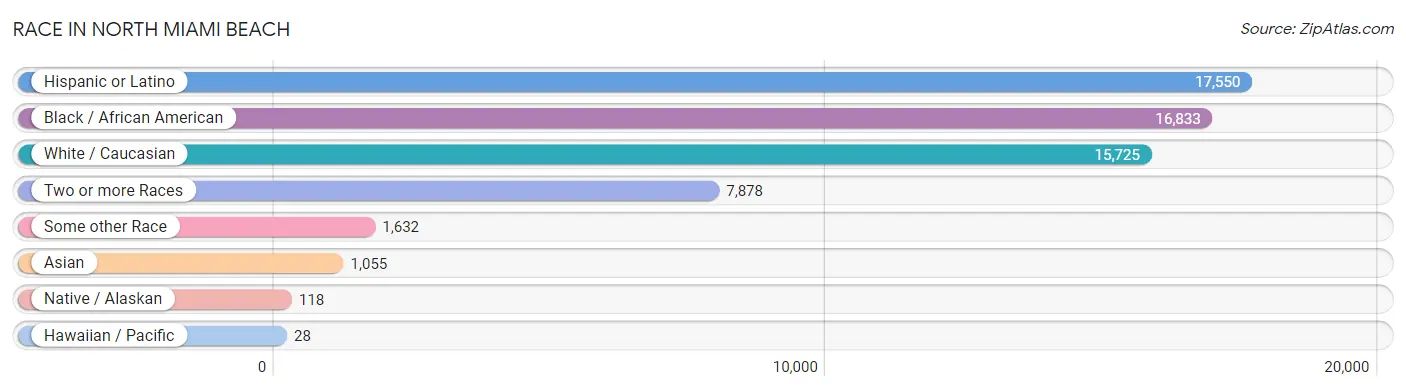
| Race | # Population | % Population |
| Asian | 1,055 | 2.4% |
| Black / African American | 16,833 | 38.9% |
| Hawaiian / Pacific | 28 | 0.1% |
| Hispanic or Latino | 17,550 | 40.6% |
| Native / Alaskan | 118 | 0.3% |
| White / Caucasian | 15,725 | 36.3% |
| Two or more Races | 7,878 | 18.2% |
| Some other Race | 1,632 | 3.8% |
| Total | 43,269 | 100.0% |
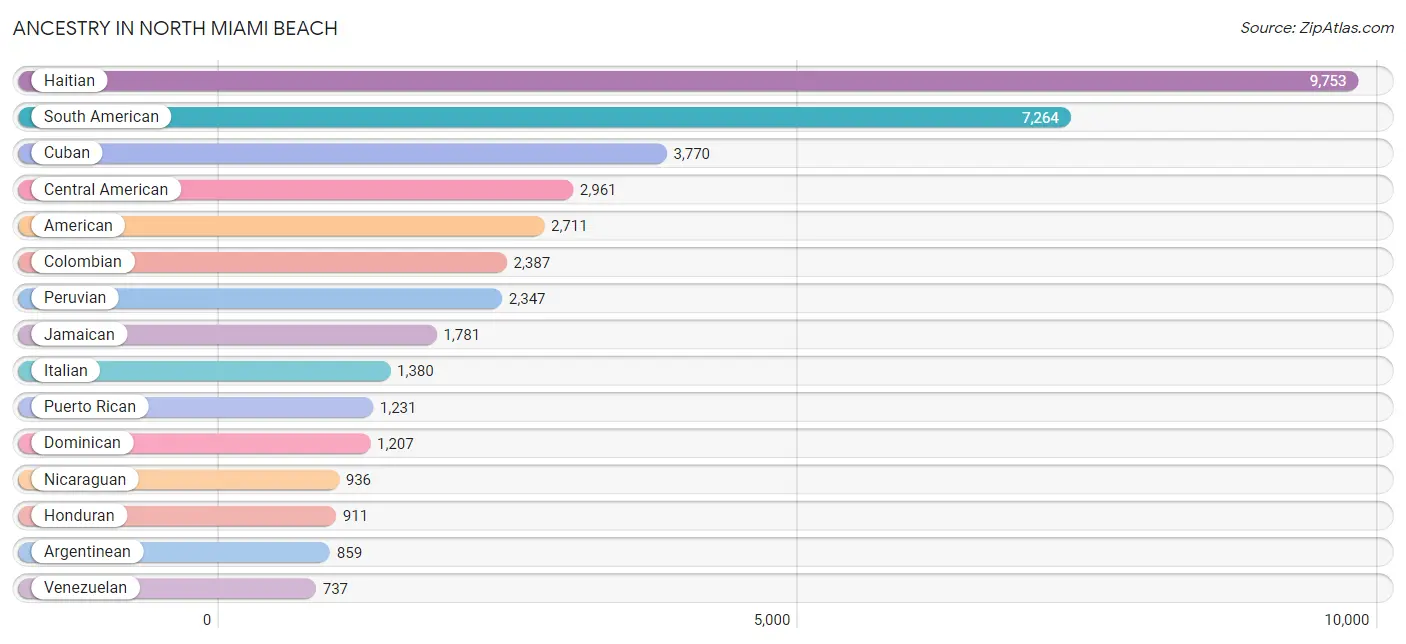
Ancestry in North Miami Beach
The most populous ancestries reported in North Miami Beach are Haitian (9,753 | 22.5%), South American (7,264 | 16.8%), Cuban (3,770 | 8.7%), Central American (2,961 | 6.8%), and American (2,711 | 6.3%), together accounting for 61.1% of all North Miami Beach residents.
| Ancestry | # Population | % Population |
| African | 232 | 0.5% |
| American | 2,711 | 6.3% |
| Arab | 149 | 0.3% |
| Argentinean | 859 | 2.0% |
| Austrian | 32 | 0.1% |
| Bahamian | 409 | 0.9% |
| Bhutanese | 266 | 0.6% |
| Bolivian | 1 | 0.0% |
| Brazilian | 447 | 1.0% |
| British | 14 | 0.0% |
| British West Indian | 13 | 0.0% |
| Canadian | 17 | 0.0% |
| Central American | 2,961 | 6.8% |
| Central American Indian | 33 | 0.1% |
| Cherokee | 10 | 0.0% |
| Chilean | 114 | 0.3% |
| Colombian | 2,387 | 5.5% |
| Costa Rican | 145 | 0.3% |
| Cuban | 3,770 | 8.7% |
| Czech | 38 | 0.1% |
| Danish | 58 | 0.1% |
| Dominican | 1,207 | 2.8% |
| Dutch | 35 | 0.1% |
| Eastern European | 164 | 0.4% |
| Ecuadorian | 532 | 1.2% |
| English | 317 | 0.7% |
| European | 249 | 0.6% |
| French | 260 | 0.6% |
| French Canadian | 39 | 0.1% |
| German | 570 | 1.3% |
| Greek | 103 | 0.2% |
| Guamanian / Chamorro | 28 | 0.1% |
| Guatemalan | 587 | 1.4% |
| Guyanese | 30 | 0.1% |
| Haitian | 9,753 | 22.5% |
| Honduran | 911 | 2.1% |
| Hungarian | 311 | 0.7% |
| Indian (Asian) | 621 | 1.4% |
| Iranian | 36 | 0.1% |
| Irish | 430 | 1.0% |
| Israeli | 519 | 1.2% |
| Italian | 1,380 | 3.2% |
| Jamaican | 1,781 | 4.1% |
| Korean | 263 | 0.6% |
| Laotian | 12 | 0.0% |
| Lebanese | 102 | 0.2% |
| Lithuanian | 57 | 0.1% |
| Lumbee | 31 | 0.1% |
| Mexican | 474 | 1.1% |
| Moroccan | 24 | 0.1% |
| New Zealander | 12 | 0.0% |
| Nicaraguan | 936 | 2.2% |
| Nigerian | 16 | 0.0% |
| Norwegian | 21 | 0.1% |
| Pakistani | 48 | 0.1% |
| Panamanian | 130 | 0.3% |
| Paraguayan | 8 | 0.0% |
| Peruvian | 2,347 | 5.4% |
| Polish | 494 | 1.1% |
| Portuguese | 119 | 0.3% |
| Puerto Rican | 1,231 | 2.8% |
| Romanian | 32 | 0.1% |
| Russian | 438 | 1.0% |
| Salvadoran | 204 | 0.5% |
| Scandinavian | 12 | 0.0% |
| Scottish | 76 | 0.2% |
| Slavic | 19 | 0.0% |
| Slovak | 3 | 0.0% |
| Slovene | 6 | 0.0% |
| South American | 7,264 | 16.8% |
| Spaniard | 73 | 0.2% |
| Spanish | 44 | 0.1% |
| Sri Lankan | 15 | 0.0% |
| Subsaharan African | 288 | 0.7% |
| Sudanese | 27 | 0.1% |
| Swedish | 13 | 0.0% |
| Swiss | 43 | 0.1% |
| Syrian | 23 | 0.1% |
| Thai | 268 | 0.6% |
| Trinidadian and Tobagonian | 121 | 0.3% |
| Turkish | 34 | 0.1% |
| Ukrainian | 161 | 0.4% |
| Uruguayan | 279 | 0.6% |
| Venezuelan | 737 | 1.7% |
| Vietnamese | 167 | 0.4% |
| Welsh | 16 | 0.0% |
| West Indian | 130 | 0.3% | View All 87 Rows |
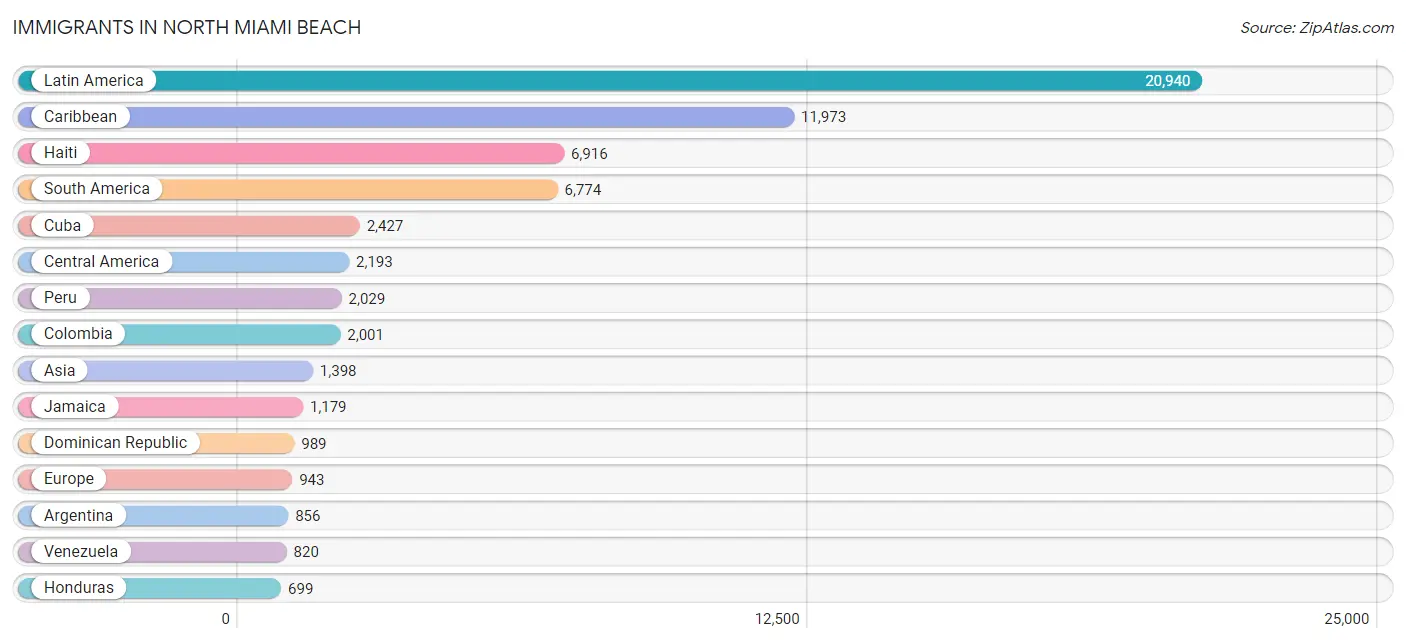
Immigrants in North Miami Beach
The most numerous immigrant groups reported in North Miami Beach came from Latin America (20,940 | 48.4%), Caribbean (11,973 | 27.7%), Haiti (6,916 | 16.0%), South America (6,774 | 15.7%), and Cuba (2,427 | 5.6%), together accounting for 113.3% of all North Miami Beach residents.
| Immigration Origin | # Population | % Population |
| Africa | 38 | 0.1% |
| Argentina | 856 | 2.0% |
| Asia | 1,398 | 3.2% |
| Bahamas | 264 | 0.6% |
| Bangladesh | 167 | 0.4% |
| Belarus | 70 | 0.2% |
| Belgium | 9 | 0.0% |
| Bolivia | 1 | 0.0% |
| Brazil | 438 | 1.0% |
| Cambodia | 9 | 0.0% |
| Canada | 56 | 0.1% |
| Caribbean | 11,973 | 27.7% |
| Central America | 2,193 | 5.1% |
| Chile | 41 | 0.1% |
| China | 314 | 0.7% |
| Colombia | 2,001 | 4.6% |
| Costa Rica | 179 | 0.4% |
| Cuba | 2,427 | 5.6% |
| Denmark | 14 | 0.0% |
| Dominican Republic | 989 | 2.3% |
| Eastern Asia | 314 | 0.7% |
| Eastern Europe | 430 | 1.0% |
| Ecuador | 255 | 0.6% |
| El Salvador | 117 | 0.3% |
| England | 61 | 0.1% |
| Europe | 943 | 2.2% |
| France | 115 | 0.3% |
| Germany | 43 | 0.1% |
| Guatemala | 262 | 0.6% |
| Guyana | 55 | 0.1% |
| Haiti | 6,916 | 16.0% |
| Honduras | 699 | 1.6% |
| Hong Kong | 41 | 0.1% |
| Hungary | 25 | 0.1% |
| India | 195 | 0.4% |
| Indonesia | 12 | 0.0% |
| Israel | 127 | 0.3% |
| Italy | 90 | 0.2% |
| Jamaica | 1,179 | 2.7% |
| Latin America | 20,940 | 48.4% |
| Mexico | 214 | 0.5% |
| Moldova | 17 | 0.0% |
| Netherlands | 11 | 0.0% |
| Nicaragua | 667 | 1.5% |
| Northern Africa | 27 | 0.1% |
| Northern Europe | 143 | 0.3% |
| Panama | 55 | 0.1% |
| Peru | 2,029 | 4.7% |
| Philippines | 520 | 1.2% |
| Poland | 32 | 0.1% |
| Portugal | 8 | 0.0% |
| Romania | 12 | 0.0% |
| Russia | 88 | 0.2% |
| South Africa | 11 | 0.0% |
| South America | 6,774 | 15.7% |
| South Central Asia | 362 | 0.8% |
| South Eastern Asia | 585 | 1.3% |
| Southern Europe | 192 | 0.4% |
| Spain | 94 | 0.2% |
| Sudan | 27 | 0.1% |
| Sweden | 4 | 0.0% |
| Syria | 5 | 0.0% |
| Taiwan | 8 | 0.0% |
| Thailand | 37 | 0.1% |
| Trinidad and Tobago | 121 | 0.3% |
| Turkey | 5 | 0.0% |
| Ukraine | 150 | 0.4% |
| Uruguay | 270 | 0.6% |
| Venezuela | 820 | 1.9% |
| Vietnam | 7 | 0.0% |
| Western Asia | 137 | 0.3% |
| Western Europe | 178 | 0.4% | View All 72 Rows |
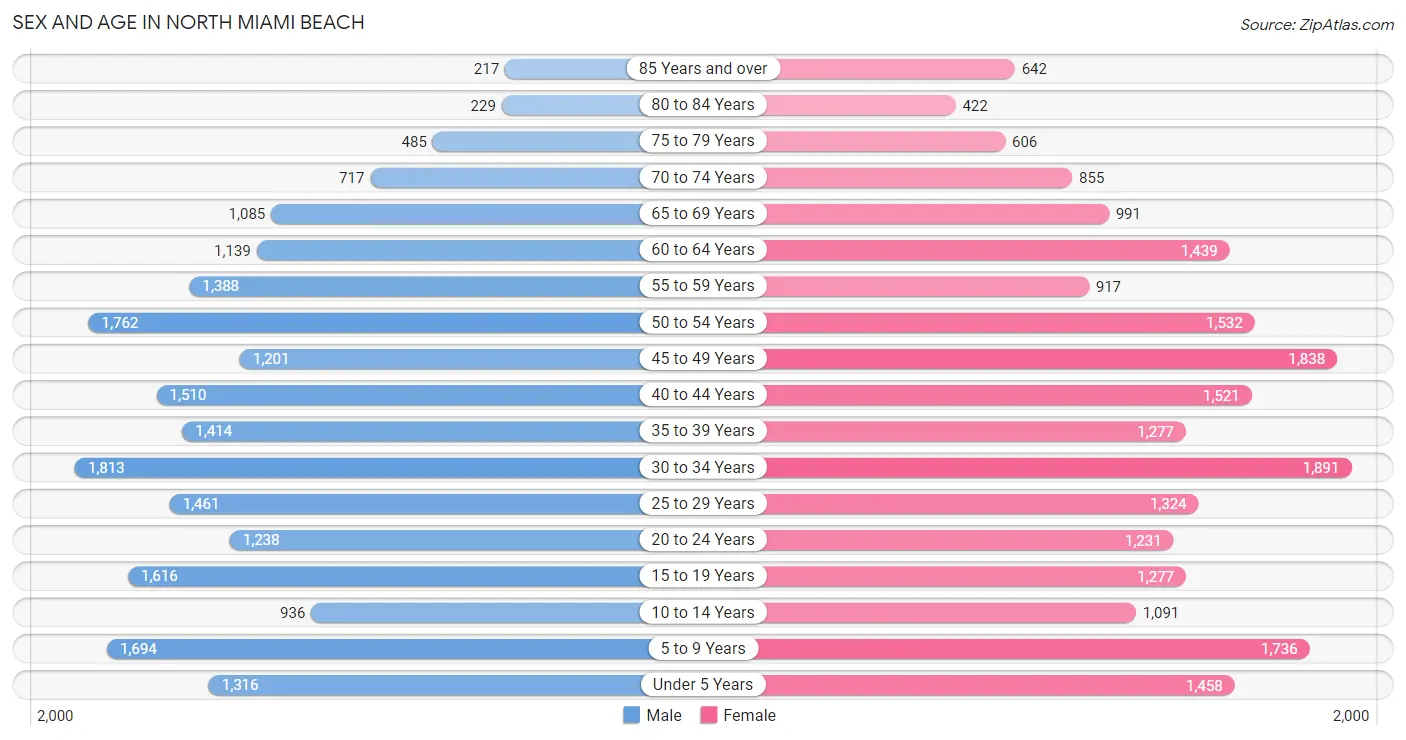
Sex and Age in North Miami Beach
Sex and Age in North Miami Beach
The most populous age groups in North Miami Beach are 30 to 34 Years (1,813 | 8.5%) for men and 30 to 34 Years (1,891 | 8.6%) for women.
| Age Bracket | Male | Female |
| Under 5 Years | 1,316 (6.2%) | 1,458 (6.6%) |
| 5 to 9 Years | 1,694 (8.0%) | 1,736 (7.9%) |
| 10 to 14 Years | 936 (4.4%) | 1,091 (5.0%) |
| 15 to 19 Years | 1,616 (7.6%) | 1,277 (5.8%) |
| 20 to 24 Years | 1,238 (5.8%) | 1,231 (5.6%) |
| 25 to 29 Years | 1,461 (6.9%) | 1,324 (6.0%) |
| 30 to 34 Years | 1,813 (8.5%) | 1,891 (8.6%) |
| 35 to 39 Years | 1,414 (6.7%) | 1,277 (5.8%) |
| 40 to 44 Years | 1,510 (7.1%) | 1,521 (6.9%) |
| 45 to 49 Years | 1,201 (5.7%) | 1,838 (8.3%) |
| 50 to 54 Years | 1,762 (8.3%) | 1,532 (7.0%) |
| 55 to 59 Years | 1,388 (6.5%) | 917 (4.2%) |
| 60 to 64 Years | 1,139 (5.4%) | 1,439 (6.5%) |
| 65 to 69 Years | 1,085 (5.1%) | 991 (4.5%) |
| 70 to 74 Years | 717 (3.4%) | 855 (3.9%) |
| 75 to 79 Years | 485 (2.3%) | 606 (2.8%) |
| 80 to 84 Years | 229 (1.1%) | 422 (1.9%) |
| 85 Years and over | 217 (1.0%) | 642 (2.9%) |
| Total | 21,221 (100.0%) | 22,048 (100.0%) |
Families and Households in North Miami Beach
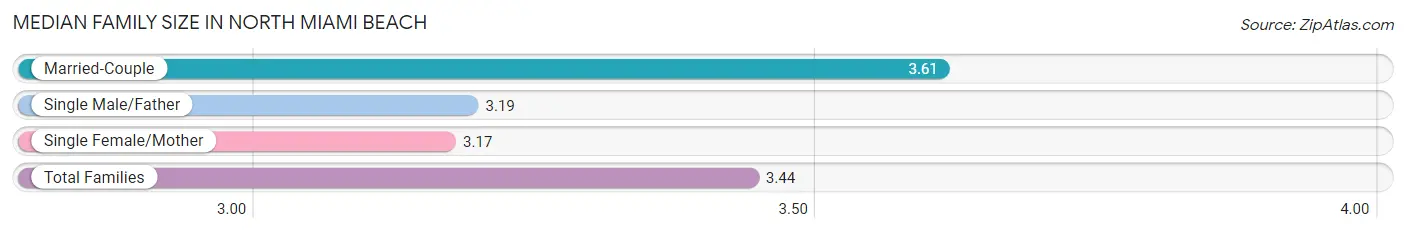
Median Family Size in North Miami Beach
The median family size in North Miami Beach is 3.44 persons per family, with married-couple families (6,266 | 59.4%) accounting for the largest median family size of 3.61 persons per family. On the other hand, single female/mother families (2,936 | 27.8%) represent the smallest median family size with 3.17 persons per family.
| Family Type | # Families | Family Size |
| Married-Couple | 6,266 (59.4%) | 3.61 |
| Single Male/Father | 1,344 (12.7%) | 3.19 |
| Single Female/Mother | 2,936 (27.8%) | 3.17 |
| Total Families | 10,546 (100.0%) | 3.44 |
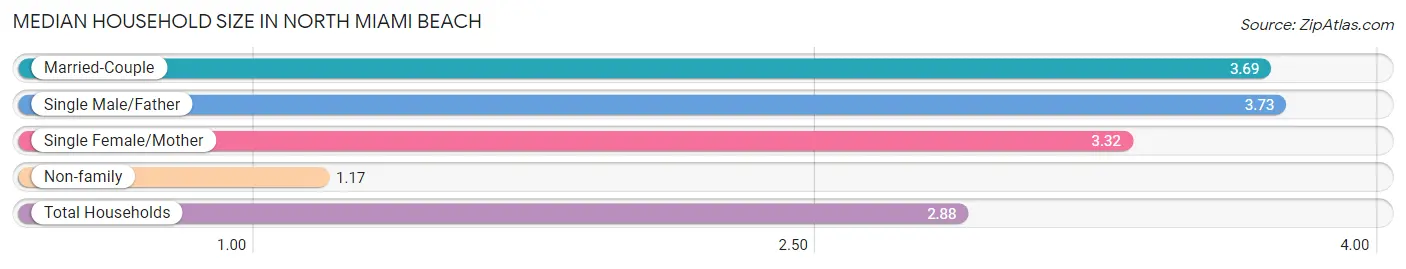
Median Household Size in North Miami Beach
The median household size in North Miami Beach is 2.88 persons per household, with single male/father households (1,344 | 9.0%) accounting for the largest median household size of 3.73 persons per household. non-family households (4,353 | 29.2%) represent the smallest median household size with 1.17 persons per household.
| Household Type | # Households | Household Size |
| Married-Couple | 6,266 (42.1%) | 3.69 |
| Single Male/Father | 1,344 (9.0%) | 3.73 |
| Single Female/Mother | 2,936 (19.7%) | 3.32 |
| Non-family | 4,353 (29.2%) | 1.17 |
| Total Households | 14,899 (100.0%) | 2.88 |
Household Size by Marriage Status in North Miami Beach
Out of a total of 14,899 households in North Miami Beach, 10,546 (70.8%) are family households, while 4,353 (29.2%) are nonfamily households. The most numerous type of family households are 2-person households, comprising 4,150, and the most common type of nonfamily households are 1-person households, comprising 3,784.
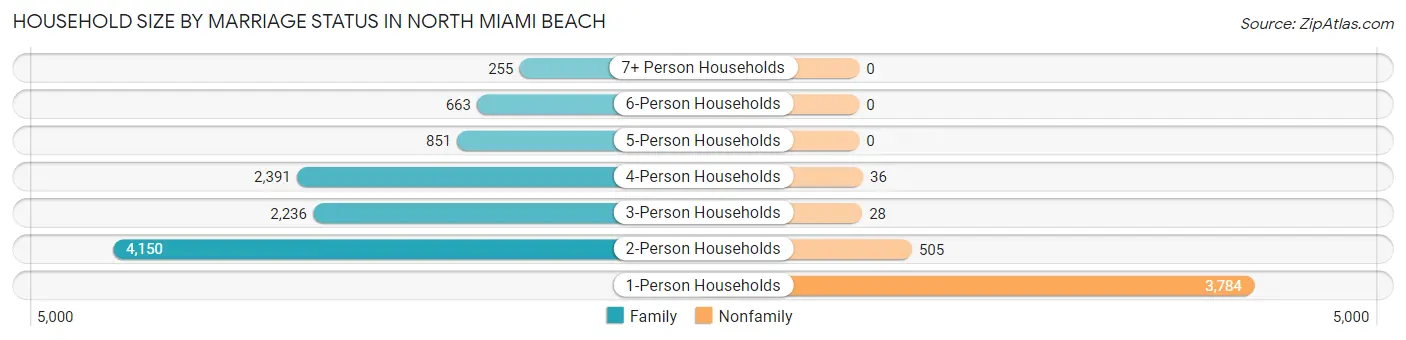
| Household Size | Family Households | Nonfamily Households |
| 1-Person Households | - | 3,784 (25.4%) |
| 2-Person Households | 4,150 (27.9%) | 505 (3.4%) |
| 3-Person Households | 2,236 (15.0%) | 28 (0.2%) |
| 4-Person Households | 2,391 (16.1%) | 36 (0.2%) |
| 5-Person Households | 851 (5.7%) | 0 (0.0%) |
| 6-Person Households | 663 (4.4%) | 0 (0.0%) |
| 7+ Person Households | 255 (1.7%) | 0 (0.0%) |
| Total | 10,546 (70.8%) | 4,353 (29.2%) |
Female Fertility in North Miami Beach
Fertility by Age in North Miami Beach
Average fertility rate in North Miami Beach is 59.0 births per 1,000 women. Women in the age bracket of 20 to 34 years have the highest fertility rate with 80.0 births per 1,000 women. Women in the age bracket of 20 to 34 years acount for 56.2% of all women with births.
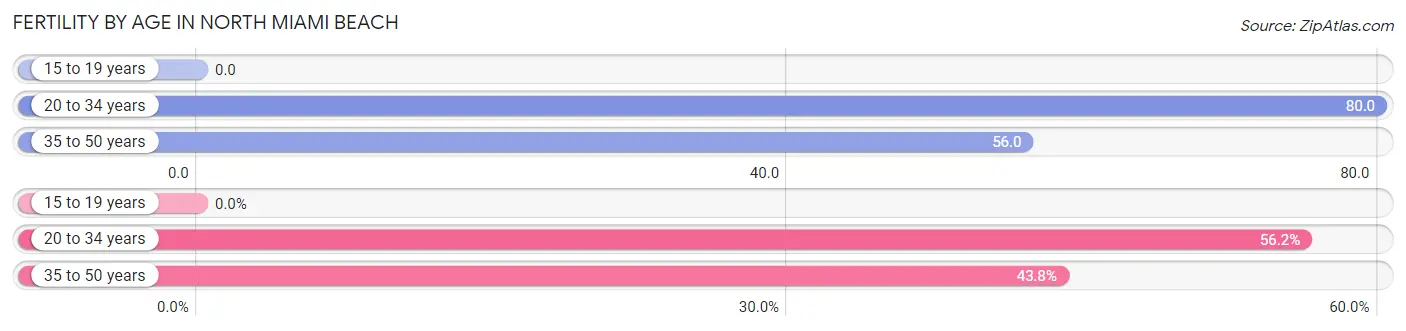
| Age Bracket | Women with Births | Births / 1,000 Women |
| 15 to 19 years | 0 (0.0%) | 0.0 |
| 20 to 34 years | 354 (56.2%) | 80.0 |
| 35 to 50 years | 276 (43.8%) | 56.0 |
| Total | 630 (100.0%) | 59.0 |
Fertility by Age by Marriage Status in North Miami Beach
75.2% of women with births (630) in North Miami Beach are married. The highest percentage of unmarried women with births falls into 20 to 34 years age bracket with 29.7% of them unmarried at the time of birth, while the lowest percentage of unmarried women with births belong to 35 to 50 years age bracket with 18.5% of them unmarried.
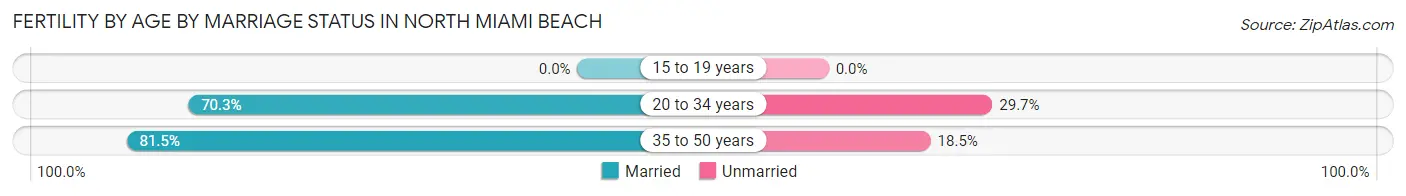
| Age Bracket | Married | Unmarried |
| 15 to 19 years | 0 (0.0%) | 0 (0.0%) |
| 20 to 34 years | 249 (70.3%) | 105 (29.7%) |
| 35 to 50 years | 225 (81.5%) | 51 (18.5%) |
| Total | 474 (75.2%) | 156 (24.8%) |
Fertility by Education in North Miami Beach
Average fertility rate in North Miami Beach is 59.0 births per 1,000 women. Women with the education attainment of college or associate's degree have the highest fertility rate of 79.0 births per 1,000 women, while women with the education attainment of bachelor's degree have the lowest fertility at 29.0 births per 1,000 women. Women with the education attainment of college or associate's degree represent 42.7% of all women with births.
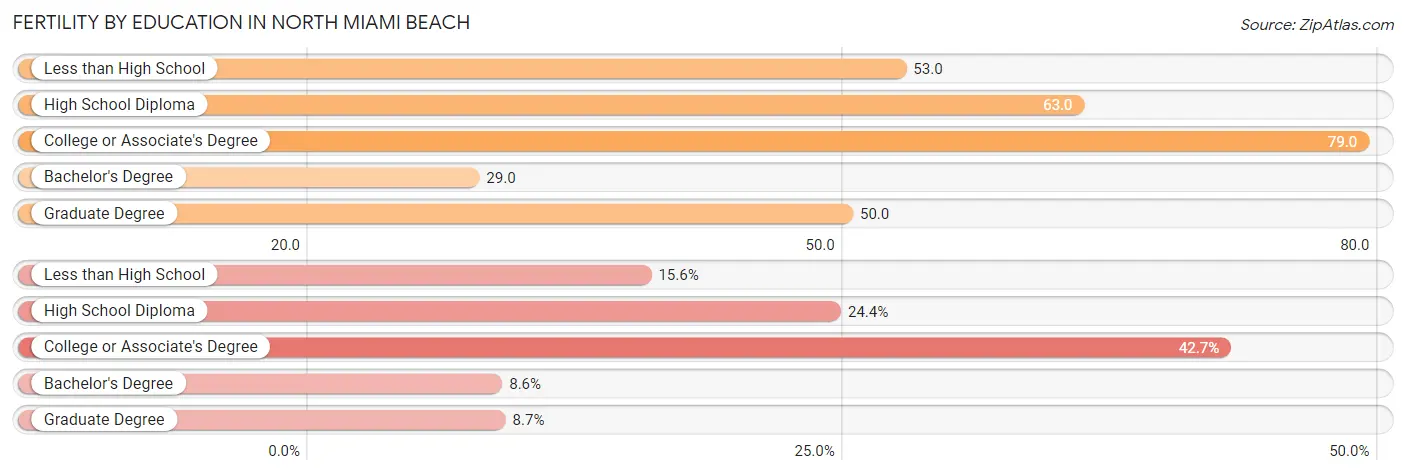
| Educational Attainment | Women with Births | Births / 1,000 Women |
| Less than High School | 98 (15.6%) | 53.0 |
| High School Diploma | 154 (24.4%) | 63.0 |
| College or Associate's Degree | 269 (42.7%) | 79.0 |
| Bachelor's Degree | 54 (8.6%) | 29.0 |
| Graduate Degree | 55 (8.7%) | 50.0 |
| Total | 630 (100.0%) | 59.0 |
Fertility by Education by Marriage Status in North Miami Beach
24.8% of women with births in North Miami Beach are unmarried. Women with the educational attainment of less than high school are most likely to be married with 100.0% of them married at childbirth, while women with the educational attainment of high school diploma are least likely to be married with 36.4% of them unmarried at childbirth.
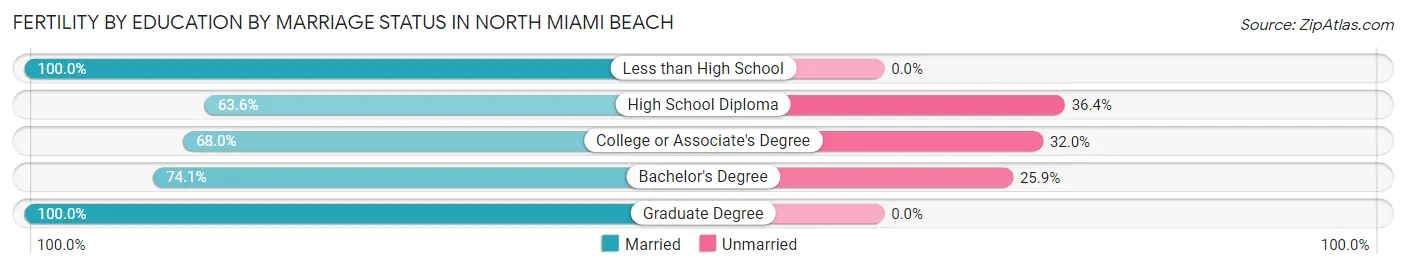
| Educational Attainment | Married | Unmarried |
| Less than High School | 98 (100.0%) | 0 (0.0%) |
| High School Diploma | 98 (63.6%) | 56 (36.4%) |
| College or Associate's Degree | 183 (68.0%) | 86 (32.0%) |
| Bachelor's Degree | 40 (74.1%) | 14 (25.9%) |
| Graduate Degree | 55 (100.0%) | 0 (0.0%) |
| Total | 474 (75.2%) | 156 (24.8%) |
Employment Characteristics in North Miami Beach
Employment by Class of Employer in North Miami Beach
Among the 21,592 employed individuals in North Miami Beach, private company employees (15,713 | 72.8%), self-employed (not incorporated) (1,686 | 7.8%), and self-employed (incorporated) (1,340 | 6.2%) make up the most common classes of employment.
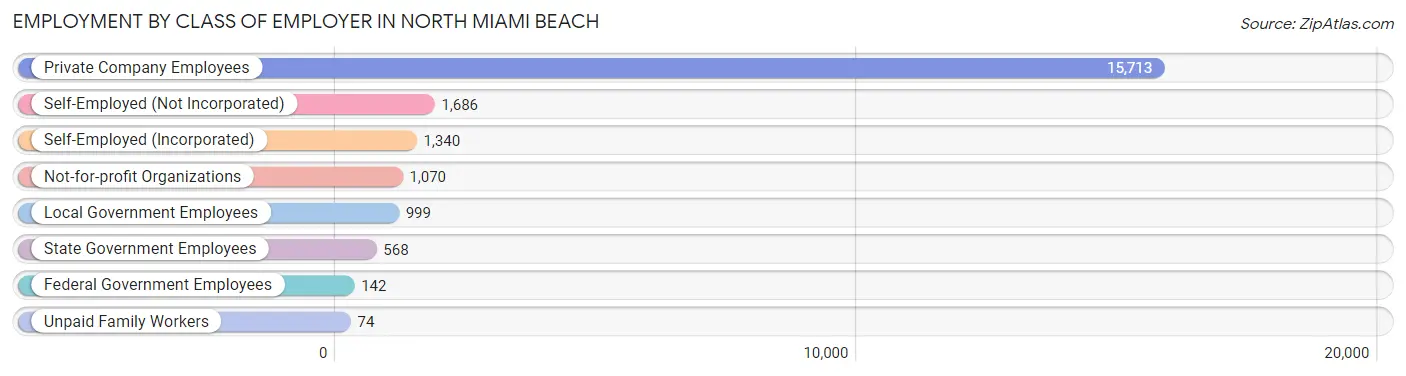
| Employer Class | # Employees | % Employees |
| Private Company Employees | 15,713 | 72.8% |
| Self-Employed (Incorporated) | 1,340 | 6.2% |
| Self-Employed (Not Incorporated) | 1,686 | 7.8% |
| Not-for-profit Organizations | 1,070 | 5.0% |
| Local Government Employees | 999 | 4.6% |
| State Government Employees | 568 | 2.6% |
| Federal Government Employees | 142 | 0.7% |
| Unpaid Family Workers | 74 | 0.3% |
| Total | 21,592 | 100.0% |
Employment Status by Age in North Miami Beach
According to the labor force statistics for North Miami Beach, out of the total population over 16 years of age (34,375), 67.8% or 23,306 individuals are in the labor force, with 5.3% or 1,235 of them unemployed. The age group with the highest labor force participation rate is 35 to 44 years, with 87.7% or 5,018 individuals in the labor force. Within the labor force, the 16 to 19 years age range has the highest percentage of unemployed individuals, with 17.9% or 90 of them being unemployed.
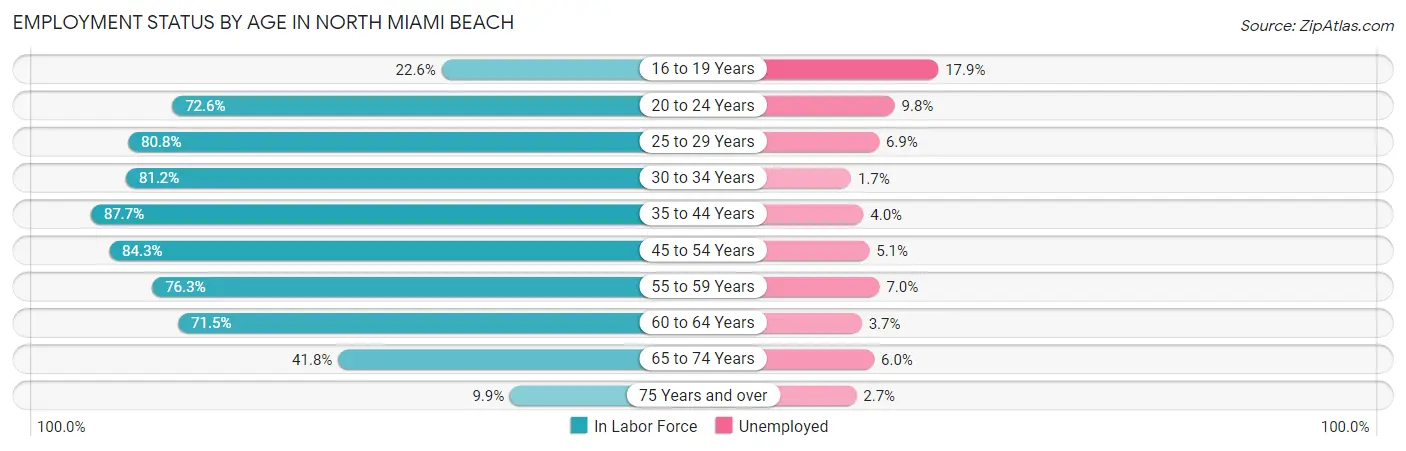
| Age Bracket | In Labor Force | Unemployed |
| 16 to 19 Years | 504 (22.6%) | 90 (17.9%) |
| 20 to 24 Years | 1,792 (72.6%) | 176 (9.8%) |
| 25 to 29 Years | 2,250 (80.8%) | 155 (6.9%) |
| 30 to 34 Years | 3,008 (81.2%) | 51 (1.7%) |
| 35 to 44 Years | 5,018 (87.7%) | 201 (4.0%) |
| 45 to 54 Years | 5,339 (84.3%) | 272 (5.1%) |
| 55 to 59 Years | 1,759 (76.3%) | 123 (7.0%) |
| 60 to 64 Years | 1,843 (71.5%) | 68 (3.7%) |
| 65 to 74 Years | 1,525 (41.8%) | 92 (6.0%) |
| 75 Years and over | 257 (9.9%) | 7 (2.7%) |
| Total | 23,306 (67.8%) | 1,235 (5.3%) |
Employment Status by Educational Attainment in North Miami Beach
According to labor force statistics for North Miami Beach, 82.0% of individuals (19,210) out of the total population between 25 and 64 years of age (23,427) are in the labor force, with 4.5% or 864 of them being unemployed. The group with the highest labor force participation rate are those with the educational attainment of bachelor's degree or higher, with 87.0% or 5,639 individuals in the labor force. Within the labor force, individuals with less than high school education have the highest percentage of unemployment, with 5.3% or 103 of them being unemployed.
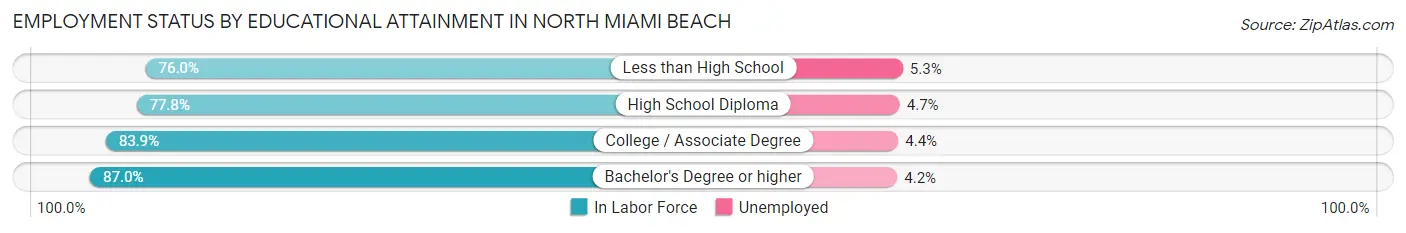
| Educational Attainment | In Labor Force | Unemployed |
| Less than High School | 1,941 (76.0%) | 135 (5.3%) |
| High School Diploma | 5,648 (77.8%) | 341 (4.7%) |
| College / Associate Degree | 5,983 (83.9%) | 314 (4.4%) |
| Bachelor's Degree or higher | 5,639 (87.0%) | 272 (4.2%) |
| Total | 19,210 (82.0%) | 1,054 (4.5%) |
Employment Occupations by Sex in North Miami Beach
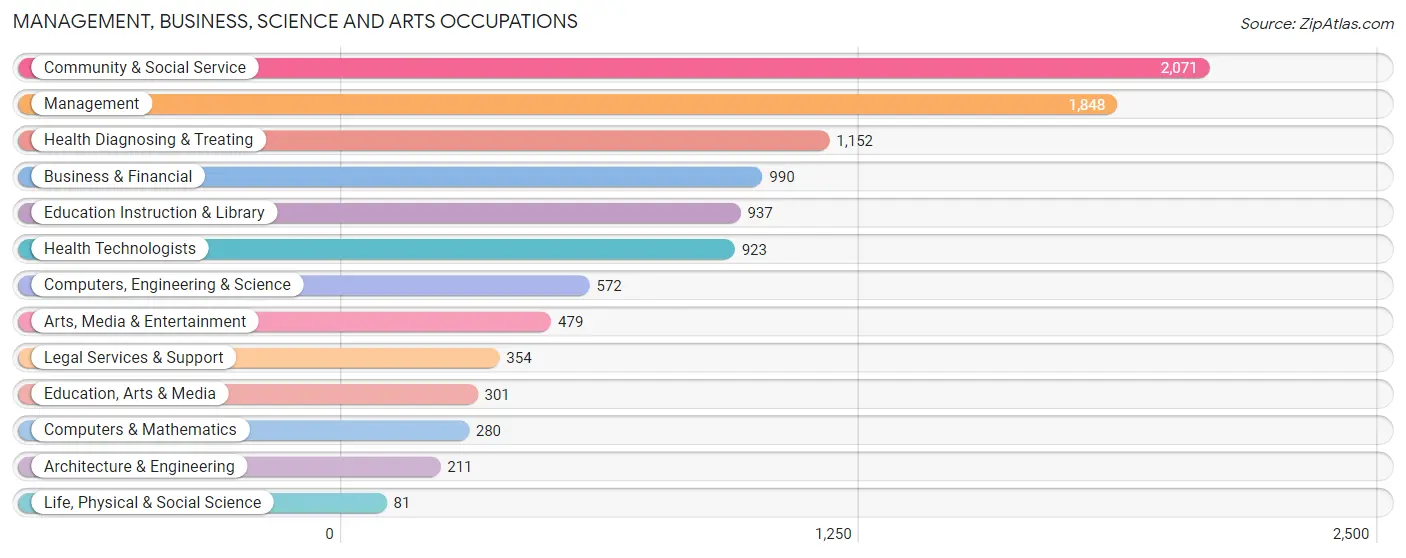
Management, Business, Science and Arts Occupations
The most common Management, Business, Science and Arts occupations in North Miami Beach are Community & Social Service (2,071 | 9.4%), Management (1,848 | 8.4%), Health Diagnosing & Treating (1,152 | 5.2%), Business & Financial (990 | 4.5%), and Education Instruction & Library (937 | 4.3%).
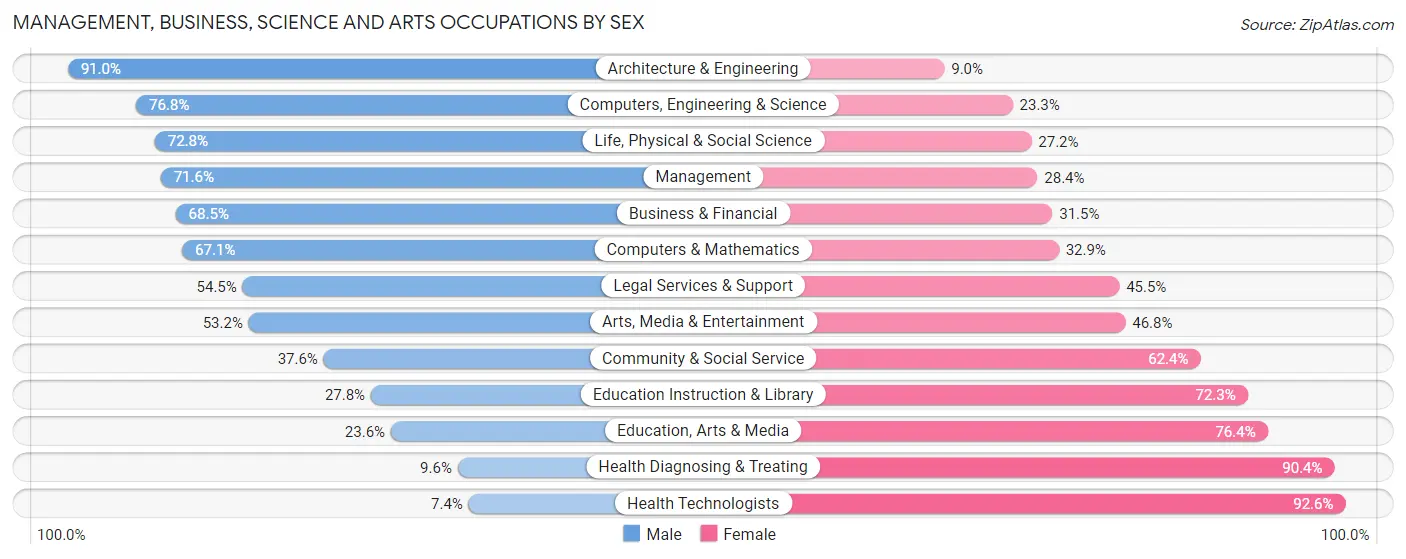
Management, Business, Science and Arts Occupations by Sex
Within the Management, Business, Science and Arts occupations in North Miami Beach, the most male-oriented occupations are Architecture & Engineering (91.0%), Computers, Engineering & Science (76.7%), and Life, Physical & Social Science (72.8%), while the most female-oriented occupations are Health Technologists (92.6%), Health Diagnosing & Treating (90.4%), and Education, Arts & Media (76.4%).
| Occupation | Male | Female |
| Management | 1,323 (71.6%) | 525 (28.4%) |
| Business & Financial | 678 (68.5%) | 312 (31.5%) |
| Computers, Engineering & Science | 439 (76.7%) | 133 (23.3%) |
| Computers & Mathematics | 188 (67.1%) | 92 (32.9%) |
| Architecture & Engineering | 192 (91.0%) | 19 (9.0%) |
| Life, Physical & Social Science | 59 (72.8%) | 22 (27.2%) |
| Community & Social Service | 779 (37.6%) | 1,292 (62.4%) |
| Education, Arts & Media | 71 (23.6%) | 230 (76.4%) |
| Legal Services & Support | 193 (54.5%) | 161 (45.5%) |
| Education Instruction & Library | 260 (27.8%) | 677 (72.3%) |
| Arts, Media & Entertainment | 255 (53.2%) | 224 (46.8%) |
| Health Diagnosing & Treating | 111 (9.6%) | 1,041 (90.4%) |
| Health Technologists | 68 (7.4%) | 855 (92.6%) |
| Total (Category) | 3,330 (50.2%) | 3,303 (49.8%) |
| Total (Overall) | 11,666 (52.9%) | 10,387 (47.1%) |
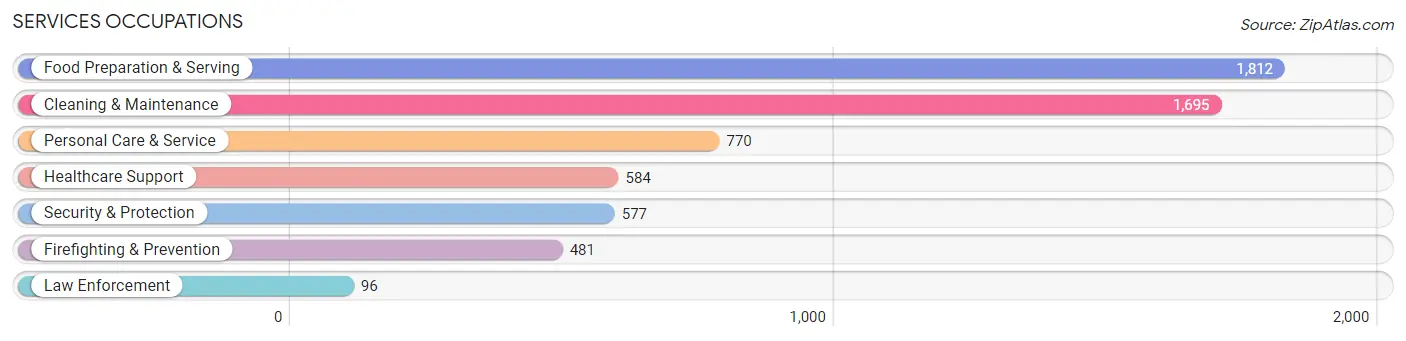
Services Occupations
The most common Services occupations in North Miami Beach are Food Preparation & Serving (1,812 | 8.2%), Cleaning & Maintenance (1,695 | 7.7%), Personal Care & Service (770 | 3.5%), Healthcare Support (584 | 2.6%), and Security & Protection (577 | 2.6%).
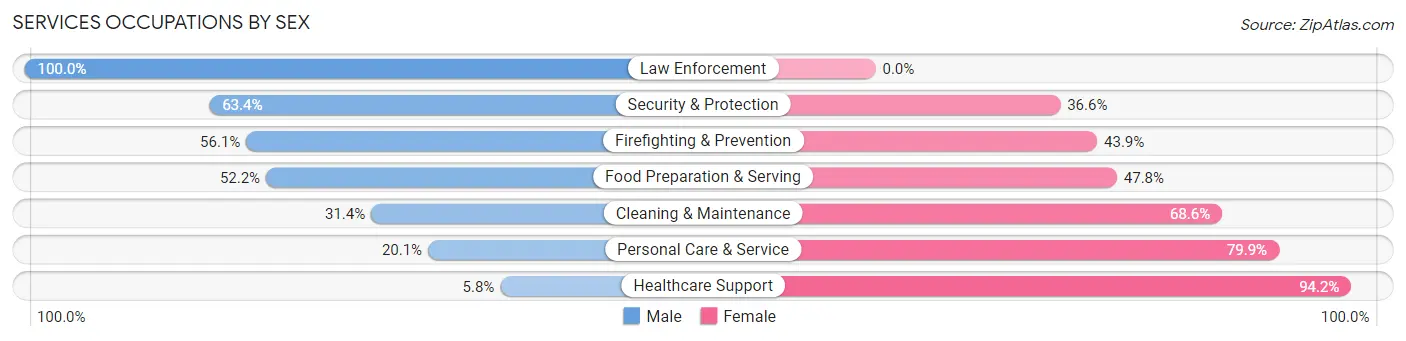
Services Occupations by Sex
Within the Services occupations in North Miami Beach, the most male-oriented occupations are Law Enforcement (100.0%), Security & Protection (63.4%), and Firefighting & Prevention (56.1%), while the most female-oriented occupations are Healthcare Support (94.2%), Personal Care & Service (79.9%), and Cleaning & Maintenance (68.6%).
| Occupation | Male | Female |
| Healthcare Support | 34 (5.8%) | 550 (94.2%) |
| Security & Protection | 366 (63.4%) | 211 (36.6%) |
| Firefighting & Prevention | 270 (56.1%) | 211 (43.9%) |
| Law Enforcement | 96 (100.0%) | 0 (0.0%) |
| Food Preparation & Serving | 946 (52.2%) | 866 (47.8%) |
| Cleaning & Maintenance | 532 (31.4%) | 1,163 (68.6%) |
| Personal Care & Service | 155 (20.1%) | 615 (79.9%) |
| Total (Category) | 2,033 (37.4%) | 3,405 (62.6%) |
| Total (Overall) | 11,666 (52.9%) | 10,387 (47.1%) |
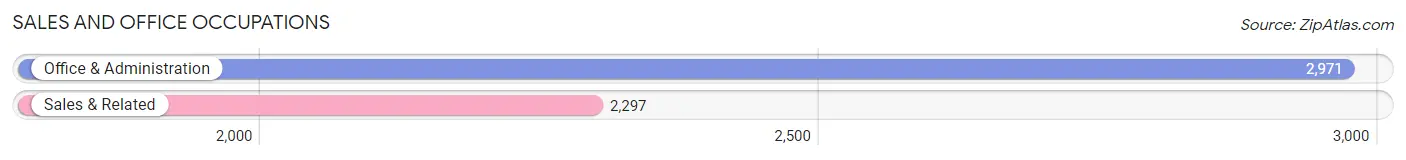
Sales and Office Occupations
The most common Sales and Office occupations in North Miami Beach are Office & Administration (2,971 | 13.5%), and Sales & Related (2,297 | 10.4%).
Sales and Office Occupations by Sex
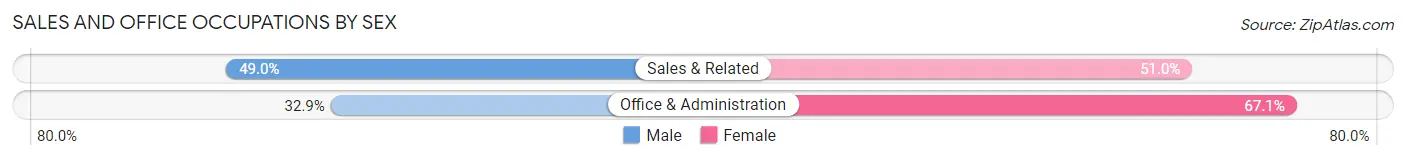
| Occupation | Male | Female |
| Sales & Related | 1,125 (49.0%) | 1,172 (51.0%) |
| Office & Administration | 978 (32.9%) | 1,993 (67.1%) |
| Total (Category) | 2,103 (39.9%) | 3,165 (60.1%) |
| Total (Overall) | 11,666 (52.9%) | 10,387 (47.1%) |
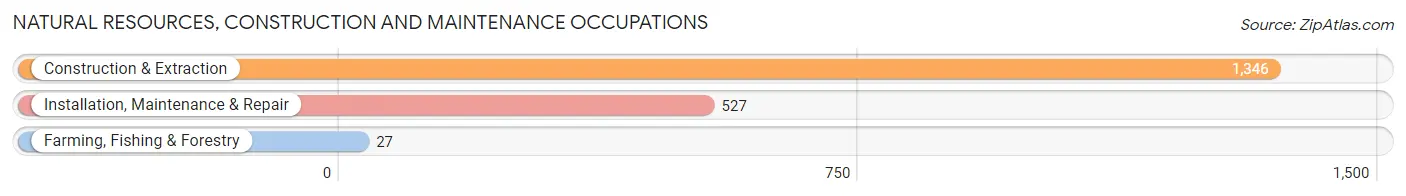
Natural Resources, Construction and Maintenance Occupations
The most common Natural Resources, Construction and Maintenance occupations in North Miami Beach are Construction & Extraction (1,346 | 6.1%), Installation, Maintenance & Repair (527 | 2.4%), and Farming, Fishing & Forestry (27 | 0.1%).
Natural Resources, Construction and Maintenance Occupations by Sex
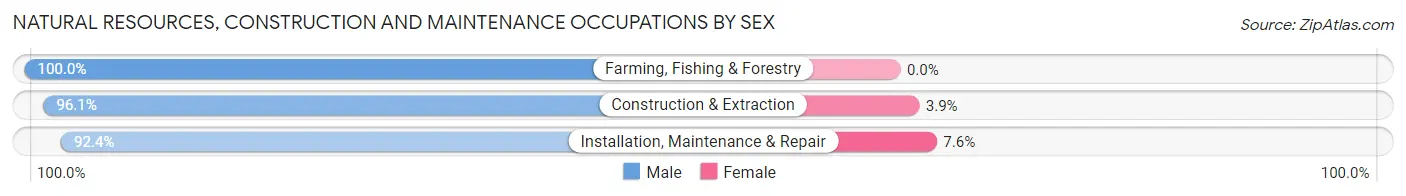
| Occupation | Male | Female |
| Farming, Fishing & Forestry | 27 (100.0%) | 0 (0.0%) |
| Construction & Extraction | 1,293 (96.1%) | 53 (3.9%) |
| Installation, Maintenance & Repair | 487 (92.4%) | 40 (7.6%) |
| Total (Category) | 1,807 (95.1%) | 93 (4.9%) |
| Total (Overall) | 11,666 (52.9%) | 10,387 (47.1%) |
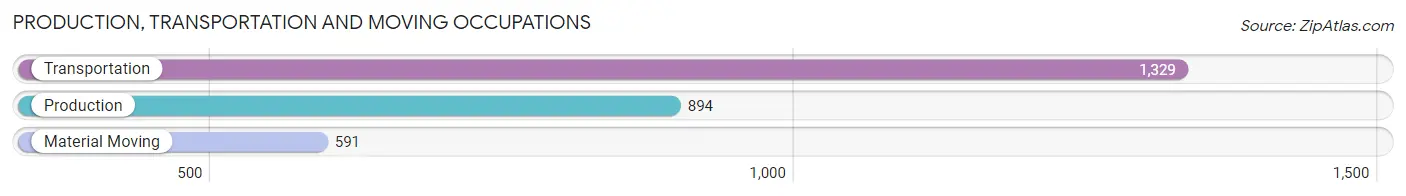
Production, Transportation and Moving Occupations
The most common Production, Transportation and Moving occupations in North Miami Beach are Transportation (1,329 | 6.0%), Production (894 | 4.1%), and Material Moving (591 | 2.7%).
Production, Transportation and Moving Occupations by Sex
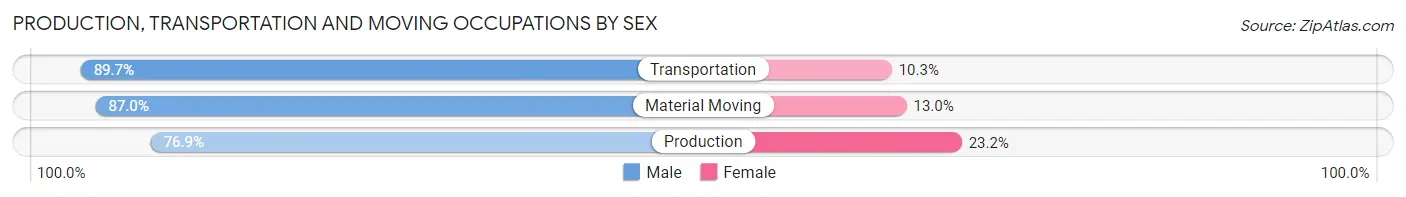
| Occupation | Male | Female |
| Production | 687 (76.8%) | 207 (23.2%) |
| Transportation | 1,192 (89.7%) | 137 (10.3%) |
| Material Moving | 514 (87.0%) | 77 (13.0%) |
| Total (Category) | 2,393 (85.0%) | 421 (15.0%) |
| Total (Overall) | 11,666 (52.9%) | 10,387 (47.1%) |
Employment Industries by Sex in North Miami Beach
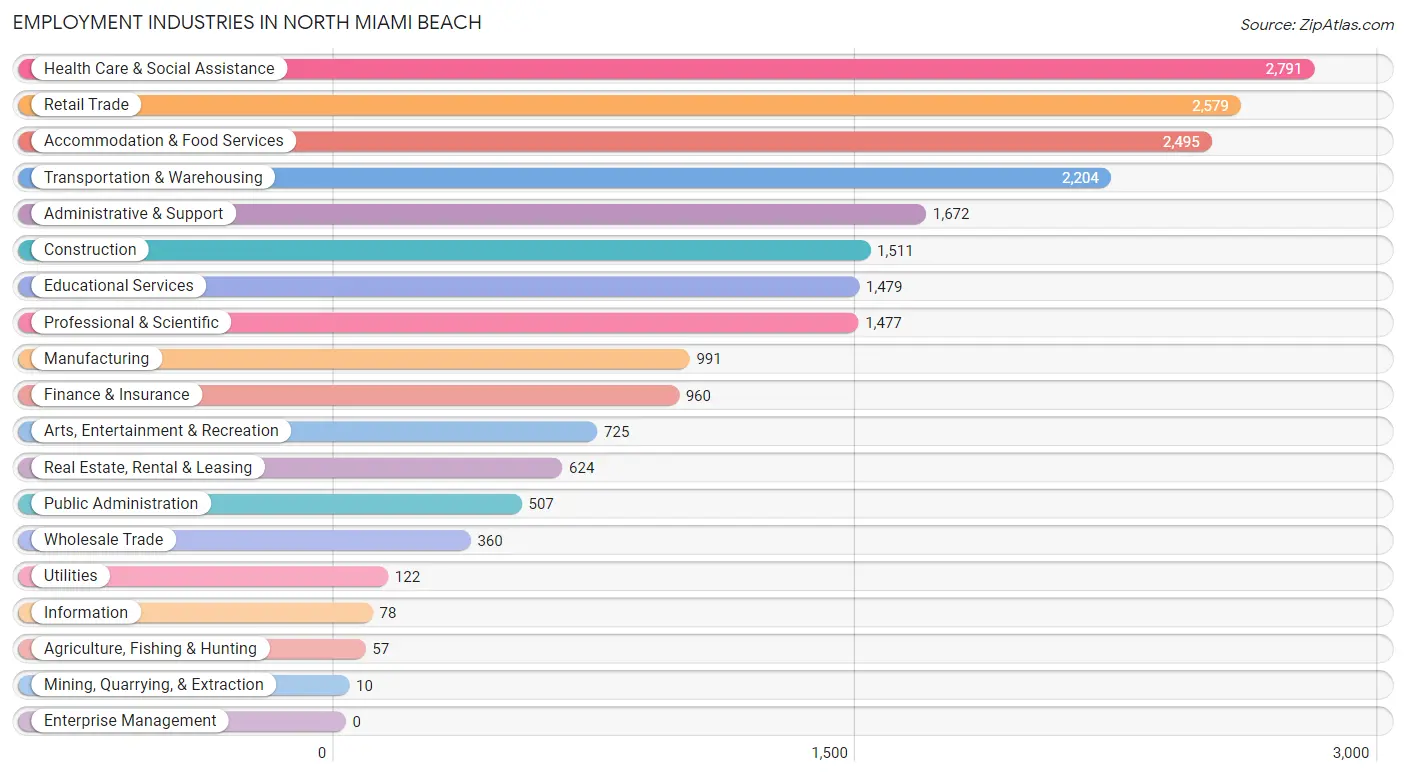
Employment Industries in North Miami Beach
The major employment industries in North Miami Beach include Health Care & Social Assistance (2,791 | 12.7%), Retail Trade (2,579 | 11.7%), Accommodation & Food Services (2,495 | 11.3%), Transportation & Warehousing (2,204 | 10.0%), and Administrative & Support (1,672 | 7.6%).
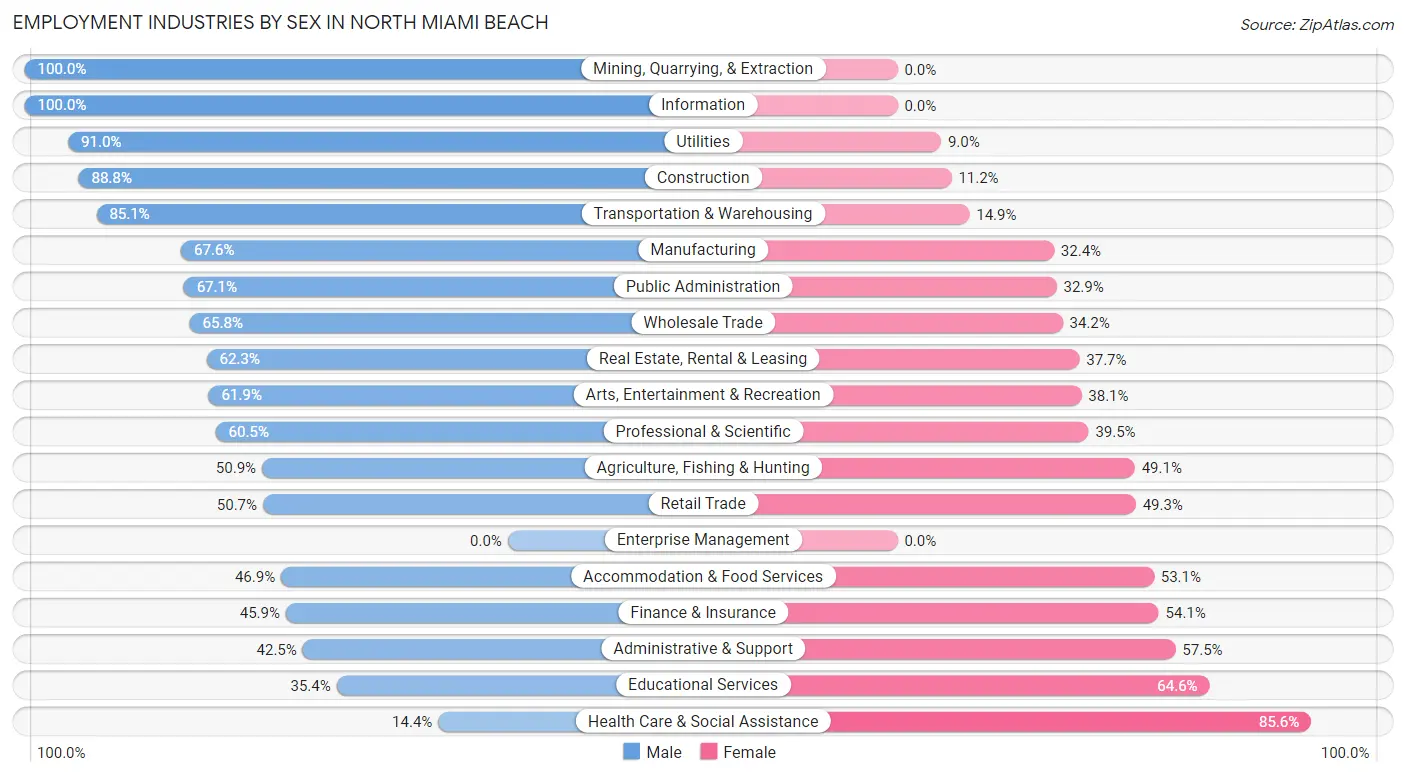
Employment Industries by Sex in North Miami Beach
The North Miami Beach industries that see more men than women are Mining, Quarrying, & Extraction (100.0%), Information (100.0%), and Utilities (91.0%), whereas the industries that tend to have a higher number of women are Health Care & Social Assistance (85.6%), Educational Services (64.6%), and Administrative & Support (57.5%).
| Industry | Male | Female |
| Agriculture, Fishing & Hunting | 29 (50.9%) | 28 (49.1%) |
| Mining, Quarrying, & Extraction | 10 (100.0%) | 0 (0.0%) |
| Construction | 1,342 (88.8%) | 169 (11.2%) |
| Manufacturing | 670 (67.6%) | 321 (32.4%) |
| Wholesale Trade | 237 (65.8%) | 123 (34.2%) |
| Retail Trade | 1,307 (50.7%) | 1,272 (49.3%) |
| Transportation & Warehousing | 1,876 (85.1%) | 328 (14.9%) |
| Utilities | 111 (91.0%) | 11 (9.0%) |
| Information | 78 (100.0%) | 0 (0.0%) |
| Finance & Insurance | 441 (45.9%) | 519 (54.1%) |
| Real Estate, Rental & Leasing | 389 (62.3%) | 235 (37.7%) |
| Professional & Scientific | 893 (60.5%) | 584 (39.5%) |
| Enterprise Management | 0 (0.0%) | 0 (0.0%) |
| Administrative & Support | 710 (42.5%) | 962 (57.5%) |
| Educational Services | 524 (35.4%) | 955 (64.6%) |
| Health Care & Social Assistance | 402 (14.4%) | 2,389 (85.6%) |
| Arts, Entertainment & Recreation | 449 (61.9%) | 276 (38.1%) |
| Accommodation & Food Services | 1,171 (46.9%) | 1,324 (53.1%) |
| Public Administration | 340 (67.1%) | 167 (32.9%) |
| Total | 11,666 (52.9%) | 10,387 (47.1%) |
Education in North Miami Beach
School Enrollment in North Miami Beach
The most common levels of schooling among the 11,146 students in North Miami Beach are elementary school (2,881 | 25.9%), college / undergraduate (2,601 | 23.3%), and high school (2,473 | 22.2%).
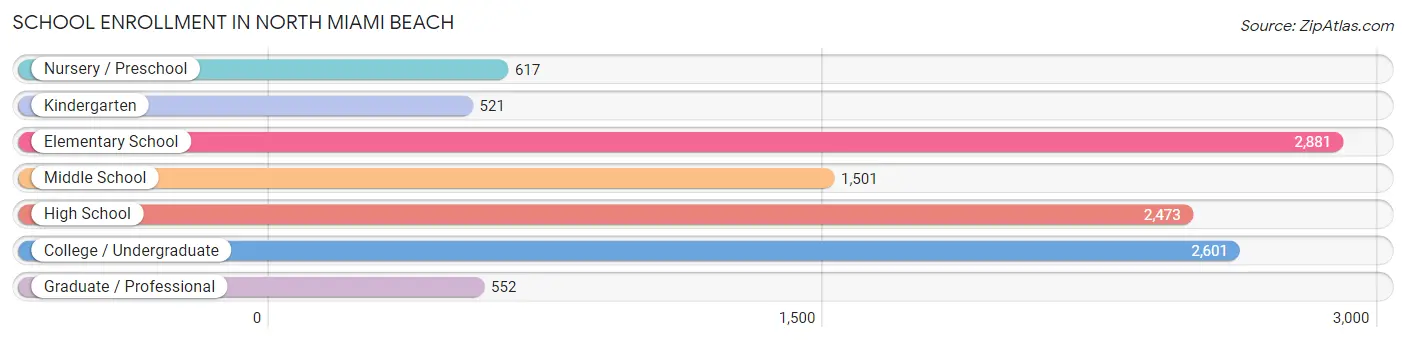
| School Level | # Students | % Students |
| Nursery / Preschool | 617 | 5.5% |
| Kindergarten | 521 | 4.7% |
| Elementary School | 2,881 | 25.9% |
| Middle School | 1,501 | 13.5% |
| High School | 2,473 | 22.2% |
| College / Undergraduate | 2,601 | 23.3% |
| Graduate / Professional | 552 | 5.0% |
| Total | 11,146 | 100.0% |
School Enrollment by Age by Funding Source in North Miami Beach
Out of a total of 11,146 students who are enrolled in schools in North Miami Beach, 1,917 (17.2%) attend a private institution, while the remaining 9,229 (82.8%) are enrolled in public schools. The age group of 25 to 34 year olds has the highest likelihood of being enrolled in private schools, with 332 (45.2% in the age bracket) enrolled. Conversely, the age group of 18 to 19 year olds has the lowest likelihood of being enrolled in a private school, with 724 (95.3% in the age bracket) attending a public institution.
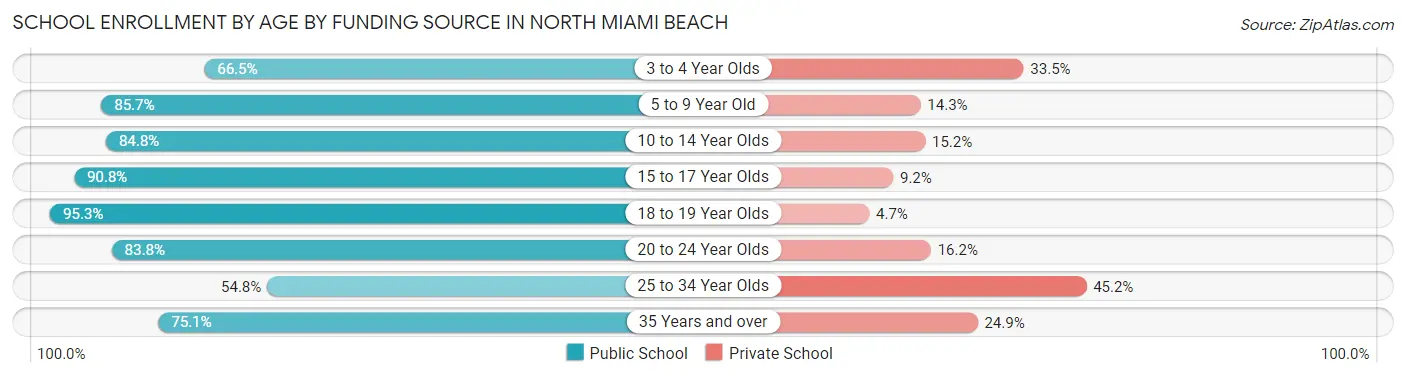
| Age Bracket | Public School | Private School |
| 3 to 4 Year Olds | 441 (66.5%) | 222 (33.5%) |
| 5 to 9 Year Old | 2,688 (85.7%) | 448 (14.3%) |
| 10 to 14 Year Olds | 1,645 (84.8%) | 294 (15.2%) |
| 15 to 17 Year Olds | 1,728 (90.8%) | 175 (9.2%) |
| 18 to 19 Year Olds | 724 (95.3%) | 36 (4.7%) |
| 20 to 24 Year Olds | 914 (83.8%) | 177 (16.2%) |
| 25 to 34 Year Olds | 403 (54.8%) | 332 (45.2%) |
| 35 Years and over | 690 (75.1%) | 229 (24.9%) |
| Total | 9,229 (82.8%) | 1,917 (17.2%) |
Educational Attainment by Field of Study in North Miami Beach
Business (1,858 | 22.3%), education (1,322 | 15.9%), science & technology (1,063 | 12.8%), engineering (656 | 7.9%), and communications (553 | 6.6%) are the most common fields of study among 8,329 individuals in North Miami Beach who have obtained a bachelor's degree or higher.
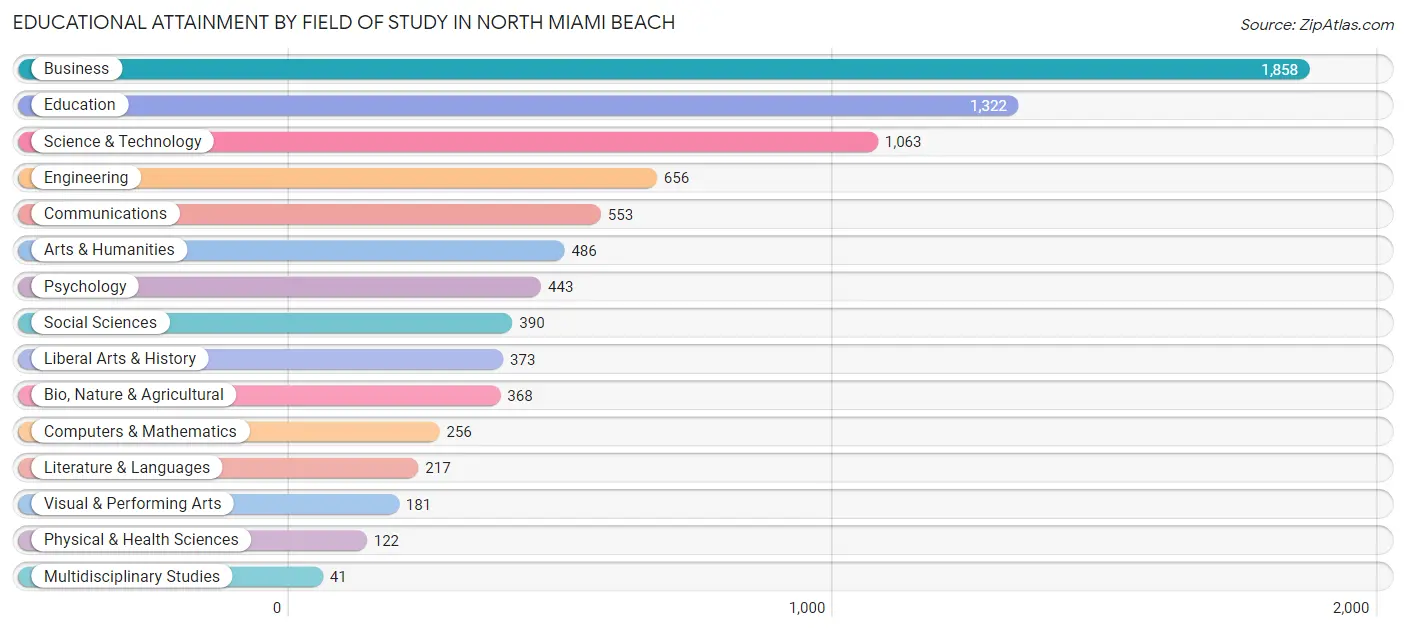
| Field of Study | # Graduates | % Graduates |
| Computers & Mathematics | 256 | 3.1% |
| Bio, Nature & Agricultural | 368 | 4.4% |
| Physical & Health Sciences | 122 | 1.5% |
| Psychology | 443 | 5.3% |
| Social Sciences | 390 | 4.7% |
| Engineering | 656 | 7.9% |
| Multidisciplinary Studies | 41 | 0.5% |
| Science & Technology | 1,063 | 12.8% |
| Business | 1,858 | 22.3% |
| Education | 1,322 | 15.9% |
| Literature & Languages | 217 | 2.6% |
| Liberal Arts & History | 373 | 4.5% |
| Visual & Performing Arts | 181 | 2.2% |
| Communications | 553 | 6.6% |
| Arts & Humanities | 486 | 5.8% |
| Total | 8,329 | 100.0% |
Transportation & Commute in North Miami Beach
Vehicle Availability by Sex in North Miami Beach
The most prevalent vehicle ownership categories in North Miami Beach are males with 2 vehicles (5,094, accounting for 44.4%) and females with 2 vehicles (4,366, making up 50.3%).
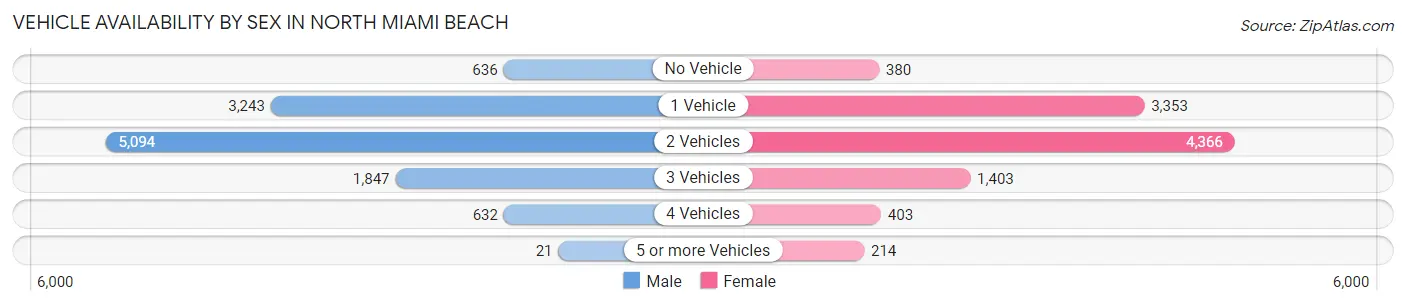
| Vehicles Available | Male | Female |
| No Vehicle | 636 (5.5%) | 380 (3.8%) |
| 1 Vehicle | 3,243 (28.3%) | 3,353 (33.1%) |
| 2 Vehicles | 5,094 (44.4%) | 4,366 (43.1%) |
| 3 Vehicles | 1,847 (16.1%) | 1,403 (13.9%) |
| 4 Vehicles | 632 (5.5%) | 403 (4.0%) |
| 5 or more Vehicles | 21 (0.2%) | 214 (2.1%) |
| Total | 11,473 (100.0%) | 10,119 (100.0%) |
Commute Time in North Miami Beach
The most frequently occuring commute durations in North Miami Beach are 30 to 34 minutes (3,762 commuters, 18.8%), 45 to 59 minutes (3,065 commuters, 15.3%), and 20 to 24 minutes (2,284 commuters, 11.4%).
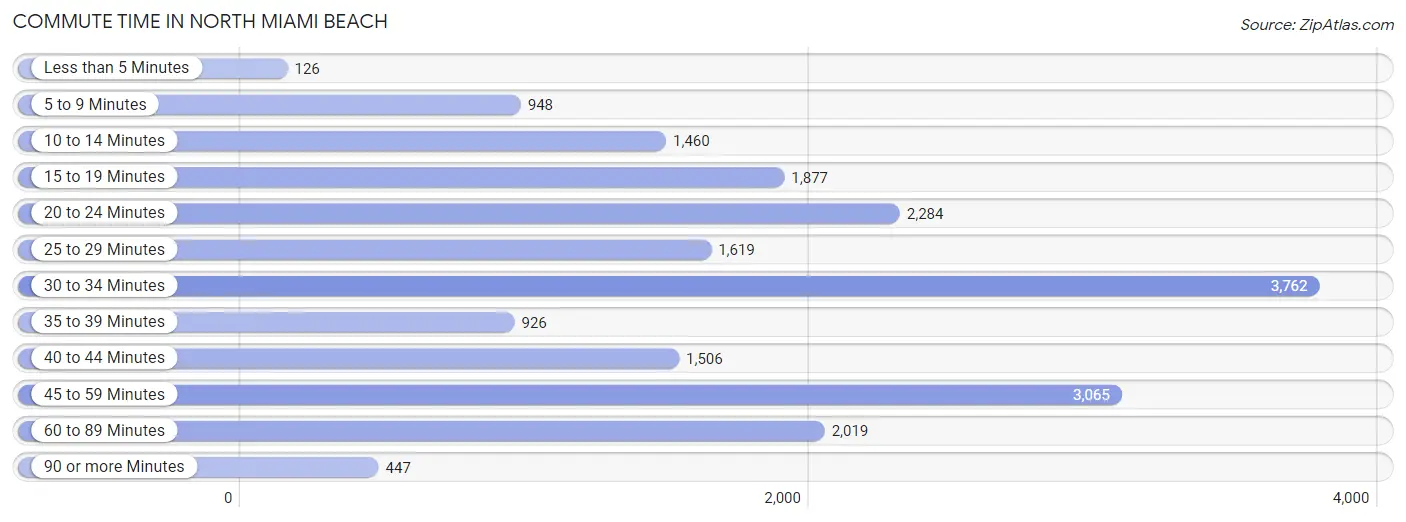
| Commute Time | # Commuters | % Commuters |
| Less than 5 Minutes | 126 | 0.6% |
| 5 to 9 Minutes | 948 | 4.7% |
| 10 to 14 Minutes | 1,460 | 7.3% |
| 15 to 19 Minutes | 1,877 | 9.4% |
| 20 to 24 Minutes | 2,284 | 11.4% |
| 25 to 29 Minutes | 1,619 | 8.1% |
| 30 to 34 Minutes | 3,762 | 18.8% |
| 35 to 39 Minutes | 926 | 4.6% |
| 40 to 44 Minutes | 1,506 | 7.5% |
| 45 to 59 Minutes | 3,065 | 15.3% |
| 60 to 89 Minutes | 2,019 | 10.1% |
| 90 or more Minutes | 447 | 2.2% |
Commute Time by Sex in North Miami Beach
The most common commute times in North Miami Beach are 30 to 34 minutes (2,295 commuters, 21.1%) for males and 30 to 34 minutes (1,467 commuters, 16.0%) for females.
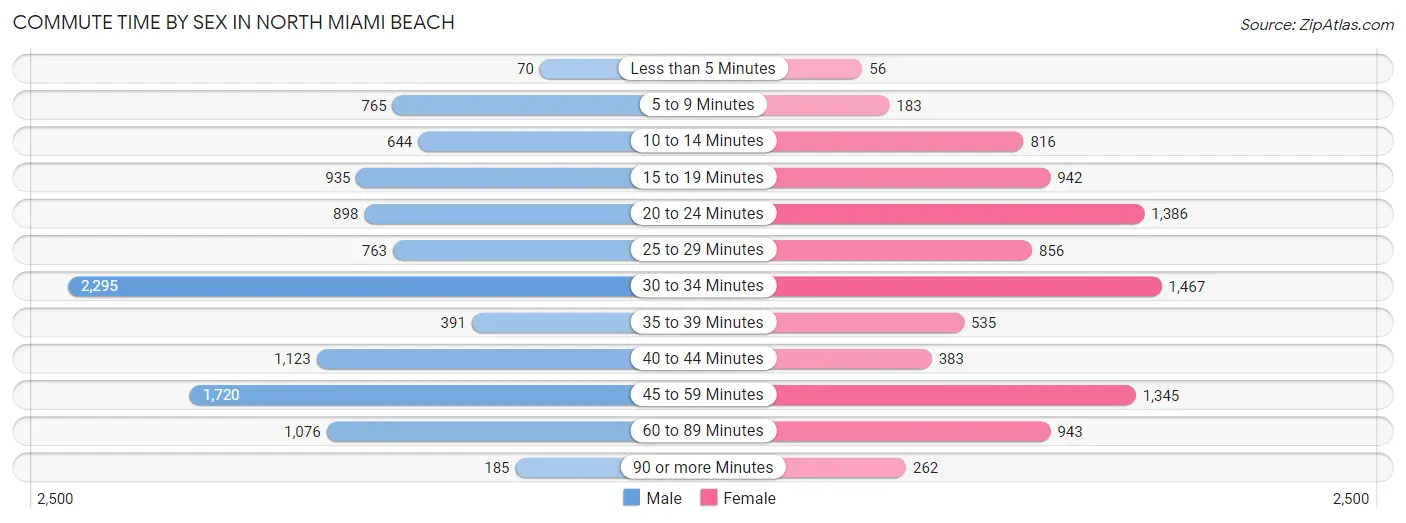
| Commute Time | Male | Female |
| Less than 5 Minutes | 70 (0.6%) | 56 (0.6%) |
| 5 to 9 Minutes | 765 (7.0%) | 183 (2.0%) |
| 10 to 14 Minutes | 644 (5.9%) | 816 (8.9%) |
| 15 to 19 Minutes | 935 (8.6%) | 942 (10.3%) |
| 20 to 24 Minutes | 898 (8.3%) | 1,386 (15.1%) |
| 25 to 29 Minutes | 763 (7.0%) | 856 (9.3%) |
| 30 to 34 Minutes | 2,295 (21.1%) | 1,467 (16.0%) |
| 35 to 39 Minutes | 391 (3.6%) | 535 (5.8%) |
| 40 to 44 Minutes | 1,123 (10.3%) | 383 (4.2%) |
| 45 to 59 Minutes | 1,720 (15.8%) | 1,345 (14.7%) |
| 60 to 89 Minutes | 1,076 (9.9%) | 943 (10.3%) |
| 90 or more Minutes | 185 (1.7%) | 262 (2.9%) |
Time of Departure to Work by Sex in North Miami Beach
The most frequent times of departure to work in North Miami Beach are 8:00 AM to 8:29 AM (1,780, 16.4%) for males and 8:00 AM to 8:29 AM (1,556, 17.0%) for females.
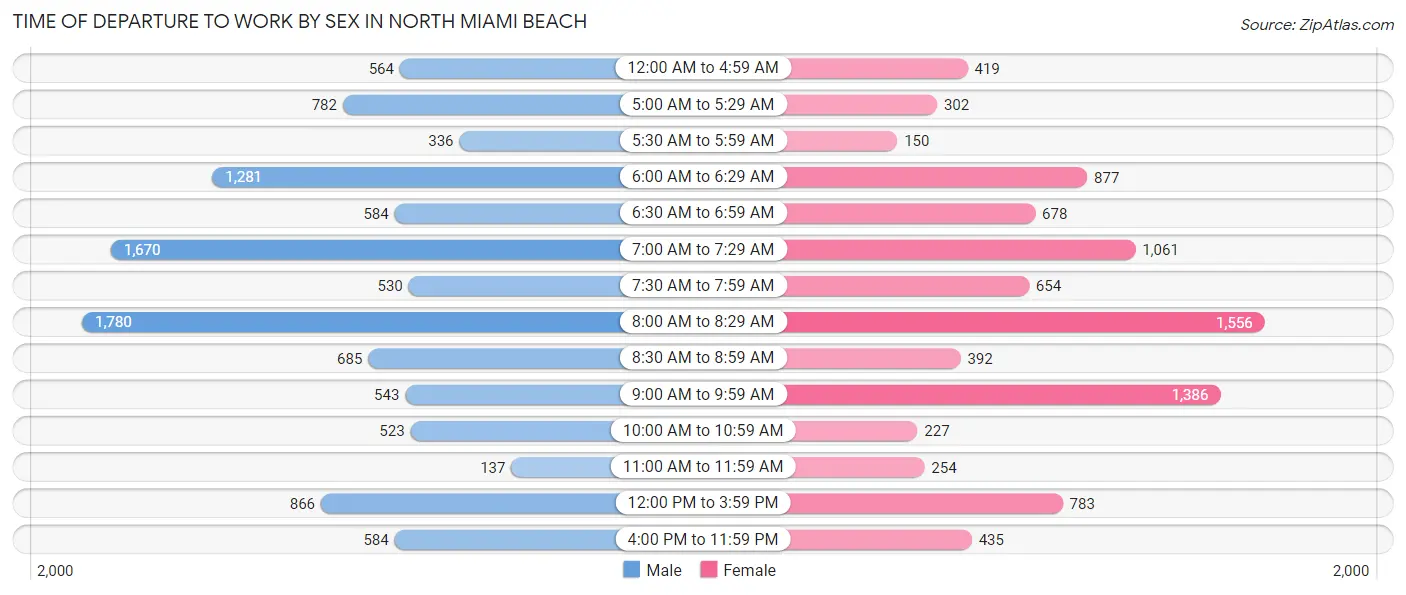
| Time of Departure | Male | Female |
| 12:00 AM to 4:59 AM | 564 (5.2%) | 419 (4.6%) |
| 5:00 AM to 5:29 AM | 782 (7.2%) | 302 (3.3%) |
| 5:30 AM to 5:59 AM | 336 (3.1%) | 150 (1.6%) |
| 6:00 AM to 6:29 AM | 1,281 (11.8%) | 877 (9.6%) |
| 6:30 AM to 6:59 AM | 584 (5.4%) | 678 (7.4%) |
| 7:00 AM to 7:29 AM | 1,670 (15.4%) | 1,061 (11.6%) |
| 7:30 AM to 7:59 AM | 530 (4.9%) | 654 (7.1%) |
| 8:00 AM to 8:29 AM | 1,780 (16.4%) | 1,556 (17.0%) |
| 8:30 AM to 8:59 AM | 685 (6.3%) | 392 (4.3%) |
| 9:00 AM to 9:59 AM | 543 (5.0%) | 1,386 (15.1%) |
| 10:00 AM to 10:59 AM | 523 (4.8%) | 227 (2.5%) |
| 11:00 AM to 11:59 AM | 137 (1.3%) | 254 (2.8%) |
| 12:00 PM to 3:59 PM | 866 (8.0%) | 783 (8.5%) |
| 4:00 PM to 11:59 PM | 584 (5.4%) | 435 (4.7%) |
| Total | 10,865 (100.0%) | 9,174 (100.0%) |
Housing Occupancy in North Miami Beach
Occupancy by Ownership in North Miami Beach
Of the total 14,899 dwellings in North Miami Beach, owner-occupied units account for 7,499 (50.3%), while renter-occupied units make up 7,400 (49.7%).
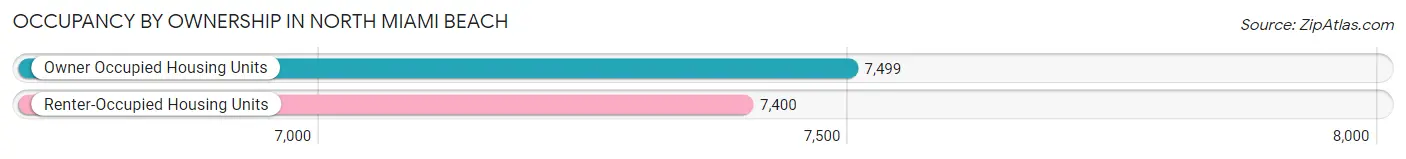
| Occupancy | # Housing Units | % Housing Units |
| Owner Occupied Housing Units | 7,499 | 50.3% |
| Renter-Occupied Housing Units | 7,400 | 49.7% |
| Total Occupied Housing Units | 14,899 | 100.0% |
Occupancy by Household Size in North Miami Beach
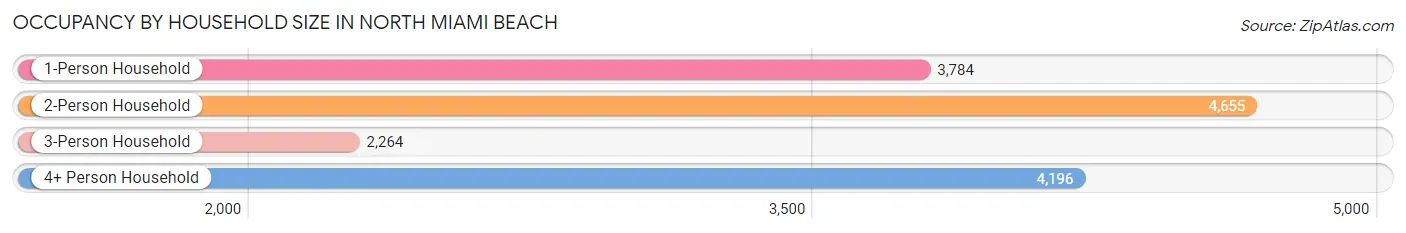
| Household Size | # Housing Units | % Housing Units |
| 1-Person Household | 3,784 | 25.4% |
| 2-Person Household | 4,655 | 31.2% |
| 3-Person Household | 2,264 | 15.2% |
| 4+ Person Household | 4,196 | 28.2% |
| Total Housing Units | 14,899 | 100.0% |
Occupancy by Ownership by Household Size in North Miami Beach
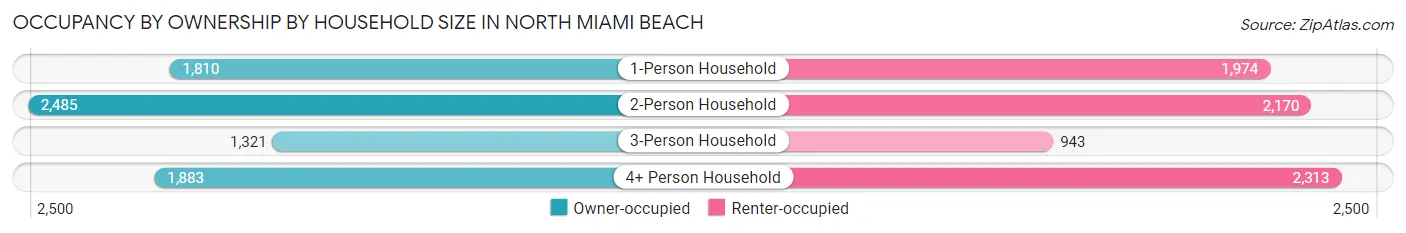
| Household Size | Owner-occupied | Renter-occupied |
| 1-Person Household | 1,810 (47.8%) | 1,974 (52.2%) |
| 2-Person Household | 2,485 (53.4%) | 2,170 (46.6%) |
| 3-Person Household | 1,321 (58.4%) | 943 (41.6%) |
| 4+ Person Household | 1,883 (44.9%) | 2,313 (55.1%) |
| Total Housing Units | 7,499 (50.3%) | 7,400 (49.7%) |
Occupancy by Educational Attainment in North Miami Beach
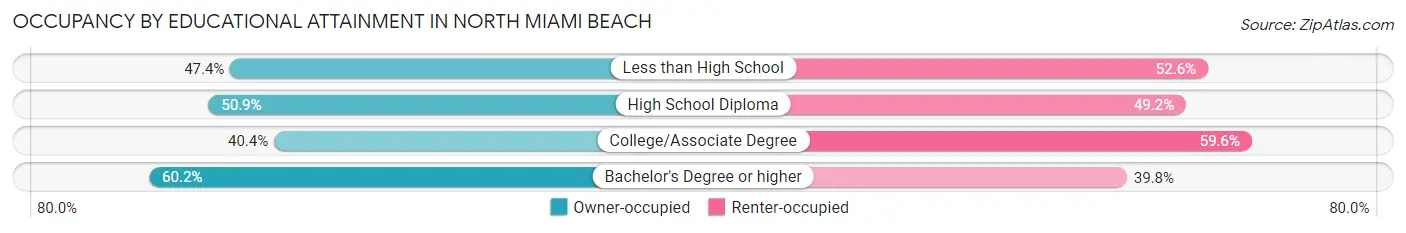
| Household Size | Owner-occupied | Renter-occupied |
| Less than High School | 870 (47.4%) | 966 (52.6%) |
| High School Diploma | 2,193 (50.8%) | 2,120 (49.1%) |
| College/Associate Degree | 1,704 (40.4%) | 2,511 (59.6%) |
| Bachelor's Degree or higher | 2,732 (60.2%) | 1,803 (39.8%) |
Occupancy by Age of Householder in North Miami Beach
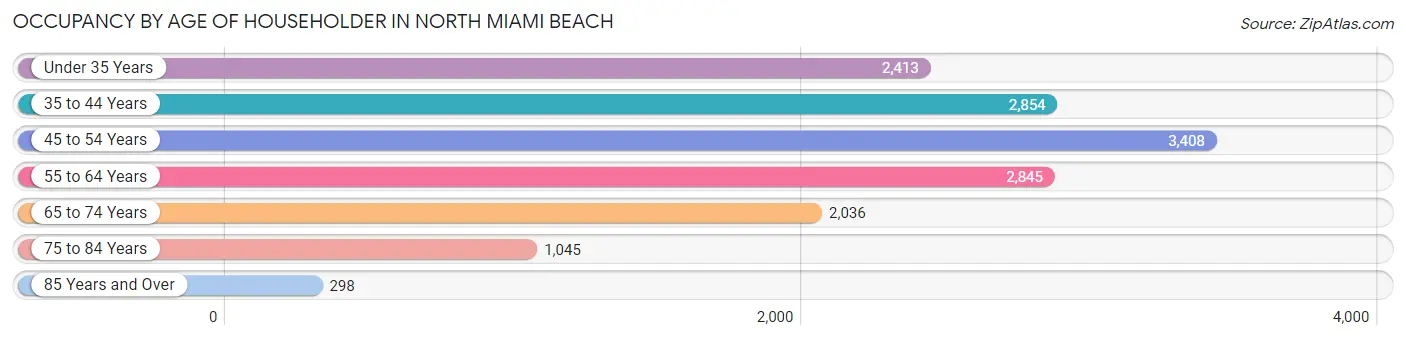
| Age Bracket | # Households | % Households |
| Under 35 Years | 2,413 | 16.2% |
| 35 to 44 Years | 2,854 | 19.2% |
| 45 to 54 Years | 3,408 | 22.9% |
| 55 to 64 Years | 2,845 | 19.1% |
| 65 to 74 Years | 2,036 | 13.7% |
| 75 to 84 Years | 1,045 | 7.0% |
| 85 Years and Over | 298 | 2.0% |
| Total | 14,899 | 100.0% |
Housing Finances in North Miami Beach
Median Income by Occupancy in North Miami Beach
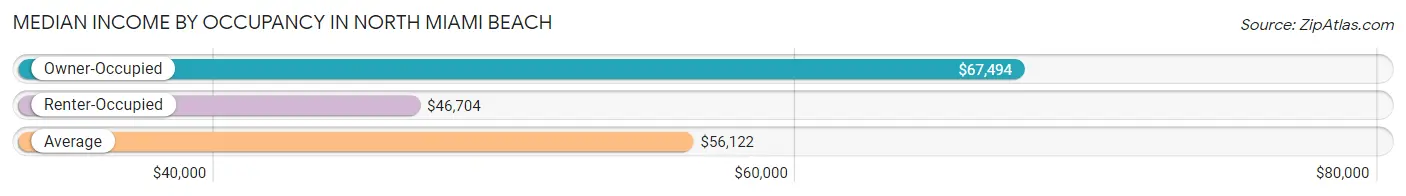
| Occupancy Type | # Households | Median Income |
| Owner-Occupied | 7,499 (50.3%) | $67,494 |
| Renter-Occupied | 7,400 (49.7%) | $46,704 |
| Average | 14,899 (100.0%) | $56,122 |
Occupancy by Householder Income Bracket in North Miami Beach
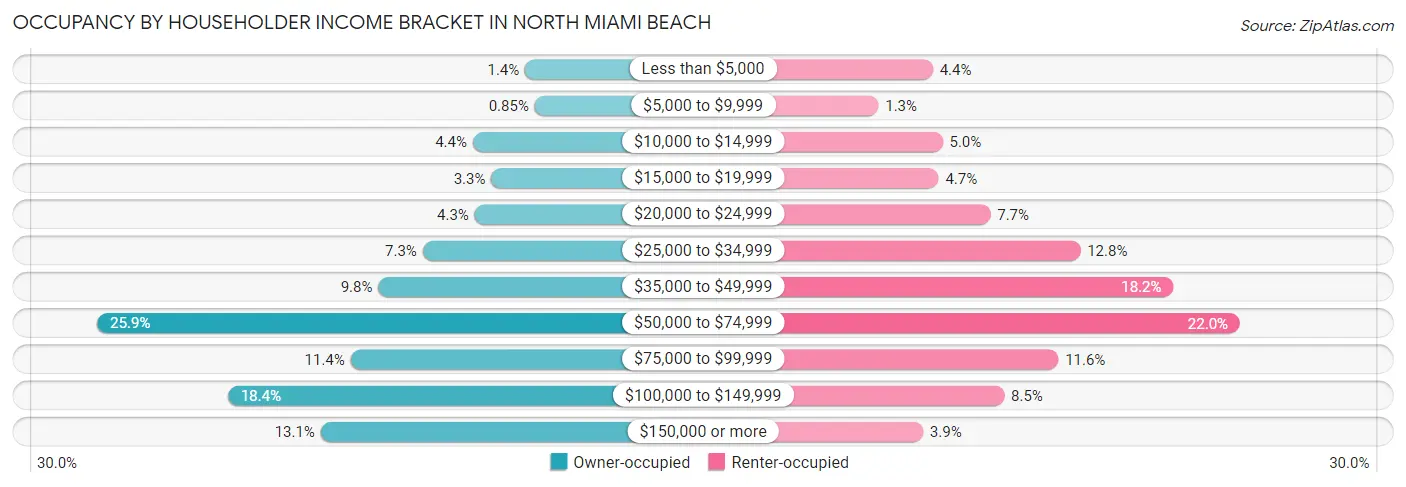
| Income Bracket | Owner-occupied | Renter-occupied |
| Less than $5,000 | 105 (1.4%) | 326 (4.4%) |
| $5,000 to $9,999 | 64 (0.9%) | 96 (1.3%) |
| $10,000 to $14,999 | 329 (4.4%) | 368 (5.0%) |
| $15,000 to $19,999 | 250 (3.3%) | 351 (4.7%) |
| $20,000 to $24,999 | 321 (4.3%) | 570 (7.7%) |
| $25,000 to $34,999 | 544 (7.2%) | 950 (12.8%) |
| $35,000 to $49,999 | 734 (9.8%) | 1,344 (18.2%) |
| $50,000 to $74,999 | 1,939 (25.9%) | 1,625 (22.0%) |
| $75,000 to $99,999 | 853 (11.4%) | 857 (11.6%) |
| $100,000 to $149,999 | 1,379 (18.4%) | 628 (8.5%) |
| $150,000 or more | 981 (13.1%) | 285 (3.8%) |
| Total | 7,499 (100.0%) | 7,400 (100.0%) |
Monthly Housing Cost Tiers in North Miami Beach
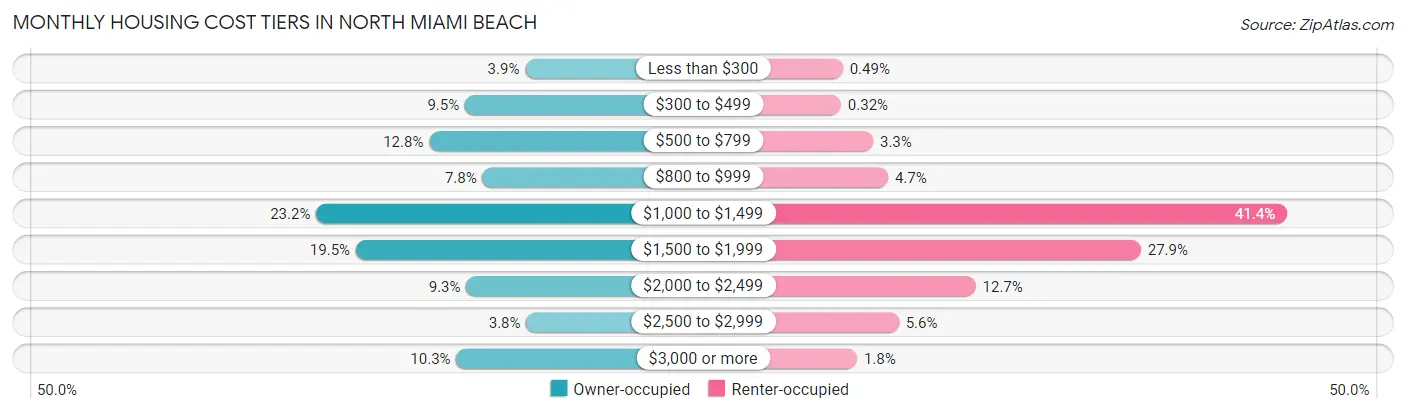
| Monthly Cost | Owner-occupied | Renter-occupied |
| Less than $300 | 293 (3.9%) | 36 (0.5%) |
| $300 to $499 | 709 (9.5%) | 24 (0.3%) |
| $500 to $799 | 956 (12.8%) | 243 (3.3%) |
| $800 to $999 | 588 (7.8%) | 344 (4.6%) |
| $1,000 to $1,499 | 1,736 (23.2%) | 3,063 (41.4%) |
| $1,500 to $1,999 | 1,462 (19.5%) | 2,067 (27.9%) |
| $2,000 to $2,499 | 700 (9.3%) | 941 (12.7%) |
| $2,500 to $2,999 | 286 (3.8%) | 417 (5.6%) |
| $3,000 or more | 769 (10.2%) | 133 (1.8%) |
| Total | 7,499 (100.0%) | 7,400 (100.0%) |
Physical Housing Characteristics in North Miami Beach
Housing Structures in North Miami Beach
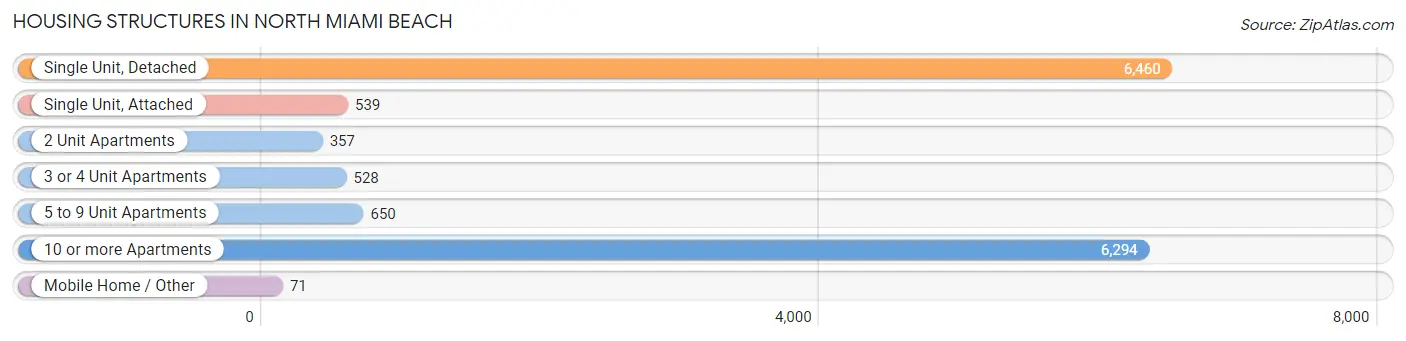
| Structure Type | # Housing Units | % Housing Units |
| Single Unit, Detached | 6,460 | 43.4% |
| Single Unit, Attached | 539 | 3.6% |
| 2 Unit Apartments | 357 | 2.4% |
| 3 or 4 Unit Apartments | 528 | 3.5% |
| 5 to 9 Unit Apartments | 650 | 4.4% |
| 10 or more Apartments | 6,294 | 42.2% |
| Mobile Home / Other | 71 | 0.5% |
| Total | 14,899 | 100.0% |
Housing Structures by Occupancy in North Miami Beach
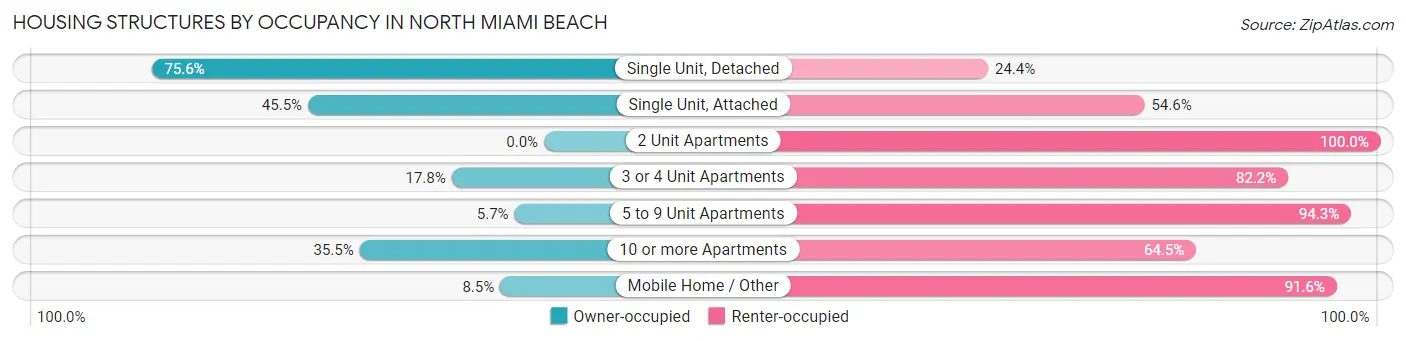
| Structure Type | Owner-occupied | Renter-occupied |
| Single Unit, Detached | 4,882 (75.6%) | 1,578 (24.4%) |
| Single Unit, Attached | 245 (45.5%) | 294 (54.5%) |
| 2 Unit Apartments | 0 (0.0%) | 357 (100.0%) |
| 3 or 4 Unit Apartments | 94 (17.8%) | 434 (82.2%) |
| 5 to 9 Unit Apartments | 37 (5.7%) | 613 (94.3%) |
| 10 or more Apartments | 2,235 (35.5%) | 4,059 (64.5%) |
| Mobile Home / Other | 6 (8.5%) | 65 (91.5%) |
| Total | 7,499 (50.3%) | 7,400 (49.7%) |
Housing Structures by Number of Rooms in North Miami Beach
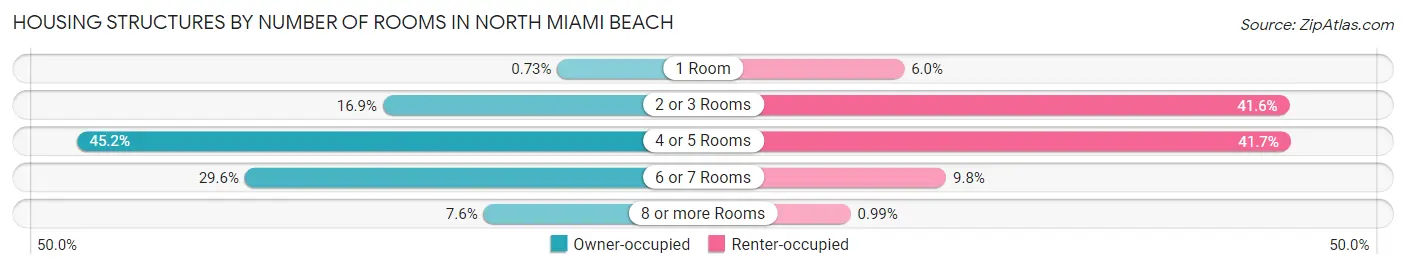
| Number of Rooms | Owner-occupied | Renter-occupied |
| 1 Room | 55 (0.7%) | 440 (5.9%) |
| 2 or 3 Rooms | 1,265 (16.9%) | 3,076 (41.6%) |
| 4 or 5 Rooms | 3,389 (45.2%) | 3,084 (41.7%) |
| 6 or 7 Rooms | 2,223 (29.6%) | 727 (9.8%) |
| 8 or more Rooms | 567 (7.6%) | 73 (1.0%) |
| Total | 7,499 (100.0%) | 7,400 (100.0%) |
Housing Structure by Heating Type in North Miami Beach
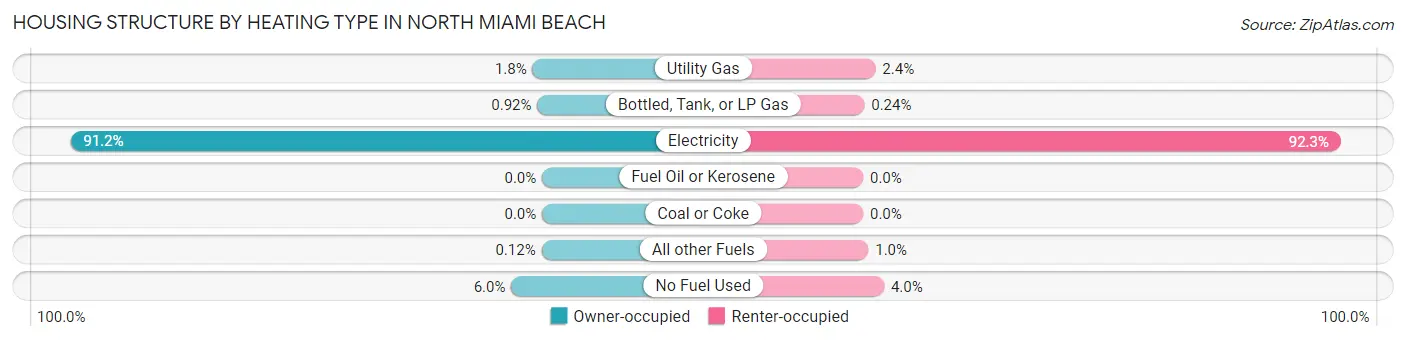
| Heating Type | Owner-occupied | Renter-occupied |
| Utility Gas | 138 (1.8%) | 177 (2.4%) |
| Bottled, Tank, or LP Gas | 69 (0.9%) | 18 (0.2%) |
| Electricity | 6,837 (91.2%) | 6,831 (92.3%) |
| Fuel Oil or Kerosene | 0 (0.0%) | 0 (0.0%) |
| Coal or Coke | 0 (0.0%) | 0 (0.0%) |
| All other Fuels | 9 (0.1%) | 75 (1.0%) |
| No Fuel Used | 446 (5.9%) | 299 (4.0%) |
| Total | 7,499 (100.0%) | 7,400 (100.0%) |
Household Vehicle Usage in North Miami Beach
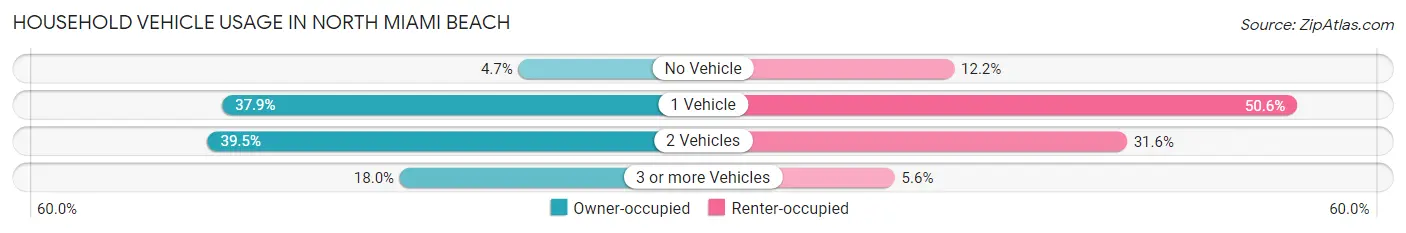
| Vehicles per Household | Owner-occupied | Renter-occupied |
| No Vehicle | 350 (4.7%) | 905 (12.2%) |
| 1 Vehicle | 2,840 (37.9%) | 3,747 (50.6%) |
| 2 Vehicles | 2,962 (39.5%) | 2,336 (31.6%) |
| 3 or more Vehicles | 1,347 (18.0%) | 412 (5.6%) |
| Total | 7,499 (100.0%) | 7,400 (100.0%) |
Real Estate & Mortgages in North Miami Beach
Real Estate and Mortgage Overview in North Miami Beach
| Characteristic | Without Mortgage | With Mortgage |
| Housing Units | 2,859 | 4,640 |
| Median Property Value | $294,500 | $284,300 |
| Median Household Income | $60,814 | $548 |
| Monthly Housing Costs | $635 | $669 |
| Real Estate Taxes | $1,604 | $61 |
Property Value by Mortgage Status in North Miami Beach
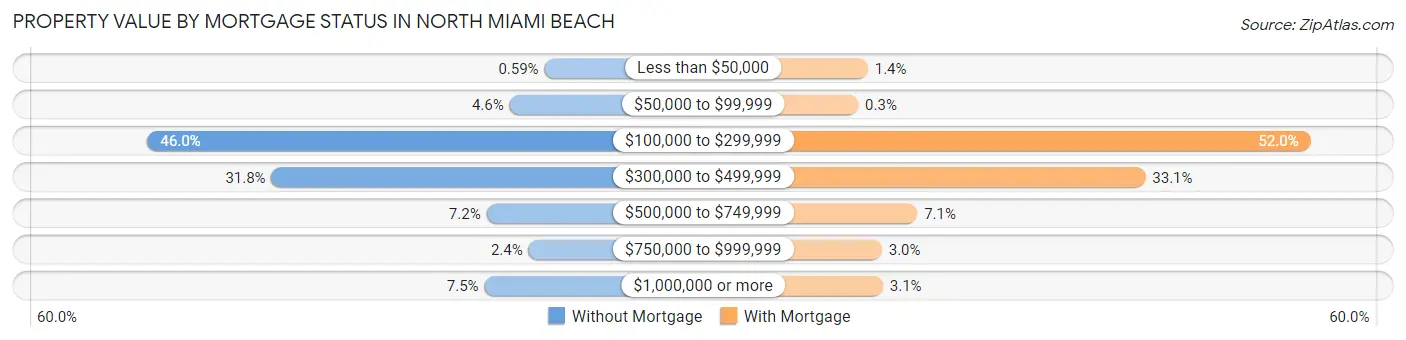
| Property Value | Without Mortgage | With Mortgage |
| Less than $50,000 | 17 (0.6%) | 65 (1.4%) |
| $50,000 to $99,999 | 131 (4.6%) | 14 (0.3%) |
| $100,000 to $299,999 | 1,314 (46.0%) | 2,413 (52.0%) |
| $300,000 to $499,999 | 909 (31.8%) | 1,537 (33.1%) |
| $500,000 to $749,999 | 206 (7.2%) | 327 (7.0%) |
| $750,000 to $999,999 | 69 (2.4%) | 139 (3.0%) |
| $1,000,000 or more | 213 (7.4%) | 145 (3.1%) |
| Total | 2,859 (100.0%) | 4,640 (100.0%) |
Household Income by Mortgage Status in North Miami Beach
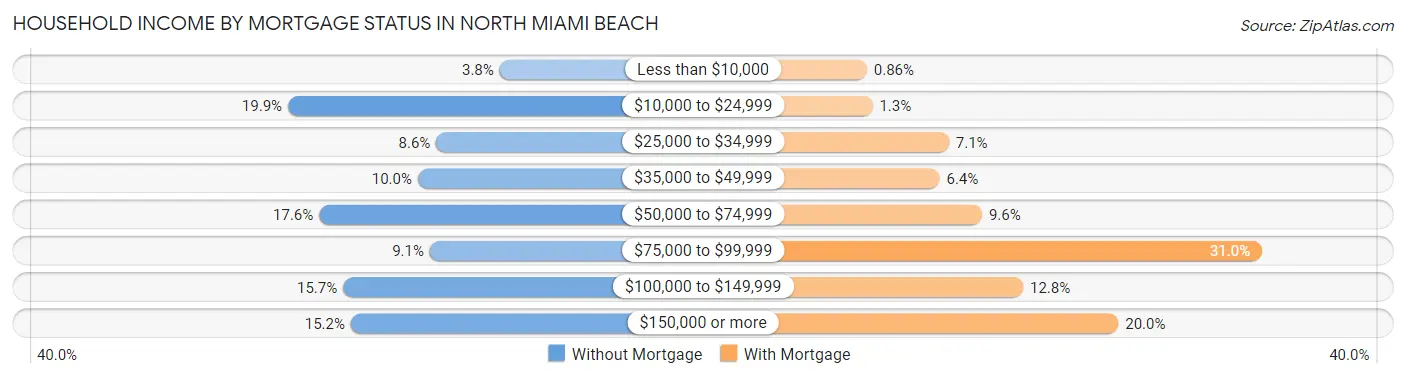
| Household Income | Without Mortgage | With Mortgage |
| Less than $10,000 | 109 (3.8%) | 40 (0.9%) |
| $10,000 to $24,999 | 570 (19.9%) | 60 (1.3%) |
| $25,000 to $34,999 | 247 (8.6%) | 330 (7.1%) |
| $35,000 to $49,999 | 287 (10.0%) | 297 (6.4%) |
| $50,000 to $74,999 | 502 (17.6%) | 447 (9.6%) |
| $75,000 to $99,999 | 261 (9.1%) | 1,437 (31.0%) |
| $100,000 to $149,999 | 450 (15.7%) | 592 (12.8%) |
| $150,000 or more | 433 (15.1%) | 929 (20.0%) |
| Total | 2,859 (100.0%) | 4,640 (100.0%) |
Property Value to Household Income Ratio in North Miami Beach
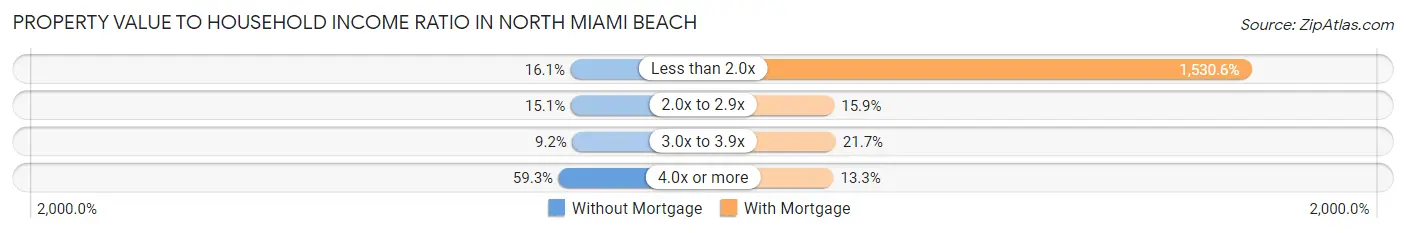
| Value-to-Income Ratio | Without Mortgage | With Mortgage |
| Less than 2.0x | 459 (16.1%) | 71,019 (1,530.6%) |
| 2.0x to 2.9x | 431 (15.1%) | 736 (15.9%) |
| 3.0x to 3.9x | 264 (9.2%) | 1,007 (21.7%) |
| 4.0x or more | 1,696 (59.3%) | 615 (13.3%) |
| Total | 2,859 (100.0%) | 4,640 (100.0%) |
Real Estate Taxes by Mortgage Status in North Miami Beach
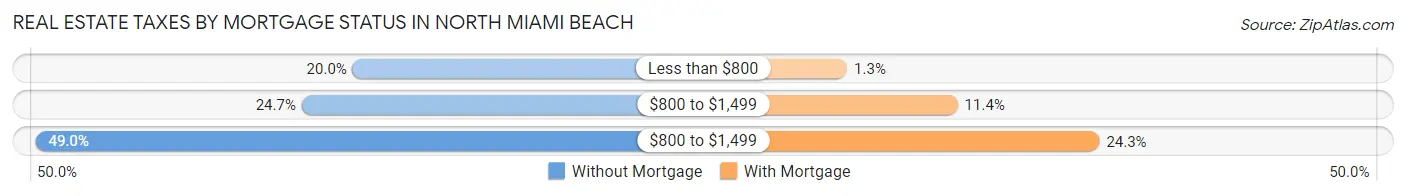
| Property Taxes | Without Mortgage | With Mortgage |
| Less than $800 | 573 (20.0%) | 60 (1.3%) |
| $800 to $1,499 | 706 (24.7%) | 528 (11.4%) |
| $800 to $1,499 | 1,401 (49.0%) | 1,129 (24.3%) |
| Total | 2,859 (100.0%) | 4,640 (100.0%) |
Health & Disability in North Miami Beach
Health Insurance Coverage by Age in North Miami Beach
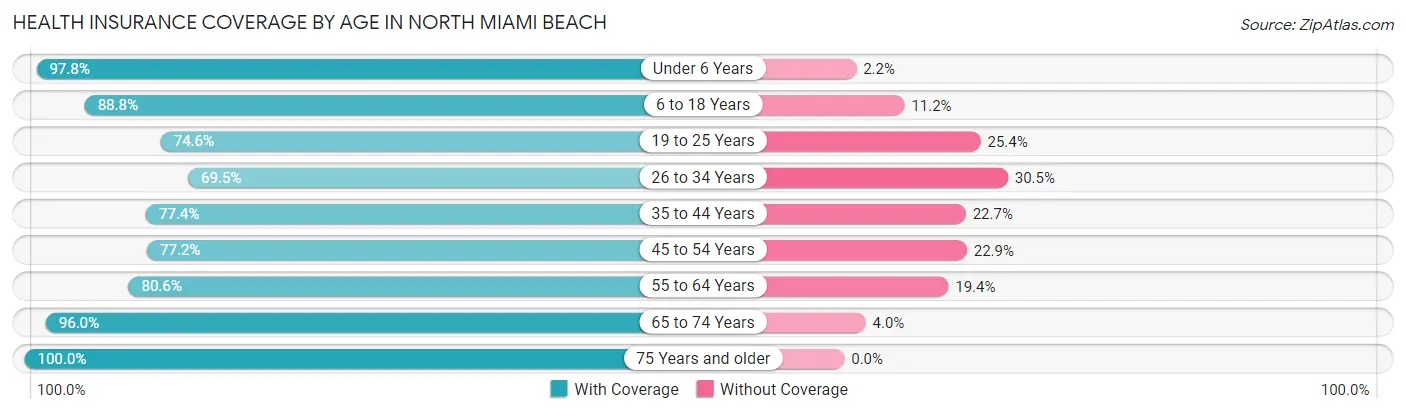
| Age Bracket | With Coverage | Without Coverage |
| Under 6 Years | 3,261 (97.8%) | 74 (2.2%) |
| 6 to 18 Years | 6,502 (88.8%) | 822 (11.2%) |
| 19 to 25 Years | 2,451 (74.6%) | 835 (25.4%) |
| 26 to 34 Years | 4,261 (69.5%) | 1,869 (30.5%) |
| 35 to 44 Years | 4,426 (77.3%) | 1,296 (22.7%) |
| 45 to 54 Years | 4,886 (77.1%) | 1,447 (22.9%) |
| 55 to 64 Years | 3,925 (80.6%) | 944 (19.4%) |
| 65 to 74 Years | 3,413 (96.0%) | 141 (4.0%) |
| 75 Years and older | 2,473 (100.0%) | 0 (0.0%) |
| Total | 35,598 (82.7%) | 7,428 (17.3%) |
Health Insurance Coverage by Citizenship Status in North Miami Beach
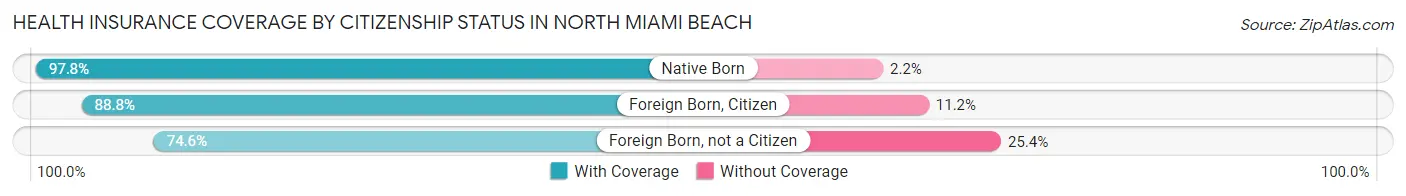
| Citizenship Status | With Coverage | Without Coverage |
| Native Born | 3,261 (97.8%) | 74 (2.2%) |
| Foreign Born, Citizen | 6,502 (88.8%) | 822 (11.2%) |
| Foreign Born, not a Citizen | 2,451 (74.6%) | 835 (25.4%) |
Health Insurance Coverage by Household Income in North Miami Beach
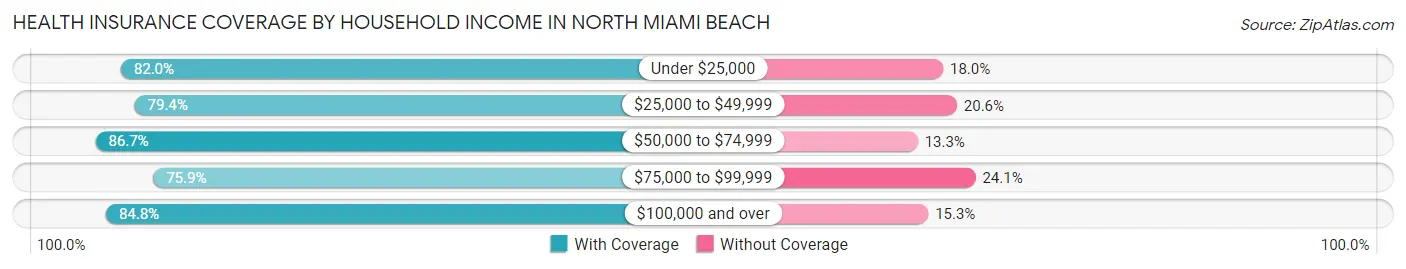
| Household Income | With Coverage | Without Coverage |
| Under $25,000 | 4,658 (82.0%) | 1,025 (18.0%) |
| $25,000 to $49,999 | 7,082 (79.4%) | 1,840 (20.6%) |
| $50,000 to $74,999 | 9,551 (86.7%) | 1,462 (13.3%) |
| $75,000 to $99,999 | 3,821 (75.9%) | 1,214 (24.1%) |
| $100,000 and over | 10,425 (84.8%) | 1,876 (15.2%) |
Public vs Private Health Insurance Coverage by Age in North Miami Beach
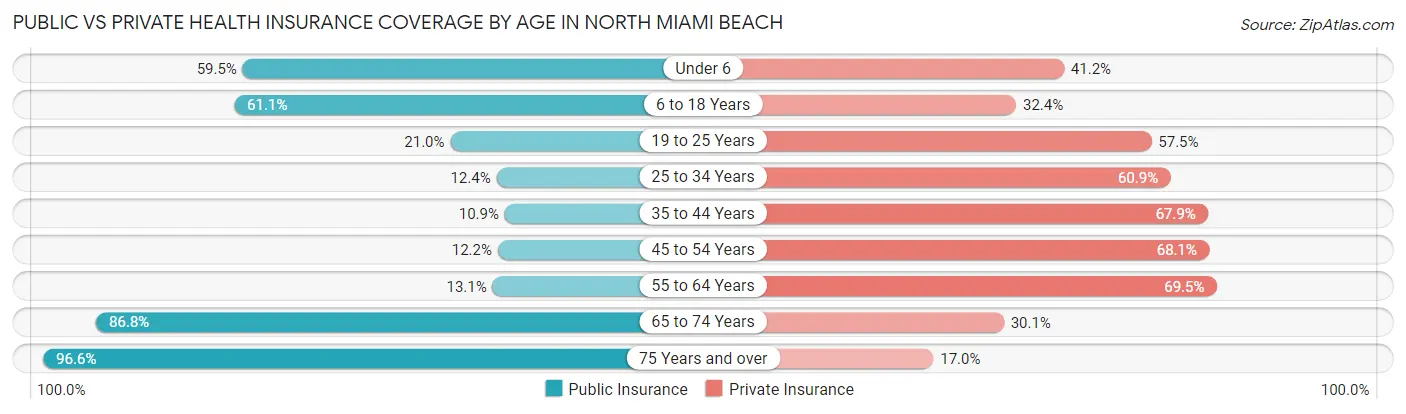
| Age Bracket | Public Insurance | Private Insurance |
| Under 6 | 1,985 (59.5%) | 1,375 (41.2%) |
| 6 to 18 Years | 4,476 (61.1%) | 2,369 (32.4%) |
| 19 to 25 Years | 689 (21.0%) | 1,888 (57.5%) |
| 25 to 34 Years | 761 (12.4%) | 3,735 (60.9%) |
| 35 to 44 Years | 622 (10.9%) | 3,886 (67.9%) |
| 45 to 54 Years | 770 (12.2%) | 4,314 (68.1%) |
| 55 to 64 Years | 640 (13.1%) | 3,385 (69.5%) |
| 65 to 74 Years | 3,083 (86.8%) | 1,068 (30.0%) |
| 75 Years and over | 2,388 (96.6%) | 420 (17.0%) |
| Total | 15,414 (35.8%) | 22,440 (52.1%) |
Disability Status by Sex by Age in North Miami Beach
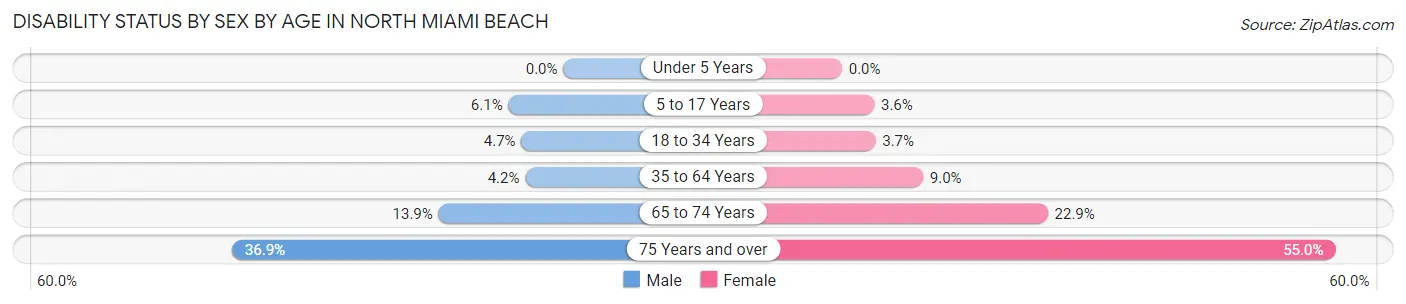
| Age Bracket | Male | Female |
| Under 5 Years | 0 (0.0%) | 0 (0.0%) |
| 5 to 17 Years | 231 (6.1%) | 130 (3.6%) |
| 18 to 34 Years | 232 (4.7%) | 184 (3.7%) |
| 35 to 64 Years | 356 (4.2%) | 770 (9.0%) |
| 65 to 74 Years | 247 (13.9%) | 407 (22.9%) |
| 75 Years and over | 327 (36.9%) | 872 (54.9%) |
Disability Class by Sex by Age in North Miami Beach
Disability Class: Hearing Difficulty
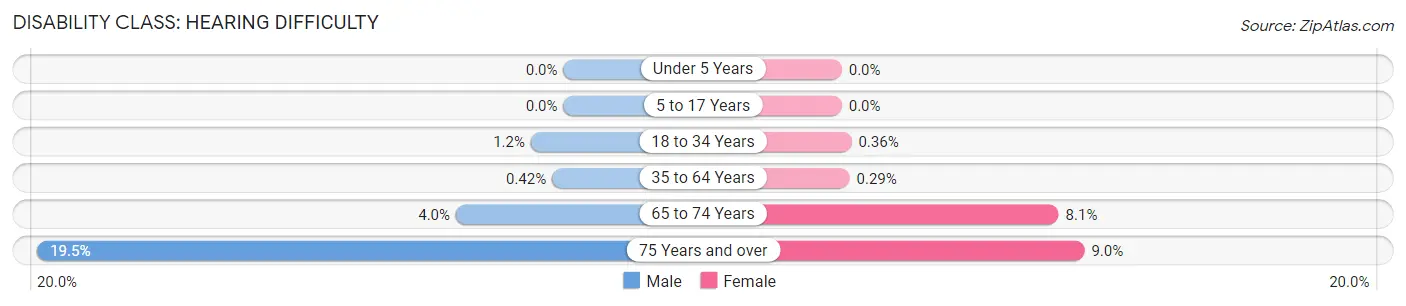
| Age Bracket | Male | Female |
| Under 5 Years | 0 (0.0%) | 0 (0.0%) |
| 5 to 17 Years | 0 (0.0%) | 0 (0.0%) |
| 18 to 34 Years | 60 (1.2%) | 18 (0.4%) |
| 35 to 64 Years | 35 (0.4%) | 25 (0.3%) |
| 65 to 74 Years | 71 (4.0%) | 143 (8.1%) |
| 75 Years and over | 173 (19.5%) | 143 (9.0%) |
Disability Class: Vision Difficulty
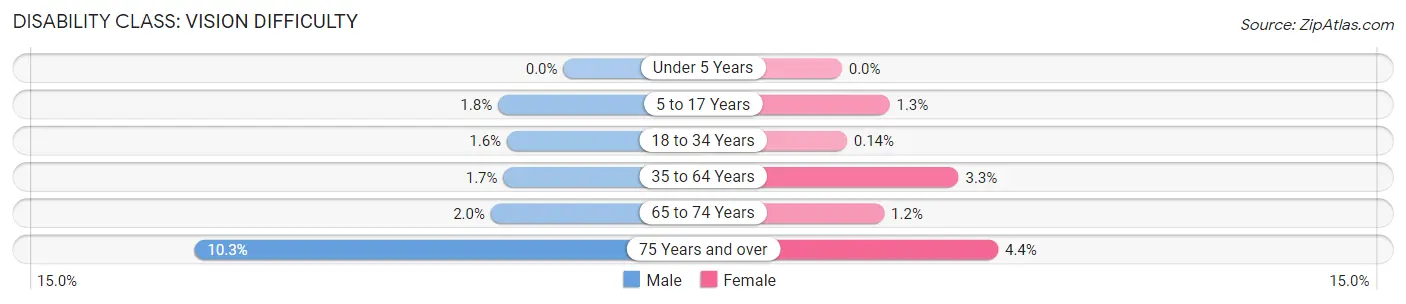
| Age Bracket | Male | Female |
| Under 5 Years | 0 (0.0%) | 0 (0.0%) |
| 5 to 17 Years | 69 (1.8%) | 48 (1.3%) |
| 18 to 34 Years | 78 (1.6%) | 7 (0.1%) |
| 35 to 64 Years | 140 (1.7%) | 277 (3.3%) |
| 65 to 74 Years | 36 (2.0%) | 21 (1.2%) |
| 75 Years and over | 91 (10.3%) | 69 (4.3%) |
Disability Class: Cognitive Difficulty
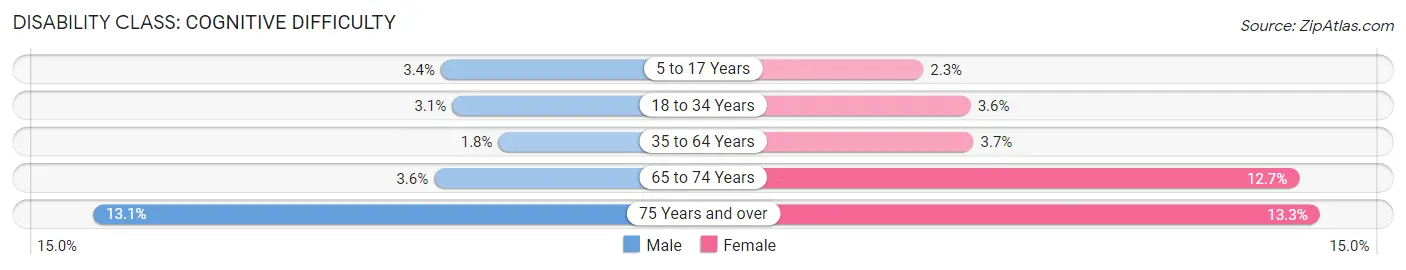
| Age Bracket | Male | Female |
| 5 to 17 Years | 129 (3.4%) | 82 (2.3%) |
| 18 to 34 Years | 154 (3.1%) | 177 (3.6%) |
| 35 to 64 Years | 152 (1.8%) | 313 (3.7%) |
| 65 to 74 Years | 64 (3.6%) | 226 (12.7%) |
| 75 Years and over | 116 (13.1%) | 211 (13.3%) |
Disability Class: Ambulatory Difficulty
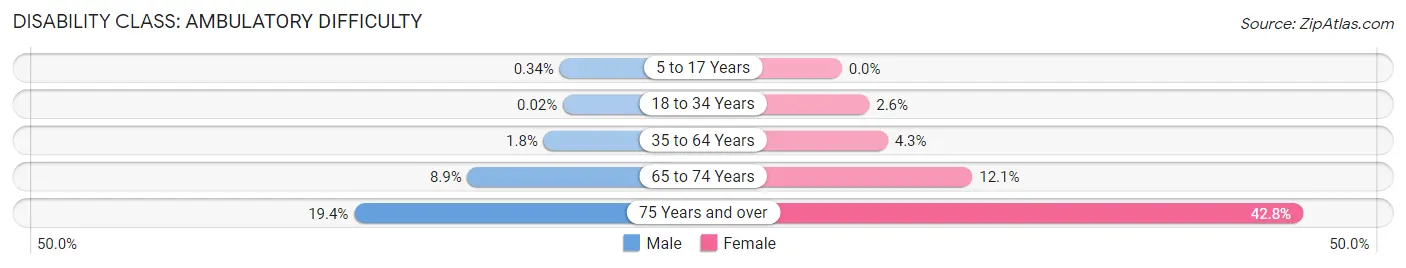
| Age Bracket | Male | Female |
| 5 to 17 Years | 13 (0.3%) | 0 (0.0%) |
| 18 to 34 Years | 1 (0.0%) | 126 (2.5%) |
| 35 to 64 Years | 153 (1.8%) | 364 (4.3%) |
| 65 to 74 Years | 158 (8.9%) | 215 (12.1%) |
| 75 Years and over | 172 (19.4%) | 679 (42.8%) |
Disability Class: Self-Care Difficulty
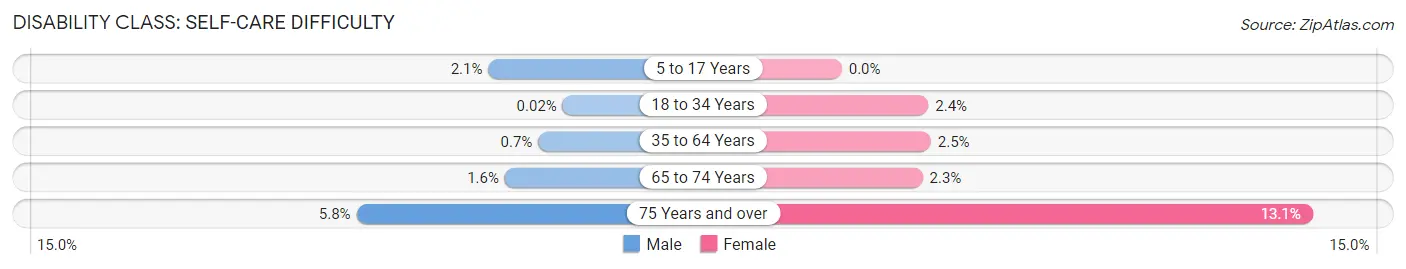
| Age Bracket | Male | Female |
| 5 to 17 Years | 79 (2.1%) | 0 (0.0%) |
| 18 to 34 Years | 1 (0.0%) | 119 (2.4%) |
| 35 to 64 Years | 59 (0.7%) | 211 (2.5%) |
| 65 to 74 Years | 29 (1.6%) | 40 (2.2%) |
| 75 Years and over | 51 (5.8%) | 208 (13.1%) |
Technology Access in North Miami Beach
Computing Device Access in North Miami Beach
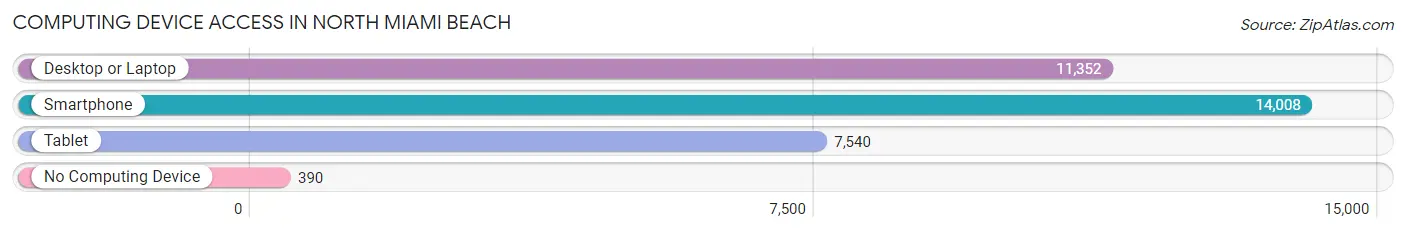
| Device Type | # Households | % Households |
| Desktop or Laptop | 11,352 | 76.2% |
| Smartphone | 14,008 | 94.0% |
| Tablet | 7,540 | 50.6% |
| No Computing Device | 390 | 2.6% |
| Total | 14,899 | 100.0% |
Internet Access in North Miami Beach
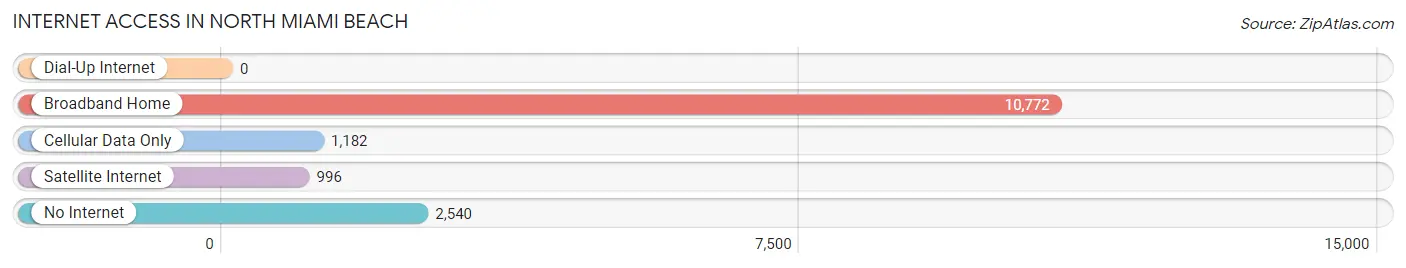
| Internet Type | # Households | % Households |
| Dial-Up Internet | 0 | 0.0% |
| Broadband Home | 10,772 | 72.3% |
| Cellular Data Only | 1,182 | 7.9% |
| Satellite Internet | 996 | 6.7% |
| No Internet | 2,540 | 17.1% |
| Total | 14,899 | 100.0% |
North Miami Beach Summary
Miami-Dade County, Florida, is home to the city of North Miami Beach, a city located in the northeastern part of the county. North Miami Beach is a diverse city with a population of 41,523 people as of the 2010 census. The city is bordered by the cities of Aventura, Miami Gardens, and Sunny Isles Beach. North Miami Beach is a vibrant city with a rich history, diverse geography, and a thriving economy.
History
North Miami Beach was originally inhabited by the Tequesta Indians, who were the first Native American tribe to inhabit the area. The Tequesta Indians were a peaceful tribe that lived in the area for centuries before the arrival of Europeans. The first Europeans to settle in the area were the Spanish, who arrived in the late 1500s. The Spanish established a mission in the area, which was later abandoned. In the late 1800s, the area was settled by homesteaders, who established farms and ranches in the area.
In the early 1900s, the area began to develop as a resort destination. The city was incorporated in 1926 and was originally known as Fulford-by-the-Sea. The city was renamed North Miami Beach in 1931. The city experienced rapid growth in the 1950s and 1960s, as many people moved to the area to take advantage of the booming economy.
Geography
North Miami Beach is located in the northeastern part of Miami-Dade County, Florida. The city is bordered by the cities of Aventura, Miami Gardens, and Sunny Isles Beach. The city is located on the Atlantic Ocean and is home to several beaches, including Haulover Beach and North Shore Open Space Park. The city is also home to several parks, including Greynolds Park and Oleta River State Park.
The city has a total area of 8.3 square miles, of which 7.9 square miles is land and 0.4 square miles is water. The city is located at an elevation of 6 feet above sea level. The city has a tropical climate, with hot and humid summers and mild winters.
Economy
North Miami Beach has a thriving economy that is driven by tourism, retail, and healthcare. The city is home to several major employers, including Baptist Health South Florida, Memorial Healthcare System, and the City of North Miami Beach. The city is also home to several shopping centers, including the Aventura Mall and the Bal Harbour Shops.
The city is also home to several major tourist attractions, including the Miami Seaquarium, the Miami Children’s Museum, and the Miami Science Museum. The city is also home to several major events, including the Miami International Boat Show and the Miami International Film Festival.
Demographics
As of the 2010 census, North Miami Beach had a population of 41,523 people. The city has a population density of 4,945 people per square mile. The racial makeup of the city is 57.3% White, 28.2% African American, 0.3% Native American, 5.2% Asian, 0.1% Pacific Islander, 4.2% from other races, and 4.7% from two or more races.
The median household income in the city is $41,945, and the median family income is $50,945. The per capita income in the city is $22,945. The city has a poverty rate of 17.3%. The city is home to several major universities, including Florida International University, Barry University, and the University of Miami.
Common Questions
What is Per Capita Income in North Miami Beach?
Per Capita income in North Miami Beach is $28,146.
What is the Median Family Income in North Miami Beach?
Median Family Income in North Miami Beach is $59,156.
What is the Median Household income in North Miami Beach?
Median Household Income in North Miami Beach is $56,122.
What is Income or Wage Gap in North Miami Beach?
Income or Wage Gap in North Miami Beach is 19.4%.
Women in North Miami Beach earn 80.6 cents for every dollar earned by a man.
What is Family Income Deficit in North Miami Beach?
Family Income Deficit in North Miami Beach is $9,578.
Families that are below poverty line in North Miami Beach earn $9,578 less on average than the poverty threshold level.
What is Inequality or Gini Index in North Miami Beach?
Inequality or Gini Index in North Miami Beach is 0.46.
What is the Total Population of North Miami Beach?
Total Population of North Miami Beach is 43,269.
What is the Total Male Population of North Miami Beach?
Total Male Population of North Miami Beach is 21,221.
What is the Total Female Population of North Miami Beach?
Total Female Population of North Miami Beach is 22,048.
What is the Ratio of Males per 100 Females in North Miami Beach?
There are 96.25 Males per 100 Females in North Miami Beach.
What is the Ratio of Females per 100 Males in North Miami Beach?
There are 103.90 Females per 100 Males in North Miami Beach.
What is the Median Population Age in North Miami Beach?
Median Population Age in North Miami Beach is 38.1 Years.
What is the Average Family Size in North Miami Beach
Average Family Size in North Miami Beach is 3.4 People.
What is the Average Household Size in North Miami Beach
Average Household Size in North Miami Beach is 2.9 People.
How Large is the Labor Force in North Miami Beach?
There are 23,306 People in the Labor Forcein in North Miami Beach.
What is the Percentage of People in the Labor Force in North Miami Beach?
67.8% of People are in the Labor Force in North Miami Beach.
What is the Unemployment Rate in North Miami Beach?
Unemployment Rate in North Miami Beach is 5.3%.