Cities with the Most Immigrants from Uruguay in Texas
RELATED REPORTS & OPTIONS
Uruguay
Texas
Compare Cities
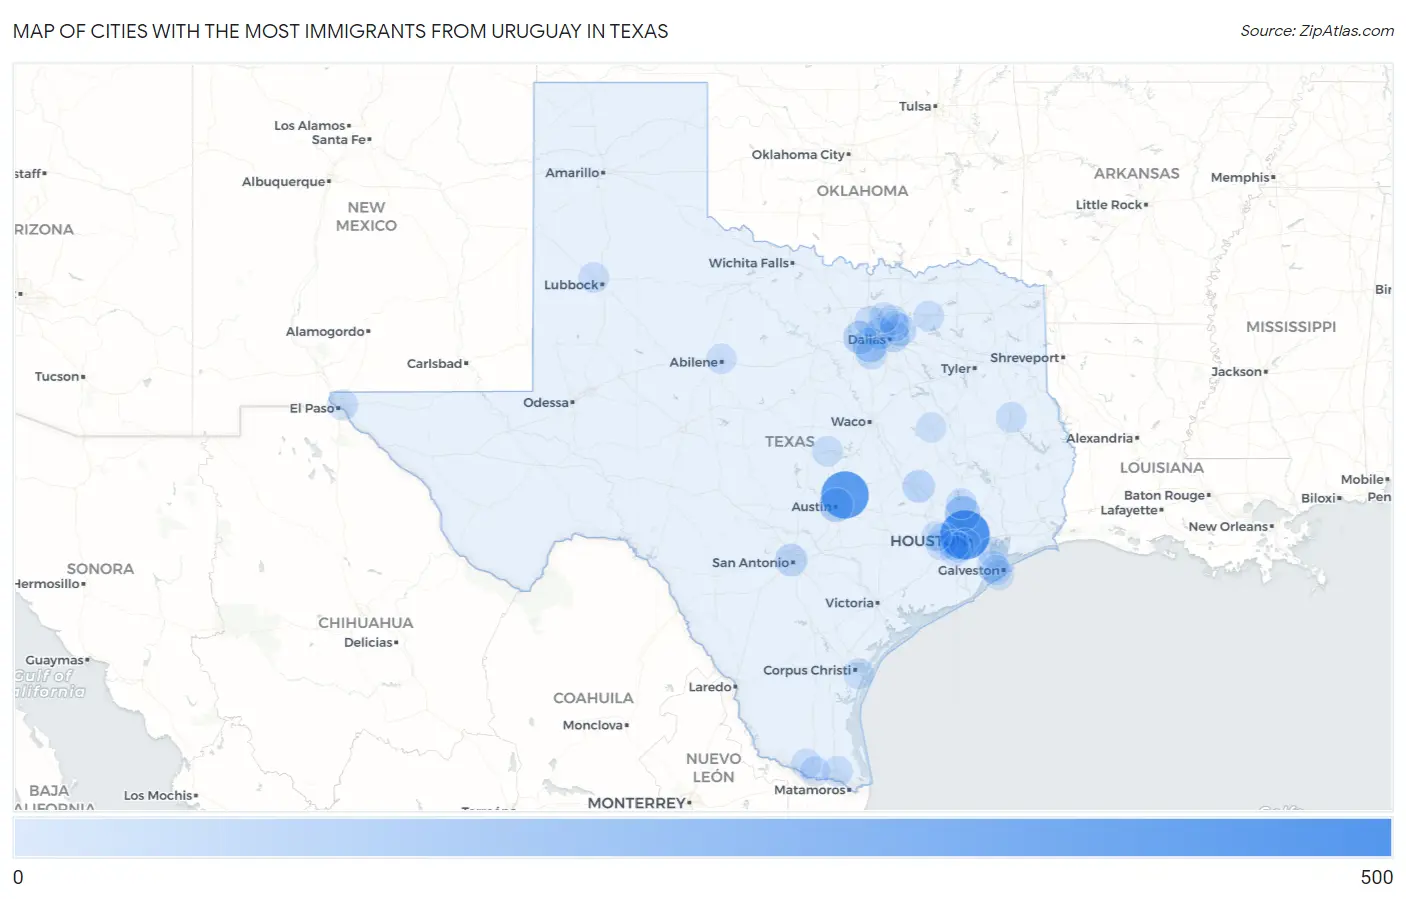
Map of Cities with the Most Immigrants from Uruguay in Texas
0
500
Cities with the Most Immigrants from Uruguay in Texas
| City | Uruguay | vs State | vs National | |
| 1. | Houston | 465 | 2,774(16.76%)#1 | 51,485(0.90%)#10 |
| 2. | Pflugerville | 412 | 2,774(14.85%)#2 | 51,485(0.80%)#13 |
| 3. | The Woodlands | 123 | 2,774(4.43%)#3 | 51,485(0.24%)#68 |
| 4. | Arlington | 97 | 2,774(3.50%)#4 | 51,485(0.19%)#94 |
| 5. | Austin | 91 | 2,774(3.28%)#5 | 51,485(0.18%)#100 |
| 6. | Fort Worth | 75 | 2,774(2.70%)#6 | 51,485(0.15%)#122 |
| 7. | College Station | 58 | 2,774(2.09%)#7 | 51,485(0.11%)#163 |
| 8. | Garland | 54 | 2,774(1.95%)#8 | 51,485(0.10%)#173 |
| 9. | San Antonio | 52 | 2,774(1.87%)#9 | 51,485(0.10%)#183 |
| 10. | Dallas | 46 | 2,774(1.66%)#10 | 51,485(0.09%)#199 |
| 11. | Katy | 34 | 2,774(1.23%)#11 | 51,485(0.07%)#273 |
| 12. | Irving | 33 | 2,774(1.19%)#12 | 51,485(0.06%)#276 |
| 13. | Mansfield | 30 | 2,774(1.08%)#13 | 51,485(0.06%)#299 |
| 14. | La Marque | 30 | 2,774(1.08%)#14 | 51,485(0.06%)#305 |
| 15. | Corpus Christi | 19 | 2,774(0.68%)#15 | 51,485(0.04%)#398 |
| 16. | El Paso | 18 | 2,774(0.65%)#16 | 51,485(0.03%)#410 |
| 17. | Flower Mound | 17 | 2,774(0.61%)#17 | 51,485(0.03%)#428 |
| 18. | Fulshear | 17 | 2,774(0.61%)#18 | 51,485(0.03%)#438 |
| 19. | Nacogdoches | 16 | 2,774(0.58%)#19 | 51,485(0.03%)#451 |
| 20. | Greenville | 15 | 2,774(0.54%)#20 | 51,485(0.03%)#464 |
| 21. | Bellaire | 15 | 2,774(0.54%)#21 | 51,485(0.03%)#469 |
| 22. | Seabrook | 15 | 2,774(0.54%)#22 | 51,485(0.03%)#470 |
| 23. | Conroe | 13 | 2,774(0.47%)#23 | 51,485(0.03%)#505 |
| 24. | Harlingen | 12 | 2,774(0.43%)#24 | 51,485(0.02%)#524 |
| 25. | Copperas Cove | 12 | 2,774(0.43%)#25 | 51,485(0.02%)#529 |
| 26. | Abilene | 11 | 2,774(0.40%)#26 | 51,485(0.02%)#548 |
| 27. | Sugar Land | 11 | 2,774(0.40%)#27 | 51,485(0.02%)#549 |
| 28. | Meadows Place | 11 | 2,774(0.40%)#28 | 51,485(0.02%)#571 |
| 29. | Shallowater | 11 | 2,774(0.40%)#29 | 51,485(0.02%)#573 |
| 30. | Plano | 10 | 2,774(0.36%)#30 | 51,485(0.02%)#576 |
| 31. | Galveston | 9 | 2,774(0.32%)#31 | 51,485(0.02%)#613 |
| 32. | Mission Bend | 9 | 2,774(0.32%)#32 | 51,485(0.02%)#615 |
| 33. | Richardson | 8 | 2,774(0.29%)#33 | 51,485(0.02%)#635 |
| 34. | The Colony | 8 | 2,774(0.29%)#34 | 51,485(0.02%)#639 |
| 35. | Mcallen | 7 | 2,774(0.25%)#35 | 51,485(0.01%)#661 |
| 36. | Alamo | 7 | 2,774(0.25%)#36 | 51,485(0.01%)#672 |
| 37. | Pattison | 5 | 2,774(0.18%)#37 | 51,485(0.01%)#722 |
| 38. | Tiki Island | 4 | 2,774(0.14%)#38 | 51,485(0.01%)#736 |
| 39. | Buffalo | 3 | 2,774(0.11%)#39 | 51,485(0.01%)#750 |
Common Questions
What are the Top 10 Cities with the Most Immigrants from Uruguay in Texas?
Top 10 Cities with the Most Immigrants from Uruguay in Texas are:
#1
465
#2
412
#3
123
#4
97
#5
91
#6
75
#7
58
#8
54
#9
52
#10
46
What city has the Most Immigrants from Uruguay in Texas?
Houston has the Most Immigrants from Uruguay in Texas with 465.
What is the Total Immigrants from Uruguay in the State of Texas?
Total Immigrants from Uruguay in Texas is 2,774.
What is the Total Immigrants from Uruguay in the United States?
Total Immigrants from Uruguay in the United States is 51,485.