Long Beach, NY Map & Demographics
Long Beach Map
Long Beach Overview
$63,853
PER CAPITA INCOME
$155,721
AVG FAMILY INCOME
$125,974
AVG HOUSEHOLD INCOME
22.5%
WAGE / INCOME GAP [ % ]
77.5¢/ $1
WAGE / INCOME GAP [ $ ]
0.41
INEQUALITY / GINI INDEX
34,734
TOTAL POPULATION
17,790
MALE POPULATION
16,944
FEMALE POPULATION
104.99
MALES / 100 FEMALES
95.24
FEMALES / 100 MALES
45.3
MEDIAN AGE
3.1
AVG FAMILY SIZE
2.4
AVG HOUSEHOLD SIZE
20,940
LABOR FORCE [ PEOPLE ]
68.4%
PERCENT IN LABOR FORCE
3.8%
UNEMPLOYMENT RATE
Long Beach Zip Codes
Long Beach Area Codes
Income in Long Beach
Income Overview in Long Beach
Per Capita Income in Long Beach is $63,853, while median incomes of families and households are $155,721 and $125,974 respectively.
| Characteristic | Number | Measure |
| Per Capita Income | 34,734 | $63,853 |
| Median Family Income | 7,805 | $155,721 |
| Mean Family Income | 7,805 | $180,862 |
| Median Household Income | 14,259 | $125,974 |
| Mean Household Income | 14,259 | $151,084 |
| Income Deficit | 7,805 | $0 |
| Wage / Income Gap (%) | 34,734 | 22.48% |
| Wage / Income Gap ($) | 34,734 | 77.52¢ per $1 |
| Gini / Inequality Index | 34,734 | 0.41 |
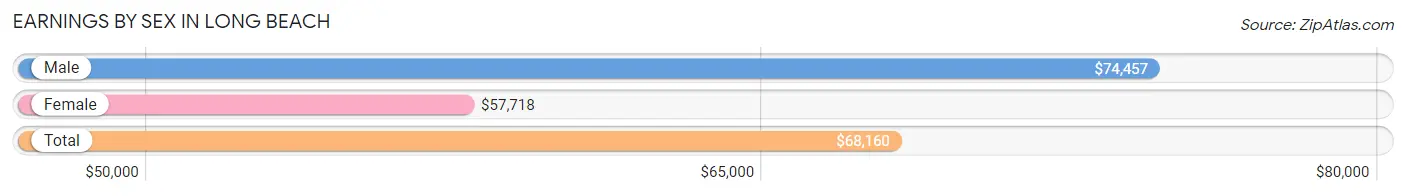
Earnings by Sex in Long Beach
Average Earnings in Long Beach are $68,160, $74,457 for men and $57,718 for women, a difference of 22.5%.
| Sex | Number | Average Earnings |
| Male | 11,325 (52.3%) | $74,457 |
| Female | 10,309 (47.6%) | $57,718 |
| Total | 21,634 (100.0%) | $68,160 |
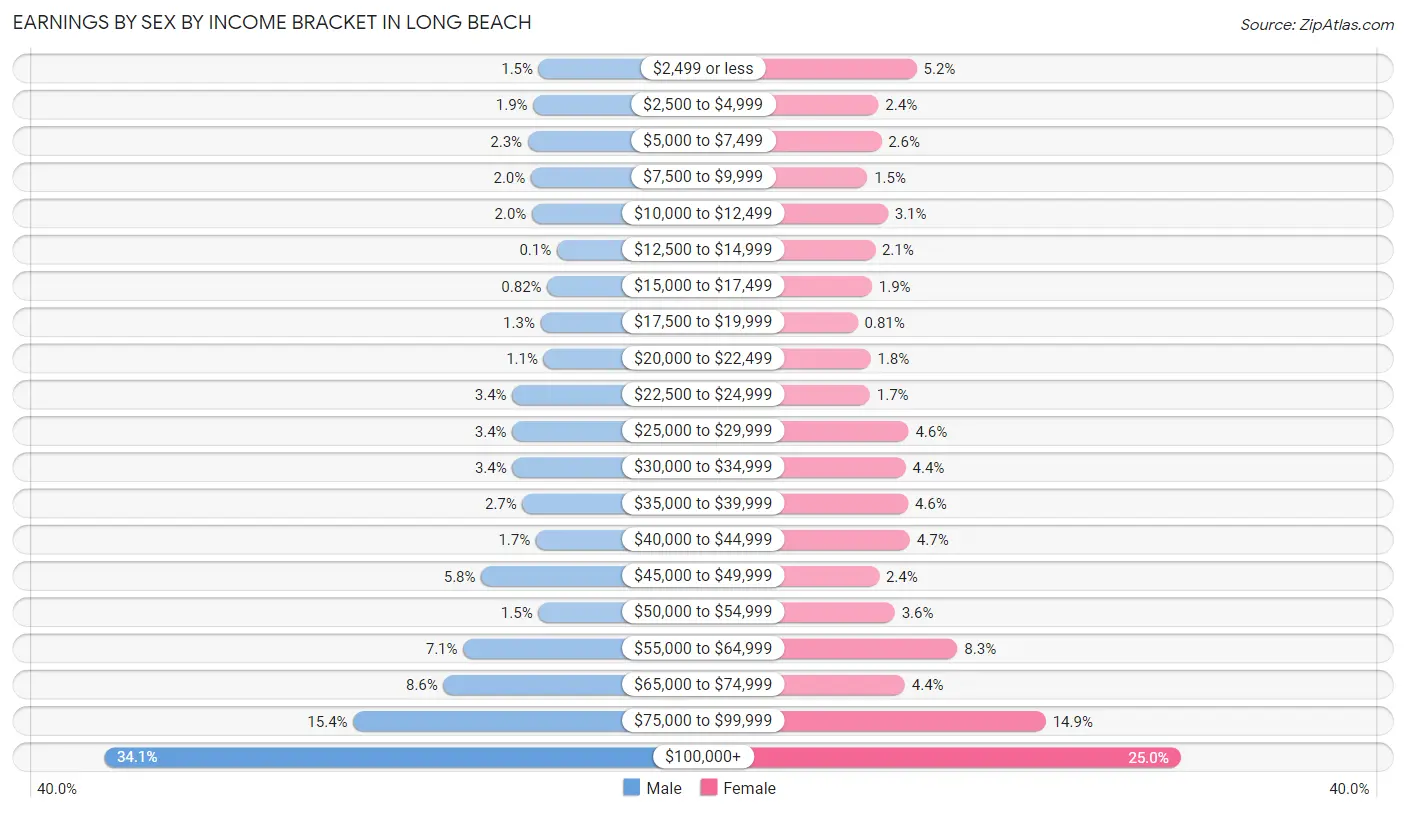
Earnings by Sex by Income Bracket in Long Beach
The most common earnings brackets in Long Beach are $100,000+ for men (3,856 | 34.1%) and $100,000+ for women (2,578 | 25.0%).
| Income | Male | Female |
| $2,499 or less | 165 (1.5%) | 539 (5.2%) |
| $2,500 to $4,999 | 212 (1.9%) | 244 (2.4%) |
| $5,000 to $7,499 | 258 (2.3%) | 266 (2.6%) |
| $7,500 to $9,999 | 231 (2.0%) | 158 (1.5%) |
| $10,000 to $12,499 | 222 (2.0%) | 316 (3.1%) |
| $12,500 to $14,999 | 11 (0.1%) | 218 (2.1%) |
| $15,000 to $17,499 | 93 (0.8%) | 194 (1.9%) |
| $17,500 to $19,999 | 149 (1.3%) | 84 (0.8%) |
| $20,000 to $22,499 | 124 (1.1%) | 184 (1.8%) |
| $22,500 to $24,999 | 390 (3.4%) | 178 (1.7%) |
| $25,000 to $29,999 | 390 (3.4%) | 476 (4.6%) |
| $30,000 to $34,999 | 389 (3.4%) | 455 (4.4%) |
| $35,000 to $39,999 | 303 (2.7%) | 473 (4.6%) |
| $40,000 to $44,999 | 189 (1.7%) | 488 (4.7%) |
| $45,000 to $49,999 | 654 (5.8%) | 248 (2.4%) |
| $50,000 to $54,999 | 169 (1.5%) | 370 (3.6%) |
| $55,000 to $64,999 | 806 (7.1%) | 855 (8.3%) |
| $65,000 to $74,999 | 974 (8.6%) | 448 (4.3%) |
| $75,000 to $99,999 | 1,740 (15.4%) | 1,537 (14.9%) |
| $100,000+ | 3,856 (34.1%) | 2,578 (25.0%) |
| Total | 11,325 (100.0%) | 10,309 (100.0%) |
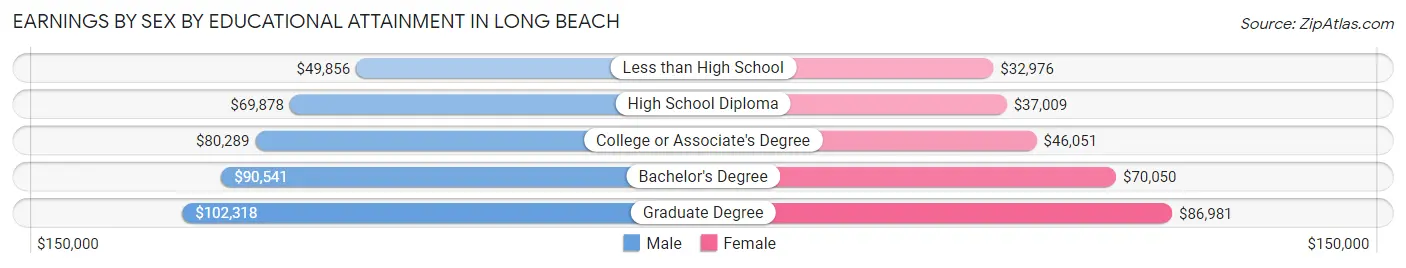
Earnings by Sex by Educational Attainment in Long Beach
Average earnings in Long Beach are $81,085 for men and $61,904 for women, a difference of 23.7%. Men with an educational attainment of graduate degree enjoy the highest average annual earnings of $102,318, while those with less than high school education earn the least with $49,856. Women with an educational attainment of graduate degree earn the most with the average annual earnings of $86,981, while those with less than high school education have the smallest earnings of $32,976.
| Educational Attainment | Male Income | Female Income |
| Less than High School | $49,856 | $32,976 |
| High School Diploma | $69,878 | $37,009 |
| College or Associate's Degree | $80,289 | $46,051 |
| Bachelor's Degree | $90,541 | $70,050 |
| Graduate Degree | $102,318 | $86,981 |
| Total | $81,085 | $61,904 |
Family Income in Long Beach
Family Income Brackets in Long Beach
According to the Long Beach family income data, there are 2,755 families falling into the $200,000+ income range, which is the most common income bracket and makes up 35.3% of all families. Conversely, the $10,000 to $14,999 income bracket is the least frequent group with only 39 families (0.5%) belonging to this category.
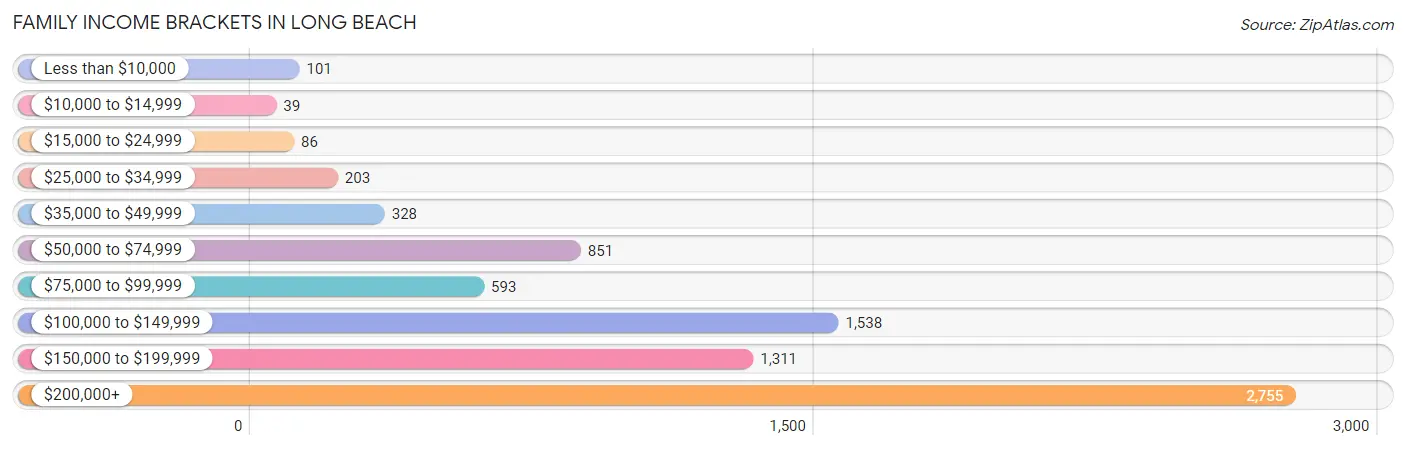
| Income Bracket | # Families | % Families |
| Less than $10,000 | 101 | 1.3% |
| $10,000 to $14,999 | 39 | 0.5% |
| $15,000 to $24,999 | 86 | 1.1% |
| $25,000 to $34,999 | 203 | 2.6% |
| $35,000 to $49,999 | 328 | 4.2% |
| $50,000 to $74,999 | 851 | 10.9% |
| $75,000 to $99,999 | 593 | 7.6% |
| $100,000 to $149,999 | 1,538 | 19.7% |
| $150,000 to $199,999 | 1,311 | 16.8% |
| $200,000+ | 2,755 | 35.3% |
Family Income by Famaliy Size in Long Beach
7+ person families (160 | 2.1%) account for the highest median family income in Long Beach with $228,929 per family, while 2-person families (3,608 | 46.2%) have the highest median income of $66,212 per family member.
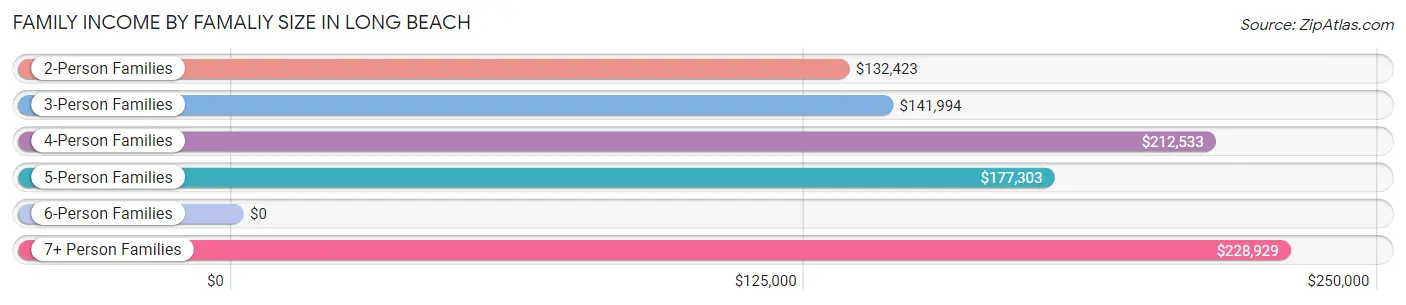
| Income Bracket | # Families | Median Income |
| 2-Person Families | 3,608 (46.2%) | $132,423 |
| 3-Person Families | 2,187 (28.0%) | $141,994 |
| 4-Person Families | 1,107 (14.2%) | $212,533 |
| 5-Person Families | 582 (7.5%) | $177,303 |
| 6-Person Families | 161 (2.1%) | $0 |
| 7+ Person Families | 160 (2.1%) | $228,929 |
| Total | 7,805 (100.0%) | $155,721 |
Family Income by Number of Earners in Long Beach
The median family income in Long Beach is $155,721, with families comprising 3+ earners (1,156) having the highest median family income of $214,844, while families with no earners (888) have the lowest median family income of $69,669, accounting for 14.8% and 11.4% of families, respectively.
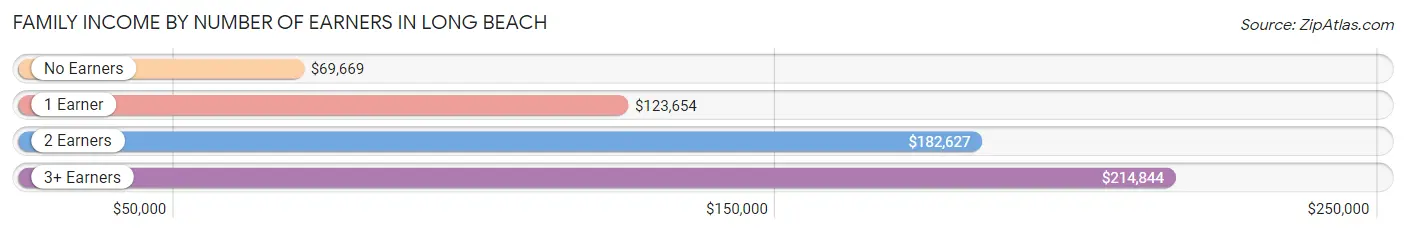
| Number of Earners | # Families | Median Income |
| No Earners | 888 (11.4%) | $69,669 |
| 1 Earner | 2,130 (27.3%) | $123,654 |
| 2 Earners | 3,631 (46.5%) | $182,627 |
| 3+ Earners | 1,156 (14.8%) | $214,844 |
| Total | 7,805 (100.0%) | $155,721 |
Household Income in Long Beach
Household Income Brackets in Long Beach
With 3,779 households falling in the category, the $200,000+ income range is the most frequent in Long Beach, accounting for 26.5% of all households. In contrast, only 242 households (1.7%) fall into the less than $10,000 income bracket, making it the least populous group.
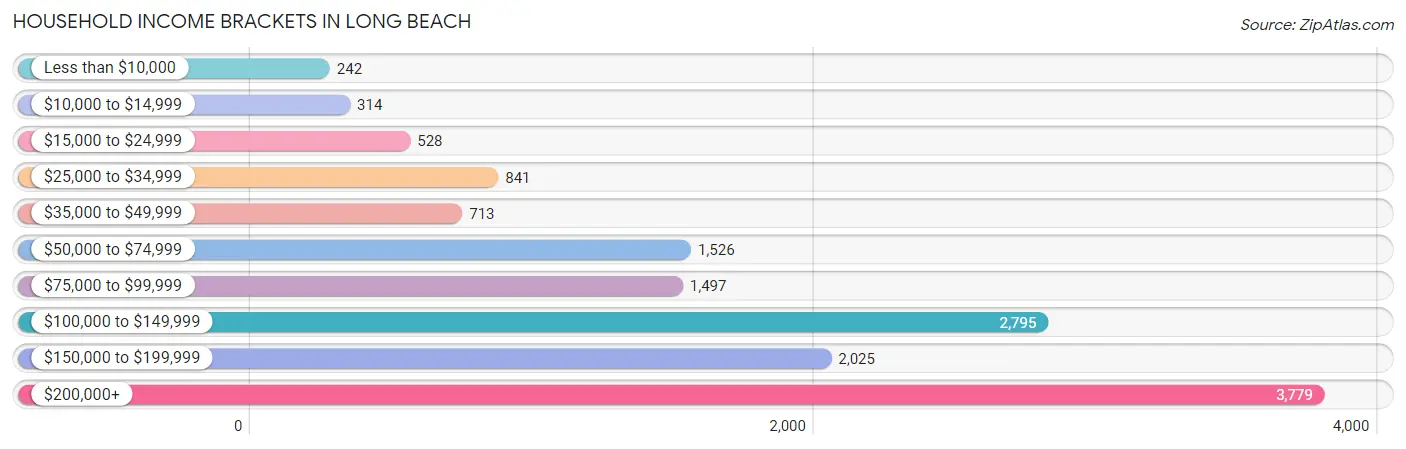
| Income Bracket | # Households | % Households |
| Less than $10,000 | 242 | 1.7% |
| $10,000 to $14,999 | 314 | 2.2% |
| $15,000 to $24,999 | 528 | 3.7% |
| $25,000 to $34,999 | 841 | 5.9% |
| $35,000 to $49,999 | 713 | 5.0% |
| $50,000 to $74,999 | 1,526 | 10.7% |
| $75,000 to $99,999 | 1,497 | 10.5% |
| $100,000 to $149,999 | 2,795 | 19.6% |
| $150,000 to $199,999 | 2,025 | 14.2% |
| $200,000+ | 3,779 | 26.5% |
Household Income by Householder Age in Long Beach
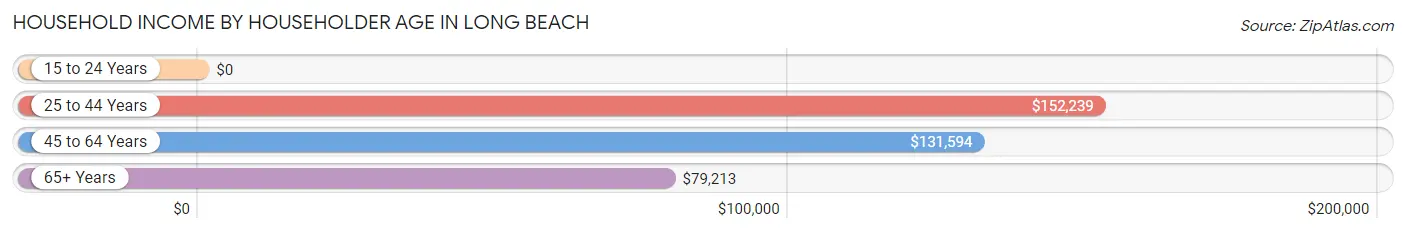
The median household income in Long Beach is $125,974, with the highest median household income of $152,239 found in the 25 to 44 years age bracket for the primary householder. A total of 4,159 households (29.2%) fall into this category. Meanwhile, the 15 to 24 years age bracket for the primary householder has the lowest median household income of $0, with 132 households (0.9%) in this group.
| Income Bracket | # Households | Median Income |
| 15 to 24 Years | 132 (0.9%) | $0 |
| 25 to 44 Years | 4,159 (29.2%) | $152,239 |
| 45 to 64 Years | 5,817 (40.8%) | $131,594 |
| 65+ Years | 4,151 (29.1%) | $79,213 |
| Total | 14,259 (100.0%) | $125,974 |
Poverty in Long Beach
Income Below Poverty by Sex and Age in Long Beach
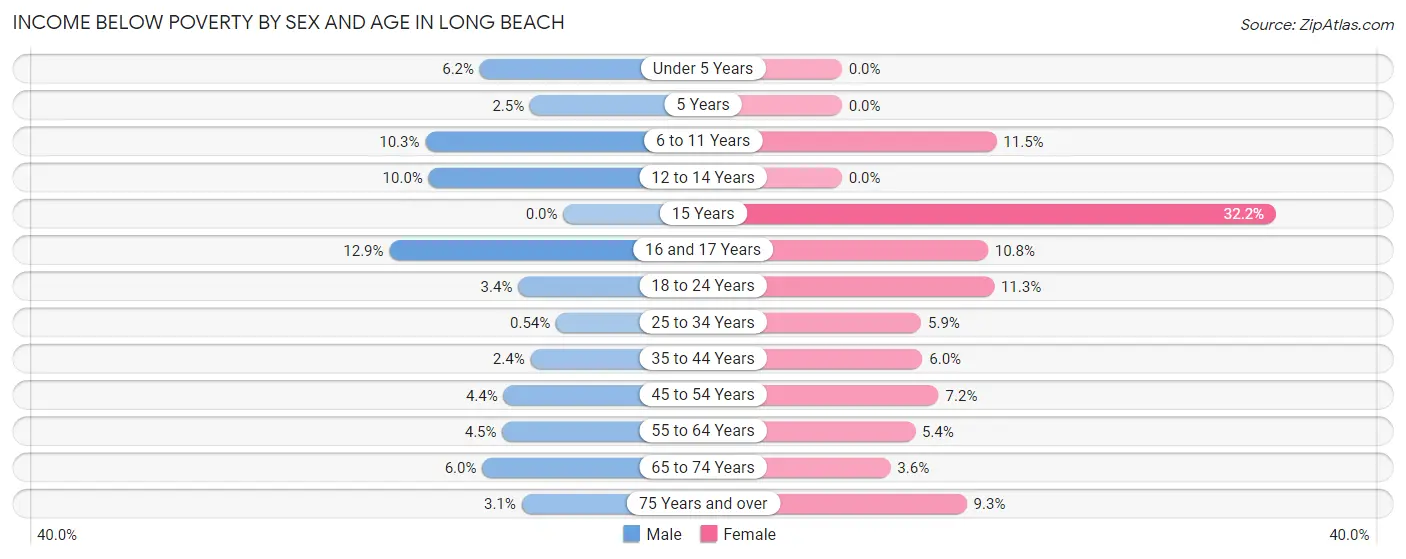
With 4.1% poverty level for males and 6.5% for females among the residents of Long Beach, 16 and 17 year old males and 15 year old females are the most vulnerable to poverty, with 35 males (12.9%) and 39 females (32.2%) in their respective age groups living below the poverty level.
| Age Bracket | Male | Female |
| Under 5 Years | 55 (6.2%) | 0 (0.0%) |
| 5 Years | 4 (2.5%) | 0 (0.0%) |
| 6 to 11 Years | 74 (10.2%) | 56 (11.5%) |
| 12 to 14 Years | 55 (10.0%) | 0 (0.0%) |
| 15 Years | 0 (0.0%) | 39 (32.2%) |
| 16 and 17 Years | 35 (12.9%) | 36 (10.8%) |
| 18 to 24 Years | 34 (3.4%) | 119 (11.3%) |
| 25 to 34 Years | 18 (0.5%) | 162 (5.9%) |
| 35 to 44 Years | 51 (2.4%) | 119 (6.0%) |
| 45 to 54 Years | 92 (4.4%) | 160 (7.2%) |
| 55 to 64 Years | 138 (4.5%) | 159 (5.4%) |
| 65 to 74 Years | 114 (6.0%) | 69 (3.6%) |
| 75 Years and over | 31 (3.1%) | 152 (9.3%) |
| Total | 701 (4.1%) | 1,071 (6.5%) |
Income Above Poverty by Sex and Age in Long Beach
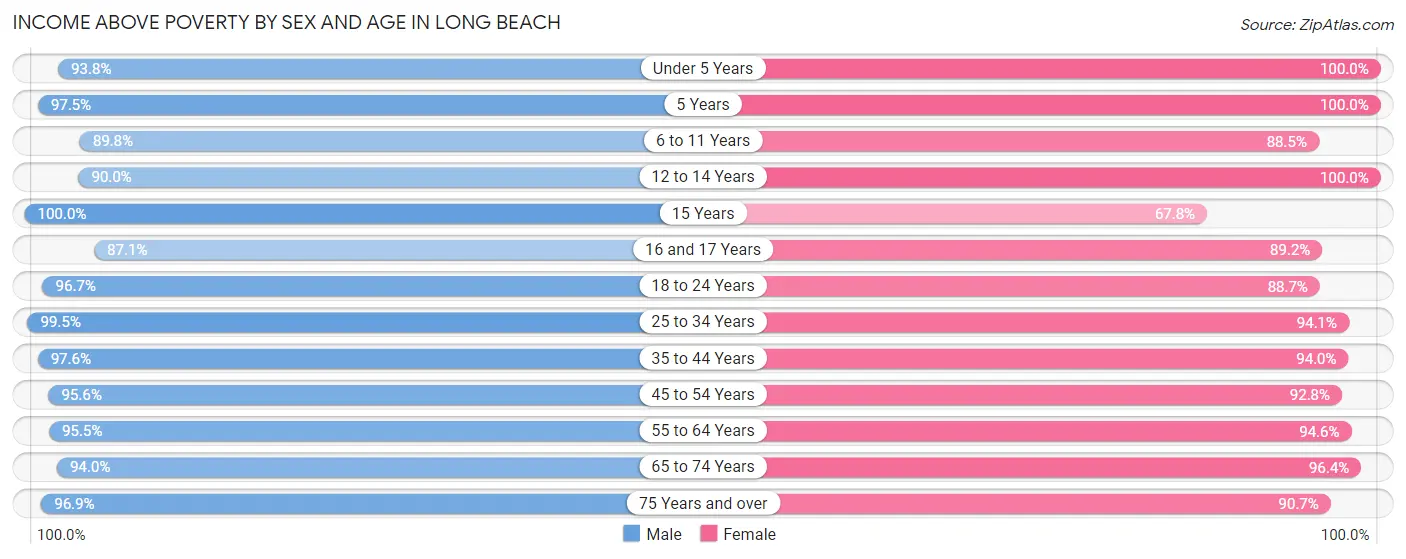
According to the poverty statistics in Long Beach, males aged 15 years and females aged under 5 years are the age groups that are most secure financially, with 100.0% of males and 100.0% of females in these age groups living above the poverty line.
| Age Bracket | Male | Female |
| Under 5 Years | 832 (93.8%) | 608 (100.0%) |
| 5 Years | 158 (97.5%) | 127 (100.0%) |
| 6 to 11 Years | 648 (89.7%) | 432 (88.5%) |
| 12 to 14 Years | 495 (90.0%) | 302 (100.0%) |
| 15 Years | 97 (100.0%) | 82 (67.8%) |
| 16 and 17 Years | 236 (87.1%) | 296 (89.2%) |
| 18 to 24 Years | 981 (96.7%) | 934 (88.7%) |
| 25 to 34 Years | 3,316 (99.5%) | 2,588 (94.1%) |
| 35 to 44 Years | 2,039 (97.6%) | 1,870 (94.0%) |
| 45 to 54 Years | 1,981 (95.6%) | 2,066 (92.8%) |
| 55 to 64 Years | 2,906 (95.5%) | 2,771 (94.6%) |
| 65 to 74 Years | 1,780 (94.0%) | 1,841 (96.4%) |
| 75 Years and over | 969 (96.9%) | 1,488 (90.7%) |
| Total | 16,438 (95.9%) | 15,405 (93.5%) |
Income Below Poverty Among Married-Couple Families in Long Beach
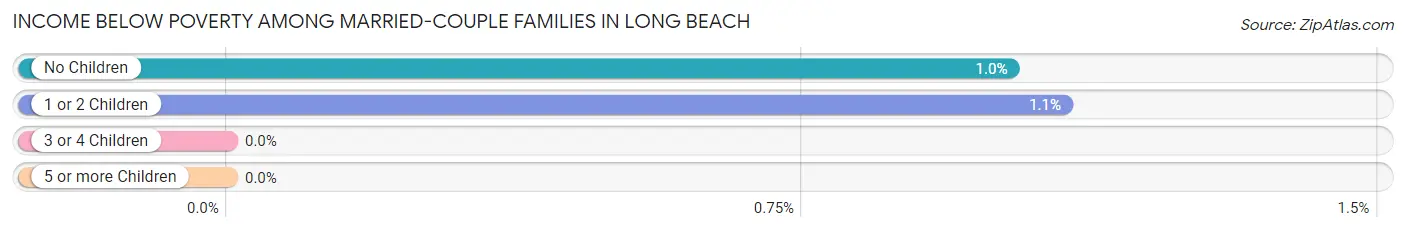
The poverty statistics for married-couple families in Long Beach show that 1.0% or 61 of the total 5,996 families live below the poverty line. Families with 1 or 2 children have the highest poverty rate of 1.1%, comprising of 20 families. On the other hand, families with 3 or 4 children have the lowest poverty rate of 0.0%, which includes 0 families.
| Children | Above Poverty | Below Poverty |
| No Children | 3,976 (99.0%) | 41 (1.0%) |
| 1 or 2 Children | 1,810 (98.9%) | 20 (1.1%) |
| 3 or 4 Children | 148 (100.0%) | 0 (0.0%) |
| 5 or more Children | 1 (100.0%) | 0 (0.0%) |
| Total | 5,935 (99.0%) | 61 (1.0%) |
Income Below Poverty Among Single-Parent Households in Long Beach
According to the poverty data in Long Beach, 4.8% or 25 single-father households and 13.1% or 169 single-mother households are living below the poverty line. Among single-father households, those with 1 or 2 children have the highest poverty rate, with 9 households (5.6%) experiencing poverty. Likewise, among single-mother households, those with 3 or 4 children have the highest poverty rate, with 40 households (37.0%) falling below the poverty line.
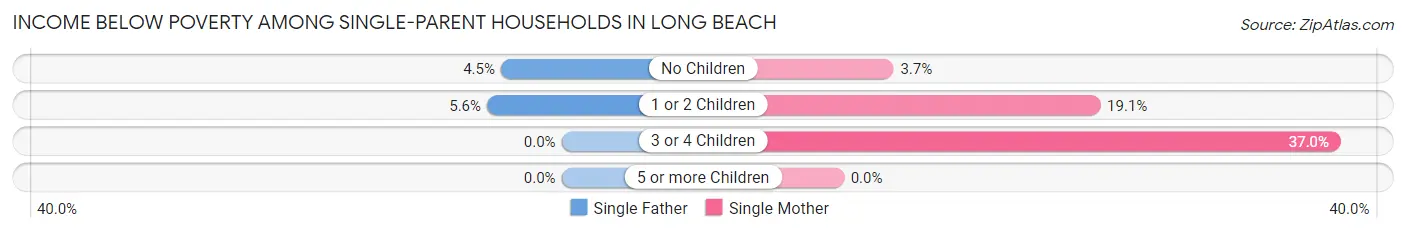
| Children | Single Father | Single Mother |
| No Children | 16 (4.5%) | 22 (3.7%) |
| 1 or 2 Children | 9 (5.6%) | 107 (19.1%) |
| 3 or 4 Children | 0 (0.0%) | 40 (37.0%) |
| 5 or more Children | 0 (0.0%) | 0 (0.0%) |
| Total | 25 (4.8%) | 169 (13.1%) |
Income Below Poverty Among Married-Couple vs Single-Parent Households in Long Beach
The poverty data for Long Beach shows that 61 of the married-couple family households (1.0%) and 194 of the single-parent households (10.7%) are living below the poverty level. Within the married-couple family households, those with 1 or 2 children have the highest poverty rate, with 20 households (1.1%) falling below the poverty line. Among the single-parent households, those with 3 or 4 children have the highest poverty rate, with 40 household (37.0%) living below poverty.
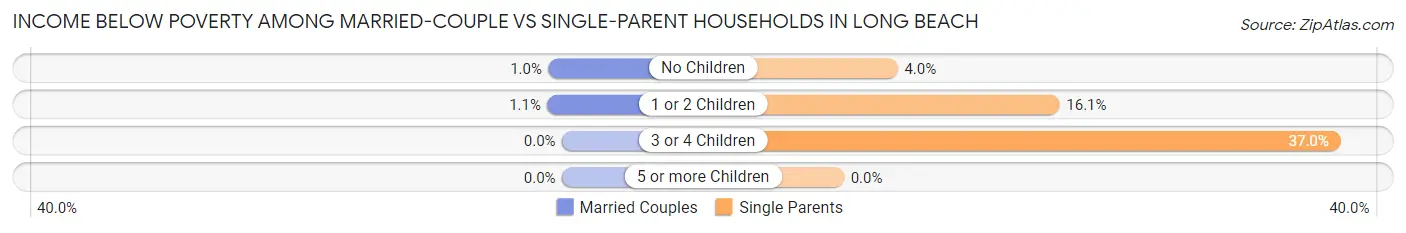
| Children | Married-Couple Families | Single-Parent Households |
| No Children | 41 (1.0%) | 38 (4.0%) |
| 1 or 2 Children | 20 (1.1%) | 116 (16.1%) |
| 3 or 4 Children | 0 (0.0%) | 40 (37.0%) |
| 5 or more Children | 0 (0.0%) | 0 (0.0%) |
| Total | 61 (1.0%) | 194 (10.7%) |
Race in Long Beach
The most populous races in Long Beach are White / Caucasian (27,749 | 79.9%), Hispanic or Latino (4,983 | 14.3%), and Black / African American (1,816 | 5.2%).
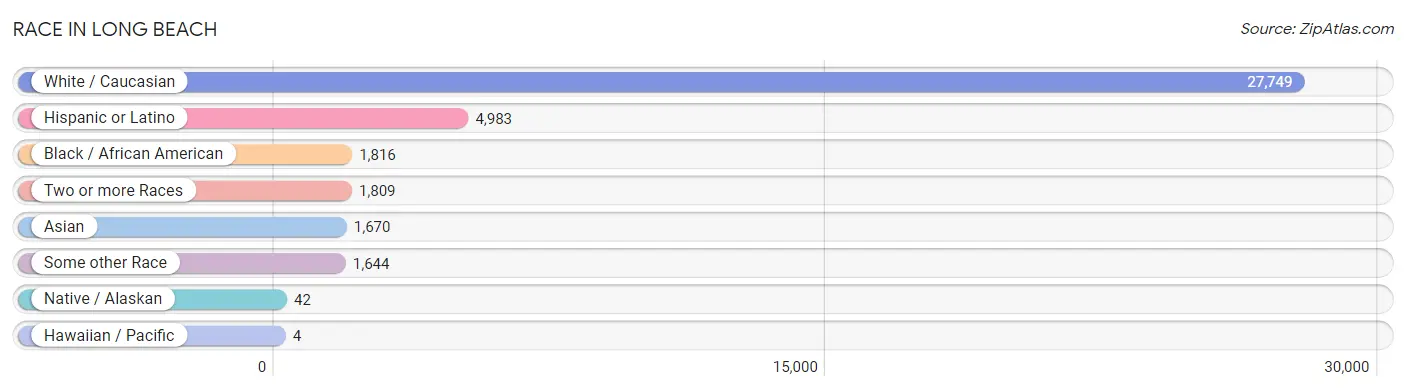
| Race | # Population | % Population |
| Asian | 1,670 | 4.8% |
| Black / African American | 1,816 | 5.2% |
| Hawaiian / Pacific | 4 | 0.0% |
| Hispanic or Latino | 4,983 | 14.3% |
| Native / Alaskan | 42 | 0.1% |
| White / Caucasian | 27,749 | 79.9% |
| Two or more Races | 1,809 | 5.2% |
| Some other Race | 1,644 | 4.7% |
| Total | 34,734 | 100.0% |
Ancestry in Long Beach
The most populous ancestries reported in Long Beach are Irish (7,300 | 21.0%), Italian (6,279 | 18.1%), German (3,380 | 9.7%), South American (1,756 | 5.1%), and Polish (1,473 | 4.2%), together accounting for 58.1% of all Long Beach residents.
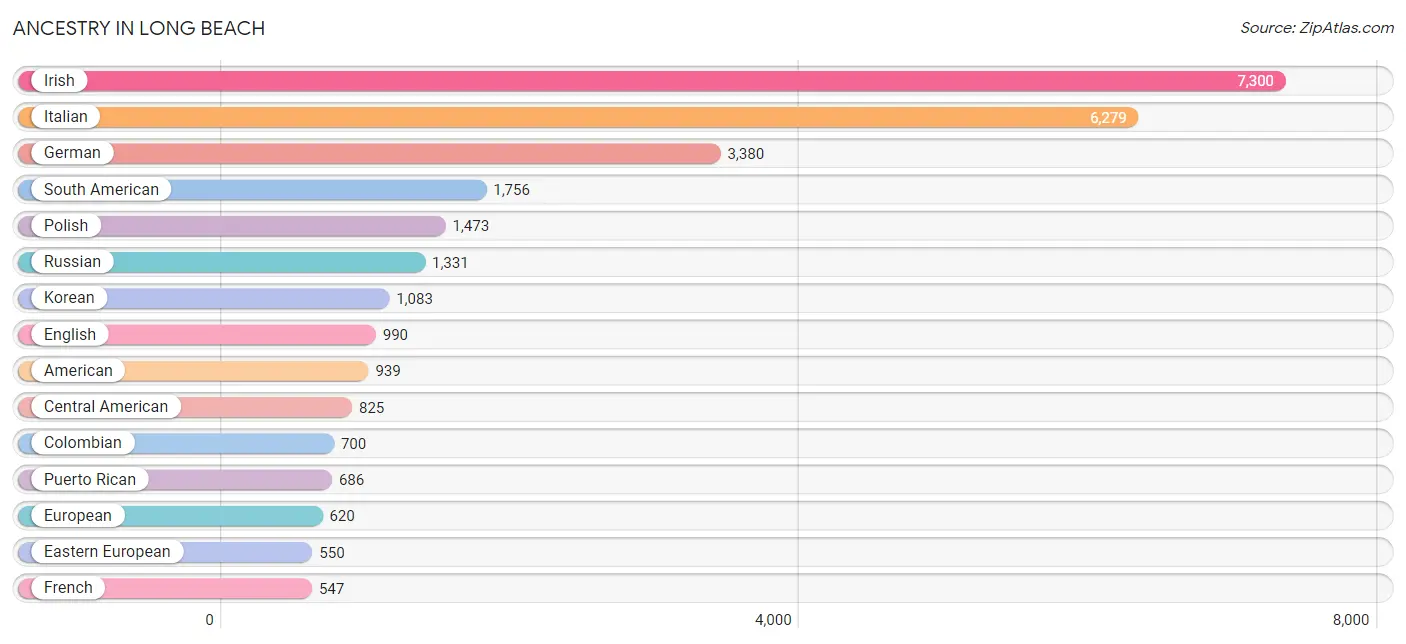
| Ancestry | # Population | % Population |
| African | 470 | 1.3% |
| Albanian | 63 | 0.2% |
| American | 939 | 2.7% |
| Arab | 88 | 0.3% |
| Argentinean | 13 | 0.0% |
| Armenian | 18 | 0.1% |
| Austrian | 143 | 0.4% |
| Belgian | 21 | 0.1% |
| Bhutanese | 58 | 0.2% |
| Blackfeet | 17 | 0.1% |
| Brazilian | 362 | 1.0% |
| British | 15 | 0.0% |
| Burmese | 131 | 0.4% |
| Canadian | 11 | 0.0% |
| Celtic | 7 | 0.0% |
| Central American | 825 | 2.4% |
| Central American Indian | 6 | 0.0% |
| Cherokee | 66 | 0.2% |
| Chilean | 180 | 0.5% |
| Colombian | 700 | 2.0% |
| Costa Rican | 21 | 0.1% |
| Croatian | 241 | 0.7% |
| Cuban | 68 | 0.2% |
| Cypriot | 30 | 0.1% |
| Czech | 73 | 0.2% |
| Czechoslovakian | 51 | 0.2% |
| Danish | 150 | 0.4% |
| Dominican | 500 | 1.4% |
| Dutch | 339 | 1.0% |
| Eastern European | 550 | 1.6% |
| Ecuadorian | 345 | 1.0% |
| English | 990 | 2.9% |
| Ethiopian | 32 | 0.1% |
| European | 620 | 1.8% |
| Finnish | 37 | 0.1% |
| French | 547 | 1.6% |
| French Canadian | 84 | 0.2% |
| German | 3,380 | 9.7% |
| Greek | 307 | 0.9% |
| Guatemalan | 43 | 0.1% |
| Guyanese | 93 | 0.3% |
| Haitian | 58 | 0.2% |
| Honduran | 274 | 0.8% |
| Hungarian | 321 | 0.9% |
| Indian (Asian) | 324 | 0.9% |
| Irish | 7,300 | 21.0% |
| Israeli | 84 | 0.2% |
| Italian | 6,279 | 18.1% |
| Jamaican | 112 | 0.3% |
| Korean | 1,083 | 3.1% |
| Laotian | 12 | 0.0% |
| Latvian | 51 | 0.2% |
| Lebanese | 13 | 0.0% |
| Lithuanian | 347 | 1.0% |
| Maltese | 18 | 0.1% |
| Mexican | 214 | 0.6% |
| Moroccan | 18 | 0.1% |
| Nicaraguan | 6 | 0.0% |
| Norwegian | 65 | 0.2% |
| Pakistani | 16 | 0.1% |
| Palestinian | 18 | 0.1% |
| Panamanian | 6 | 0.0% |
| Peruvian | 147 | 0.4% |
| Polish | 1,473 | 4.2% |
| Portuguese | 325 | 0.9% |
| Puerto Rican | 686 | 2.0% |
| Romanian | 129 | 0.4% |
| Russian | 1,331 | 3.8% |
| Salvadoran | 475 | 1.4% |
| Scandinavian | 27 | 0.1% |
| Scotch-Irish | 134 | 0.4% |
| Scottish | 212 | 0.6% |
| Slavic | 8 | 0.0% |
| Slovak | 17 | 0.1% |
| South American | 1,756 | 5.1% |
| Soviet Union | 12 | 0.0% |
| Spaniard | 291 | 0.8% |
| Sri Lankan | 5 | 0.0% |
| Subsaharan African | 502 | 1.5% |
| Swedish | 231 | 0.7% |
| Swiss | 46 | 0.1% |
| Syrian | 18 | 0.1% |
| Thai | 207 | 0.6% |
| Trinidadian and Tobagonian | 27 | 0.1% |
| Turkish | 214 | 0.6% |
| Ukrainian | 210 | 0.6% |
| Uruguayan | 262 | 0.7% |
| Venezuelan | 109 | 0.3% |
| Vietnamese | 42 | 0.1% |
| Welsh | 54 | 0.2% | View All 90 Rows |
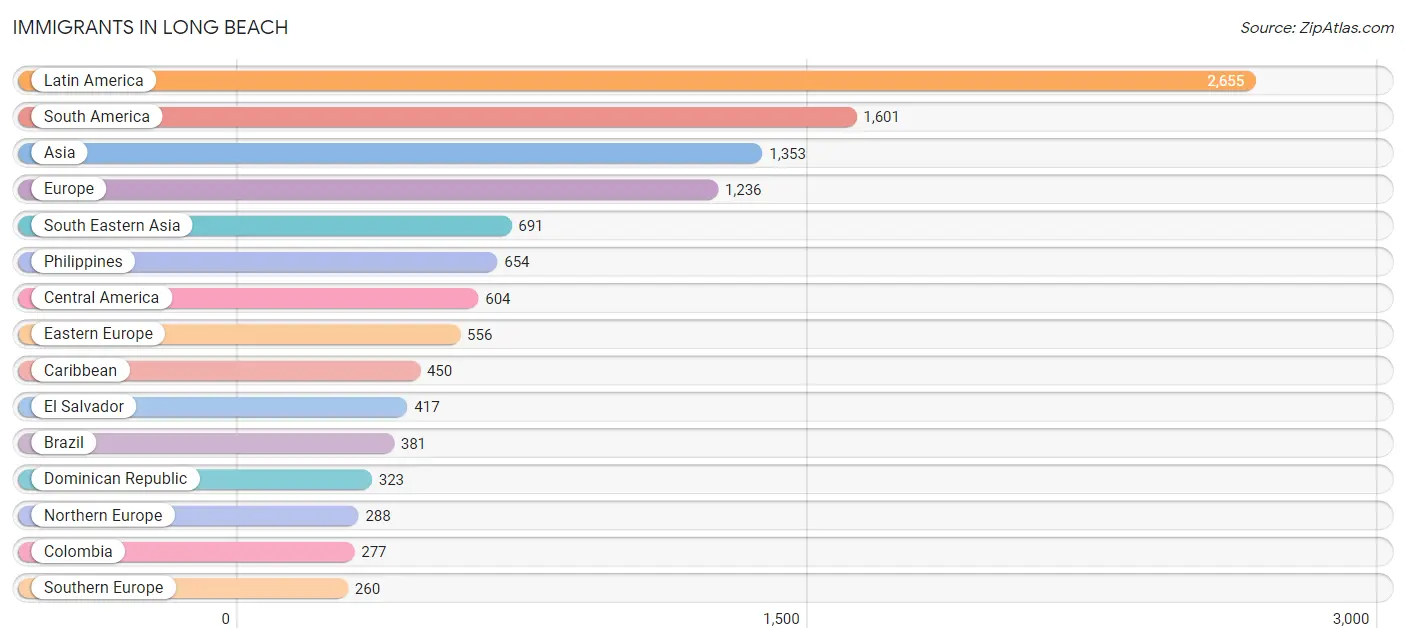
Immigrants in Long Beach
The most numerous immigrant groups reported in Long Beach came from Latin America (2,655 | 7.6%), South America (1,601 | 4.6%), Asia (1,353 | 3.9%), Europe (1,236 | 3.6%), and South Eastern Asia (691 | 2.0%), together accounting for 21.7% of all Long Beach residents.
| Immigration Origin | # Population | % Population |
| Africa | 98 | 0.3% |
| Argentina | 13 | 0.0% |
| Asia | 1,353 | 3.9% |
| Bangladesh | 30 | 0.1% |
| Belarus | 29 | 0.1% |
| Brazil | 381 | 1.1% |
| Canada | 27 | 0.1% |
| Caribbean | 450 | 1.3% |
| Central America | 604 | 1.7% |
| Chile | 166 | 0.5% |
| China | 134 | 0.4% |
| Colombia | 277 | 0.8% |
| Costa Rica | 21 | 0.1% |
| Croatia | 119 | 0.3% |
| Czechoslovakia | 14 | 0.0% |
| Denmark | 104 | 0.3% |
| Dominican Republic | 323 | 0.9% |
| Eastern Africa | 32 | 0.1% |
| Eastern Asia | 219 | 0.6% |
| Eastern Europe | 556 | 1.6% |
| Ecuador | 167 | 0.5% |
| Egypt | 66 | 0.2% |
| El Salvador | 417 | 1.2% |
| Ethiopia | 32 | 0.1% |
| Europe | 1,236 | 3.6% |
| France | 24 | 0.1% |
| Germany | 92 | 0.3% |
| Greece | 86 | 0.3% |
| Guatemala | 37 | 0.1% |
| Guyana | 131 | 0.4% |
| Haiti | 62 | 0.2% |
| Honduras | 73 | 0.2% |
| Hong Kong | 16 | 0.1% |
| India | 74 | 0.2% |
| Ireland | 139 | 0.4% |
| Israel | 40 | 0.1% |
| Italy | 151 | 0.4% |
| Jamaica | 27 | 0.1% |
| Japan | 38 | 0.1% |
| Korea | 47 | 0.1% |
| Kuwait | 76 | 0.2% |
| Latin America | 2,655 | 7.6% |
| Latvia | 76 | 0.2% |
| Lithuania | 119 | 0.3% |
| Mexico | 50 | 0.1% |
| Netherlands | 12 | 0.0% |
| Northern Africa | 66 | 0.2% |
| Northern Europe | 288 | 0.8% |
| Panama | 6 | 0.0% |
| Peru | 95 | 0.3% |
| Philippines | 654 | 1.9% |
| Romania | 59 | 0.2% |
| Russia | 15 | 0.0% |
| Scotland | 20 | 0.1% |
| South America | 1,601 | 4.6% |
| South Central Asia | 191 | 0.5% |
| South Eastern Asia | 691 | 2.0% |
| Southern Europe | 260 | 0.7% |
| Spain | 23 | 0.1% |
| Switzerland | 4 | 0.0% |
| Thailand | 37 | 0.1% |
| Trinidad and Tobago | 38 | 0.1% |
| Turkey | 107 | 0.3% |
| Ukraine | 84 | 0.2% |
| Uruguay | 242 | 0.7% |
| Uzbekistan | 87 | 0.3% |
| Venezuela | 129 | 0.4% |
| Western Asia | 252 | 0.7% |
| Western Europe | 132 | 0.4% | View All 69 Rows |
Sex and Age in Long Beach
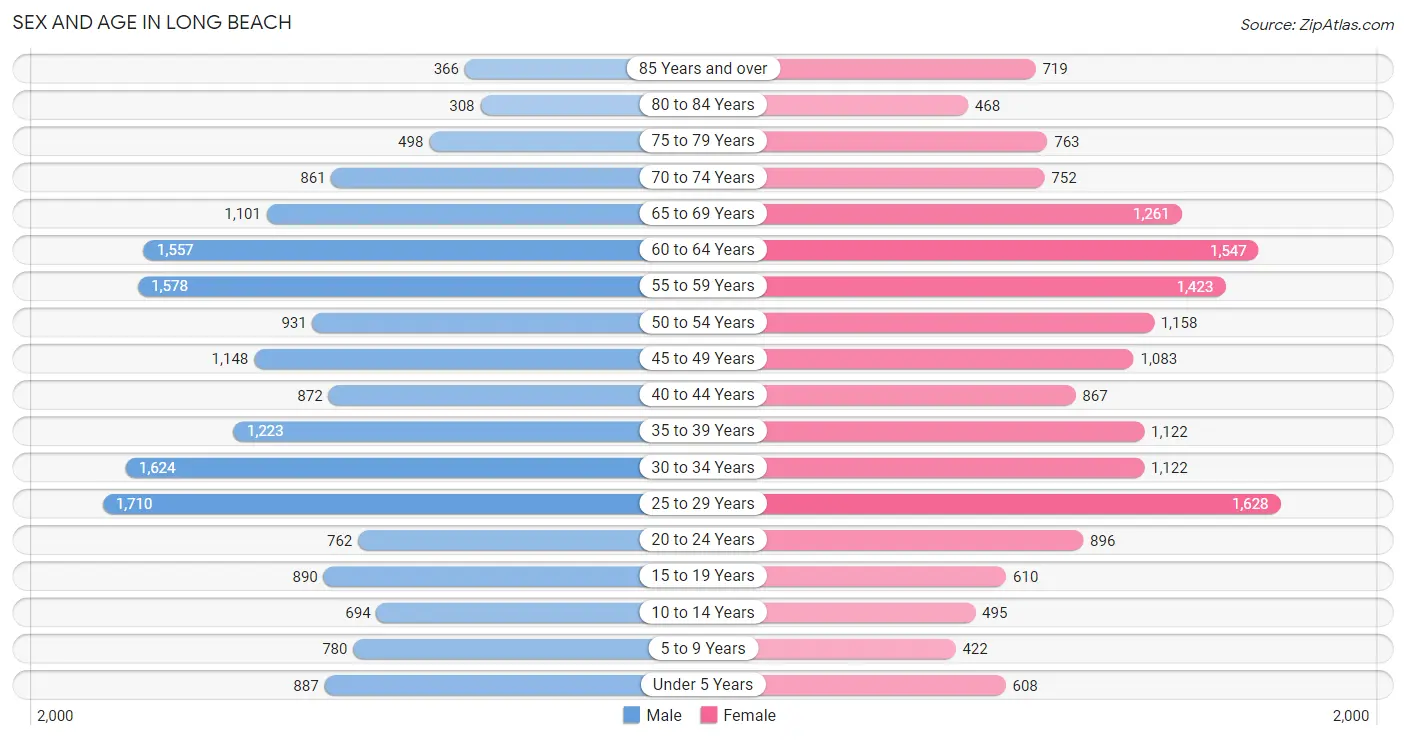
Sex and Age in Long Beach
The most populous age groups in Long Beach are 25 to 29 Years (1,710 | 9.6%) for men and 25 to 29 Years (1,628 | 9.6%) for women.
| Age Bracket | Male | Female |
| Under 5 Years | 887 (5.0%) | 608 (3.6%) |
| 5 to 9 Years | 780 (4.4%) | 422 (2.5%) |
| 10 to 14 Years | 694 (3.9%) | 495 (2.9%) |
| 15 to 19 Years | 890 (5.0%) | 610 (3.6%) |
| 20 to 24 Years | 762 (4.3%) | 896 (5.3%) |
| 25 to 29 Years | 1,710 (9.6%) | 1,628 (9.6%) |
| 30 to 34 Years | 1,624 (9.1%) | 1,122 (6.6%) |
| 35 to 39 Years | 1,223 (6.9%) | 1,122 (6.6%) |
| 40 to 44 Years | 872 (4.9%) | 867 (5.1%) |
| 45 to 49 Years | 1,148 (6.5%) | 1,083 (6.4%) |
| 50 to 54 Years | 931 (5.2%) | 1,158 (6.8%) |
| 55 to 59 Years | 1,578 (8.9%) | 1,423 (8.4%) |
| 60 to 64 Years | 1,557 (8.7%) | 1,547 (9.1%) |
| 65 to 69 Years | 1,101 (6.2%) | 1,261 (7.4%) |
| 70 to 74 Years | 861 (4.8%) | 752 (4.4%) |
| 75 to 79 Years | 498 (2.8%) | 763 (4.5%) |
| 80 to 84 Years | 308 (1.7%) | 468 (2.8%) |
| 85 Years and over | 366 (2.1%) | 719 (4.2%) |
| Total | 17,790 (100.0%) | 16,944 (100.0%) |
Families and Households in Long Beach
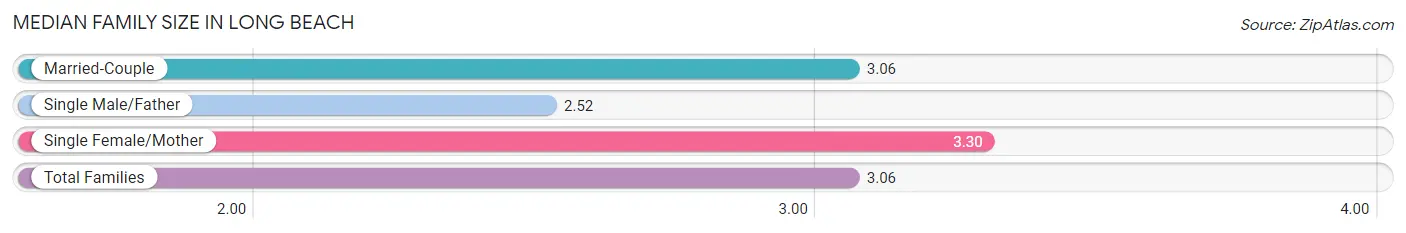
Median Family Size in Long Beach
The median family size in Long Beach is 3.06 persons per family, with single female/mother families (1,293 | 16.6%) accounting for the largest median family size of 3.3 persons per family. On the other hand, single male/father families (516 | 6.6%) represent the smallest median family size with 2.52 persons per family.
| Family Type | # Families | Family Size |
| Married-Couple | 5,996 (76.8%) | 3.06 |
| Single Male/Father | 516 (6.6%) | 2.52 |
| Single Female/Mother | 1,293 (16.6%) | 3.30 |
| Total Families | 7,805 (100.0%) | 3.06 |
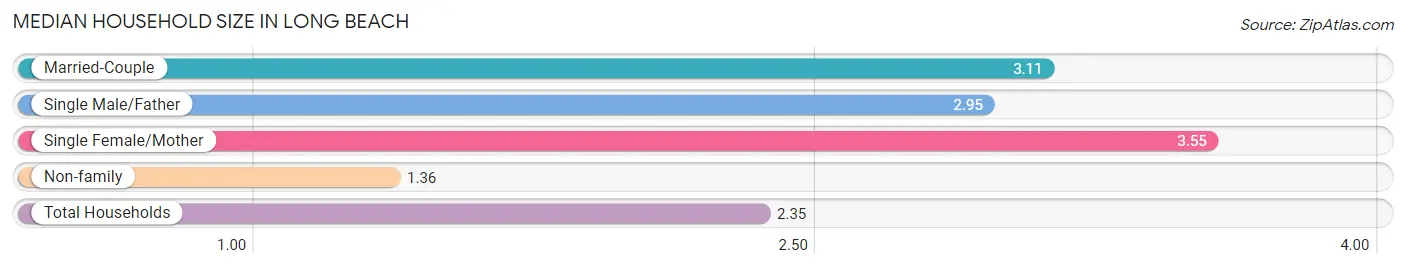
Median Household Size in Long Beach
The median household size in Long Beach is 2.35 persons per household, with single female/mother households (1,293 | 9.1%) accounting for the largest median household size of 3.55 persons per household. non-family households (6,454 | 45.3%) represent the smallest median household size with 1.36 persons per household.
| Household Type | # Households | Household Size |
| Married-Couple | 5,996 (42.0%) | 3.11 |
| Single Male/Father | 516 (3.6%) | 2.95 |
| Single Female/Mother | 1,293 (9.1%) | 3.55 |
| Non-family | 6,454 (45.3%) | 1.36 |
| Total Households | 14,259 (100.0%) | 2.35 |
Household Size by Marriage Status in Long Beach
Out of a total of 14,259 households in Long Beach, 7,805 (54.7%) are family households, while 6,454 (45.3%) are nonfamily households. The most numerous type of family households are 2-person households, comprising 3,360, and the most common type of nonfamily households are 1-person households, comprising 4,759.
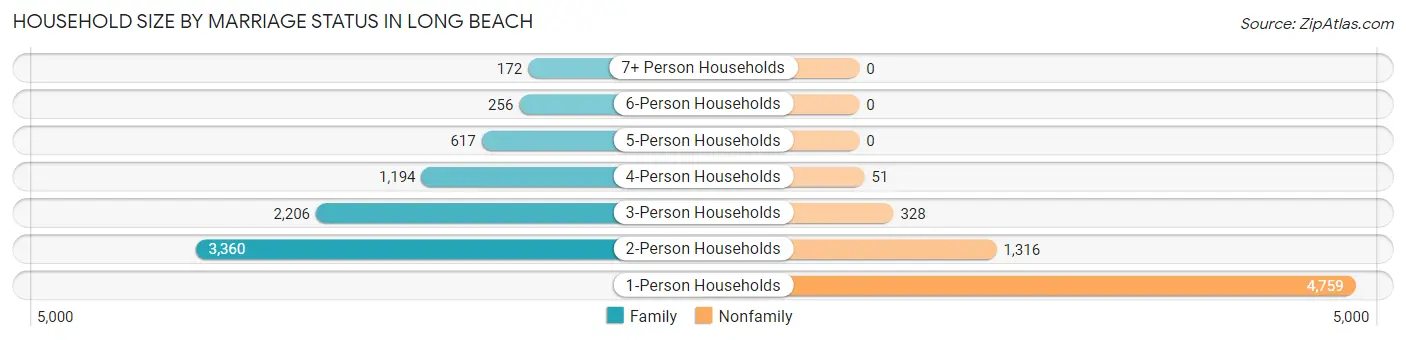
| Household Size | Family Households | Nonfamily Households |
| 1-Person Households | - | 4,759 (33.4%) |
| 2-Person Households | 3,360 (23.6%) | 1,316 (9.2%) |
| 3-Person Households | 2,206 (15.5%) | 328 (2.3%) |
| 4-Person Households | 1,194 (8.4%) | 51 (0.4%) |
| 5-Person Households | 617 (4.3%) | 0 (0.0%) |
| 6-Person Households | 256 (1.8%) | 0 (0.0%) |
| 7+ Person Households | 172 (1.2%) | 0 (0.0%) |
| Total | 7,805 (54.7%) | 6,454 (45.3%) |
Female Fertility in Long Beach
Fertility by Age in Long Beach
Average fertility rate in Long Beach is 52.0 births per 1,000 women. Women in the age bracket of 20 to 34 years have the highest fertility rate with 85.0 births per 1,000 women. Women in the age bracket of 20 to 34 years acount for 78.4% of all women with births.
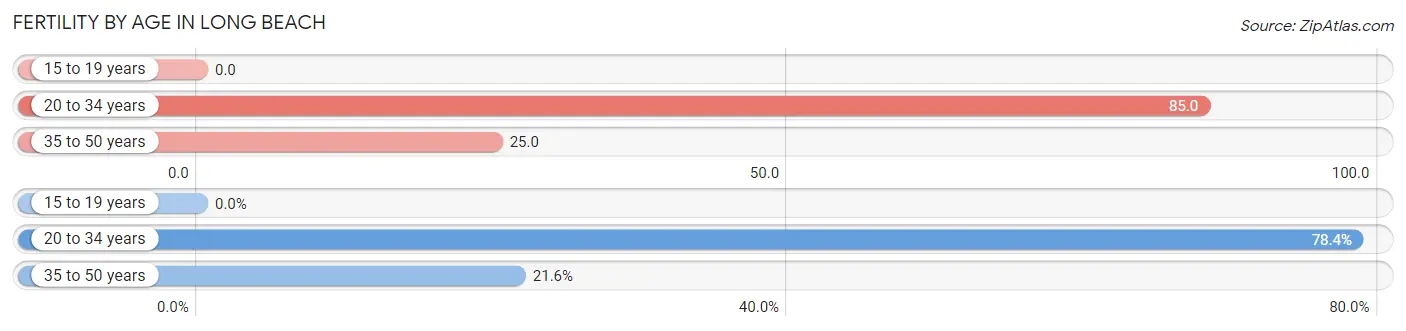
| Age Bracket | Women with Births | Births / 1,000 Women |
| 15 to 19 years | 0 (0.0%) | 0.0 |
| 20 to 34 years | 309 (78.4%) | 85.0 |
| 35 to 50 years | 85 (21.6%) | 25.0 |
| Total | 394 (100.0%) | 52.0 |
Fertility by Age by Marriage Status in Long Beach
82.2% of women with births (394) in Long Beach are married. The highest percentage of unmarried women with births falls into 20 to 34 years age bracket with 22.7% of them unmarried at the time of birth, while the lowest percentage of unmarried women with births belong to 35 to 50 years age bracket with 0.0% of them unmarried.
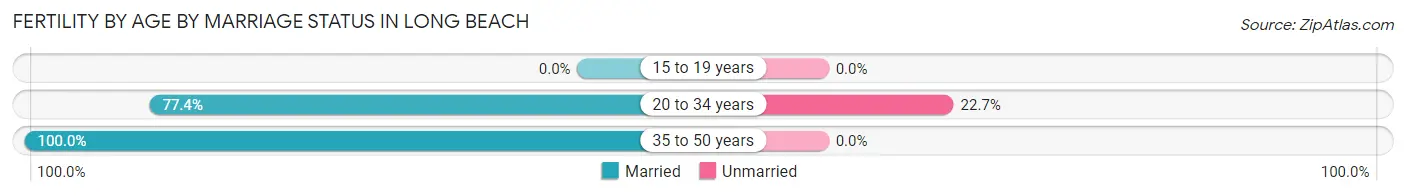
| Age Bracket | Married | Unmarried |
| 15 to 19 years | 0 (0.0%) | 0 (0.0%) |
| 20 to 34 years | 239 (77.3%) | 70 (22.7%) |
| 35 to 50 years | 85 (100.0%) | 0 (0.0%) |
| Total | 324 (82.2%) | 70 (17.8%) |
Fertility by Education in Long Beach
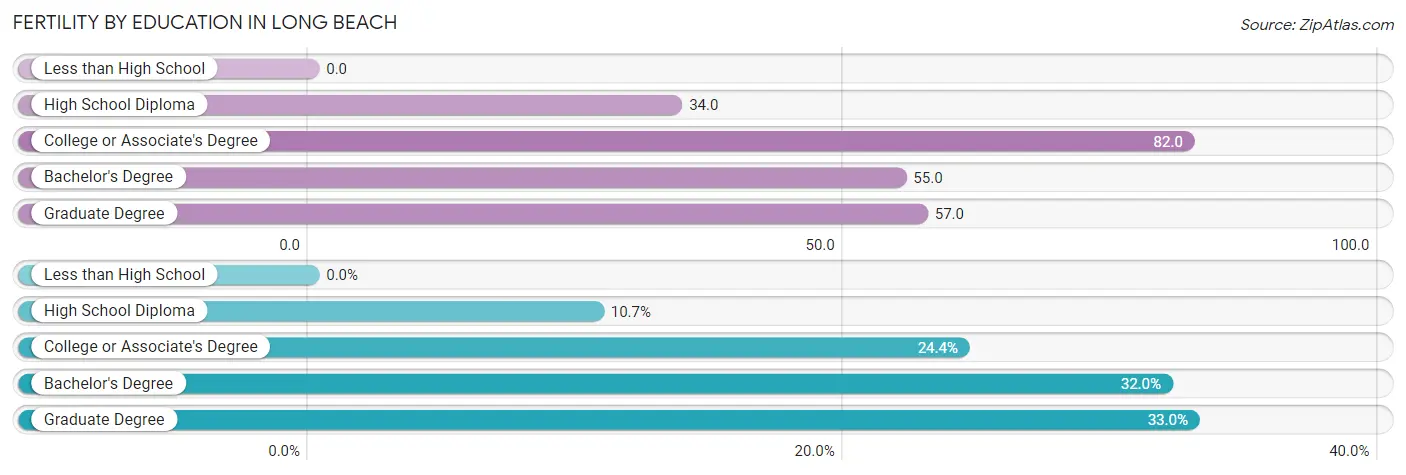
| Educational Attainment | Women with Births | Births / 1,000 Women |
| Less than High School | 0 (0.0%) | 0.0 |
| High School Diploma | 42 (10.7%) | 34.0 |
| College or Associate's Degree | 96 (24.4%) | 82.0 |
| Bachelor's Degree | 126 (32.0%) | 55.0 |
| Graduate Degree | 130 (33.0%) | 57.0 |
| Total | 394 (100.0%) | 52.0 |
Fertility by Education by Marriage Status in Long Beach
17.8% of women with births in Long Beach are unmarried. Women with the educational attainment of bachelor's degree are most likely to be married with 100.0% of them married at childbirth, while women with the educational attainment of high school diploma are least likely to be married with 57.1% of them unmarried at childbirth.
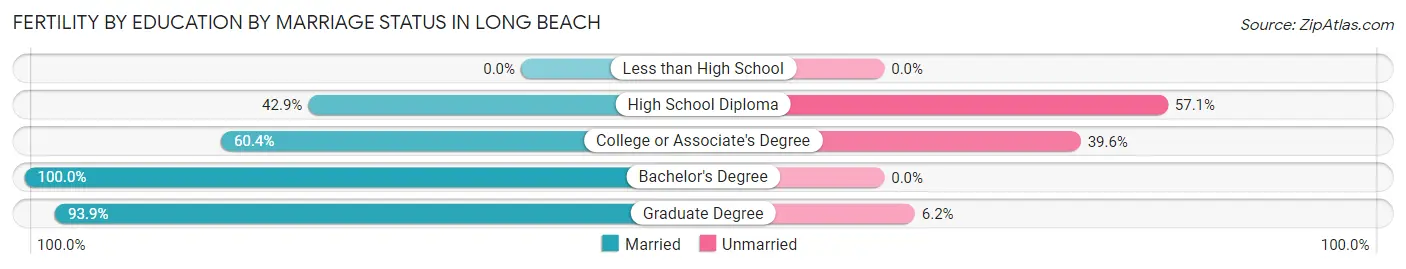
| Educational Attainment | Married | Unmarried |
| Less than High School | 0 (0.0%) | 0 (0.0%) |
| High School Diploma | 18 (42.9%) | 24 (57.1%) |
| College or Associate's Degree | 58 (60.4%) | 38 (39.6%) |
| Bachelor's Degree | 126 (100.0%) | 0 (0.0%) |
| Graduate Degree | 122 (93.9%) | 8 (6.1%) |
| Total | 324 (82.2%) | 70 (17.8%) |
Employment Characteristics in Long Beach
Employment by Class of Employer in Long Beach
Among the 19,639 employed individuals in Long Beach, private company employees (11,983 | 61.0%), local government employees (3,305 | 16.8%), and not-for-profit organizations (1,680 | 8.6%) make up the most common classes of employment.
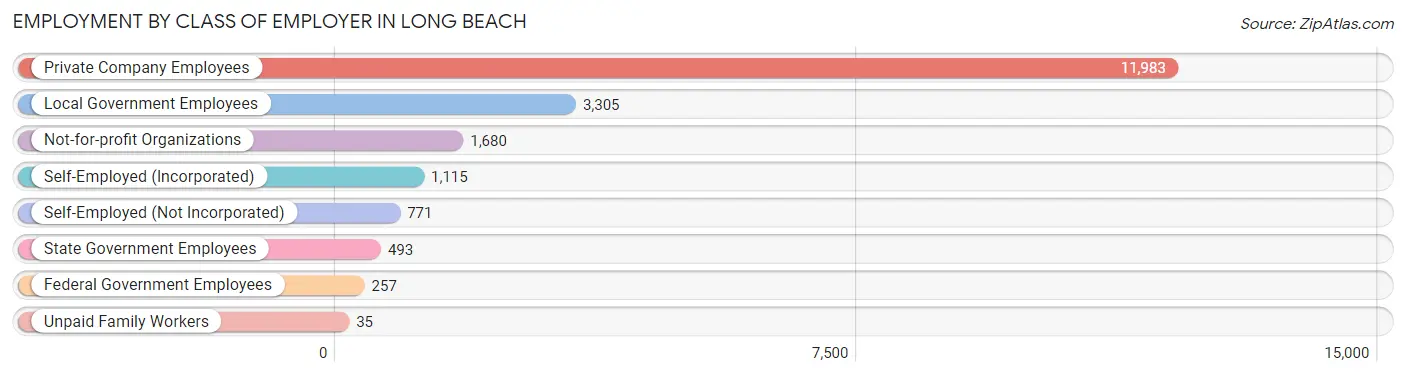
| Employer Class | # Employees | % Employees |
| Private Company Employees | 11,983 | 61.0% |
| Self-Employed (Incorporated) | 1,115 | 5.7% |
| Self-Employed (Not Incorporated) | 771 | 3.9% |
| Not-for-profit Organizations | 1,680 | 8.6% |
| Local Government Employees | 3,305 | 16.8% |
| State Government Employees | 493 | 2.5% |
| Federal Government Employees | 257 | 1.3% |
| Unpaid Family Workers | 35 | 0.2% |
| Total | 19,639 | 100.0% |
Employment Status by Age in Long Beach
According to the labor force statistics for Long Beach, out of the total population over 16 years of age (30,614), 68.4% or 20,940 individuals are in the labor force, with 3.8% or 796 of them unemployed. The age group with the highest labor force participation rate is 30 to 34 years, with 93.9% or 2,578 individuals in the labor force. Within the labor force, the 16 to 19 years age range has the highest percentage of unemployed individuals, with 8.5% or 26 of them being unemployed.
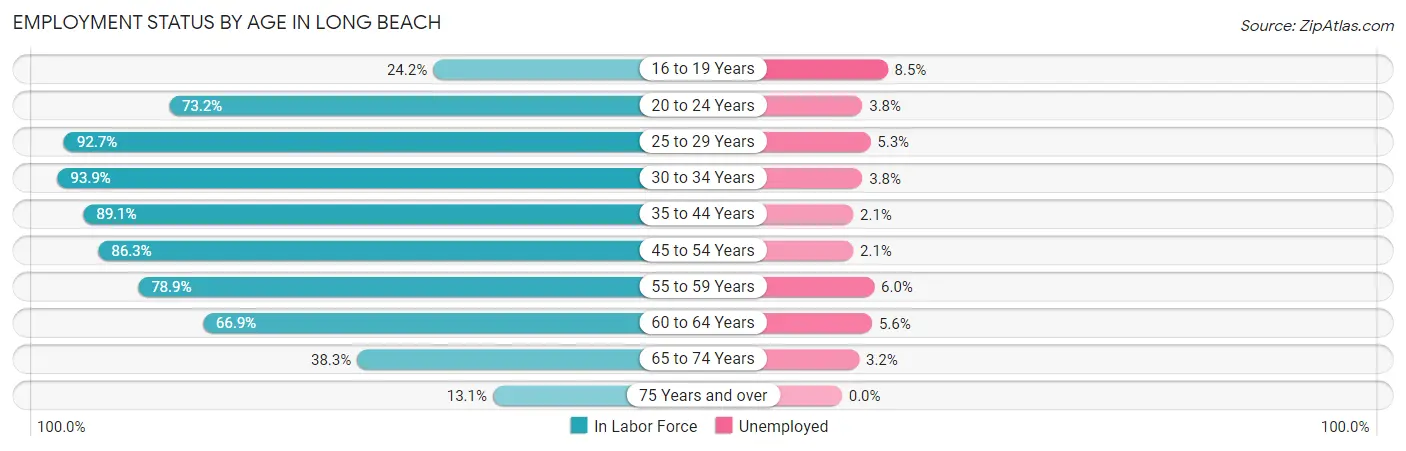
| Age Bracket | In Labor Force | Unemployed |
| 16 to 19 Years | 306 (24.2%) | 26 (8.5%) |
| 20 to 24 Years | 1,214 (73.2%) | 46 (3.8%) |
| 25 to 29 Years | 3,094 (92.7%) | 164 (5.3%) |
| 30 to 34 Years | 2,578 (93.9%) | 98 (3.8%) |
| 35 to 44 Years | 3,639 (89.1%) | 76 (2.1%) |
| 45 to 54 Years | 3,728 (86.3%) | 78 (2.1%) |
| 55 to 59 Years | 2,368 (78.9%) | 142 (6.0%) |
| 60 to 64 Years | 2,077 (66.9%) | 116 (5.6%) |
| 65 to 74 Years | 1,522 (38.3%) | 49 (3.2%) |
| 75 Years and over | 409 (13.1%) | 0 (0.0%) |
| Total | 20,940 (68.4%) | 796 (3.8%) |
Employment Status by Educational Attainment in Long Beach
According to labor force statistics for Long Beach, 84.9% of individuals (17,483) out of the total population between 25 and 64 years of age (20,593) are in the labor force, with 3.9% or 682 of them being unemployed. The group with the highest labor force participation rate are those with the educational attainment of bachelor's degree or higher, with 92.1% or 10,432 individuals in the labor force. Within the labor force, individuals with high school diploma education have the highest percentage of unemployment, with 7.4% or 234 of them being unemployed.
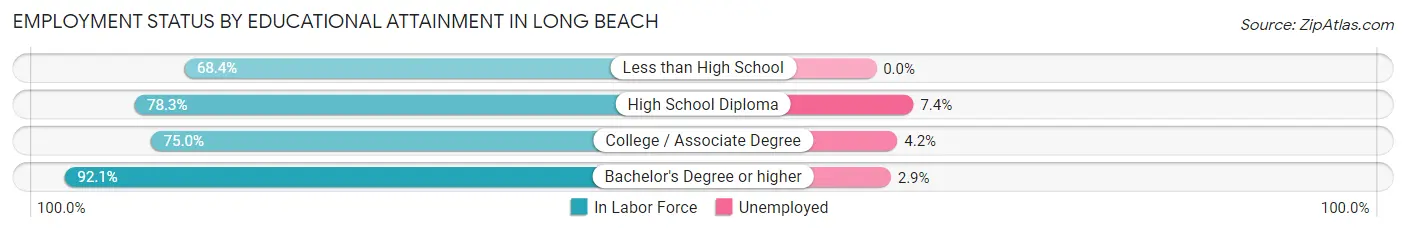
| Educational Attainment | In Labor Force | Unemployed |
| Less than High School | 420 (68.4%) | 0 (0.0%) |
| High School Diploma | 3,167 (78.3%) | 299 (7.4%) |
| College / Associate Degree | 3,455 (75.0%) | 193 (4.2%) |
| Bachelor's Degree or higher | 10,432 (92.1%) | 328 (2.9%) |
| Total | 17,483 (84.9%) | 803 (3.9%) |
Employment Occupations by Sex in Long Beach
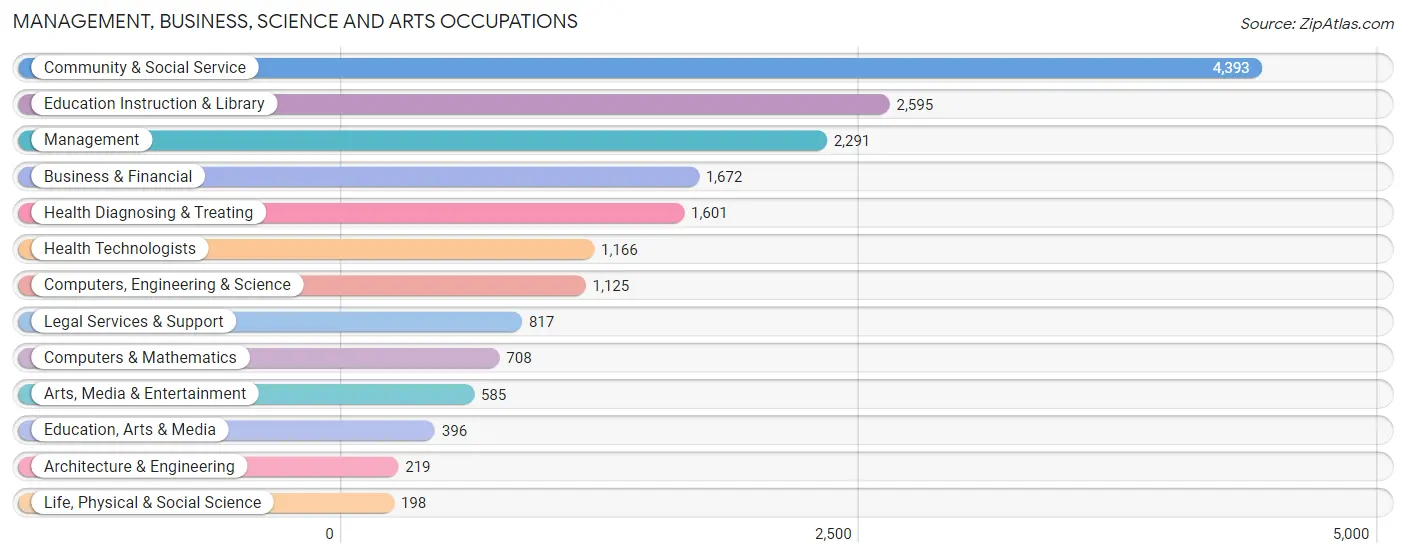
Management, Business, Science and Arts Occupations
The most common Management, Business, Science and Arts occupations in Long Beach are Community & Social Service (4,393 | 21.8%), Education Instruction & Library (2,595 | 12.9%), Management (2,291 | 11.4%), Business & Financial (1,672 | 8.3%), and Health Diagnosing & Treating (1,601 | 8.0%).
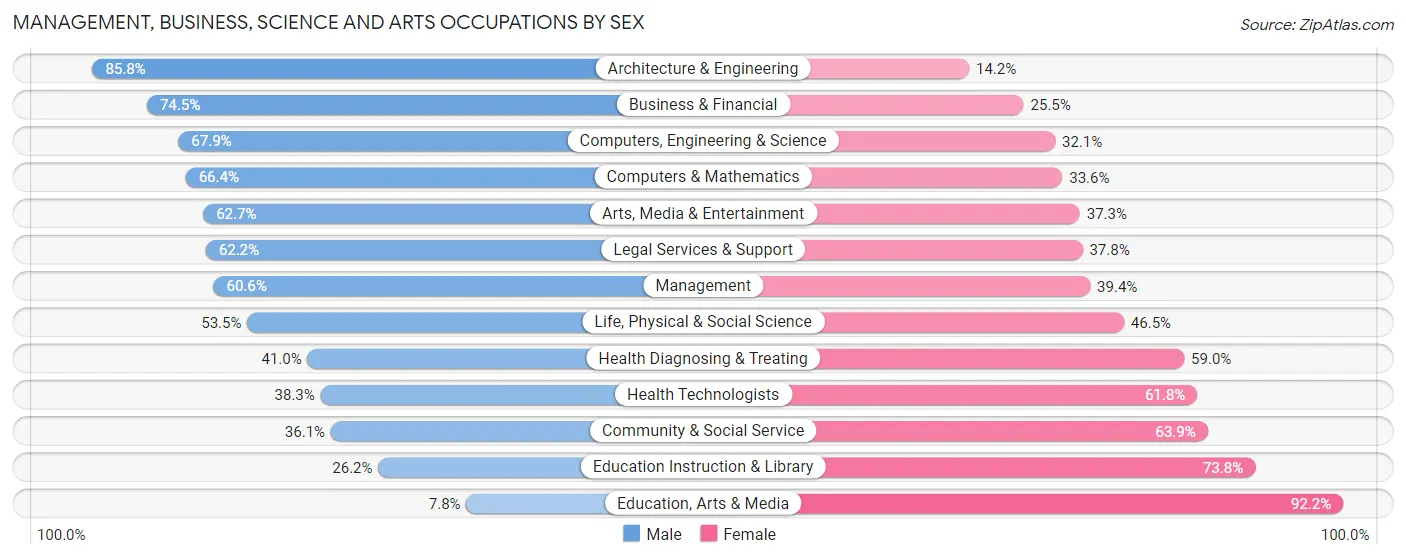
Management, Business, Science and Arts Occupations by Sex
Within the Management, Business, Science and Arts occupations in Long Beach, the most male-oriented occupations are Architecture & Engineering (85.8%), Business & Financial (74.5%), and Computers, Engineering & Science (67.9%), while the most female-oriented occupations are Education, Arts & Media (92.2%), Education Instruction & Library (73.8%), and Community & Social Service (63.9%).
| Occupation | Male | Female |
| Management | 1,388 (60.6%) | 903 (39.4%) |
| Business & Financial | 1,245 (74.5%) | 427 (25.5%) |
| Computers, Engineering & Science | 764 (67.9%) | 361 (32.1%) |
| Computers & Mathematics | 470 (66.4%) | 238 (33.6%) |
| Architecture & Engineering | 188 (85.8%) | 31 (14.2%) |
| Life, Physical & Social Science | 106 (53.5%) | 92 (46.5%) |
| Community & Social Service | 1,586 (36.1%) | 2,807 (63.9%) |
| Education, Arts & Media | 31 (7.8%) | 365 (92.2%) |
| Legal Services & Support | 508 (62.2%) | 309 (37.8%) |
| Education Instruction & Library | 680 (26.2%) | 1,915 (73.8%) |
| Arts, Media & Entertainment | 367 (62.7%) | 218 (37.3%) |
| Health Diagnosing & Treating | 656 (41.0%) | 945 (59.0%) |
| Health Technologists | 446 (38.3%) | 720 (61.8%) |
| Total (Category) | 5,639 (50.9%) | 5,443 (49.1%) |
| Total (Overall) | 10,671 (53.0%) | 9,467 (47.0%) |
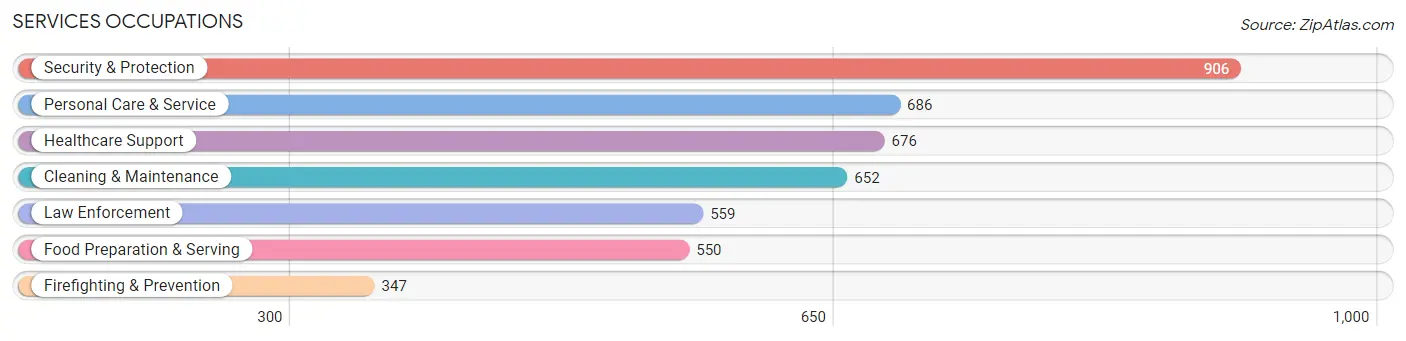
Services Occupations
The most common Services occupations in Long Beach are Security & Protection (906 | 4.5%), Personal Care & Service (686 | 3.4%), Healthcare Support (676 | 3.4%), Cleaning & Maintenance (652 | 3.2%), and Law Enforcement (559 | 2.8%).
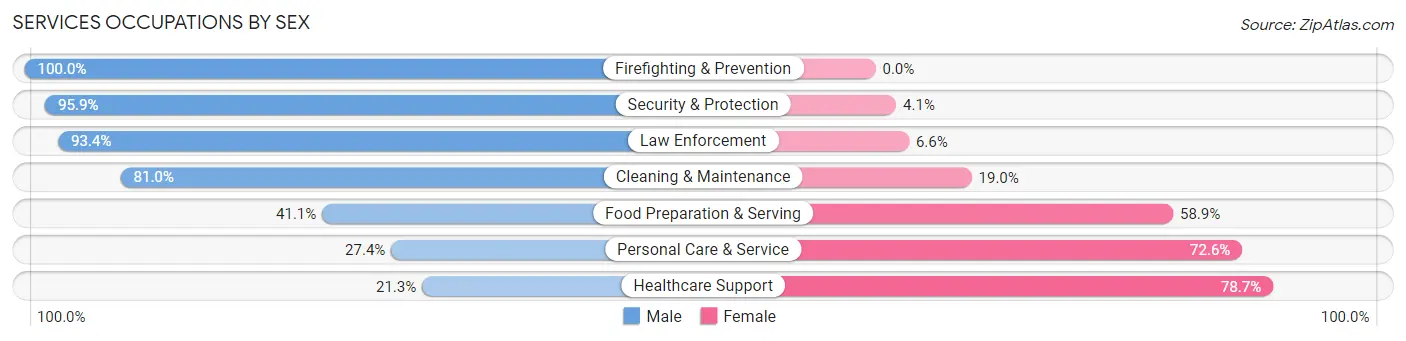
Services Occupations by Sex
Within the Services occupations in Long Beach, the most male-oriented occupations are Firefighting & Prevention (100.0%), Security & Protection (95.9%), and Law Enforcement (93.4%), while the most female-oriented occupations are Healthcare Support (78.7%), Personal Care & Service (72.6%), and Food Preparation & Serving (58.9%).
| Occupation | Male | Female |
| Healthcare Support | 144 (21.3%) | 532 (78.7%) |
| Security & Protection | 869 (95.9%) | 37 (4.1%) |
| Firefighting & Prevention | 347 (100.0%) | 0 (0.0%) |
| Law Enforcement | 522 (93.4%) | 37 (6.6%) |
| Food Preparation & Serving | 226 (41.1%) | 324 (58.9%) |
| Cleaning & Maintenance | 528 (81.0%) | 124 (19.0%) |
| Personal Care & Service | 188 (27.4%) | 498 (72.6%) |
| Total (Category) | 1,955 (56.3%) | 1,515 (43.7%) |
| Total (Overall) | 10,671 (53.0%) | 9,467 (47.0%) |
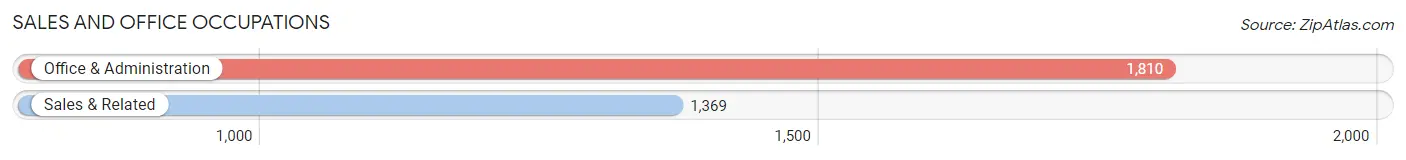
Sales and Office Occupations
The most common Sales and Office occupations in Long Beach are Office & Administration (1,810 | 9.0%), and Sales & Related (1,369 | 6.8%).
Sales and Office Occupations by Sex
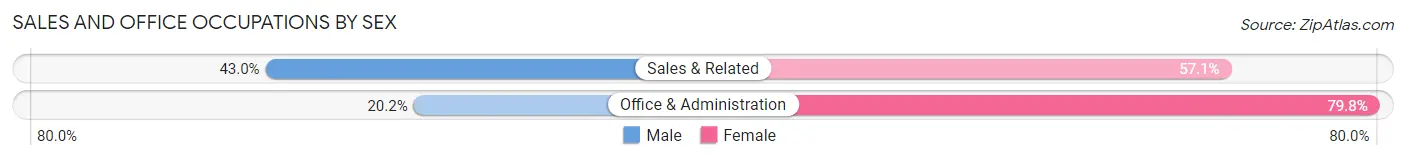
| Occupation | Male | Female |
| Sales & Related | 588 (42.9%) | 781 (57.1%) |
| Office & Administration | 365 (20.2%) | 1,445 (79.8%) |
| Total (Category) | 953 (30.0%) | 2,226 (70.0%) |
| Total (Overall) | 10,671 (53.0%) | 9,467 (47.0%) |
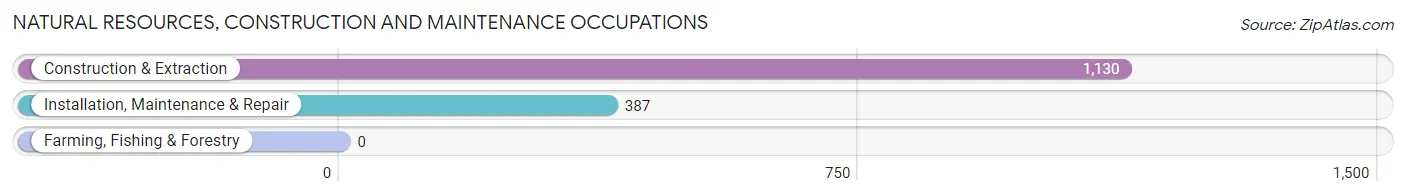
Natural Resources, Construction and Maintenance Occupations
The most common Natural Resources, Construction and Maintenance occupations in Long Beach are Construction & Extraction (1,130 | 5.6%), and Installation, Maintenance & Repair (387 | 1.9%).
Natural Resources, Construction and Maintenance Occupations by Sex
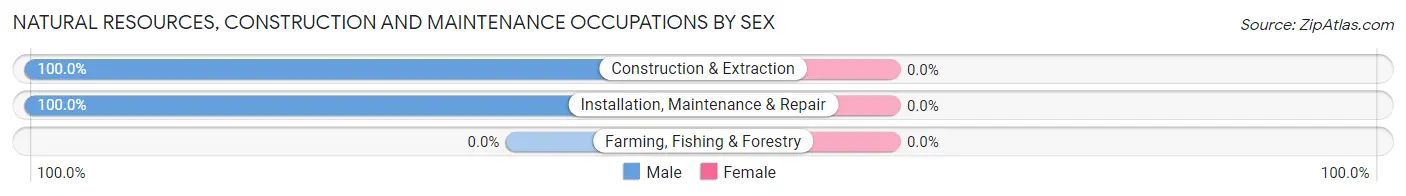
| Occupation | Male | Female |
| Farming, Fishing & Forestry | 0 (0.0%) | 0 (0.0%) |
| Construction & Extraction | 1,130 (100.0%) | 0 (0.0%) |
| Installation, Maintenance & Repair | 387 (100.0%) | 0 (0.0%) |
| Total (Category) | 1,517 (100.0%) | 0 (0.0%) |
| Total (Overall) | 10,671 (53.0%) | 9,467 (47.0%) |
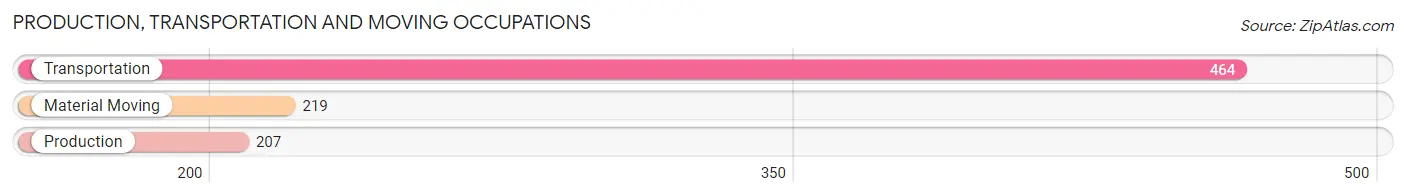
Production, Transportation and Moving Occupations
The most common Production, Transportation and Moving occupations in Long Beach are Transportation (464 | 2.3%), Material Moving (219 | 1.1%), and Production (207 | 1.0%).
Production, Transportation and Moving Occupations by Sex
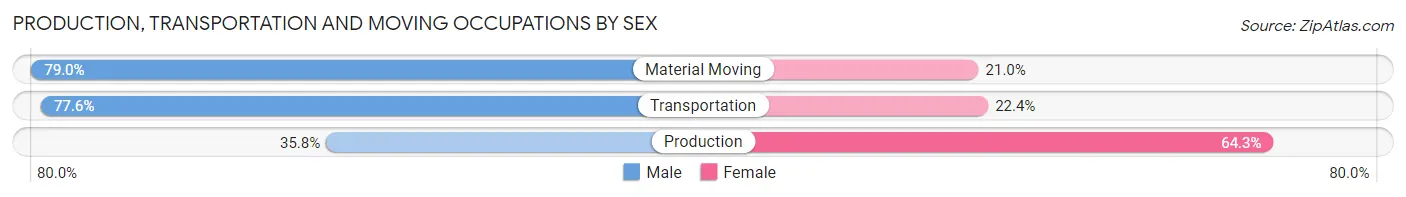
| Occupation | Male | Female |
| Production | 74 (35.7%) | 133 (64.2%) |
| Transportation | 360 (77.6%) | 104 (22.4%) |
| Material Moving | 173 (79.0%) | 46 (21.0%) |
| Total (Category) | 607 (68.2%) | 283 (31.8%) |
| Total (Overall) | 10,671 (53.0%) | 9,467 (47.0%) |
Employment Industries by Sex in Long Beach
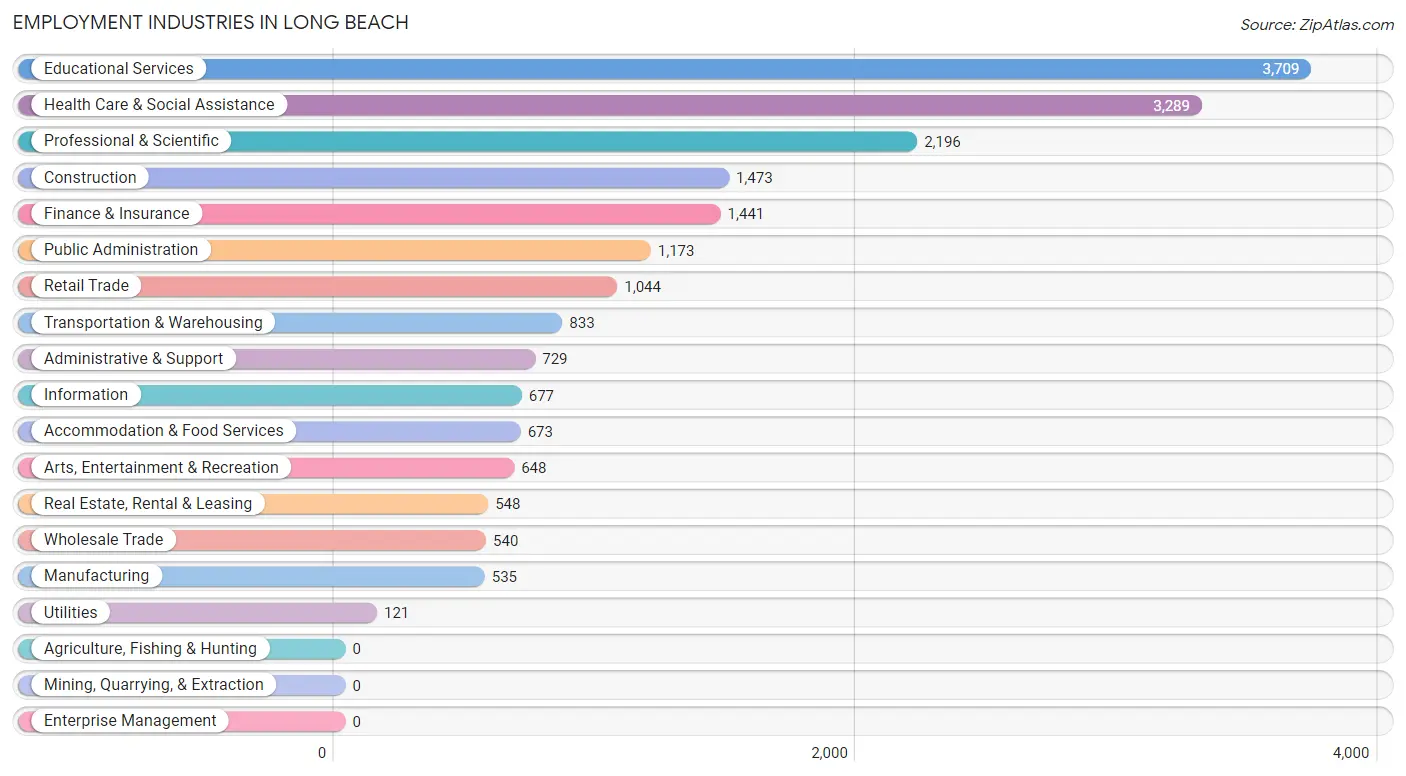
Employment Industries in Long Beach
The major employment industries in Long Beach include Educational Services (3,709 | 18.4%), Health Care & Social Assistance (3,289 | 16.3%), Professional & Scientific (2,196 | 10.9%), Construction (1,473 | 7.3%), and Finance & Insurance (1,441 | 7.2%).
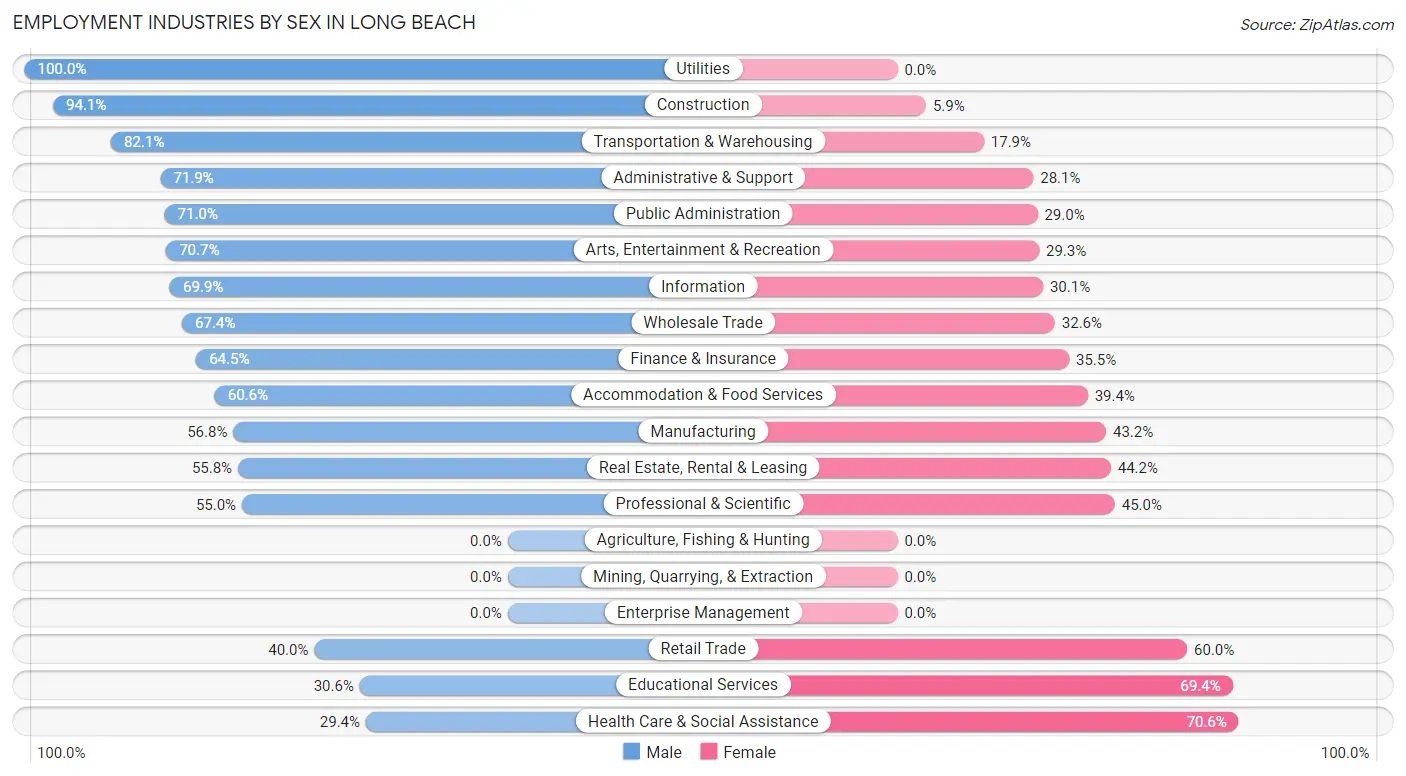
Employment Industries by Sex in Long Beach
The Long Beach industries that see more men than women are Utilities (100.0%), Construction (94.1%), and Transportation & Warehousing (82.1%), whereas the industries that tend to have a higher number of women are Health Care & Social Assistance (70.6%), Educational Services (69.4%), and Retail Trade (60.0%).
| Industry | Male | Female |
| Agriculture, Fishing & Hunting | 0 (0.0%) | 0 (0.0%) |
| Mining, Quarrying, & Extraction | 0 (0.0%) | 0 (0.0%) |
| Construction | 1,386 (94.1%) | 87 (5.9%) |
| Manufacturing | 304 (56.8%) | 231 (43.2%) |
| Wholesale Trade | 364 (67.4%) | 176 (32.6%) |
| Retail Trade | 418 (40.0%) | 626 (60.0%) |
| Transportation & Warehousing | 684 (82.1%) | 149 (17.9%) |
| Utilities | 121 (100.0%) | 0 (0.0%) |
| Information | 473 (69.9%) | 204 (30.1%) |
| Finance & Insurance | 929 (64.5%) | 512 (35.5%) |
| Real Estate, Rental & Leasing | 306 (55.8%) | 242 (44.2%) |
| Professional & Scientific | 1,208 (55.0%) | 988 (45.0%) |
| Enterprise Management | 0 (0.0%) | 0 (0.0%) |
| Administrative & Support | 524 (71.9%) | 205 (28.1%) |
| Educational Services | 1,136 (30.6%) | 2,573 (69.4%) |
| Health Care & Social Assistance | 966 (29.4%) | 2,323 (70.6%) |
| Arts, Entertainment & Recreation | 458 (70.7%) | 190 (29.3%) |
| Accommodation & Food Services | 408 (60.6%) | 265 (39.4%) |
| Public Administration | 833 (71.0%) | 340 (29.0%) |
| Total | 10,671 (53.0%) | 9,467 (47.0%) |
Education in Long Beach
School Enrollment in Long Beach
The most common levels of schooling among the 5,360 students in Long Beach are high school (1,275 | 23.8%), college / undergraduate (1,158 | 21.6%), and elementary school (938 | 17.5%).
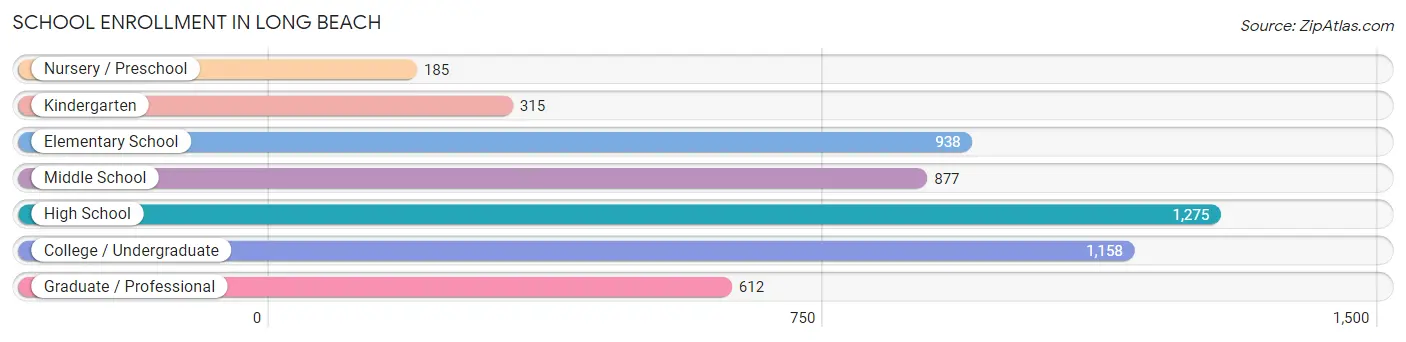
| School Level | # Students | % Students |
| Nursery / Preschool | 185 | 3.5% |
| Kindergarten | 315 | 5.9% |
| Elementary School | 938 | 17.5% |
| Middle School | 877 | 16.4% |
| High School | 1,275 | 23.8% |
| College / Undergraduate | 1,158 | 21.6% |
| Graduate / Professional | 612 | 11.4% |
| Total | 5,360 | 100.0% |
School Enrollment by Age by Funding Source in Long Beach
Out of a total of 5,360 students who are enrolled in schools in Long Beach, 1,276 (23.8%) attend a private institution, while the remaining 4,084 (76.2%) are enrolled in public schools. The age group of 25 to 34 year olds has the highest likelihood of being enrolled in private schools, with 300 (66.4% in the age bracket) enrolled. Conversely, the age group of 5 to 9 year old has the lowest likelihood of being enrolled in a private school, with 1,146 (96.4% in the age bracket) attending a public institution.
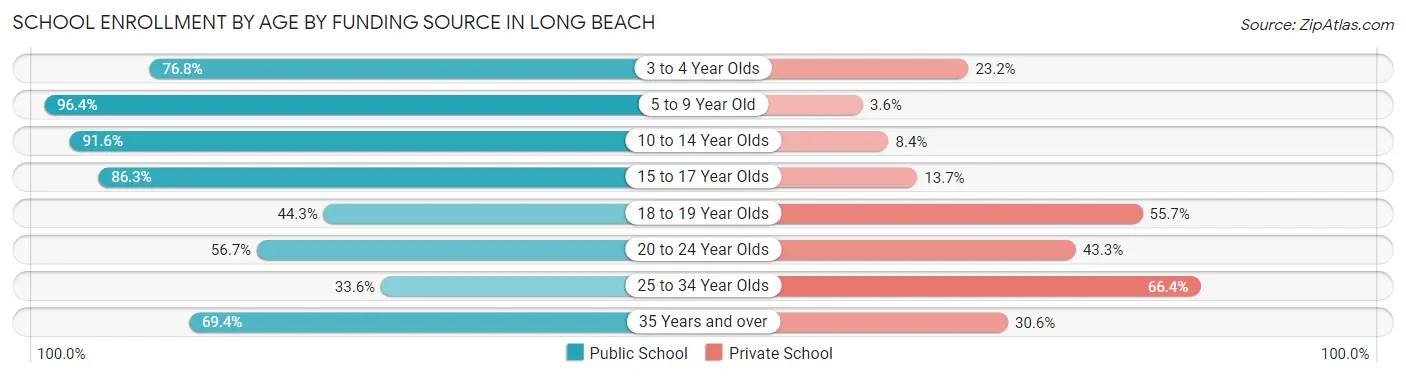
| Age Bracket | Public School | Private School |
| 3 to 4 Year Olds | 142 (76.8%) | 43 (23.2%) |
| 5 to 9 Year Old | 1,146 (96.4%) | 43 (3.6%) |
| 10 to 14 Year Olds | 1,073 (91.6%) | 98 (8.4%) |
| 15 to 17 Year Olds | 735 (86.3%) | 117 (13.7%) |
| 18 to 19 Year Olds | 246 (44.3%) | 309 (55.7%) |
| 20 to 24 Year Olds | 333 (56.7%) | 254 (43.3%) |
| 25 to 34 Year Olds | 152 (33.6%) | 300 (66.4%) |
| 35 Years and over | 256 (69.4%) | 113 (30.6%) |
| Total | 4,084 (76.2%) | 1,276 (23.8%) |
Educational Attainment by Field of Study in Long Beach
Business (3,370 | 22.2%), education (2,587 | 17.1%), science & technology (1,445 | 9.5%), social sciences (1,312 | 8.6%), and psychology (1,108 | 7.3%) are the most common fields of study among 15,176 individuals in Long Beach who have obtained a bachelor's degree or higher.
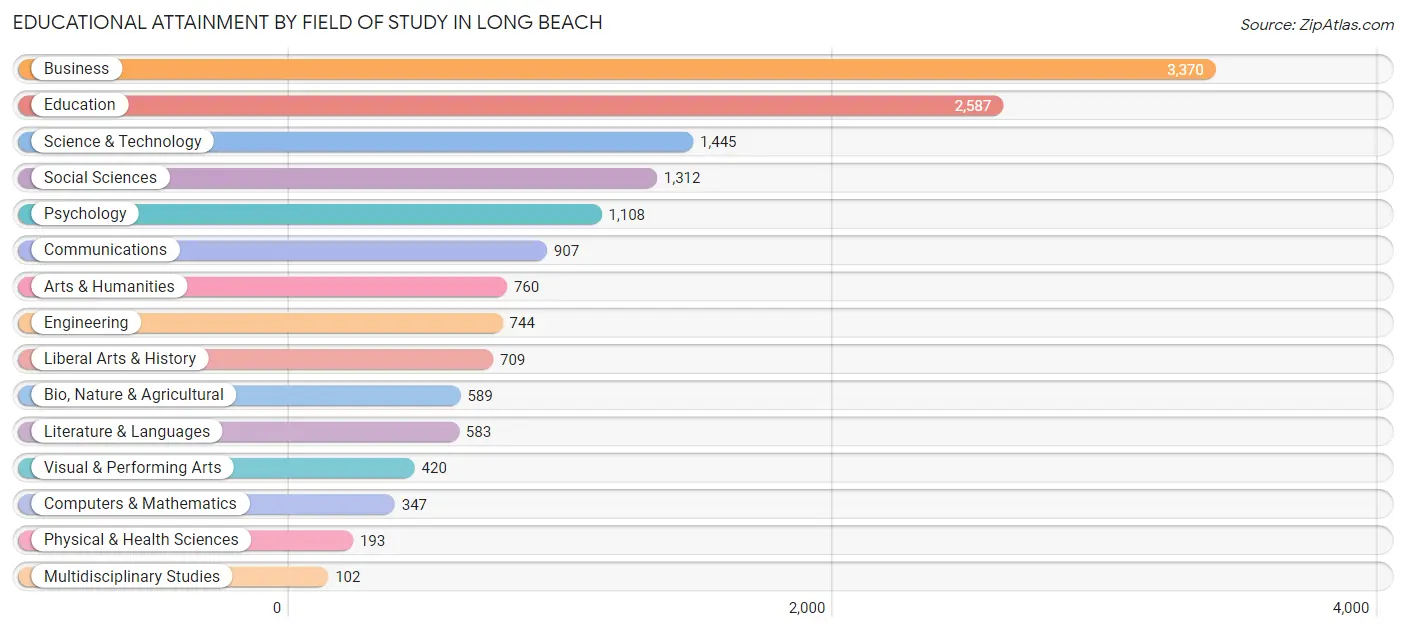
| Field of Study | # Graduates | % Graduates |
| Computers & Mathematics | 347 | 2.3% |
| Bio, Nature & Agricultural | 589 | 3.9% |
| Physical & Health Sciences | 193 | 1.3% |
| Psychology | 1,108 | 7.3% |
| Social Sciences | 1,312 | 8.6% |
| Engineering | 744 | 4.9% |
| Multidisciplinary Studies | 102 | 0.7% |
| Science & Technology | 1,445 | 9.5% |
| Business | 3,370 | 22.2% |
| Education | 2,587 | 17.1% |
| Literature & Languages | 583 | 3.8% |
| Liberal Arts & History | 709 | 4.7% |
| Visual & Performing Arts | 420 | 2.8% |
| Communications | 907 | 6.0% |
| Arts & Humanities | 760 | 5.0% |
| Total | 15,176 | 100.0% |
Transportation & Commute in Long Beach
Vehicle Availability by Sex in Long Beach
The most prevalent vehicle ownership categories in Long Beach are males with 2 vehicles (5,103, accounting for 48.9%) and females with 2 vehicles (3,795, making up 55.8%).
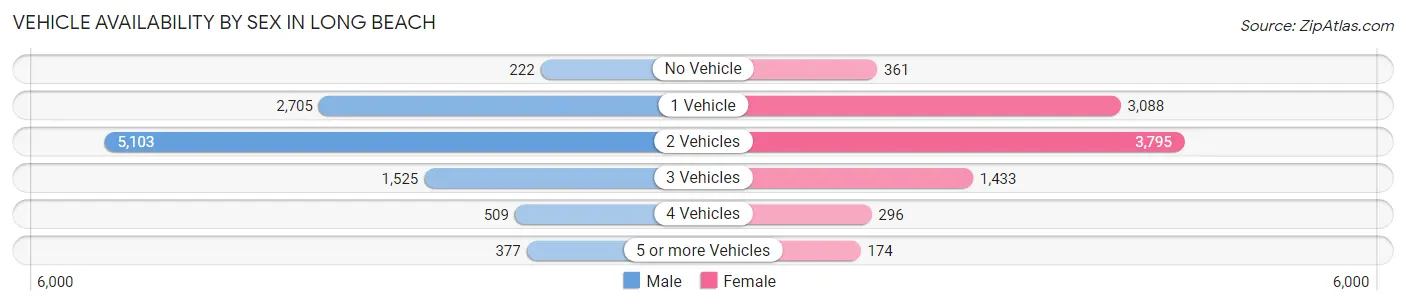
| Vehicles Available | Male | Female |
| No Vehicle | 222 (2.1%) | 361 (4.0%) |
| 1 Vehicle | 2,705 (25.9%) | 3,088 (33.8%) |
| 2 Vehicles | 5,103 (48.9%) | 3,795 (41.5%) |
| 3 Vehicles | 1,525 (14.6%) | 1,433 (15.7%) |
| 4 Vehicles | 509 (4.9%) | 296 (3.2%) |
| 5 or more Vehicles | 377 (3.6%) | 174 (1.9%) |
| Total | 10,441 (100.0%) | 9,147 (100.0%) |
Commute Time in Long Beach
The most frequently occuring commute durations in Long Beach are 60 to 89 minutes (2,822 commuters, 16.9%), 30 to 34 minutes (2,569 commuters, 15.4%), and 45 to 59 minutes (2,518 commuters, 15.1%).
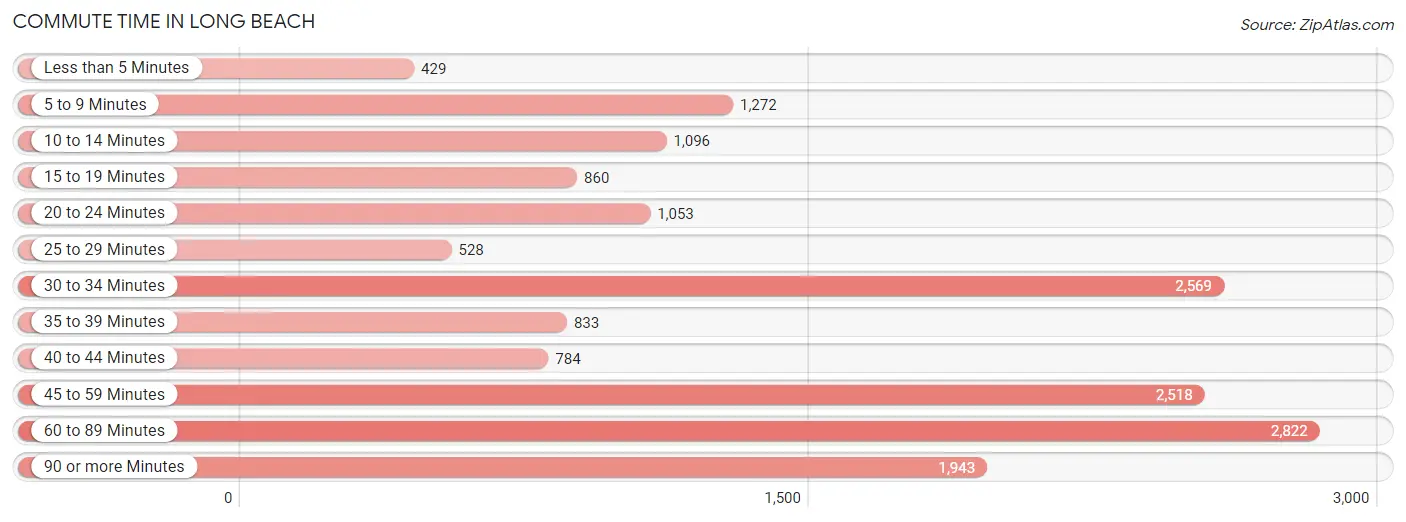
| Commute Time | # Commuters | % Commuters |
| Less than 5 Minutes | 429 | 2.6% |
| 5 to 9 Minutes | 1,272 | 7.6% |
| 10 to 14 Minutes | 1,096 | 6.6% |
| 15 to 19 Minutes | 860 | 5.1% |
| 20 to 24 Minutes | 1,053 | 6.3% |
| 25 to 29 Minutes | 528 | 3.2% |
| 30 to 34 Minutes | 2,569 | 15.4% |
| 35 to 39 Minutes | 833 | 5.0% |
| 40 to 44 Minutes | 784 | 4.7% |
| 45 to 59 Minutes | 2,518 | 15.1% |
| 60 to 89 Minutes | 2,822 | 16.9% |
| 90 or more Minutes | 1,943 | 11.6% |
Commute Time by Sex in Long Beach
The most common commute times in Long Beach are 60 to 89 minutes (1,614 commuters, 18.1%) for males and 60 to 89 minutes (1,208 commuters, 15.5%) for females.
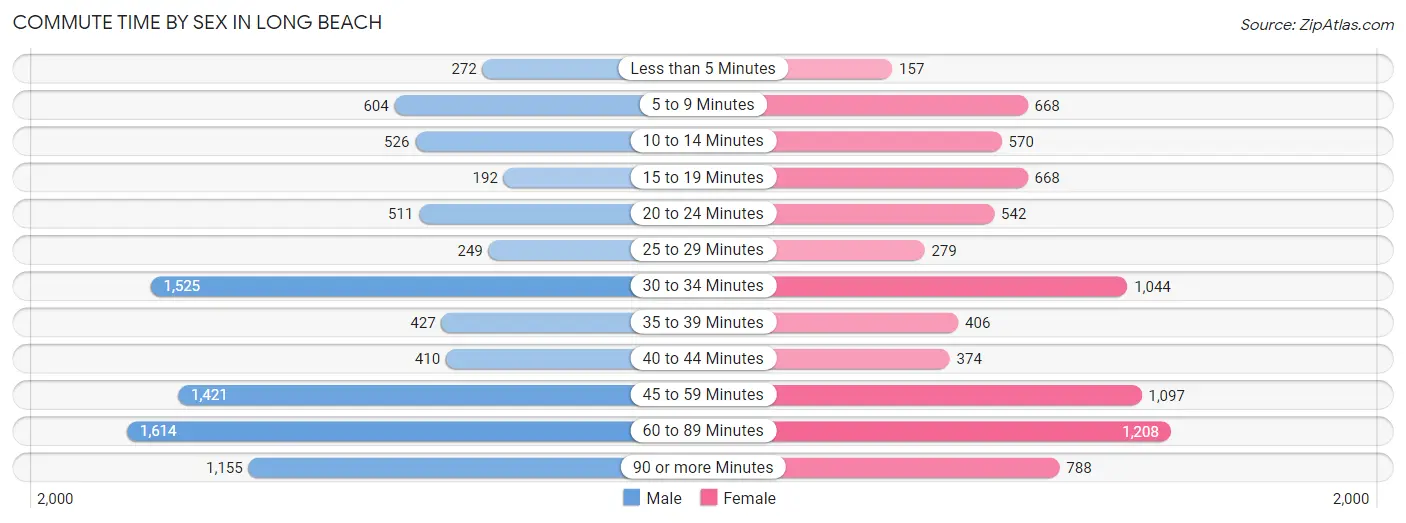
| Commute Time | Male | Female |
| Less than 5 Minutes | 272 (3.0%) | 157 (2.0%) |
| 5 to 9 Minutes | 604 (6.8%) | 668 (8.6%) |
| 10 to 14 Minutes | 526 (5.9%) | 570 (7.3%) |
| 15 to 19 Minutes | 192 (2.2%) | 668 (8.6%) |
| 20 to 24 Minutes | 511 (5.7%) | 542 (7.0%) |
| 25 to 29 Minutes | 249 (2.8%) | 279 (3.6%) |
| 30 to 34 Minutes | 1,525 (17.1%) | 1,044 (13.4%) |
| 35 to 39 Minutes | 427 (4.8%) | 406 (5.2%) |
| 40 to 44 Minutes | 410 (4.6%) | 374 (4.8%) |
| 45 to 59 Minutes | 1,421 (16.0%) | 1,097 (14.1%) |
| 60 to 89 Minutes | 1,614 (18.1%) | 1,208 (15.5%) |
| 90 or more Minutes | 1,155 (13.0%) | 788 (10.1%) |
Time of Departure to Work by Sex in Long Beach
The most frequent times of departure to work in Long Beach are 7:30 AM to 7:59 AM (1,257, 14.1%) for males and 8:00 AM to 8:29 AM (1,149, 14.7%) for females.
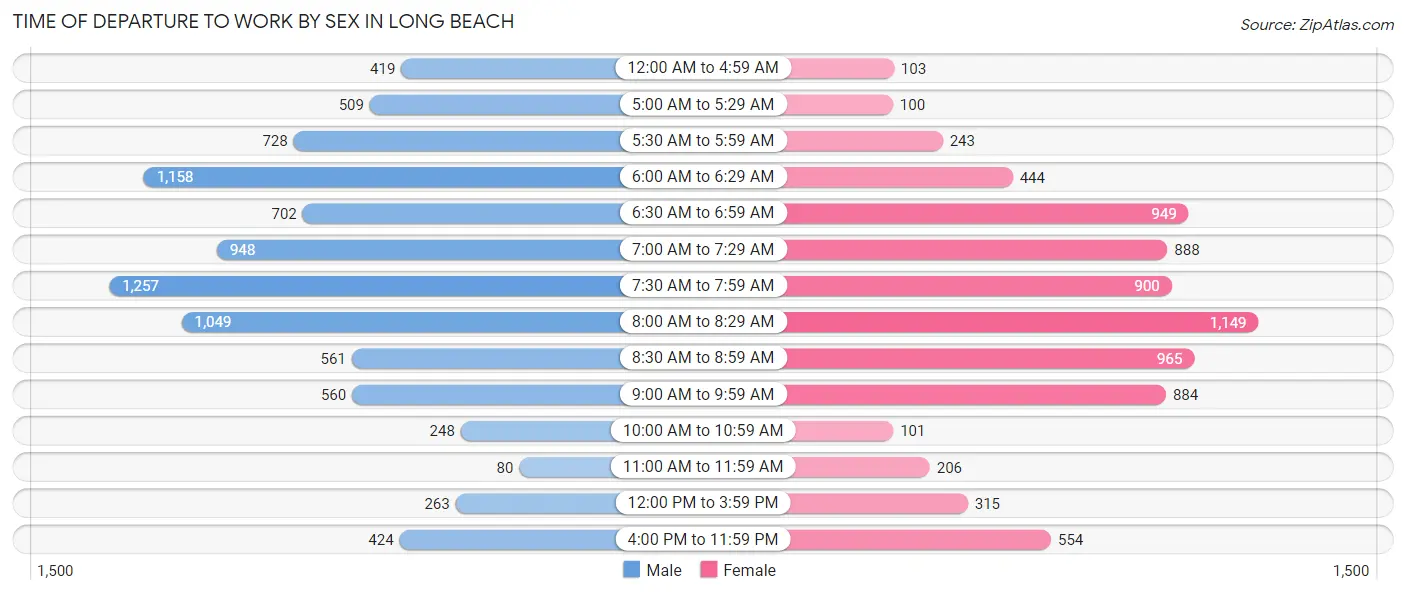
| Time of Departure | Male | Female |
| 12:00 AM to 4:59 AM | 419 (4.7%) | 103 (1.3%) |
| 5:00 AM to 5:29 AM | 509 (5.7%) | 100 (1.3%) |
| 5:30 AM to 5:59 AM | 728 (8.2%) | 243 (3.1%) |
| 6:00 AM to 6:29 AM | 1,158 (13.0%) | 444 (5.7%) |
| 6:30 AM to 6:59 AM | 702 (7.9%) | 949 (12.2%) |
| 7:00 AM to 7:29 AM | 948 (10.6%) | 888 (11.4%) |
| 7:30 AM to 7:59 AM | 1,257 (14.1%) | 900 (11.5%) |
| 8:00 AM to 8:29 AM | 1,049 (11.8%) | 1,149 (14.7%) |
| 8:30 AM to 8:59 AM | 561 (6.3%) | 965 (12.4%) |
| 9:00 AM to 9:59 AM | 560 (6.3%) | 884 (11.3%) |
| 10:00 AM to 10:59 AM | 248 (2.8%) | 101 (1.3%) |
| 11:00 AM to 11:59 AM | 80 (0.9%) | 206 (2.6%) |
| 12:00 PM to 3:59 PM | 263 (2.9%) | 315 (4.0%) |
| 4:00 PM to 11:59 PM | 424 (4.8%) | 554 (7.1%) |
| Total | 8,906 (100.0%) | 7,801 (100.0%) |
Housing Occupancy in Long Beach
Occupancy by Ownership in Long Beach
Of the total 14,259 dwellings in Long Beach, owner-occupied units account for 8,977 (63.0%), while renter-occupied units make up 5,282 (37.0%).
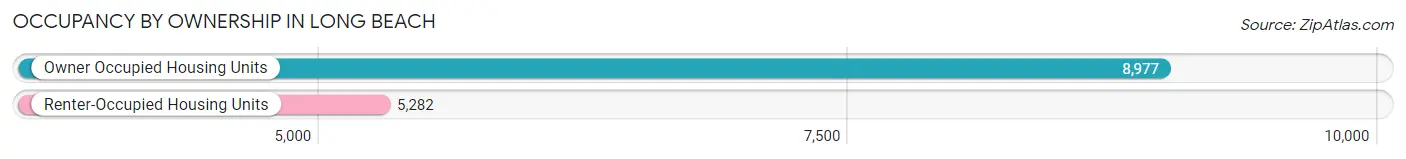
| Occupancy | # Housing Units | % Housing Units |
| Owner Occupied Housing Units | 8,977 | 63.0% |
| Renter-Occupied Housing Units | 5,282 | 37.0% |
| Total Occupied Housing Units | 14,259 | 100.0% |
Occupancy by Household Size in Long Beach
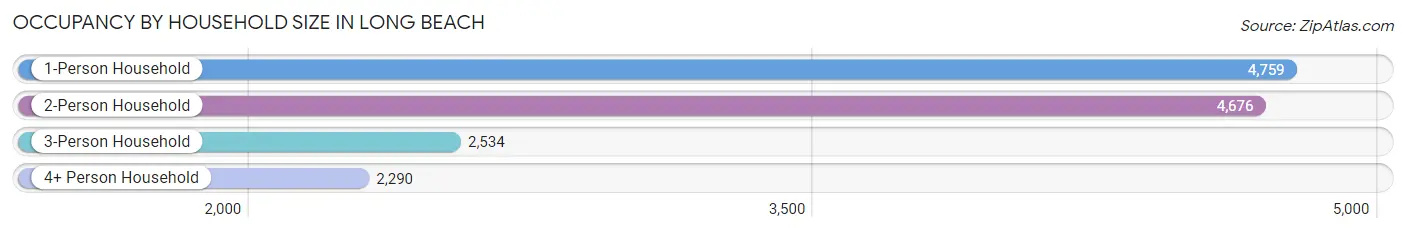
| Household Size | # Housing Units | % Housing Units |
| 1-Person Household | 4,759 | 33.4% |
| 2-Person Household | 4,676 | 32.8% |
| 3-Person Household | 2,534 | 17.8% |
| 4+ Person Household | 2,290 | 16.1% |
| Total Housing Units | 14,259 | 100.0% |
Occupancy by Ownership by Household Size in Long Beach
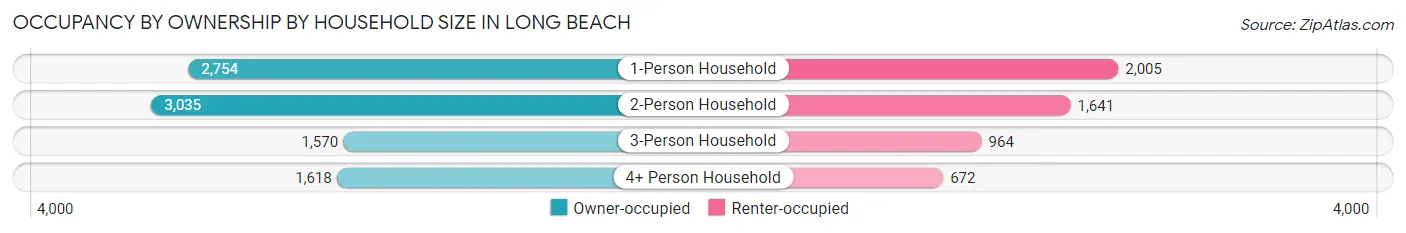
| Household Size | Owner-occupied | Renter-occupied |
| 1-Person Household | 2,754 (57.9%) | 2,005 (42.1%) |
| 2-Person Household | 3,035 (64.9%) | 1,641 (35.1%) |
| 3-Person Household | 1,570 (62.0%) | 964 (38.0%) |
| 4+ Person Household | 1,618 (70.7%) | 672 (29.3%) |
| Total Housing Units | 8,977 (63.0%) | 5,282 (37.0%) |
Occupancy by Educational Attainment in Long Beach
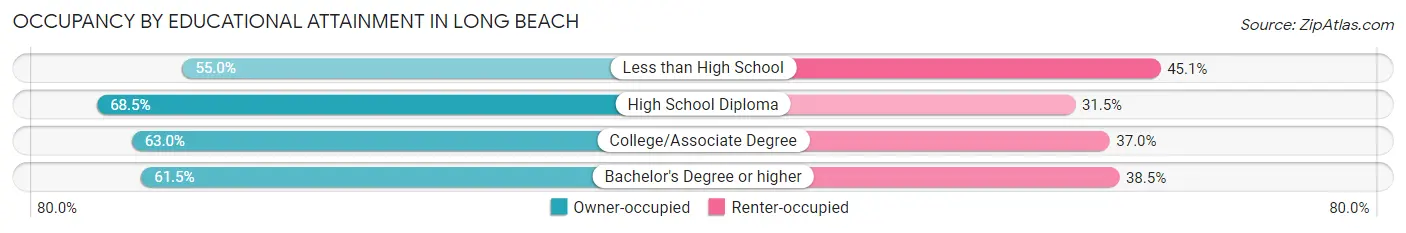
| Household Size | Owner-occupied | Renter-occupied |
| Less than High School | 244 (54.9%) | 200 (45.1%) |
| High School Diploma | 1,837 (68.5%) | 846 (31.5%) |
| College/Associate Degree | 2,109 (63.0%) | 1,238 (37.0%) |
| Bachelor's Degree or higher | 4,787 (61.5%) | 2,998 (38.5%) |
Occupancy by Age of Householder in Long Beach
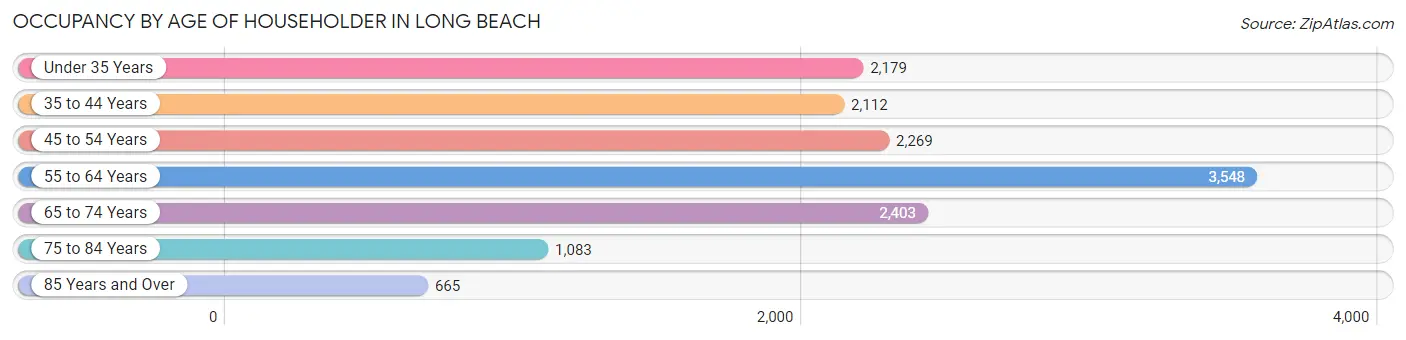
| Age Bracket | # Households | % Households |
| Under 35 Years | 2,179 | 15.3% |
| 35 to 44 Years | 2,112 | 14.8% |
| 45 to 54 Years | 2,269 | 15.9% |
| 55 to 64 Years | 3,548 | 24.9% |
| 65 to 74 Years | 2,403 | 16.9% |
| 75 to 84 Years | 1,083 | 7.6% |
| 85 Years and Over | 665 | 4.7% |
| Total | 14,259 | 100.0% |
Housing Finances in Long Beach
Median Income by Occupancy in Long Beach
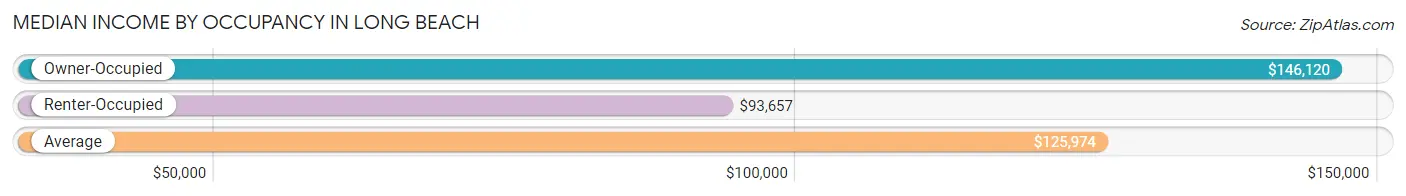
| Occupancy Type | # Households | Median Income |
| Owner-Occupied | 8,977 (63.0%) | $146,120 |
| Renter-Occupied | 5,282 (37.0%) | $93,657 |
| Average | 14,259 (100.0%) | $125,974 |
Occupancy by Householder Income Bracket in Long Beach
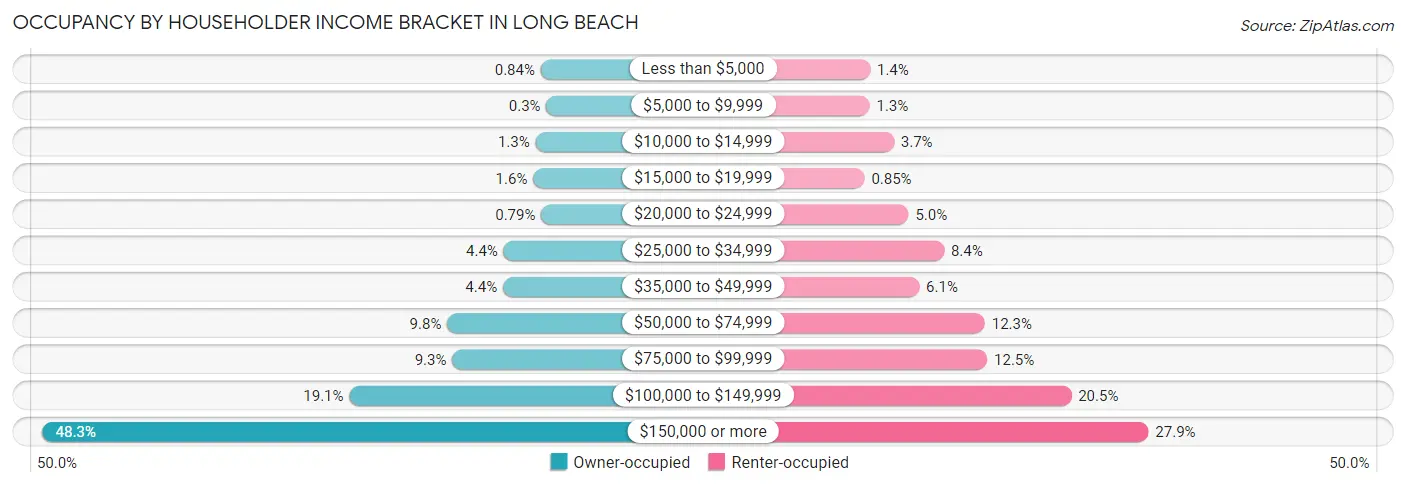
| Income Bracket | Owner-occupied | Renter-occupied |
| Less than $5,000 | 75 (0.8%) | 73 (1.4%) |
| $5,000 to $9,999 | 27 (0.3%) | 70 (1.3%) |
| $10,000 to $14,999 | 120 (1.3%) | 193 (3.6%) |
| $15,000 to $19,999 | 140 (1.6%) | 45 (0.9%) |
| $20,000 to $24,999 | 71 (0.8%) | 266 (5.0%) |
| $25,000 to $34,999 | 392 (4.4%) | 445 (8.4%) |
| $35,000 to $49,999 | 399 (4.4%) | 320 (6.1%) |
| $50,000 to $74,999 | 875 (9.8%) | 650 (12.3%) |
| $75,000 to $99,999 | 832 (9.3%) | 662 (12.5%) |
| $100,000 to $149,999 | 1,712 (19.1%) | 1,085 (20.5%) |
| $150,000 or more | 4,334 (48.3%) | 1,473 (27.9%) |
| Total | 8,977 (100.0%) | 5,282 (100.0%) |
Monthly Housing Cost Tiers in Long Beach
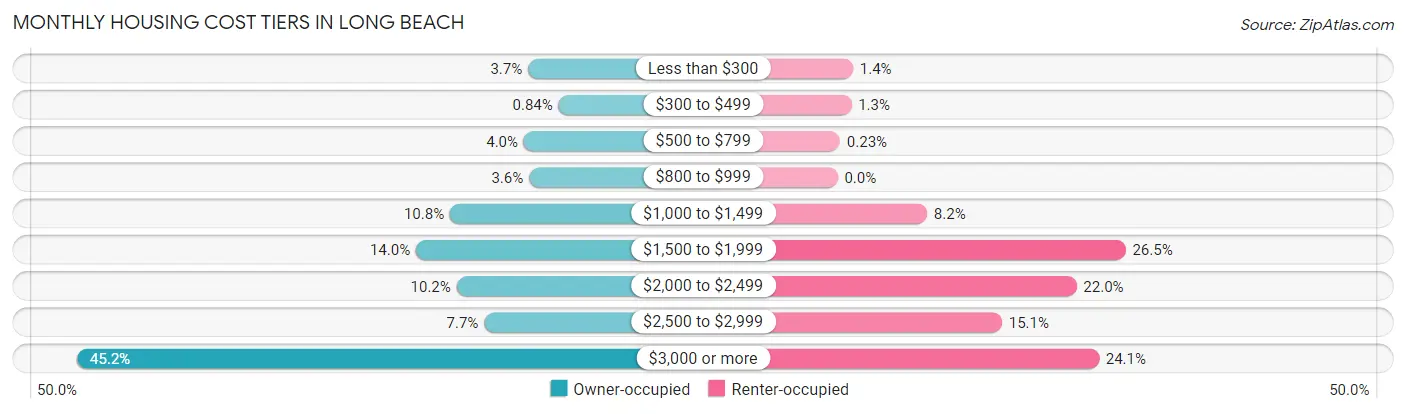
| Monthly Cost | Owner-occupied | Renter-occupied |
| Less than $300 | 328 (3.6%) | 75 (1.4%) |
| $300 to $499 | 75 (0.8%) | 67 (1.3%) |
| $500 to $799 | 363 (4.0%) | 12 (0.2%) |
| $800 to $999 | 320 (3.6%) | 0 (0.0%) |
| $1,000 to $1,499 | 973 (10.8%) | 435 (8.2%) |
| $1,500 to $1,999 | 1,254 (14.0%) | 1,401 (26.5%) |
| $2,000 to $2,499 | 918 (10.2%) | 1,162 (22.0%) |
| $2,500 to $2,999 | 690 (7.7%) | 799 (15.1%) |
| $3,000 or more | 4,056 (45.2%) | 1,271 (24.1%) |
| Total | 8,977 (100.0%) | 5,282 (100.0%) |
Physical Housing Characteristics in Long Beach
Housing Structures in Long Beach
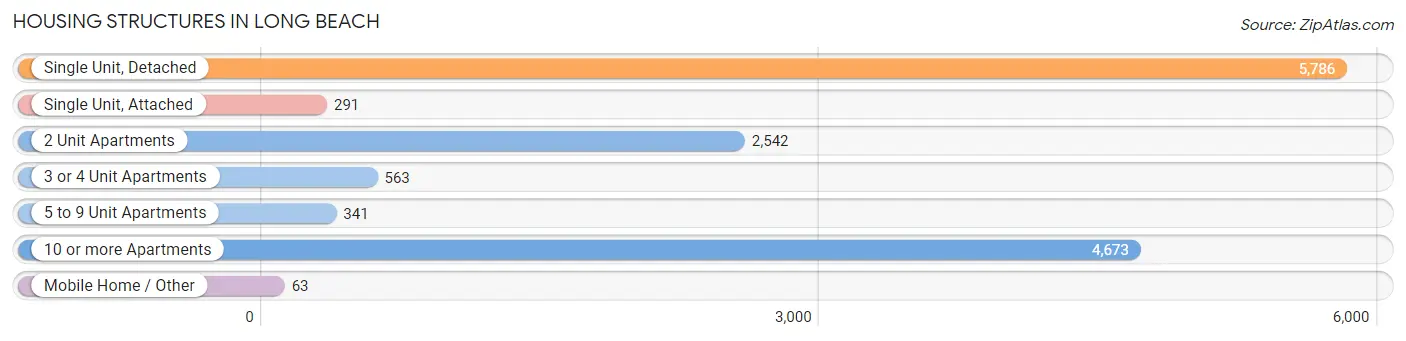
| Structure Type | # Housing Units | % Housing Units |
| Single Unit, Detached | 5,786 | 40.6% |
| Single Unit, Attached | 291 | 2.0% |
| 2 Unit Apartments | 2,542 | 17.8% |
| 3 or 4 Unit Apartments | 563 | 4.0% |
| 5 to 9 Unit Apartments | 341 | 2.4% |
| 10 or more Apartments | 4,673 | 32.8% |
| Mobile Home / Other | 63 | 0.4% |
| Total | 14,259 | 100.0% |
Housing Structures by Occupancy in Long Beach
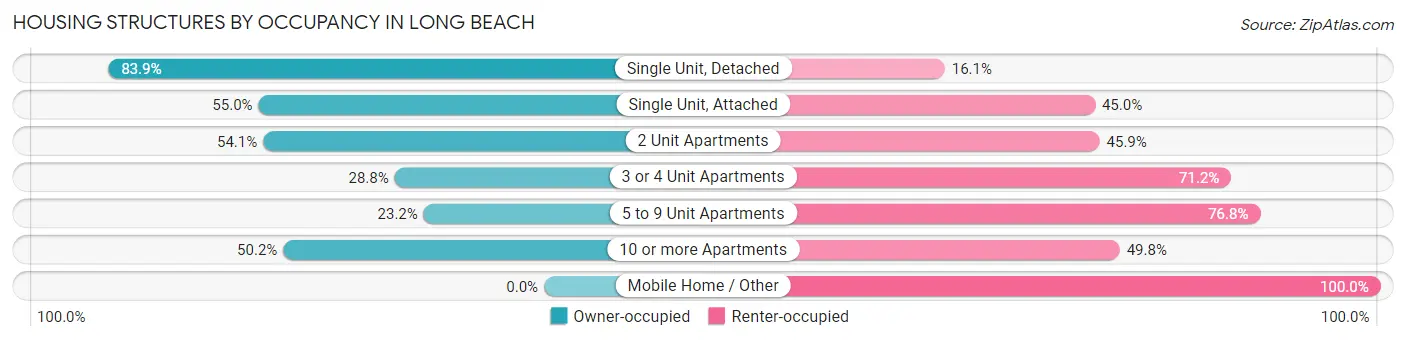
| Structure Type | Owner-occupied | Renter-occupied |
| Single Unit, Detached | 4,854 (83.9%) | 932 (16.1%) |
| Single Unit, Attached | 160 (55.0%) | 131 (45.0%) |
| 2 Unit Apartments | 1,375 (54.1%) | 1,167 (45.9%) |
| 3 or 4 Unit Apartments | 162 (28.8%) | 401 (71.2%) |
| 5 to 9 Unit Apartments | 79 (23.2%) | 262 (76.8%) |
| 10 or more Apartments | 2,347 (50.2%) | 2,326 (49.8%) |
| Mobile Home / Other | 0 (0.0%) | 63 (100.0%) |
| Total | 8,977 (63.0%) | 5,282 (37.0%) |
Housing Structures by Number of Rooms in Long Beach
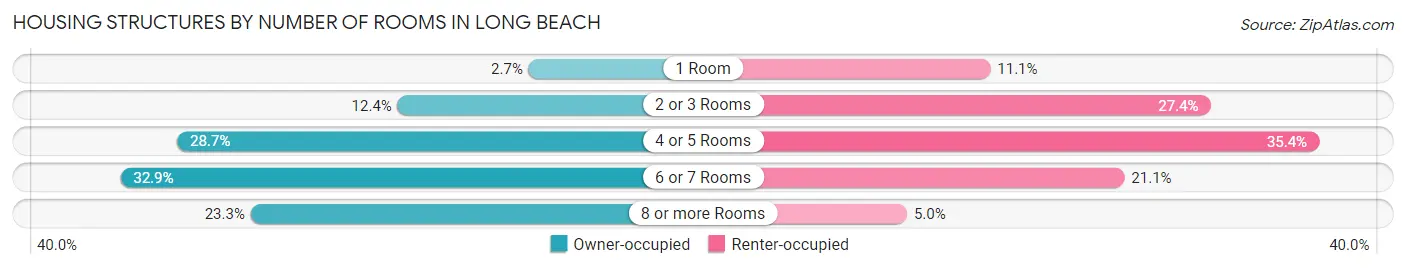
| Number of Rooms | Owner-occupied | Renter-occupied |
| 1 Room | 242 (2.7%) | 588 (11.1%) |
| 2 or 3 Rooms | 1,113 (12.4%) | 1,448 (27.4%) |
| 4 or 5 Rooms | 2,578 (28.7%) | 1,872 (35.4%) |
| 6 or 7 Rooms | 2,955 (32.9%) | 1,112 (21.0%) |
| 8 or more Rooms | 2,089 (23.3%) | 262 (5.0%) |
| Total | 8,977 (100.0%) | 5,282 (100.0%) |
Housing Structure by Heating Type in Long Beach
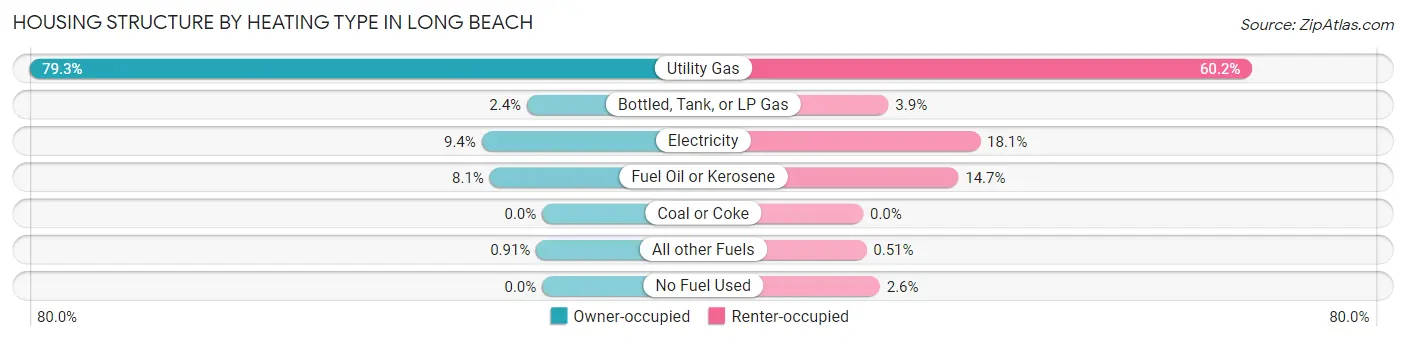
| Heating Type | Owner-occupied | Renter-occupied |
| Utility Gas | 7,118 (79.3%) | 3,177 (60.2%) |
| Bottled, Tank, or LP Gas | 211 (2.4%) | 207 (3.9%) |
| Electricity | 839 (9.3%) | 956 (18.1%) |
| Fuel Oil or Kerosene | 727 (8.1%) | 778 (14.7%) |
| Coal or Coke | 0 (0.0%) | 0 (0.0%) |
| All other Fuels | 82 (0.9%) | 27 (0.5%) |
| No Fuel Used | 0 (0.0%) | 137 (2.6%) |
| Total | 8,977 (100.0%) | 5,282 (100.0%) |
Household Vehicle Usage in Long Beach
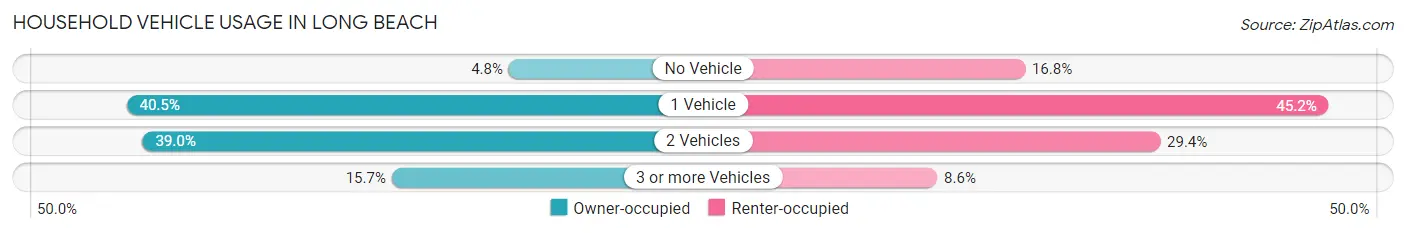
| Vehicles per Household | Owner-occupied | Renter-occupied |
| No Vehicle | 431 (4.8%) | 888 (16.8%) |
| 1 Vehicle | 3,634 (40.5%) | 2,385 (45.2%) |
| 2 Vehicles | 3,500 (39.0%) | 1,554 (29.4%) |
| 3 or more Vehicles | 1,412 (15.7%) | 455 (8.6%) |
| Total | 8,977 (100.0%) | 5,282 (100.0%) |
Real Estate & Mortgages in Long Beach
Real Estate and Mortgage Overview in Long Beach
| Characteristic | Without Mortgage | With Mortgage |
| Housing Units | 3,270 | 5,707 |
| Median Property Value | $617,800 | $638,400 |
| Median Household Income | $115,179 | $2,933 |
| Monthly Housing Costs | $1,469 | $3,916 |
| Real Estate Taxes | $10,001 | $384 |
Property Value by Mortgage Status in Long Beach
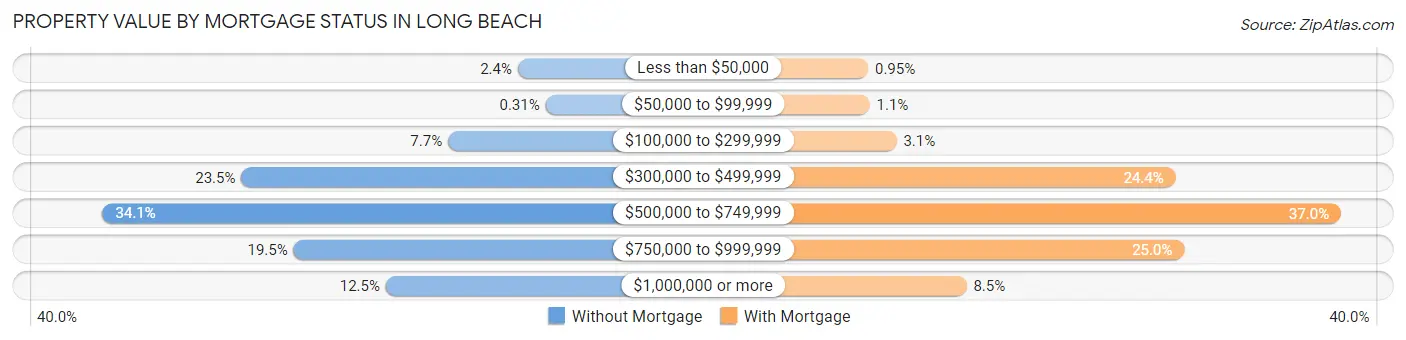
| Property Value | Without Mortgage | With Mortgage |
| Less than $50,000 | 79 (2.4%) | 54 (0.9%) |
| $50,000 to $99,999 | 10 (0.3%) | 61 (1.1%) |
| $100,000 to $299,999 | 253 (7.7%) | 178 (3.1%) |
| $300,000 to $499,999 | 768 (23.5%) | 1,392 (24.4%) |
| $500,000 to $749,999 | 1,114 (34.1%) | 2,111 (37.0%) |
| $750,000 to $999,999 | 638 (19.5%) | 1,429 (25.0%) |
| $1,000,000 or more | 408 (12.5%) | 482 (8.5%) |
| Total | 3,270 (100.0%) | 5,707 (100.0%) |
Household Income by Mortgage Status in Long Beach
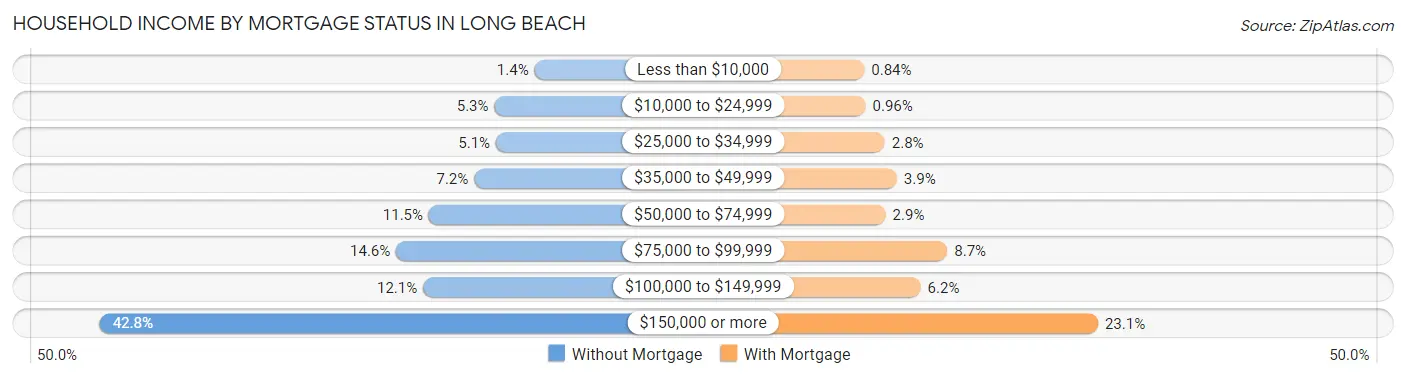
| Household Income | Without Mortgage | With Mortgage |
| Less than $10,000 | 47 (1.4%) | 48 (0.8%) |
| $10,000 to $24,999 | 172 (5.3%) | 55 (1.0%) |
| $25,000 to $34,999 | 167 (5.1%) | 159 (2.8%) |
| $35,000 to $49,999 | 235 (7.2%) | 225 (3.9%) |
| $50,000 to $74,999 | 376 (11.5%) | 164 (2.9%) |
| $75,000 to $99,999 | 478 (14.6%) | 499 (8.7%) |
| $100,000 to $149,999 | 394 (12.0%) | 354 (6.2%) |
| $150,000 or more | 1,401 (42.8%) | 1,318 (23.1%) |
| Total | 3,270 (100.0%) | 5,707 (100.0%) |
Property Value to Household Income Ratio in Long Beach
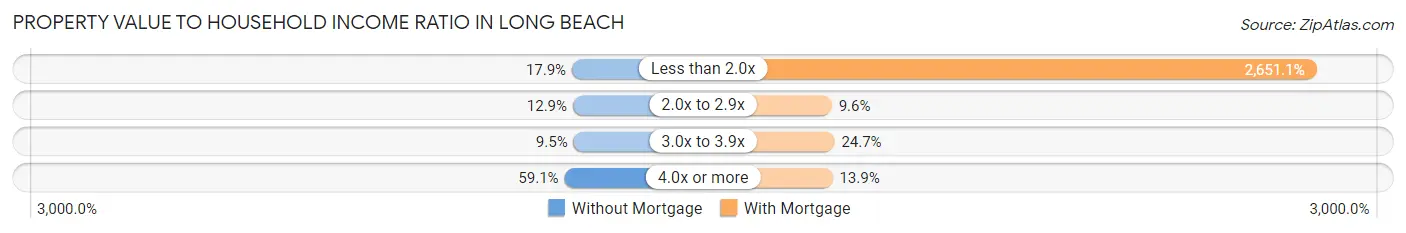
| Value-to-Income Ratio | Without Mortgage | With Mortgage |
| Less than 2.0x | 585 (17.9%) | 151,299 (2,651.1%) |
| 2.0x to 2.9x | 422 (12.9%) | 547 (9.6%) |
| 3.0x to 3.9x | 312 (9.5%) | 1,410 (24.7%) |
| 4.0x or more | 1,931 (59.1%) | 793 (13.9%) |
| Total | 3,270 (100.0%) | 5,707 (100.0%) |
Real Estate Taxes by Mortgage Status in Long Beach
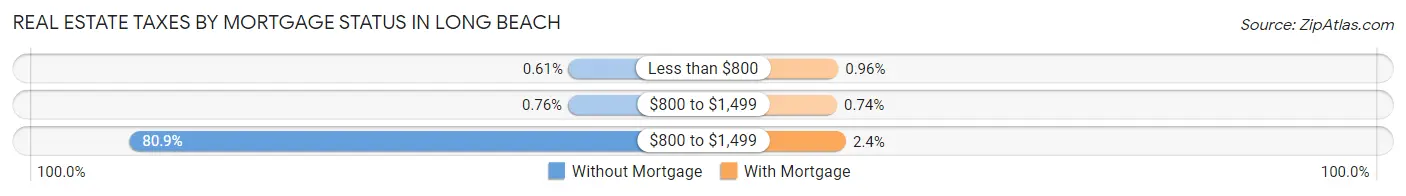
| Property Taxes | Without Mortgage | With Mortgage |
| Less than $800 | 20 (0.6%) | 55 (1.0%) |
| $800 to $1,499 | 25 (0.8%) | 42 (0.7%) |
| $800 to $1,499 | 2,644 (80.9%) | 135 (2.4%) |
| Total | 3,270 (100.0%) | 5,707 (100.0%) |
Health & Disability in Long Beach
Health Insurance Coverage by Age in Long Beach
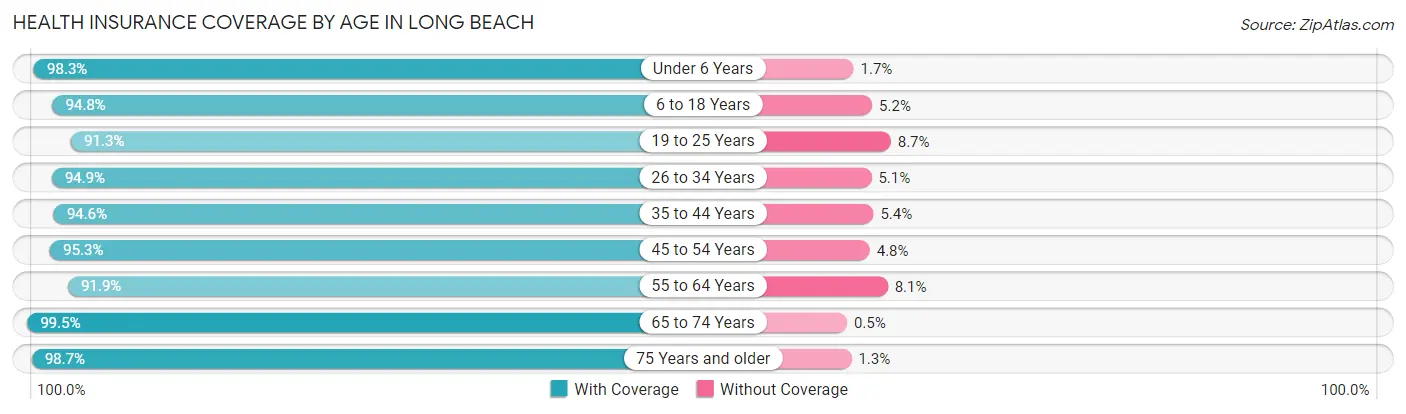
| Age Bracket | With Coverage | Without Coverage |
| Under 6 Years | 1,753 (98.3%) | 31 (1.7%) |
| 6 to 18 Years | 3,211 (94.8%) | 176 (5.2%) |
| 19 to 25 Years | 2,266 (91.3%) | 215 (8.7%) |
| 26 to 34 Years | 5,163 (94.9%) | 275 (5.1%) |
| 35 to 44 Years | 3,857 (94.6%) | 222 (5.4%) |
| 45 to 54 Years | 4,095 (95.3%) | 204 (4.8%) |
| 55 to 64 Years | 5,491 (91.9%) | 483 (8.1%) |
| 65 to 74 Years | 3,785 (99.5%) | 19 (0.5%) |
| 75 Years and older | 2,605 (98.7%) | 35 (1.3%) |
| Total | 32,226 (95.1%) | 1,660 (4.9%) |
Health Insurance Coverage by Citizenship Status in Long Beach
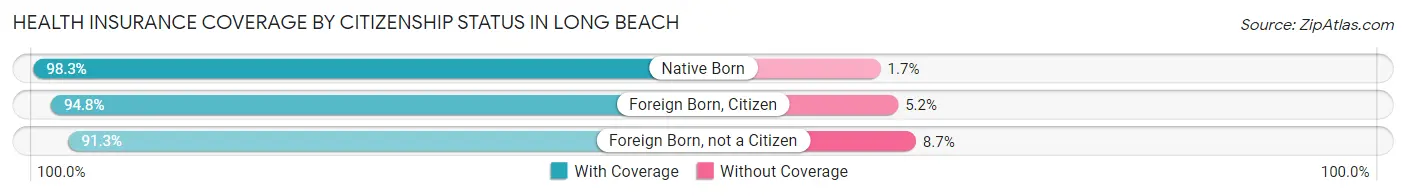
| Citizenship Status | With Coverage | Without Coverage |
| Native Born | 1,753 (98.3%) | 31 (1.7%) |
| Foreign Born, Citizen | 3,211 (94.8%) | 176 (5.2%) |
| Foreign Born, not a Citizen | 2,266 (91.3%) | 215 (8.7%) |
Health Insurance Coverage by Household Income in Long Beach
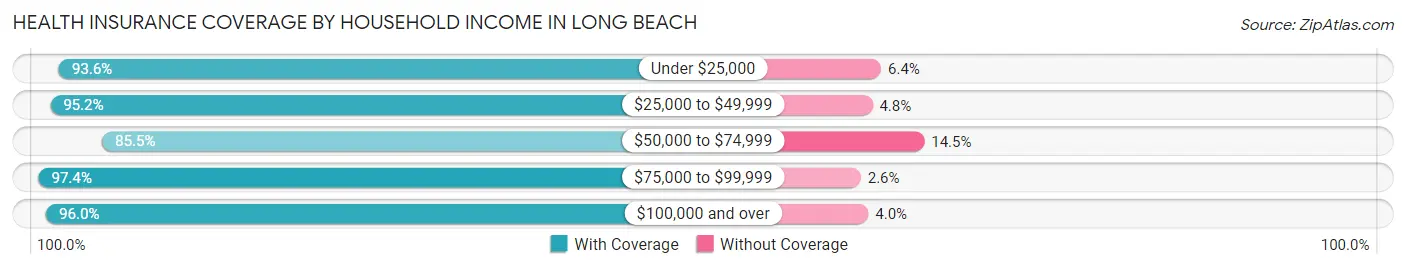
| Household Income | With Coverage | Without Coverage |
| Under $25,000 | 1,383 (93.6%) | 95 (6.4%) |
| $25,000 to $49,999 | 2,416 (95.2%) | 122 (4.8%) |
| $50,000 to $74,999 | 2,260 (85.5%) | 384 (14.5%) |
| $75,000 to $99,999 | 2,642 (97.4%) | 71 (2.6%) |
| $100,000 and over | 23,194 (96.0%) | 976 (4.0%) |
Public vs Private Health Insurance Coverage by Age in Long Beach
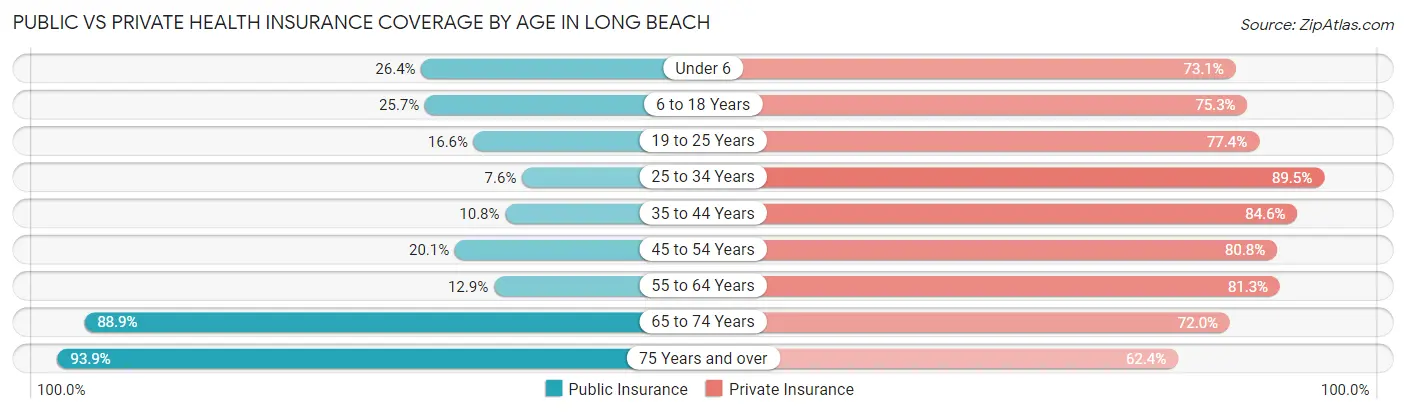
| Age Bracket | Public Insurance | Private Insurance |
| Under 6 | 470 (26.4%) | 1,304 (73.1%) |
| 6 to 18 Years | 869 (25.7%) | 2,550 (75.3%) |
| 19 to 25 Years | 412 (16.6%) | 1,921 (77.4%) |
| 25 to 34 Years | 415 (7.6%) | 4,867 (89.5%) |
| 35 to 44 Years | 439 (10.8%) | 3,449 (84.6%) |
| 45 to 54 Years | 864 (20.1%) | 3,473 (80.8%) |
| 55 to 64 Years | 769 (12.9%) | 4,858 (81.3%) |
| 65 to 74 Years | 3,383 (88.9%) | 2,740 (72.0%) |
| 75 Years and over | 2,479 (93.9%) | 1,648 (62.4%) |
| Total | 10,100 (29.8%) | 26,810 (79.1%) |
Disability Status by Sex by Age in Long Beach
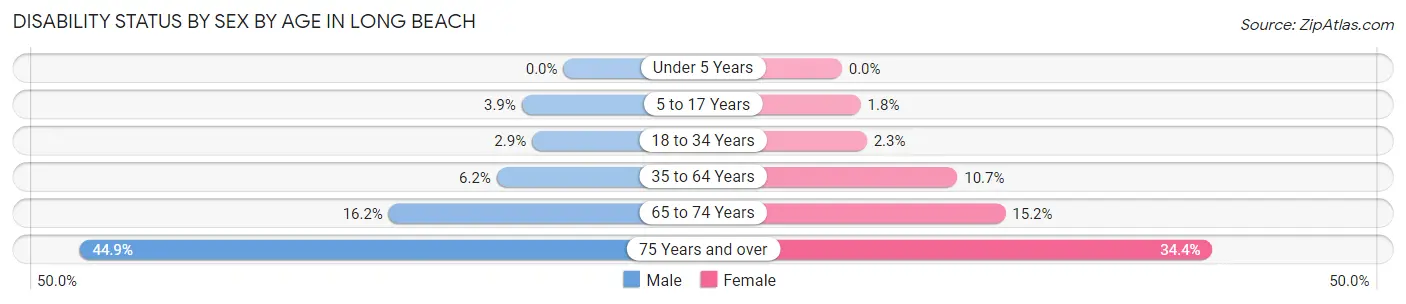
| Age Bracket | Male | Female |
| Under 5 Years | 0 (0.0%) | 0 (0.0%) |
| 5 to 17 Years | 73 (3.9%) | 24 (1.8%) |
| 18 to 34 Years | 132 (2.9%) | 88 (2.3%) |
| 35 to 64 Years | 446 (6.2%) | 766 (10.7%) |
| 65 to 74 Years | 307 (16.2%) | 290 (15.2%) |
| 75 Years and over | 449 (44.9%) | 564 (34.4%) |
Disability Class by Sex by Age in Long Beach
Disability Class: Hearing Difficulty
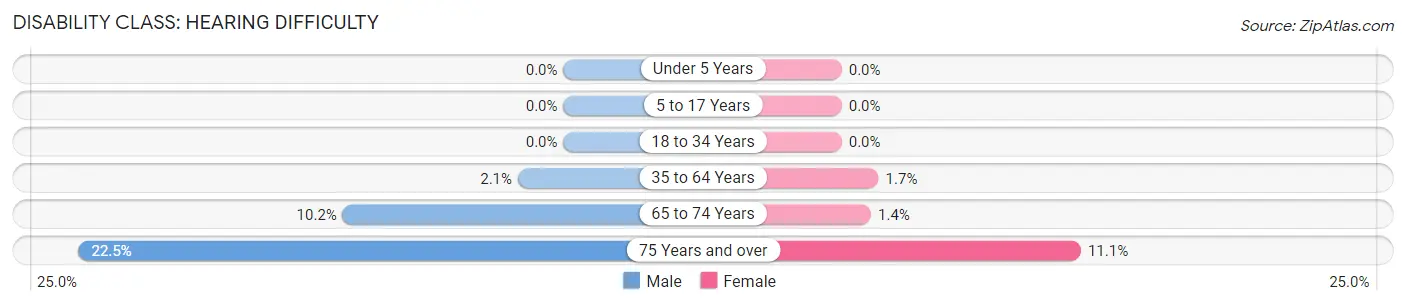
| Age Bracket | Male | Female |
| Under 5 Years | 0 (0.0%) | 0 (0.0%) |
| 5 to 17 Years | 0 (0.0%) | 0 (0.0%) |
| 18 to 34 Years | 0 (0.0%) | 0 (0.0%) |
| 35 to 64 Years | 152 (2.1%) | 122 (1.7%) |
| 65 to 74 Years | 194 (10.2%) | 26 (1.4%) |
| 75 Years and over | 225 (22.5%) | 182 (11.1%) |
Disability Class: Vision Difficulty
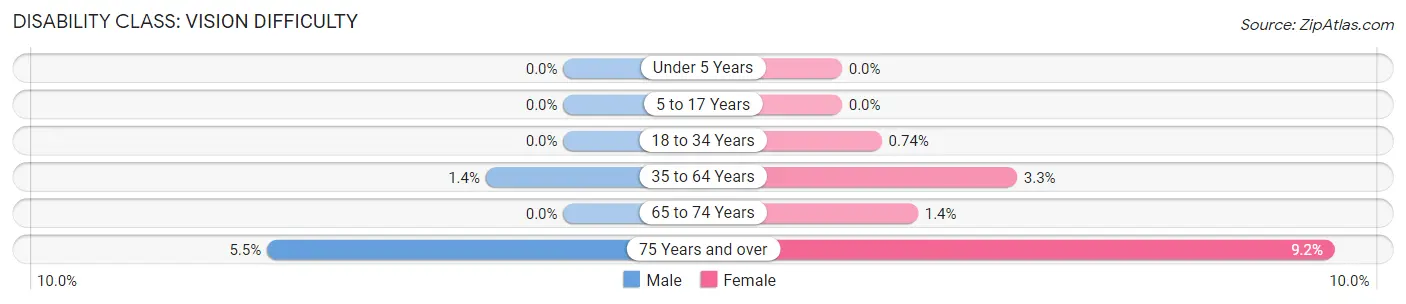
| Age Bracket | Male | Female |
| Under 5 Years | 0 (0.0%) | 0 (0.0%) |
| 5 to 17 Years | 0 (0.0%) | 0 (0.0%) |
| 18 to 34 Years | 0 (0.0%) | 28 (0.7%) |
| 35 to 64 Years | 104 (1.4%) | 232 (3.3%) |
| 65 to 74 Years | 0 (0.0%) | 27 (1.4%) |
| 75 Years and over | 55 (5.5%) | 150 (9.1%) |
Disability Class: Cognitive Difficulty
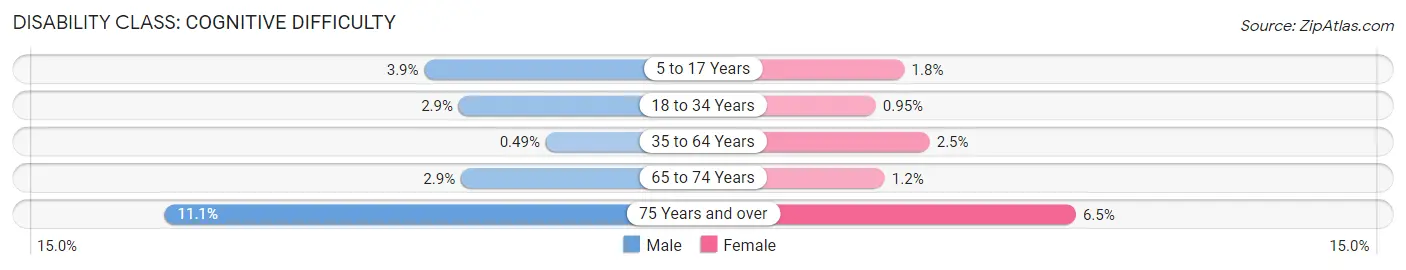
| Age Bracket | Male | Female |
| 5 to 17 Years | 73 (3.9%) | 24 (1.8%) |
| 18 to 34 Years | 132 (2.9%) | 36 (0.9%) |
| 35 to 64 Years | 35 (0.5%) | 175 (2.5%) |
| 65 to 74 Years | 54 (2.9%) | 23 (1.2%) |
| 75 Years and over | 111 (11.1%) | 107 (6.5%) |
Disability Class: Ambulatory Difficulty
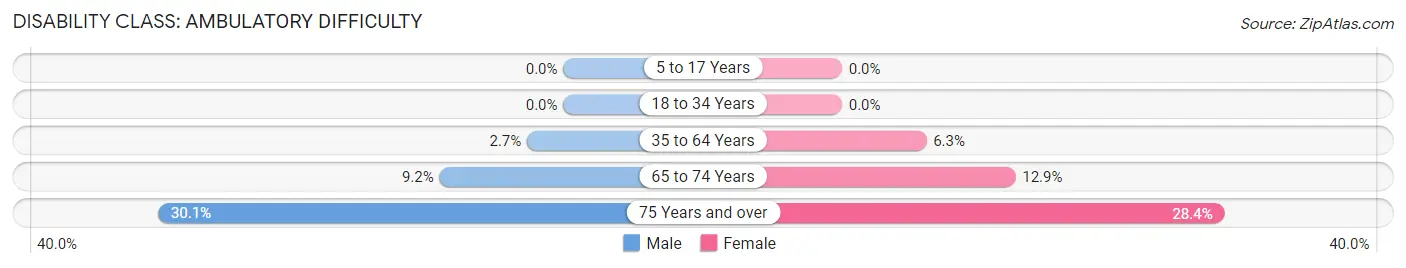
| Age Bracket | Male | Female |
| 5 to 17 Years | 0 (0.0%) | 0 (0.0%) |
| 18 to 34 Years | 0 (0.0%) | 0 (0.0%) |
| 35 to 64 Years | 194 (2.7%) | 448 (6.3%) |
| 65 to 74 Years | 174 (9.2%) | 246 (12.9%) |
| 75 Years and over | 301 (30.1%) | 466 (28.4%) |
Disability Class: Self-Care Difficulty
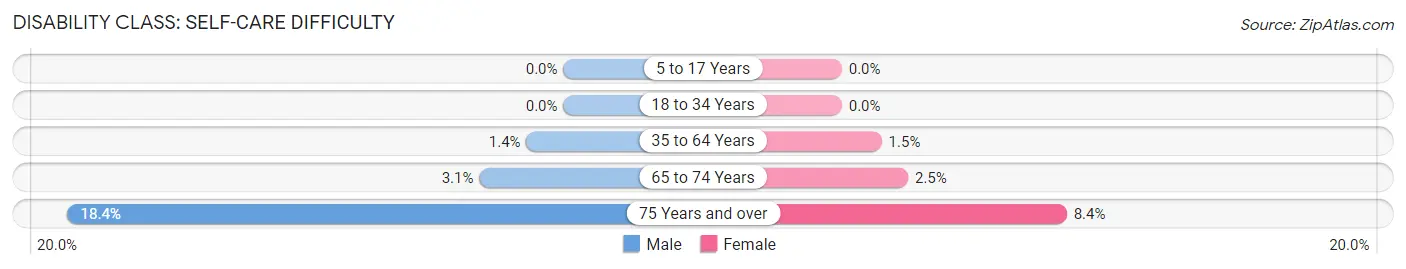
| Age Bracket | Male | Female |
| 5 to 17 Years | 0 (0.0%) | 0 (0.0%) |
| 18 to 34 Years | 0 (0.0%) | 0 (0.0%) |
| 35 to 64 Years | 99 (1.4%) | 106 (1.5%) |
| 65 to 74 Years | 59 (3.1%) | 47 (2.5%) |
| 75 Years and over | 184 (18.4%) | 137 (8.4%) |
Technology Access in Long Beach
Computing Device Access in Long Beach
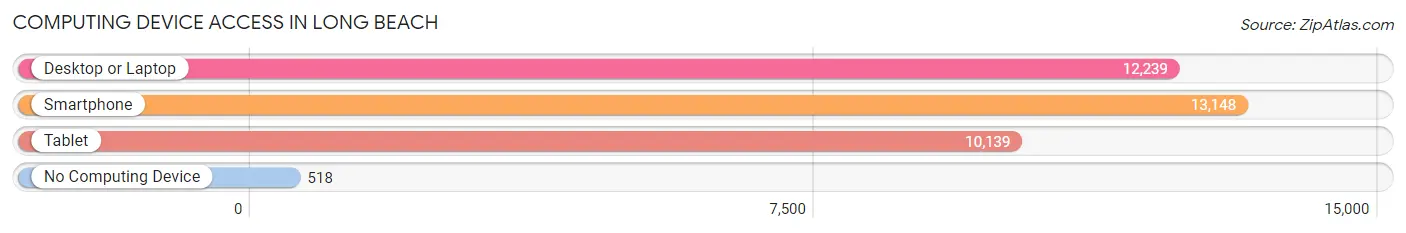
| Device Type | # Households | % Households |
| Desktop or Laptop | 12,239 | 85.8% |
| Smartphone | 13,148 | 92.2% |
| Tablet | 10,139 | 71.1% |
| No Computing Device | 518 | 3.6% |
| Total | 14,259 | 100.0% |
Internet Access in Long Beach
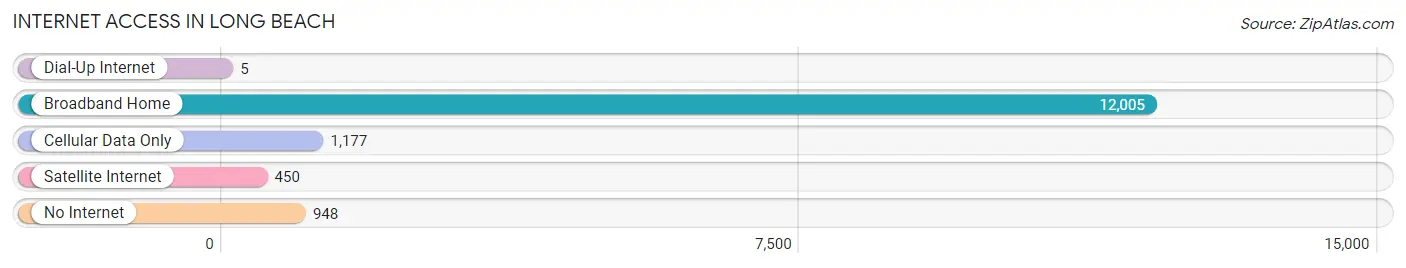
| Internet Type | # Households | % Households |
| Dial-Up Internet | 5 | 0.0% |
| Broadband Home | 12,005 | 84.2% |
| Cellular Data Only | 1,177 | 8.3% |
| Satellite Internet | 450 | 3.2% |
| No Internet | 948 | 6.7% |
| Total | 14,259 | 100.0% |
Long Beach Summary
Long Beach, New York is a city located in Nassau County, on the south shore of Long Island. It is situated on a barrier island, which separates the Atlantic Ocean from Reynolds Channel. The city is bordered by the Atlantic Ocean to the south, East Rockaway Inlet to the east, Reynolds Channel to the north, and Jones Inlet to the west. The city has a population of 33,275, according to the 2010 census.
History
Long Beach was originally inhabited by the Rockaway Indians, a sub-tribe of the Lenape people. The area was first settled by Europeans in 1643, when Thomas Powell purchased land from the Rockaway Indians. The area was known as "Powell's Neck" until 1867, when it was renamed Long Beach. The city was incorporated in 1922, and was initially a popular summer resort destination.
Geography
Long Beach is located on a barrier island, which separates the Atlantic Ocean from Reynolds Channel. The city is bordered by the Atlantic Ocean to the south, East Rockaway Inlet to the east, Reynolds Channel to the north, and Jones Inlet to the west. The city has a total area of 5.5 square miles, of which 4.9 square miles is land and 0.6 square miles is water.
Economy
Long Beach's economy is largely based on tourism and hospitality. The city is home to several hotels, restaurants, and other tourist attractions. The city also has a thriving fishing industry, with several commercial fishing boats operating out of the city's harbor. Additionally, the city is home to several manufacturing and technology companies.
Demographics
As of the 2010 census, Long Beach had a population of 33,275. The racial makeup of the city was 79.2% White, 8.3% African American, 0.3% Native American, 4.2% Asian, 0.1% Pacific Islander, 4.7% from other races, and 3.2% from two or more races. Hispanic or Latino of any race were 11.7% of the population.
The median income for a household in the city was $50,945, and the median income for a family was $60,945. The per capita income for the city was $27,945. About 8.2% of families and 10.3% of the population were below the poverty line, including 14.2% of those under age 18 and 8.2% of those age 65 or over.
Common Questions
What is Per Capita Income in Long Beach?
Per Capita income in Long Beach is $63,853.
What is the Median Family Income in Long Beach?
Median Family Income in Long Beach is $155,721.
What is the Median Household income in Long Beach?
Median Household Income in Long Beach is $125,974.
What is Income or Wage Gap in Long Beach?
Income or Wage Gap in Long Beach is 22.5%.
Women in Long Beach earn 77.5 cents for every dollar earned by a man.
What is Inequality or Gini Index in Long Beach?
Inequality or Gini Index in Long Beach is 0.41.
What is the Total Population of Long Beach?
Total Population of Long Beach is 34,734.
What is the Total Male Population of Long Beach?
Total Male Population of Long Beach is 17,790.
What is the Total Female Population of Long Beach?
Total Female Population of Long Beach is 16,944.
What is the Ratio of Males per 100 Females in Long Beach?
There are 104.99 Males per 100 Females in Long Beach.
What is the Ratio of Females per 100 Males in Long Beach?
There are 95.24 Females per 100 Males in Long Beach.
What is the Median Population Age in Long Beach?
Median Population Age in Long Beach is 45.3 Years.
What is the Average Family Size in Long Beach
Average Family Size in Long Beach is 3.1 People.
What is the Average Household Size in Long Beach
Average Household Size in Long Beach is 2.4 People.
How Large is the Labor Force in Long Beach?
There are 20,940 People in the Labor Forcein in Long Beach.
What is the Percentage of People in the Labor Force in Long Beach?
68.4% of People are in the Labor Force in Long Beach.
What is the Unemployment Rate in Long Beach?
Unemployment Rate in Long Beach is 3.8%.