Holyoke, MA Map & Demographics
Holyoke Map
Holyoke Overview
$27,973
PER CAPITA INCOME
$59,787
AVG FAMILY INCOME
$49,007
AVG HOUSEHOLD INCOME
19.7%
WAGE / INCOME GAP [ % ]
80.3¢/ $1
WAGE / INCOME GAP [ $ ]
$11,480
FAMILY INCOME DEFICIT
0.49
INEQUALITY / GINI INDEX
38,210
TOTAL POPULATION
18,805
MALE POPULATION
19,405
FEMALE POPULATION
96.91
MALES / 100 FEMALES
103.19
FEMALES / 100 MALES
37.5
MEDIAN AGE
3.1
AVG FAMILY SIZE
2.5
AVG HOUSEHOLD SIZE
16,599
LABOR FORCE [ PEOPLE ]
54.2%
PERCENT IN LABOR FORCE
6.8%
UNEMPLOYMENT RATE
Holyoke Zip Codes
Holyoke Area Codes
Income in Holyoke
Income Overview in Holyoke
Per Capita Income in Holyoke is $27,973, while median incomes of families and households are $59,787 and $49,007 respectively.
| Characteristic | Number | Measure |
| Per Capita Income | 38,210 | $27,973 |
| Median Family Income | 8,980 | $59,787 |
| Mean Family Income | 8,980 | $80,758 |
| Median Household Income | 15,112 | $49,007 |
| Mean Household Income | 15,112 | $68,330 |
| Income Deficit | 8,980 | $11,480 |
| Wage / Income Gap (%) | 38,210 | 19.72% |
| Wage / Income Gap ($) | 38,210 | 80.28¢ per $1 |
| Gini / Inequality Index | 38,210 | 0.49 |
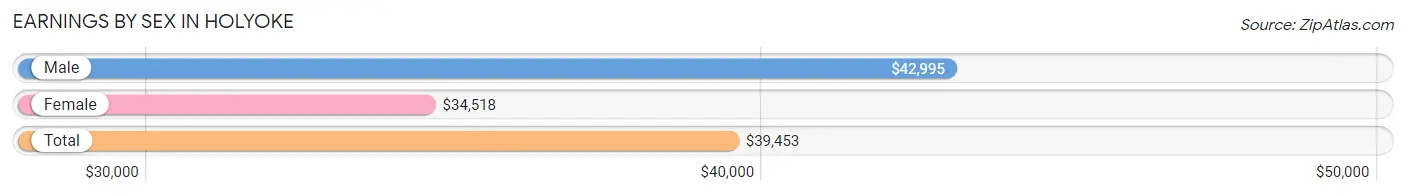
Earnings by Sex in Holyoke
Average Earnings in Holyoke are $39,453, $42,995 for men and $34,518 for women, a difference of 19.7%.
| Sex | Number | Average Earnings |
| Male | 8,213 (48.8%) | $42,995 |
| Female | 8,631 (51.2%) | $34,518 |
| Total | 16,844 (100.0%) | $39,453 |
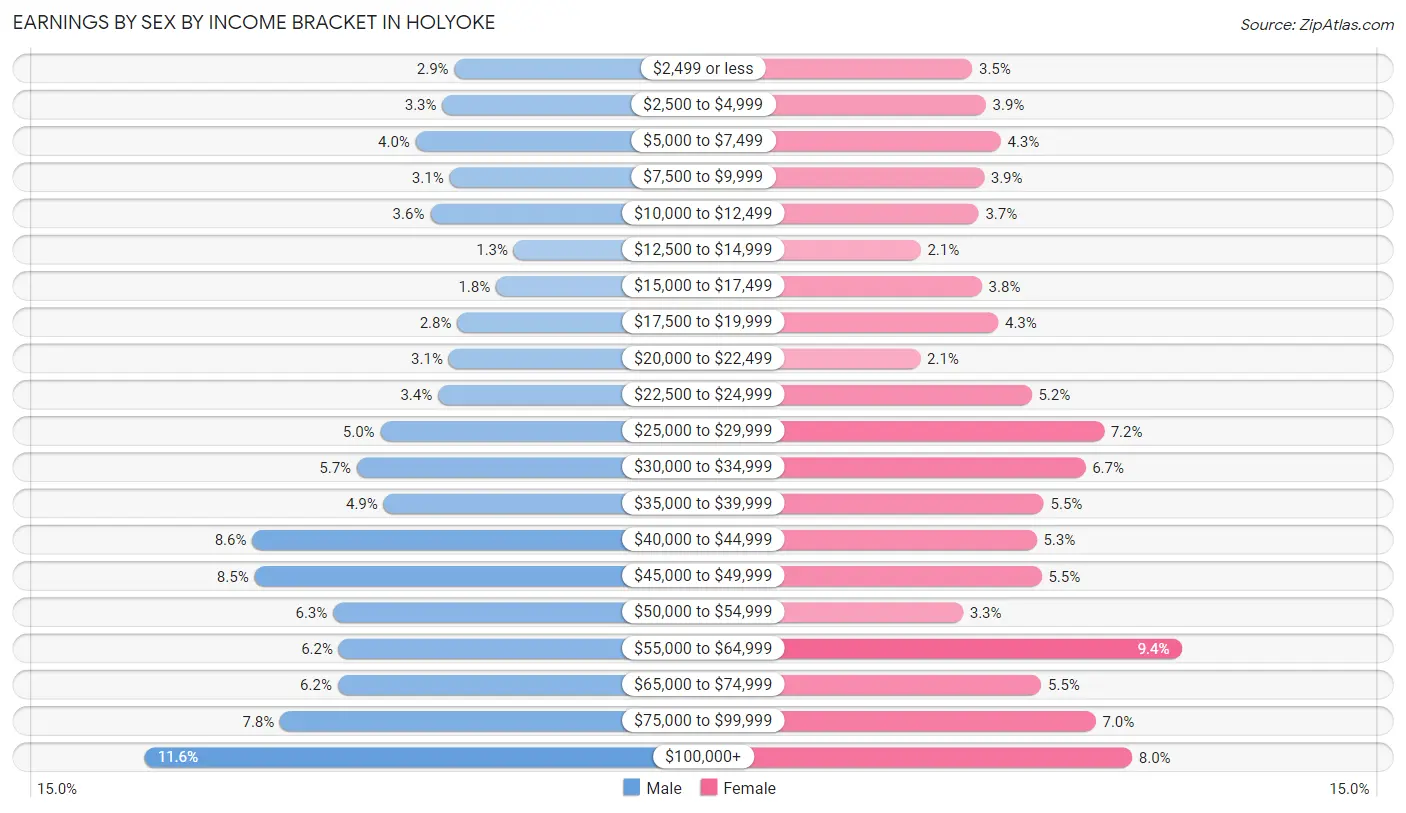
Earnings by Sex by Income Bracket in Holyoke
The most common earnings brackets in Holyoke are $100,000+ for men (954 | 11.6%) and $55,000 to $64,999 for women (811 | 9.4%).
| Income | Male | Female |
| $2,499 or less | 240 (2.9%) | 304 (3.5%) |
| $2,500 to $4,999 | 268 (3.3%) | 337 (3.9%) |
| $5,000 to $7,499 | 329 (4.0%) | 373 (4.3%) |
| $7,500 to $9,999 | 251 (3.1%) | 332 (3.8%) |
| $10,000 to $12,499 | 296 (3.6%) | 319 (3.7%) |
| $12,500 to $14,999 | 103 (1.3%) | 179 (2.1%) |
| $15,000 to $17,499 | 144 (1.8%) | 327 (3.8%) |
| $17,500 to $19,999 | 233 (2.8%) | 367 (4.3%) |
| $20,000 to $22,499 | 253 (3.1%) | 178 (2.1%) |
| $22,500 to $24,999 | 278 (3.4%) | 448 (5.2%) |
| $25,000 to $29,999 | 411 (5.0%) | 623 (7.2%) |
| $30,000 to $34,999 | 465 (5.7%) | 578 (6.7%) |
| $35,000 to $39,999 | 403 (4.9%) | 477 (5.5%) |
| $40,000 to $44,999 | 706 (8.6%) | 460 (5.3%) |
| $45,000 to $49,999 | 701 (8.5%) | 472 (5.5%) |
| $50,000 to $54,999 | 520 (6.3%) | 281 (3.3%) |
| $55,000 to $64,999 | 507 (6.2%) | 811 (9.4%) |
| $65,000 to $74,999 | 509 (6.2%) | 471 (5.5%) |
| $75,000 to $99,999 | 642 (7.8%) | 603 (7.0%) |
| $100,000+ | 954 (11.6%) | 691 (8.0%) |
| Total | 8,213 (100.0%) | 8,631 (100.0%) |
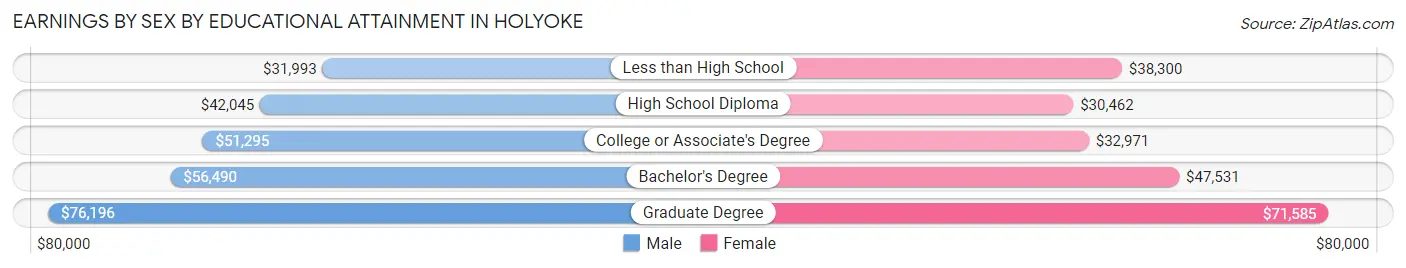
Earnings by Sex by Educational Attainment in Holyoke
Average earnings in Holyoke are $46,220 for men and $39,510 for women, a difference of 14.5%. Men with an educational attainment of graduate degree enjoy the highest average annual earnings of $76,196, while those with less than high school education earn the least with $31,993. Women with an educational attainment of graduate degree earn the most with the average annual earnings of $71,585, while those with high school diploma education have the smallest earnings of $30,462.
| Educational Attainment | Male Income | Female Income |
| Less than High School | $31,993 | $38,300 |
| High School Diploma | $42,045 | $30,462 |
| College or Associate's Degree | $51,295 | $32,971 |
| Bachelor's Degree | $56,490 | $47,531 |
| Graduate Degree | $76,196 | $71,585 |
| Total | $46,220 | $39,510 |
Family Income in Holyoke
Family Income Brackets in Holyoke
According to the Holyoke family income data, there are 1,392 families falling into the $50,000 to $74,999 income range, which is the most common income bracket and makes up 15.5% of all families. Conversely, the $10,000 to $14,999 income bracket is the least frequent group with only 458 families (5.1%) belonging to this category.
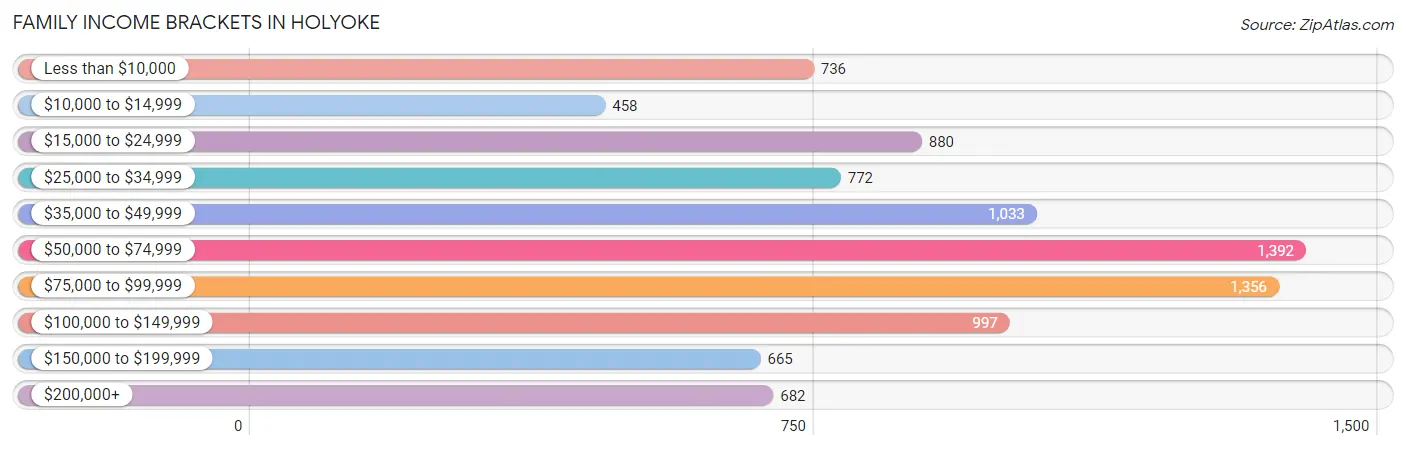
| Income Bracket | # Families | % Families |
| Less than $10,000 | 736 | 8.2% |
| $10,000 to $14,999 | 458 | 5.1% |
| $15,000 to $24,999 | 880 | 9.8% |
| $25,000 to $34,999 | 772 | 8.6% |
| $35,000 to $49,999 | 1,033 | 11.5% |
| $50,000 to $74,999 | 1,392 | 15.5% |
| $75,000 to $99,999 | 1,356 | 15.1% |
| $100,000 to $149,999 | 997 | 11.1% |
| $150,000 to $199,999 | 665 | 7.4% |
| $200,000+ | 682 | 7.6% |
Family Income by Famaliy Size in Holyoke
6-person families (153 | 1.7%) account for the highest median family income in Holyoke with $92,768 per family, while 2-person families (4,237 | 47.2%) have the highest median income of $29,854 per family member.
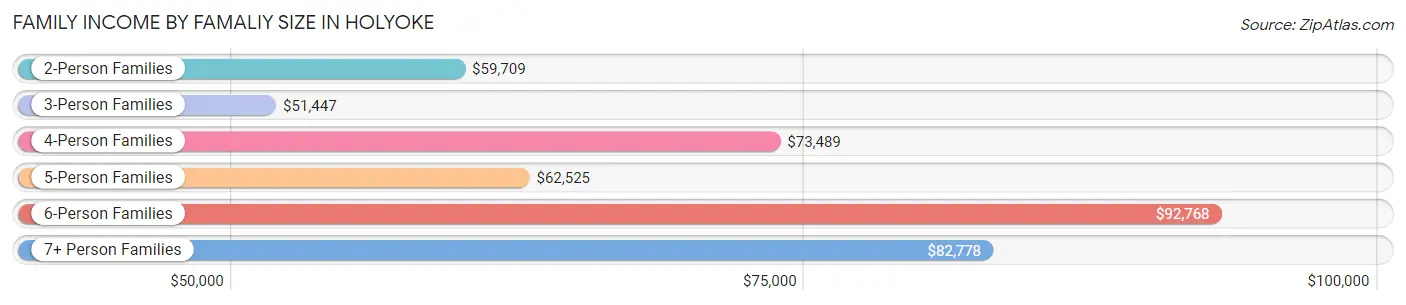
| Income Bracket | # Families | Median Income |
| 2-Person Families | 4,237 (47.2%) | $59,709 |
| 3-Person Families | 2,290 (25.5%) | $51,447 |
| 4-Person Families | 1,433 (16.0%) | $73,489 |
| 5-Person Families | 775 (8.6%) | $62,525 |
| 6-Person Families | 153 (1.7%) | $92,768 |
| 7+ Person Families | 92 (1.0%) | $82,778 |
| Total | 8,980 (100.0%) | $59,787 |
Family Income by Number of Earners in Holyoke
The median family income in Holyoke is $59,787, with families comprising 3+ earners (678) having the highest median family income of $154,018, while families with no earners (1,972) have the lowest median family income of $20,348, accounting for 7.5% and 22.0% of families, respectively.
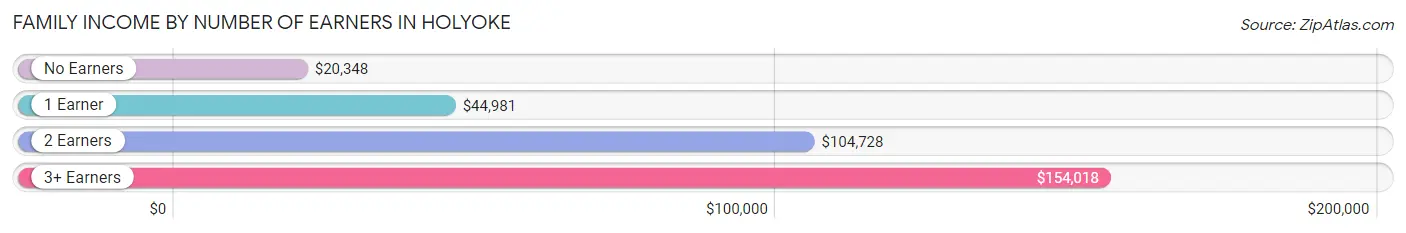
| Number of Earners | # Families | Median Income |
| No Earners | 1,972 (22.0%) | $20,348 |
| 1 Earner | 3,619 (40.3%) | $44,981 |
| 2 Earners | 2,711 (30.2%) | $104,728 |
| 3+ Earners | 678 (7.5%) | $154,018 |
| Total | 8,980 (100.0%) | $59,787 |
Household Income in Holyoke
Household Income Brackets in Holyoke
With 2,539 households falling in the category, the $50,000 to $74,999 income range is the most frequent in Holyoke, accounting for 16.8% of all households. In contrast, only 771 households (5.1%) fall into the $200,000+ income bracket, making it the least populous group.
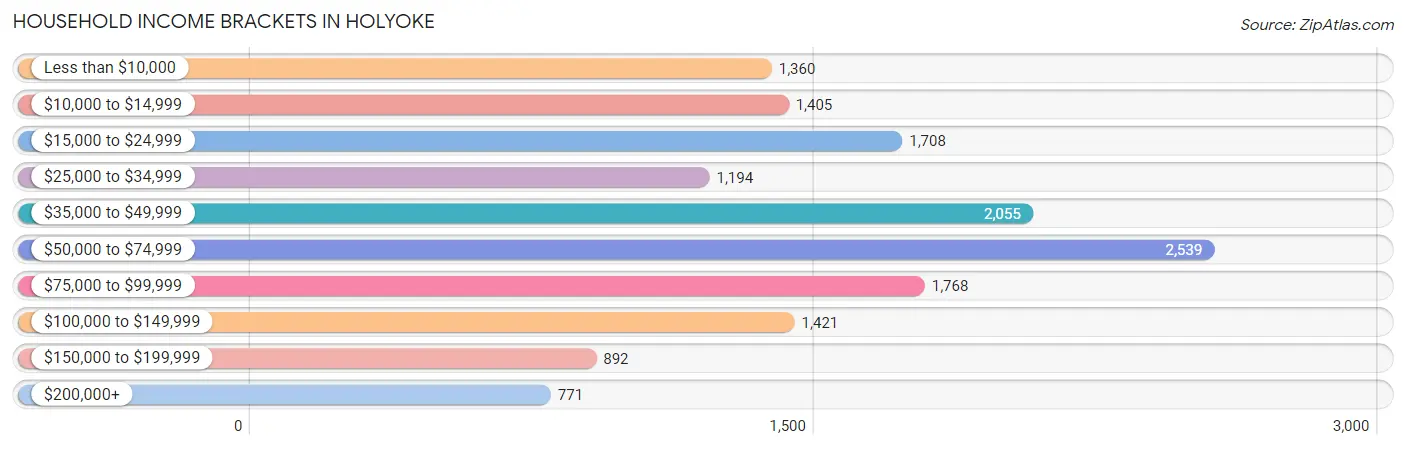
| Income Bracket | # Households | % Households |
| Less than $10,000 | 1,360 | 9.0% |
| $10,000 to $14,999 | 1,405 | 9.3% |
| $15,000 to $24,999 | 1,708 | 11.3% |
| $25,000 to $34,999 | 1,194 | 7.9% |
| $35,000 to $49,999 | 2,055 | 13.6% |
| $50,000 to $74,999 | 2,539 | 16.8% |
| $75,000 to $99,999 | 1,768 | 11.7% |
| $100,000 to $149,999 | 1,421 | 9.4% |
| $150,000 to $199,999 | 892 | 5.9% |
| $200,000+ | 771 | 5.1% |
Household Income by Householder Age in Holyoke
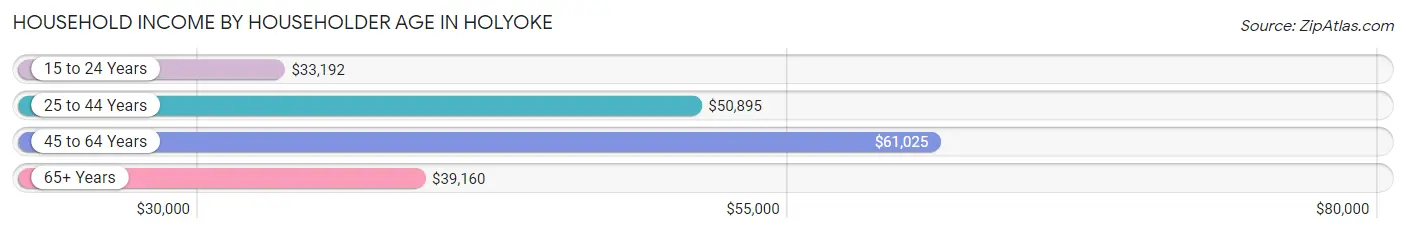
The median household income in Holyoke is $49,007, with the highest median household income of $61,025 found in the 45 to 64 years age bracket for the primary householder. A total of 5,443 households (36.0%) fall into this category. Meanwhile, the 15 to 24 years age bracket for the primary householder has the lowest median household income of $33,192, with 725 households (4.8%) in this group.
| Income Bracket | # Households | Median Income |
| 15 to 24 Years | 725 (4.8%) | $33,192 |
| 25 to 44 Years | 5,039 (33.3%) | $50,895 |
| 45 to 64 Years | 5,443 (36.0%) | $61,025 |
| 65+ Years | 3,905 (25.8%) | $39,160 |
| Total | 15,112 (100.0%) | $49,007 |
Poverty in Holyoke
Income Below Poverty by Sex and Age in Holyoke
With 25.1% poverty level for males and 26.9% for females among the residents of Holyoke, 5 year old males and 15 year old females are the most vulnerable to poverty, with 43 males (51.8%) and 144 females (59.5%) in their respective age groups living below the poverty level.
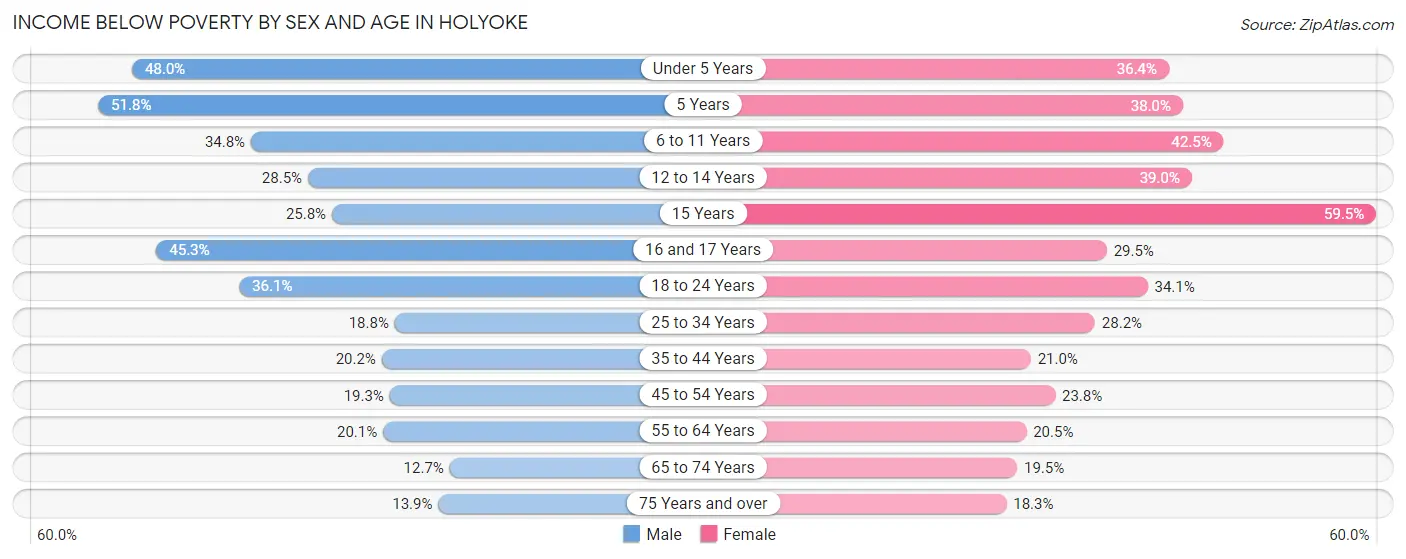
| Age Bracket | Male | Female |
| Under 5 Years | 600 (48.0%) | 334 (36.4%) |
| 5 Years | 43 (51.8%) | 109 (38.0%) |
| 6 to 11 Years | 486 (34.8%) | 492 (42.5%) |
| 12 to 14 Years | 305 (28.4%) | 249 (39.0%) |
| 15 Years | 101 (25.8%) | 144 (59.5%) |
| 16 and 17 Years | 218 (45.3%) | 118 (29.5%) |
| 18 to 24 Years | 714 (36.1%) | 662 (34.1%) |
| 25 to 34 Years | 515 (18.8%) | 794 (28.2%) |
| 35 to 44 Years | 447 (20.2%) | 512 (21.0%) |
| 45 to 54 Years | 394 (19.3%) | 554 (23.7%) |
| 55 to 64 Years | 404 (20.1%) | 513 (20.5%) |
| 65 to 74 Years | 184 (12.7%) | 356 (19.5%) |
| 75 Years and over | 156 (13.9%) | 271 (18.3%) |
| Total | 4,567 (25.1%) | 5,108 (26.9%) |
Income Above Poverty by Sex and Age in Holyoke
According to the poverty statistics in Holyoke, males aged 65 to 74 years and females aged 75 years and over are the age groups that are most secure financially, with 87.3% of males and 81.7% of females in these age groups living above the poverty line.
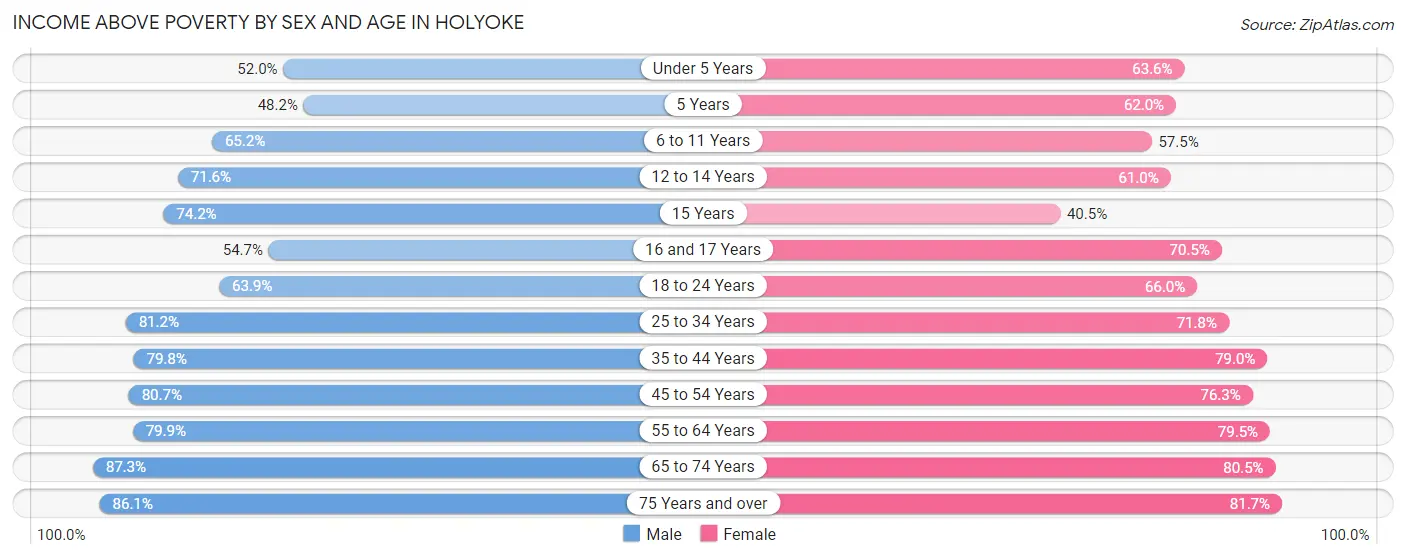
| Age Bracket | Male | Female |
| Under 5 Years | 649 (52.0%) | 583 (63.6%) |
| 5 Years | 40 (48.2%) | 178 (62.0%) |
| 6 to 11 Years | 911 (65.2%) | 665 (57.5%) |
| 12 to 14 Years | 767 (71.6%) | 390 (61.0%) |
| 15 Years | 291 (74.2%) | 98 (40.5%) |
| 16 and 17 Years | 263 (54.7%) | 282 (70.5%) |
| 18 to 24 Years | 1,264 (63.9%) | 1,282 (65.9%) |
| 25 to 34 Years | 2,227 (81.2%) | 2,023 (71.8%) |
| 35 to 44 Years | 1,763 (79.8%) | 1,921 (79.0%) |
| 45 to 54 Years | 1,643 (80.7%) | 1,779 (76.2%) |
| 55 to 64 Years | 1,608 (79.9%) | 1,985 (79.5%) |
| 65 to 74 Years | 1,269 (87.3%) | 1,468 (80.5%) |
| 75 Years and over | 964 (86.1%) | 1,208 (81.7%) |
| Total | 13,659 (74.9%) | 13,862 (73.1%) |
Income Below Poverty Among Married-Couple Families in Holyoke
The poverty statistics for married-couple families in Holyoke show that 9.1% or 402 of the total 4,411 families live below the poverty line. Families with 5 or more children have the highest poverty rate of 46.0%, comprising of 17 families. On the other hand, families with 1 or 2 children have the lowest poverty rate of 7.0%, which includes 74 families.
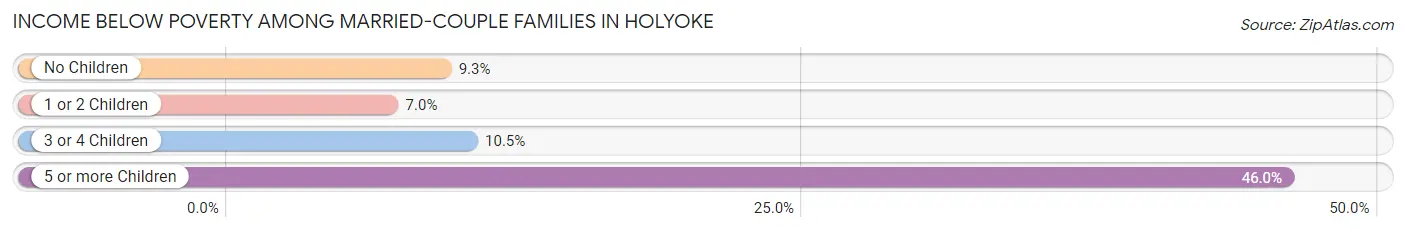
| Children | Above Poverty | Below Poverty |
| No Children | 2,808 (90.7%) | 288 (9.3%) |
| 1 or 2 Children | 984 (93.0%) | 74 (7.0%) |
| 3 or 4 Children | 197 (89.5%) | 23 (10.4%) |
| 5 or more Children | 20 (54.0%) | 17 (46.0%) |
| Total | 4,009 (90.9%) | 402 (9.1%) |
Income Below Poverty Among Single-Parent Households in Holyoke
According to the poverty data in Holyoke, 14.6% or 130 single-father households and 37.6% or 1,383 single-mother households are living below the poverty line. Among single-father households, those with 3 or 4 children have the highest poverty rate, with 36 households (28.1%) experiencing poverty. Likewise, among single-mother households, those with 3 or 4 children have the highest poverty rate, with 311 households (68.3%) falling below the poverty line.
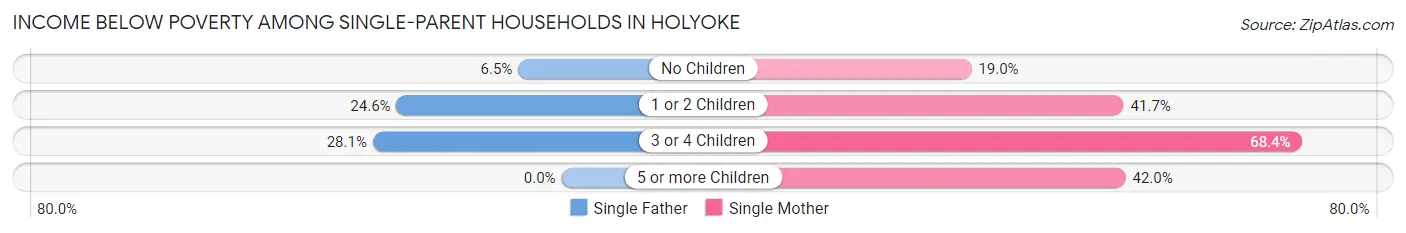
| Children | Single Father | Single Mother |
| No Children | 33 (6.5%) | 230 (19.0%) |
| 1 or 2 Children | 61 (24.6%) | 821 (41.7%) |
| 3 or 4 Children | 36 (28.1%) | 311 (68.3%) |
| 5 or more Children | 0 (0.0%) | 21 (42.0%) |
| Total | 130 (14.6%) | 1,383 (37.6%) |
Income Below Poverty Among Married-Couple vs Single-Parent Households in Holyoke
The poverty data for Holyoke shows that 402 of the married-couple family households (9.1%) and 1,513 of the single-parent households (33.1%) are living below the poverty level. Within the married-couple family households, those with 5 or more children have the highest poverty rate, with 17 households (46.0%) falling below the poverty line. Among the single-parent households, those with 3 or 4 children have the highest poverty rate, with 347 household (59.5%) living below poverty.
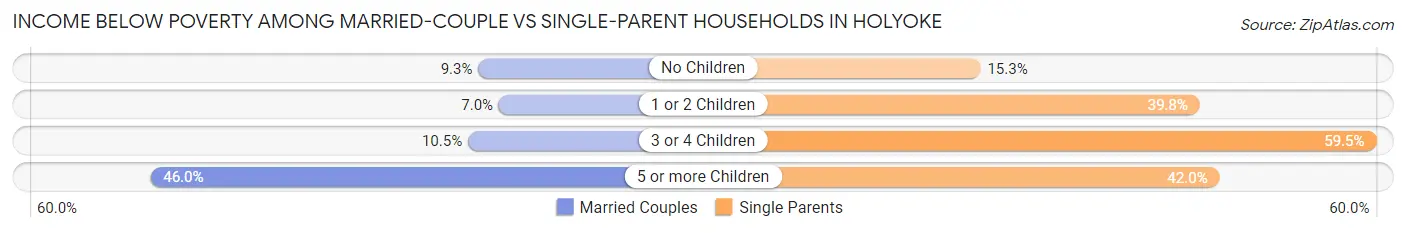
| Children | Married-Couple Families | Single-Parent Households |
| No Children | 288 (9.3%) | 263 (15.3%) |
| 1 or 2 Children | 74 (7.0%) | 882 (39.8%) |
| 3 or 4 Children | 23 (10.4%) | 347 (59.5%) |
| 5 or more Children | 17 (46.0%) | 21 (42.0%) |
| Total | 402 (9.1%) | 1,513 (33.1%) |
Race in Holyoke
The most populous races in Holyoke are White / Caucasian (25,804 | 67.5%), Hispanic or Latino (19,744 | 51.7%), and Two or more Races (7,288 | 19.1%).
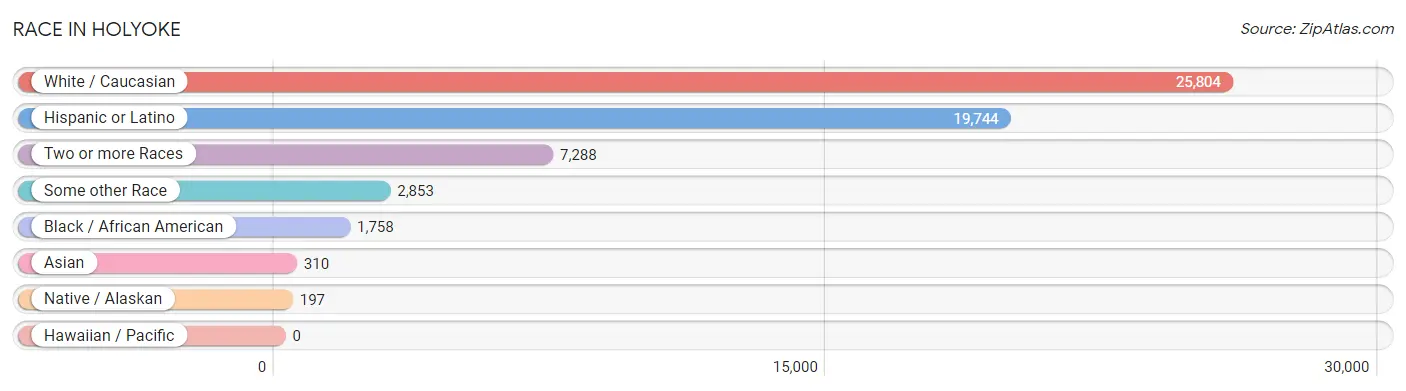
| Race | # Population | % Population |
| Asian | 310 | 0.8% |
| Black / African American | 1,758 | 4.6% |
| Hawaiian / Pacific | 0 | 0.0% |
| Hispanic or Latino | 19,744 | 51.7% |
| Native / Alaskan | 197 | 0.5% |
| White / Caucasian | 25,804 | 67.5% |
| Two or more Races | 7,288 | 19.1% |
| Some other Race | 2,853 | 7.5% |
| Total | 38,210 | 100.0% |
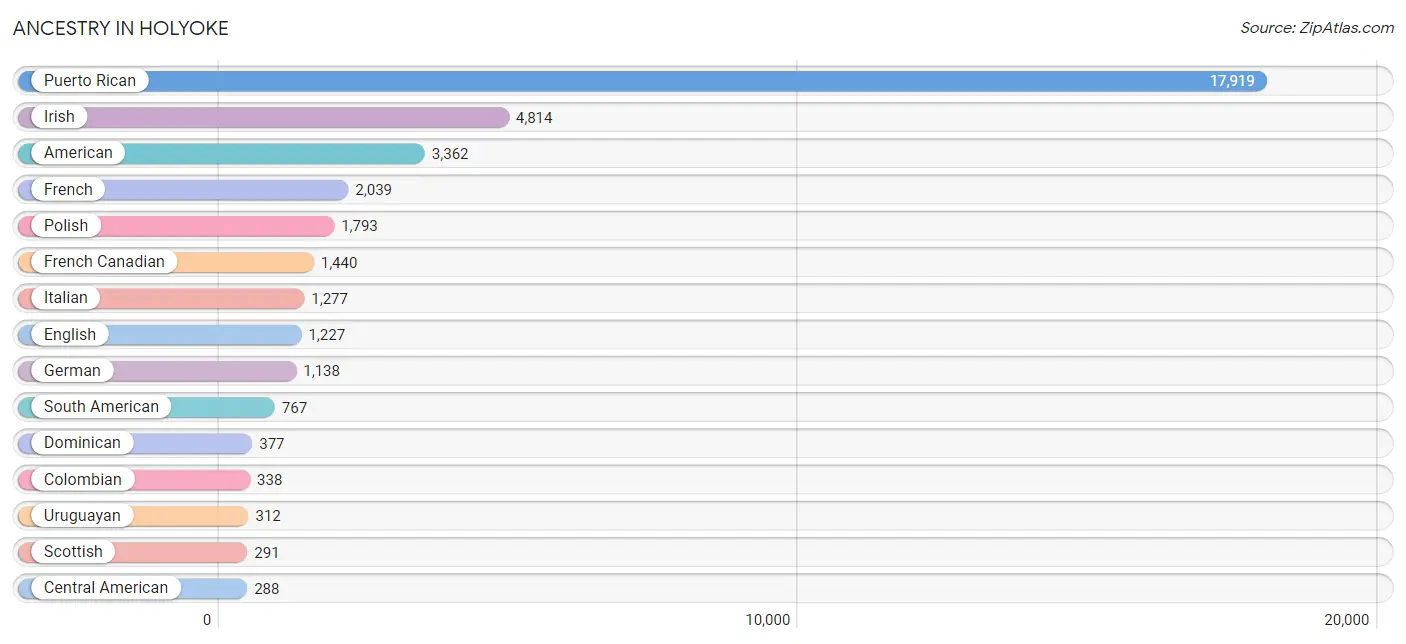
Ancestry in Holyoke
The most populous ancestries reported in Holyoke are Puerto Rican (17,919 | 46.9%), Irish (4,814 | 12.6%), American (3,362 | 8.8%), French (2,039 | 5.3%), and Polish (1,793 | 4.7%), together accounting for 78.3% of all Holyoke residents.
| Ancestry | # Population | % Population |
| African | 50 | 0.1% |
| Alaska Native | 8 | 0.0% |
| American | 3,362 | 8.8% |
| Arab | 116 | 0.3% |
| Armenian | 41 | 0.1% |
| Belgian | 37 | 0.1% |
| Blackfeet | 3 | 0.0% |
| British | 142 | 0.4% |
| British West Indian | 27 | 0.1% |
| Burmese | 101 | 0.3% |
| Cambodian | 5 | 0.0% |
| Canadian | 202 | 0.5% |
| Central American | 288 | 0.7% |
| Central American Indian | 97 | 0.3% |
| Cherokee | 5 | 0.0% |
| Colombian | 338 | 0.9% |
| Croatian | 29 | 0.1% |
| Cuban | 39 | 0.1% |
| Czech | 13 | 0.0% |
| Danish | 22 | 0.1% |
| Dominican | 377 | 1.0% |
| Dutch | 52 | 0.1% |
| Eastern European | 15 | 0.0% |
| Ecuadorian | 71 | 0.2% |
| Egyptian | 9 | 0.0% |
| English | 1,227 | 3.2% |
| European | 76 | 0.2% |
| Finnish | 14 | 0.0% |
| French | 2,039 | 5.3% |
| French Canadian | 1,440 | 3.8% |
| German | 1,138 | 3.0% |
| Ghanaian | 86 | 0.2% |
| Greek | 77 | 0.2% |
| Guatemalan | 184 | 0.5% |
| Guyanese | 23 | 0.1% |
| Honduran | 39 | 0.1% |
| Hungarian | 5 | 0.0% |
| Icelander | 9 | 0.0% |
| Indian (Asian) | 22 | 0.1% |
| Irish | 4,814 | 12.6% |
| Italian | 1,277 | 3.3% |
| Jamaican | 15 | 0.0% |
| Japanese | 115 | 0.3% |
| Kenyan | 23 | 0.1% |
| Korean | 61 | 0.2% |
| Laotian | 5 | 0.0% |
| Lebanese | 85 | 0.2% |
| Lithuanian | 70 | 0.2% |
| Mexican | 152 | 0.4% |
| Nicaraguan | 65 | 0.2% |
| Nigerian | 94 | 0.3% |
| Pennsylvania German | 11 | 0.0% |
| Peruvian | 46 | 0.1% |
| Polish | 1,793 | 4.7% |
| Portuguese | 118 | 0.3% |
| Puerto Rican | 17,919 | 46.9% |
| Romanian | 155 | 0.4% |
| Russian | 287 | 0.7% |
| Scotch-Irish | 98 | 0.3% |
| Scottish | 291 | 0.8% |
| Sioux | 8 | 0.0% |
| Slovak | 14 | 0.0% |
| South American | 767 | 2.0% |
| Spaniard | 118 | 0.3% |
| Spanish | 22 | 0.1% |
| Sri Lankan | 2 | 0.0% |
| Subsaharan African | 258 | 0.7% |
| Swedish | 124 | 0.3% |
| Swiss | 40 | 0.1% |
| Syrian | 22 | 0.1% |
| Thai | 157 | 0.4% |
| Trinidadian and Tobagonian | 15 | 0.0% |
| Ukrainian | 92 | 0.2% |
| Uruguayan | 312 | 0.8% |
| Welsh | 27 | 0.1% |
| West Indian | 88 | 0.2% | View All 76 Rows |
Immigrants in Holyoke
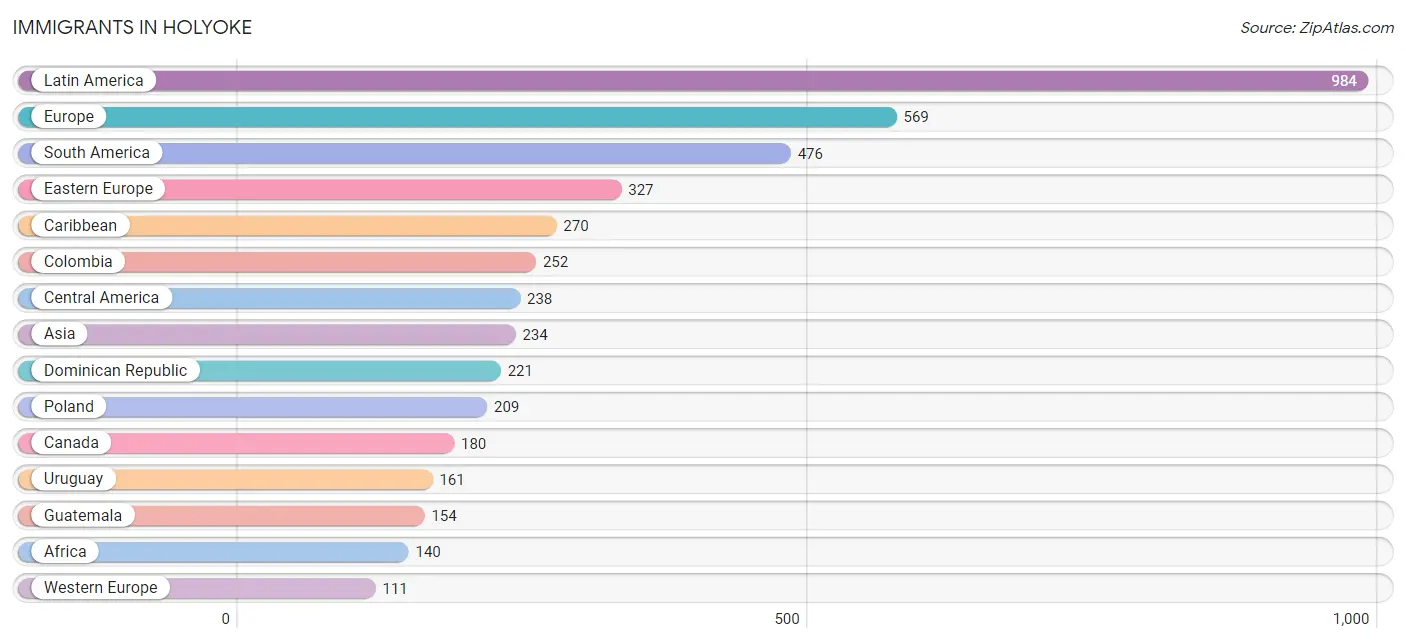
The most numerous immigrant groups reported in Holyoke came from Latin America (984 | 2.6%), Europe (569 | 1.5%), South America (476 | 1.3%), Eastern Europe (327 | 0.9%), and Caribbean (270 | 0.7%), together accounting for 6.9% of all Holyoke residents.
| Immigration Origin | # Population | % Population |
| Africa | 140 | 0.4% |
| Argentina | 9 | 0.0% |
| Asia | 234 | 0.6% |
| Barbados | 1 | 0.0% |
| Cambodia | 57 | 0.2% |
| Canada | 180 | 0.5% |
| Caribbean | 270 | 0.7% |
| Central America | 238 | 0.6% |
| China | 25 | 0.1% |
| Colombia | 252 | 0.7% |
| Cuba | 22 | 0.1% |
| Dominican Republic | 221 | 0.6% |
| Eastern Africa | 34 | 0.1% |
| Eastern Asia | 53 | 0.1% |
| Eastern Europe | 327 | 0.9% |
| El Salvador | 15 | 0.0% |
| England | 30 | 0.1% |
| Europe | 569 | 1.5% |
| France | 28 | 0.1% |
| Germany | 83 | 0.2% |
| Ghana | 100 | 0.3% |
| Guatemala | 154 | 0.4% |
| Guyana | 32 | 0.1% |
| Honduras | 9 | 0.0% |
| India | 14 | 0.0% |
| Ireland | 30 | 0.1% |
| Israel | 7 | 0.0% |
| Italy | 32 | 0.1% |
| Japan | 8 | 0.0% |
| Kazakhstan | 44 | 0.1% |
| Kenya | 29 | 0.1% |
| Korea | 20 | 0.1% |
| Latin America | 984 | 2.6% |
| Lebanon | 13 | 0.0% |
| Mexico | 32 | 0.1% |
| Moldova | 59 | 0.2% |
| Nicaragua | 28 | 0.1% |
| Northern Europe | 85 | 0.2% |
| Peru | 22 | 0.1% |
| Poland | 209 | 0.5% |
| Portugal | 14 | 0.0% |
| Romania | 1 | 0.0% |
| Russia | 49 | 0.1% |
| South Africa | 6 | 0.0% |
| South America | 476 | 1.3% |
| South Central Asia | 58 | 0.2% |
| South Eastern Asia | 103 | 0.3% |
| Southern Europe | 46 | 0.1% |
| Thailand | 44 | 0.1% |
| Ukraine | 9 | 0.0% |
| Uruguay | 161 | 0.4% |
| Vietnam | 2 | 0.0% |
| West Indies | 26 | 0.1% |
| Western Africa | 100 | 0.3% |
| Western Asia | 20 | 0.1% |
| Western Europe | 111 | 0.3% | View All 56 Rows |
Sex and Age in Holyoke
Sex and Age in Holyoke
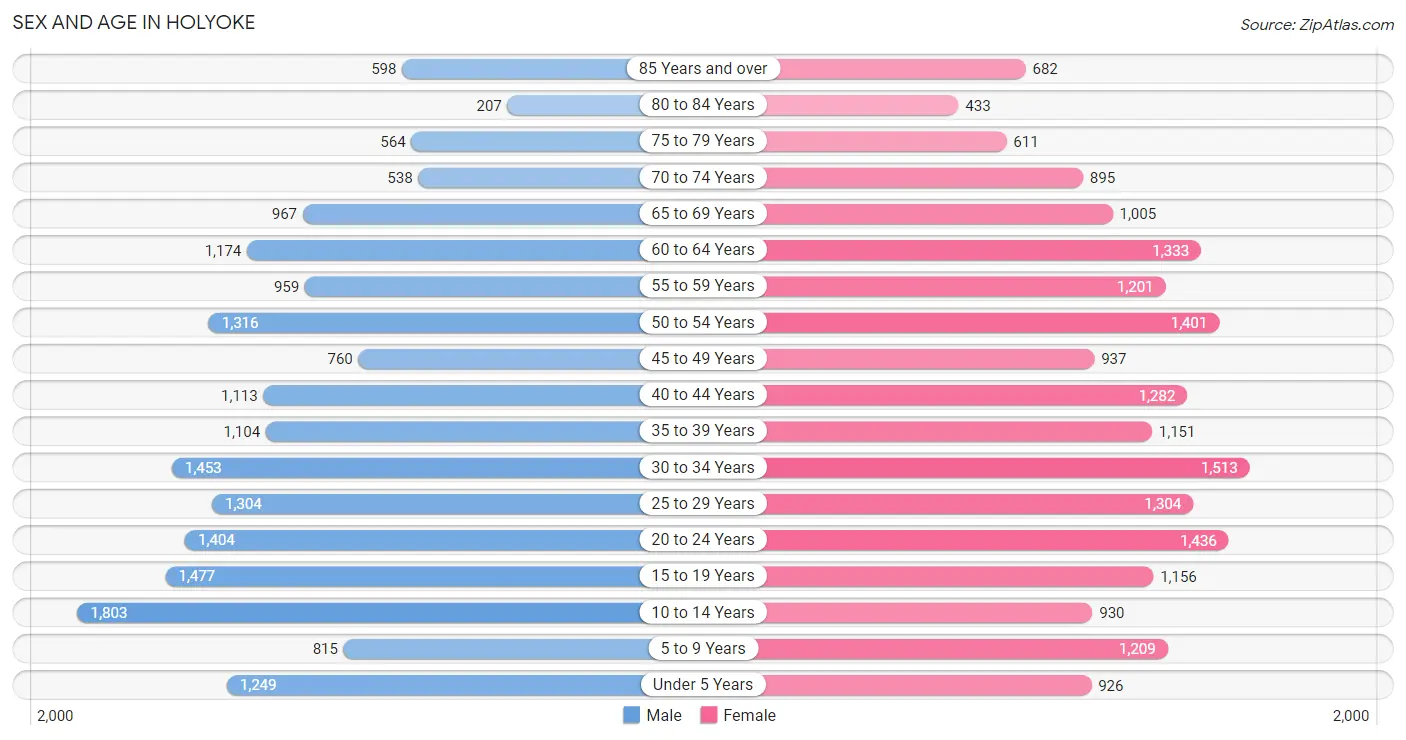
The most populous age groups in Holyoke are 10 to 14 Years (1,803 | 9.6%) for men and 30 to 34 Years (1,513 | 7.8%) for women.
| Age Bracket | Male | Female |
| Under 5 Years | 1,249 (6.6%) | 926 (4.8%) |
| 5 to 9 Years | 815 (4.3%) | 1,209 (6.2%) |
| 10 to 14 Years | 1,803 (9.6%) | 930 (4.8%) |
| 15 to 19 Years | 1,477 (7.9%) | 1,156 (6.0%) |
| 20 to 24 Years | 1,404 (7.5%) | 1,436 (7.4%) |
| 25 to 29 Years | 1,304 (6.9%) | 1,304 (6.7%) |
| 30 to 34 Years | 1,453 (7.7%) | 1,513 (7.8%) |
| 35 to 39 Years | 1,104 (5.9%) | 1,151 (5.9%) |
| 40 to 44 Years | 1,113 (5.9%) | 1,282 (6.6%) |
| 45 to 49 Years | 760 (4.0%) | 937 (4.8%) |
| 50 to 54 Years | 1,316 (7.0%) | 1,401 (7.2%) |
| 55 to 59 Years | 959 (5.1%) | 1,201 (6.2%) |
| 60 to 64 Years | 1,174 (6.2%) | 1,333 (6.9%) |
| 65 to 69 Years | 967 (5.1%) | 1,005 (5.2%) |
| 70 to 74 Years | 538 (2.9%) | 895 (4.6%) |
| 75 to 79 Years | 564 (3.0%) | 611 (3.2%) |
| 80 to 84 Years | 207 (1.1%) | 433 (2.2%) |
| 85 Years and over | 598 (3.2%) | 682 (3.5%) |
| Total | 18,805 (100.0%) | 19,405 (100.0%) |
Families and Households in Holyoke
Median Family Size in Holyoke
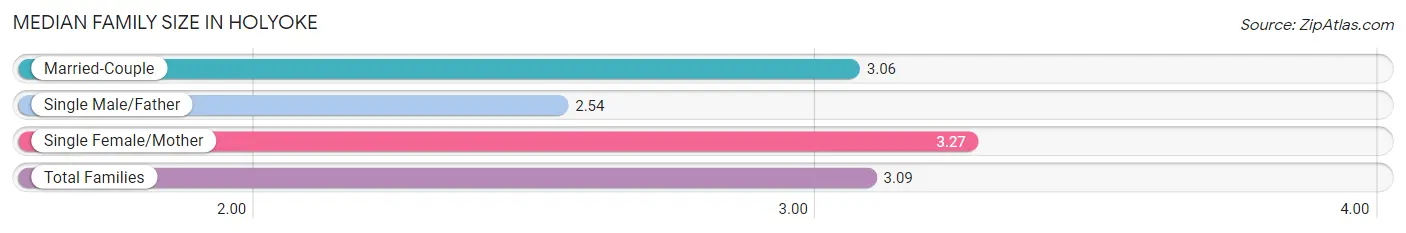
The median family size in Holyoke is 3.09 persons per family, with single female/mother families (3,681 | 41.0%) accounting for the largest median family size of 3.27 persons per family. On the other hand, single male/father families (888 | 9.9%) represent the smallest median family size with 2.54 persons per family.
| Family Type | # Families | Family Size |
| Married-Couple | 4,411 (49.1%) | 3.06 |
| Single Male/Father | 888 (9.9%) | 2.54 |
| Single Female/Mother | 3,681 (41.0%) | 3.27 |
| Total Families | 8,980 (100.0%) | 3.09 |
Median Household Size in Holyoke
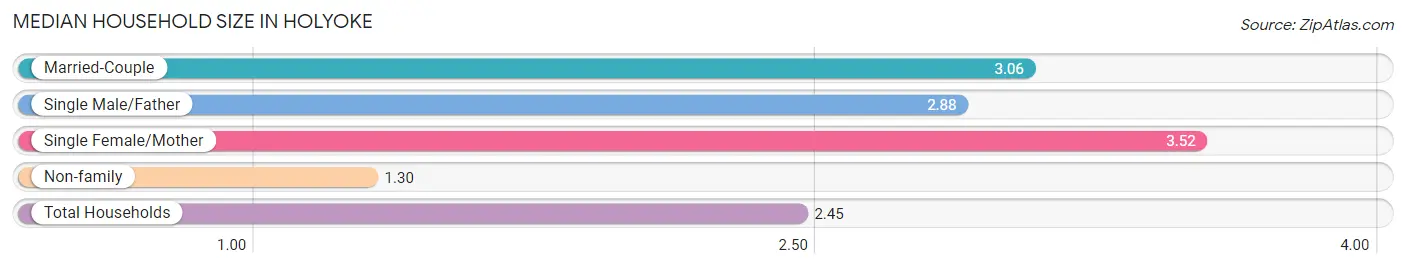
The median household size in Holyoke is 2.45 persons per household, with single female/mother households (3,681 | 24.4%) accounting for the largest median household size of 3.52 persons per household. non-family households (6,132 | 40.6%) represent the smallest median household size with 1.30 persons per household.
| Household Type | # Households | Household Size |
| Married-Couple | 4,411 (29.2%) | 3.06 |
| Single Male/Father | 888 (5.9%) | 2.88 |
| Single Female/Mother | 3,681 (24.4%) | 3.52 |
| Non-family | 6,132 (40.6%) | 1.30 |
| Total Households | 15,112 (100.0%) | 2.45 |
Household Size by Marriage Status in Holyoke
Out of a total of 15,112 households in Holyoke, 8,980 (59.4%) are family households, while 6,132 (40.6%) are nonfamily households. The most numerous type of family households are 2-person households, comprising 3,896, and the most common type of nonfamily households are 1-person households, comprising 4,725.
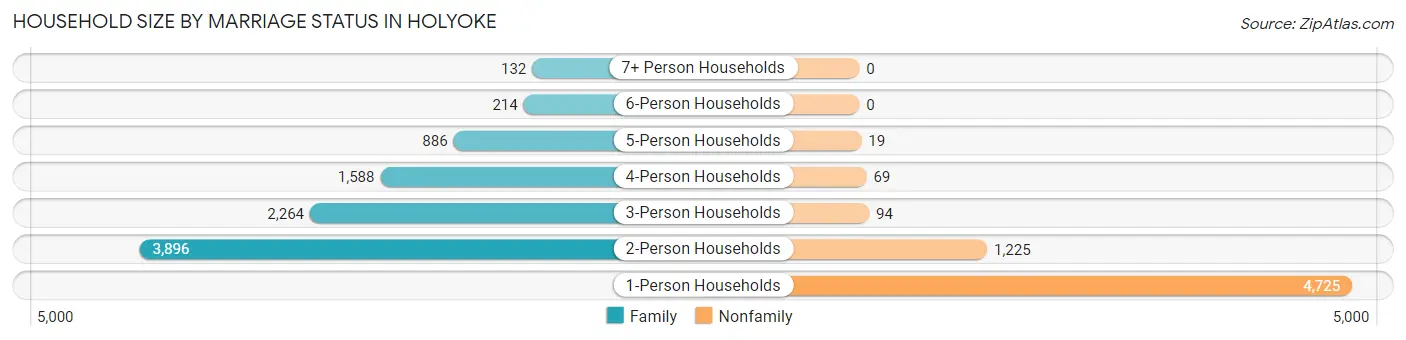
| Household Size | Family Households | Nonfamily Households |
| 1-Person Households | - | 4,725 (31.3%) |
| 2-Person Households | 3,896 (25.8%) | 1,225 (8.1%) |
| 3-Person Households | 2,264 (15.0%) | 94 (0.6%) |
| 4-Person Households | 1,588 (10.5%) | 69 (0.5%) |
| 5-Person Households | 886 (5.9%) | 19 (0.1%) |
| 6-Person Households | 214 (1.4%) | 0 (0.0%) |
| 7+ Person Households | 132 (0.9%) | 0 (0.0%) |
| Total | 8,980 (59.4%) | 6,132 (40.6%) |
Female Fertility in Holyoke
Fertility by Age in Holyoke
Average fertility rate in Holyoke is 54.0 births per 1,000 women. Women in the age bracket of 20 to 34 years have the highest fertility rate with 99.0 births per 1,000 women. Women in the age bracket of 20 to 34 years acount for 86.0% of all women with births.
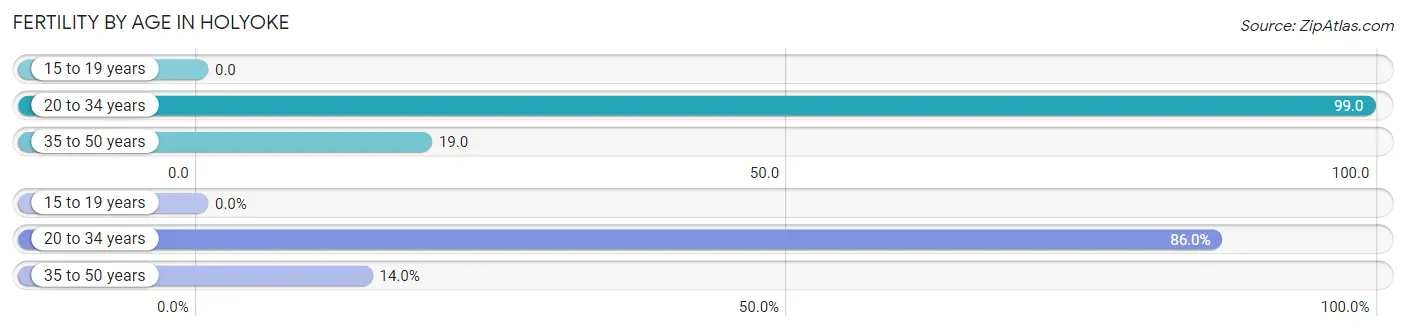
| Age Bracket | Women with Births | Births / 1,000 Women |
| 15 to 19 years | 0 (0.0%) | 0.0 |
| 20 to 34 years | 419 (86.0%) | 99.0 |
| 35 to 50 years | 68 (14.0%) | 19.0 |
| Total | 487 (100.0%) | 54.0 |
Fertility by Age by Marriage Status in Holyoke
41.3% of women with births (487) in Holyoke are married. The highest percentage of unmarried women with births falls into 20 to 34 years age bracket with 68.3% of them unmarried at the time of birth, while the lowest percentage of unmarried women with births belong to 35 to 50 years age bracket with 0.0% of them unmarried.
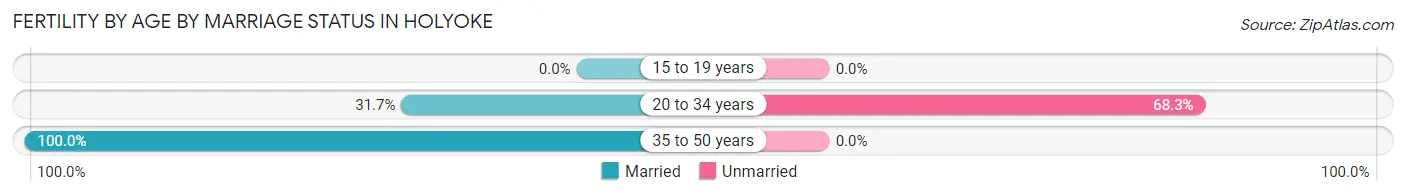
| Age Bracket | Married | Unmarried |
| 15 to 19 years | 0 (0.0%) | 0 (0.0%) |
| 20 to 34 years | 133 (31.7%) | 286 (68.3%) |
| 35 to 50 years | 68 (100.0%) | 0 (0.0%) |
| Total | 201 (41.3%) | 286 (58.7%) |
Fertility by Education in Holyoke
Average fertility rate in Holyoke is 54.0 births per 1,000 women. Women with the education attainment of bachelor's degree have the highest fertility rate of 118.0 births per 1,000 women, while women with the education attainment of less than high school have the lowest fertility at 10.0 births per 1,000 women. Women with the education attainment of college or associate's degree represent 33.7% of all women with births.
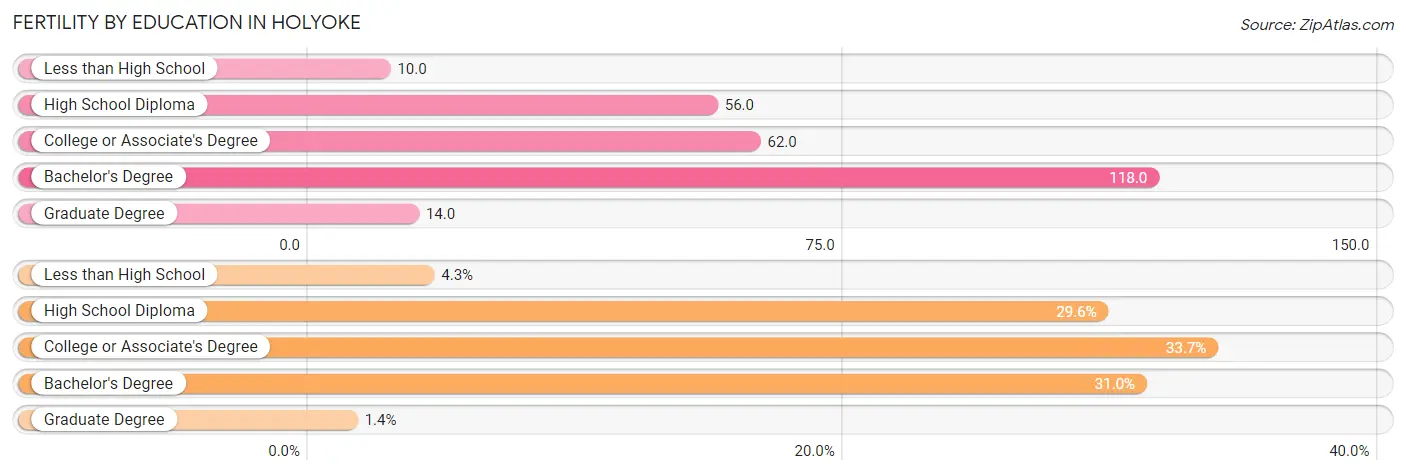
| Educational Attainment | Women with Births | Births / 1,000 Women |
| Less than High School | 21 (4.3%) | 10.0 |
| High School Diploma | 144 (29.6%) | 56.0 |
| College or Associate's Degree | 164 (33.7%) | 62.0 |
| Bachelor's Degree | 151 (31.0%) | 118.0 |
| Graduate Degree | 7 (1.4%) | 14.0 |
| Total | 487 (100.0%) | 54.0 |
Fertility by Education by Marriage Status in Holyoke
58.7% of women with births in Holyoke are unmarried. Women with the educational attainment of graduate degree are most likely to be married with 100.0% of them married at childbirth, while women with the educational attainment of high school diploma are least likely to be married with 88.9% of them unmarried at childbirth.
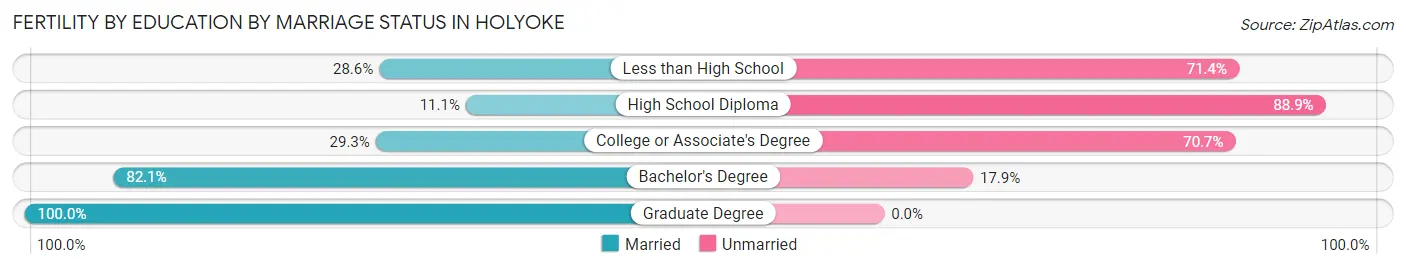
| Educational Attainment | Married | Unmarried |
| Less than High School | 6 (28.6%) | 15 (71.4%) |
| High School Diploma | 16 (11.1%) | 128 (88.9%) |
| College or Associate's Degree | 48 (29.3%) | 116 (70.7%) |
| Bachelor's Degree | 124 (82.1%) | 27 (17.9%) |
| Graduate Degree | 7 (100.0%) | 0 (0.0%) |
| Total | 201 (41.3%) | 286 (58.7%) |
Employment Characteristics in Holyoke
Employment by Class of Employer in Holyoke
Among the 15,123 employed individuals in Holyoke, private company employees (9,615 | 63.6%), not-for-profit organizations (1,836 | 12.1%), and local government employees (1,501 | 9.9%) make up the most common classes of employment.
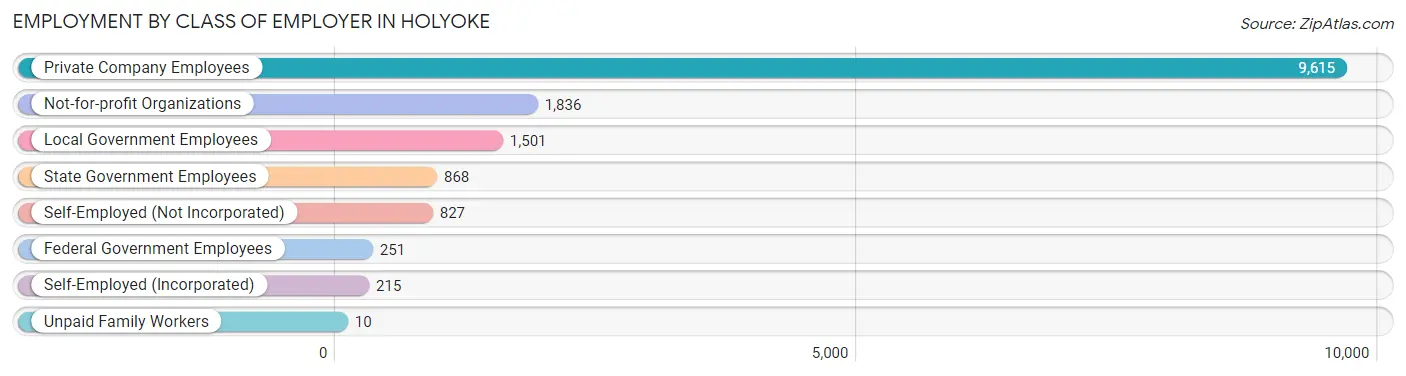
| Employer Class | # Employees | % Employees |
| Private Company Employees | 9,615 | 63.6% |
| Self-Employed (Incorporated) | 215 | 1.4% |
| Self-Employed (Not Incorporated) | 827 | 5.5% |
| Not-for-profit Organizations | 1,836 | 12.1% |
| Local Government Employees | 1,501 | 9.9% |
| State Government Employees | 868 | 5.7% |
| Federal Government Employees | 251 | 1.7% |
| Unpaid Family Workers | 10 | 0.1% |
| Total | 15,123 | 100.0% |
Employment Status by Age in Holyoke
According to the labor force statistics for Holyoke, out of the total population over 16 years of age (30,626), 54.2% or 16,599 individuals are in the labor force, with 6.8% or 1,129 of them unemployed. The age group with the highest labor force participation rate is 30 to 34 years, with 79.7% or 2,364 individuals in the labor force. Within the labor force, the 16 to 19 years age range has the highest percentage of unemployed individuals, with 27.2% or 91 of them being unemployed.
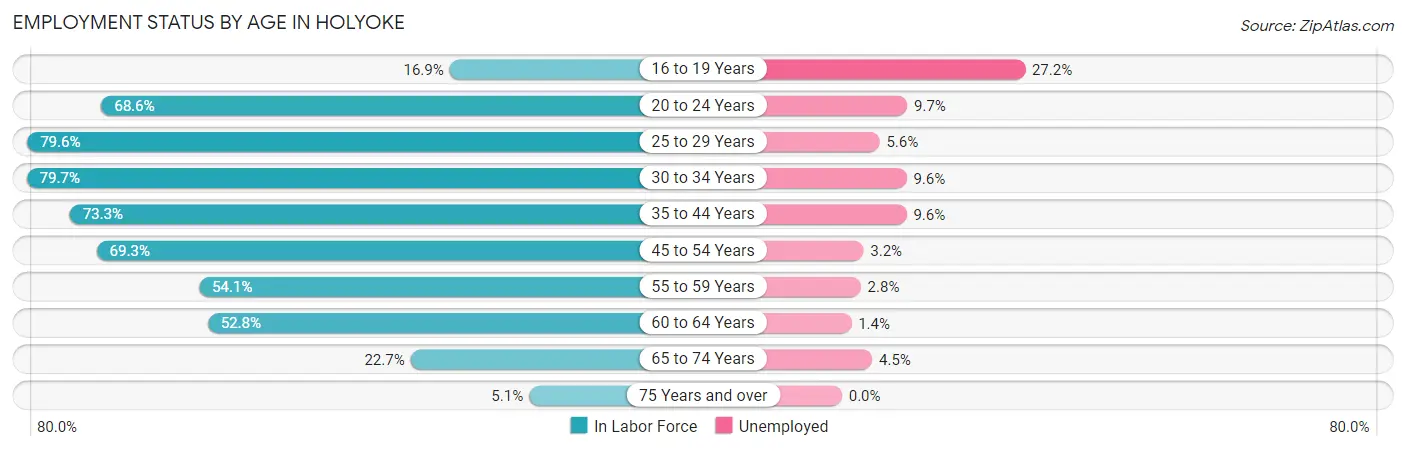
| Age Bracket | In Labor Force | Unemployed |
| 16 to 19 Years | 335 (16.9%) | 91 (27.2%) |
| 20 to 24 Years | 1,948 (68.6%) | 189 (9.7%) |
| 25 to 29 Years | 2,076 (79.6%) | 116 (5.6%) |
| 30 to 34 Years | 2,364 (79.7%) | 227 (9.6%) |
| 35 to 44 Years | 3,408 (73.3%) | 327 (9.6%) |
| 45 to 54 Years | 3,059 (69.3%) | 98 (3.2%) |
| 55 to 59 Years | 1,169 (54.1%) | 33 (2.8%) |
| 60 to 64 Years | 1,324 (52.8%) | 19 (1.4%) |
| 65 to 74 Years | 773 (22.7%) | 35 (4.5%) |
| 75 Years and over | 158 (5.1%) | 0 (0.0%) |
| Total | 16,599 (54.2%) | 1,129 (6.8%) |
Employment Status by Educational Attainment in Holyoke
According to labor force statistics for Holyoke, 69.4% of individuals (13,398) out of the total population between 25 and 64 years of age (19,305) are in the labor force, with 6.1% or 817 of them being unemployed. The group with the highest labor force participation rate are those with the educational attainment of bachelor's degree or higher, with 85.3% or 3,544 individuals in the labor force. Within the labor force, individuals with less than high school education have the highest percentage of unemployment, with 14.7% or 247 of them being unemployed.
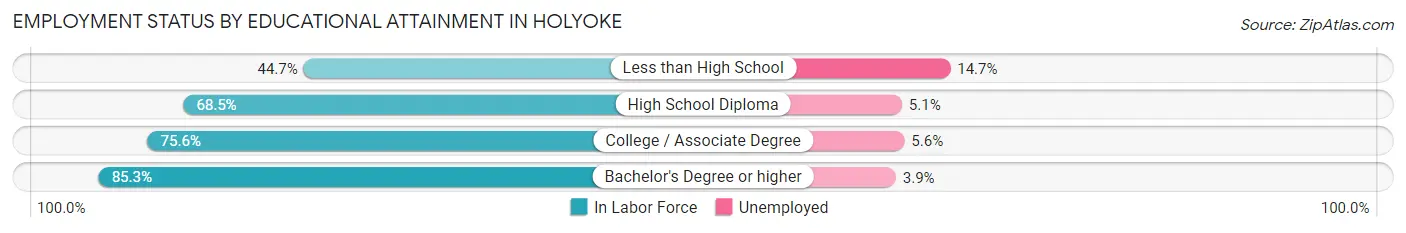
| Educational Attainment | In Labor Force | Unemployed |
| Less than High School | 1,678 (44.7%) | 552 (14.7%) |
| High School Diploma | 4,248 (68.5%) | 316 (5.1%) |
| College / Associate Degree | 3,926 (75.6%) | 291 (5.6%) |
| Bachelor's Degree or higher | 3,544 (85.3%) | 162 (3.9%) |
| Total | 13,398 (69.4%) | 1,178 (6.1%) |
Employment Occupations by Sex in Holyoke
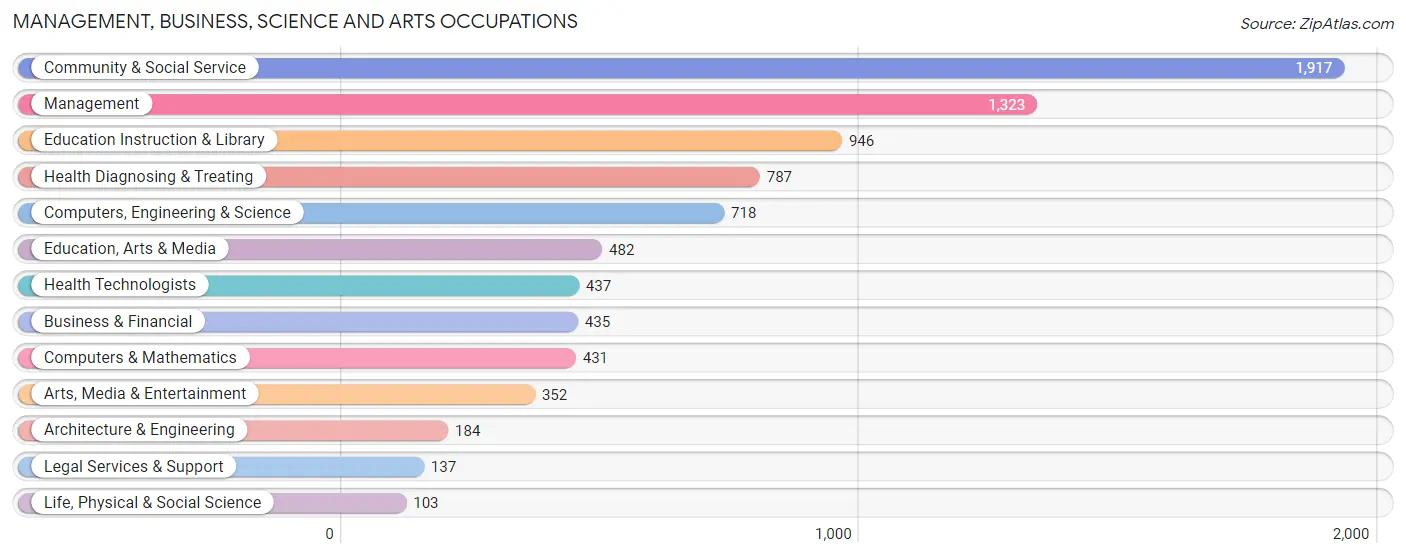
Management, Business, Science and Arts Occupations
The most common Management, Business, Science and Arts occupations in Holyoke are Community & Social Service (1,917 | 12.4%), Management (1,323 | 8.6%), Education Instruction & Library (946 | 6.1%), Health Diagnosing & Treating (787 | 5.1%), and Computers, Engineering & Science (718 | 4.6%).
Management, Business, Science and Arts Occupations by Sex
Within the Management, Business, Science and Arts occupations in Holyoke, the most male-oriented occupations are Computers & Mathematics (87.5%), Computers, Engineering & Science (78.0%), and Life, Physical & Social Science (72.8%), while the most female-oriented occupations are Health Technologists (87.9%), Health Diagnosing & Treating (84.9%), and Education, Arts & Media (82.8%).
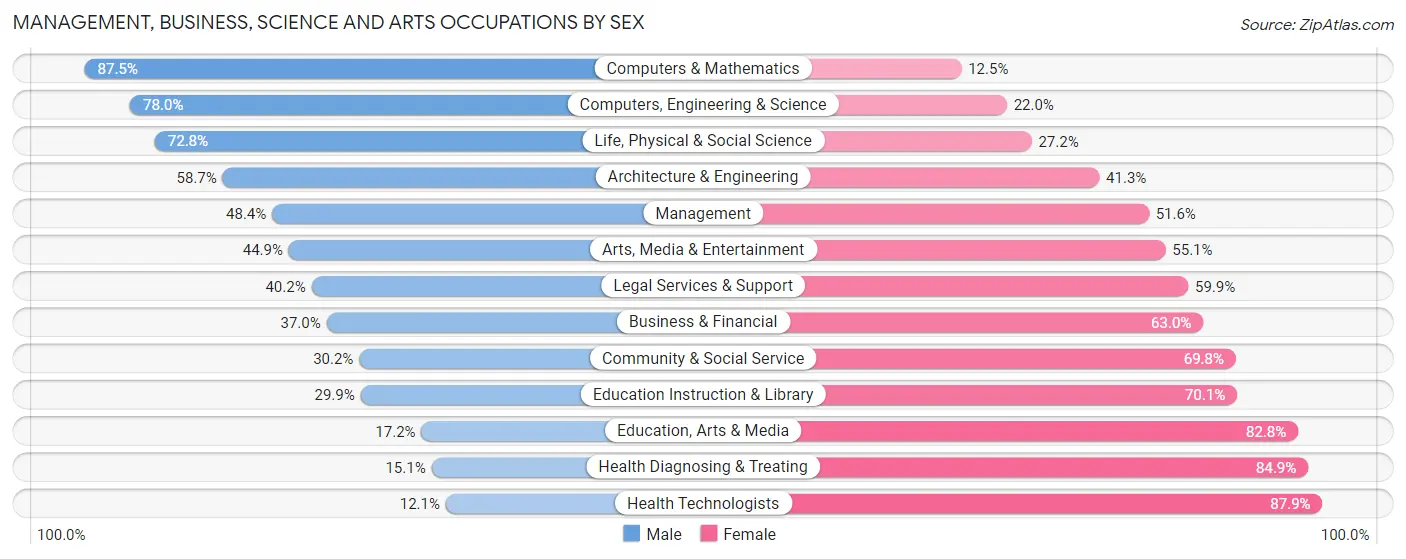
| Occupation | Male | Female |
| Management | 640 (48.4%) | 683 (51.6%) |
| Business & Financial | 161 (37.0%) | 274 (63.0%) |
| Computers, Engineering & Science | 560 (78.0%) | 158 (22.0%) |
| Computers & Mathematics | 377 (87.5%) | 54 (12.5%) |
| Architecture & Engineering | 108 (58.7%) | 76 (41.3%) |
| Life, Physical & Social Science | 75 (72.8%) | 28 (27.2%) |
| Community & Social Service | 579 (30.2%) | 1,338 (69.8%) |
| Education, Arts & Media | 83 (17.2%) | 399 (82.8%) |
| Legal Services & Support | 55 (40.2%) | 82 (59.9%) |
| Education Instruction & Library | 283 (29.9%) | 663 (70.1%) |
| Arts, Media & Entertainment | 158 (44.9%) | 194 (55.1%) |
| Health Diagnosing & Treating | 119 (15.1%) | 668 (84.9%) |
| Health Technologists | 53 (12.1%) | 384 (87.9%) |
| Total (Category) | 2,059 (39.8%) | 3,121 (60.3%) |
| Total (Overall) | 7,504 (48.5%) | 7,975 (51.5%) |
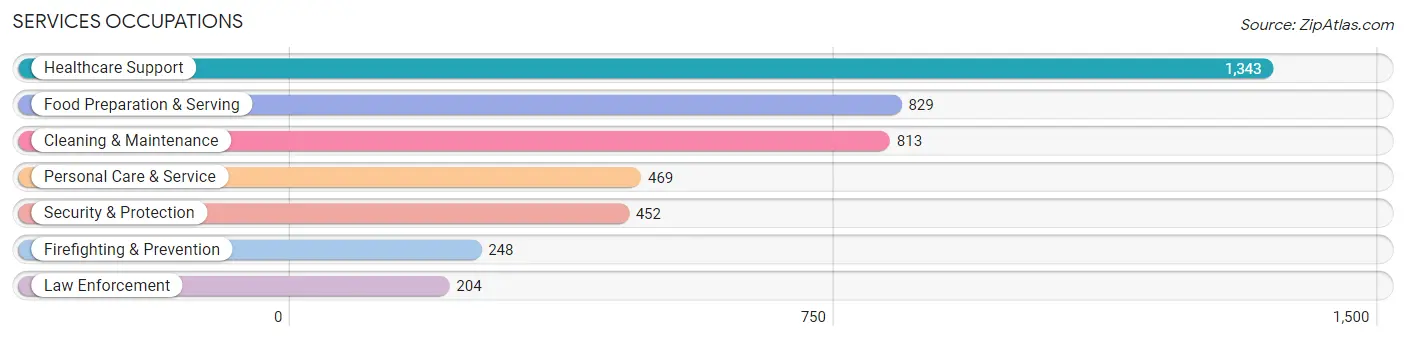
Services Occupations
The most common Services occupations in Holyoke are Healthcare Support (1,343 | 8.7%), Food Preparation & Serving (829 | 5.4%), Cleaning & Maintenance (813 | 5.2%), Personal Care & Service (469 | 3.0%), and Security & Protection (452 | 2.9%).
Services Occupations by Sex
Within the Services occupations in Holyoke, the most male-oriented occupations are Law Enforcement (95.6%), Security & Protection (91.1%), and Firefighting & Prevention (87.5%), while the most female-oriented occupations are Healthcare Support (83.7%), Personal Care & Service (80.0%), and Food Preparation & Serving (45.7%).
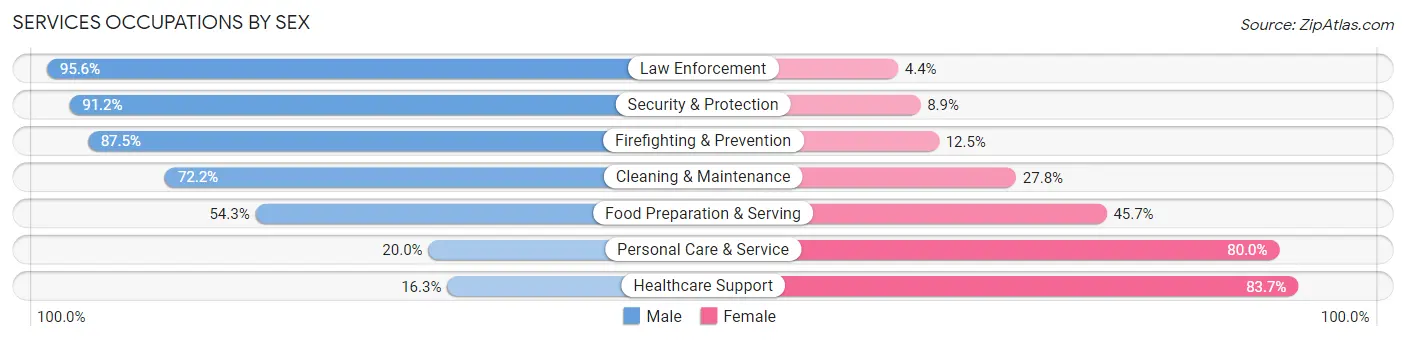
| Occupation | Male | Female |
| Healthcare Support | 219 (16.3%) | 1,124 (83.7%) |
| Security & Protection | 412 (91.1%) | 40 (8.8%) |
| Firefighting & Prevention | 217 (87.5%) | 31 (12.5%) |
| Law Enforcement | 195 (95.6%) | 9 (4.4%) |
| Food Preparation & Serving | 450 (54.3%) | 379 (45.7%) |
| Cleaning & Maintenance | 587 (72.2%) | 226 (27.8%) |
| Personal Care & Service | 94 (20.0%) | 375 (80.0%) |
| Total (Category) | 1,762 (45.1%) | 2,144 (54.9%) |
| Total (Overall) | 7,504 (48.5%) | 7,975 (51.5%) |
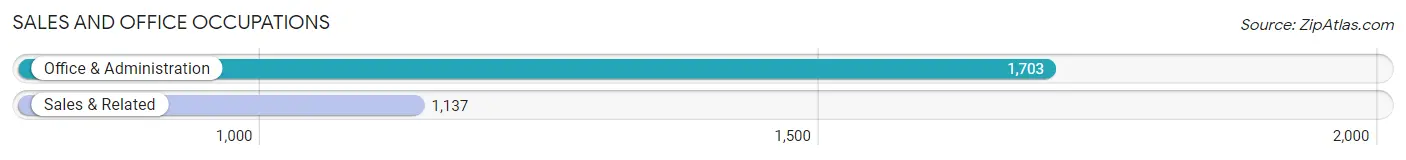
Sales and Office Occupations
The most common Sales and Office occupations in Holyoke are Office & Administration (1,703 | 11.0%), and Sales & Related (1,137 | 7.3%).
Sales and Office Occupations by Sex
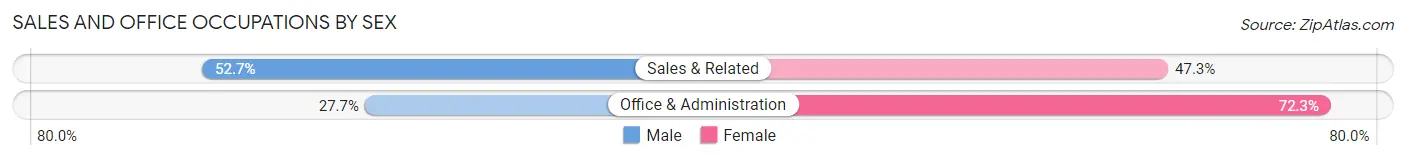
| Occupation | Male | Female |
| Sales & Related | 599 (52.7%) | 538 (47.3%) |
| Office & Administration | 471 (27.7%) | 1,232 (72.3%) |
| Total (Category) | 1,070 (37.7%) | 1,770 (62.3%) |
| Total (Overall) | 7,504 (48.5%) | 7,975 (51.5%) |
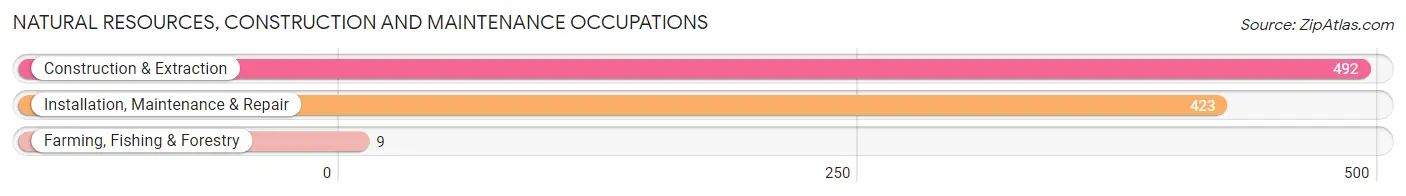
Natural Resources, Construction and Maintenance Occupations
The most common Natural Resources, Construction and Maintenance occupations in Holyoke are Construction & Extraction (492 | 3.2%), Installation, Maintenance & Repair (423 | 2.7%), and Farming, Fishing & Forestry (9 | 0.1%).
Natural Resources, Construction and Maintenance Occupations by Sex
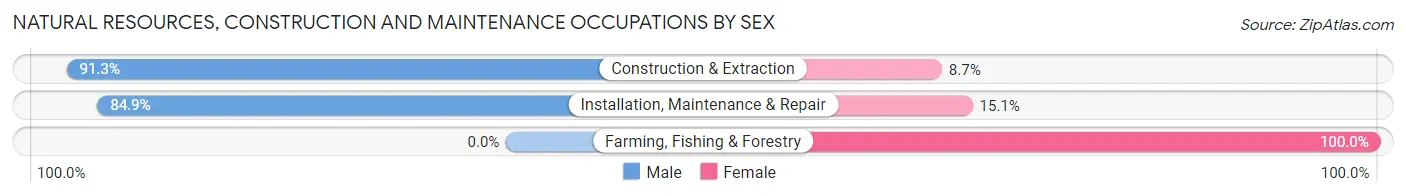
| Occupation | Male | Female |
| Farming, Fishing & Forestry | 0 (0.0%) | 9 (100.0%) |
| Construction & Extraction | 449 (91.3%) | 43 (8.7%) |
| Installation, Maintenance & Repair | 359 (84.9%) | 64 (15.1%) |
| Total (Category) | 808 (87.5%) | 116 (12.6%) |
| Total (Overall) | 7,504 (48.5%) | 7,975 (51.5%) |
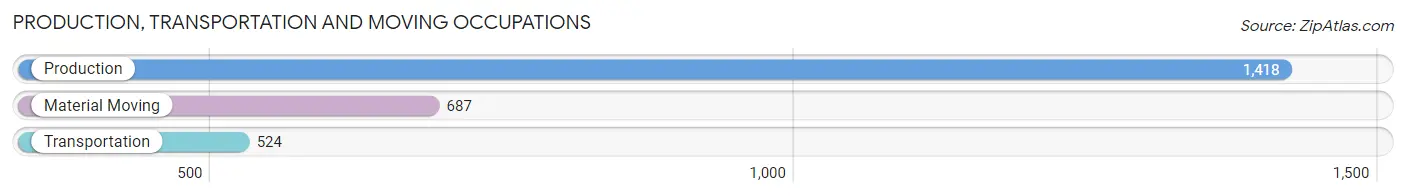
Production, Transportation and Moving Occupations
The most common Production, Transportation and Moving occupations in Holyoke are Production (1,418 | 9.2%), Material Moving (687 | 4.4%), and Transportation (524 | 3.4%).
Production, Transportation and Moving Occupations by Sex
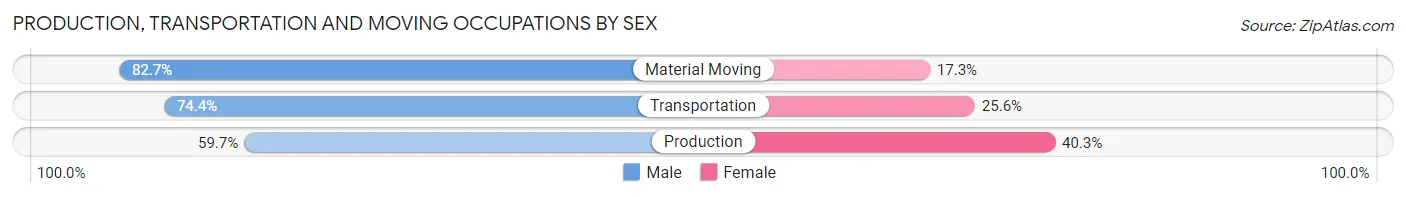
| Occupation | Male | Female |
| Production | 847 (59.7%) | 571 (40.3%) |
| Transportation | 390 (74.4%) | 134 (25.6%) |
| Material Moving | 568 (82.7%) | 119 (17.3%) |
| Total (Category) | 1,805 (68.7%) | 824 (31.3%) |
| Total (Overall) | 7,504 (48.5%) | 7,975 (51.5%) |
Employment Industries by Sex in Holyoke
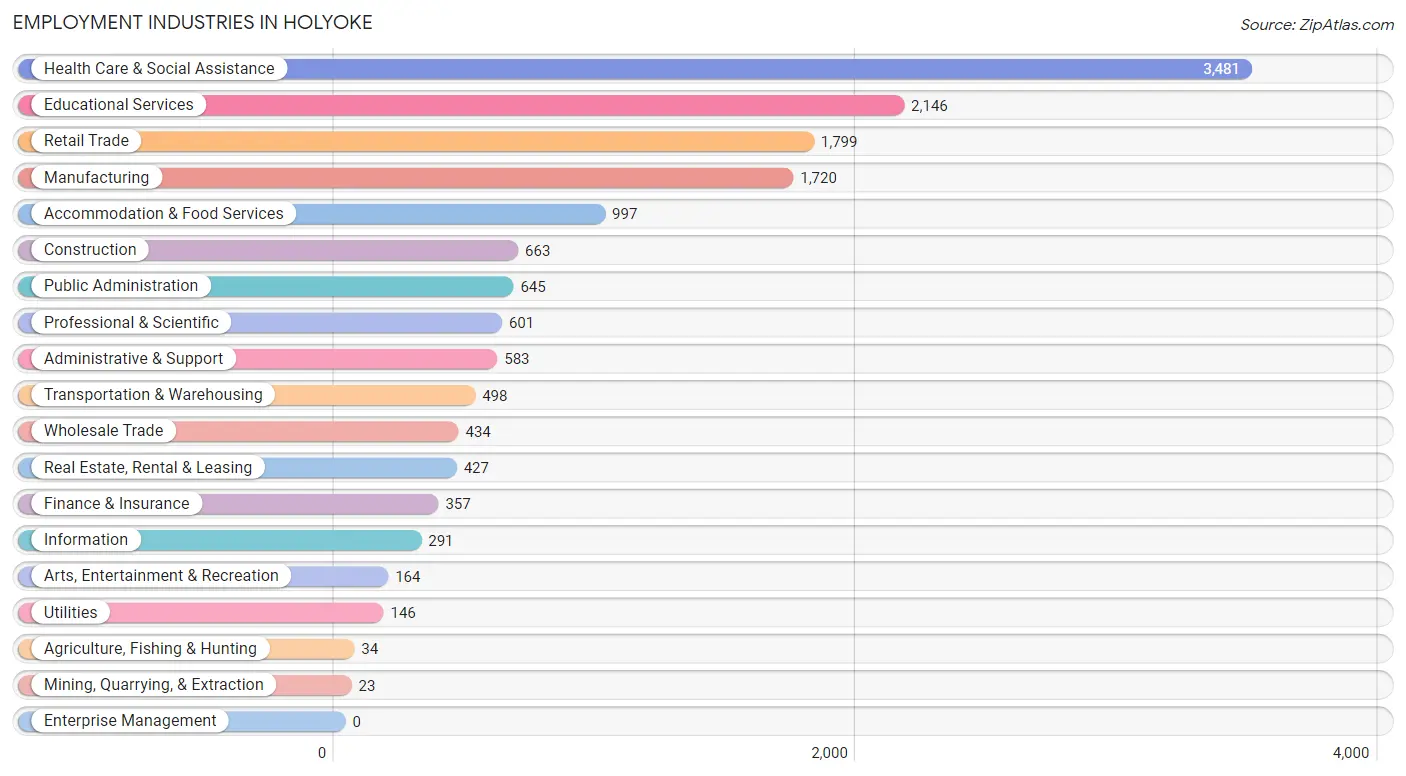
Employment Industries in Holyoke
The major employment industries in Holyoke include Health Care & Social Assistance (3,481 | 22.5%), Educational Services (2,146 | 13.9%), Retail Trade (1,799 | 11.6%), Manufacturing (1,720 | 11.1%), and Accommodation & Food Services (997 | 6.4%).
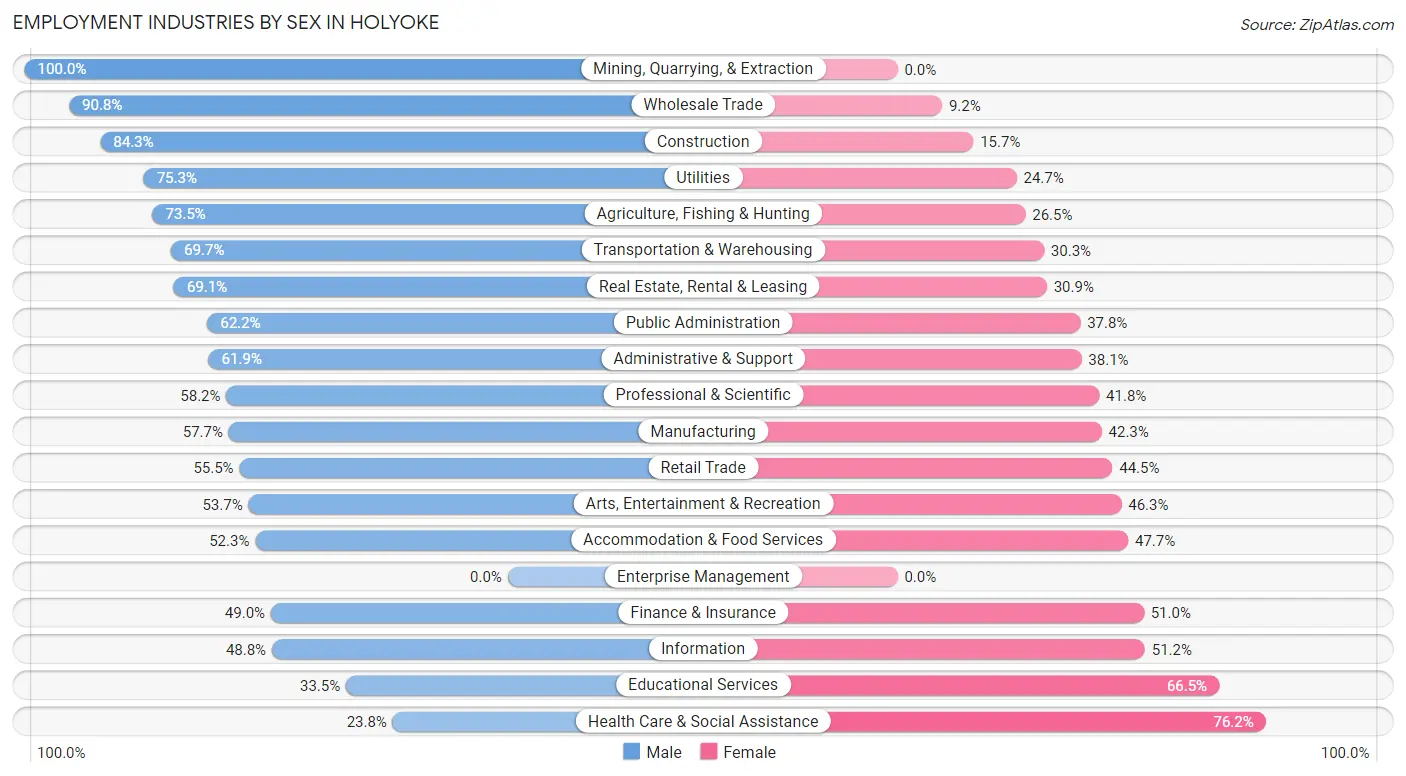
Employment Industries by Sex in Holyoke
The Holyoke industries that see more men than women are Mining, Quarrying, & Extraction (100.0%), Wholesale Trade (90.8%), and Construction (84.3%), whereas the industries that tend to have a higher number of women are Health Care & Social Assistance (76.2%), Educational Services (66.5%), and Information (51.2%).
| Industry | Male | Female |
| Agriculture, Fishing & Hunting | 25 (73.5%) | 9 (26.5%) |
| Mining, Quarrying, & Extraction | 23 (100.0%) | 0 (0.0%) |
| Construction | 559 (84.3%) | 104 (15.7%) |
| Manufacturing | 993 (57.7%) | 727 (42.3%) |
| Wholesale Trade | 394 (90.8%) | 40 (9.2%) |
| Retail Trade | 999 (55.5%) | 800 (44.5%) |
| Transportation & Warehousing | 347 (69.7%) | 151 (30.3%) |
| Utilities | 110 (75.3%) | 36 (24.7%) |
| Information | 142 (48.8%) | 149 (51.2%) |
| Finance & Insurance | 175 (49.0%) | 182 (51.0%) |
| Real Estate, Rental & Leasing | 295 (69.1%) | 132 (30.9%) |
| Professional & Scientific | 350 (58.2%) | 251 (41.8%) |
| Enterprise Management | 0 (0.0%) | 0 (0.0%) |
| Administrative & Support | 361 (61.9%) | 222 (38.1%) |
| Educational Services | 718 (33.5%) | 1,428 (66.5%) |
| Health Care & Social Assistance | 829 (23.8%) | 2,652 (76.2%) |
| Arts, Entertainment & Recreation | 88 (53.7%) | 76 (46.3%) |
| Accommodation & Food Services | 521 (52.3%) | 476 (47.7%) |
| Public Administration | 401 (62.2%) | 244 (37.8%) |
| Total | 7,504 (48.5%) | 7,975 (51.5%) |
Education in Holyoke
School Enrollment in Holyoke
The most common levels of schooling among the 8,903 students in Holyoke are high school (2,320 | 26.1%), middle school (2,133 | 24.0%), and elementary school (1,781 | 20.0%).
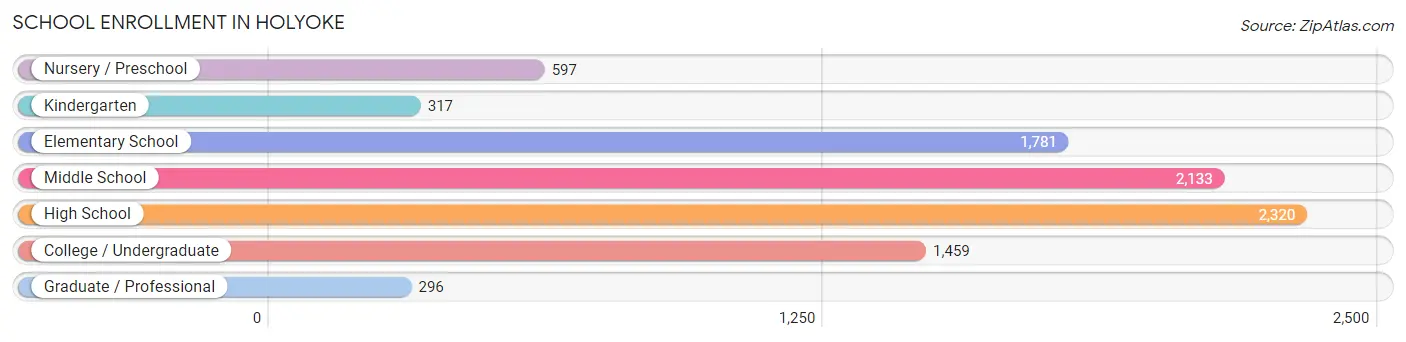
| School Level | # Students | % Students |
| Nursery / Preschool | 597 | 6.7% |
| Kindergarten | 317 | 3.6% |
| Elementary School | 1,781 | 20.0% |
| Middle School | 2,133 | 24.0% |
| High School | 2,320 | 26.1% |
| College / Undergraduate | 1,459 | 16.4% |
| Graduate / Professional | 296 | 3.3% |
| Total | 8,903 | 100.0% |
School Enrollment by Age by Funding Source in Holyoke
Out of a total of 8,903 students who are enrolled in schools in Holyoke, 1,068 (12.0%) attend a private institution, while the remaining 7,835 (88.0%) are enrolled in public schools. The age group of 25 to 34 year olds has the highest likelihood of being enrolled in private schools, with 189 (36.4% in the age bracket) enrolled. Conversely, the age group of 10 to 14 year olds has the lowest likelihood of being enrolled in a private school, with 2,524 (93.7% in the age bracket) attending a public institution.
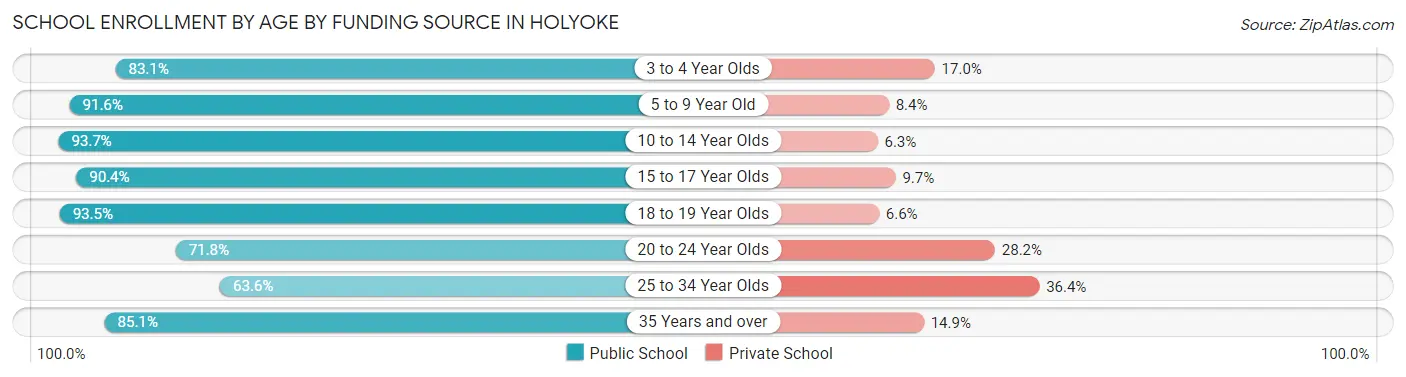
| Age Bracket | Public School | Private School |
| 3 to 4 Year Olds | 397 (83.1%) | 81 (17.0%) |
| 5 to 9 Year Old | 1,737 (91.6%) | 159 (8.4%) |
| 10 to 14 Year Olds | 2,524 (93.7%) | 170 (6.3%) |
| 15 to 17 Year Olds | 1,320 (90.3%) | 141 (9.7%) |
| 18 to 19 Year Olds | 642 (93.4%) | 45 (6.6%) |
| 20 to 24 Year Olds | 574 (71.8%) | 225 (28.2%) |
| 25 to 34 Year Olds | 330 (63.6%) | 189 (36.4%) |
| 35 Years and over | 314 (85.1%) | 55 (14.9%) |
| Total | 7,835 (88.0%) | 1,068 (12.0%) |
Educational Attainment by Field of Study in Holyoke
Education (911 | 15.1%), business (822 | 13.6%), social sciences (740 | 12.2%), arts & humanities (503 | 8.3%), and psychology (416 | 6.9%) are the most common fields of study among 6,049 individuals in Holyoke who have obtained a bachelor's degree or higher.
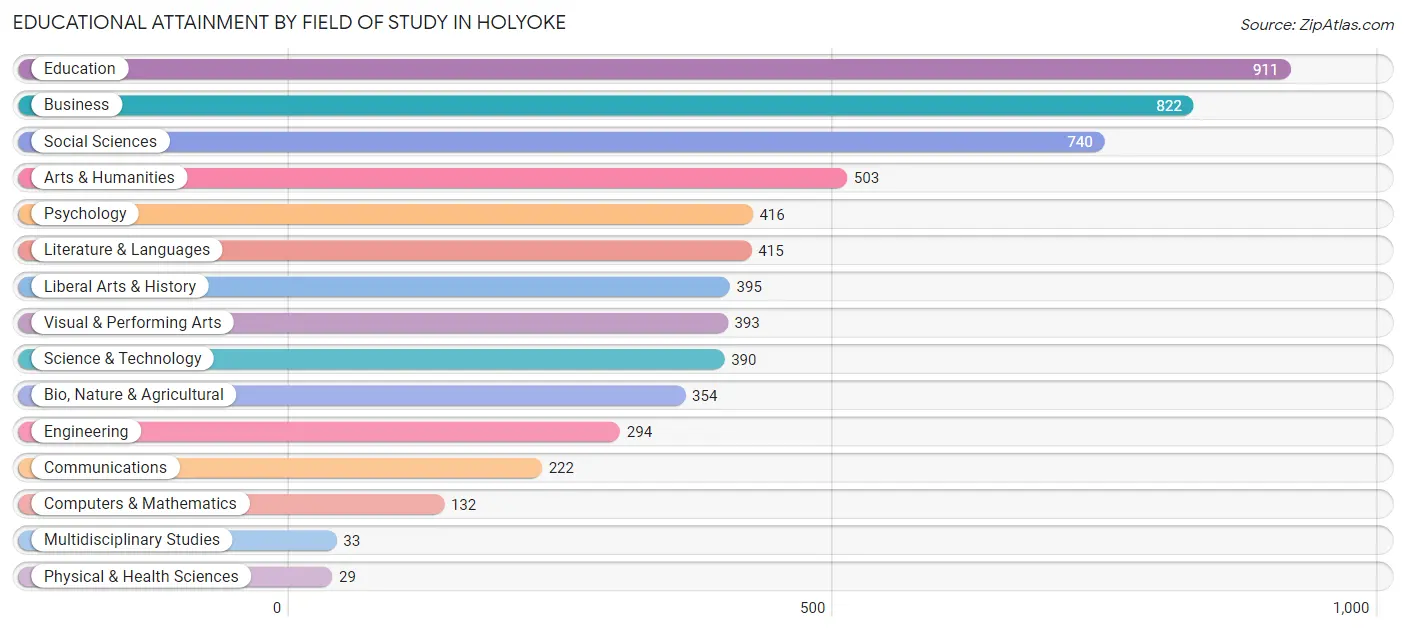
| Field of Study | # Graduates | % Graduates |
| Computers & Mathematics | 132 | 2.2% |
| Bio, Nature & Agricultural | 354 | 5.9% |
| Physical & Health Sciences | 29 | 0.5% |
| Psychology | 416 | 6.9% |
| Social Sciences | 740 | 12.2% |
| Engineering | 294 | 4.9% |
| Multidisciplinary Studies | 33 | 0.5% |
| Science & Technology | 390 | 6.5% |
| Business | 822 | 13.6% |
| Education | 911 | 15.1% |
| Literature & Languages | 415 | 6.9% |
| Liberal Arts & History | 395 | 6.5% |
| Visual & Performing Arts | 393 | 6.5% |
| Communications | 222 | 3.7% |
| Arts & Humanities | 503 | 8.3% |
| Total | 6,049 | 100.0% |
Transportation & Commute in Holyoke
Vehicle Availability by Sex in Holyoke
The most prevalent vehicle ownership categories in Holyoke are males with 2 vehicles (2,843, accounting for 38.4%) and females with 2 vehicles (2,908, making up 37.0%).
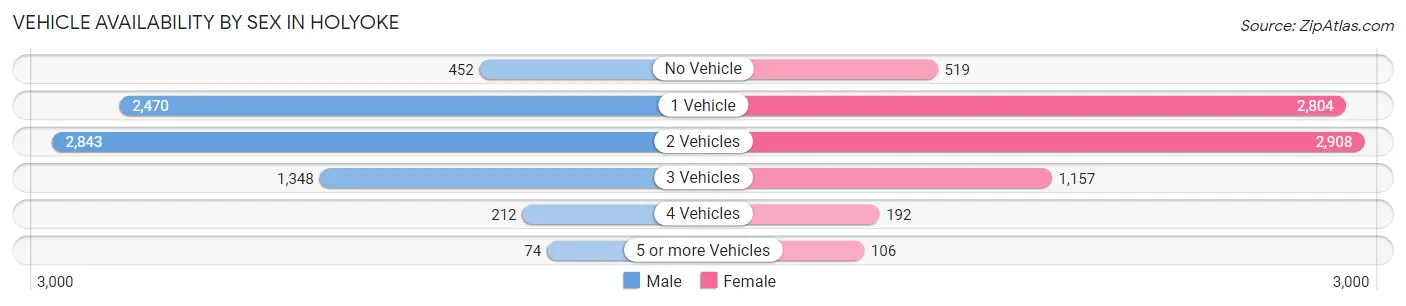
| Vehicles Available | Male | Female |
| No Vehicle | 452 (6.1%) | 519 (6.8%) |
| 1 Vehicle | 2,470 (33.4%) | 2,804 (36.5%) |
| 2 Vehicles | 2,843 (38.4%) | 2,908 (37.8%) |
| 3 Vehicles | 1,348 (18.2%) | 1,157 (15.0%) |
| 4 Vehicles | 212 (2.9%) | 192 (2.5%) |
| 5 or more Vehicles | 74 (1.0%) | 106 (1.4%) |
| Total | 7,399 (100.0%) | 7,686 (100.0%) |
Commute Time in Holyoke
The most frequently occuring commute durations in Holyoke are 10 to 14 minutes (2,872 commuters, 20.8%), 15 to 19 minutes (2,681 commuters, 19.4%), and 20 to 24 minutes (2,601 commuters, 18.8%).
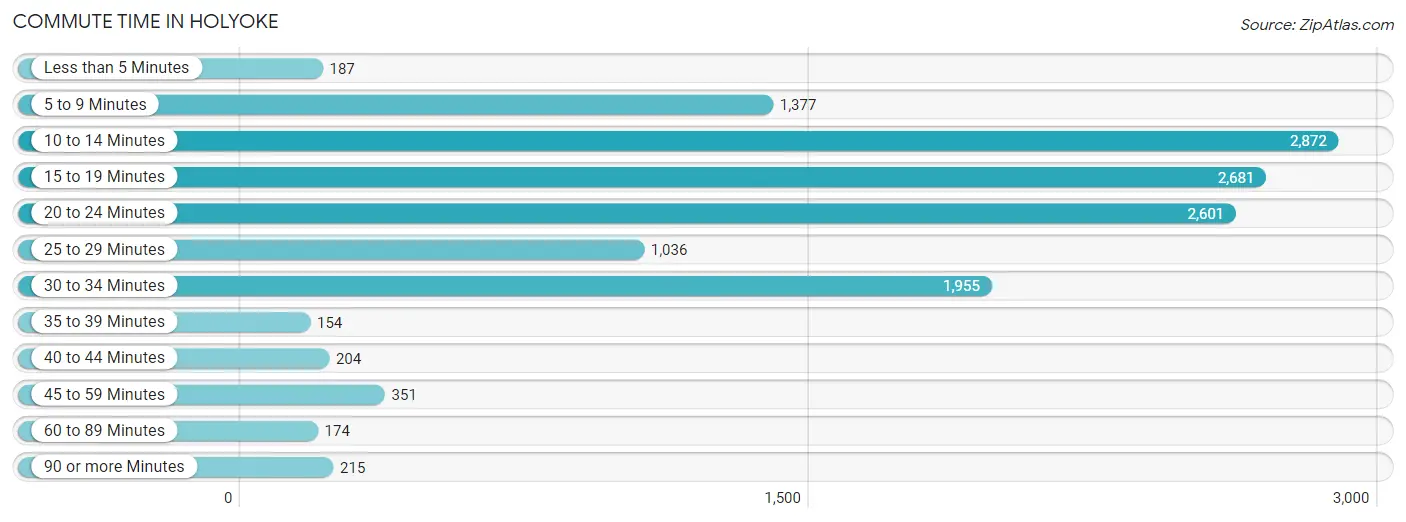
| Commute Time | # Commuters | % Commuters |
| Less than 5 Minutes | 187 | 1.3% |
| 5 to 9 Minutes | 1,377 | 10.0% |
| 10 to 14 Minutes | 2,872 | 20.8% |
| 15 to 19 Minutes | 2,681 | 19.4% |
| 20 to 24 Minutes | 2,601 | 18.8% |
| 25 to 29 Minutes | 1,036 | 7.5% |
| 30 to 34 Minutes | 1,955 | 14.2% |
| 35 to 39 Minutes | 154 | 1.1% |
| 40 to 44 Minutes | 204 | 1.5% |
| 45 to 59 Minutes | 351 | 2.5% |
| 60 to 89 Minutes | 174 | 1.3% |
| 90 or more Minutes | 215 | 1.6% |
Commute Time by Sex in Holyoke
The most common commute times in Holyoke are 15 to 19 minutes (1,519 commuters, 22.3%) for males and 10 to 14 minutes (1,516 commuters, 21.7%) for females.
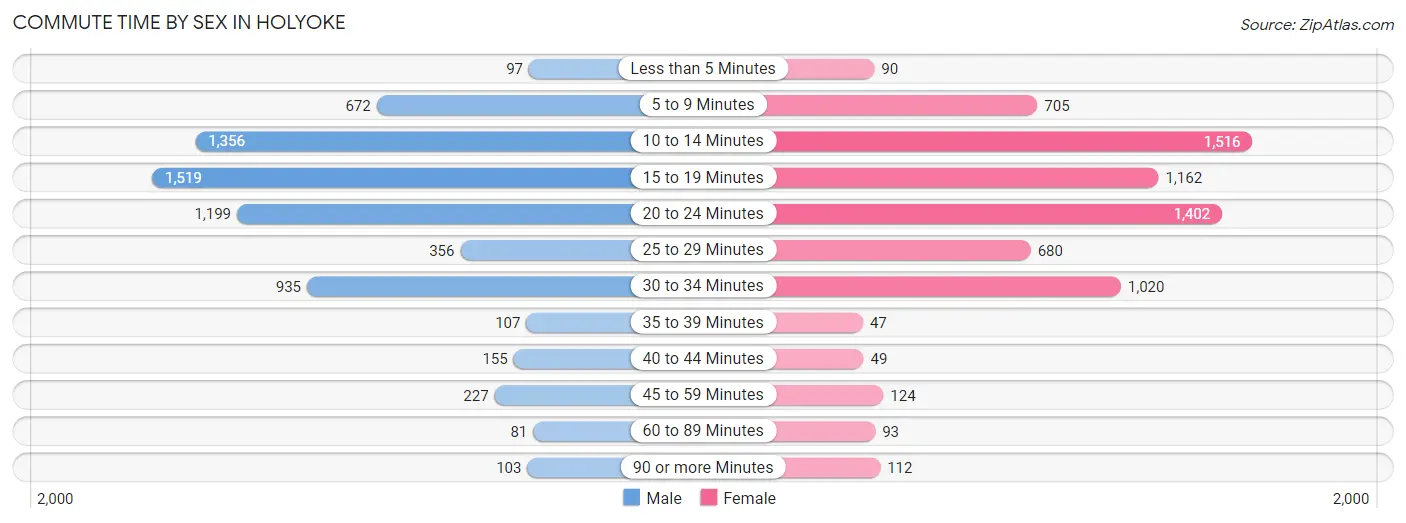
| Commute Time | Male | Female |
| Less than 5 Minutes | 97 (1.4%) | 90 (1.3%) |
| 5 to 9 Minutes | 672 (9.9%) | 705 (10.1%) |
| 10 to 14 Minutes | 1,356 (19.9%) | 1,516 (21.7%) |
| 15 to 19 Minutes | 1,519 (22.3%) | 1,162 (16.6%) |
| 20 to 24 Minutes | 1,199 (17.6%) | 1,402 (20.0%) |
| 25 to 29 Minutes | 356 (5.2%) | 680 (9.7%) |
| 30 to 34 Minutes | 935 (13.7%) | 1,020 (14.6%) |
| 35 to 39 Minutes | 107 (1.6%) | 47 (0.7%) |
| 40 to 44 Minutes | 155 (2.3%) | 49 (0.7%) |
| 45 to 59 Minutes | 227 (3.3%) | 124 (1.8%) |
| 60 to 89 Minutes | 81 (1.2%) | 93 (1.3%) |
| 90 or more Minutes | 103 (1.5%) | 112 (1.6%) |
Time of Departure to Work by Sex in Holyoke
The most frequent times of departure to work in Holyoke are 6:30 AM to 6:59 AM (944, 13.9%) for males and 7:30 AM to 7:59 AM (1,369, 19.6%) for females.
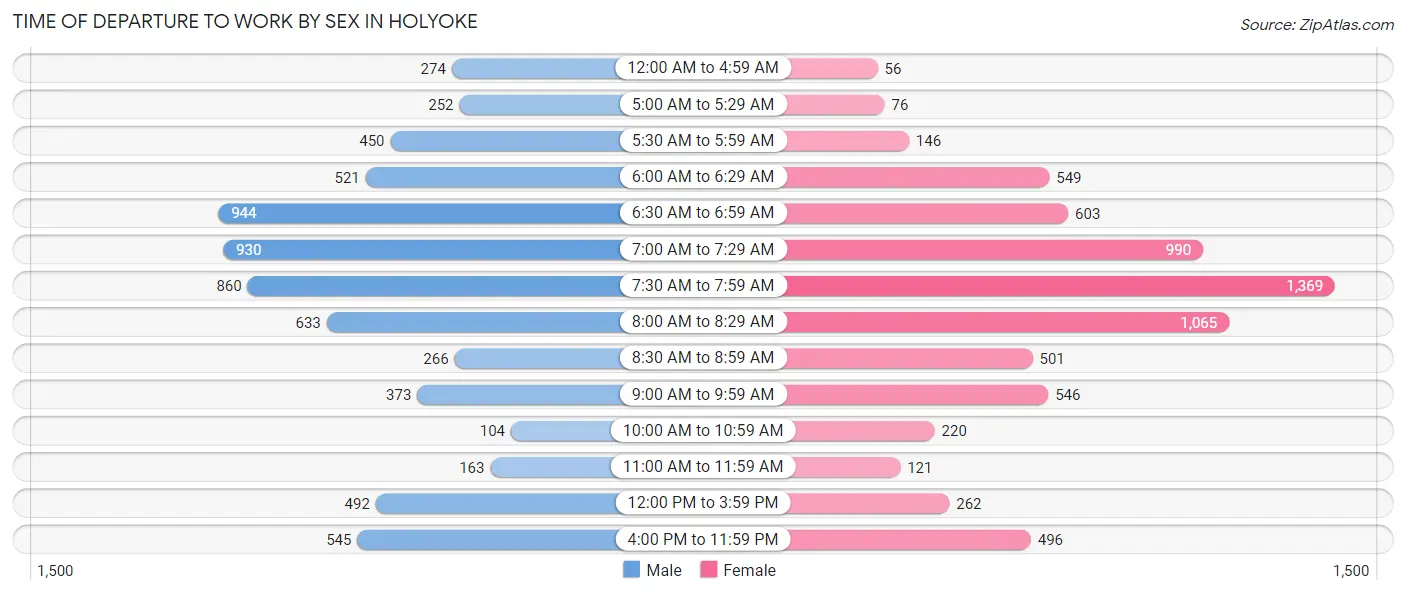
| Time of Departure | Male | Female |
| 12:00 AM to 4:59 AM | 274 (4.0%) | 56 (0.8%) |
| 5:00 AM to 5:29 AM | 252 (3.7%) | 76 (1.1%) |
| 5:30 AM to 5:59 AM | 450 (6.6%) | 146 (2.1%) |
| 6:00 AM to 6:29 AM | 521 (7.6%) | 549 (7.8%) |
| 6:30 AM to 6:59 AM | 944 (13.9%) | 603 (8.6%) |
| 7:00 AM to 7:29 AM | 930 (13.7%) | 990 (14.1%) |
| 7:30 AM to 7:59 AM | 860 (12.6%) | 1,369 (19.6%) |
| 8:00 AM to 8:29 AM | 633 (9.3%) | 1,065 (15.2%) |
| 8:30 AM to 8:59 AM | 266 (3.9%) | 501 (7.2%) |
| 9:00 AM to 9:59 AM | 373 (5.5%) | 546 (7.8%) |
| 10:00 AM to 10:59 AM | 104 (1.5%) | 220 (3.1%) |
| 11:00 AM to 11:59 AM | 163 (2.4%) | 121 (1.7%) |
| 12:00 PM to 3:59 PM | 492 (7.2%) | 262 (3.7%) |
| 4:00 PM to 11:59 PM | 545 (8.0%) | 496 (7.1%) |
| Total | 6,807 (100.0%) | 7,000 (100.0%) |
Housing Occupancy in Holyoke
Occupancy by Ownership in Holyoke
Of the total 15,112 dwellings in Holyoke, owner-occupied units account for 6,272 (41.5%), while renter-occupied units make up 8,840 (58.5%).
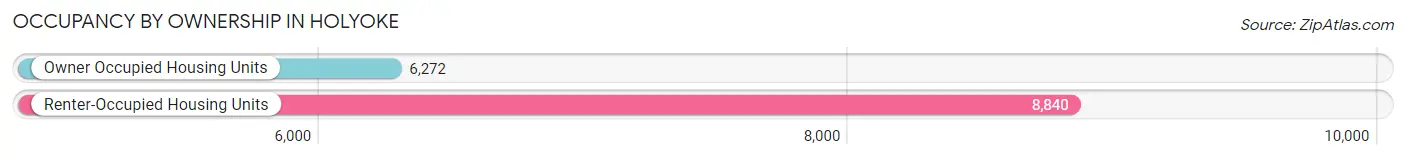
| Occupancy | # Housing Units | % Housing Units |
| Owner Occupied Housing Units | 6,272 | 41.5% |
| Renter-Occupied Housing Units | 8,840 | 58.5% |
| Total Occupied Housing Units | 15,112 | 100.0% |
Occupancy by Household Size in Holyoke
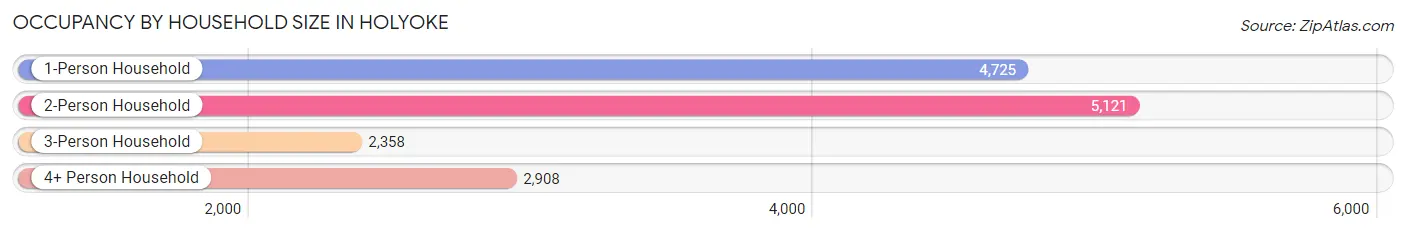
| Household Size | # Housing Units | % Housing Units |
| 1-Person Household | 4,725 | 31.3% |
| 2-Person Household | 5,121 | 33.9% |
| 3-Person Household | 2,358 | 15.6% |
| 4+ Person Household | 2,908 | 19.2% |
| Total Housing Units | 15,112 | 100.0% |
Occupancy by Ownership by Household Size in Holyoke
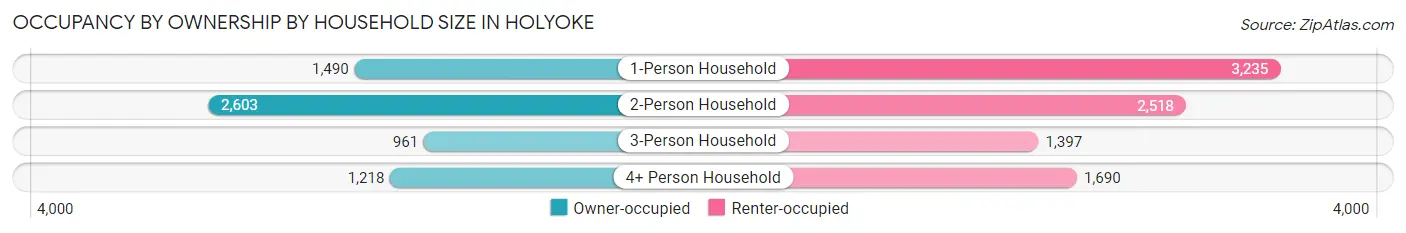
| Household Size | Owner-occupied | Renter-occupied |
| 1-Person Household | 1,490 (31.5%) | 3,235 (68.5%) |
| 2-Person Household | 2,603 (50.8%) | 2,518 (49.2%) |
| 3-Person Household | 961 (40.7%) | 1,397 (59.3%) |
| 4+ Person Household | 1,218 (41.9%) | 1,690 (58.1%) |
| Total Housing Units | 6,272 (41.5%) | 8,840 (58.5%) |
Occupancy by Educational Attainment in Holyoke
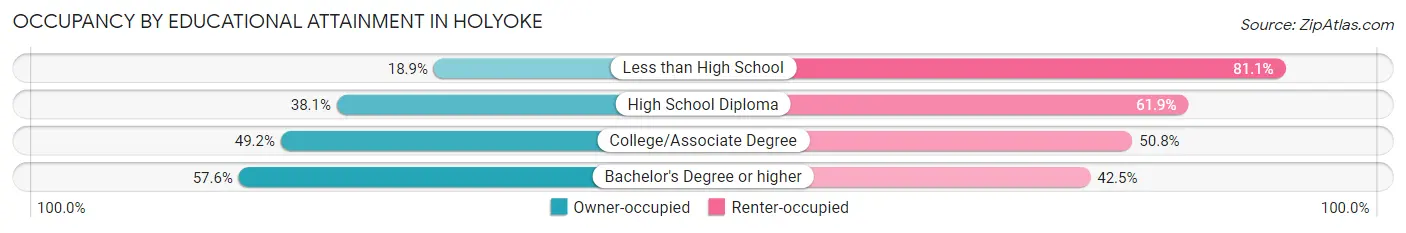
| Household Size | Owner-occupied | Renter-occupied |
| Less than High School | 603 (18.9%) | 2,593 (81.1%) |
| High School Diploma | 1,666 (38.1%) | 2,705 (61.9%) |
| College/Associate Degree | 1,998 (49.2%) | 2,063 (50.8%) |
| Bachelor's Degree or higher | 2,005 (57.6%) | 1,479 (42.4%) |
Occupancy by Age of Householder in Holyoke
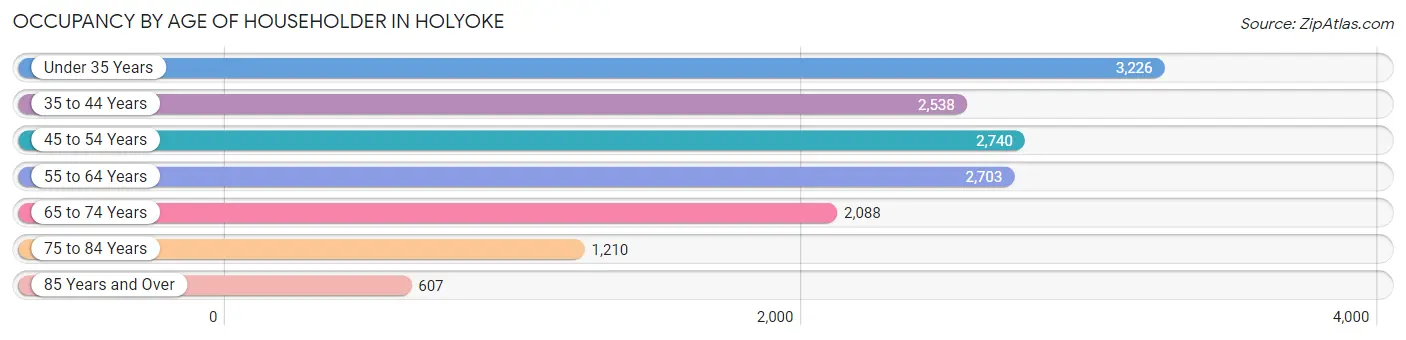
| Age Bracket | # Households | % Households |
| Under 35 Years | 3,226 | 21.3% |
| 35 to 44 Years | 2,538 | 16.8% |
| 45 to 54 Years | 2,740 | 18.1% |
| 55 to 64 Years | 2,703 | 17.9% |
| 65 to 74 Years | 2,088 | 13.8% |
| 75 to 84 Years | 1,210 | 8.0% |
| 85 Years and Over | 607 | 4.0% |
| Total | 15,112 | 100.0% |
Housing Finances in Holyoke
Median Income by Occupancy in Holyoke
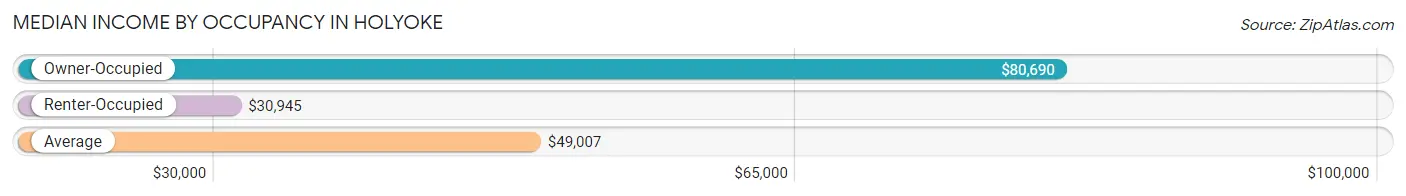
| Occupancy Type | # Households | Median Income |
| Owner-Occupied | 6,272 (41.5%) | $80,690 |
| Renter-Occupied | 8,840 (58.5%) | $30,945 |
| Average | 15,112 (100.0%) | $49,007 |
Occupancy by Householder Income Bracket in Holyoke
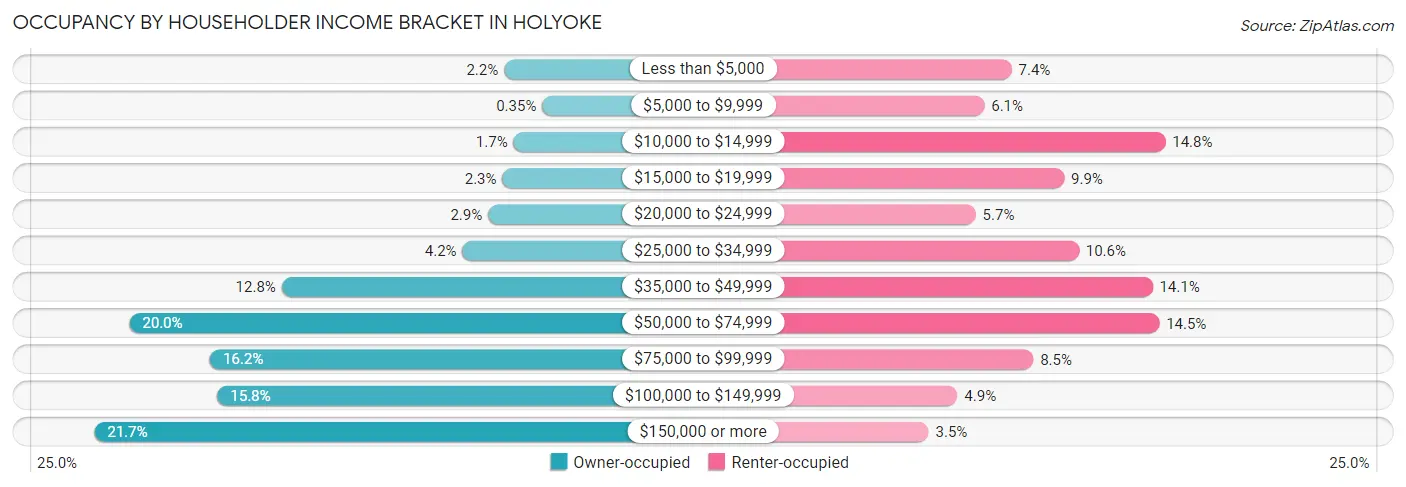
| Income Bracket | Owner-occupied | Renter-occupied |
| Less than $5,000 | 136 (2.2%) | 657 (7.4%) |
| $5,000 to $9,999 | 22 (0.4%) | 542 (6.1%) |
| $10,000 to $14,999 | 108 (1.7%) | 1,304 (14.7%) |
| $15,000 to $19,999 | 141 (2.2%) | 878 (9.9%) |
| $20,000 to $24,999 | 184 (2.9%) | 506 (5.7%) |
| $25,000 to $34,999 | 260 (4.2%) | 940 (10.6%) |
| $35,000 to $49,999 | 800 (12.8%) | 1,250 (14.1%) |
| $50,000 to $74,999 | 1,255 (20.0%) | 1,278 (14.5%) |
| $75,000 to $99,999 | 1,014 (16.2%) | 748 (8.5%) |
| $100,000 to $149,999 | 992 (15.8%) | 429 (4.9%) |
| $150,000 or more | 1,360 (21.7%) | 308 (3.5%) |
| Total | 6,272 (100.0%) | 8,840 (100.0%) |
Monthly Housing Cost Tiers in Holyoke
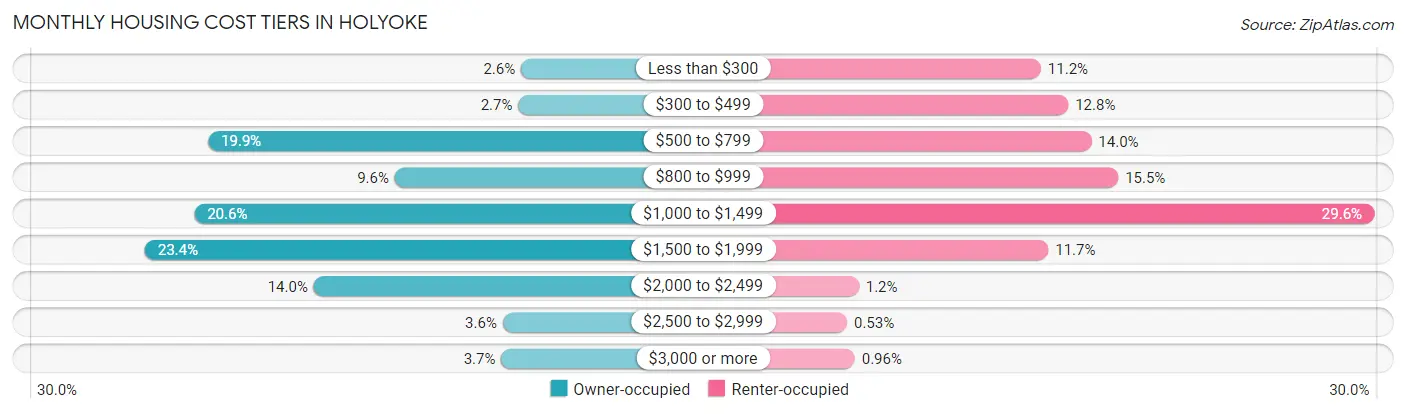
| Monthly Cost | Owner-occupied | Renter-occupied |
| Less than $300 | 162 (2.6%) | 994 (11.2%) |
| $300 to $499 | 171 (2.7%) | 1,127 (12.8%) |
| $500 to $799 | 1,246 (19.9%) | 1,240 (14.0%) |
| $800 to $999 | 599 (9.6%) | 1,371 (15.5%) |
| $1,000 to $1,499 | 1,294 (20.6%) | 2,619 (29.6%) |
| $1,500 to $1,999 | 1,465 (23.4%) | 1,030 (11.7%) |
| $2,000 to $2,499 | 880 (14.0%) | 104 (1.2%) |
| $2,500 to $2,999 | 225 (3.6%) | 47 (0.5%) |
| $3,000 or more | 230 (3.7%) | 85 (1.0%) |
| Total | 6,272 (100.0%) | 8,840 (100.0%) |
Physical Housing Characteristics in Holyoke
Housing Structures in Holyoke
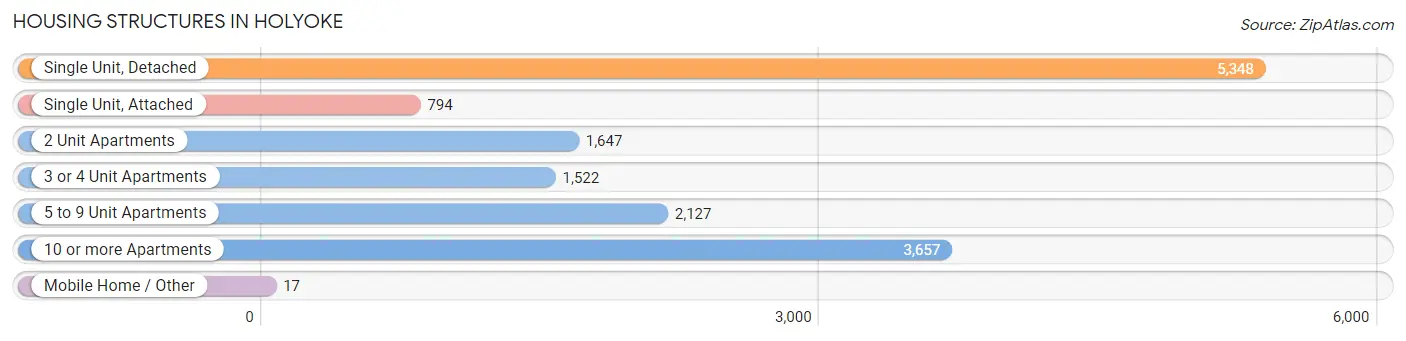
| Structure Type | # Housing Units | % Housing Units |
| Single Unit, Detached | 5,348 | 35.4% |
| Single Unit, Attached | 794 | 5.2% |
| 2 Unit Apartments | 1,647 | 10.9% |
| 3 or 4 Unit Apartments | 1,522 | 10.1% |
| 5 to 9 Unit Apartments | 2,127 | 14.1% |
| 10 or more Apartments | 3,657 | 24.2% |
| Mobile Home / Other | 17 | 0.1% |
| Total | 15,112 | 100.0% |
Housing Structures by Occupancy in Holyoke
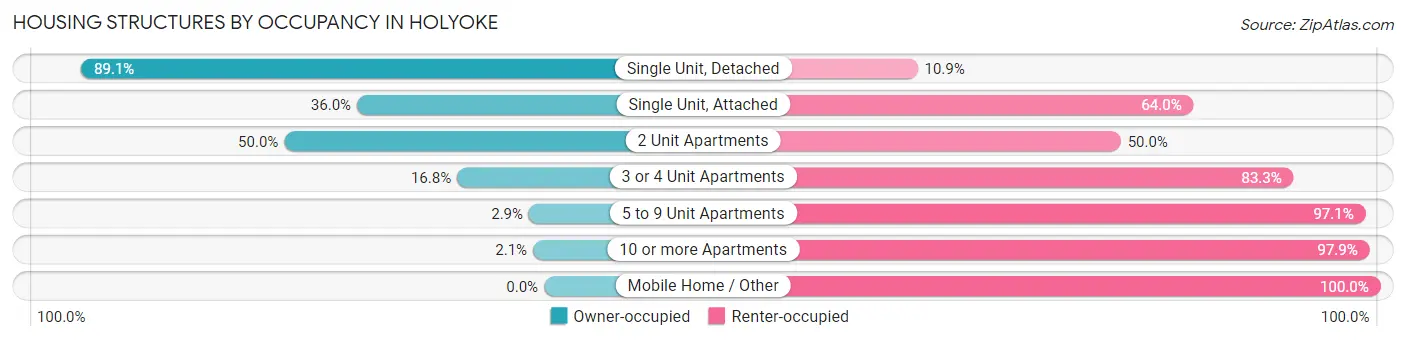
| Structure Type | Owner-occupied | Renter-occupied |
| Single Unit, Detached | 4,767 (89.1%) | 581 (10.9%) |
| Single Unit, Attached | 286 (36.0%) | 508 (64.0%) |
| 2 Unit Apartments | 824 (50.0%) | 823 (50.0%) |
| 3 or 4 Unit Apartments | 255 (16.8%) | 1,267 (83.3%) |
| 5 to 9 Unit Apartments | 62 (2.9%) | 2,065 (97.1%) |
| 10 or more Apartments | 78 (2.1%) | 3,579 (97.9%) |
| Mobile Home / Other | 0 (0.0%) | 17 (100.0%) |
| Total | 6,272 (41.5%) | 8,840 (58.5%) |
Housing Structures by Number of Rooms in Holyoke
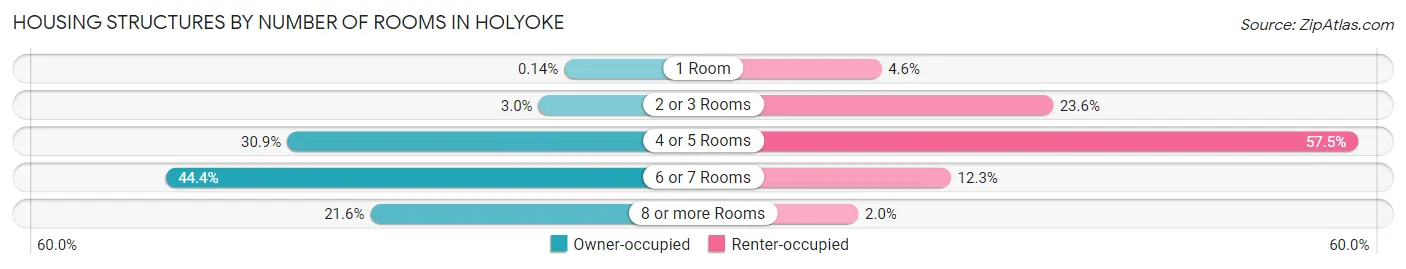
| Number of Rooms | Owner-occupied | Renter-occupied |
| 1 Room | 9 (0.1%) | 405 (4.6%) |
| 2 or 3 Rooms | 186 (3.0%) | 2,088 (23.6%) |
| 4 or 5 Rooms | 1,936 (30.9%) | 5,082 (57.5%) |
| 6 or 7 Rooms | 2,784 (44.4%) | 1,086 (12.3%) |
| 8 or more Rooms | 1,357 (21.6%) | 179 (2.0%) |
| Total | 6,272 (100.0%) | 8,840 (100.0%) |
Housing Structure by Heating Type in Holyoke
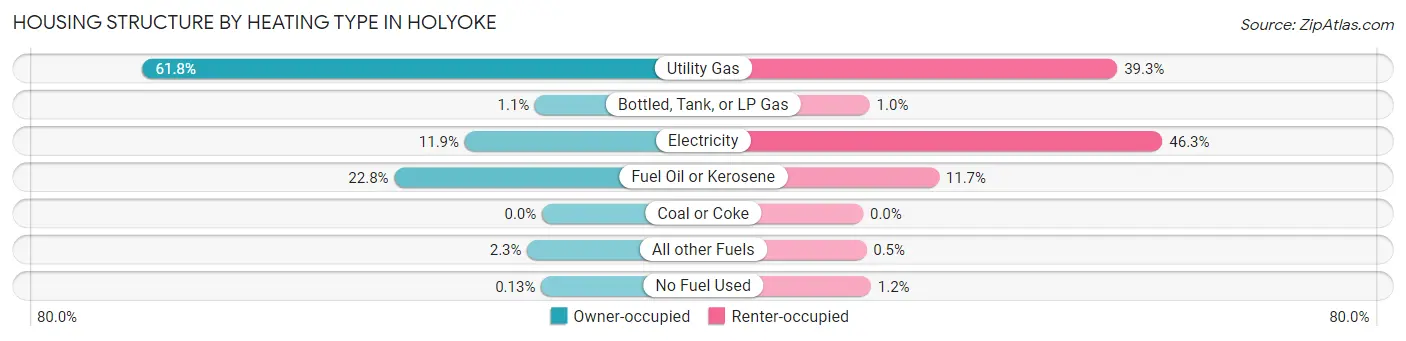
| Heating Type | Owner-occupied | Renter-occupied |
| Utility Gas | 3,873 (61.8%) | 3,473 (39.3%) |
| Bottled, Tank, or LP Gas | 67 (1.1%) | 90 (1.0%) |
| Electricity | 749 (11.9%) | 4,090 (46.3%) |
| Fuel Oil or Kerosene | 1,432 (22.8%) | 1,036 (11.7%) |
| Coal or Coke | 0 (0.0%) | 0 (0.0%) |
| All other Fuels | 143 (2.3%) | 44 (0.5%) |
| No Fuel Used | 8 (0.1%) | 107 (1.2%) |
| Total | 6,272 (100.0%) | 8,840 (100.0%) |
Household Vehicle Usage in Holyoke
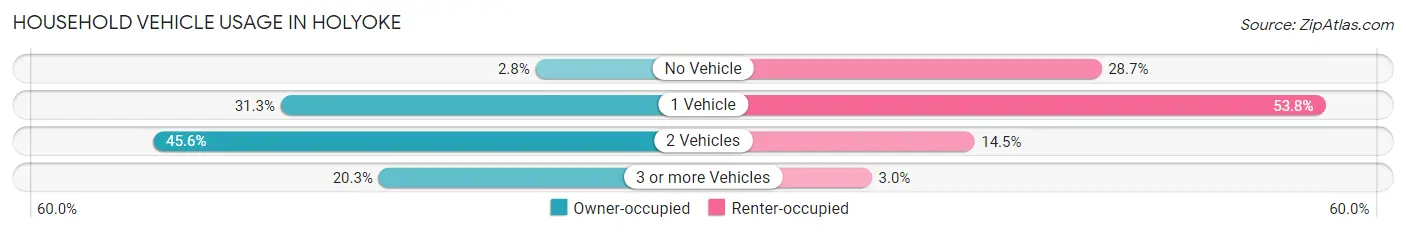
| Vehicles per Household | Owner-occupied | Renter-occupied |
| No Vehicle | 173 (2.8%) | 2,538 (28.7%) |
| 1 Vehicle | 1,964 (31.3%) | 4,757 (53.8%) |
| 2 Vehicles | 2,860 (45.6%) | 1,281 (14.5%) |
| 3 or more Vehicles | 1,275 (20.3%) | 264 (3.0%) |
| Total | 6,272 (100.0%) | 8,840 (100.0%) |
Real Estate & Mortgages in Holyoke
Real Estate and Mortgage Overview in Holyoke
| Characteristic | Without Mortgage | With Mortgage |
| Housing Units | 2,172 | 4,100 |
| Median Property Value | $237,100 | $236,700 |
| Median Household Income | $56,905 | $1,055 |
| Monthly Housing Costs | $707 | $225 |
| Real Estate Taxes | $3,948 | $51 |
Property Value by Mortgage Status in Holyoke
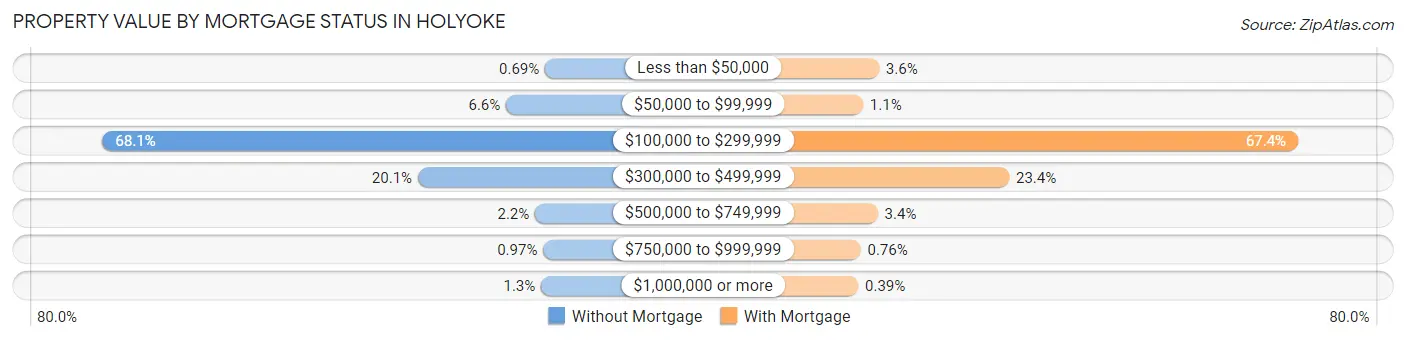
| Property Value | Without Mortgage | With Mortgage |
| Less than $50,000 | 15 (0.7%) | 146 (3.6%) |
| $50,000 to $99,999 | 144 (6.6%) | 46 (1.1%) |
| $100,000 to $299,999 | 1,480 (68.1%) | 2,764 (67.4%) |
| $300,000 to $499,999 | 436 (20.1%) | 959 (23.4%) |
| $500,000 to $749,999 | 48 (2.2%) | 138 (3.4%) |
| $750,000 to $999,999 | 21 (1.0%) | 31 (0.8%) |
| $1,000,000 or more | 28 (1.3%) | 16 (0.4%) |
| Total | 2,172 (100.0%) | 4,100 (100.0%) |
Household Income by Mortgage Status in Holyoke
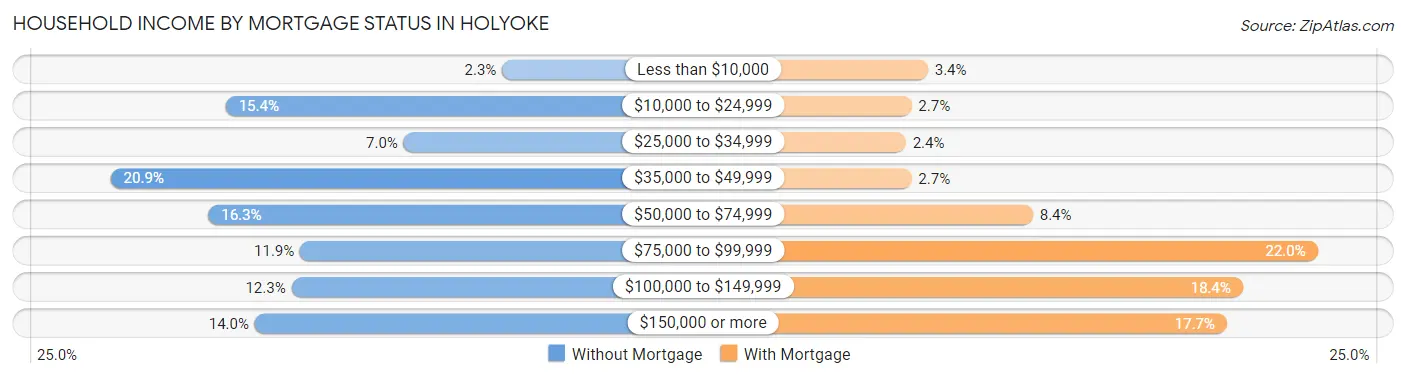
| Household Income | Without Mortgage | With Mortgage |
| Less than $10,000 | 49 (2.3%) | 141 (3.4%) |
| $10,000 to $24,999 | 335 (15.4%) | 109 (2.7%) |
| $25,000 to $34,999 | 151 (7.0%) | 98 (2.4%) |
| $35,000 to $49,999 | 454 (20.9%) | 109 (2.7%) |
| $50,000 to $74,999 | 353 (16.3%) | 346 (8.4%) |
| $75,000 to $99,999 | 258 (11.9%) | 902 (22.0%) |
| $100,000 to $149,999 | 267 (12.3%) | 756 (18.4%) |
| $150,000 or more | 305 (14.0%) | 725 (17.7%) |
| Total | 2,172 (100.0%) | 4,100 (100.0%) |
Property Value to Household Income Ratio in Holyoke
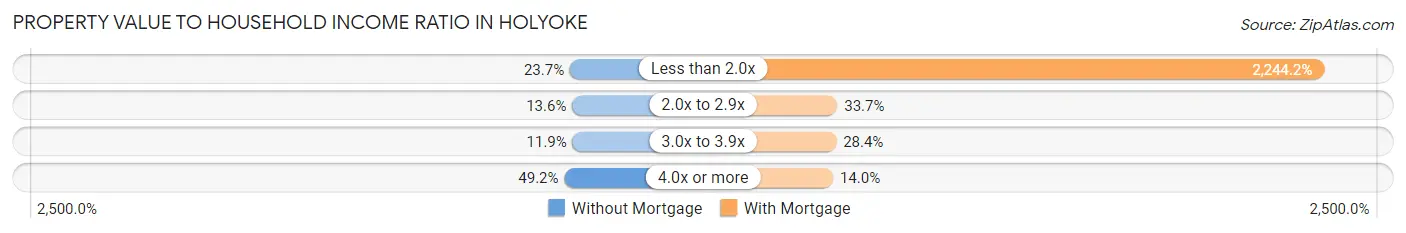
| Value-to-Income Ratio | Without Mortgage | With Mortgage |
| Less than 2.0x | 515 (23.7%) | 92,011 (2,244.2%) |
| 2.0x to 2.9x | 296 (13.6%) | 1,380 (33.7%) |
| 3.0x to 3.9x | 259 (11.9%) | 1,166 (28.4%) |
| 4.0x or more | 1,069 (49.2%) | 572 (14.0%) |
| Total | 2,172 (100.0%) | 4,100 (100.0%) |
Real Estate Taxes by Mortgage Status in Holyoke
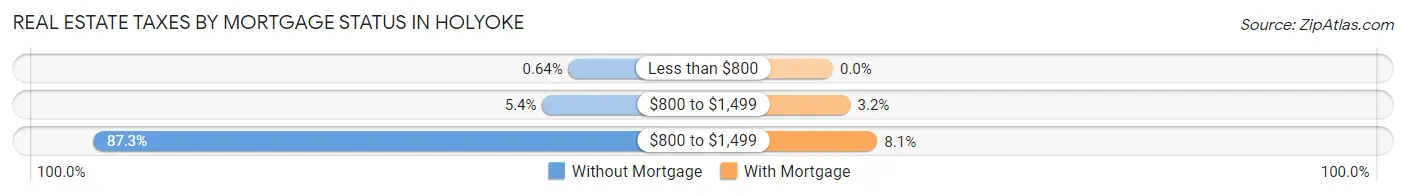
| Property Taxes | Without Mortgage | With Mortgage |
| Less than $800 | 14 (0.6%) | 0 (0.0%) |
| $800 to $1,499 | 118 (5.4%) | 131 (3.2%) |
| $800 to $1,499 | 1,897 (87.3%) | 332 (8.1%) |
| Total | 2,172 (100.0%) | 4,100 (100.0%) |
Health & Disability in Holyoke
Health Insurance Coverage by Age in Holyoke
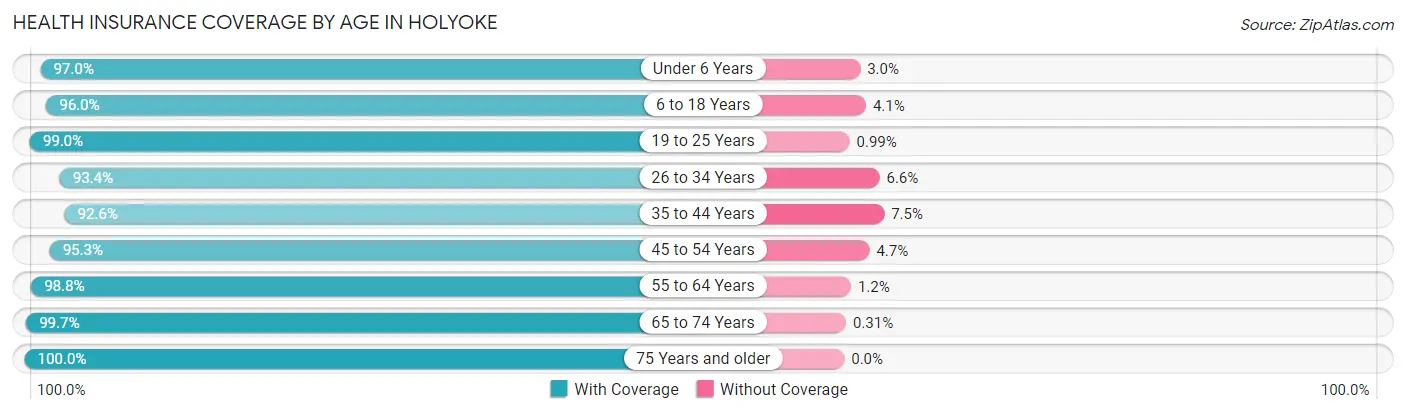
| Age Bracket | With Coverage | Without Coverage |
| Under 6 Years | 2,482 (97.0%) | 76 (3.0%) |
| 6 to 18 Years | 6,135 (96.0%) | 259 (4.1%) |
| 19 to 25 Years | 3,896 (99.0%) | 39 (1.0%) |
| 26 to 34 Years | 4,705 (93.4%) | 331 (6.6%) |
| 35 to 44 Years | 4,297 (92.5%) | 346 (7.4%) |
| 45 to 54 Years | 4,165 (95.3%) | 205 (4.7%) |
| 55 to 64 Years | 4,454 (98.8%) | 56 (1.2%) |
| 65 to 74 Years | 3,267 (99.7%) | 10 (0.3%) |
| 75 Years and older | 2,599 (100.0%) | 0 (0.0%) |
| Total | 36,000 (96.5%) | 1,322 (3.5%) |
Health Insurance Coverage by Citizenship Status in Holyoke
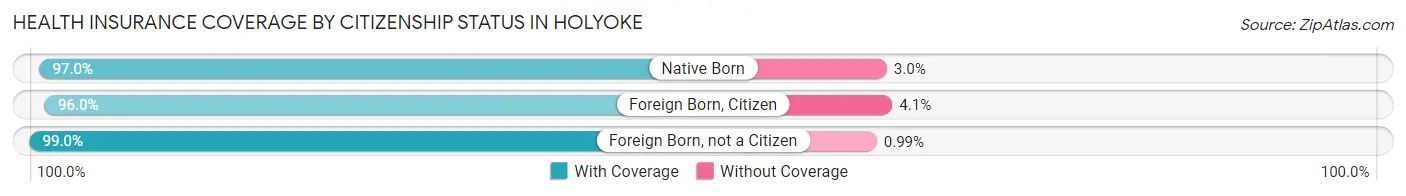
| Citizenship Status | With Coverage | Without Coverage |
| Native Born | 2,482 (97.0%) | 76 (3.0%) |
| Foreign Born, Citizen | 6,135 (96.0%) | 259 (4.1%) |
| Foreign Born, not a Citizen | 3,896 (99.0%) | 39 (1.0%) |
Health Insurance Coverage by Household Income in Holyoke
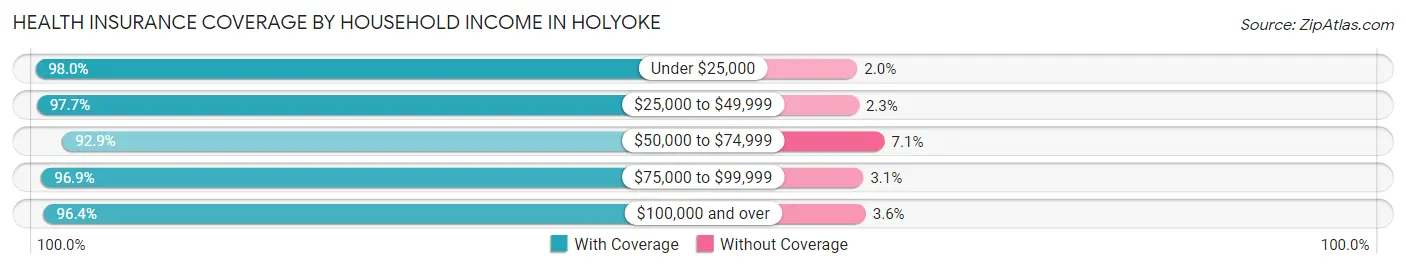
| Household Income | With Coverage | Without Coverage |
| Under $25,000 | 8,586 (98.0%) | 174 (2.0%) |
| $25,000 to $49,999 | 7,471 (97.7%) | 174 (2.3%) |
| $50,000 to $74,999 | 5,684 (92.9%) | 434 (7.1%) |
| $75,000 to $99,999 | 4,699 (96.9%) | 152 (3.1%) |
| $100,000 and over | 9,240 (96.4%) | 342 (3.6%) |
Public vs Private Health Insurance Coverage by Age in Holyoke
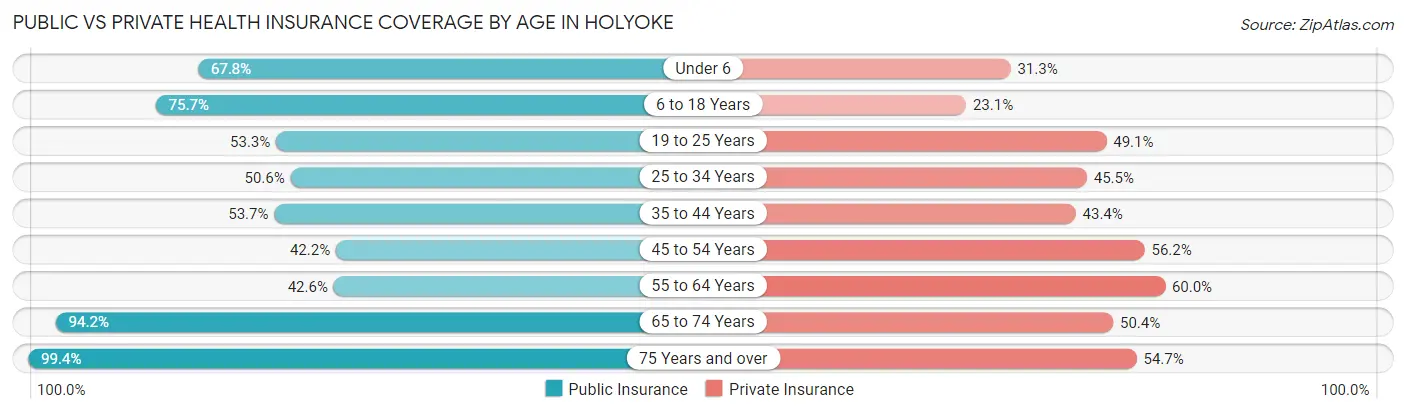
| Age Bracket | Public Insurance | Private Insurance |
| Under 6 | 1,735 (67.8%) | 801 (31.3%) |
| 6 to 18 Years | 4,839 (75.7%) | 1,474 (23.1%) |
| 19 to 25 Years | 2,098 (53.3%) | 1,932 (49.1%) |
| 25 to 34 Years | 2,550 (50.6%) | 2,290 (45.5%) |
| 35 to 44 Years | 2,491 (53.6%) | 2,015 (43.4%) |
| 45 to 54 Years | 1,844 (42.2%) | 2,456 (56.2%) |
| 55 to 64 Years | 1,922 (42.6%) | 2,705 (60.0%) |
| 65 to 74 Years | 3,088 (94.2%) | 1,650 (50.3%) |
| 75 Years and over | 2,582 (99.4%) | 1,422 (54.7%) |
| Total | 23,149 (62.0%) | 16,745 (44.9%) |
Disability Status by Sex by Age in Holyoke
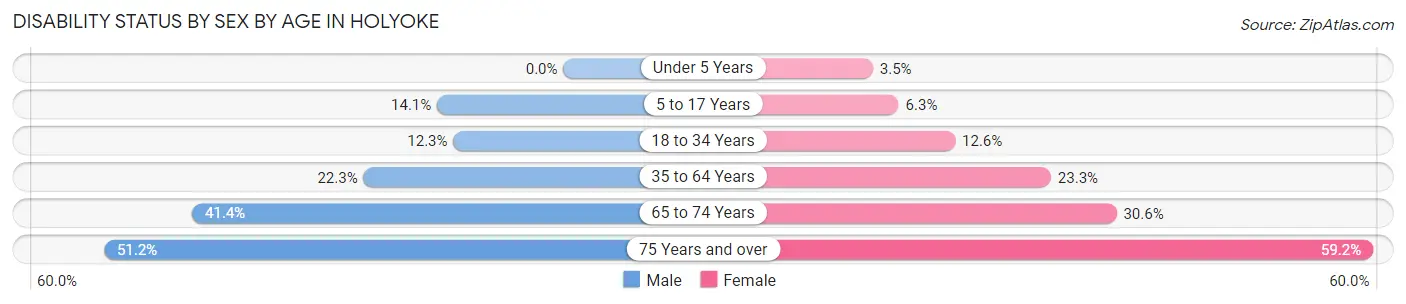
| Age Bracket | Male | Female |
| Under 5 Years | 0 (0.0%) | 32 (3.5%) |
| 5 to 17 Years | 490 (14.1%) | 176 (6.3%) |
| 18 to 34 Years | 578 (12.2%) | 601 (12.6%) |
| 35 to 64 Years | 1,393 (22.3%) | 1,692 (23.3%) |
| 65 to 74 Years | 601 (41.4%) | 558 (30.6%) |
| 75 Years and over | 573 (51.2%) | 875 (59.2%) |
Disability Class by Sex by Age in Holyoke
Disability Class: Hearing Difficulty
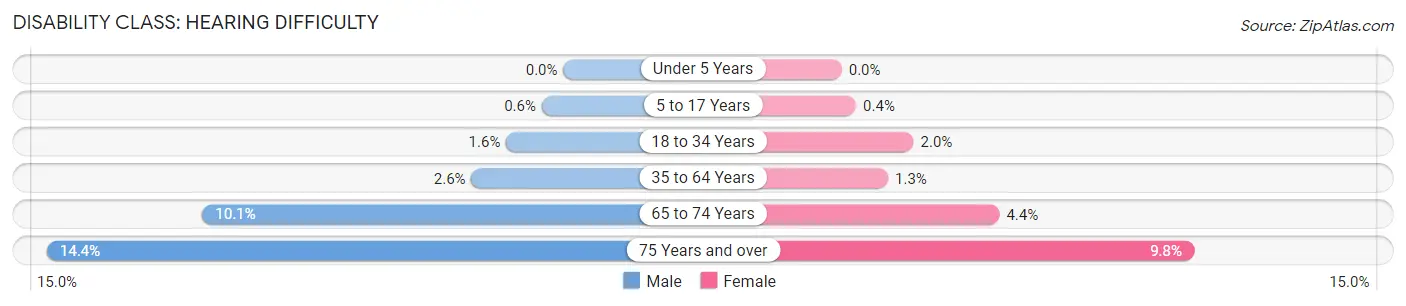
| Age Bracket | Male | Female |
| Under 5 Years | 0 (0.0%) | 0 (0.0%) |
| 5 to 17 Years | 21 (0.6%) | 11 (0.4%) |
| 18 to 34 Years | 75 (1.6%) | 95 (2.0%) |
| 35 to 64 Years | 160 (2.6%) | 94 (1.3%) |
| 65 to 74 Years | 146 (10.1%) | 80 (4.4%) |
| 75 Years and over | 161 (14.4%) | 145 (9.8%) |
Disability Class: Vision Difficulty
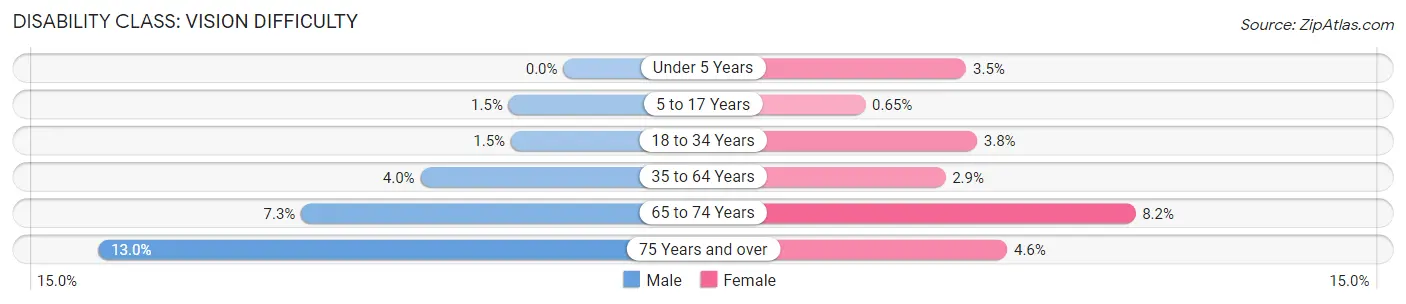
| Age Bracket | Male | Female |
| Under 5 Years | 0 (0.0%) | 32 (3.5%) |
| 5 to 17 Years | 53 (1.5%) | 18 (0.6%) |
| 18 to 34 Years | 69 (1.5%) | 179 (3.8%) |
| 35 to 64 Years | 249 (4.0%) | 209 (2.9%) |
| 65 to 74 Years | 106 (7.3%) | 149 (8.2%) |
| 75 Years and over | 145 (13.0%) | 68 (4.6%) |
Disability Class: Cognitive Difficulty
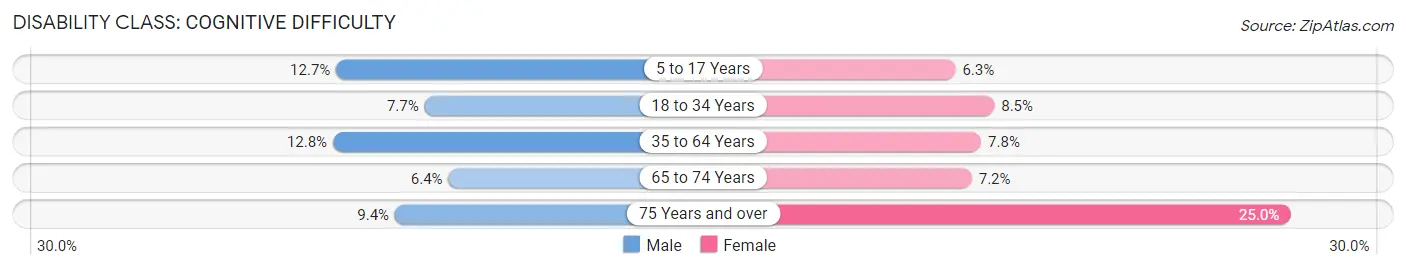
| Age Bracket | Male | Female |
| 5 to 17 Years | 441 (12.7%) | 176 (6.3%) |
| 18 to 34 Years | 365 (7.7%) | 404 (8.5%) |
| 35 to 64 Years | 803 (12.8%) | 564 (7.8%) |
| 65 to 74 Years | 93 (6.4%) | 132 (7.2%) |
| 75 Years and over | 105 (9.4%) | 370 (25.0%) |
Disability Class: Ambulatory Difficulty
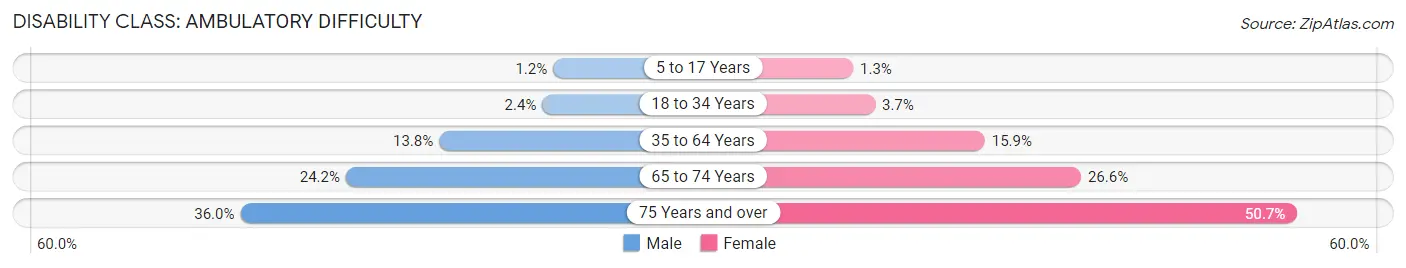
| Age Bracket | Male | Female |
| 5 to 17 Years | 40 (1.1%) | 35 (1.3%) |
| 18 to 34 Years | 111 (2.4%) | 176 (3.7%) |
| 35 to 64 Years | 866 (13.8%) | 1,157 (15.9%) |
| 65 to 74 Years | 352 (24.2%) | 486 (26.6%) |
| 75 Years and over | 403 (36.0%) | 750 (50.7%) |
Disability Class: Self-Care Difficulty
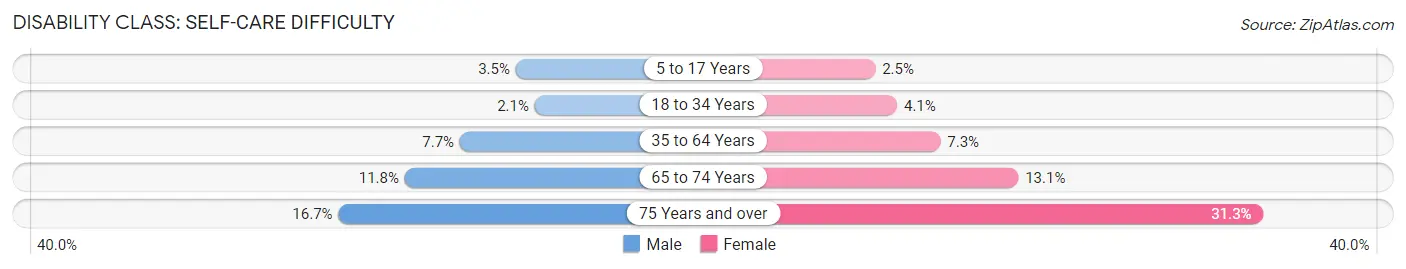
| Age Bracket | Male | Female |
| 5 to 17 Years | 123 (3.5%) | 69 (2.5%) |
| 18 to 34 Years | 100 (2.1%) | 195 (4.1%) |
| 35 to 64 Years | 481 (7.7%) | 532 (7.3%) |
| 65 to 74 Years | 171 (11.8%) | 239 (13.1%) |
| 75 Years and over | 187 (16.7%) | 463 (31.3%) |
Technology Access in Holyoke
Computing Device Access in Holyoke
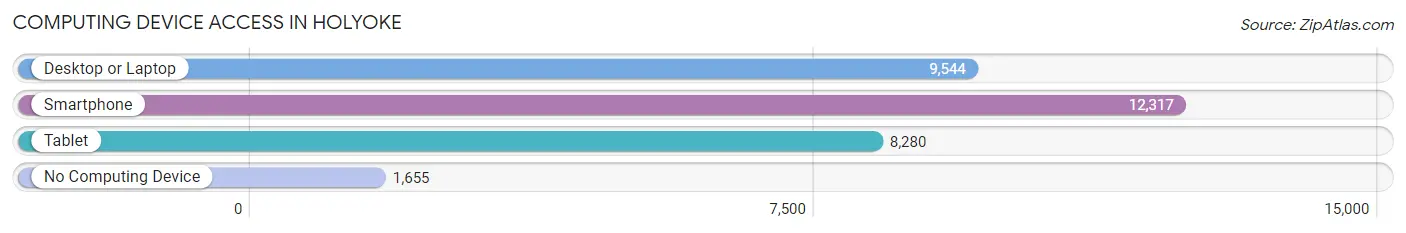
| Device Type | # Households | % Households |
| Desktop or Laptop | 9,544 | 63.2% |
| Smartphone | 12,317 | 81.5% |
| Tablet | 8,280 | 54.8% |
| No Computing Device | 1,655 | 11.0% |
| Total | 15,112 | 100.0% |
Internet Access in Holyoke
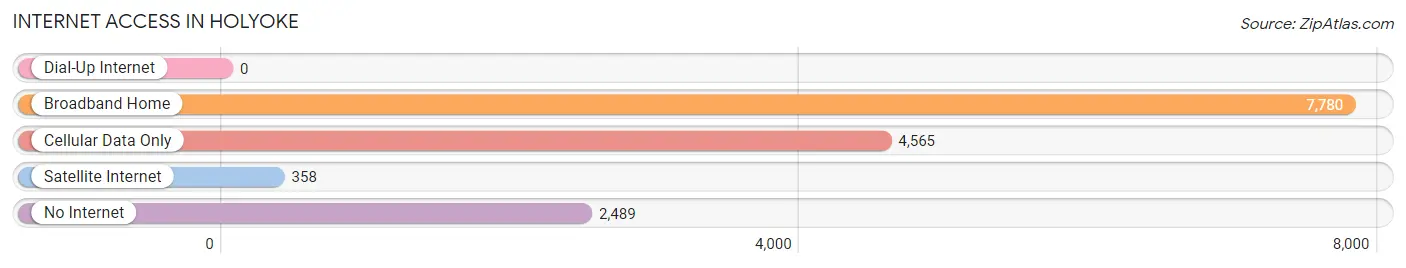
| Internet Type | # Households | % Households |
| Dial-Up Internet | 0 | 0.0% |
| Broadband Home | 7,780 | 51.5% |
| Cellular Data Only | 4,565 | 30.2% |
| Satellite Internet | 358 | 2.4% |
| No Internet | 2,489 | 16.5% |
| Total | 15,112 | 100.0% |
Holyoke Summary
Holyoke, Massachusetts is a city located in Hampden County in the Pioneer Valley region of the Commonwealth of Massachusetts. It is situated between the cities of Springfield and Chicopee, and is bordered by the Connecticut River. The city is known for its rich history, diverse geography, vibrant economy, and diverse demographics.
History
Holyoke was first settled in 1745 by settlers from the Connecticut River Valley. The city was originally known as Ireland Parish, and was later renamed in honor of Elizur Holyoke, a prominent local minister. The city was officially incorporated in 1850.
Holyoke was an important industrial center in the 19th and 20th centuries. The city was home to numerous paper mills, which were powered by the nearby Hadley Falls. The city was also home to a number of other industries, including iron and steel production, textiles, and rubber manufacturing.
Geography
Holyoke is located in the Pioneer Valley region of Massachusetts, and is bordered by the Connecticut River. The city is situated between the cities of Springfield and Chicopee. The city has a total area of 8.3 square miles, of which 8.2 square miles is land and 0.1 square miles is water.
The city is located in the Connecticut River Valley, and is surrounded by hills and mountains. The city is home to numerous parks and recreational areas, including the Holyoke Heritage State Park, the Holyoke Range, and the Mount Tom State Reservation.
Economy
Holyoke has a vibrant economy that is driven by a number of industries. The city is home to numerous paper mills, which are powered by the nearby Hadley Falls. The city is also home to a number of other industries, including iron and steel production, textiles, and rubber manufacturing.
The city is also home to a number of educational institutions, including the University of Massachusetts Amherst, Holyoke Community College, and Elms College. The city is also home to a number of healthcare facilities, including Holyoke Medical Center and Holyoke Health Center.
Demographics
As of the 2010 census, the population of Holyoke was 39,880. The city has a diverse population, with a majority of the population being of Hispanic or Latino origin. The city also has a significant population of African Americans, Asians, and Native Americans.
The median household income in Holyoke is $35,945, and the median family income is $41,945. The city has a poverty rate of 28.3%, which is higher than the national average. The city also has a high unemployment rate of 8.2%.
Holyoke is a diverse and vibrant city with a rich history, diverse geography, vibrant economy, and diverse demographics. The city is home to numerous industries, educational institutions, and healthcare facilities, and is a great place to live and work.
Common Questions
What is Per Capita Income in Holyoke?
Per Capita income in Holyoke is $27,973.
What is the Median Family Income in Holyoke?
Median Family Income in Holyoke is $59,787.
What is the Median Household income in Holyoke?
Median Household Income in Holyoke is $49,007.
What is Income or Wage Gap in Holyoke?
Income or Wage Gap in Holyoke is 19.7%.
Women in Holyoke earn 80.3 cents for every dollar earned by a man.
What is Family Income Deficit in Holyoke?
Family Income Deficit in Holyoke is $11,480.
Families that are below poverty line in Holyoke earn $11,480 less on average than the poverty threshold level.
What is Inequality or Gini Index in Holyoke?
Inequality or Gini Index in Holyoke is 0.49.
What is the Total Population of Holyoke?
Total Population of Holyoke is 38,210.
What is the Total Male Population of Holyoke?
Total Male Population of Holyoke is 18,805.
What is the Total Female Population of Holyoke?
Total Female Population of Holyoke is 19,405.
What is the Ratio of Males per 100 Females in Holyoke?
There are 96.91 Males per 100 Females in Holyoke.
What is the Ratio of Females per 100 Males in Holyoke?
There are 103.19 Females per 100 Males in Holyoke.
What is the Median Population Age in Holyoke?
Median Population Age in Holyoke is 37.5 Years.
What is the Average Family Size in Holyoke
Average Family Size in Holyoke is 3.1 People.
What is the Average Household Size in Holyoke
Average Household Size in Holyoke is 2.5 People.
How Large is the Labor Force in Holyoke?
There are 16,599 People in the Labor Forcein in Holyoke.
What is the Percentage of People in the Labor Force in Holyoke?
54.2% of People are in the Labor Force in Holyoke.
What is the Unemployment Rate in Holyoke?
Unemployment Rate in Holyoke is 6.8%.