Waynesboro borough, PA Map & Demographics
Waynesboro borough Overview
$27,339
PER CAPITA INCOME
$65,657
AVG FAMILY INCOME
$56,413
AVG HOUSEHOLD INCOME
0.8%
WAGE / INCOME GAP [ % ]
99.2¢/ $1
WAGE / INCOME GAP [ $ ]
$11,217
FAMILY INCOME DEFICIT
0.37
INEQUALITY / GINI INDEX
11,009
TOTAL POPULATION
5,141
MALE POPULATION
5,868
FEMALE POPULATION
87.61
MALES / 100 FEMALES
114.14
FEMALES / 100 MALES
36.8
MEDIAN AGE
3.1
AVG FAMILY SIZE
2.4
AVG HOUSEHOLD SIZE
5,449
LABOR FORCE [ PEOPLE ]
65.3%
PERCENT IN LABOR FORCE
3.4%
UNEMPLOYMENT RATE
Income in Waynesboro borough
Income Overview in Waynesboro borough
Per Capita Income in Waynesboro borough is $27,339, while median incomes of families and households are $65,657 and $56,413 respectively.
| Characteristic | Number | Measure |
| Per Capita Income | 11,009 | $27,339 |
| Median Family Income | 2,701 | $65,657 |
| Mean Family Income | 2,701 | $76,757 |
| Median Household Income | 4,511 | $56,413 |
| Mean Household Income | 4,511 | $65,167 |
| Income Deficit | 2,701 | $11,217 |
| Wage / Income Gap (%) | 11,009 | 0.77% |
| Wage / Income Gap ($) | 11,009 | 99.23¢ per $1 |
| Gini / Inequality Index | 11,009 | 0.37 |
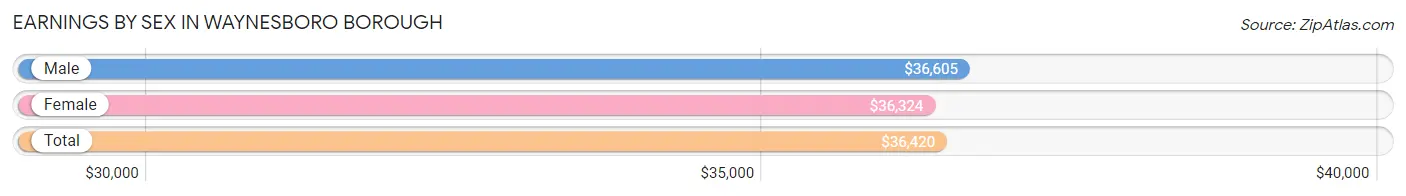
Earnings by Sex in Waynesboro borough
Average Earnings in Waynesboro borough are $36,420, $36,605 for men and $36,324 for women, a difference of 0.8%.
| Sex | Number | Average Earnings |
| Male | 2,857 (49.7%) | $36,605 |
| Female | 2,894 (50.3%) | $36,324 |
| Total | 5,751 (100.0%) | $36,420 |
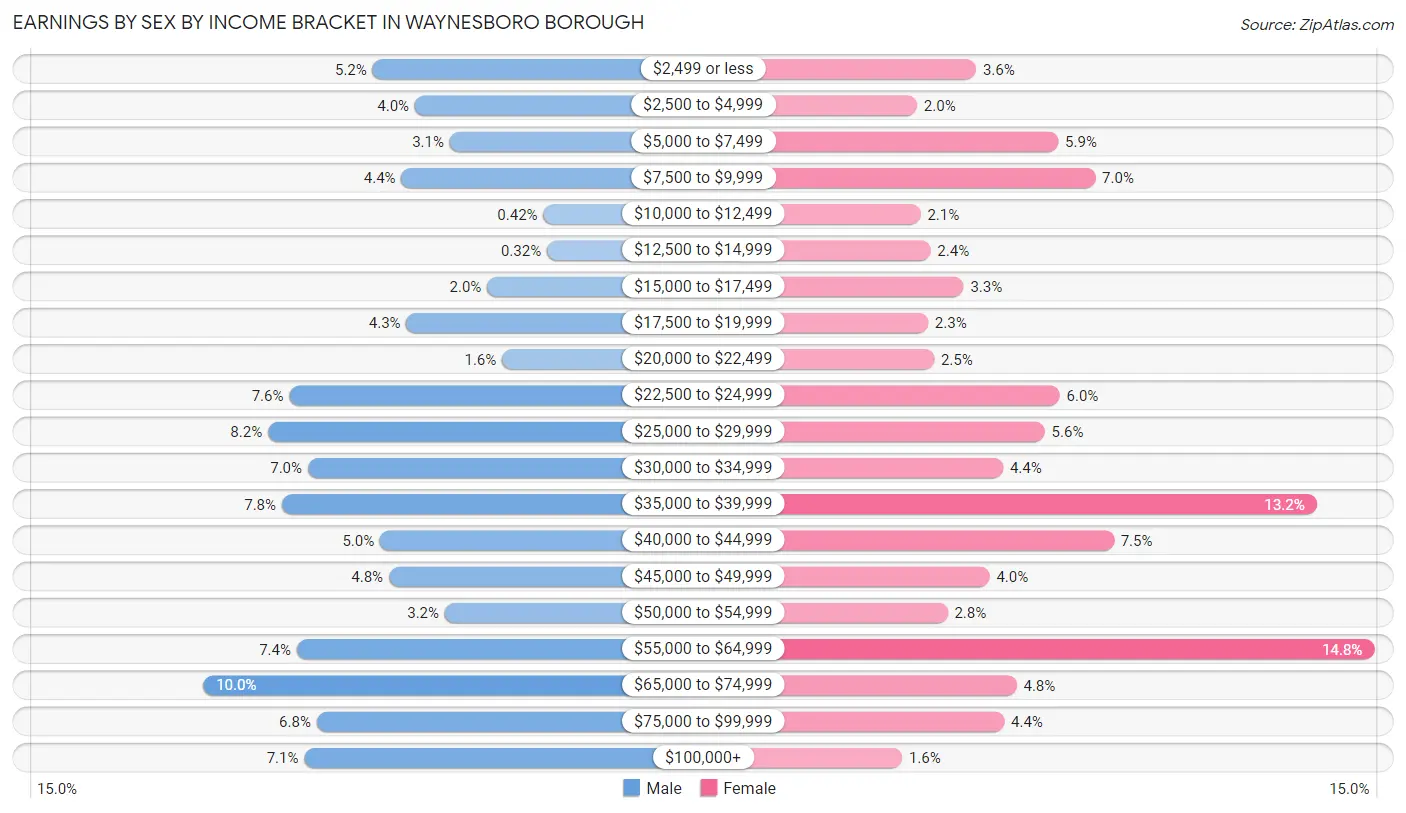
Earnings by Sex by Income Bracket in Waynesboro borough
The most common earnings brackets in Waynesboro borough are $65,000 to $74,999 for men (285 | 10.0%) and $55,000 to $64,999 for women (429 | 14.8%).
| Income | Male | Female |
| $2,499 or less | 149 (5.2%) | 105 (3.6%) |
| $2,500 to $4,999 | 115 (4.0%) | 57 (2.0%) |
| $5,000 to $7,499 | 87 (3.0%) | 172 (5.9%) |
| $7,500 to $9,999 | 126 (4.4%) | 202 (7.0%) |
| $10,000 to $12,499 | 12 (0.4%) | 60 (2.1%) |
| $12,500 to $14,999 | 9 (0.3%) | 68 (2.4%) |
| $15,000 to $17,499 | 57 (2.0%) | 95 (3.3%) |
| $17,500 to $19,999 | 122 (4.3%) | 66 (2.3%) |
| $20,000 to $22,499 | 45 (1.6%) | 71 (2.5%) |
| $22,500 to $24,999 | 216 (7.6%) | 173 (6.0%) |
| $25,000 to $29,999 | 233 (8.2%) | 161 (5.6%) |
| $30,000 to $34,999 | 201 (7.0%) | 127 (4.4%) |
| $35,000 to $39,999 | 222 (7.8%) | 382 (13.2%) |
| $40,000 to $44,999 | 143 (5.0%) | 217 (7.5%) |
| $45,000 to $49,999 | 136 (4.8%) | 116 (4.0%) |
| $50,000 to $54,999 | 91 (3.2%) | 82 (2.8%) |
| $55,000 to $64,999 | 210 (7.3%) | 429 (14.8%) |
| $65,000 to $74,999 | 285 (10.0%) | 138 (4.8%) |
| $75,000 to $99,999 | 194 (6.8%) | 128 (4.4%) |
| $100,000+ | 204 (7.1%) | 45 (1.5%) |
| Total | 2,857 (100.0%) | 2,894 (100.0%) |
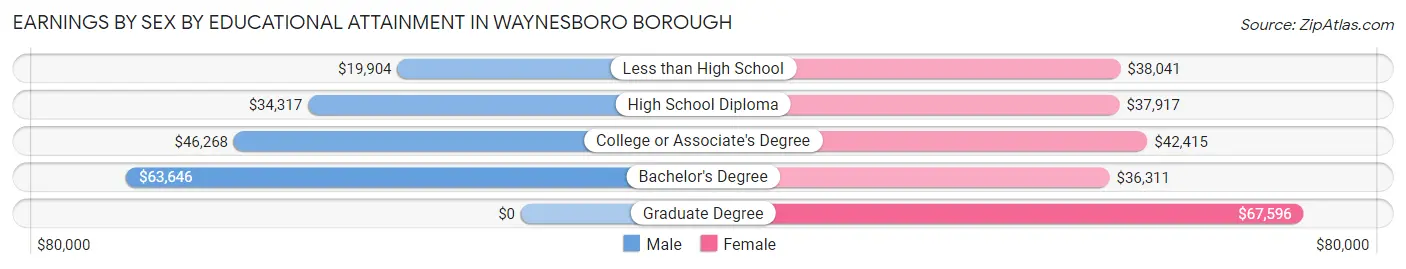
Earnings by Sex by Educational Attainment in Waynesboro borough
Average earnings in Waynesboro borough are $40,571 for men and $38,903 for women, a difference of 4.1%. Men with an educational attainment of bachelor's degree enjoy the highest average annual earnings of $63,646, while those with less than high school education earn the least with $19,904. Women with an educational attainment of graduate degree earn the most with the average annual earnings of $67,596, while those with bachelor's degree education have the smallest earnings of $36,311.
| Educational Attainment | Male Income | Female Income |
| Less than High School | $19,904 | $38,041 |
| High School Diploma | $34,317 | $37,917 |
| College or Associate's Degree | $46,268 | $42,415 |
| Bachelor's Degree | $63,646 | $36,311 |
| Graduate Degree | - | - |
| Total | $40,571 | $38,903 |
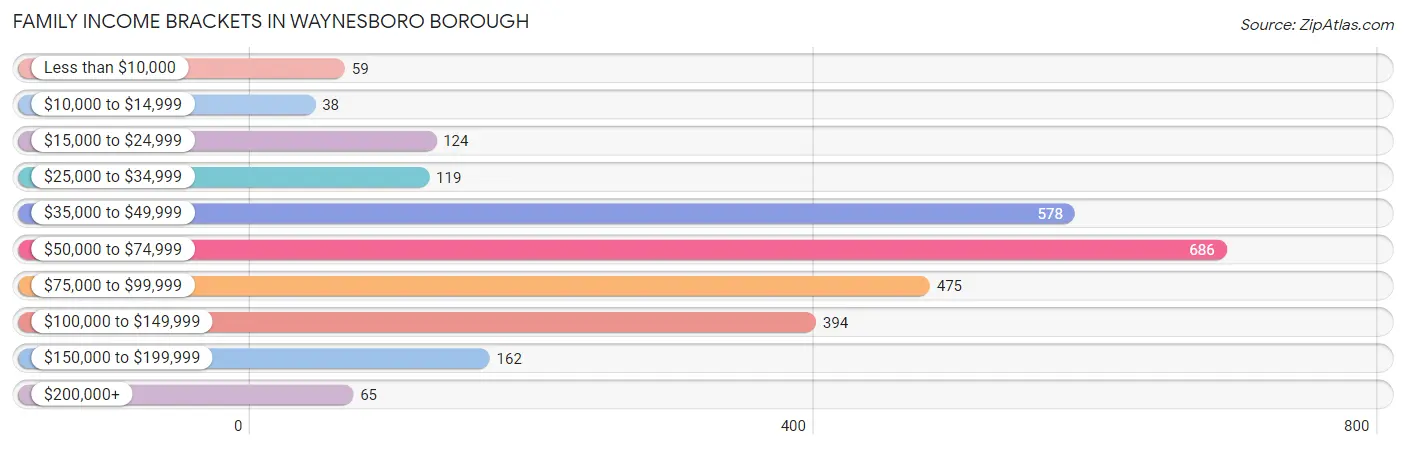
Family Income in Waynesboro borough
Family Income Brackets in Waynesboro borough
According to the Waynesboro borough family income data, there are 686 families falling into the $50,000 to $74,999 income range, which is the most common income bracket and makes up 25.4% of all families. Conversely, the $10,000 to $14,999 income bracket is the least frequent group with only 38 families (1.4%) belonging to this category.
| Income Bracket | # Families | % Families |
| Less than $10,000 | 59 | 2.2% |
| $10,000 to $14,999 | 38 | 1.4% |
| $15,000 to $24,999 | 124 | 4.6% |
| $25,000 to $34,999 | 119 | 4.4% |
| $35,000 to $49,999 | 578 | 21.4% |
| $50,000 to $74,999 | 686 | 25.4% |
| $75,000 to $99,999 | 475 | 17.6% |
| $100,000 to $149,999 | 394 | 14.6% |
| $150,000 to $199,999 | 162 | 6.0% |
| $200,000+ | 65 | 2.4% |
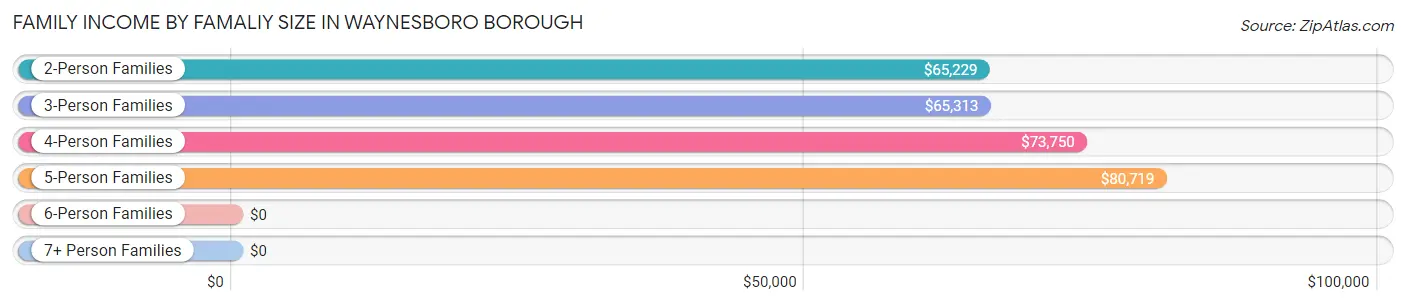
Family Income by Famaliy Size in Waynesboro borough
5-person families (243 | 9.0%) account for the highest median family income in Waynesboro borough with $80,719 per family, while 2-person families (1,440 | 53.3%) have the highest median income of $32,614 per family member.
| Income Bracket | # Families | Median Income |
| 2-Person Families | 1,440 (53.3%) | $65,229 |
| 3-Person Families | 368 (13.6%) | $65,313 |
| 4-Person Families | 455 (16.9%) | $73,750 |
| 5-Person Families | 243 (9.0%) | $80,719 |
| 6-Person Families | 96 (3.5%) | $0 |
| 7+ Person Families | 99 (3.7%) | $0 |
| Total | 2,701 (100.0%) | $65,657 |
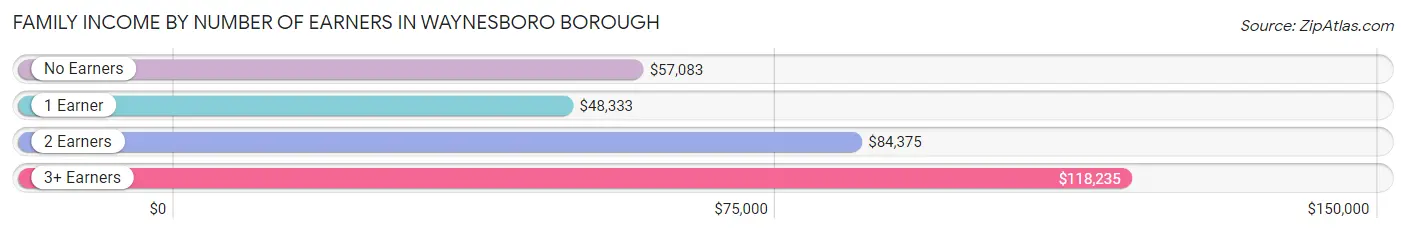
Family Income by Number of Earners in Waynesboro borough
The median family income in Waynesboro borough is $65,657, with families comprising 3+ earners (238) having the highest median family income of $118,235, while families with 1 earner (1,158) have the lowest median family income of $48,333, accounting for 8.8% and 42.9% of families, respectively.
| Number of Earners | # Families | Median Income |
| No Earners | 330 (12.2%) | $57,083 |
| 1 Earner | 1,158 (42.9%) | $48,333 |
| 2 Earners | 975 (36.1%) | $84,375 |
| 3+ Earners | 238 (8.8%) | $118,235 |
| Total | 2,701 (100.0%) | $65,657 |
Household Income in Waynesboro borough
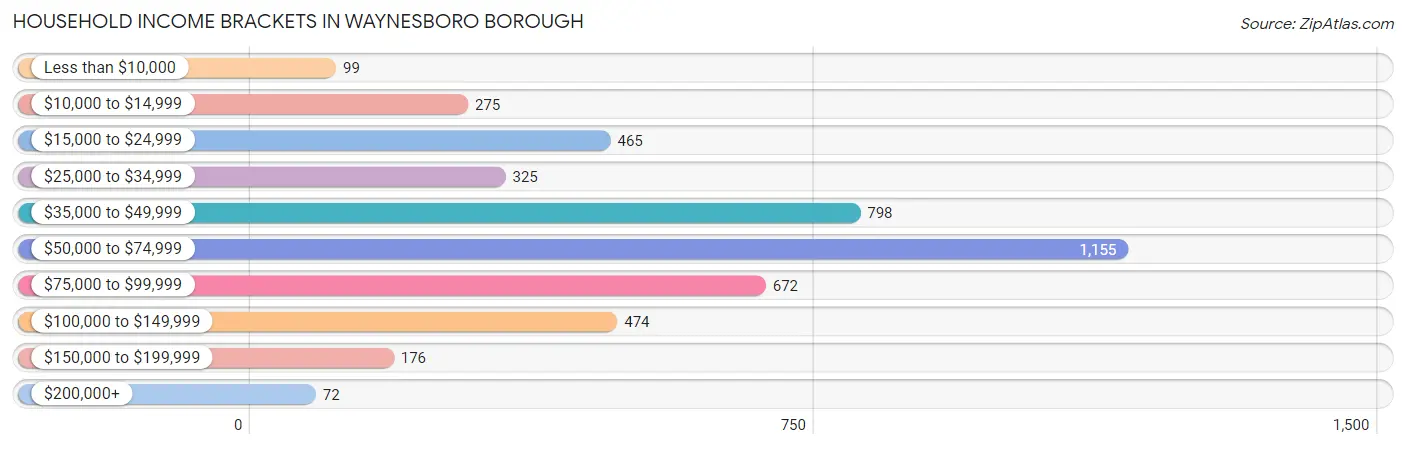
Household Income Brackets in Waynesboro borough
With 1,155 households falling in the category, the $50,000 to $74,999 income range is the most frequent in Waynesboro borough, accounting for 25.6% of all households. In contrast, only 72 households (1.6%) fall into the $200,000+ income bracket, making it the least populous group.
| Income Bracket | # Households | % Households |
| Less than $10,000 | 99 | 2.2% |
| $10,000 to $14,999 | 275 | 6.1% |
| $15,000 to $24,999 | 465 | 10.3% |
| $25,000 to $34,999 | 325 | 7.2% |
| $35,000 to $49,999 | 798 | 17.7% |
| $50,000 to $74,999 | 1,155 | 25.6% |
| $75,000 to $99,999 | 672 | 14.9% |
| $100,000 to $149,999 | 474 | 10.5% |
| $150,000 to $199,999 | 176 | 3.9% |
| $200,000+ | 72 | 1.6% |
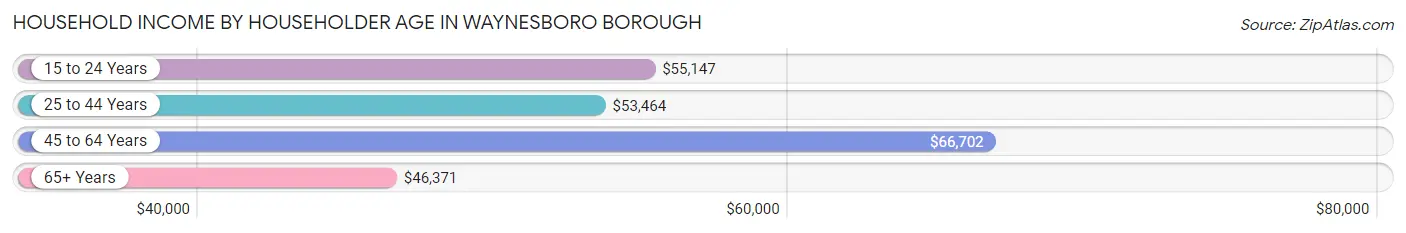
Household Income by Householder Age in Waynesboro borough
The median household income in Waynesboro borough is $56,413, with the highest median household income of $66,702 found in the 45 to 64 years age bracket for the primary householder. A total of 1,561 households (34.6%) fall into this category. Meanwhile, the 65+ years age bracket for the primary householder has the lowest median household income of $46,371, with 1,068 households (23.7%) in this group.
| Income Bracket | # Households | Median Income |
| 15 to 24 Years | 248 (5.5%) | $55,147 |
| 25 to 44 Years | 1,634 (36.2%) | $53,464 |
| 45 to 64 Years | 1,561 (34.6%) | $66,702 |
| 65+ Years | 1,068 (23.7%) | $46,371 |
| Total | 4,511 (100.0%) | $56,413 |
Poverty in Waynesboro borough
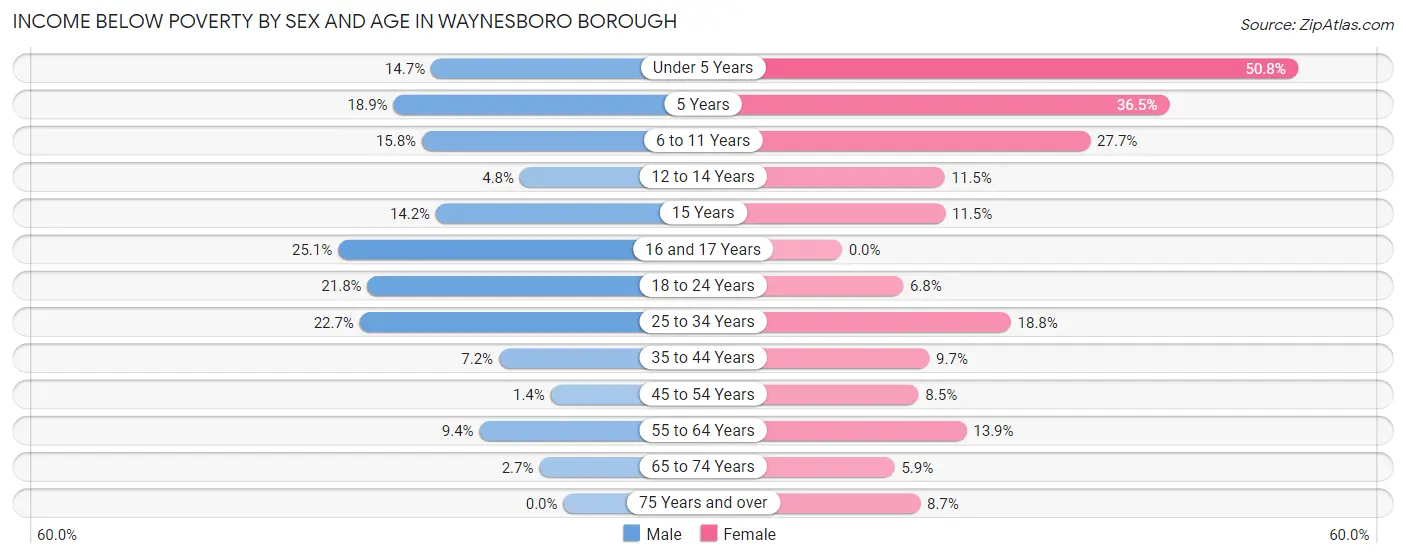
Income Below Poverty by Sex and Age in Waynesboro borough
With 11.3% poverty level for males and 14.5% for females among the residents of Waynesboro borough, 16 and 17 year old males and under 5 year old females are the most vulnerable to poverty, with 71 males (25.1%) and 134 females (50.8%) in their respective age groups living below the poverty level.
| Age Bracket | Male | Female |
| Under 5 Years | 28 (14.7%) | 134 (50.8%) |
| 5 Years | 7 (18.9%) | 39 (36.4%) |
| 6 to 11 Years | 86 (15.8%) | 174 (27.7%) |
| 12 to 14 Years | 17 (4.8%) | 30 (11.5%) |
| 15 Years | 21 (14.2%) | 13 (11.5%) |
| 16 and 17 Years | 71 (25.1%) | 0 (0.0%) |
| 18 to 24 Years | 79 (21.8%) | 23 (6.8%) |
| 25 to 34 Years | 144 (22.7%) | 113 (18.8%) |
| 35 to 44 Years | 63 (7.2%) | 96 (9.7%) |
| 45 to 54 Years | 9 (1.4%) | 54 (8.5%) |
| 55 to 64 Years | 46 (9.3%) | 100 (13.9%) |
| 65 to 74 Years | 9 (2.7%) | 35 (5.9%) |
| 75 Years and over | 0 (0.0%) | 37 (8.7%) |
| Total | 580 (11.3%) | 848 (14.5%) |
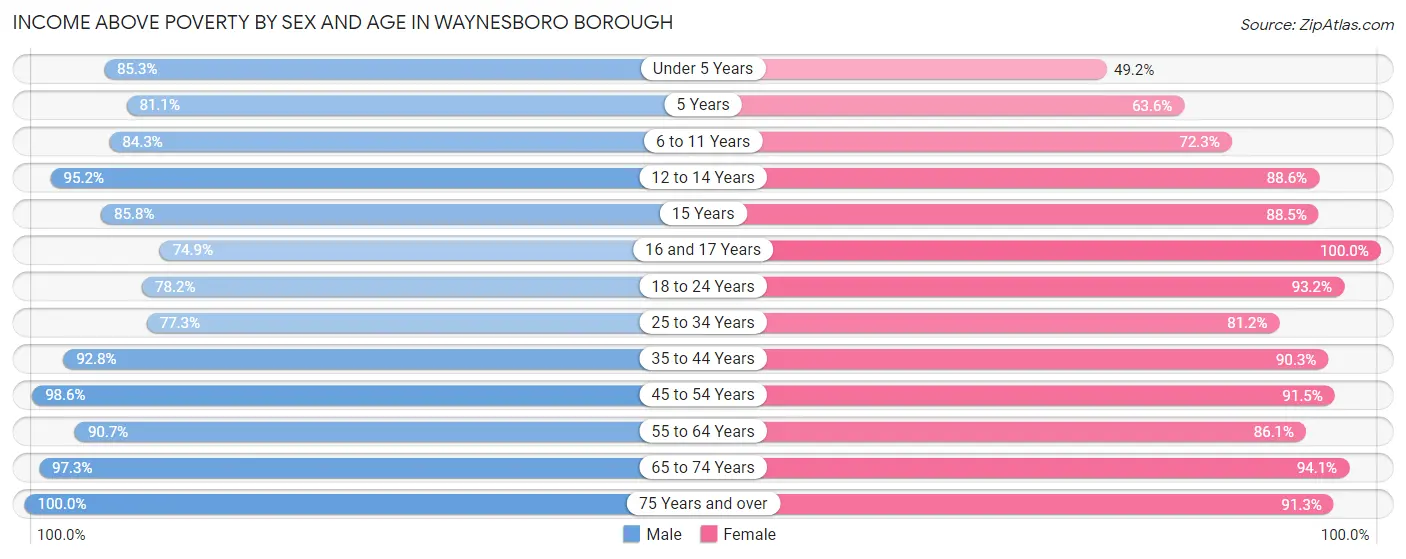
Income Above Poverty by Sex and Age in Waynesboro borough
According to the poverty statistics in Waynesboro borough, males aged 75 years and over and females aged 16 and 17 years are the age groups that are most secure financially, with 100.0% of males and 100.0% of females in these age groups living above the poverty line.
| Age Bracket | Male | Female |
| Under 5 Years | 162 (85.3%) | 130 (49.2%) |
| 5 Years | 30 (81.1%) | 68 (63.5%) |
| 6 to 11 Years | 460 (84.3%) | 455 (72.3%) |
| 12 to 14 Years | 334 (95.2%) | 232 (88.5%) |
| 15 Years | 127 (85.8%) | 100 (88.5%) |
| 16 and 17 Years | 212 (74.9%) | 186 (100.0%) |
| 18 to 24 Years | 283 (78.2%) | 314 (93.2%) |
| 25 to 34 Years | 491 (77.3%) | 488 (81.2%) |
| 35 to 44 Years | 816 (92.8%) | 891 (90.3%) |
| 45 to 54 Years | 623 (98.6%) | 579 (91.5%) |
| 55 to 64 Years | 446 (90.6%) | 621 (86.1%) |
| 65 to 74 Years | 327 (97.3%) | 561 (94.1%) |
| 75 Years and over | 240 (100.0%) | 388 (91.3%) |
| Total | 4,551 (88.7%) | 5,013 (85.5%) |
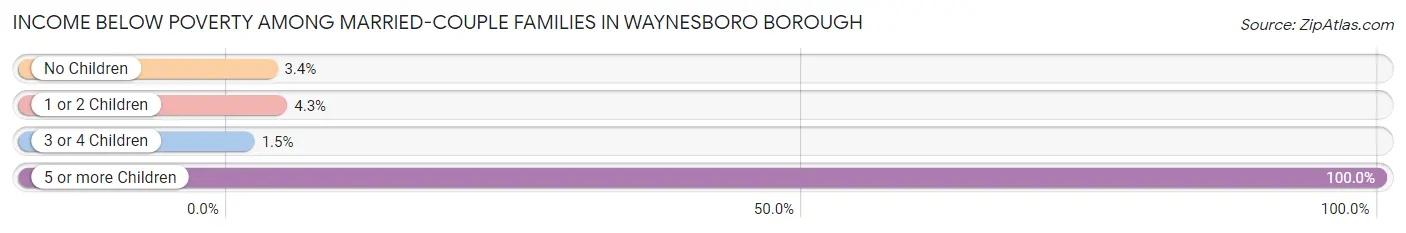
Income Below Poverty Among Married-Couple Families in Waynesboro borough
The poverty statistics for married-couple families in Waynesboro borough show that 5.3% or 92 of the total 1,743 families live below the poverty line. Families with 5 or more children have the highest poverty rate of 100.0%, comprising of 33 families. On the other hand, families with 3 or 4 children have the lowest poverty rate of 1.5%, which includes 3 families.
| Children | Above Poverty | Below Poverty |
| No Children | 956 (96.6%) | 34 (3.4%) |
| 1 or 2 Children | 491 (95.7%) | 22 (4.3%) |
| 3 or 4 Children | 204 (98.6%) | 3 (1.5%) |
| 5 or more Children | 0 (0.0%) | 33 (100.0%) |
| Total | 1,651 (94.7%) | 92 (5.3%) |
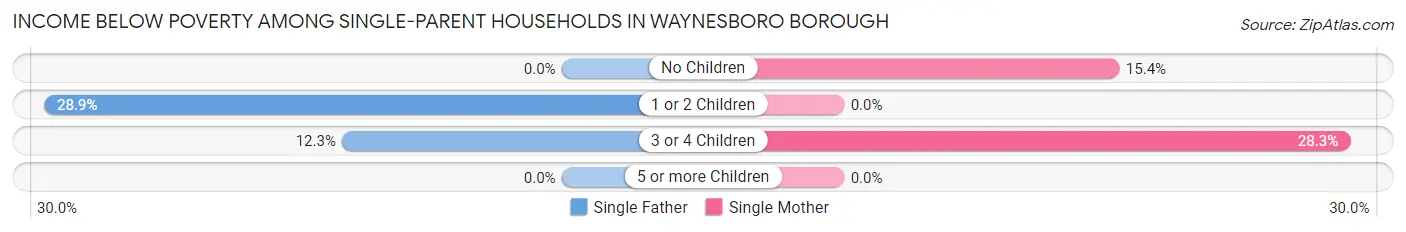
Income Below Poverty Among Single-Parent Households in Waynesboro borough
According to the poverty data in Waynesboro borough, 20.9% or 44 single-father households and 9.8% or 73 single-mother households are living below the poverty line. Among single-father households, those with 1 or 2 children have the highest poverty rate, with 37 households (28.9%) experiencing poverty. Likewise, among single-mother households, those with 3 or 4 children have the highest poverty rate, with 43 households (28.3%) falling below the poverty line.
| Children | Single Father | Single Mother |
| No Children | 0 (0.0%) | 30 (15.4%) |
| 1 or 2 Children | 37 (28.9%) | 0 (0.0%) |
| 3 or 4 Children | 7 (12.3%) | 43 (28.3%) |
| 5 or more Children | 0 (0.0%) | 0 (0.0%) |
| Total | 44 (20.9%) | 73 (9.8%) |
Income Below Poverty Among Married-Couple vs Single-Parent Households in Waynesboro borough
The poverty data for Waynesboro borough shows that 92 of the married-couple family households (5.3%) and 117 of the single-parent households (12.2%) are living below the poverty level. Within the married-couple family households, those with 5 or more children have the highest poverty rate, with 33 households (100.0%) falling below the poverty line. Among the single-parent households, those with 3 or 4 children have the highest poverty rate, with 50 household (23.9%) living below poverty.
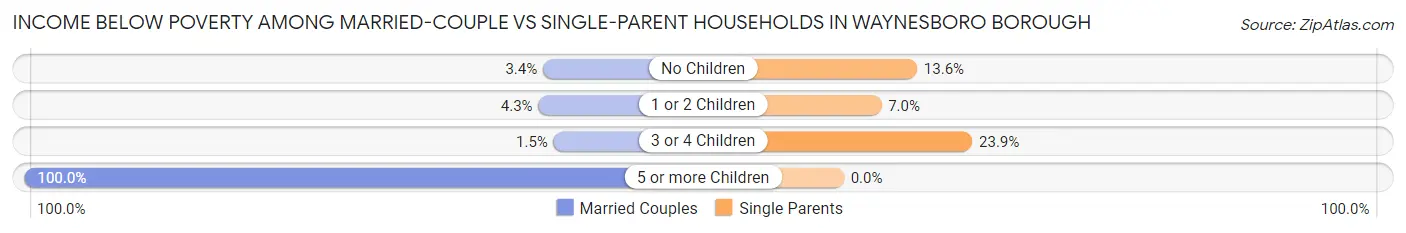
| Children | Married-Couple Families | Single-Parent Households |
| No Children | 34 (3.4%) | 30 (13.6%) |
| 1 or 2 Children | 22 (4.3%) | 37 (7.0%) |
| 3 or 4 Children | 3 (1.5%) | 50 (23.9%) |
| 5 or more Children | 33 (100.0%) | 0 (0.0%) |
| Total | 92 (5.3%) | 117 (12.2%) |
Race in Waynesboro borough
The most populous races in Waynesboro borough are White / Caucasian (9,566 | 86.9%), Two or more Races (756 | 6.9%), and Hispanic or Latino (741 | 6.7%).
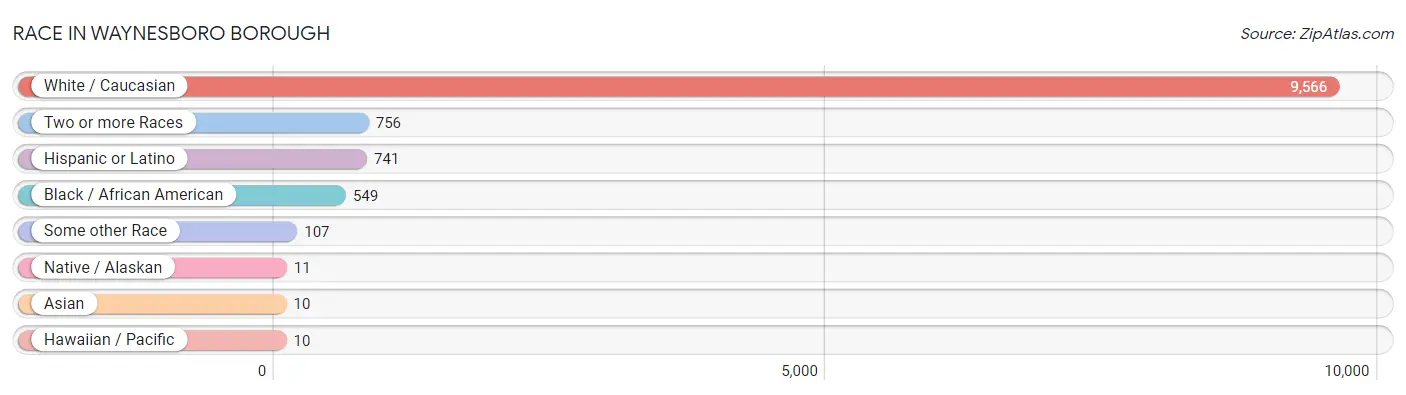
| Race | # Population | % Population |
| Asian | 10 | 0.1% |
| Black / African American | 549 | 5.0% |
| Hawaiian / Pacific | 10 | 0.1% |
| Hispanic or Latino | 741 | 6.7% |
| Native / Alaskan | 11 | 0.1% |
| White / Caucasian | 9,566 | 86.9% |
| Two or more Races | 756 | 6.9% |
| Some other Race | 107 | 1.0% |
| Total | 11,009 | 100.0% |
Ancestry in Waynesboro borough
The most populous ancestries reported in Waynesboro borough are German (3,269 | 29.7%), American (1,533 | 13.9%), Irish (1,506 | 13.7%), English (921 | 8.4%), and Italian (596 | 5.4%), together accounting for 71.1% of all Waynesboro borough residents.
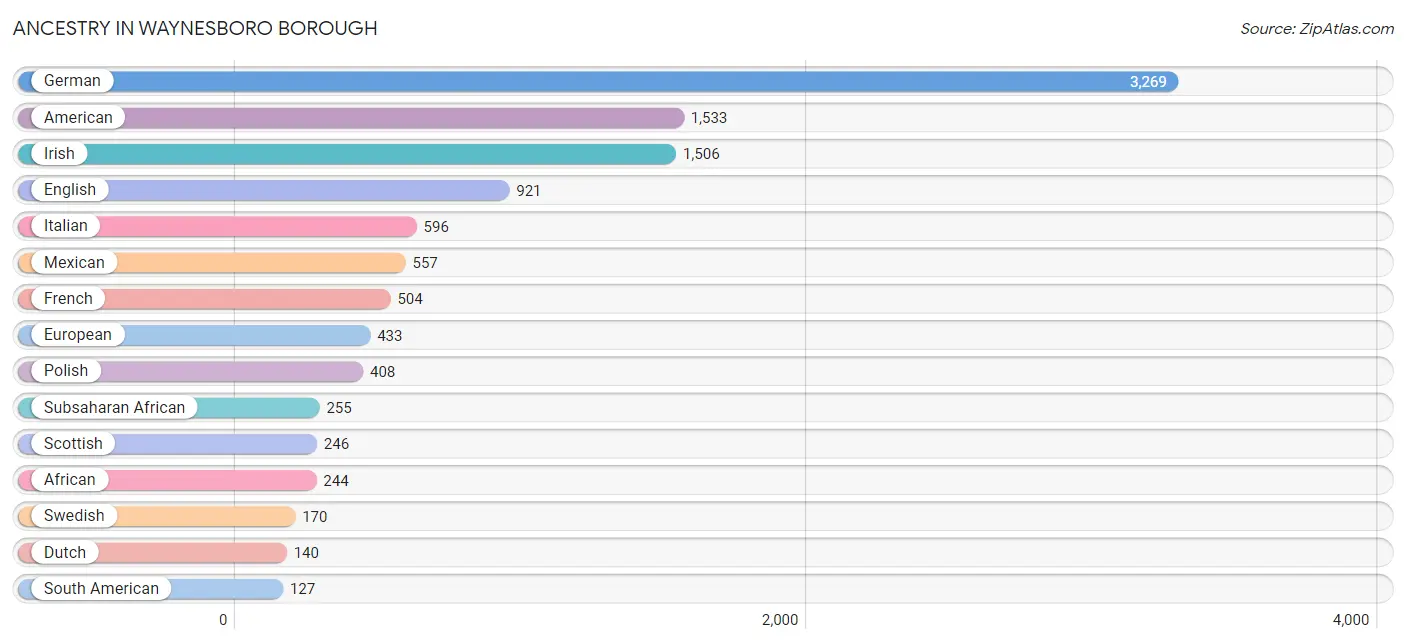
| Ancestry | # Population | % Population |
| African | 244 | 2.2% |
| American | 1,533 | 13.9% |
| Apache | 15 | 0.1% |
| Arab | 82 | 0.7% |
| Austrian | 8 | 0.1% |
| Belgian | 7 | 0.1% |
| Bhutanese | 18 | 0.2% |
| Blackfeet | 19 | 0.2% |
| British | 16 | 0.2% |
| Burmese | 10 | 0.1% |
| Canadian | 27 | 0.3% |
| Cape Verdean | 11 | 0.1% |
| Central American | 37 | 0.3% |
| Cherokee | 11 | 0.1% |
| Croatian | 4 | 0.0% |
| Cuban | 11 | 0.1% |
| Czech | 22 | 0.2% |
| Dutch | 140 | 1.3% |
| Eastern European | 15 | 0.1% |
| English | 921 | 8.4% |
| European | 433 | 3.9% |
| Finnish | 16 | 0.2% |
| French | 504 | 4.6% |
| French Canadian | 6 | 0.1% |
| German | 3,269 | 29.7% |
| Guatemalan | 10 | 0.1% |
| Irish | 1,506 | 13.7% |
| Italian | 596 | 5.4% |
| Mexican | 557 | 5.1% |
| Native Hawaiian | 10 | 0.1% |
| Norwegian | 61 | 0.5% |
| Polish | 408 | 3.7% |
| Portuguese | 30 | 0.3% |
| Puerto Rican | 9 | 0.1% |
| Romanian | 39 | 0.4% |
| Russian | 32 | 0.3% |
| Salvadoran | 27 | 0.3% |
| Scandinavian | 8 | 0.1% |
| Scotch-Irish | 94 | 0.9% |
| Scottish | 246 | 2.2% |
| Serbian | 9 | 0.1% |
| Sioux | 15 | 0.1% |
| Slovak | 12 | 0.1% |
| South American | 127 | 1.1% |
| Subsaharan African | 255 | 2.3% |
| Swedish | 170 | 1.5% |
| Swiss | 49 | 0.4% |
| Syrian | 82 | 0.7% |
| Ugandan | 10 | 0.1% |
| Uruguayan | 127 | 1.1% |
| Welsh | 93 | 0.8% | View All 51 Rows |
Immigrants in Waynesboro borough
The most numerous immigrant groups reported in Waynesboro borough came from Latin America (204 | 1.8%), South America (106 | 1.0%), Uruguay (106 | 1.0%), Central America (98 | 0.9%), and Mexico (98 | 0.9%), together accounting for 5.5% of all Waynesboro borough residents.
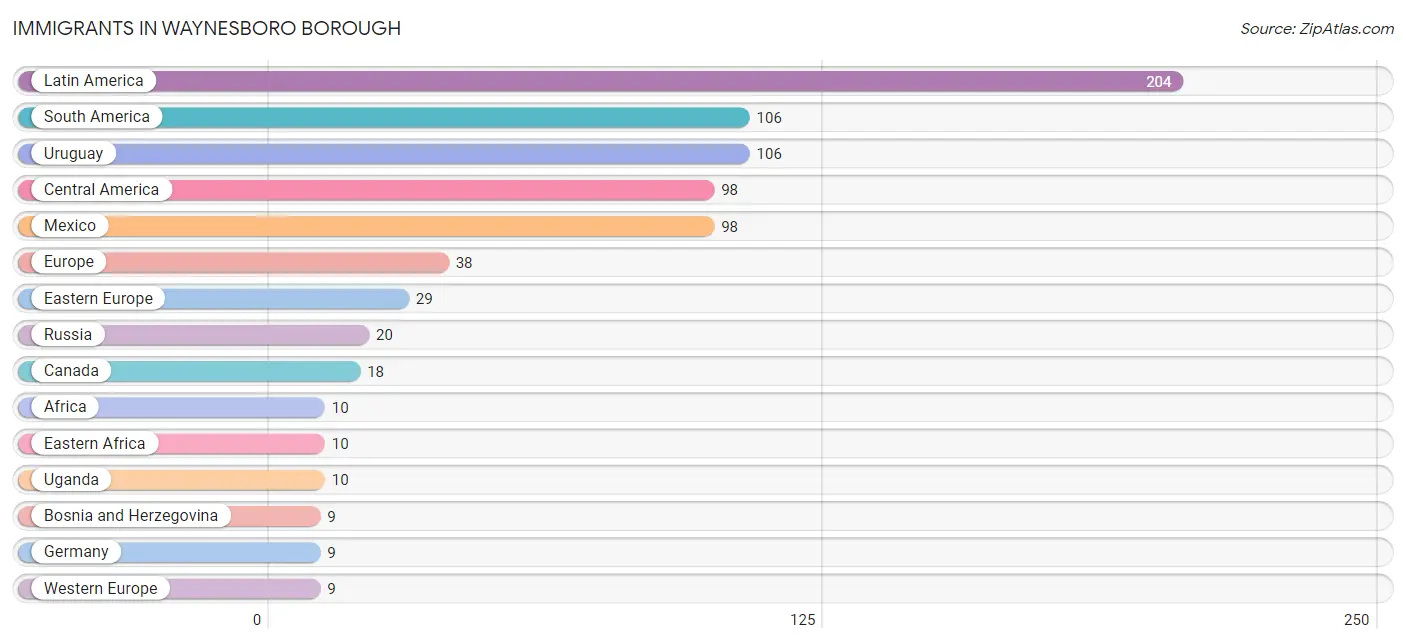
| Immigration Origin | # Population | % Population |
| Africa | 10 | 0.1% |
| Bosnia and Herzegovina | 9 | 0.1% |
| Canada | 18 | 0.2% |
| Central America | 98 | 0.9% |
| Eastern Africa | 10 | 0.1% |
| Eastern Europe | 29 | 0.3% |
| Europe | 38 | 0.4% |
| Germany | 9 | 0.1% |
| Latin America | 204 | 1.8% |
| Mexico | 98 | 0.9% |
| Russia | 20 | 0.2% |
| South America | 106 | 1.0% |
| Uganda | 10 | 0.1% |
| Uruguay | 106 | 1.0% |
| Western Europe | 9 | 0.1% | View All 15 Rows |
Sex and Age in Waynesboro borough
Sex and Age in Waynesboro borough
The most populous age groups in Waynesboro borough are 15 to 19 Years (601 | 11.7%) for men and 5 to 9 Years (615 | 10.5%) for women.
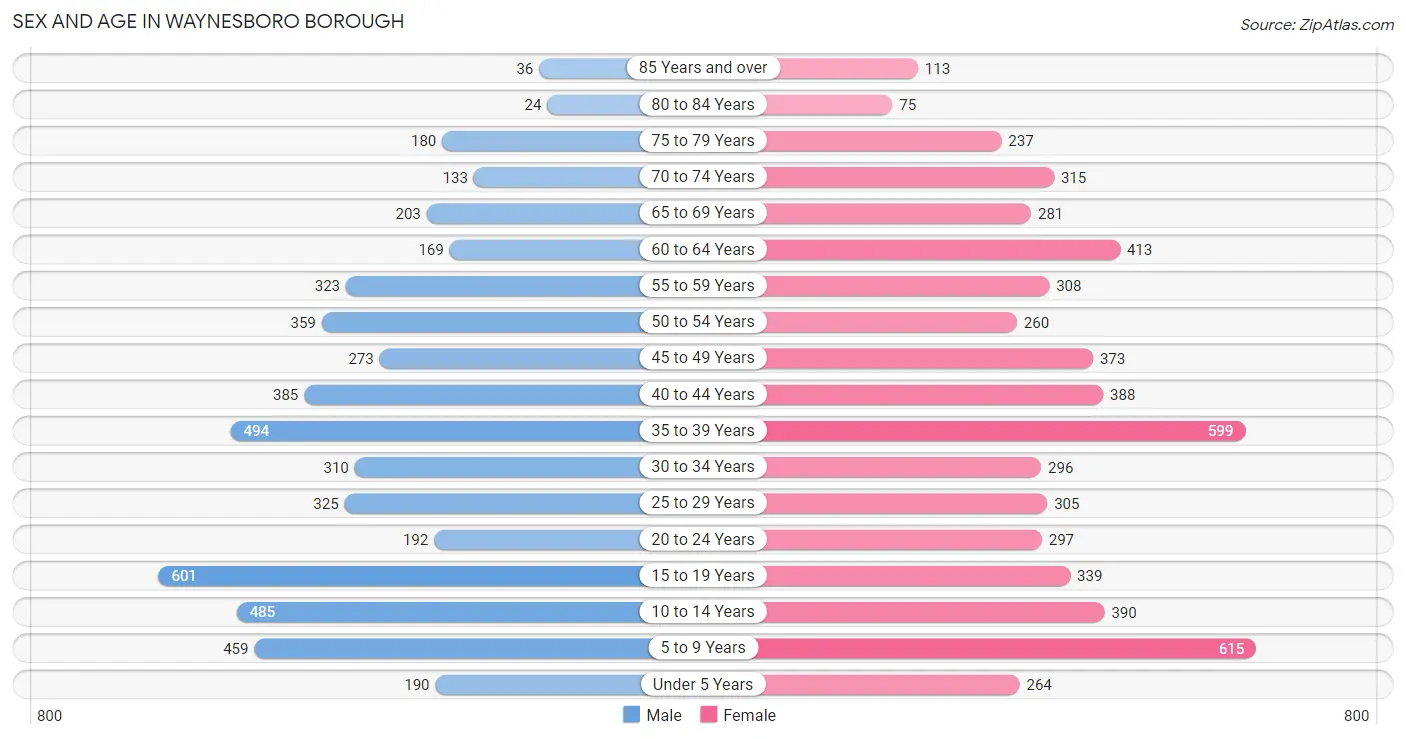
| Age Bracket | Male | Female |
| Under 5 Years | 190 (3.7%) | 264 (4.5%) |
| 5 to 9 Years | 459 (8.9%) | 615 (10.5%) |
| 10 to 14 Years | 485 (9.4%) | 390 (6.7%) |
| 15 to 19 Years | 601 (11.7%) | 339 (5.8%) |
| 20 to 24 Years | 192 (3.7%) | 297 (5.1%) |
| 25 to 29 Years | 325 (6.3%) | 305 (5.2%) |
| 30 to 34 Years | 310 (6.0%) | 296 (5.0%) |
| 35 to 39 Years | 494 (9.6%) | 599 (10.2%) |
| 40 to 44 Years | 385 (7.5%) | 388 (6.6%) |
| 45 to 49 Years | 273 (5.3%) | 373 (6.4%) |
| 50 to 54 Years | 359 (7.0%) | 260 (4.4%) |
| 55 to 59 Years | 323 (6.3%) | 308 (5.2%) |
| 60 to 64 Years | 169 (3.3%) | 413 (7.0%) |
| 65 to 69 Years | 203 (4.0%) | 281 (4.8%) |
| 70 to 74 Years | 133 (2.6%) | 315 (5.4%) |
| 75 to 79 Years | 180 (3.5%) | 237 (4.0%) |
| 80 to 84 Years | 24 (0.5%) | 75 (1.3%) |
| 85 Years and over | 36 (0.7%) | 113 (1.9%) |
| Total | 5,141 (100.0%) | 5,868 (100.0%) |
Families and Households in Waynesboro borough
Median Family Size in Waynesboro borough
The median family size in Waynesboro borough is 3.10 persons per family, with married-couple families (1,743 | 64.5%) accounting for the largest median family size of 3.29 persons per family. On the other hand, single male/father families (210 | 7.8%) represent the smallest median family size with 2.55 persons per family.
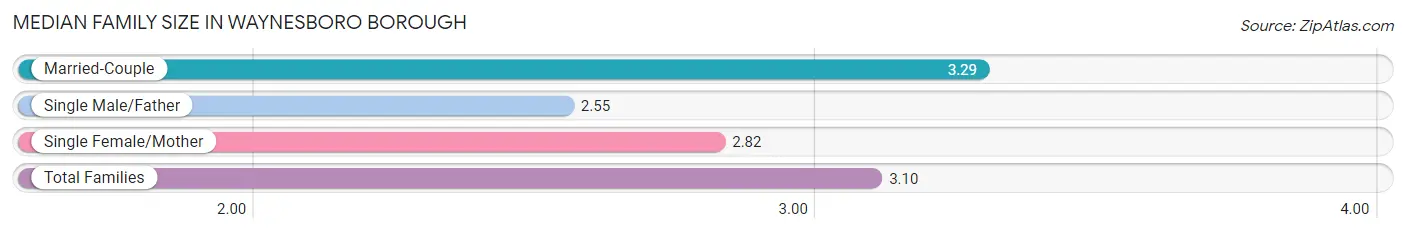
| Family Type | # Families | Family Size |
| Married-Couple | 1,743 (64.5%) | 3.29 |
| Single Male/Father | 210 (7.8%) | 2.55 |
| Single Female/Mother | 748 (27.7%) | 2.82 |
| Total Families | 2,701 (100.0%) | 3.10 |
Median Household Size in Waynesboro borough
The median household size in Waynesboro borough is 2.43 persons per household, with single male/father households (210 | 4.7%) accounting for the largest median household size of 3.44 persons per household. non-family households (1,810 | 40.1%) represent the smallest median household size with 1.22 persons per household.
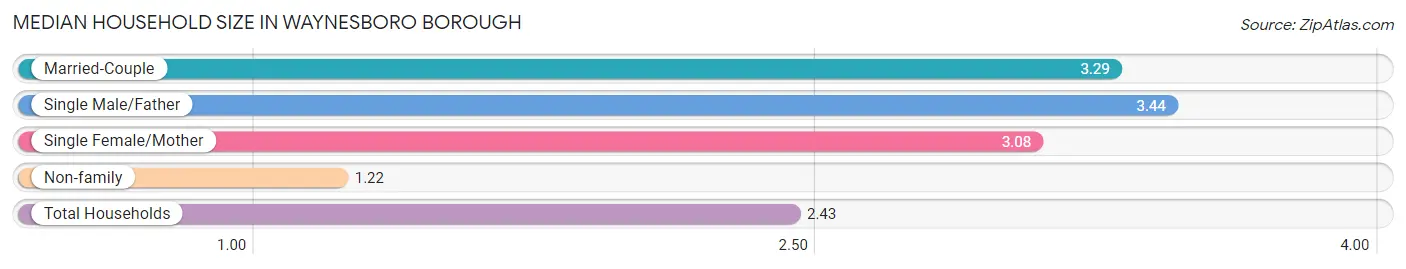
| Household Type | # Households | Household Size |
| Married-Couple | 1,743 (38.6%) | 3.29 |
| Single Male/Father | 210 (4.7%) | 3.44 |
| Single Female/Mother | 748 (16.6%) | 3.08 |
| Non-family | 1,810 (40.1%) | 1.22 |
| Total Households | 4,511 (100.0%) | 2.43 |
Household Size by Marriage Status in Waynesboro borough
Out of a total of 4,511 households in Waynesboro borough, 2,701 (59.9%) are family households, while 1,810 (40.1%) are nonfamily households. The most numerous type of family households are 2-person households, comprising 1,326, and the most common type of nonfamily households are 1-person households, comprising 1,473.
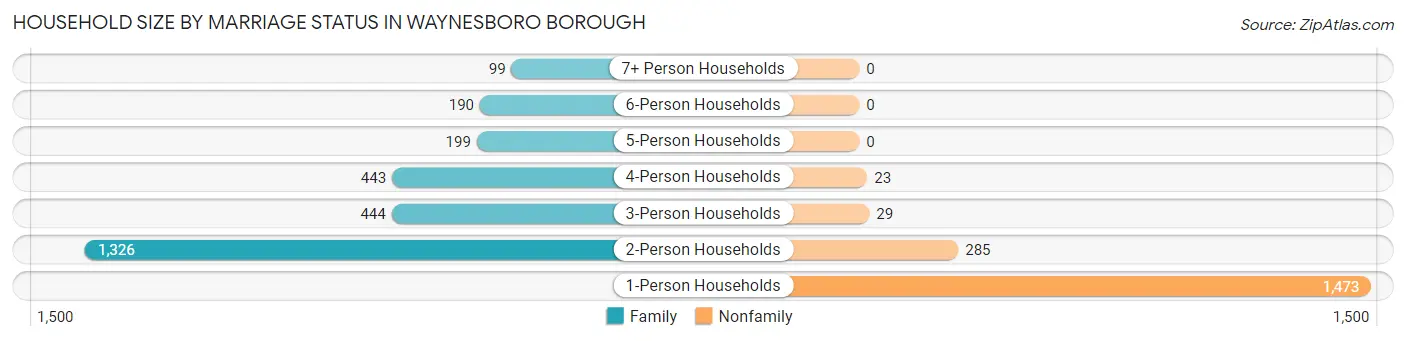
| Household Size | Family Households | Nonfamily Households |
| 1-Person Households | - | 1,473 (32.7%) |
| 2-Person Households | 1,326 (29.4%) | 285 (6.3%) |
| 3-Person Households | 444 (9.8%) | 29 (0.6%) |
| 4-Person Households | 443 (9.8%) | 23 (0.5%) |
| 5-Person Households | 199 (4.4%) | 0 (0.0%) |
| 6-Person Households | 190 (4.2%) | 0 (0.0%) |
| 7+ Person Households | 99 (2.2%) | 0 (0.0%) |
| Total | 2,701 (59.9%) | 1,810 (40.1%) |
Female Fertility in Waynesboro borough
Fertility by Age in Waynesboro borough
Average fertility rate in Waynesboro borough is 10.0 births per 1,000 women. Women in the age bracket of 20 to 34 years have the highest fertility rate with 30.0 births per 1,000 women. Women in the age bracket of 20 to 34 years acount for 100.0% of all women with births.
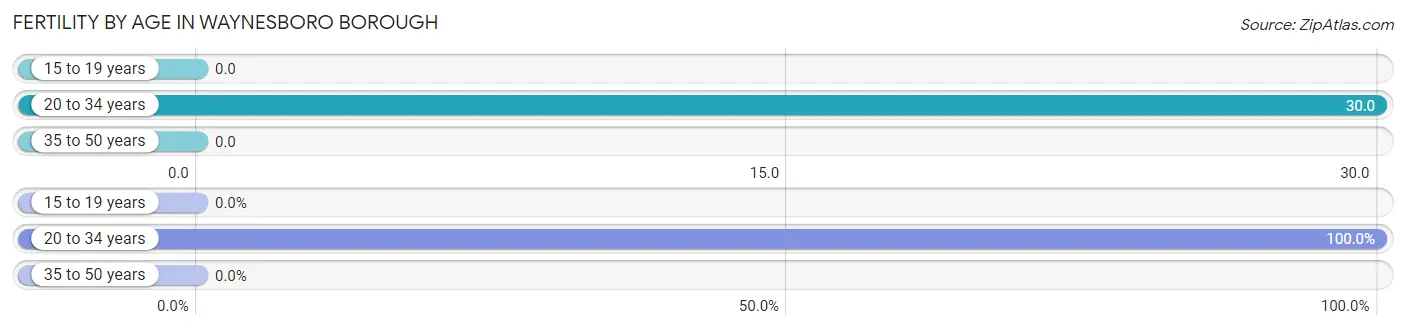
| Age Bracket | Women with Births | Births / 1,000 Women |
| 15 to 19 years | 0 (0.0%) | 0.0 |
| 20 to 34 years | 27 (100.0%) | 30.0 |
| 35 to 50 years | 0 (0.0%) | 0.0 |
| Total | 27 (100.0%) | 10.0 |
Fertility by Age by Marriage Status in Waynesboro borough
33.3% of women with births (27) in Waynesboro borough are married. The highest percentage of unmarried women with births falls into 20 to 34 years age bracket with 66.7% of them unmarried at the time of birth, while the lowest percentage of unmarried women with births belong to 20 to 34 years age bracket with 66.7% of them unmarried.
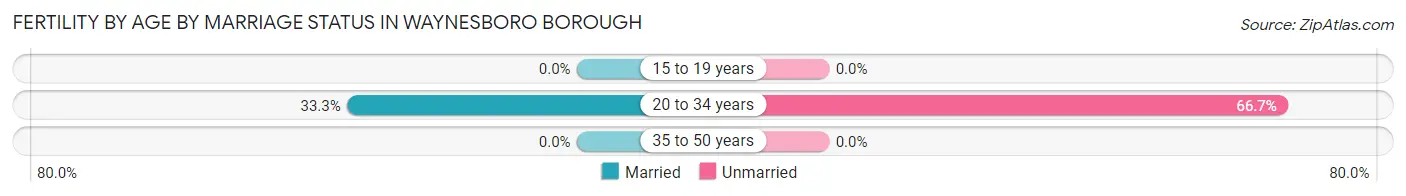
| Age Bracket | Married | Unmarried |
| 15 to 19 years | 0 (0.0%) | 0 (0.0%) |
| 20 to 34 years | 9 (33.3%) | 18 (66.7%) |
| 35 to 50 years | 0 (0.0%) | 0 (0.0%) |
| Total | 9 (33.3%) | 18 (66.7%) |
Fertility by Education in Waynesboro borough
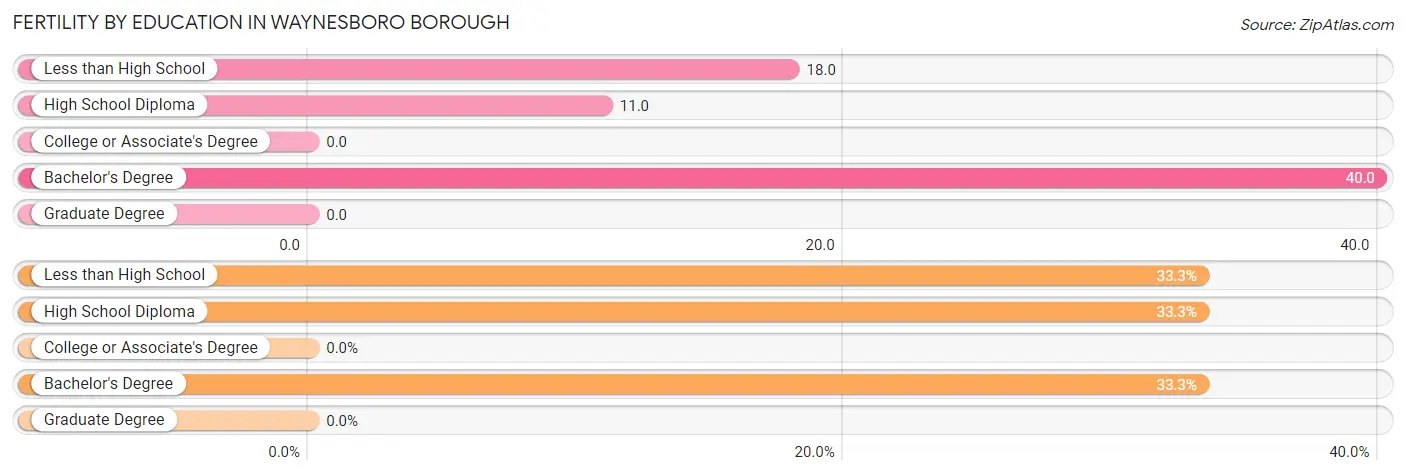
| Educational Attainment | Women with Births | Births / 1,000 Women |
| Less than High School | 9 (33.3%) | 18.0 |
| High School Diploma | 9 (33.3%) | 11.0 |
| College or Associate's Degree | 0 (0.0%) | 0.0 |
| Bachelor's Degree | 9 (33.3%) | 40.0 |
| Graduate Degree | 0 (0.0%) | 0.0 |
| Total | 27 (100.0%) | 10.0 |
Fertility by Education by Marriage Status in Waynesboro borough
66.7% of women with births in Waynesboro borough are unmarried. Women with the educational attainment of bachelor's degree are most likely to be married with 100.0% of them married at childbirth, while women with the educational attainment of less than high school are least likely to be married with 100.0% of them unmarried at childbirth.
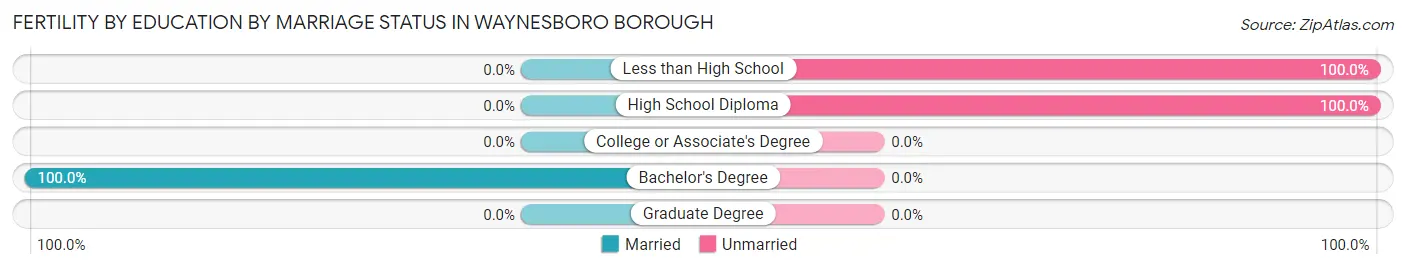
| Educational Attainment | Married | Unmarried |
| Less than High School | 0 (0.0%) | 9 (100.0%) |
| High School Diploma | 0 (0.0%) | 9 (100.0%) |
| College or Associate's Degree | 0 (0.0%) | 0 (0.0%) |
| Bachelor's Degree | 9 (100.0%) | 0 (0.0%) |
| Graduate Degree | 0 (0.0%) | 0 (0.0%) |
| Total | 9 (33.3%) | 18 (66.7%) |
Employment Characteristics in Waynesboro borough
Employment by Class of Employer in Waynesboro borough
Among the 5,142 employed individuals in Waynesboro borough, private company employees (3,944 | 76.7%), local government employees (396 | 7.7%), and not-for-profit organizations (314 | 6.1%) make up the most common classes of employment.
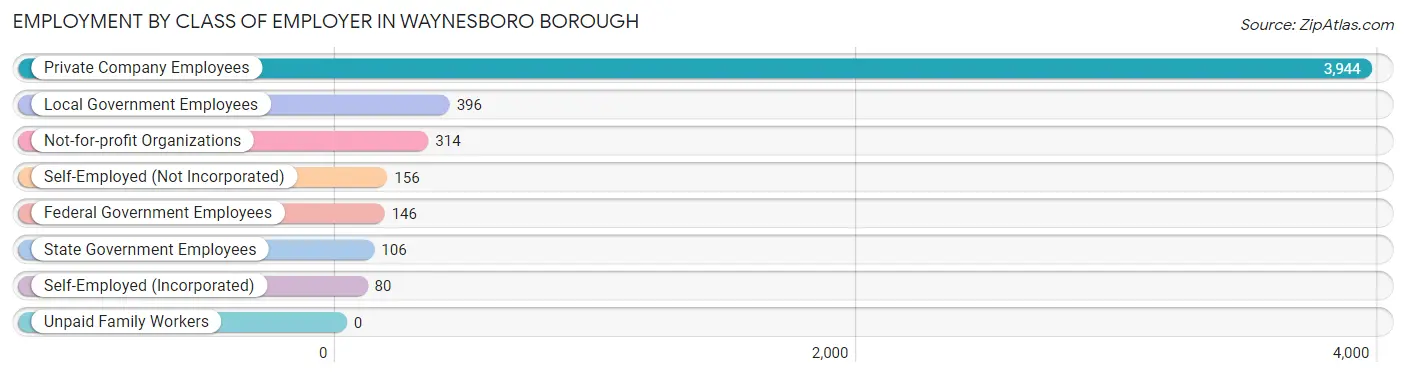
| Employer Class | # Employees | % Employees |
| Private Company Employees | 3,944 | 76.7% |
| Self-Employed (Incorporated) | 80 | 1.6% |
| Self-Employed (Not Incorporated) | 156 | 3.0% |
| Not-for-profit Organizations | 314 | 6.1% |
| Local Government Employees | 396 | 7.7% |
| State Government Employees | 106 | 2.1% |
| Federal Government Employees | 146 | 2.8% |
| Unpaid Family Workers | 0 | 0.0% |
| Total | 5,142 | 100.0% |
Employment Status by Age in Waynesboro borough
According to the labor force statistics for Waynesboro borough, out of the total population over 16 years of age (8,345), 65.3% or 5,449 individuals are in the labor force, with 3.4% or 185 of them unemployed. The age group with the highest labor force participation rate is 25 to 29 years, with 91.1% or 574 individuals in the labor force. Within the labor force, the 20 to 24 years age range has the highest percentage of unemployed individuals, with 8.7% or 32 of them being unemployed.
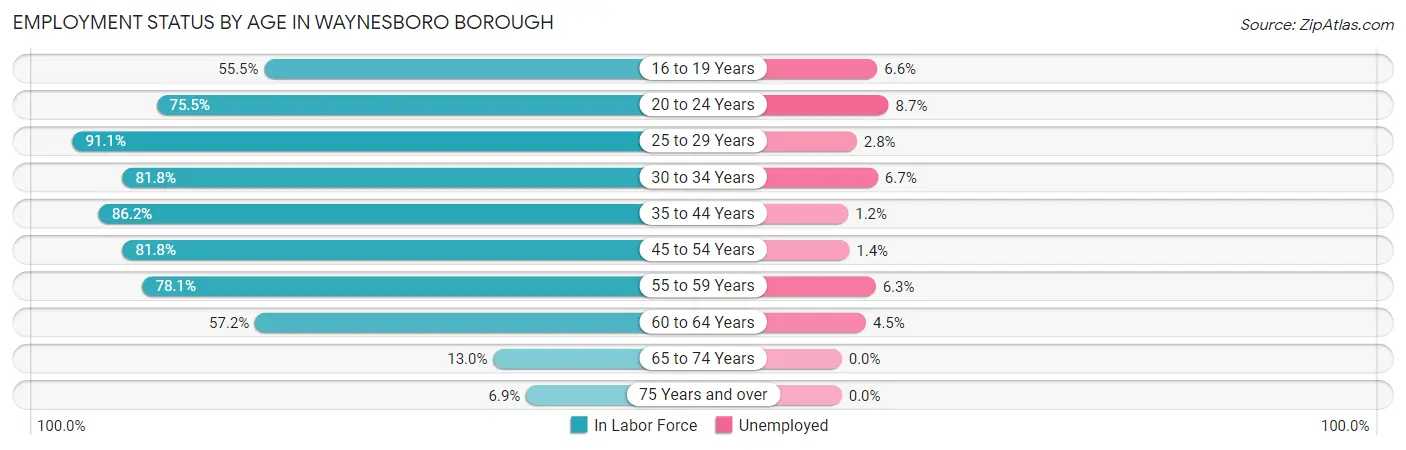
| Age Bracket | In Labor Force | Unemployed |
| 16 to 19 Years | 377 (55.5%) | 25 (6.6%) |
| 20 to 24 Years | 369 (75.5%) | 32 (8.7%) |
| 25 to 29 Years | 574 (91.1%) | 16 (2.8%) |
| 30 to 34 Years | 496 (81.8%) | 33 (6.7%) |
| 35 to 44 Years | 1,608 (86.2%) | 19 (1.2%) |
| 45 to 54 Years | 1,035 (81.8%) | 14 (1.4%) |
| 55 to 59 Years | 493 (78.1%) | 31 (6.3%) |
| 60 to 64 Years | 333 (57.2%) | 15 (4.5%) |
| 65 to 74 Years | 121 (13.0%) | 0 (0.0%) |
| 75 Years and over | 46 (6.9%) | 0 (0.0%) |
| Total | 5,449 (65.3%) | 185 (3.4%) |
Employment Status by Educational Attainment in Waynesboro borough
According to labor force statistics for Waynesboro borough, 81.4% of individuals (4,542) out of the total population between 25 and 64 years of age (5,580) are in the labor force, with 2.8% or 127 of them being unemployed. The group with the highest labor force participation rate are those with the educational attainment of college / associate degree, with 89.4% or 1,867 individuals in the labor force. Within the labor force, individuals with college / associate degree education have the highest percentage of unemployment, with 4.2% or 78 of them being unemployed.
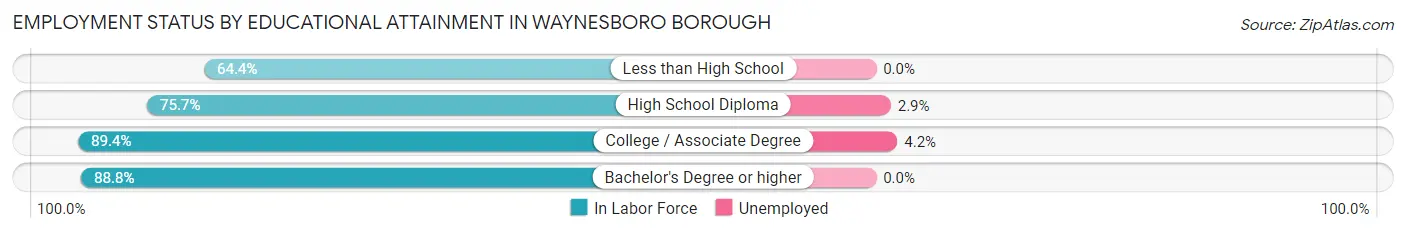
| Educational Attainment | In Labor Force | Unemployed |
| Less than High School | 340 (64.4%) | 0 (0.0%) |
| High School Diploma | 1,718 (75.7%) | 66 (2.9%) |
| College / Associate Degree | 1,867 (89.4%) | 88 (4.2%) |
| Bachelor's Degree or higher | 616 (88.8%) | 0 (0.0%) |
| Total | 4,542 (81.4%) | 156 (2.8%) |
Employment Occupations by Sex in Waynesboro borough
Management, Business, Science and Arts Occupations
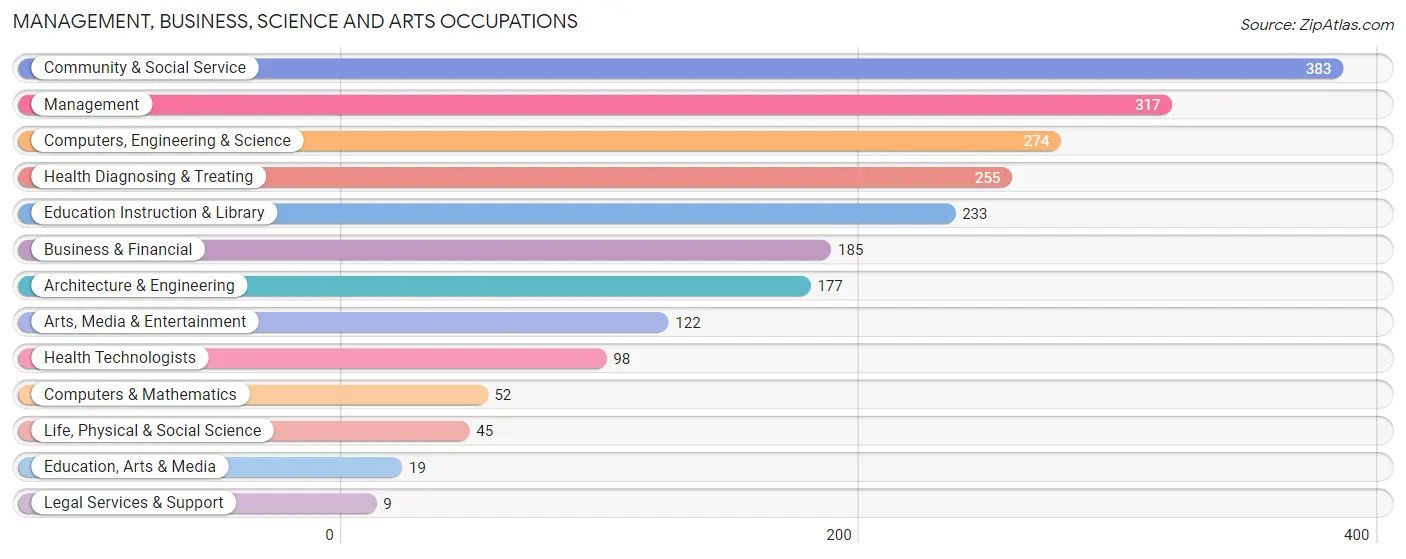
The most common Management, Business, Science and Arts occupations in Waynesboro borough are Community & Social Service (383 | 7.3%), Management (317 | 6.0%), Computers, Engineering & Science (274 | 5.2%), Health Diagnosing & Treating (255 | 4.8%), and Education Instruction & Library (233 | 4.4%).
Management, Business, Science and Arts Occupations by Sex
Within the Management, Business, Science and Arts occupations in Waynesboro borough, the most male-oriented occupations are Legal Services & Support (100.0%), Computers & Mathematics (71.2%), and Arts, Media & Entertainment (70.5%), while the most female-oriented occupations are Health Technologists (100.0%), Health Diagnosing & Treating (96.1%), and Education Instruction & Library (73.4%).
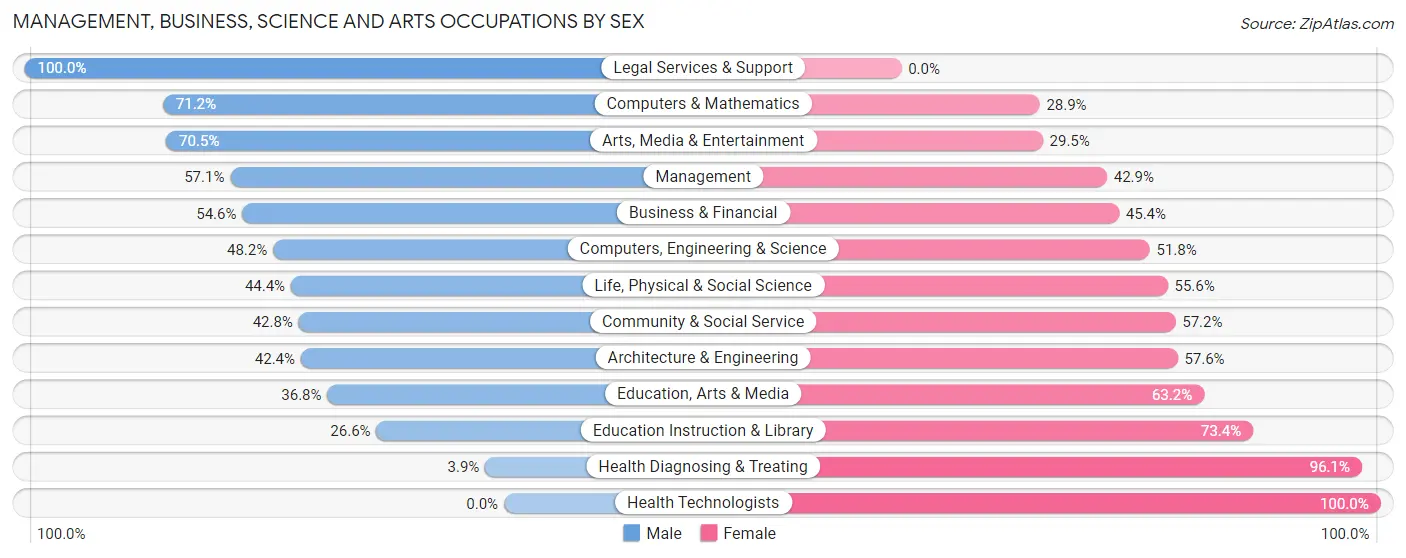
| Occupation | Male | Female |
| Management | 181 (57.1%) | 136 (42.9%) |
| Business & Financial | 101 (54.6%) | 84 (45.4%) |
| Computers, Engineering & Science | 132 (48.2%) | 142 (51.8%) |
| Computers & Mathematics | 37 (71.2%) | 15 (28.8%) |
| Architecture & Engineering | 75 (42.4%) | 102 (57.6%) |
| Life, Physical & Social Science | 20 (44.4%) | 25 (55.6%) |
| Community & Social Service | 164 (42.8%) | 219 (57.2%) |
| Education, Arts & Media | 7 (36.8%) | 12 (63.2%) |
| Legal Services & Support | 9 (100.0%) | 0 (0.0%) |
| Education Instruction & Library | 62 (26.6%) | 171 (73.4%) |
| Arts, Media & Entertainment | 86 (70.5%) | 36 (29.5%) |
| Health Diagnosing & Treating | 10 (3.9%) | 245 (96.1%) |
| Health Technologists | 0 (0.0%) | 98 (100.0%) |
| Total (Category) | 588 (41.6%) | 826 (58.4%) |
| Total (Overall) | 2,558 (48.6%) | 2,709 (51.4%) |
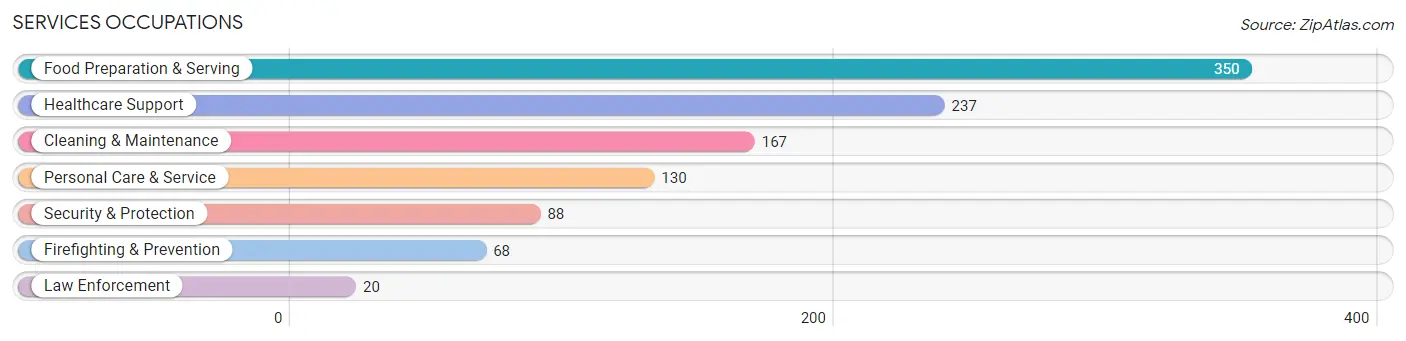
Services Occupations
The most common Services occupations in Waynesboro borough are Food Preparation & Serving (350 | 6.7%), Healthcare Support (237 | 4.5%), Cleaning & Maintenance (167 | 3.2%), Personal Care & Service (130 | 2.5%), and Security & Protection (88 | 1.7%).
Services Occupations by Sex
Within the Services occupations in Waynesboro borough, the most male-oriented occupations are Law Enforcement (100.0%), Security & Protection (70.5%), and Firefighting & Prevention (61.8%), while the most female-oriented occupations are Healthcare Support (91.6%), Personal Care & Service (87.7%), and Food Preparation & Serving (48.3%).
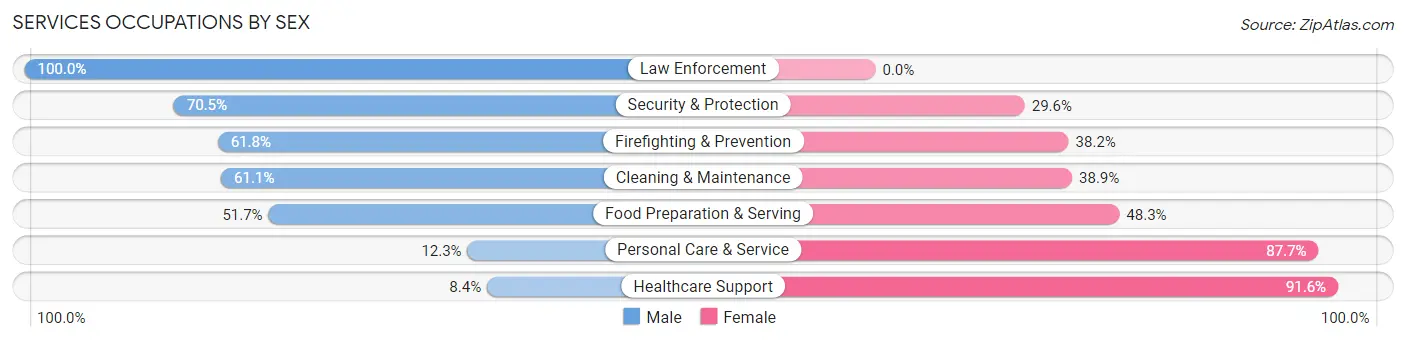
| Occupation | Male | Female |
| Healthcare Support | 20 (8.4%) | 217 (91.6%) |
| Security & Protection | 62 (70.5%) | 26 (29.5%) |
| Firefighting & Prevention | 42 (61.8%) | 26 (38.2%) |
| Law Enforcement | 20 (100.0%) | 0 (0.0%) |
| Food Preparation & Serving | 181 (51.7%) | 169 (48.3%) |
| Cleaning & Maintenance | 102 (61.1%) | 65 (38.9%) |
| Personal Care & Service | 16 (12.3%) | 114 (87.7%) |
| Total (Category) | 381 (39.2%) | 591 (60.8%) |
| Total (Overall) | 2,558 (48.6%) | 2,709 (51.4%) |
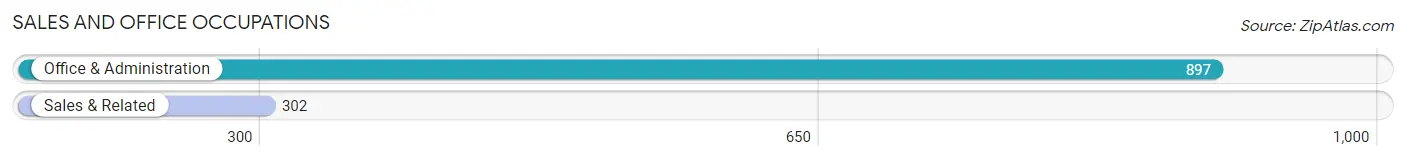
Sales and Office Occupations
The most common Sales and Office occupations in Waynesboro borough are Office & Administration (897 | 17.0%), and Sales & Related (302 | 5.7%).
Sales and Office Occupations by Sex

| Occupation | Male | Female |
| Sales & Related | 181 (59.9%) | 121 (40.1%) |
| Office & Administration | 108 (12.0%) | 789 (88.0%) |
| Total (Category) | 289 (24.1%) | 910 (75.9%) |
| Total (Overall) | 2,558 (48.6%) | 2,709 (51.4%) |
Natural Resources, Construction and Maintenance Occupations
The most common Natural Resources, Construction and Maintenance occupations in Waynesboro borough are Installation, Maintenance & Repair (268 | 5.1%), and Construction & Extraction (142 | 2.7%).
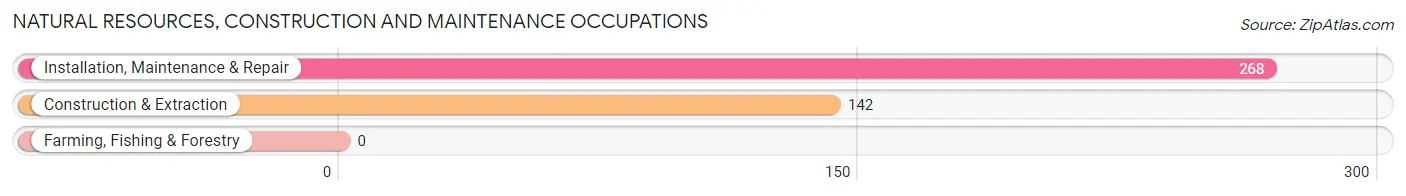
Natural Resources, Construction and Maintenance Occupations by Sex

| Occupation | Male | Female |
| Farming, Fishing & Forestry | 0 (0.0%) | 0 (0.0%) |
| Construction & Extraction | 105 (73.9%) | 37 (26.1%) |
| Installation, Maintenance & Repair | 268 (100.0%) | 0 (0.0%) |
| Total (Category) | 373 (91.0%) | 37 (9.0%) |
| Total (Overall) | 2,558 (48.6%) | 2,709 (51.4%) |
Production, Transportation and Moving Occupations
The most common Production, Transportation and Moving occupations in Waynesboro borough are Production (654 | 12.4%), Material Moving (461 | 8.7%), and Transportation (157 | 3.0%).
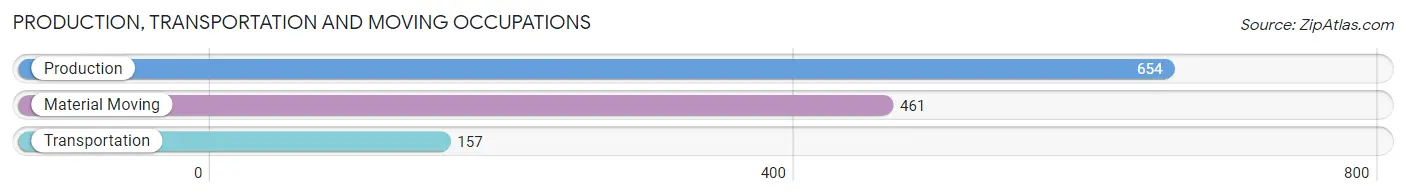
Production, Transportation and Moving Occupations by Sex
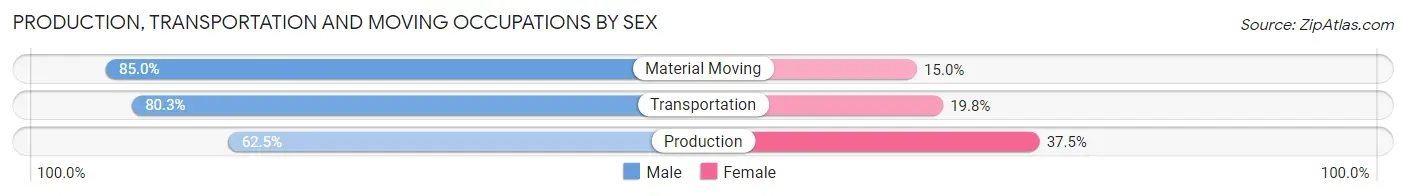
| Occupation | Male | Female |
| Production | 409 (62.5%) | 245 (37.5%) |
| Transportation | 126 (80.2%) | 31 (19.8%) |
| Material Moving | 392 (85.0%) | 69 (15.0%) |
| Total (Category) | 927 (72.9%) | 345 (27.1%) |
| Total (Overall) | 2,558 (48.6%) | 2,709 (51.4%) |
Employment Industries by Sex in Waynesboro borough
Employment Industries in Waynesboro borough
The major employment industries in Waynesboro borough include Manufacturing (865 | 16.4%), Health Care & Social Assistance (811 | 15.4%), Transportation & Warehousing (699 | 13.3%), Retail Trade (580 | 11.0%), and Accommodation & Food Services (406 | 7.7%).
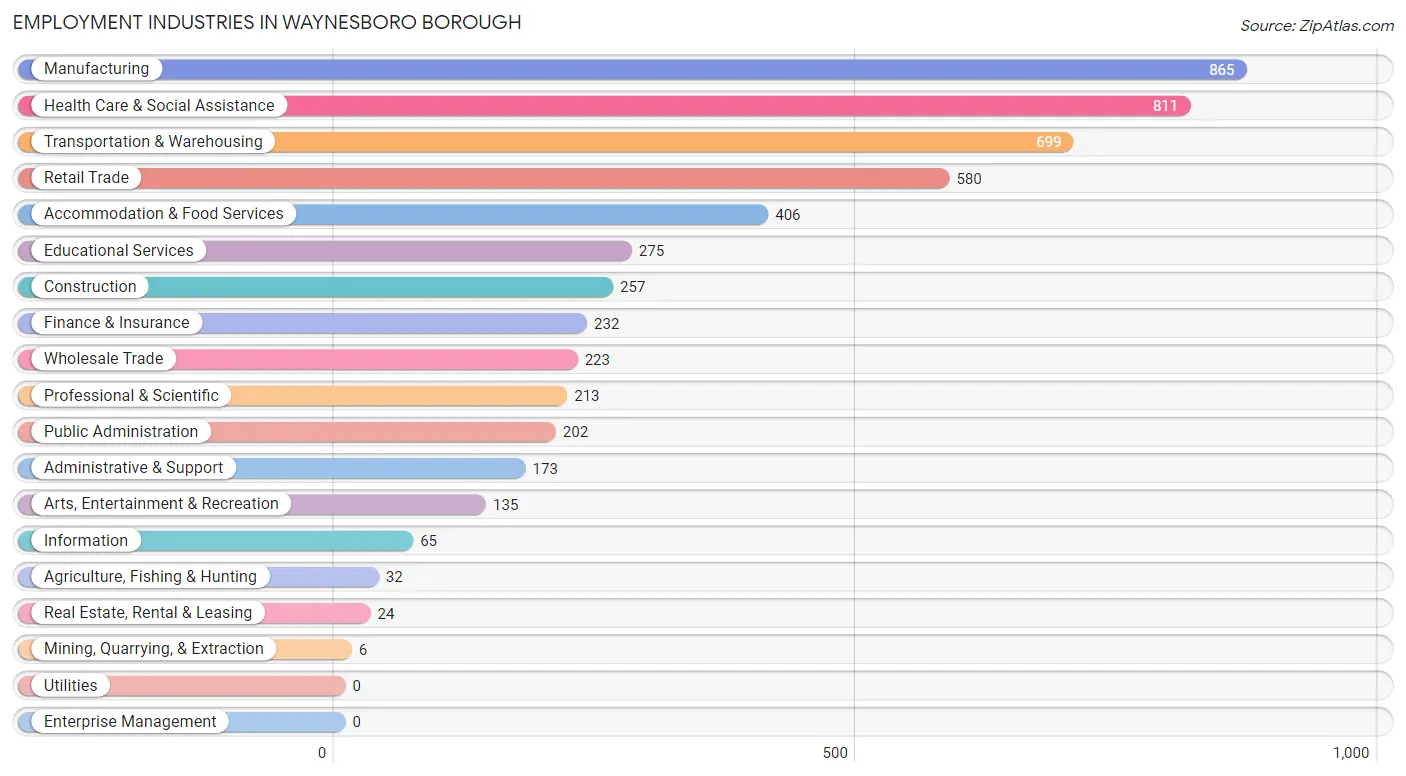
Employment Industries by Sex in Waynesboro borough
The Waynesboro borough industries that see more men than women are Mining, Quarrying, & Extraction (100.0%), Construction (85.2%), and Agriculture, Fishing & Hunting (78.1%), whereas the industries that tend to have a higher number of women are Real Estate, Rental & Leasing (100.0%), Finance & Insurance (96.6%), and Health Care & Social Assistance (91.5%).
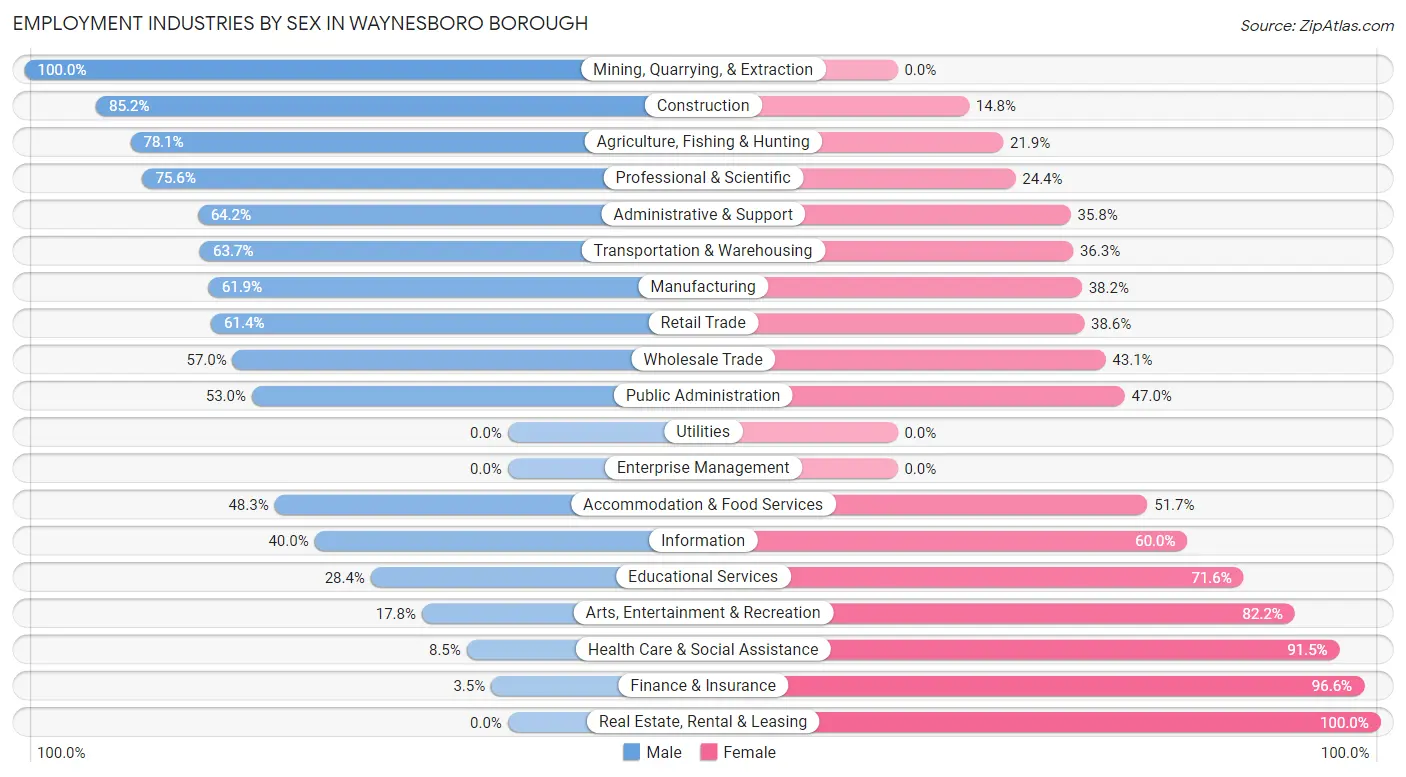
| Industry | Male | Female |
| Agriculture, Fishing & Hunting | 25 (78.1%) | 7 (21.9%) |
| Mining, Quarrying, & Extraction | 6 (100.0%) | 0 (0.0%) |
| Construction | 219 (85.2%) | 38 (14.8%) |
| Manufacturing | 535 (61.9%) | 330 (38.2%) |
| Wholesale Trade | 127 (57.0%) | 96 (43.0%) |
| Retail Trade | 356 (61.4%) | 224 (38.6%) |
| Transportation & Warehousing | 445 (63.7%) | 254 (36.3%) |
| Utilities | 0 (0.0%) | 0 (0.0%) |
| Information | 26 (40.0%) | 39 (60.0%) |
| Finance & Insurance | 8 (3.5%) | 224 (96.6%) |
| Real Estate, Rental & Leasing | 0 (0.0%) | 24 (100.0%) |
| Professional & Scientific | 161 (75.6%) | 52 (24.4%) |
| Enterprise Management | 0 (0.0%) | 0 (0.0%) |
| Administrative & Support | 111 (64.2%) | 62 (35.8%) |
| Educational Services | 78 (28.4%) | 197 (71.6%) |
| Health Care & Social Assistance | 69 (8.5%) | 742 (91.5%) |
| Arts, Entertainment & Recreation | 24 (17.8%) | 111 (82.2%) |
| Accommodation & Food Services | 196 (48.3%) | 210 (51.7%) |
| Public Administration | 107 (53.0%) | 95 (47.0%) |
| Total | 2,558 (48.6%) | 2,709 (51.4%) |
Education in Waynesboro borough
School Enrollment in Waynesboro borough
The most common levels of schooling among the 3,056 students in Waynesboro borough are elementary school (909 | 29.7%), high school (823 | 26.9%), and middle school (765 | 25.0%).
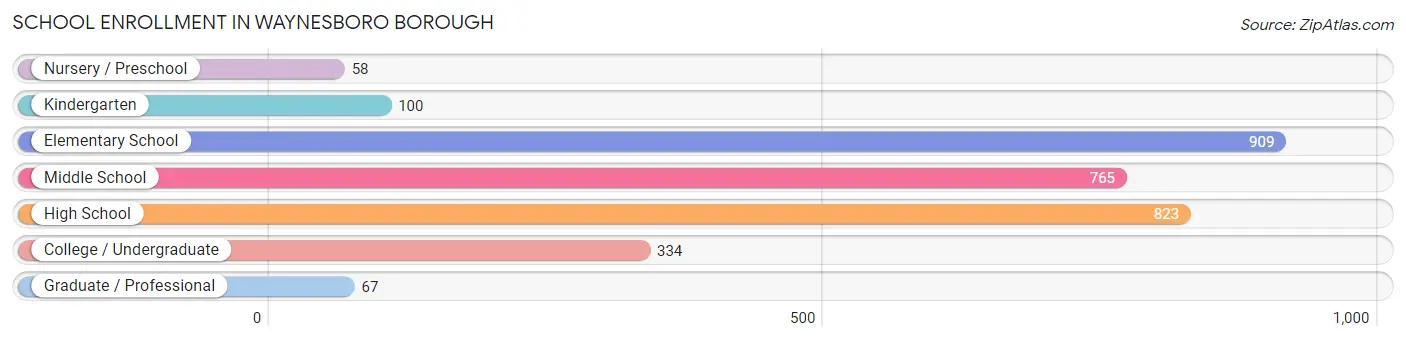
| School Level | # Students | % Students |
| Nursery / Preschool | 58 | 1.9% |
| Kindergarten | 100 | 3.3% |
| Elementary School | 909 | 29.7% |
| Middle School | 765 | 25.0% |
| High School | 823 | 26.9% |
| College / Undergraduate | 334 | 10.9% |
| Graduate / Professional | 67 | 2.2% |
| Total | 3,056 | 100.0% |
School Enrollment by Age by Funding Source in Waynesboro borough
Out of a total of 3,056 students who are enrolled in schools in Waynesboro borough, 342 (11.2%) attend a private institution, while the remaining 2,714 (88.8%) are enrolled in public schools. The age group of 20 to 24 year olds has the highest likelihood of being enrolled in private schools, with 69 (51.1% in the age bracket) enrolled. Conversely, the age group of 18 to 19 year olds has the lowest likelihood of being enrolled in a private school, with 116 (100.0% in the age bracket) attending a public institution.
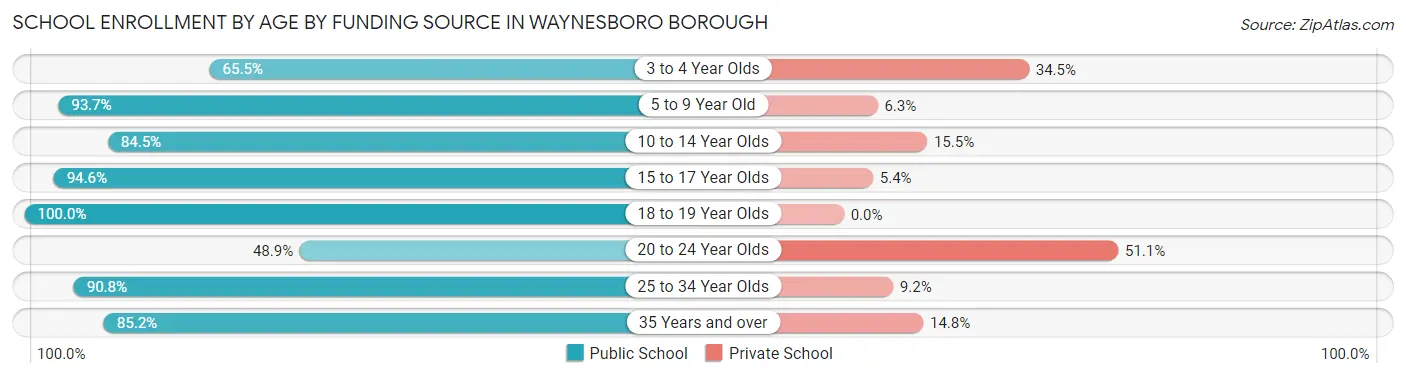
| Age Bracket | Public School | Private School |
| 3 to 4 Year Olds | 19 (65.5%) | 10 (34.5%) |
| 5 to 9 Year Old | 938 (93.7%) | 63 (6.3%) |
| 10 to 14 Year Olds | 735 (84.5%) | 135 (15.5%) |
| 15 to 17 Year Olds | 644 (94.6%) | 37 (5.4%) |
| 18 to 19 Year Olds | 116 (100.0%) | 0 (0.0%) |
| 20 to 24 Year Olds | 66 (48.9%) | 69 (51.1%) |
| 25 to 34 Year Olds | 99 (90.8%) | 10 (9.2%) |
| 35 Years and over | 98 (85.2%) | 17 (14.8%) |
| Total | 2,714 (88.8%) | 342 (11.2%) |
Educational Attainment by Field of Study in Waynesboro borough
Business (166 | 16.2%), social sciences (150 | 14.6%), education (128 | 12.5%), arts & humanities (109 | 10.6%), and science & technology (103 | 10.1%) are the most common fields of study among 1,025 individuals in Waynesboro borough who have obtained a bachelor's degree or higher.
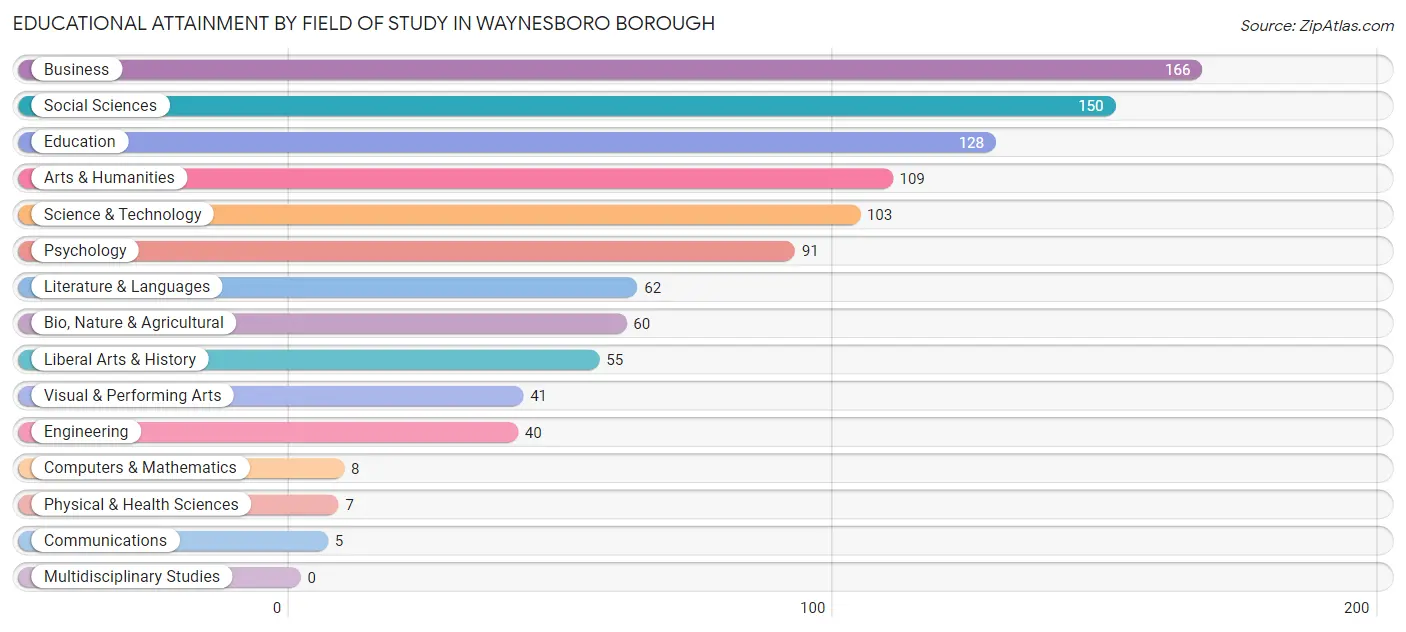
| Field of Study | # Graduates | % Graduates |
| Computers & Mathematics | 8 | 0.8% |
| Bio, Nature & Agricultural | 60 | 5.9% |
| Physical & Health Sciences | 7 | 0.7% |
| Psychology | 91 | 8.9% |
| Social Sciences | 150 | 14.6% |
| Engineering | 40 | 3.9% |
| Multidisciplinary Studies | 0 | 0.0% |
| Science & Technology | 103 | 10.1% |
| Business | 166 | 16.2% |
| Education | 128 | 12.5% |
| Literature & Languages | 62 | 6.0% |
| Liberal Arts & History | 55 | 5.4% |
| Visual & Performing Arts | 41 | 4.0% |
| Communications | 5 | 0.5% |
| Arts & Humanities | 109 | 10.6% |
| Total | 1,025 | 100.0% |
Transportation & Commute in Waynesboro borough
Vehicle Availability by Sex in Waynesboro borough
The most prevalent vehicle ownership categories in Waynesboro borough are males with 2 vehicles (1,019, accounting for 40.3%) and females with 2 vehicles (890, making up 39.0%).
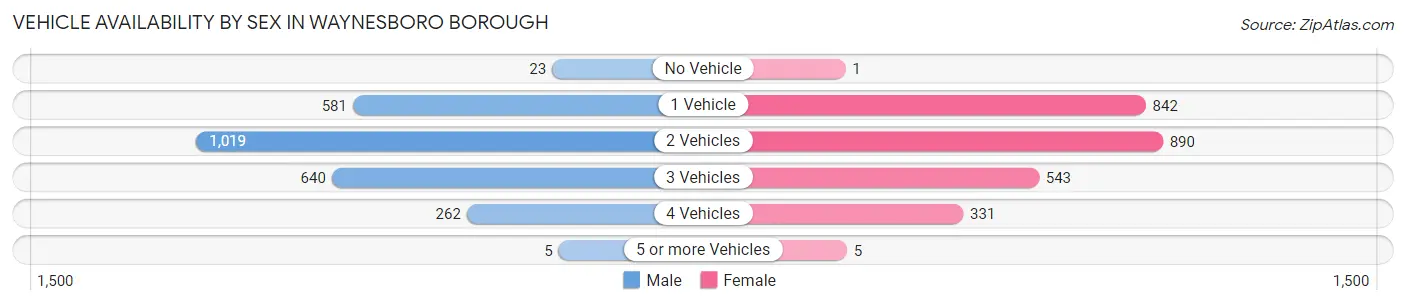
| Vehicles Available | Male | Female |
| No Vehicle | 23 (0.9%) | 1 (0.0%) |
| 1 Vehicle | 581 (23.0%) | 842 (32.2%) |
| 2 Vehicles | 1,019 (40.3%) | 890 (34.1%) |
| 3 Vehicles | 640 (25.3%) | 543 (20.8%) |
| 4 Vehicles | 262 (10.4%) | 331 (12.7%) |
| 5 or more Vehicles | 5 (0.2%) | 5 (0.2%) |
| Total | 2,530 (100.0%) | 2,612 (100.0%) |
Commute Time in Waynesboro borough
The most frequently occuring commute durations in Waynesboro borough are 25 to 29 minutes (798 commuters, 16.2%), 20 to 24 minutes (646 commuters, 13.1%), and 5 to 9 minutes (634 commuters, 12.8%).
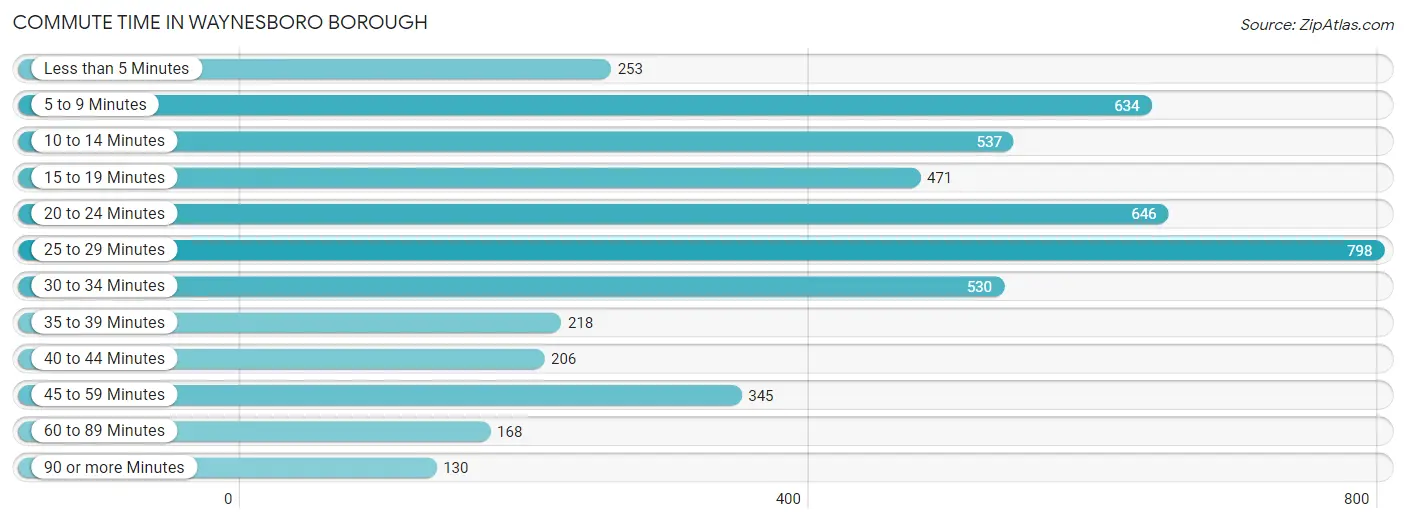
| Commute Time | # Commuters | % Commuters |
| Less than 5 Minutes | 253 | 5.1% |
| 5 to 9 Minutes | 634 | 12.8% |
| 10 to 14 Minutes | 537 | 10.9% |
| 15 to 19 Minutes | 471 | 9.5% |
| 20 to 24 Minutes | 646 | 13.1% |
| 25 to 29 Minutes | 798 | 16.2% |
| 30 to 34 Minutes | 530 | 10.7% |
| 35 to 39 Minutes | 218 | 4.4% |
| 40 to 44 Minutes | 206 | 4.2% |
| 45 to 59 Minutes | 345 | 7.0% |
| 60 to 89 Minutes | 168 | 3.4% |
| 90 or more Minutes | 130 | 2.6% |
Commute Time by Sex in Waynesboro borough
The most common commute times in Waynesboro borough are 5 to 9 minutes (383 commuters, 15.3%) for males and 25 to 29 minutes (504 commuters, 20.7%) for females.
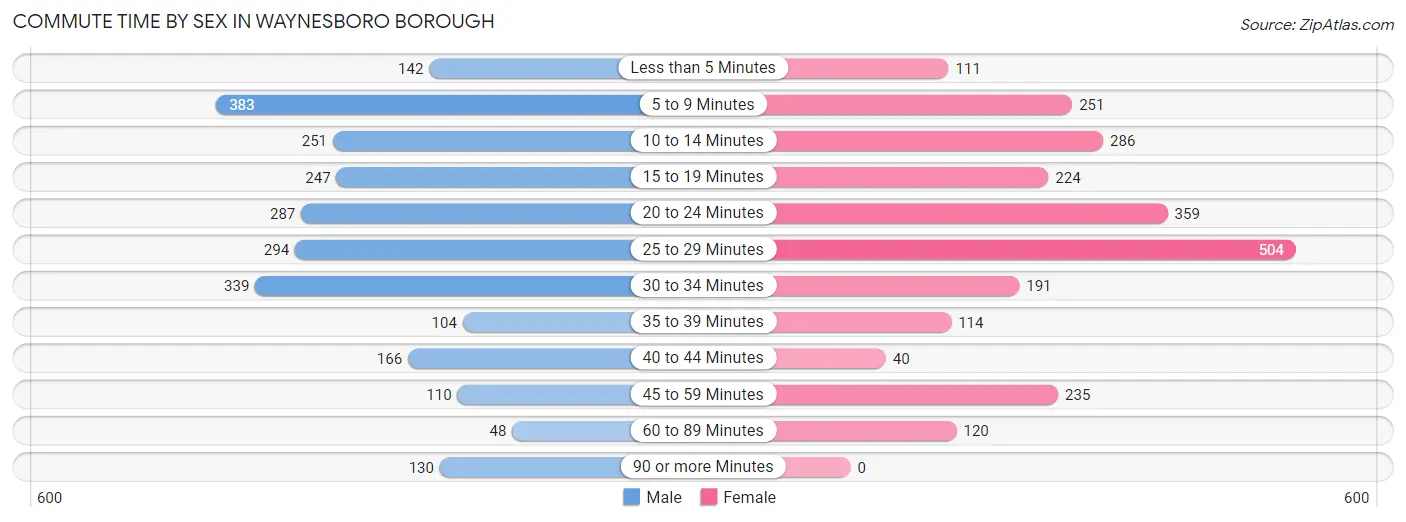
| Commute Time | Male | Female |
| Less than 5 Minutes | 142 (5.7%) | 111 (4.6%) |
| 5 to 9 Minutes | 383 (15.3%) | 251 (10.3%) |
| 10 to 14 Minutes | 251 (10.0%) | 286 (11.7%) |
| 15 to 19 Minutes | 247 (9.9%) | 224 (9.2%) |
| 20 to 24 Minutes | 287 (11.5%) | 359 (14.7%) |
| 25 to 29 Minutes | 294 (11.8%) | 504 (20.7%) |
| 30 to 34 Minutes | 339 (13.6%) | 191 (7.8%) |
| 35 to 39 Minutes | 104 (4.2%) | 114 (4.7%) |
| 40 to 44 Minutes | 166 (6.6%) | 40 (1.6%) |
| 45 to 59 Minutes | 110 (4.4%) | 235 (9.7%) |
| 60 to 89 Minutes | 48 (1.9%) | 120 (4.9%) |
| 90 or more Minutes | 130 (5.2%) | 0 (0.0%) |
Time of Departure to Work by Sex in Waynesboro borough
The most frequent times of departure to work in Waynesboro borough are 12:00 AM to 4:59 AM (416, 16.6%) for males and 6:30 AM to 6:59 AM (406, 16.7%) for females.
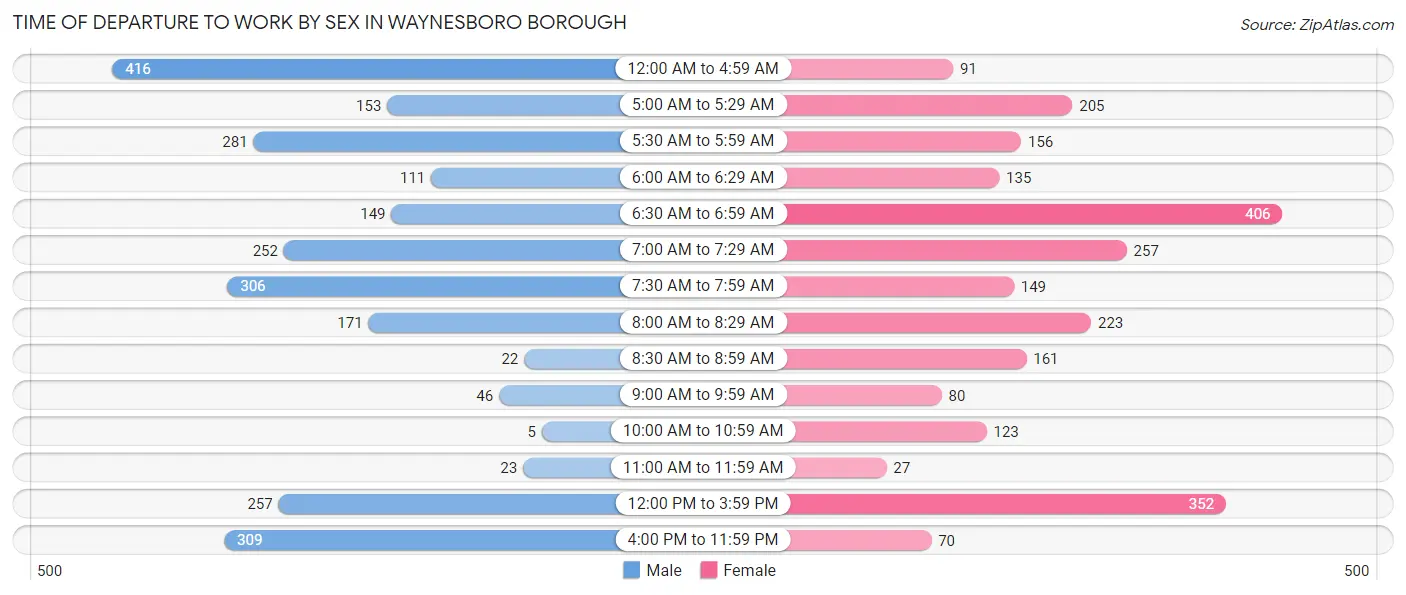
| Time of Departure | Male | Female |
| 12:00 AM to 4:59 AM | 416 (16.6%) | 91 (3.7%) |
| 5:00 AM to 5:29 AM | 153 (6.1%) | 205 (8.4%) |
| 5:30 AM to 5:59 AM | 281 (11.2%) | 156 (6.4%) |
| 6:00 AM to 6:29 AM | 111 (4.4%) | 135 (5.5%) |
| 6:30 AM to 6:59 AM | 149 (6.0%) | 406 (16.7%) |
| 7:00 AM to 7:29 AM | 252 (10.1%) | 257 (10.5%) |
| 7:30 AM to 7:59 AM | 306 (12.2%) | 149 (6.1%) |
| 8:00 AM to 8:29 AM | 171 (6.8%) | 223 (9.2%) |
| 8:30 AM to 8:59 AM | 22 (0.9%) | 161 (6.6%) |
| 9:00 AM to 9:59 AM | 46 (1.8%) | 80 (3.3%) |
| 10:00 AM to 10:59 AM | 5 (0.2%) | 123 (5.1%) |
| 11:00 AM to 11:59 AM | 23 (0.9%) | 27 (1.1%) |
| 12:00 PM to 3:59 PM | 257 (10.3%) | 352 (14.5%) |
| 4:00 PM to 11:59 PM | 309 (12.4%) | 70 (2.9%) |
| Total | 2,501 (100.0%) | 2,435 (100.0%) |
Housing Occupancy in Waynesboro borough
Occupancy by Ownership in Waynesboro borough
Of the total 4,511 dwellings in Waynesboro borough, owner-occupied units account for 2,249 (49.9%), while renter-occupied units make up 2,262 (50.1%).
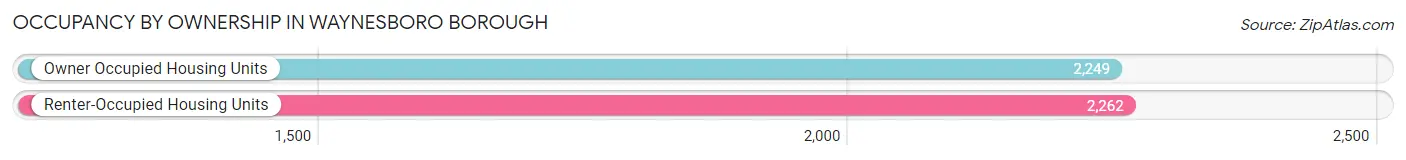
| Occupancy | # Housing Units | % Housing Units |
| Owner Occupied Housing Units | 2,249 | 49.9% |
| Renter-Occupied Housing Units | 2,262 | 50.1% |
| Total Occupied Housing Units | 4,511 | 100.0% |
Occupancy by Household Size in Waynesboro borough
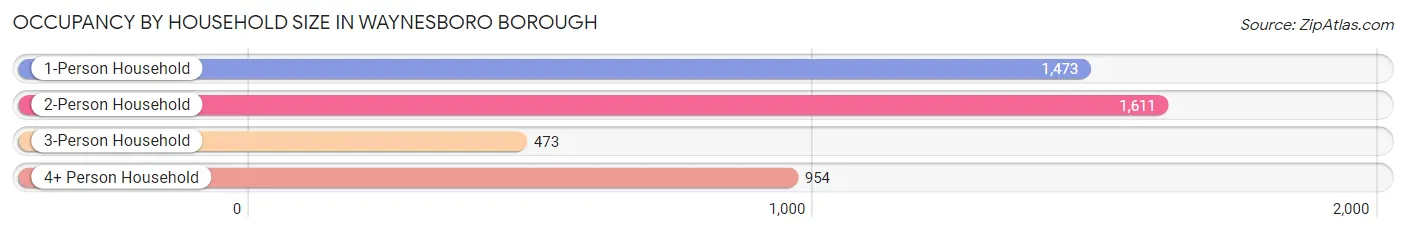
| Household Size | # Housing Units | % Housing Units |
| 1-Person Household | 1,473 | 32.7% |
| 2-Person Household | 1,611 | 35.7% |
| 3-Person Household | 473 | 10.5% |
| 4+ Person Household | 954 | 21.1% |
| Total Housing Units | 4,511 | 100.0% |
Occupancy by Ownership by Household Size in Waynesboro borough
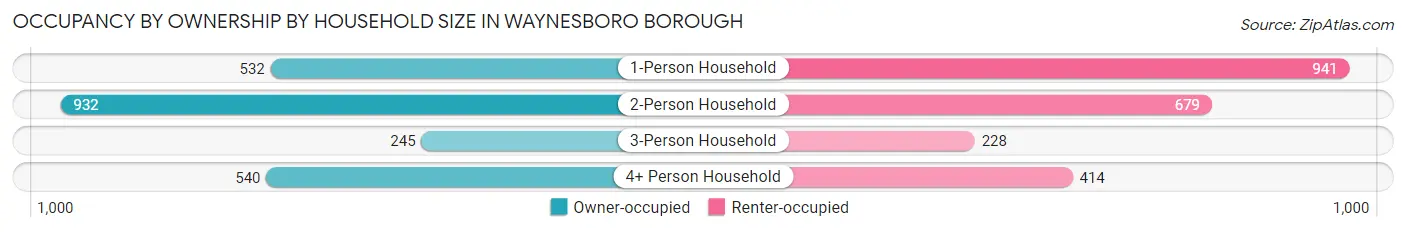
| Household Size | Owner-occupied | Renter-occupied |
| 1-Person Household | 532 (36.1%) | 941 (63.9%) |
| 2-Person Household | 932 (57.9%) | 679 (42.1%) |
| 3-Person Household | 245 (51.8%) | 228 (48.2%) |
| 4+ Person Household | 540 (56.6%) | 414 (43.4%) |
| Total Housing Units | 2,249 (49.9%) | 2,262 (50.1%) |
Occupancy by Educational Attainment in Waynesboro borough
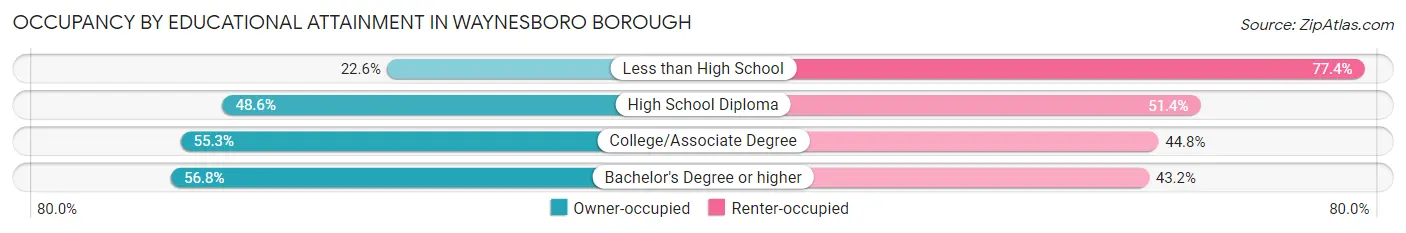
| Household Size | Owner-occupied | Renter-occupied |
| Less than High School | 88 (22.6%) | 302 (77.4%) |
| High School Diploma | 922 (48.6%) | 975 (51.4%) |
| College/Associate Degree | 853 (55.2%) | 691 (44.8%) |
| Bachelor's Degree or higher | 386 (56.8%) | 294 (43.2%) |
Occupancy by Age of Householder in Waynesboro borough
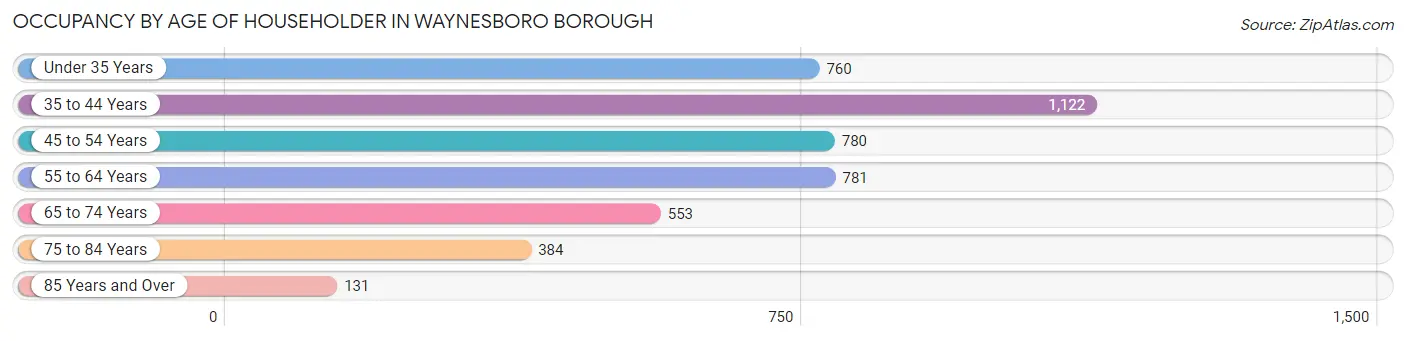
| Age Bracket | # Households | % Households |
| Under 35 Years | 760 | 16.9% |
| 35 to 44 Years | 1,122 | 24.9% |
| 45 to 54 Years | 780 | 17.3% |
| 55 to 64 Years | 781 | 17.3% |
| 65 to 74 Years | 553 | 12.3% |
| 75 to 84 Years | 384 | 8.5% |
| 85 Years and Over | 131 | 2.9% |
| Total | 4,511 | 100.0% |
Housing Finances in Waynesboro borough
Median Income by Occupancy in Waynesboro borough
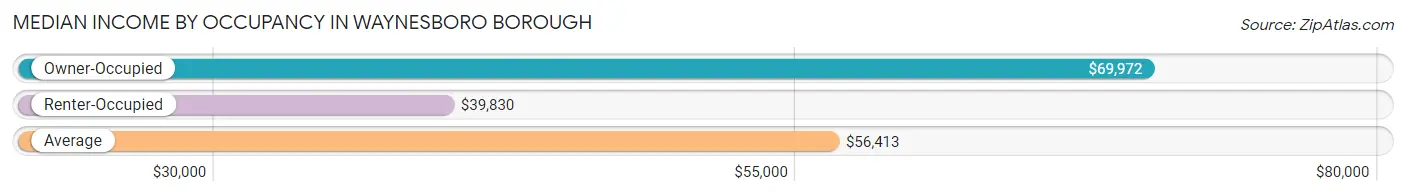
| Occupancy Type | # Households | Median Income |
| Owner-Occupied | 2,249 (49.9%) | $69,972 |
| Renter-Occupied | 2,262 (50.1%) | $39,830 |
| Average | 4,511 (100.0%) | $56,413 |
Occupancy by Householder Income Bracket in Waynesboro borough
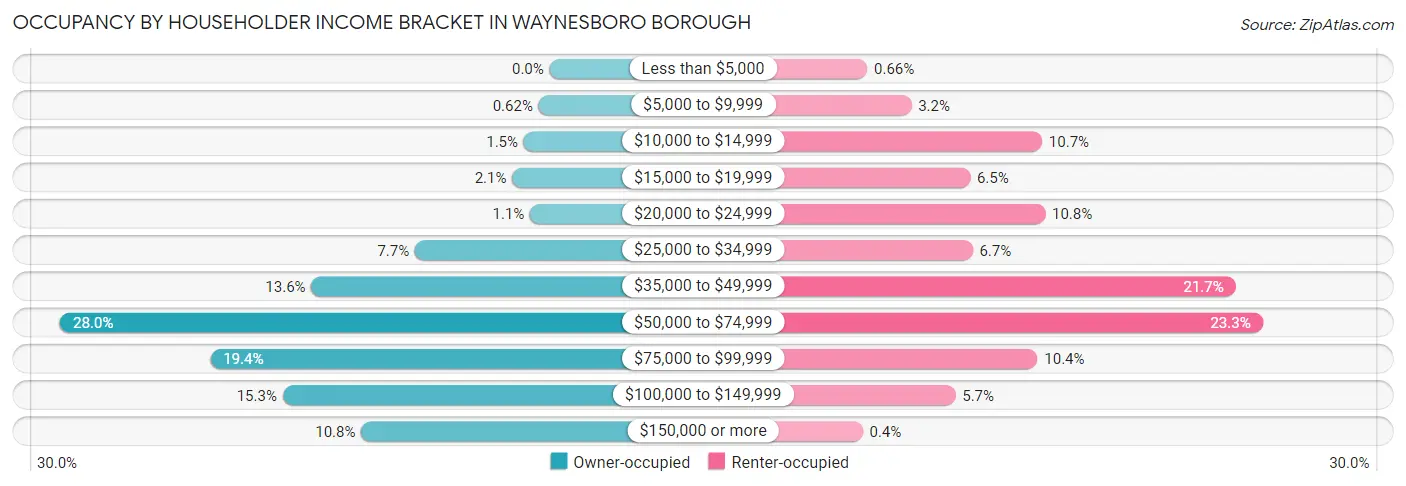
| Income Bracket | Owner-occupied | Renter-occupied |
| Less than $5,000 | 0 (0.0%) | 15 (0.7%) |
| $5,000 to $9,999 | 14 (0.6%) | 72 (3.2%) |
| $10,000 to $14,999 | 33 (1.5%) | 241 (10.6%) |
| $15,000 to $19,999 | 48 (2.1%) | 148 (6.5%) |
| $20,000 to $24,999 | 25 (1.1%) | 245 (10.8%) |
| $25,000 to $34,999 | 173 (7.7%) | 151 (6.7%) |
| $35,000 to $49,999 | 306 (13.6%) | 491 (21.7%) |
| $50,000 to $74,999 | 629 (28.0%) | 526 (23.3%) |
| $75,000 to $99,999 | 436 (19.4%) | 235 (10.4%) |
| $100,000 to $149,999 | 343 (15.2%) | 129 (5.7%) |
| $150,000 or more | 242 (10.8%) | 9 (0.4%) |
| Total | 2,249 (100.0%) | 2,262 (100.0%) |
Monthly Housing Cost Tiers in Waynesboro borough
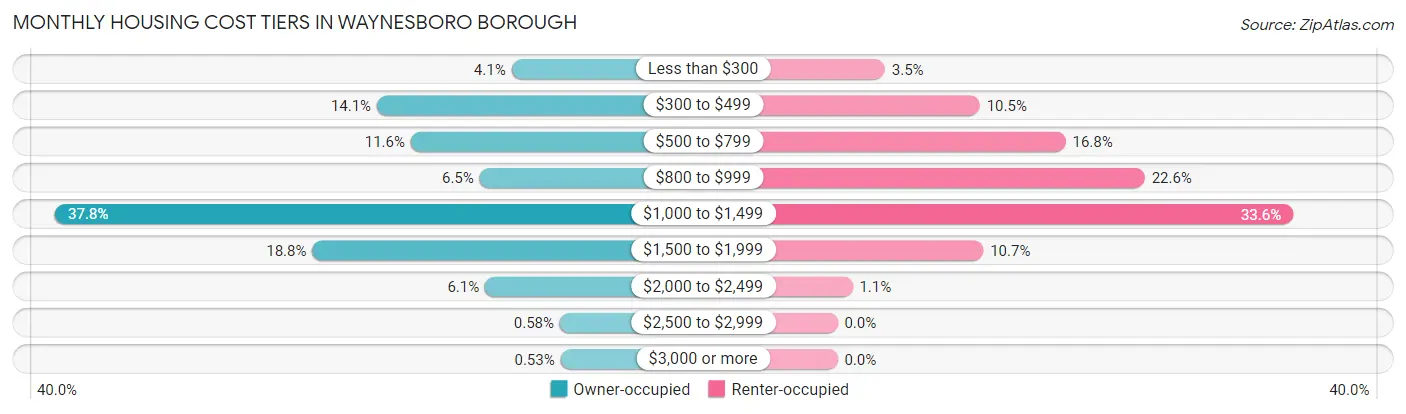
| Monthly Cost | Owner-occupied | Renter-occupied |
| Less than $300 | 93 (4.1%) | 79 (3.5%) |
| $300 to $499 | 316 (14.1%) | 237 (10.5%) |
| $500 to $799 | 260 (11.6%) | 380 (16.8%) |
| $800 to $999 | 146 (6.5%) | 512 (22.6%) |
| $1,000 to $1,499 | 849 (37.8%) | 759 (33.6%) |
| $1,500 to $1,999 | 423 (18.8%) | 243 (10.7%) |
| $2,000 to $2,499 | 137 (6.1%) | 25 (1.1%) |
| $2,500 to $2,999 | 13 (0.6%) | 0 (0.0%) |
| $3,000 or more | 12 (0.5%) | 0 (0.0%) |
| Total | 2,249 (100.0%) | 2,262 (100.0%) |
Physical Housing Characteristics in Waynesboro borough
Housing Structures in Waynesboro borough
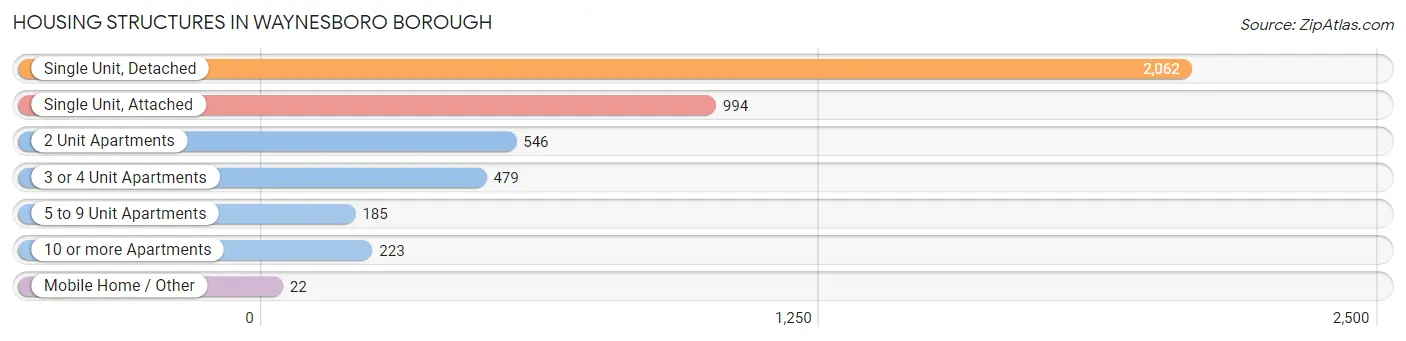
| Structure Type | # Housing Units | % Housing Units |
| Single Unit, Detached | 2,062 | 45.7% |
| Single Unit, Attached | 994 | 22.0% |
| 2 Unit Apartments | 546 | 12.1% |
| 3 or 4 Unit Apartments | 479 | 10.6% |
| 5 to 9 Unit Apartments | 185 | 4.1% |
| 10 or more Apartments | 223 | 4.9% |
| Mobile Home / Other | 22 | 0.5% |
| Total | 4,511 | 100.0% |
Housing Structures by Occupancy in Waynesboro borough
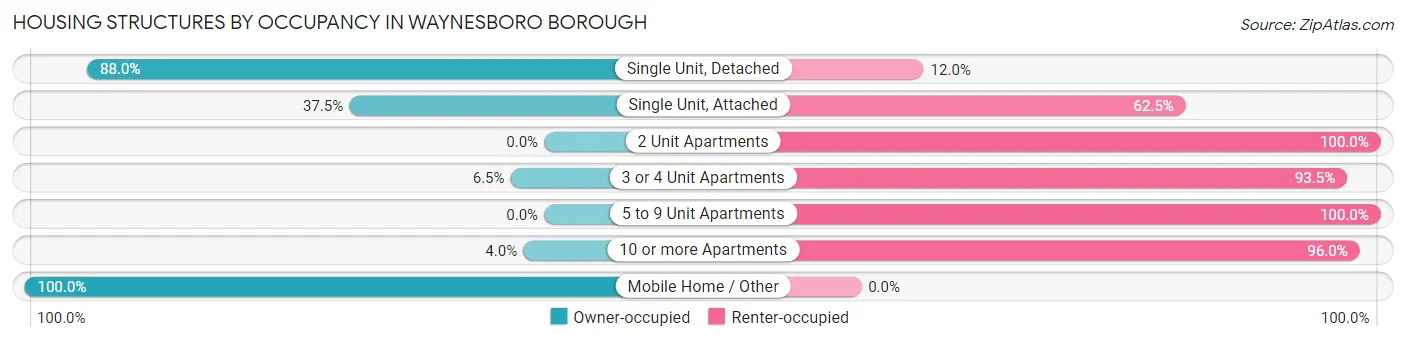
| Structure Type | Owner-occupied | Renter-occupied |
| Single Unit, Detached | 1,814 (88.0%) | 248 (12.0%) |
| Single Unit, Attached | 373 (37.5%) | 621 (62.5%) |
| 2 Unit Apartments | 0 (0.0%) | 546 (100.0%) |
| 3 or 4 Unit Apartments | 31 (6.5%) | 448 (93.5%) |
| 5 to 9 Unit Apartments | 0 (0.0%) | 185 (100.0%) |
| 10 or more Apartments | 9 (4.0%) | 214 (96.0%) |
| Mobile Home / Other | 22 (100.0%) | 0 (0.0%) |
| Total | 2,249 (49.9%) | 2,262 (50.1%) |
Housing Structures by Number of Rooms in Waynesboro borough
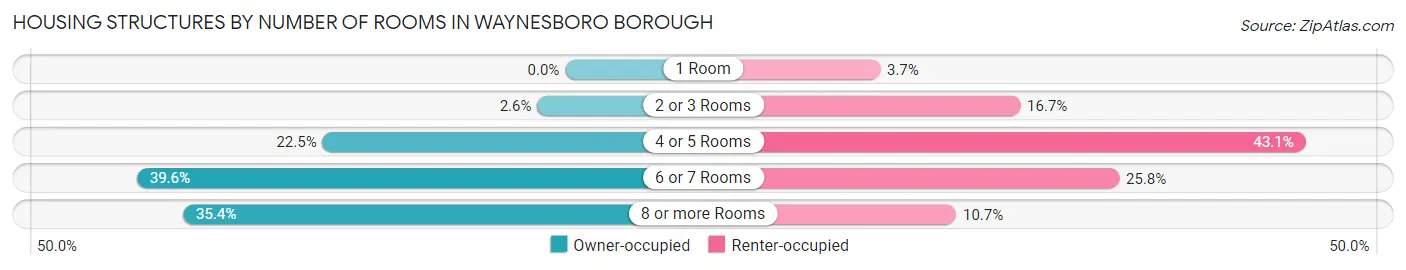
| Number of Rooms | Owner-occupied | Renter-occupied |
| 1 Room | 0 (0.0%) | 84 (3.7%) |
| 2 or 3 Rooms | 58 (2.6%) | 377 (16.7%) |
| 4 or 5 Rooms | 505 (22.5%) | 974 (43.1%) |
| 6 or 7 Rooms | 891 (39.6%) | 584 (25.8%) |
| 8 or more Rooms | 795 (35.3%) | 243 (10.7%) |
| Total | 2,249 (100.0%) | 2,262 (100.0%) |
Housing Structure by Heating Type in Waynesboro borough
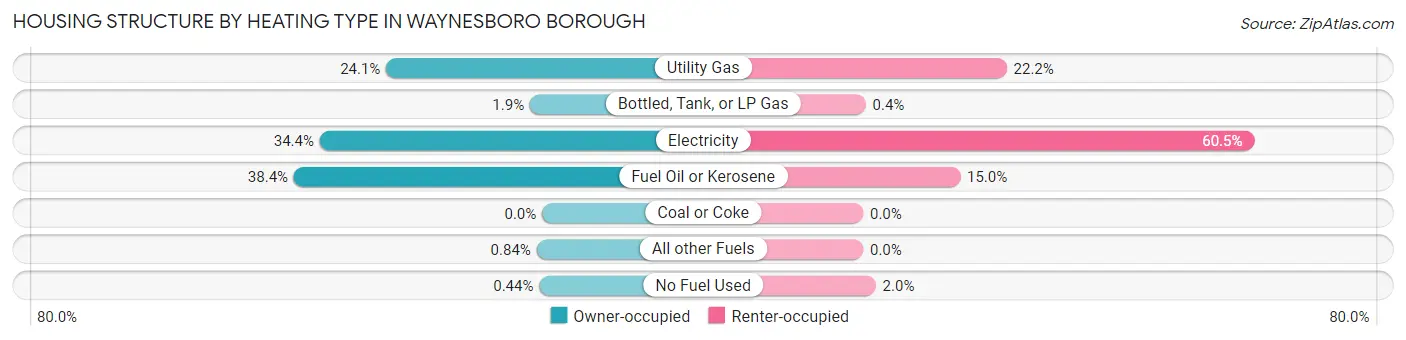
| Heating Type | Owner-occupied | Renter-occupied |
| Utility Gas | 542 (24.1%) | 502 (22.2%) |
| Bottled, Tank, or LP Gas | 42 (1.9%) | 9 (0.4%) |
| Electricity | 773 (34.4%) | 1,368 (60.5%) |
| Fuel Oil or Kerosene | 863 (38.4%) | 339 (15.0%) |
| Coal or Coke | 0 (0.0%) | 0 (0.0%) |
| All other Fuels | 19 (0.8%) | 0 (0.0%) |
| No Fuel Used | 10 (0.4%) | 44 (1.9%) |
| Total | 2,249 (100.0%) | 2,262 (100.0%) |
Household Vehicle Usage in Waynesboro borough
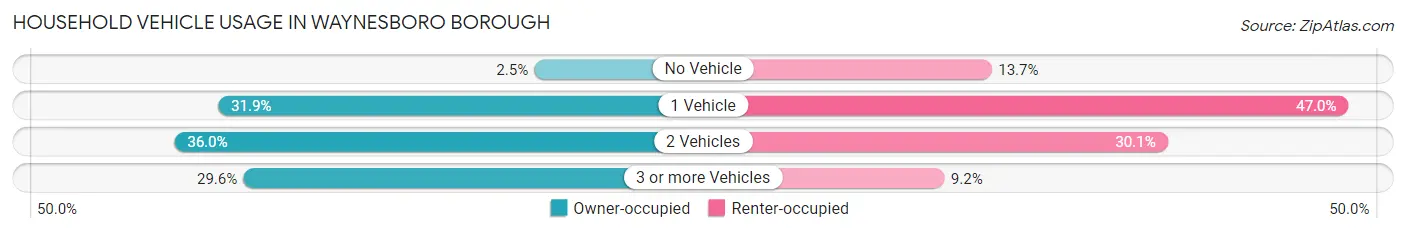
| Vehicles per Household | Owner-occupied | Renter-occupied |
| No Vehicle | 55 (2.5%) | 309 (13.7%) |
| 1 Vehicle | 718 (31.9%) | 1,063 (47.0%) |
| 2 Vehicles | 810 (36.0%) | 681 (30.1%) |
| 3 or more Vehicles | 666 (29.6%) | 209 (9.2%) |
| Total | 2,249 (100.0%) | 2,262 (100.0%) |
Real Estate & Mortgages in Waynesboro borough
Real Estate and Mortgage Overview in Waynesboro borough
| Characteristic | Without Mortgage | With Mortgage |
| Housing Units | 693 | 1,556 |
| Median Property Value | $162,000 | $174,100 |
| Median Household Income | $65,375 | $179 |
| Monthly Housing Costs | $465 | $12 |
| Real Estate Taxes | $1,603 | $28 |
Property Value by Mortgage Status in Waynesboro borough
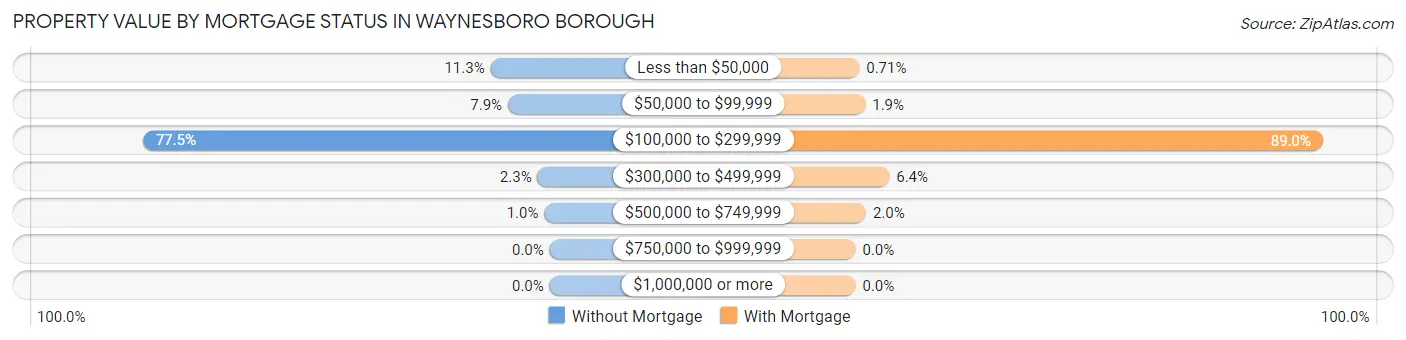
| Property Value | Without Mortgage | With Mortgage |
| Less than $50,000 | 78 (11.3%) | 11 (0.7%) |
| $50,000 to $99,999 | 55 (7.9%) | 29 (1.9%) |
| $100,000 to $299,999 | 537 (77.5%) | 1,385 (89.0%) |
| $300,000 to $499,999 | 16 (2.3%) | 100 (6.4%) |
| $500,000 to $749,999 | 7 (1.0%) | 31 (2.0%) |
| $750,000 to $999,999 | 0 (0.0%) | 0 (0.0%) |
| $1,000,000 or more | 0 (0.0%) | 0 (0.0%) |
| Total | 693 (100.0%) | 1,556 (100.0%) |
Household Income by Mortgage Status in Waynesboro borough
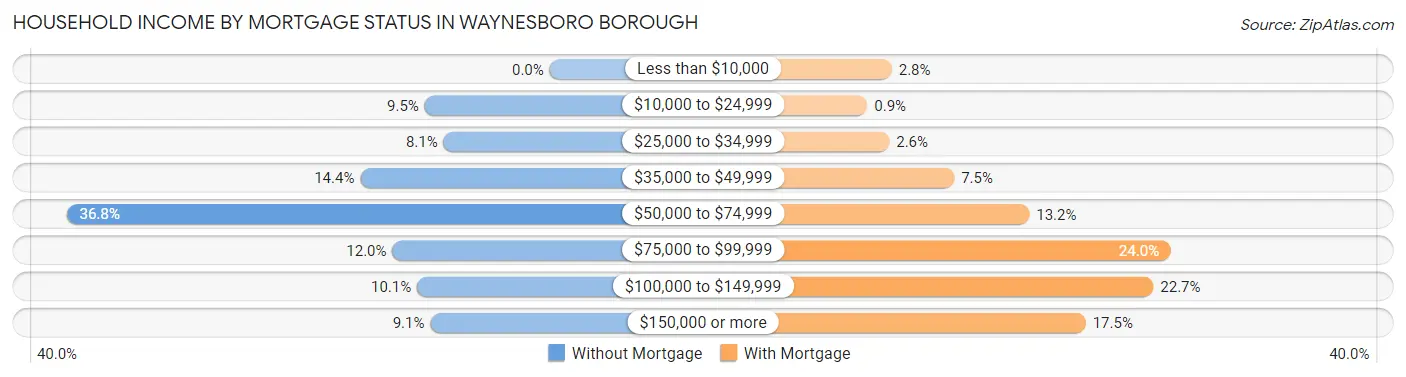
| Household Income | Without Mortgage | With Mortgage |
| Less than $10,000 | 0 (0.0%) | 43 (2.8%) |
| $10,000 to $24,999 | 66 (9.5%) | 14 (0.9%) |
| $25,000 to $34,999 | 56 (8.1%) | 40 (2.6%) |
| $35,000 to $49,999 | 100 (14.4%) | 117 (7.5%) |
| $50,000 to $74,999 | 255 (36.8%) | 206 (13.2%) |
| $75,000 to $99,999 | 83 (12.0%) | 374 (24.0%) |
| $100,000 to $149,999 | 70 (10.1%) | 353 (22.7%) |
| $150,000 or more | 63 (9.1%) | 273 (17.5%) |
| Total | 693 (100.0%) | 1,556 (100.0%) |
Property Value to Household Income Ratio in Waynesboro borough
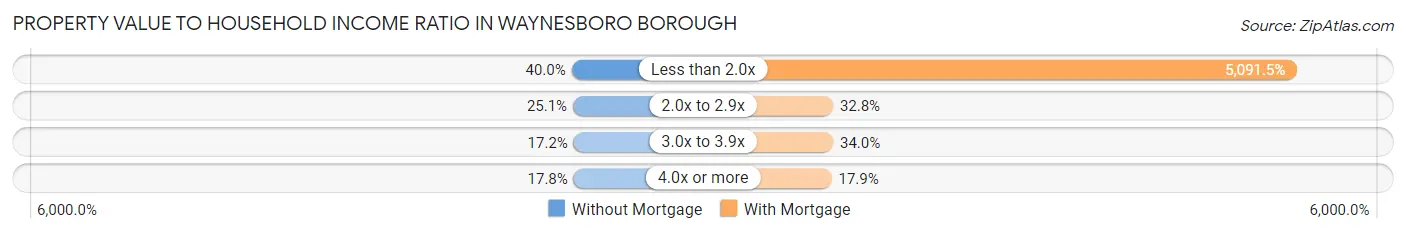
| Value-to-Income Ratio | Without Mortgage | With Mortgage |
| Less than 2.0x | 277 (40.0%) | 79,224 (5,091.5%) |
| 2.0x to 2.9x | 174 (25.1%) | 510 (32.8%) |
| 3.0x to 3.9x | 119 (17.2%) | 529 (34.0%) |
| 4.0x or more | 123 (17.7%) | 278 (17.9%) |
| Total | 693 (100.0%) | 1,556 (100.0%) |
Real Estate Taxes by Mortgage Status in Waynesboro borough
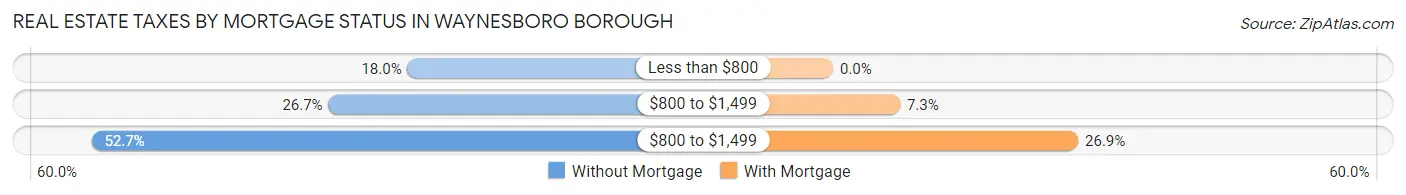
| Property Taxes | Without Mortgage | With Mortgage |
| Less than $800 | 125 (18.0%) | 0 (0.0%) |
| $800 to $1,499 | 185 (26.7%) | 114 (7.3%) |
| $800 to $1,499 | 365 (52.7%) | 418 (26.9%) |
| Total | 693 (100.0%) | 1,556 (100.0%) |
Health & Disability in Waynesboro borough
Health Insurance Coverage by Age in Waynesboro borough
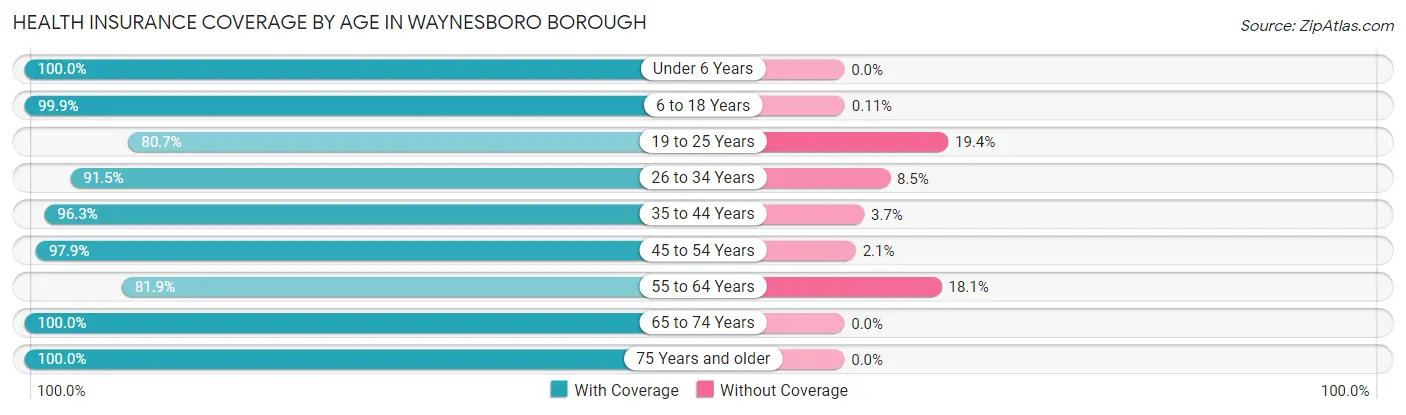
| Age Bracket | With Coverage | Without Coverage |
| Under 6 Years | 598 (100.0%) | 0 (0.0%) |
| 6 to 18 Years | 2,643 (99.9%) | 3 (0.1%) |
| 19 to 25 Years | 600 (80.6%) | 144 (19.4%) |
| 26 to 34 Years | 988 (91.5%) | 92 (8.5%) |
| 35 to 44 Years | 1,797 (96.3%) | 69 (3.7%) |
| 45 to 54 Years | 1,238 (97.9%) | 27 (2.1%) |
| 55 to 64 Years | 993 (81.9%) | 220 (18.1%) |
| 65 to 74 Years | 932 (100.0%) | 0 (0.0%) |
| 75 Years and older | 665 (100.0%) | 0 (0.0%) |
| Total | 10,454 (95.0%) | 555 (5.0%) |
Health Insurance Coverage by Citizenship Status in Waynesboro borough
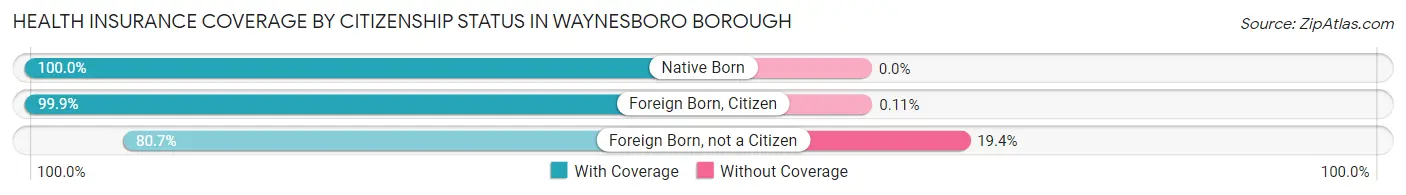
| Citizenship Status | With Coverage | Without Coverage |
| Native Born | 598 (100.0%) | 0 (0.0%) |
| Foreign Born, Citizen | 2,643 (99.9%) | 3 (0.1%) |
| Foreign Born, not a Citizen | 600 (80.6%) | 144 (19.4%) |
Health Insurance Coverage by Household Income in Waynesboro borough
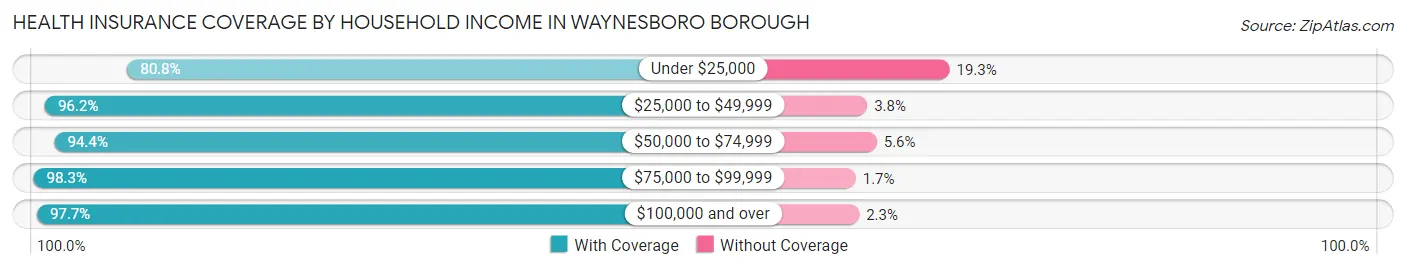
| Household Income | With Coverage | Without Coverage |
| Under $25,000 | 881 (80.7%) | 210 (19.3%) |
| $25,000 to $49,999 | 2,816 (96.2%) | 112 (3.8%) |
| $50,000 to $74,999 | 2,435 (94.4%) | 145 (5.6%) |
| $75,000 to $99,999 | 2,098 (98.3%) | 36 (1.7%) |
| $100,000 and over | 2,191 (97.7%) | 52 (2.3%) |
Public vs Private Health Insurance Coverage by Age in Waynesboro borough
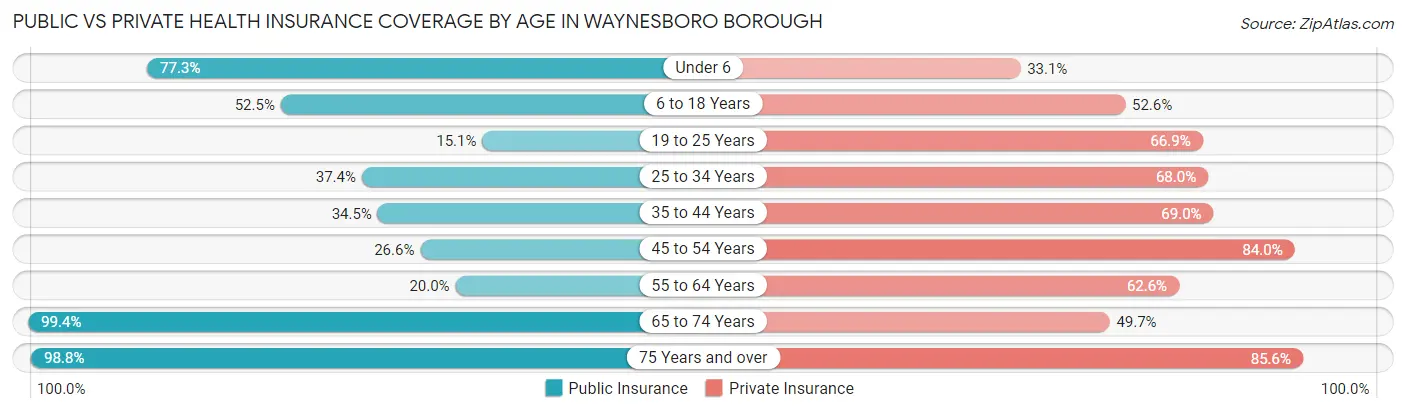
| Age Bracket | Public Insurance | Private Insurance |
| Under 6 | 462 (77.3%) | 198 (33.1%) |
| 6 to 18 Years | 1,388 (52.5%) | 1,391 (52.6%) |
| 19 to 25 Years | 112 (15.0%) | 498 (66.9%) |
| 25 to 34 Years | 404 (37.4%) | 734 (68.0%) |
| 35 to 44 Years | 643 (34.5%) | 1,287 (69.0%) |
| 45 to 54 Years | 336 (26.6%) | 1,063 (84.0%) |
| 55 to 64 Years | 243 (20.0%) | 759 (62.6%) |
| 65 to 74 Years | 926 (99.4%) | 463 (49.7%) |
| 75 Years and over | 657 (98.8%) | 569 (85.6%) |
| Total | 5,171 (47.0%) | 6,962 (63.2%) |
Disability Status by Sex by Age in Waynesboro borough
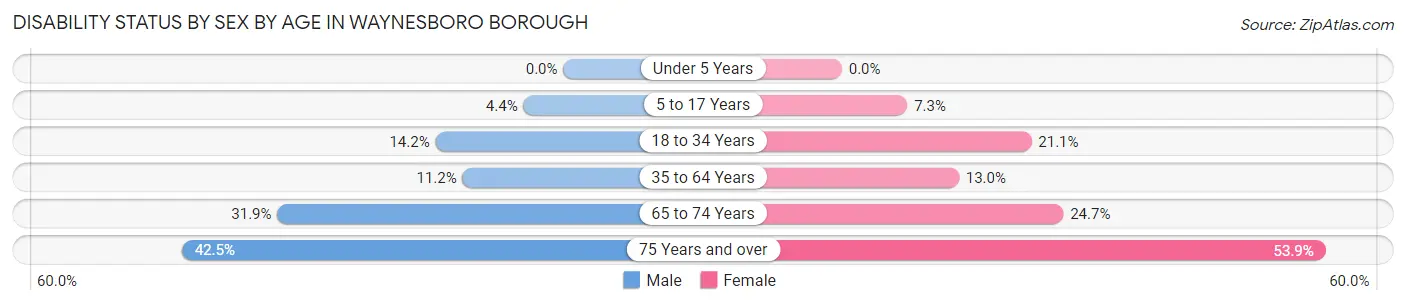
| Age Bracket | Male | Female |
| Under 5 Years | 0 (0.0%) | 0 (0.0%) |
| 5 to 17 Years | 61 (4.4%) | 95 (7.3%) |
| 18 to 34 Years | 142 (14.2%) | 198 (21.1%) |
| 35 to 64 Years | 225 (11.2%) | 305 (13.0%) |
| 65 to 74 Years | 107 (31.9%) | 147 (24.7%) |
| 75 Years and over | 102 (42.5%) | 229 (53.9%) |
Disability Class by Sex by Age in Waynesboro borough
Disability Class: Hearing Difficulty
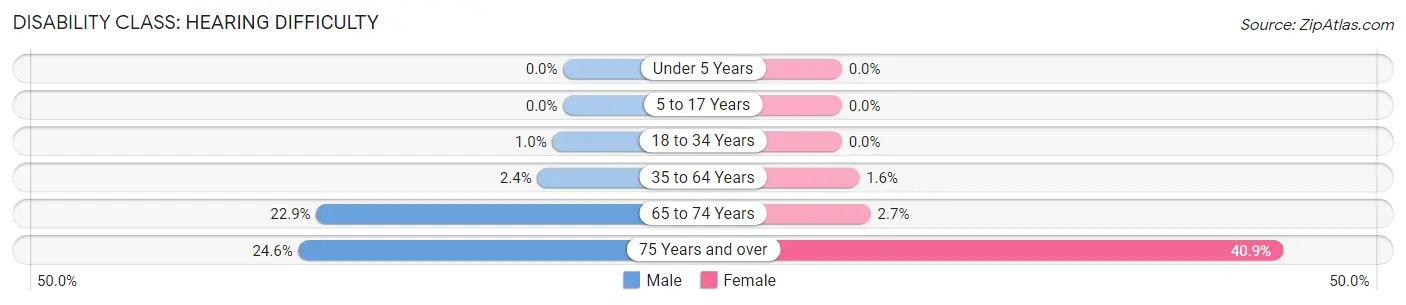
| Age Bracket | Male | Female |
| Under 5 Years | 0 (0.0%) | 0 (0.0%) |
| 5 to 17 Years | 0 (0.0%) | 0 (0.0%) |
| 18 to 34 Years | 10 (1.0%) | 0 (0.0%) |
| 35 to 64 Years | 48 (2.4%) | 38 (1.6%) |
| 65 to 74 Years | 77 (22.9%) | 16 (2.7%) |
| 75 Years and over | 59 (24.6%) | 174 (40.9%) |
Disability Class: Vision Difficulty
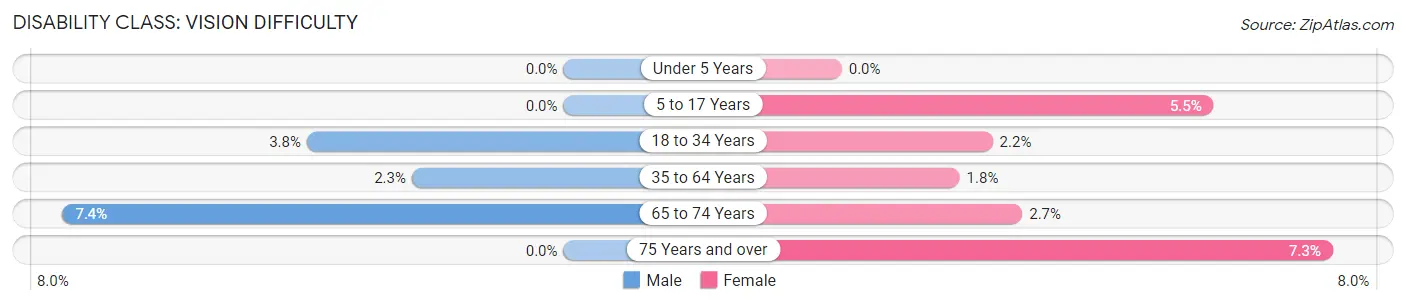
| Age Bracket | Male | Female |
| Under 5 Years | 0 (0.0%) | 0 (0.0%) |
| 5 to 17 Years | 0 (0.0%) | 72 (5.5%) |
| 18 to 34 Years | 38 (3.8%) | 21 (2.2%) |
| 35 to 64 Years | 45 (2.2%) | 41 (1.8%) |
| 65 to 74 Years | 25 (7.4%) | 16 (2.7%) |
| 75 Years and over | 0 (0.0%) | 31 (7.3%) |
Disability Class: Cognitive Difficulty
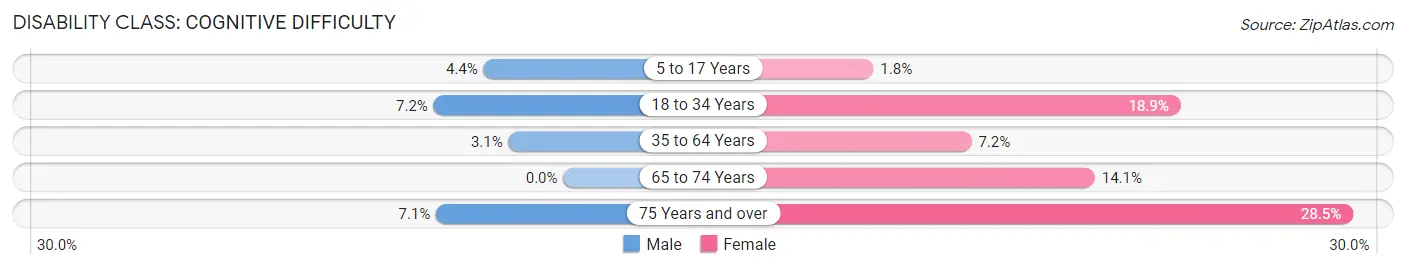
| Age Bracket | Male | Female |
| 5 to 17 Years | 61 (4.4%) | 23 (1.8%) |
| 18 to 34 Years | 72 (7.2%) | 177 (18.9%) |
| 35 to 64 Years | 61 (3.0%) | 169 (7.2%) |
| 65 to 74 Years | 0 (0.0%) | 84 (14.1%) |
| 75 Years and over | 17 (7.1%) | 121 (28.5%) |
Disability Class: Ambulatory Difficulty
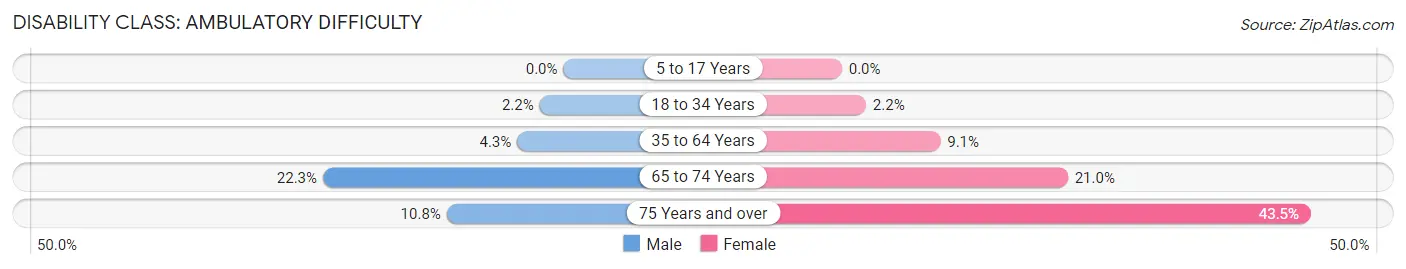
| Age Bracket | Male | Female |
| 5 to 17 Years | 0 (0.0%) | 0 (0.0%) |
| 18 to 34 Years | 22 (2.2%) | 21 (2.2%) |
| 35 to 64 Years | 86 (4.3%) | 214 (9.1%) |
| 65 to 74 Years | 75 (22.3%) | 125 (21.0%) |
| 75 Years and over | 26 (10.8%) | 185 (43.5%) |
Disability Class: Self-Care Difficulty
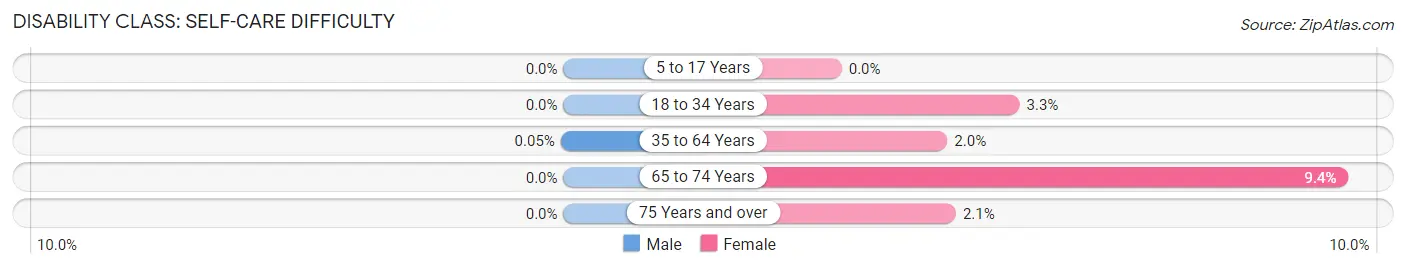
| Age Bracket | Male | Female |
| 5 to 17 Years | 0 (0.0%) | 0 (0.0%) |
| 18 to 34 Years | 0 (0.0%) | 31 (3.3%) |
| 35 to 64 Years | 1 (0.1%) | 46 (2.0%) |
| 65 to 74 Years | 0 (0.0%) | 56 (9.4%) |
| 75 Years and over | 0 (0.0%) | 9 (2.1%) |
Technology Access in Waynesboro borough
Computing Device Access in Waynesboro borough
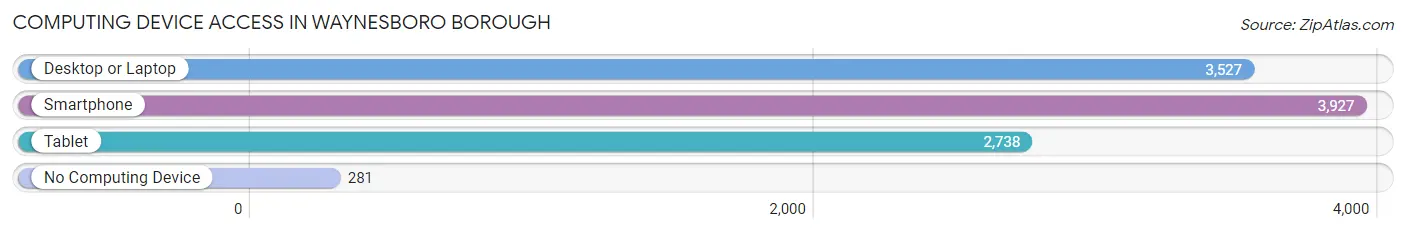
| Device Type | # Households | % Households |
| Desktop or Laptop | 3,527 | 78.2% |
| Smartphone | 3,927 | 87.1% |
| Tablet | 2,738 | 60.7% |
| No Computing Device | 281 | 6.2% |
| Total | 4,511 | 100.0% |
Internet Access in Waynesboro borough
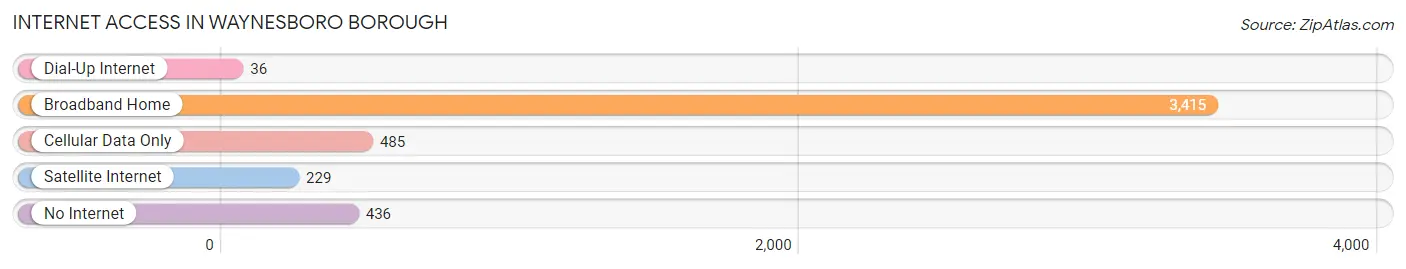
| Internet Type | # Households | % Households |
| Dial-Up Internet | 36 | 0.8% |
| Broadband Home | 3,415 | 75.7% |
| Cellular Data Only | 485 | 10.7% |
| Satellite Internet | 229 | 5.1% |
| No Internet | 436 | 9.7% |
| Total | 4,511 | 100.0% |
Waynesboro borough Summary
Waynesboro Borough is a borough located in Franklin County, Pennsylvania, United States. The population was 10,568 at the 2010 census. It is the county seat of Franklin County. Waynesboro is part of the Chambersburg-Waynesboro Metropolitan Statistical Area, which is part of the larger Harrisburg-York-Lebanon, PA Combined Statistical Area.
History
The area that is now Waynesboro was first settled in 1750 by William Wallace. The town was named after General Anthony Wayne, who was a hero of the American Revolution. The town was incorporated in 1831.
In the 19th century, Waynesboro was an important center for the production of iron and steel. The Waynesboro Iron Works was established in 1837 and was one of the largest iron works in the country. The iron works closed in 1891, but the town continued to be an important industrial center.
In the 20th century, Waynesboro became a center for the production of paper products. The Waynesboro Paper Mill was established in 1906 and was one of the largest paper mills in the country. The paper mill closed in 2002, but the town continues to be an important industrial center.
Geography
Waynesboro is located at 39°45'45" North, 77°32'45" West (39.7625, -77.5458). According to the United States Census Bureau, the borough has a total area of 2.2 square miles (5.7 km2), all of it land.
Economy
Waynesboro is an important industrial center in Franklin County. The town is home to several manufacturing companies, including:
Waynesboro Plastics which produces plastic products for the automotive and medical industries
• Waynesboro Machine Works, which produces machine parts for the automotive and aerospace industries.
Waynesboro Foundry which produces castings for the automotive and industrial markets
Waynesboro Steel which produces steel products for the automotive and industrial markets
Waynesboro Paper Mill which produces paper products for the printing and packaging industries
Demographics
As of the census of 2010, there were 10,568 people, 4,541 households, and 2,717 families residing in the borough. The population density was 4,741.7 people per square mile (1,837.2/km2). There were 4,945 housing units at an average density of 2,223.2 per square mile (857.2/km2). The racial makeup of the borough was 94.2% White, 2.3% African American, 0.2% Native American, 0.7% Asian, 0.1% Pacific Islander, 0.9% from other races, and 1.6% from two or more races. Hispanic or Latino of any race were 2.7% of the population.
There were 4,541 households, out of which 28.2% had children under the age of 18 living with them, 41.2% were married couples living together, 14.7% had a female householder with no husband present, and 39.3% were non-families. 33.2% of all households were made up of individuals, and 14.7% had someone living alone who was 65 years of age or older. The average household size was 2.30 and the average family size was 2.90.
In the borough the population was spread out, with 23.2% under the age of 18, 8.2% from 18 to 24, 28.7% from 25 to 44, 22.3% from 45 to 64, and 17.6% who were 65 years of age or older. The median age was 38 years. For every 100 females there were 88.3 males. For every 100 females age 18 and over, there were 84.2 males.
The median income for a household in the borough was $35,921, and the median income for a family was $45,945. Males had a median income of $32,813 versus $23,846 for females. The per capita income for the borough was $19,845. About 8.2% of families and 10.7% of the population were below the poverty line, including 15.2% of those under age 18 and 8.2% of those age 65 or over.
Common Questions
What is Per Capita Income in Waynesboro borough?
Per Capita income in Waynesboro borough is $27,339.
What is the Median Family Income in Waynesboro borough?
Median Family Income in Waynesboro borough is $65,657.
What is the Median Household income in Waynesboro borough?
Median Household Income in Waynesboro borough is $56,413.
What is Income or Wage Gap in Waynesboro borough?
Income or Wage Gap in Waynesboro borough is 0.8%.
Women in Waynesboro borough earn 99.2 cents for every dollar earned by a man.
What is Family Income Deficit in Waynesboro borough?
Family Income Deficit in Waynesboro borough is $11,217.
Families that are below poverty line in Waynesboro borough earn $11,217 less on average than the poverty threshold level.
What is Inequality or Gini Index in Waynesboro borough?
Inequality or Gini Index in Waynesboro borough is 0.37.
What is the Total Population of Waynesboro borough?
Total Population of Waynesboro borough is 11,009.
What is the Total Male Population of Waynesboro borough?
Total Male Population of Waynesboro borough is 5,141.
What is the Total Female Population of Waynesboro borough?
Total Female Population of Waynesboro borough is 5,868.
What is the Ratio of Males per 100 Females in Waynesboro borough?
There are 87.61 Males per 100 Females in Waynesboro borough.
What is the Ratio of Females per 100 Males in Waynesboro borough?
There are 114.14 Females per 100 Males in Waynesboro borough.
What is the Median Population Age in Waynesboro borough?
Median Population Age in Waynesboro borough is 36.8 Years.
What is the Average Family Size in Waynesboro borough
Average Family Size in Waynesboro borough is 3.1 People.
What is the Average Household Size in Waynesboro borough
Average Household Size in Waynesboro borough is 2.4 People.
How Large is the Labor Force in Waynesboro borough?
There are 5,449 People in the Labor Forcein in Waynesboro borough.
What is the Percentage of People in the Labor Force in Waynesboro borough?
65.3% of People are in the Labor Force in Waynesboro borough.
What is the Unemployment Rate in Waynesboro borough?
Unemployment Rate in Waynesboro borough is 3.4%.