Syosset, NY Map & Demographics
Syosset Map
Syosset Overview
$74,045
PER CAPITA INCOME
$209,844
AVG FAMILY INCOME
$180,297
AVG HOUSEHOLD INCOME
39.7%
WAGE / INCOME GAP [ % ]
60.3¢/ $1
WAGE / INCOME GAP [ $ ]
$7,979
FAMILY INCOME DEFICIT
0.45
INEQUALITY / GINI INDEX
18,807
TOTAL POPULATION
9,508
MALE POPULATION
9,299
FEMALE POPULATION
102.25
MALES / 100 FEMALES
97.80
FEMALES / 100 MALES
42.9
MEDIAN AGE
3.4
AVG FAMILY SIZE
3.0
AVG HOUSEHOLD SIZE
9,193
LABOR FORCE [ PEOPLE ]
63.7%
PERCENT IN LABOR FORCE
3.9%
UNEMPLOYMENT RATE
Syosset Zip Codes
Syosset Area Codes
Income in Syosset
Income Overview in Syosset
Per Capita Income in Syosset is $74,045, while median incomes of families and households are $209,844 and $180,297 respectively.
| Characteristic | Number | Measure |
| Per Capita Income | 18,807 | $74,045 |
| Median Family Income | 5,183 | $209,844 |
| Mean Family Income | 5,183 | $247,994 |
| Median Household Income | 6,105 | $180,297 |
| Mean Household Income | 6,105 | $223,508 |
| Income Deficit | 5,183 | $7,979 |
| Wage / Income Gap (%) | 18,807 | 39.71% |
| Wage / Income Gap ($) | 18,807 | 60.29¢ per $1 |
| Gini / Inequality Index | 18,807 | 0.45 |
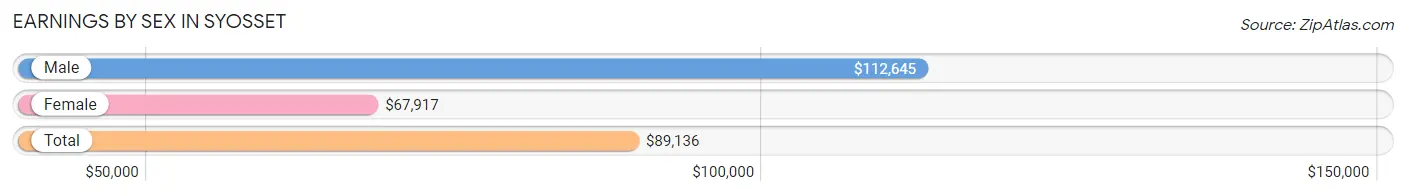
Earnings by Sex in Syosset
Average Earnings in Syosset are $89,136, $112,645 for men and $67,917 for women, a difference of 39.7%.
| Sex | Number | Average Earnings |
| Male | 5,190 (54.3%) | $112,645 |
| Female | 4,370 (45.7%) | $67,917 |
| Total | 9,560 (100.0%) | $89,136 |
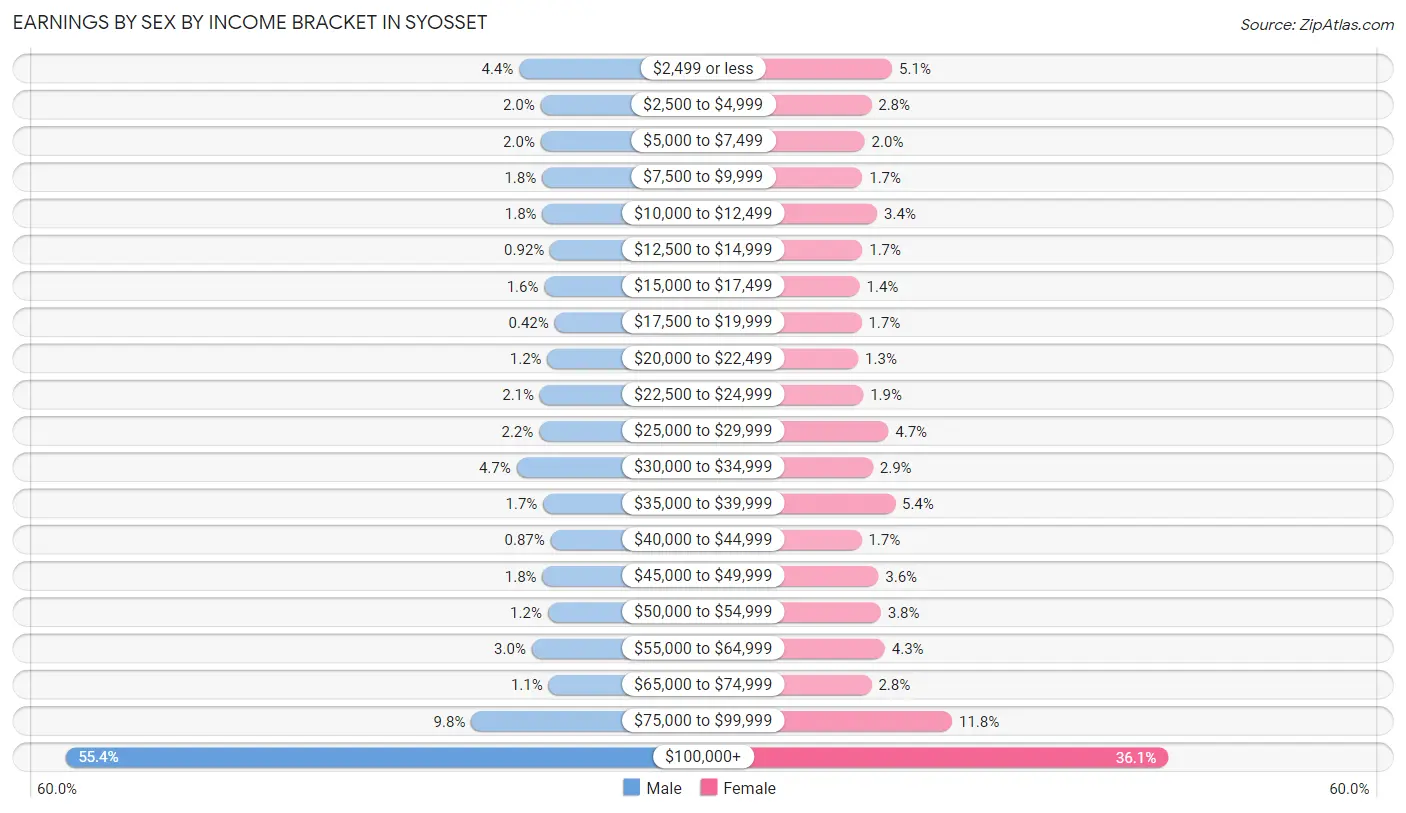
Earnings by Sex by Income Bracket in Syosset
The most common earnings brackets in Syosset are $100,000+ for men (2,877 | 55.4%) and $100,000+ for women (1,578 | 36.1%).
| Income | Male | Female |
| $2,499 or less | 229 (4.4%) | 223 (5.1%) |
| $2,500 to $4,999 | 104 (2.0%) | 120 (2.8%) |
| $5,000 to $7,499 | 103 (2.0%) | 88 (2.0%) |
| $7,500 to $9,999 | 95 (1.8%) | 76 (1.7%) |
| $10,000 to $12,499 | 93 (1.8%) | 149 (3.4%) |
| $12,500 to $14,999 | 48 (0.9%) | 76 (1.7%) |
| $15,000 to $17,499 | 82 (1.6%) | 63 (1.4%) |
| $17,500 to $19,999 | 22 (0.4%) | 72 (1.7%) |
| $20,000 to $22,499 | 64 (1.2%) | 56 (1.3%) |
| $22,500 to $24,999 | 108 (2.1%) | 81 (1.8%) |
| $25,000 to $29,999 | 112 (2.2%) | 204 (4.7%) |
| $30,000 to $34,999 | 244 (4.7%) | 128 (2.9%) |
| $35,000 to $39,999 | 89 (1.7%) | 237 (5.4%) |
| $40,000 to $44,999 | 45 (0.9%) | 72 (1.7%) |
| $45,000 to $49,999 | 93 (1.8%) | 155 (3.5%) |
| $50,000 to $54,999 | 62 (1.2%) | 167 (3.8%) |
| $55,000 to $64,999 | 155 (3.0%) | 187 (4.3%) |
| $65,000 to $74,999 | 57 (1.1%) | 121 (2.8%) |
| $75,000 to $99,999 | 508 (9.8%) | 517 (11.8%) |
| $100,000+ | 2,877 (55.4%) | 1,578 (36.1%) |
| Total | 5,190 (100.0%) | 4,370 (100.0%) |
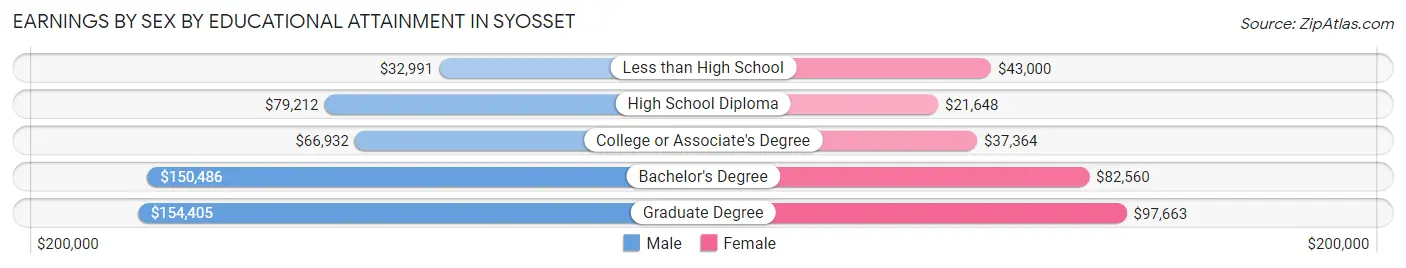
Earnings by Sex by Educational Attainment in Syosset
Average earnings in Syosset are $119,514 for men and $78,750 for women, a difference of 34.1%. Men with an educational attainment of graduate degree enjoy the highest average annual earnings of $154,405, while those with less than high school education earn the least with $32,991. Women with an educational attainment of graduate degree earn the most with the average annual earnings of $97,663, while those with high school diploma education have the smallest earnings of $21,648.
| Educational Attainment | Male Income | Female Income |
| Less than High School | $32,991 | $43,000 |
| High School Diploma | $79,212 | $21,648 |
| College or Associate's Degree | $66,932 | $37,364 |
| Bachelor's Degree | $150,486 | $82,560 |
| Graduate Degree | $154,405 | $97,663 |
| Total | $119,514 | $78,750 |
Family Income in Syosset
Family Income Brackets in Syosset
According to the Syosset family income data, there are 2,674 families falling into the $200,000+ income range, which is the most common income bracket and makes up 51.6% of all families. Conversely, the less than $10,000 income bracket is the least frequent group with only 67 families (1.3%) belonging to this category.
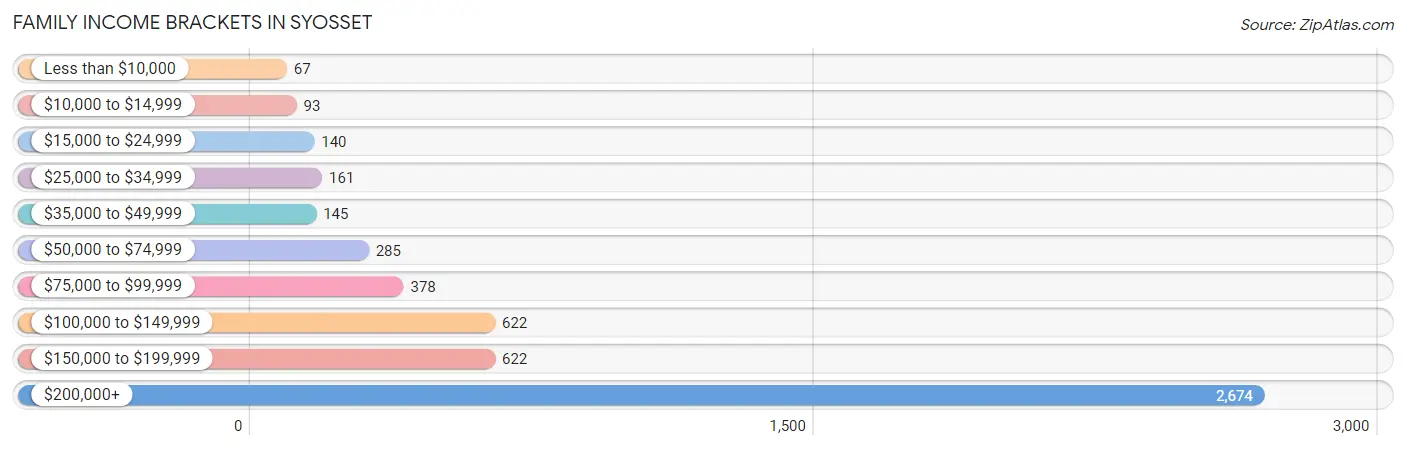
| Income Bracket | # Families | % Families |
| Less than $10,000 | 67 | 1.3% |
| $10,000 to $14,999 | 93 | 1.8% |
| $15,000 to $24,999 | 140 | 2.7% |
| $25,000 to $34,999 | 161 | 3.1% |
| $35,000 to $49,999 | 145 | 2.8% |
| $50,000 to $74,999 | 285 | 5.5% |
| $75,000 to $99,999 | 378 | 7.3% |
| $100,000 to $149,999 | 622 | 12.0% |
| $150,000 to $199,999 | 622 | 12.0% |
| $200,000+ | 2,674 | 51.6% |
Family Income by Famaliy Size in Syosset
7+ person families (38 | 0.7%) account for the highest median family income in Syosset with $250,001 per family, while 3-person families (1,395 | 26.9%) have the highest median income of $78,750 per family member.
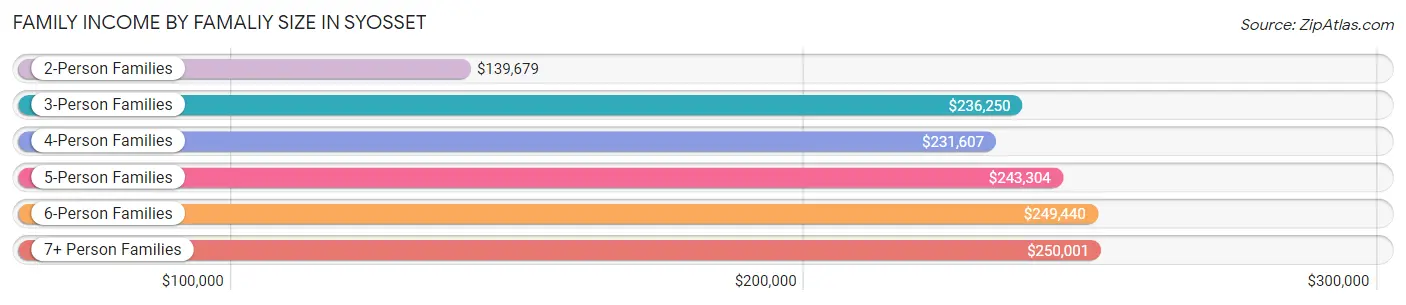
| Income Bracket | # Families | Median Income |
| 2-Person Families | 1,579 (30.5%) | $139,679 |
| 3-Person Families | 1,395 (26.9%) | $236,250 |
| 4-Person Families | 1,515 (29.2%) | $231,607 |
| 5-Person Families | 533 (10.3%) | $243,304 |
| 6-Person Families | 123 (2.4%) | $249,440 |
| 7+ Person Families | 38 (0.7%) | $250,001 |
| Total | 5,183 (100.0%) | $209,844 |
Family Income by Number of Earners in Syosset
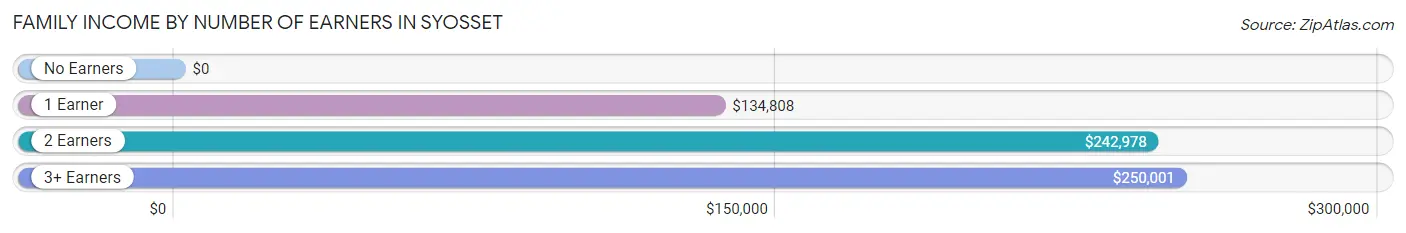
| Number of Earners | # Families | Median Income |
| No Earners | 592 (11.4%) | $0 |
| 1 Earner | 1,392 (26.9%) | $134,808 |
| 2 Earners | 2,590 (50.0%) | $242,978 |
| 3+ Earners | 609 (11.7%) | $250,001 |
| Total | 5,183 (100.0%) | $209,844 |
Household Income in Syosset
Household Income Brackets in Syosset
With 2,772 households falling in the category, the $200,000+ income range is the most frequent in Syosset, accounting for 45.4% of all households. In contrast, only 153 households (2.5%) fall into the $10,000 to $14,999 income bracket, making it the least populous group.
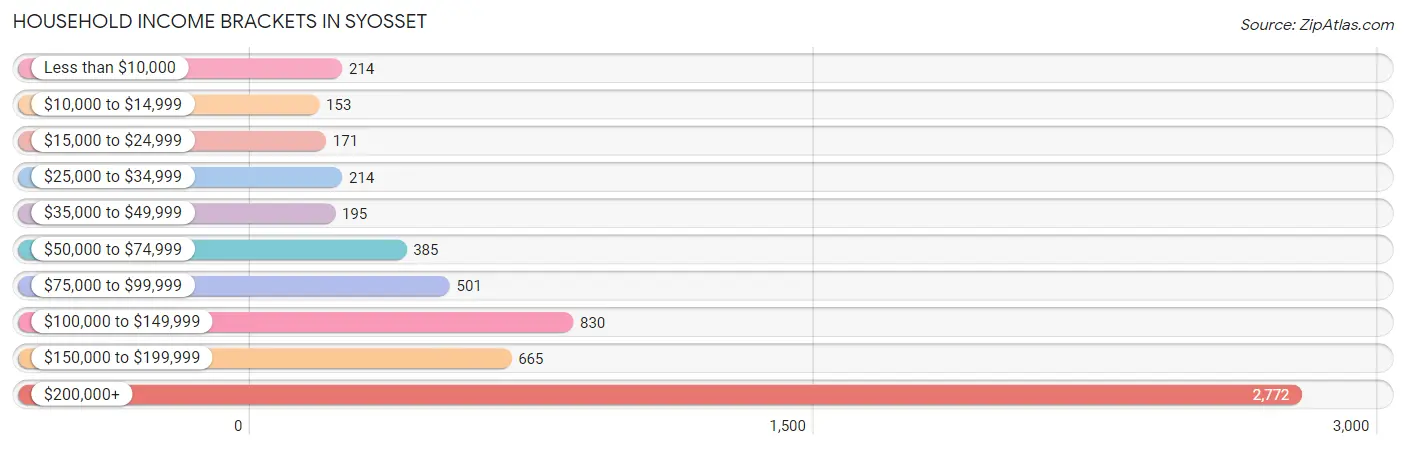
| Income Bracket | # Households | % Households |
| Less than $10,000 | 214 | 3.5% |
| $10,000 to $14,999 | 153 | 2.5% |
| $15,000 to $24,999 | 171 | 2.8% |
| $25,000 to $34,999 | 214 | 3.5% |
| $35,000 to $49,999 | 195 | 3.2% |
| $50,000 to $74,999 | 385 | 6.3% |
| $75,000 to $99,999 | 501 | 8.2% |
| $100,000 to $149,999 | 830 | 13.6% |
| $150,000 to $199,999 | 665 | 10.9% |
| $200,000+ | 2,772 | 45.4% |
Household Income by Householder Age in Syosset
The median household income in Syosset is $180,297, with the highest median household income of $232,083 found in the 45 to 64 years age bracket for the primary householder. A total of 3,028 households (49.6%) fall into this category.
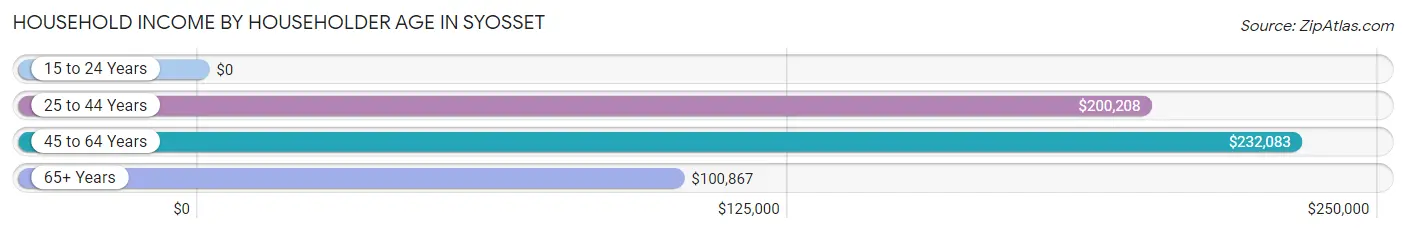
| Income Bracket | # Households | Median Income |
| 15 to 24 Years | 0 (0.0%) | $0 |
| 25 to 44 Years | 1,405 (23.0%) | $200,208 |
| 45 to 64 Years | 3,028 (49.6%) | $232,083 |
| 65+ Years | 1,672 (27.4%) | $100,867 |
| Total | 6,105 (100.0%) | $180,297 |
Poverty in Syosset
Income Below Poverty by Sex and Age in Syosset
With 3.7% poverty level for males and 6.0% for females among the residents of Syosset, 75 year old and over males and 75 year old and over females are the most vulnerable to poverty, with 101 males (20.1%) and 78 females (15.4%) in their respective age groups living below the poverty level.
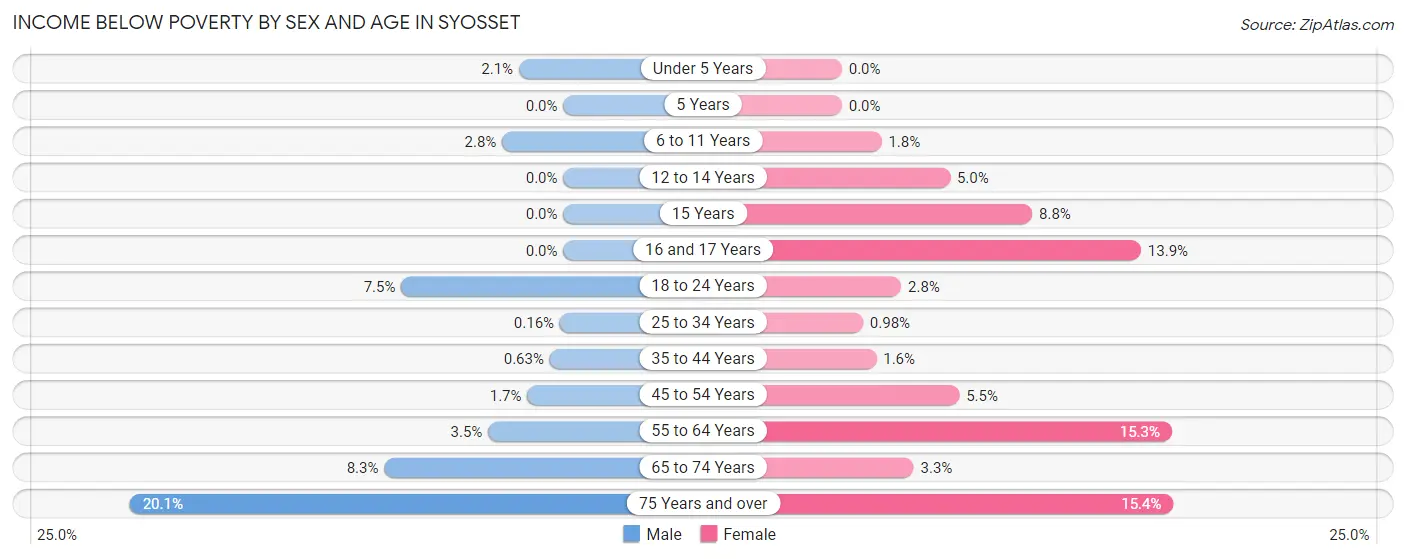
| Age Bracket | Male | Female |
| Under 5 Years | 9 (2.1%) | 0 (0.0%) |
| 5 Years | 0 (0.0%) | 0 (0.0%) |
| 6 to 11 Years | 27 (2.8%) | 14 (1.8%) |
| 12 to 14 Years | 0 (0.0%) | 27 (5.0%) |
| 15 Years | 0 (0.0%) | 28 (8.8%) |
| 16 and 17 Years | 0 (0.0%) | 54 (13.9%) |
| 18 to 24 Years | 55 (7.5%) | 10 (2.8%) |
| 25 to 34 Years | 1 (0.2%) | 8 (1.0%) |
| 35 to 44 Years | 7 (0.6%) | 19 (1.6%) |
| 45 to 54 Years | 28 (1.7%) | 100 (5.4%) |
| 55 to 64 Years | 37 (3.5%) | 184 (15.3%) |
| 65 to 74 Years | 89 (8.3%) | 32 (3.3%) |
| 75 Years and over | 101 (20.1%) | 78 (15.4%) |
| Total | 354 (3.7%) | 554 (6.0%) |
Income Above Poverty by Sex and Age in Syosset
According to the poverty statistics in Syosset, males aged 5 years and females aged under 5 years are the age groups that are most secure financially, with 100.0% of males and 100.0% of females in these age groups living above the poverty line.
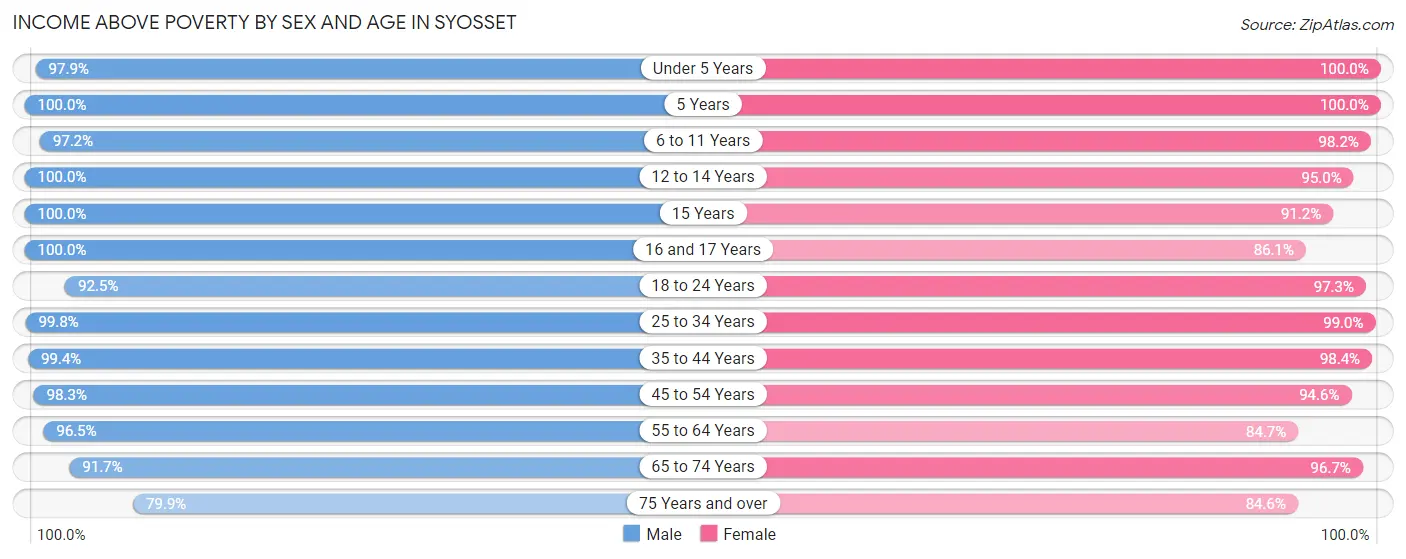
| Age Bracket | Male | Female |
| Under 5 Years | 427 (97.9%) | 183 (100.0%) |
| 5 Years | 22 (100.0%) | 215 (100.0%) |
| 6 to 11 Years | 923 (97.2%) | 746 (98.2%) |
| 12 to 14 Years | 782 (100.0%) | 511 (95.0%) |
| 15 Years | 119 (100.0%) | 289 (91.2%) |
| 16 and 17 Years | 372 (100.0%) | 335 (86.1%) |
| 18 to 24 Years | 676 (92.5%) | 354 (97.3%) |
| 25 to 34 Years | 606 (99.8%) | 812 (99.0%) |
| 35 to 44 Years | 1,107 (99.4%) | 1,168 (98.4%) |
| 45 to 54 Years | 1,648 (98.3%) | 1,736 (94.6%) |
| 55 to 64 Years | 1,023 (96.5%) | 1,018 (84.7%) |
| 65 to 74 Years | 982 (91.7%) | 929 (96.7%) |
| 75 Years and over | 401 (79.9%) | 429 (84.6%) |
| Total | 9,088 (96.3%) | 8,725 (94.0%) |
Income Below Poverty Among Married-Couple Families in Syosset
The poverty statistics for married-couple families in Syosset show that 3.6% or 168 of the total 4,695 families live below the poverty line. Families with 3 or 4 children have the highest poverty rate of 6.9%, comprising of 29 families. On the other hand, families with 1 or 2 children have the lowest poverty rate of 0.6%, which includes 13 families.
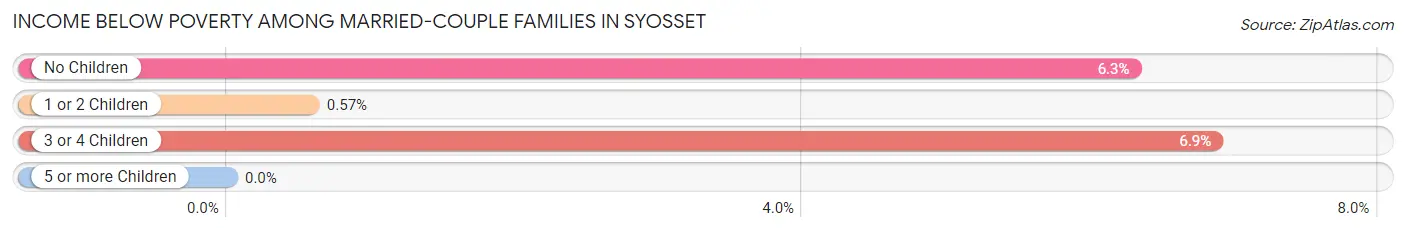
| Children | Above Poverty | Below Poverty |
| No Children | 1,878 (93.7%) | 126 (6.3%) |
| 1 or 2 Children | 2,255 (99.4%) | 13 (0.6%) |
| 3 or 4 Children | 394 (93.1%) | 29 (6.9%) |
| 5 or more Children | 0 (0.0%) | 0 (0.0%) |
| Total | 4,527 (96.4%) | 168 (3.6%) |
Income Below Poverty Among Single-Parent Households in Syosset
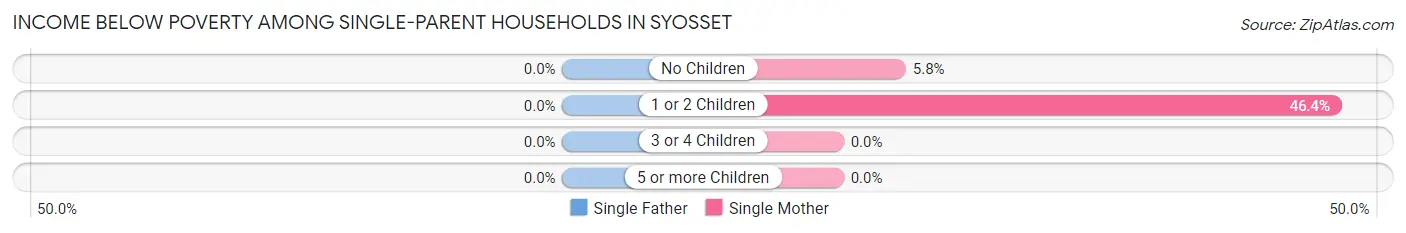
| Children | Single Father | Single Mother |
| No Children | 0 (0.0%) | 11 (5.8%) |
| 1 or 2 Children | 0 (0.0%) | 45 (46.4%) |
| 3 or 4 Children | 0 (0.0%) | 0 (0.0%) |
| 5 or more Children | 0 (0.0%) | 0 (0.0%) |
| Total | 0 (0.0%) | 56 (19.5%) |
Income Below Poverty Among Married-Couple vs Single-Parent Households in Syosset
The poverty data for Syosset shows that 168 of the married-couple family households (3.6%) and 56 of the single-parent households (11.5%) are living below the poverty level. Within the married-couple family households, those with 3 or 4 children have the highest poverty rate, with 29 households (6.9%) falling below the poverty line. Among the single-parent households, those with 1 or 2 children have the highest poverty rate, with 45 household (22.2%) living below poverty.
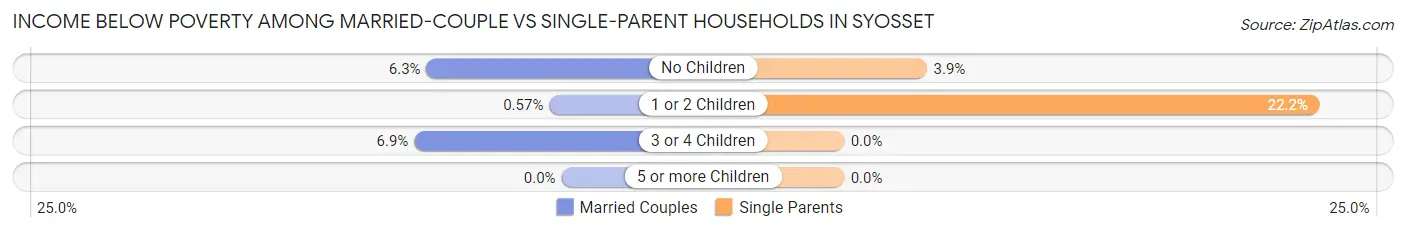
| Children | Married-Couple Families | Single-Parent Households |
| No Children | 126 (6.3%) | 11 (3.9%) |
| 1 or 2 Children | 13 (0.6%) | 45 (22.2%) |
| 3 or 4 Children | 29 (6.9%) | 0 (0.0%) |
| 5 or more Children | 0 (0.0%) | 0 (0.0%) |
| Total | 168 (3.6%) | 56 (11.5%) |
Race in Syosset
The most populous races in Syosset are White / Caucasian (11,787 | 62.7%), Asian (5,910 | 31.4%), and Hispanic or Latino (772 | 4.1%).
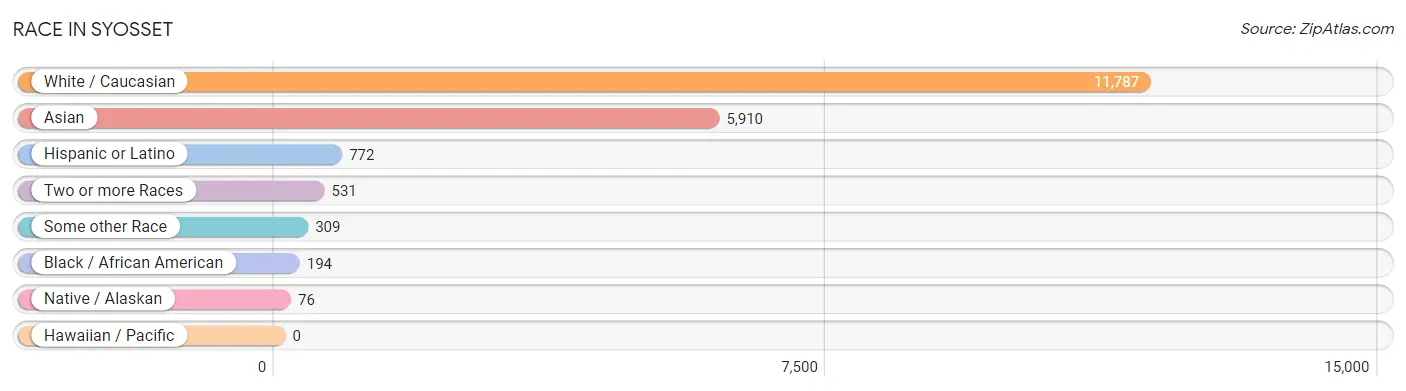
| Race | # Population | % Population |
| Asian | 5,910 | 31.4% |
| Black / African American | 194 | 1.0% |
| Hawaiian / Pacific | 0 | 0.0% |
| Hispanic or Latino | 772 | 4.1% |
| Native / Alaskan | 76 | 0.4% |
| White / Caucasian | 11,787 | 62.7% |
| Two or more Races | 531 | 2.8% |
| Some other Race | 309 | 1.6% |
| Total | 18,807 | 100.0% |
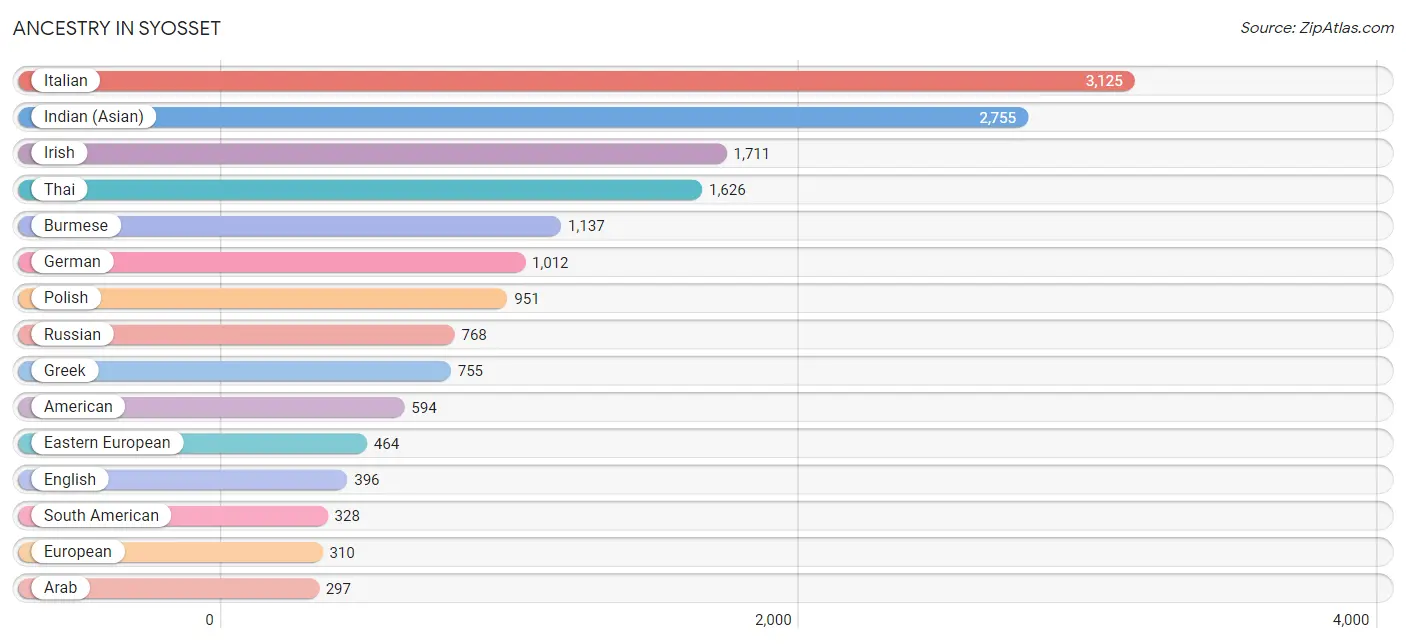
Ancestry in Syosset
The most populous ancestries reported in Syosset are Italian (3,125 | 16.6%), Indian (Asian) (2,755 | 14.6%), Irish (1,711 | 9.1%), Thai (1,626 | 8.6%), and Burmese (1,137 | 6.0%), together accounting for 55.1% of all Syosset residents.
| Ancestry | # Population | % Population |
| American | 594 | 3.2% |
| Arab | 297 | 1.6% |
| Armenian | 72 | 0.4% |
| Australian | 18 | 0.1% |
| Austrian | 165 | 0.9% |
| Belgian | 68 | 0.4% |
| Bhutanese | 79 | 0.4% |
| British | 27 | 0.1% |
| Burmese | 1,137 | 6.0% |
| Canadian | 86 | 0.5% |
| Central American | 123 | 0.6% |
| Chilean | 22 | 0.1% |
| Colombian | 135 | 0.7% |
| Costa Rican | 39 | 0.2% |
| Croatian | 90 | 0.5% |
| Cuban | 70 | 0.4% |
| Czech | 51 | 0.3% |
| Danish | 11 | 0.1% |
| Dominican | 83 | 0.4% |
| Dutch | 14 | 0.1% |
| Eastern European | 464 | 2.5% |
| Egyptian | 179 | 0.9% |
| English | 396 | 2.1% |
| Estonian | 10 | 0.1% |
| European | 310 | 1.7% |
| Filipino | 50 | 0.3% |
| Finnish | 11 | 0.1% |
| French | 64 | 0.3% |
| French Canadian | 52 | 0.3% |
| German | 1,012 | 5.4% |
| Greek | 755 | 4.0% |
| Guatemalan | 6 | 0.0% |
| Honduran | 3 | 0.0% |
| Hungarian | 104 | 0.5% |
| Indian (Asian) | 2,755 | 14.6% |
| Iranian | 52 | 0.3% |
| Iraqi | 23 | 0.1% |
| Irish | 1,711 | 9.1% |
| Israeli | 27 | 0.1% |
| Italian | 3,125 | 16.6% |
| Jamaican | 34 | 0.2% |
| Korean | 42 | 0.2% |
| Lithuanian | 21 | 0.1% |
| Maltese | 9 | 0.1% |
| Mexican | 12 | 0.1% |
| Native Hawaiian | 6 | 0.0% |
| Navajo | 6 | 0.0% |
| Nigerian | 12 | 0.1% |
| Norwegian | 10 | 0.1% |
| Okinawan | 22 | 0.1% |
| Peruvian | 33 | 0.2% |
| Polish | 951 | 5.1% |
| Portuguese | 187 | 1.0% |
| Puerto Rican | 90 | 0.5% |
| Romanian | 67 | 0.4% |
| Russian | 768 | 4.1% |
| Salvadoran | 75 | 0.4% |
| Scotch-Irish | 51 | 0.3% |
| Scottish | 54 | 0.3% |
| Slavic | 45 | 0.2% |
| Slovak | 16 | 0.1% |
| South American | 328 | 1.7% |
| Spanish American | 10 | 0.1% |
| Spanish American Indian | 53 | 0.3% |
| Sri Lankan | 42 | 0.2% |
| Subsaharan African | 67 | 0.4% |
| Swedish | 24 | 0.1% |
| Swiss | 73 | 0.4% |
| Syrian | 42 | 0.2% |
| Thai | 1,626 | 8.6% |
| Turkish | 99 | 0.5% |
| Ukrainian | 70 | 0.4% |
| Uruguayan | 127 | 0.7% |
| Ute | 17 | 0.1% |
| Venezuelan | 11 | 0.1% |
| Vietnamese | 139 | 0.7% |
| West Indian | 47 | 0.3% | View All 77 Rows |
Immigrants in Syosset
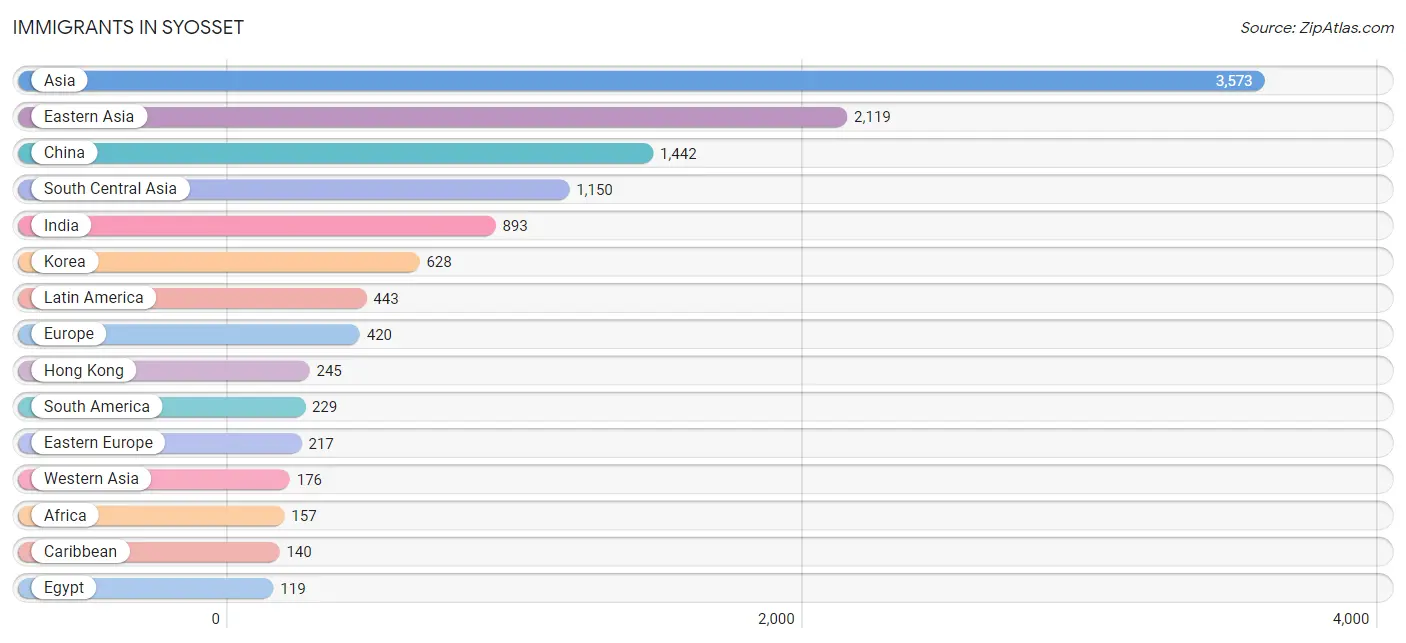
The most numerous immigrant groups reported in Syosset came from Asia (3,573 | 19.0%), Eastern Asia (2,119 | 11.3%), China (1,442 | 7.7%), South Central Asia (1,150 | 6.1%), and India (893 | 4.8%), together accounting for 48.8% of all Syosset residents.
| Immigration Origin | # Population | % Population |
| Afghanistan | 7 | 0.0% |
| Africa | 157 | 0.8% |
| Asia | 3,573 | 19.0% |
| Australia | 9 | 0.1% |
| Bangladesh | 92 | 0.5% |
| Bosnia and Herzegovina | 15 | 0.1% |
| Brazil | 39 | 0.2% |
| Canada | 84 | 0.4% |
| Caribbean | 140 | 0.7% |
| Central America | 74 | 0.4% |
| China | 1,442 | 7.7% |
| Colombia | 38 | 0.2% |
| Costa Rica | 14 | 0.1% |
| Croatia | 12 | 0.1% |
| Cuba | 35 | 0.2% |
| Czechoslovakia | 16 | 0.1% |
| Dominican Republic | 75 | 0.4% |
| Eastern Africa | 26 | 0.1% |
| Eastern Asia | 2,119 | 11.3% |
| Eastern Europe | 217 | 1.1% |
| Egypt | 119 | 0.6% |
| El Salvador | 47 | 0.3% |
| Europe | 420 | 2.2% |
| Greece | 82 | 0.4% |
| Guyana | 24 | 0.1% |
| Hong Kong | 245 | 1.3% |
| Hungary | 24 | 0.1% |
| India | 893 | 4.8% |
| Iran | 35 | 0.2% |
| Ireland | 20 | 0.1% |
| Israel | 10 | 0.1% |
| Italy | 36 | 0.2% |
| Jamaica | 21 | 0.1% |
| Japan | 49 | 0.3% |
| Korea | 628 | 3.3% |
| Kuwait | 8 | 0.0% |
| Latin America | 443 | 2.4% |
| Latvia | 15 | 0.1% |
| Lebanon | 8 | 0.0% |
| Malaysia | 27 | 0.1% |
| Nigeria | 12 | 0.1% |
| Northern Africa | 119 | 0.6% |
| Northern Europe | 31 | 0.2% |
| Oceania | 9 | 0.1% |
| Pakistan | 57 | 0.3% |
| Panama | 13 | 0.1% |
| Philippines | 34 | 0.2% |
| Poland | 32 | 0.2% |
| Romania | 13 | 0.1% |
| Russia | 48 | 0.3% |
| Saudi Arabia | 67 | 0.4% |
| Singapore | 10 | 0.1% |
| South America | 229 | 1.2% |
| South Central Asia | 1,150 | 6.1% |
| South Eastern Asia | 110 | 0.6% |
| Southern Europe | 118 | 0.6% |
| Syria | 19 | 0.1% |
| Taiwan | 103 | 0.5% |
| Trinidad and Tobago | 9 | 0.1% |
| Turkey | 39 | 0.2% |
| Ukraine | 32 | 0.2% |
| Uruguay | 109 | 0.6% |
| Uzbekistan | 66 | 0.4% |
| Venezuela | 19 | 0.1% |
| Vietnam | 39 | 0.2% |
| Western Africa | 12 | 0.1% |
| Western Asia | 176 | 0.9% | View All 67 Rows |
Sex and Age in Syosset
Sex and Age in Syosset
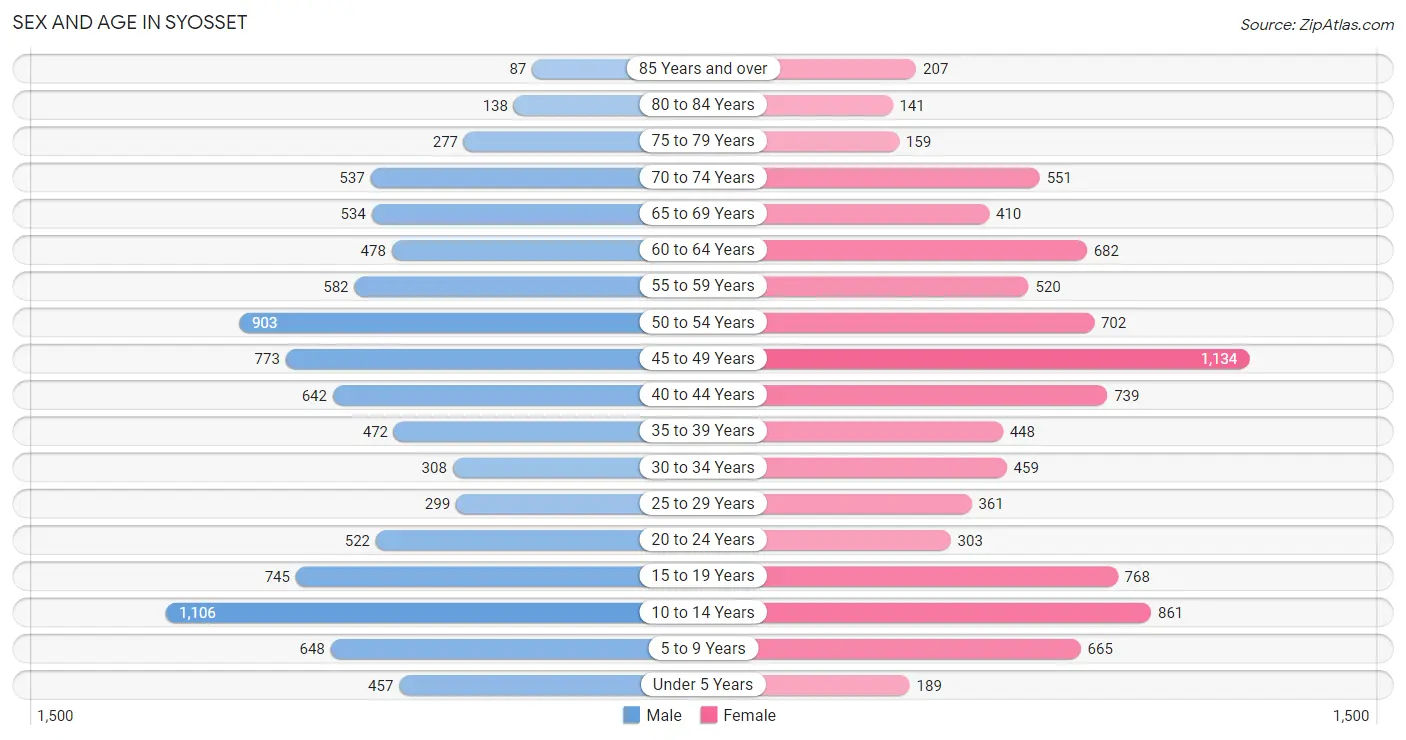
The most populous age groups in Syosset are 10 to 14 Years (1,106 | 11.6%) for men and 45 to 49 Years (1,134 | 12.2%) for women.
| Age Bracket | Male | Female |
| Under 5 Years | 457 (4.8%) | 189 (2.0%) |
| 5 to 9 Years | 648 (6.8%) | 665 (7.1%) |
| 10 to 14 Years | 1,106 (11.6%) | 861 (9.3%) |
| 15 to 19 Years | 745 (7.8%) | 768 (8.3%) |
| 20 to 24 Years | 522 (5.5%) | 303 (3.3%) |
| 25 to 29 Years | 299 (3.1%) | 361 (3.9%) |
| 30 to 34 Years | 308 (3.2%) | 459 (4.9%) |
| 35 to 39 Years | 472 (5.0%) | 448 (4.8%) |
| 40 to 44 Years | 642 (6.8%) | 739 (8.0%) |
| 45 to 49 Years | 773 (8.1%) | 1,134 (12.2%) |
| 50 to 54 Years | 903 (9.5%) | 702 (7.5%) |
| 55 to 59 Years | 582 (6.1%) | 520 (5.6%) |
| 60 to 64 Years | 478 (5.0%) | 682 (7.3%) |
| 65 to 69 Years | 534 (5.6%) | 410 (4.4%) |
| 70 to 74 Years | 537 (5.7%) | 551 (5.9%) |
| 75 to 79 Years | 277 (2.9%) | 159 (1.7%) |
| 80 to 84 Years | 138 (1.5%) | 141 (1.5%) |
| 85 Years and over | 87 (0.9%) | 207 (2.2%) |
| Total | 9,508 (100.0%) | 9,299 (100.0%) |
Families and Households in Syosset
Median Family Size in Syosset
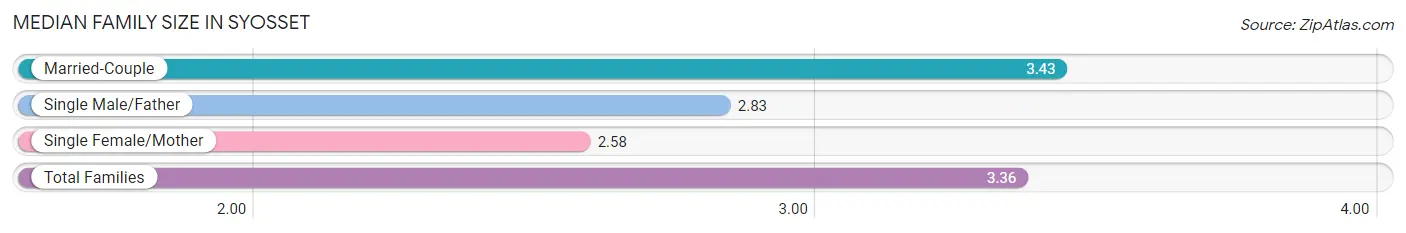
The median family size in Syosset is 3.36 persons per family, with married-couple families (4,695 | 90.6%) accounting for the largest median family size of 3.43 persons per family. On the other hand, single female/mother families (287 | 5.5%) represent the smallest median family size with 2.58 persons per family.
| Family Type | # Families | Family Size |
| Married-Couple | 4,695 (90.6%) | 3.43 |
| Single Male/Father | 201 (3.9%) | 2.83 |
| Single Female/Mother | 287 (5.5%) | 2.58 |
| Total Families | 5,183 (100.0%) | 3.36 |
Median Household Size in Syosset
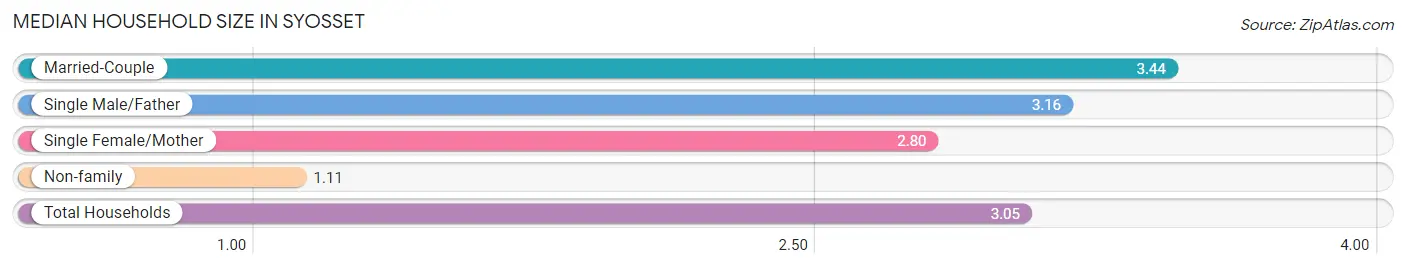
The median household size in Syosset is 3.05 persons per household, with married-couple households (4,695 | 76.9%) accounting for the largest median household size of 3.44 persons per household. non-family households (922 | 15.1%) represent the smallest median household size with 1.11 persons per household.
| Household Type | # Households | Household Size |
| Married-Couple | 4,695 (76.9%) | 3.44 |
| Single Male/Father | 201 (3.3%) | 3.16 |
| Single Female/Mother | 287 (4.7%) | 2.80 |
| Non-family | 922 (15.1%) | 1.11 |
| Total Households | 6,105 (100.0%) | 3.05 |
Household Size by Marriage Status in Syosset
Out of a total of 6,105 households in Syosset, 5,183 (84.9%) are family households, while 922 (15.1%) are nonfamily households. The most numerous type of family households are 4-person households, comprising 1,504, and the most common type of nonfamily households are 1-person households, comprising 860.
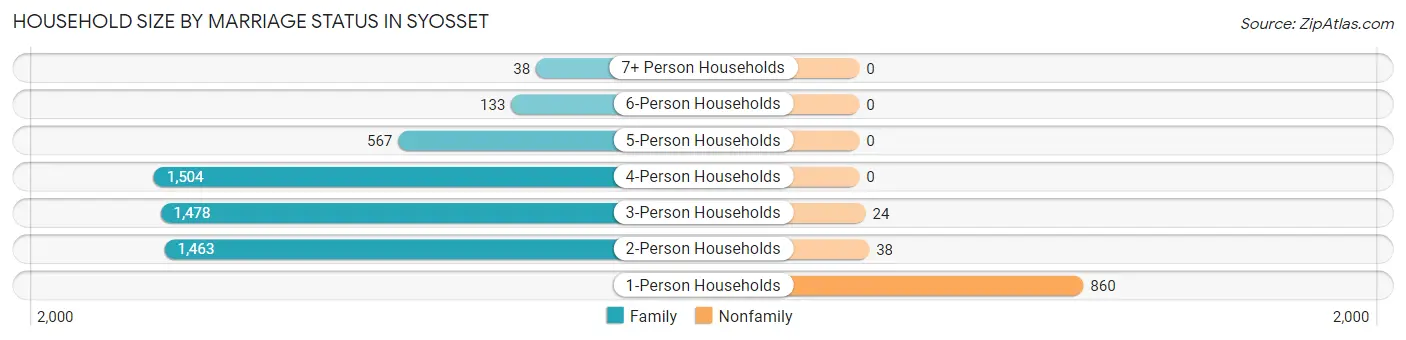
| Household Size | Family Households | Nonfamily Households |
| 1-Person Households | - | 860 (14.1%) |
| 2-Person Households | 1,463 (24.0%) | 38 (0.6%) |
| 3-Person Households | 1,478 (24.2%) | 24 (0.4%) |
| 4-Person Households | 1,504 (24.6%) | 0 (0.0%) |
| 5-Person Households | 567 (9.3%) | 0 (0.0%) |
| 6-Person Households | 133 (2.2%) | 0 (0.0%) |
| 7+ Person Households | 38 (0.6%) | 0 (0.0%) |
| Total | 5,183 (84.9%) | 922 (15.1%) |
Female Fertility in Syosset
Fertility by Age in Syosset
Average fertility rate in Syosset is 31.0 births per 1,000 women. Women in the age bracket of 20 to 34 years have the highest fertility rate with 68.0 births per 1,000 women. Women in the age bracket of 20 to 34 years acount for 55.1% of all women with births.
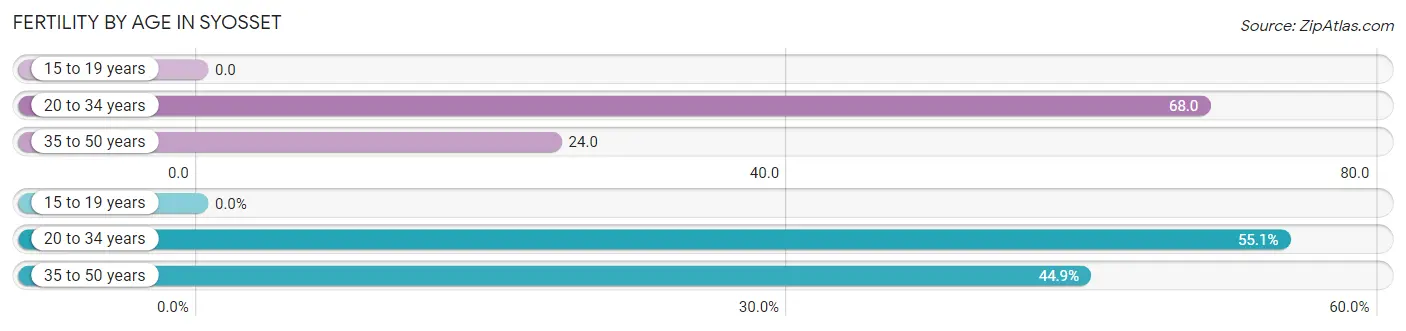
| Age Bracket | Women with Births | Births / 1,000 Women |
| 15 to 19 years | 0 (0.0%) | 0.0 |
| 20 to 34 years | 76 (55.1%) | 68.0 |
| 35 to 50 years | 62 (44.9%) | 24.0 |
| Total | 138 (100.0%) | 31.0 |
Fertility by Age by Marriage Status in Syosset
69.6% of women with births (138) in Syosset are married. The highest percentage of unmarried women with births falls into 20 to 34 years age bracket with 55.3% of them unmarried at the time of birth, while the lowest percentage of unmarried women with births belong to 35 to 50 years age bracket with 0.0% of them unmarried.
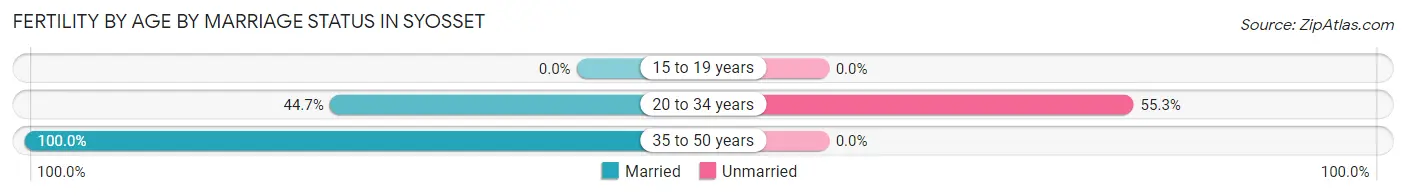
| Age Bracket | Married | Unmarried |
| 15 to 19 years | 0 (0.0%) | 0 (0.0%) |
| 20 to 34 years | 34 (44.7%) | 42 (55.3%) |
| 35 to 50 years | 62 (100.0%) | 0 (0.0%) |
| Total | 96 (69.6%) | 42 (30.4%) |
Fertility by Education in Syosset
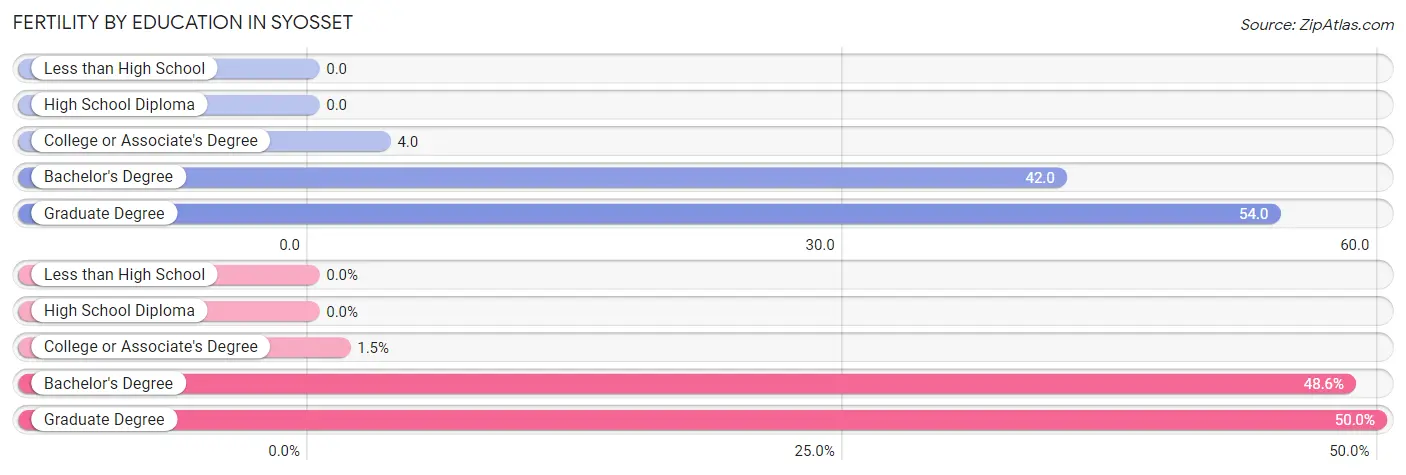
| Educational Attainment | Women with Births | Births / 1,000 Women |
| Less than High School | 0 (0.0%) | 0.0 |
| High School Diploma | 0 (0.0%) | 0.0 |
| College or Associate's Degree | 2 (1.5%) | 4.0 |
| Bachelor's Degree | 67 (48.5%) | 42.0 |
| Graduate Degree | 69 (50.0%) | 54.0 |
| Total | 138 (100.0%) | 31.0 |
Fertility by Education by Marriage Status in Syosset
30.4% of women with births in Syosset are unmarried. Women with the educational attainment of college or associate's degree are most likely to be married with 100.0% of them married at childbirth, while women with the educational attainment of bachelor's degree are least likely to be married with 62.7% of them unmarried at childbirth.
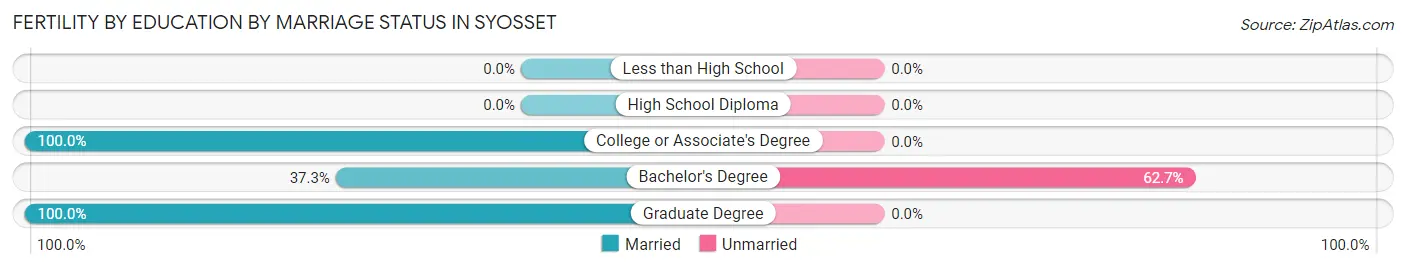
| Educational Attainment | Married | Unmarried |
| Less than High School | 0 (0.0%) | 0 (0.0%) |
| High School Diploma | 0 (0.0%) | 0 (0.0%) |
| College or Associate's Degree | 2 (100.0%) | 0 (0.0%) |
| Bachelor's Degree | 25 (37.3%) | 42 (62.7%) |
| Graduate Degree | 69 (100.0%) | 0 (0.0%) |
| Total | 96 (69.6%) | 42 (30.4%) |
Employment Characteristics in Syosset
Employment by Class of Employer in Syosset
Among the 8,607 employed individuals in Syosset, private company employees (5,513 | 64.0%), not-for-profit organizations (867 | 10.1%), and self-employed (incorporated) (779 | 9.0%) make up the most common classes of employment.
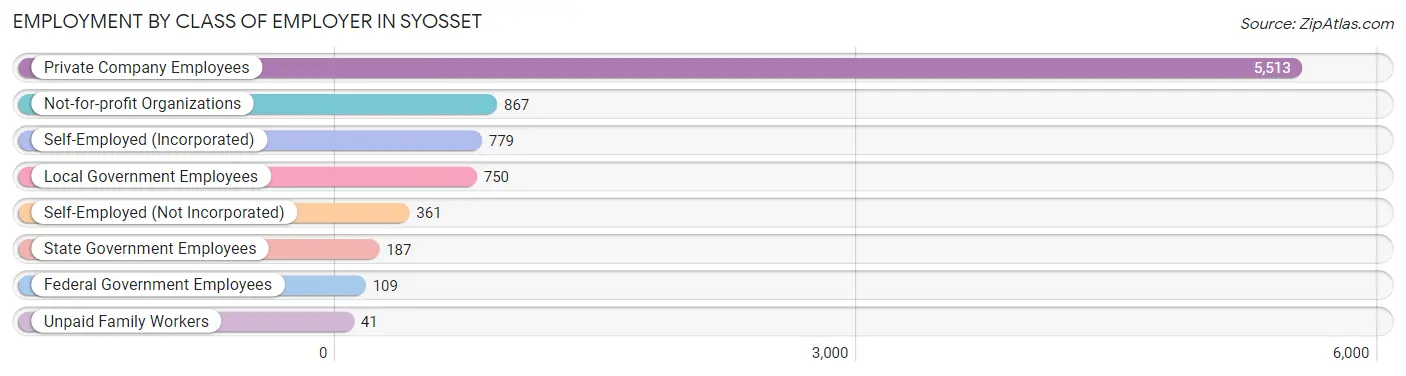
| Employer Class | # Employees | % Employees |
| Private Company Employees | 5,513 | 64.0% |
| Self-Employed (Incorporated) | 779 | 9.0% |
| Self-Employed (Not Incorporated) | 361 | 4.2% |
| Not-for-profit Organizations | 867 | 10.1% |
| Local Government Employees | 750 | 8.7% |
| State Government Employees | 187 | 2.2% |
| Federal Government Employees | 109 | 1.3% |
| Unpaid Family Workers | 41 | 0.5% |
| Total | 8,607 | 100.0% |
Employment Status by Age in Syosset
According to the labor force statistics for Syosset, out of the total population over 16 years of age (14,432), 63.7% or 9,193 individuals are in the labor force, with 3.9% or 359 of them unemployed. The age group with the highest labor force participation rate is 35 to 44 years, with 87.1% or 2,004 individuals in the labor force. Within the labor force, the 20 to 24 years age range has the highest percentage of unemployed individuals, with 14.4% or 80 of them being unemployed.
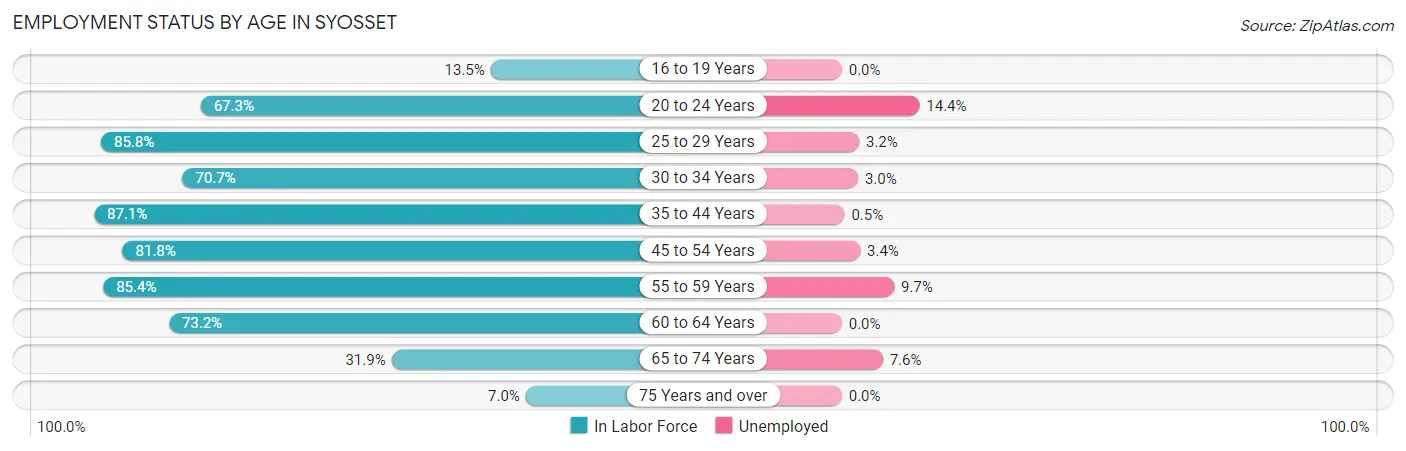
| Age Bracket | In Labor Force | Unemployed |
| 16 to 19 Years | 144 (13.5%) | 0 (0.0%) |
| 20 to 24 Years | 555 (67.3%) | 80 (14.4%) |
| 25 to 29 Years | 566 (85.8%) | 18 (3.2%) |
| 30 to 34 Years | 542 (70.7%) | 16 (3.0%) |
| 35 to 44 Years | 2,004 (87.1%) | 10 (0.5%) |
| 45 to 54 Years | 2,873 (81.8%) | 98 (3.4%) |
| 55 to 59 Years | 941 (85.4%) | 91 (9.7%) |
| 60 to 64 Years | 849 (73.2%) | 0 (0.0%) |
| 65 to 74 Years | 648 (31.9%) | 49 (7.6%) |
| 75 Years and over | 71 (7.0%) | 0 (0.0%) |
| Total | 9,193 (63.7%) | 359 (3.9%) |
Employment Status by Educational Attainment in Syosset
According to labor force statistics for Syosset, 81.8% of individuals (7,773) out of the total population between 25 and 64 years of age (9,502) are in the labor force, with 3.0% or 233 of them being unemployed. The group with the highest labor force participation rate are those with the educational attainment of bachelor's degree or higher, with 83.3% or 5,890 individuals in the labor force. Within the labor force, individuals with college / associate degree education have the highest percentage of unemployment, with 6.1% or 72 of them being unemployed.
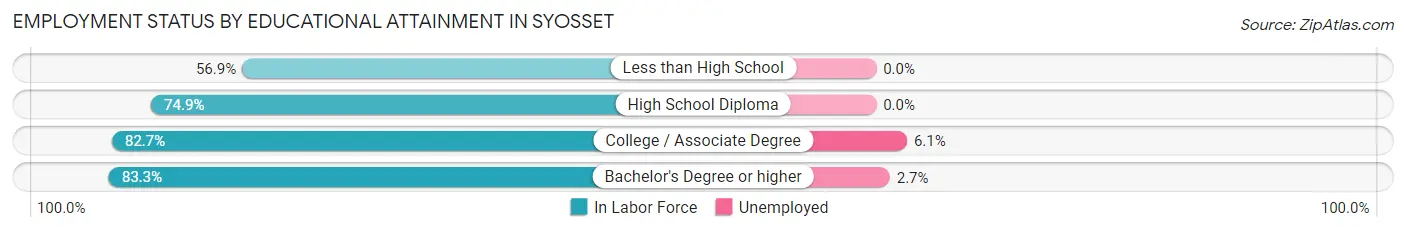
| Educational Attainment | In Labor Force | Unemployed |
| Less than High School | 157 (56.9%) | 0 (0.0%) |
| High School Diploma | 544 (74.9%) | 0 (0.0%) |
| College / Associate Degree | 1,182 (82.7%) | 87 (6.1%) |
| Bachelor's Degree or higher | 5,890 (83.3%) | 191 (2.7%) |
| Total | 7,773 (81.8%) | 285 (3.0%) |
Employment Occupations by Sex in Syosset
Management, Business, Science and Arts Occupations
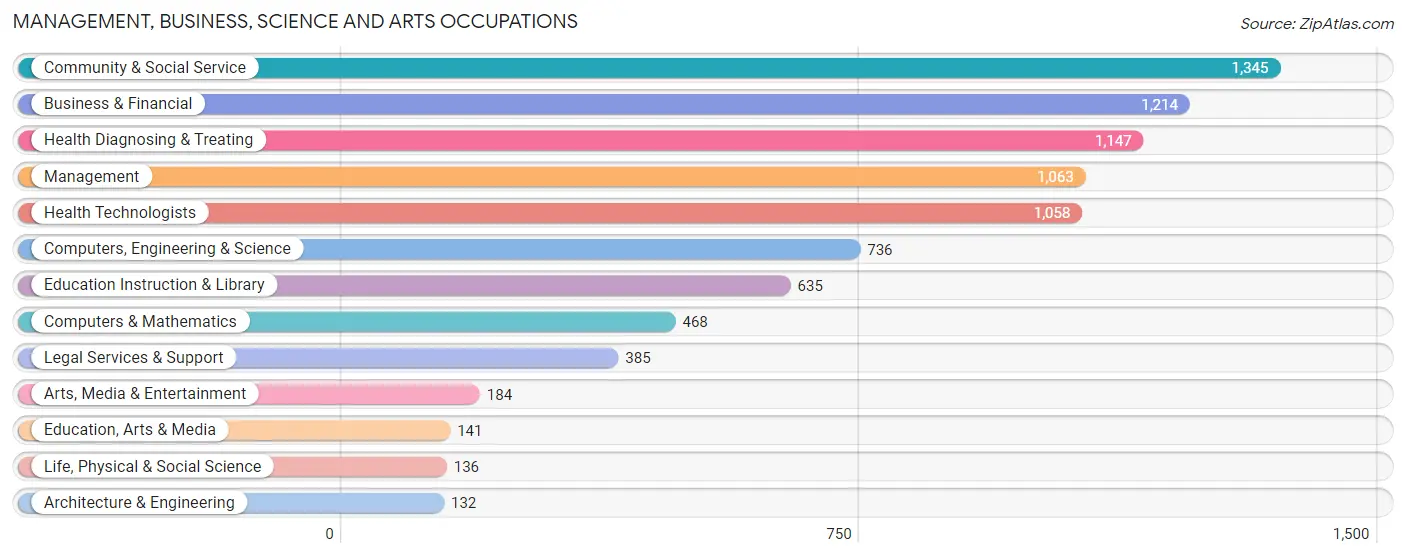
The most common Management, Business, Science and Arts occupations in Syosset are Community & Social Service (1,345 | 15.2%), Business & Financial (1,214 | 13.8%), Health Diagnosing & Treating (1,147 | 13.0%), Management (1,063 | 12.0%), and Health Technologists (1,058 | 12.0%).
Management, Business, Science and Arts Occupations by Sex
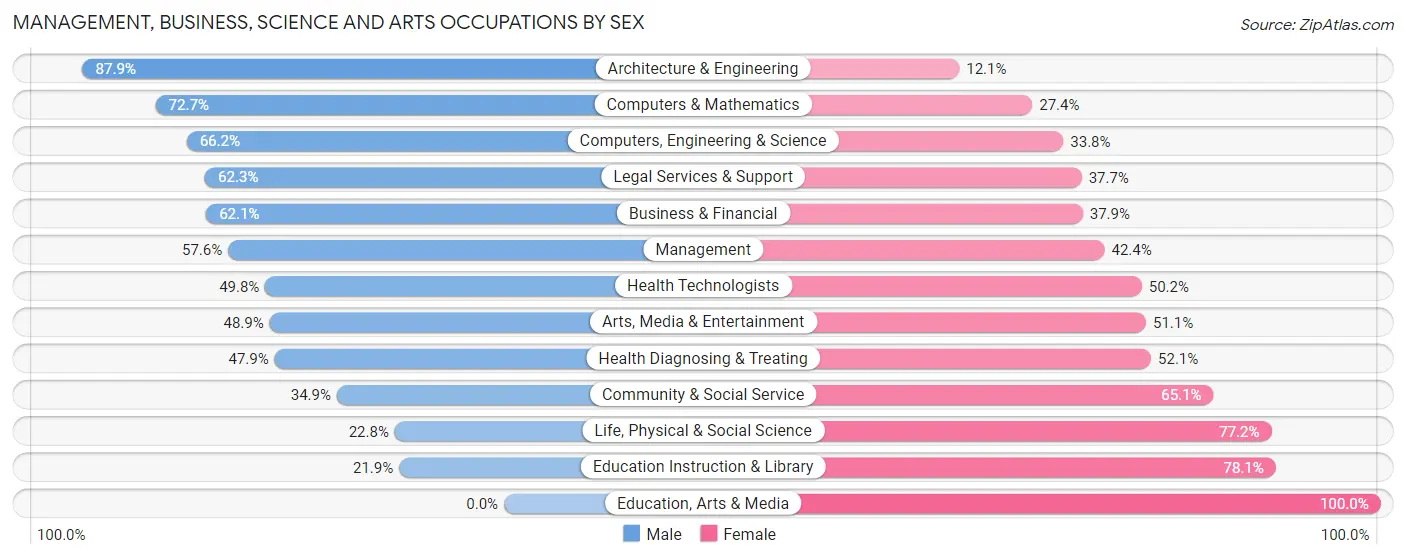
Within the Management, Business, Science and Arts occupations in Syosset, the most male-oriented occupations are Architecture & Engineering (87.9%), Computers & Mathematics (72.7%), and Computers, Engineering & Science (66.2%), while the most female-oriented occupations are Education, Arts & Media (100.0%), Education Instruction & Library (78.1%), and Life, Physical & Social Science (77.2%).
| Occupation | Male | Female |
| Management | 612 (57.6%) | 451 (42.4%) |
| Business & Financial | 754 (62.1%) | 460 (37.9%) |
| Computers, Engineering & Science | 487 (66.2%) | 249 (33.8%) |
| Computers & Mathematics | 340 (72.7%) | 128 (27.4%) |
| Architecture & Engineering | 116 (87.9%) | 16 (12.1%) |
| Life, Physical & Social Science | 31 (22.8%) | 105 (77.2%) |
| Community & Social Service | 469 (34.9%) | 876 (65.1%) |
| Education, Arts & Media | 0 (0.0%) | 141 (100.0%) |
| Legal Services & Support | 240 (62.3%) | 145 (37.7%) |
| Education Instruction & Library | 139 (21.9%) | 496 (78.1%) |
| Arts, Media & Entertainment | 90 (48.9%) | 94 (51.1%) |
| Health Diagnosing & Treating | 549 (47.9%) | 598 (52.1%) |
| Health Technologists | 527 (49.8%) | 531 (50.2%) |
| Total (Category) | 2,871 (52.1%) | 2,634 (47.8%) |
| Total (Overall) | 4,801 (54.4%) | 4,031 (45.6%) |
Services Occupations
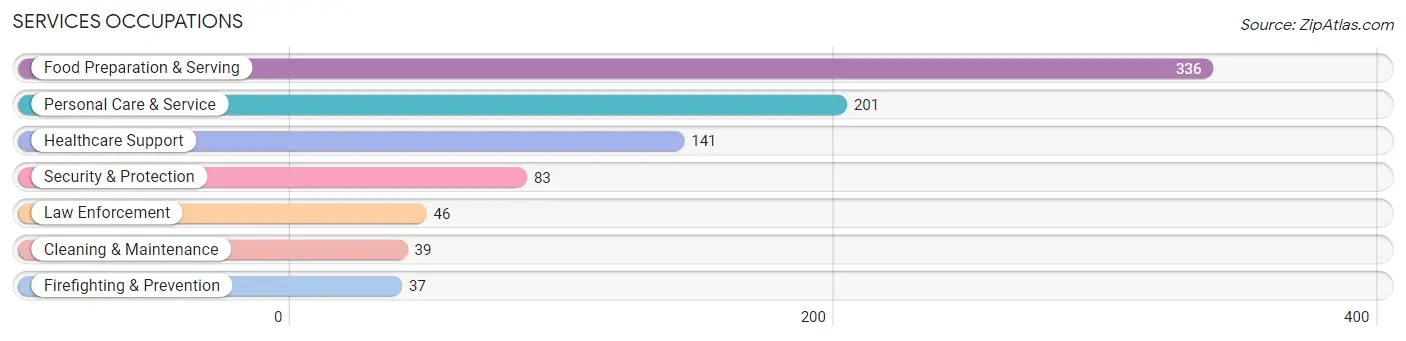
The most common Services occupations in Syosset are Food Preparation & Serving (336 | 3.8%), Personal Care & Service (201 | 2.3%), Healthcare Support (141 | 1.6%), Security & Protection (83 | 0.9%), and Law Enforcement (46 | 0.5%).
Services Occupations by Sex
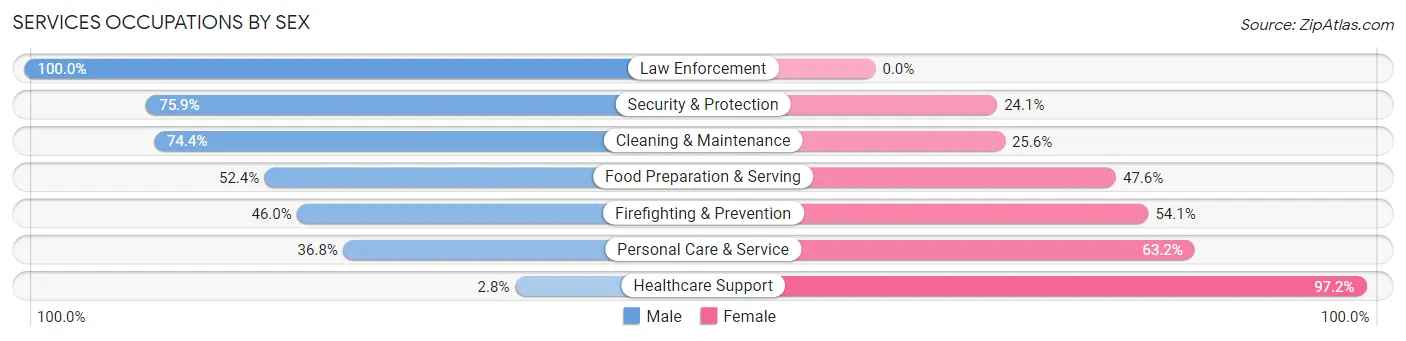
Within the Services occupations in Syosset, the most male-oriented occupations are Law Enforcement (100.0%), Security & Protection (75.9%), and Cleaning & Maintenance (74.4%), while the most female-oriented occupations are Healthcare Support (97.2%), Personal Care & Service (63.2%), and Firefighting & Prevention (54.0%).
| Occupation | Male | Female |
| Healthcare Support | 4 (2.8%) | 137 (97.2%) |
| Security & Protection | 63 (75.9%) | 20 (24.1%) |
| Firefighting & Prevention | 17 (46.0%) | 20 (54.0%) |
| Law Enforcement | 46 (100.0%) | 0 (0.0%) |
| Food Preparation & Serving | 176 (52.4%) | 160 (47.6%) |
| Cleaning & Maintenance | 29 (74.4%) | 10 (25.6%) |
| Personal Care & Service | 74 (36.8%) | 127 (63.2%) |
| Total (Category) | 346 (43.2%) | 454 (56.8%) |
| Total (Overall) | 4,801 (54.4%) | 4,031 (45.6%) |
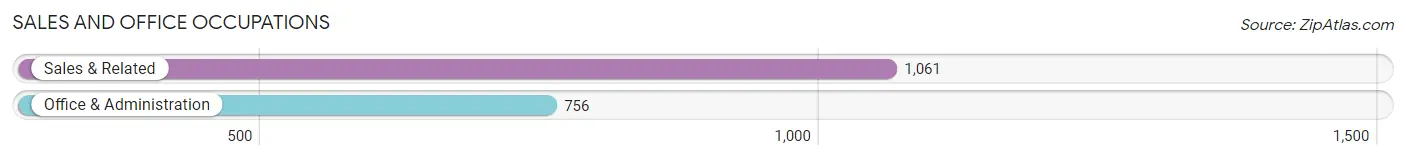
Sales and Office Occupations
The most common Sales and Office occupations in Syosset are Sales & Related (1,061 | 12.0%), and Office & Administration (756 | 8.6%).
Sales and Office Occupations by Sex
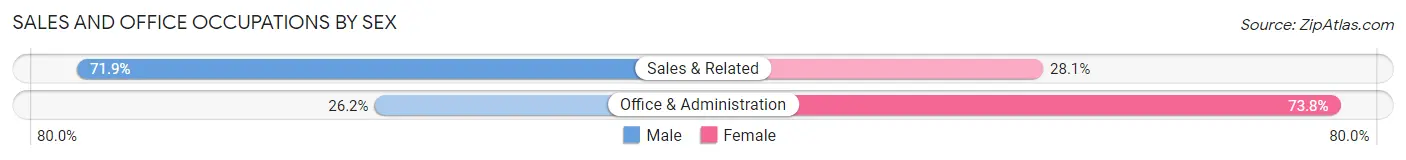
| Occupation | Male | Female |
| Sales & Related | 763 (71.9%) | 298 (28.1%) |
| Office & Administration | 198 (26.2%) | 558 (73.8%) |
| Total (Category) | 961 (52.9%) | 856 (47.1%) |
| Total (Overall) | 4,801 (54.4%) | 4,031 (45.6%) |
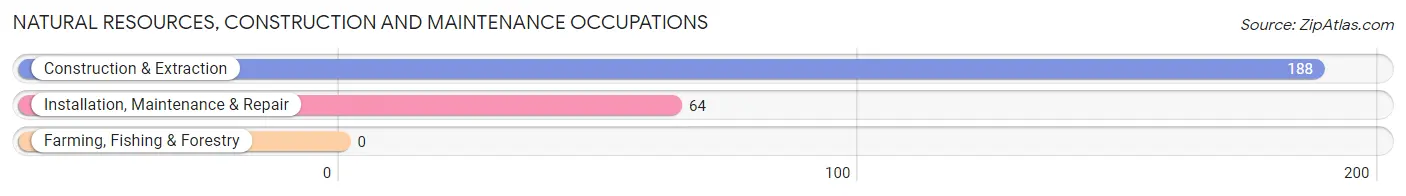
Natural Resources, Construction and Maintenance Occupations
The most common Natural Resources, Construction and Maintenance occupations in Syosset are Construction & Extraction (188 | 2.1%), and Installation, Maintenance & Repair (64 | 0.7%).
Natural Resources, Construction and Maintenance Occupations by Sex
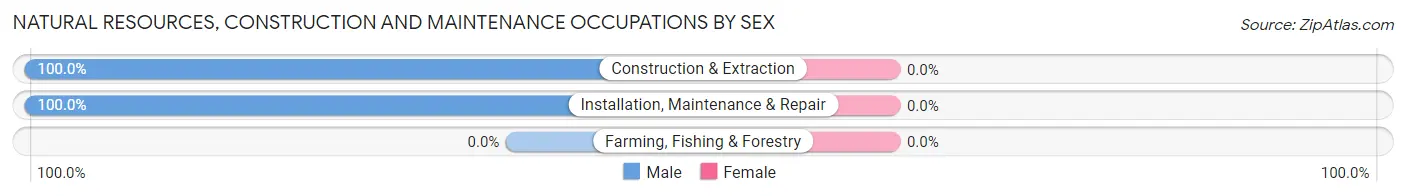
| Occupation | Male | Female |
| Farming, Fishing & Forestry | 0 (0.0%) | 0 (0.0%) |
| Construction & Extraction | 188 (100.0%) | 0 (0.0%) |
| Installation, Maintenance & Repair | 64 (100.0%) | 0 (0.0%) |
| Total (Category) | 252 (100.0%) | 0 (0.0%) |
| Total (Overall) | 4,801 (54.4%) | 4,031 (45.6%) |
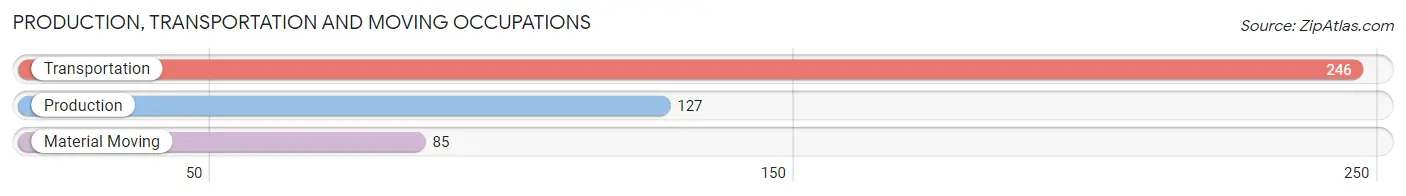
Production, Transportation and Moving Occupations
The most common Production, Transportation and Moving occupations in Syosset are Transportation (246 | 2.8%), Production (127 | 1.4%), and Material Moving (85 | 1.0%).
Production, Transportation and Moving Occupations by Sex
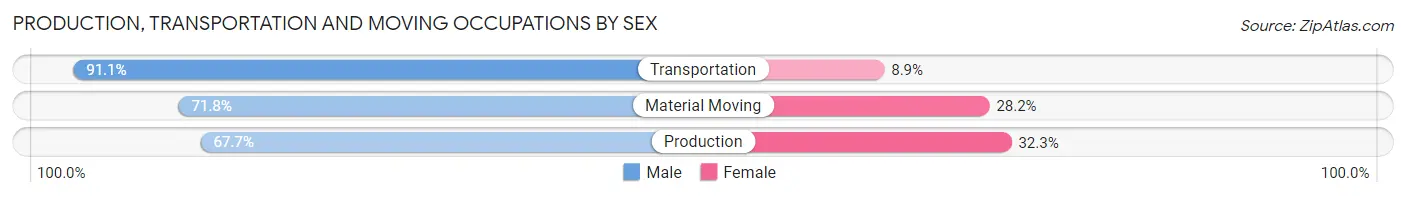
| Occupation | Male | Female |
| Production | 86 (67.7%) | 41 (32.3%) |
| Transportation | 224 (91.1%) | 22 (8.9%) |
| Material Moving | 61 (71.8%) | 24 (28.2%) |
| Total (Category) | 371 (81.0%) | 87 (19.0%) |
| Total (Overall) | 4,801 (54.4%) | 4,031 (45.6%) |
Employment Industries by Sex in Syosset
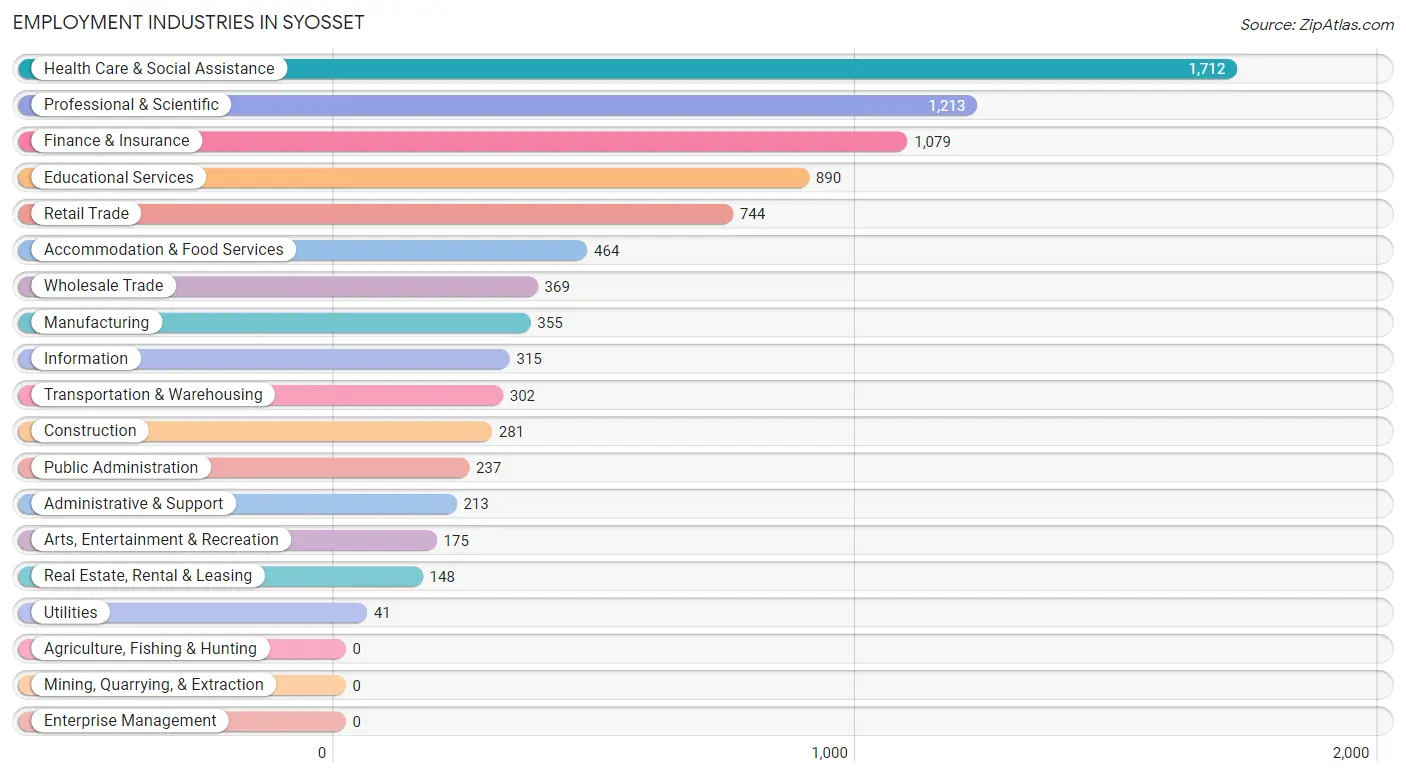
Employment Industries in Syosset
The major employment industries in Syosset include Health Care & Social Assistance (1,712 | 19.4%), Professional & Scientific (1,213 | 13.7%), Finance & Insurance (1,079 | 12.2%), Educational Services (890 | 10.1%), and Retail Trade (744 | 8.4%).
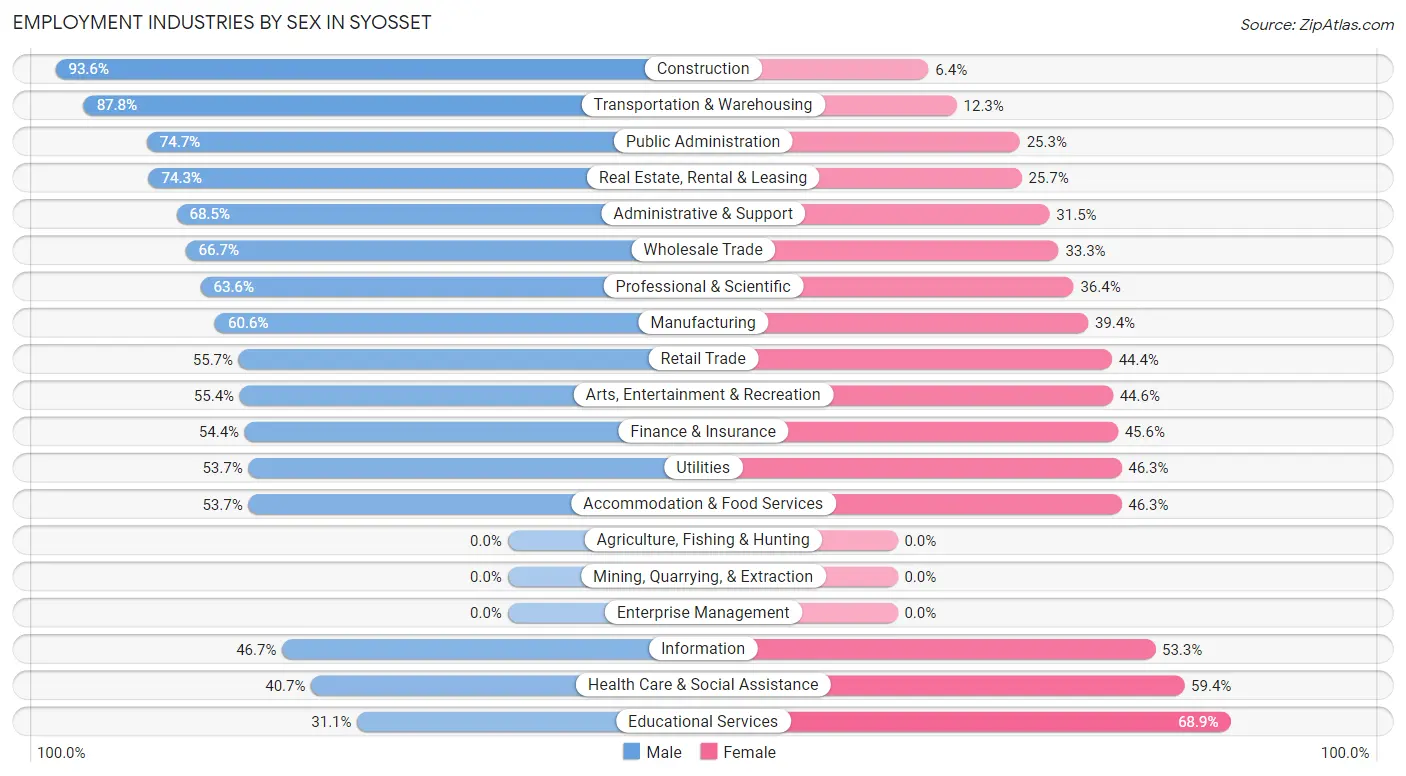
Employment Industries by Sex in Syosset
The Syosset industries that see more men than women are Construction (93.6%), Transportation & Warehousing (87.7%), and Public Administration (74.7%), whereas the industries that tend to have a higher number of women are Educational Services (68.9%), Health Care & Social Assistance (59.4%), and Information (53.3%).
| Industry | Male | Female |
| Agriculture, Fishing & Hunting | 0 (0.0%) | 0 (0.0%) |
| Mining, Quarrying, & Extraction | 0 (0.0%) | 0 (0.0%) |
| Construction | 263 (93.6%) | 18 (6.4%) |
| Manufacturing | 215 (60.6%) | 140 (39.4%) |
| Wholesale Trade | 246 (66.7%) | 123 (33.3%) |
| Retail Trade | 414 (55.6%) | 330 (44.4%) |
| Transportation & Warehousing | 265 (87.7%) | 37 (12.2%) |
| Utilities | 22 (53.7%) | 19 (46.3%) |
| Information | 147 (46.7%) | 168 (53.3%) |
| Finance & Insurance | 587 (54.4%) | 492 (45.6%) |
| Real Estate, Rental & Leasing | 110 (74.3%) | 38 (25.7%) |
| Professional & Scientific | 771 (63.6%) | 442 (36.4%) |
| Enterprise Management | 0 (0.0%) | 0 (0.0%) |
| Administrative & Support | 146 (68.5%) | 67 (31.5%) |
| Educational Services | 277 (31.1%) | 613 (68.9%) |
| Health Care & Social Assistance | 696 (40.6%) | 1,016 (59.4%) |
| Arts, Entertainment & Recreation | 97 (55.4%) | 78 (44.6%) |
| Accommodation & Food Services | 249 (53.7%) | 215 (46.3%) |
| Public Administration | 177 (74.7%) | 60 (25.3%) |
| Total | 4,801 (54.4%) | 4,031 (45.6%) |
Education in Syosset
School Enrollment in Syosset
The most common levels of schooling among the 5,509 students in Syosset are high school (1,591 | 28.9%), middle school (1,505 | 27.3%), and elementary school (1,100 | 20.0%).
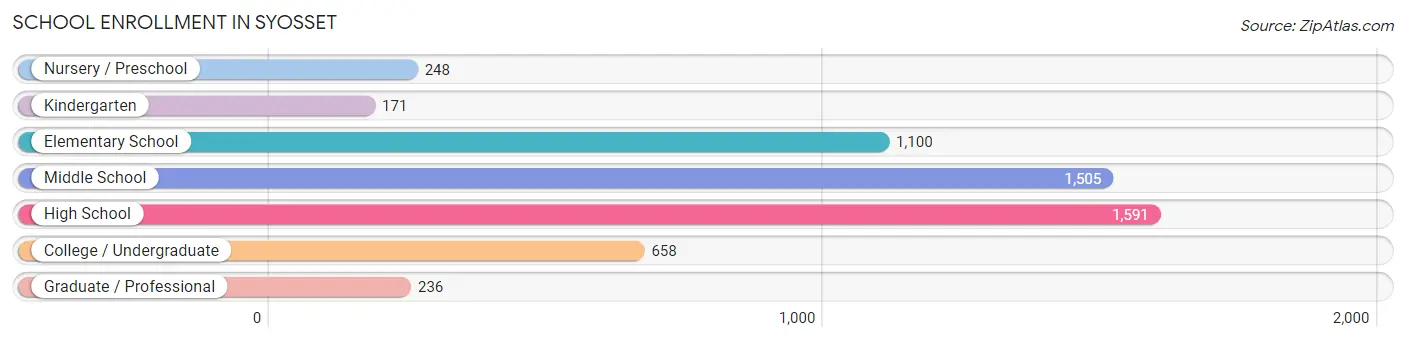
| School Level | # Students | % Students |
| Nursery / Preschool | 248 | 4.5% |
| Kindergarten | 171 | 3.1% |
| Elementary School | 1,100 | 20.0% |
| Middle School | 1,505 | 27.3% |
| High School | 1,591 | 28.9% |
| College / Undergraduate | 658 | 11.9% |
| Graduate / Professional | 236 | 4.3% |
| Total | 5,509 | 100.0% |
School Enrollment by Age by Funding Source in Syosset
Out of a total of 5,509 students who are enrolled in schools in Syosset, 722 (13.1%) attend a private institution, while the remaining 4,787 (86.9%) are enrolled in public schools. The age group of 25 to 34 year olds has the highest likelihood of being enrolled in private schools, with 61 (89.7% in the age bracket) enrolled. Conversely, the age group of 10 to 14 year olds has the lowest likelihood of being enrolled in a private school, with 1,839 (97.9% in the age bracket) attending a public institution.
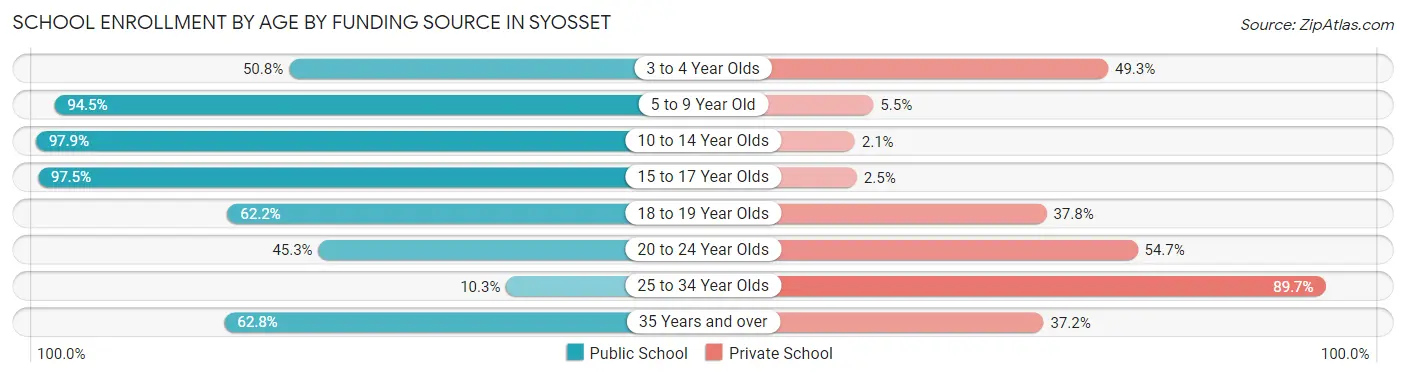
| Age Bracket | Public School | Private School |
| 3 to 4 Year Olds | 101 (50.7%) | 98 (49.2%) |
| 5 to 9 Year Old | 1,176 (94.5%) | 69 (5.5%) |
| 10 to 14 Year Olds | 1,839 (97.9%) | 39 (2.1%) |
| 15 to 17 Year Olds | 1,187 (97.5%) | 30 (2.5%) |
| 18 to 19 Year Olds | 140 (62.2%) | 85 (37.8%) |
| 20 to 24 Year Olds | 225 (45.3%) | 272 (54.7%) |
| 25 to 34 Year Olds | 7 (10.3%) | 61 (89.7%) |
| 35 Years and over | 113 (62.8%) | 67 (37.2%) |
| Total | 4,787 (86.9%) | 722 (13.1%) |
Educational Attainment by Field of Study in Syosset
Business (2,129 | 23.5%), social sciences (957 | 10.5%), science & technology (884 | 9.7%), education (795 | 8.8%), and psychology (718 | 7.9%) are the most common fields of study among 9,074 individuals in Syosset who have obtained a bachelor's degree or higher.
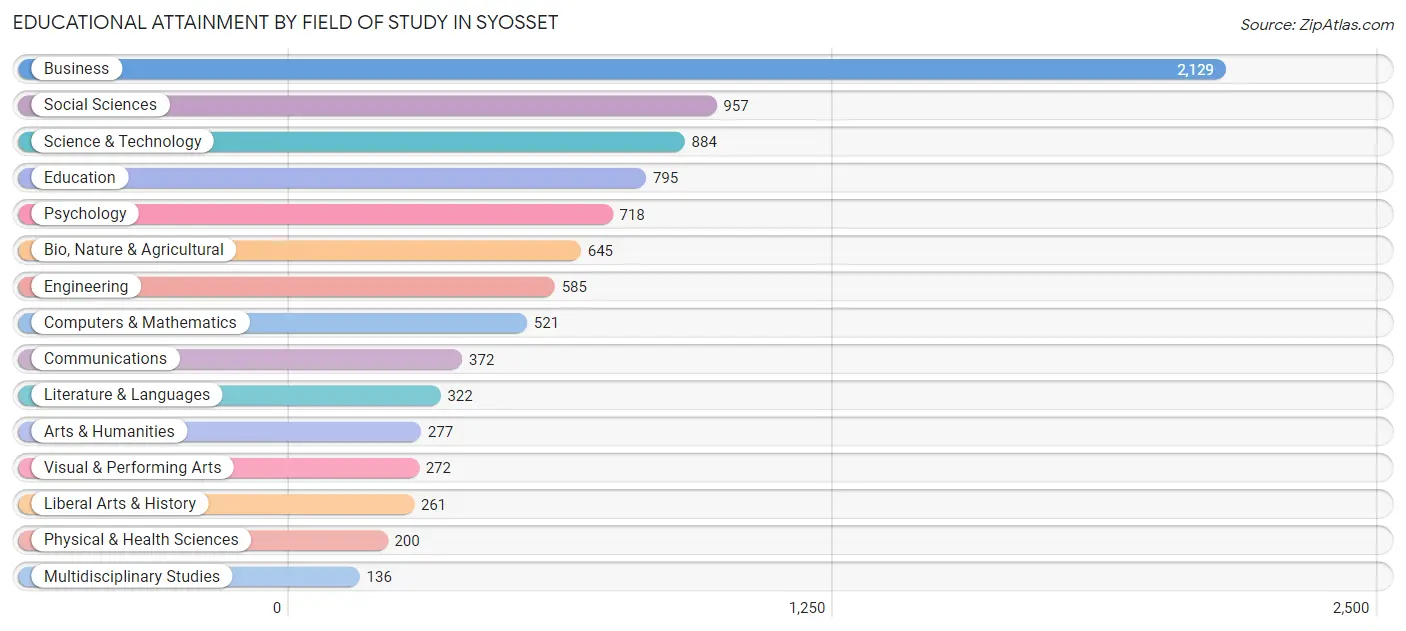
| Field of Study | # Graduates | % Graduates |
| Computers & Mathematics | 521 | 5.7% |
| Bio, Nature & Agricultural | 645 | 7.1% |
| Physical & Health Sciences | 200 | 2.2% |
| Psychology | 718 | 7.9% |
| Social Sciences | 957 | 10.5% |
| Engineering | 585 | 6.5% |
| Multidisciplinary Studies | 136 | 1.5% |
| Science & Technology | 884 | 9.7% |
| Business | 2,129 | 23.5% |
| Education | 795 | 8.8% |
| Literature & Languages | 322 | 3.5% |
| Liberal Arts & History | 261 | 2.9% |
| Visual & Performing Arts | 272 | 3.0% |
| Communications | 372 | 4.1% |
| Arts & Humanities | 277 | 3.0% |
| Total | 9,074 | 100.0% |
Transportation & Commute in Syosset
Vehicle Availability by Sex in Syosset
The most prevalent vehicle ownership categories in Syosset are males with 2 vehicles (2,381, accounting for 51.8%) and females with 2 vehicles (1,893, making up 59.7%).
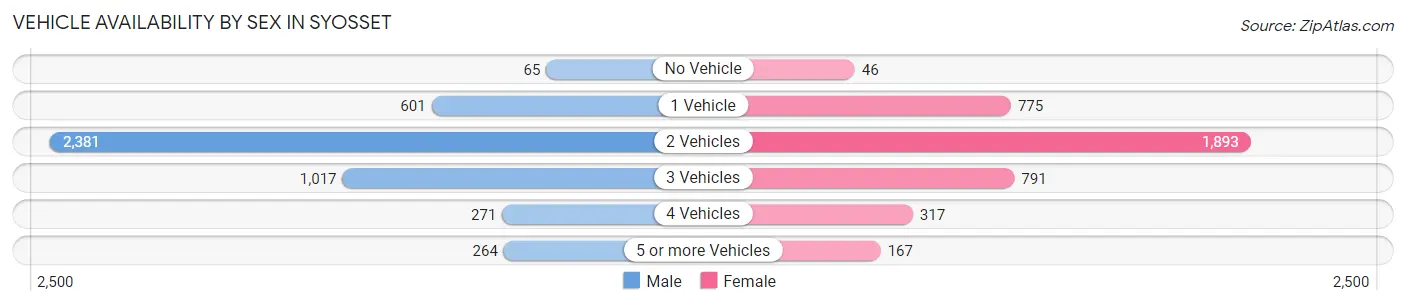
| Vehicles Available | Male | Female |
| No Vehicle | 65 (1.4%) | 46 (1.1%) |
| 1 Vehicle | 601 (13.1%) | 775 (19.4%) |
| 2 Vehicles | 2,381 (51.8%) | 1,893 (47.5%) |
| 3 Vehicles | 1,017 (22.1%) | 791 (19.8%) |
| 4 Vehicles | 271 (5.9%) | 317 (8.0%) |
| 5 or more Vehicles | 264 (5.7%) | 167 (4.2%) |
| Total | 4,599 (100.0%) | 3,989 (100.0%) |
Commute Time in Syosset
The most frequently occuring commute durations in Syosset are 60 to 89 minutes (1,183 commuters, 17.0%), 10 to 14 minutes (838 commuters, 12.0%), and 90 or more minutes (763 commuters, 11.0%).
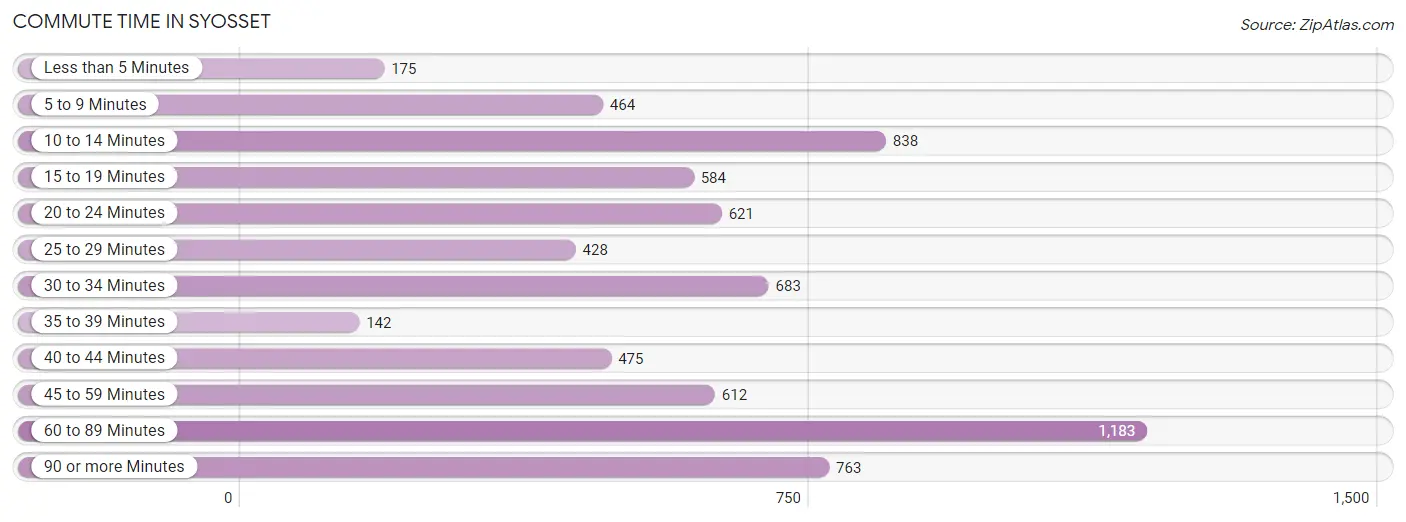
| Commute Time | # Commuters | % Commuters |
| Less than 5 Minutes | 175 | 2.5% |
| 5 to 9 Minutes | 464 | 6.7% |
| 10 to 14 Minutes | 838 | 12.0% |
| 15 to 19 Minutes | 584 | 8.4% |
| 20 to 24 Minutes | 621 | 8.9% |
| 25 to 29 Minutes | 428 | 6.1% |
| 30 to 34 Minutes | 683 | 9.8% |
| 35 to 39 Minutes | 142 | 2.0% |
| 40 to 44 Minutes | 475 | 6.8% |
| 45 to 59 Minutes | 612 | 8.8% |
| 60 to 89 Minutes | 1,183 | 17.0% |
| 90 or more Minutes | 763 | 11.0% |
Commute Time by Sex in Syosset
The most common commute times in Syosset are 60 to 89 minutes (656 commuters, 16.9%) for males and 60 to 89 minutes (527 commuters, 17.1%) for females.
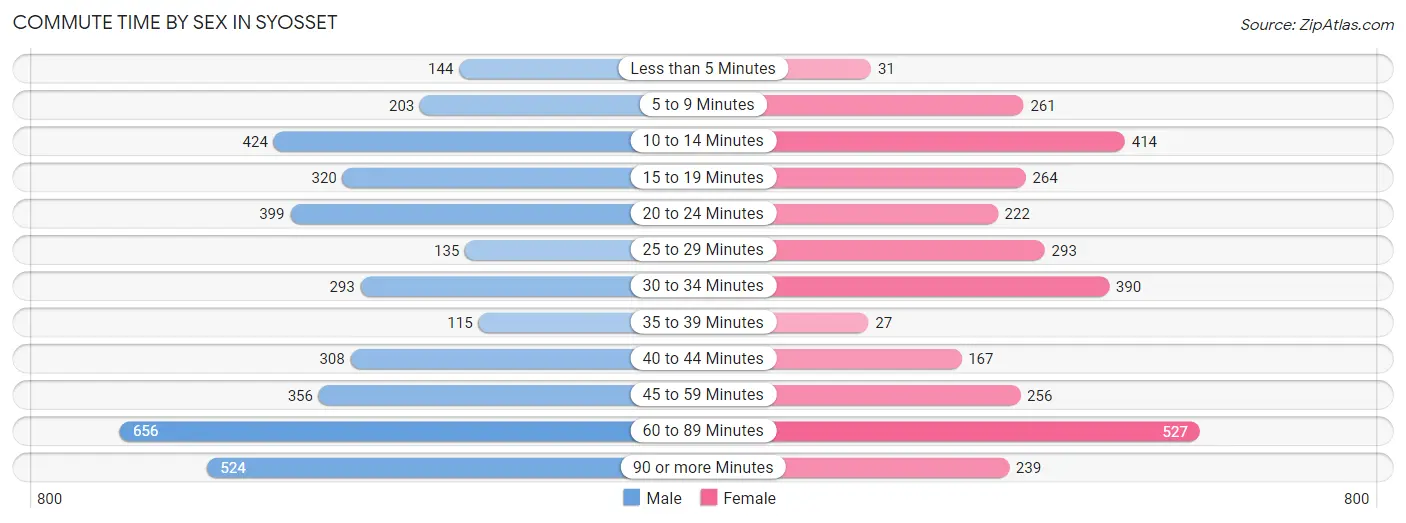
| Commute Time | Male | Female |
| Less than 5 Minutes | 144 (3.7%) | 31 (1.0%) |
| 5 to 9 Minutes | 203 (5.2%) | 261 (8.4%) |
| 10 to 14 Minutes | 424 (10.9%) | 414 (13.4%) |
| 15 to 19 Minutes | 320 (8.3%) | 264 (8.5%) |
| 20 to 24 Minutes | 399 (10.3%) | 222 (7.2%) |
| 25 to 29 Minutes | 135 (3.5%) | 293 (9.5%) |
| 30 to 34 Minutes | 293 (7.6%) | 390 (12.6%) |
| 35 to 39 Minutes | 115 (3.0%) | 27 (0.9%) |
| 40 to 44 Minutes | 308 (7.9%) | 167 (5.4%) |
| 45 to 59 Minutes | 356 (9.2%) | 256 (8.3%) |
| 60 to 89 Minutes | 656 (16.9%) | 527 (17.1%) |
| 90 or more Minutes | 524 (13.5%) | 239 (7.7%) |
Time of Departure to Work by Sex in Syosset
The most frequent times of departure to work in Syosset are 8:00 AM to 8:29 AM (606, 15.6%) for males and 9:00 AM to 9:59 AM (487, 15.8%) for females.
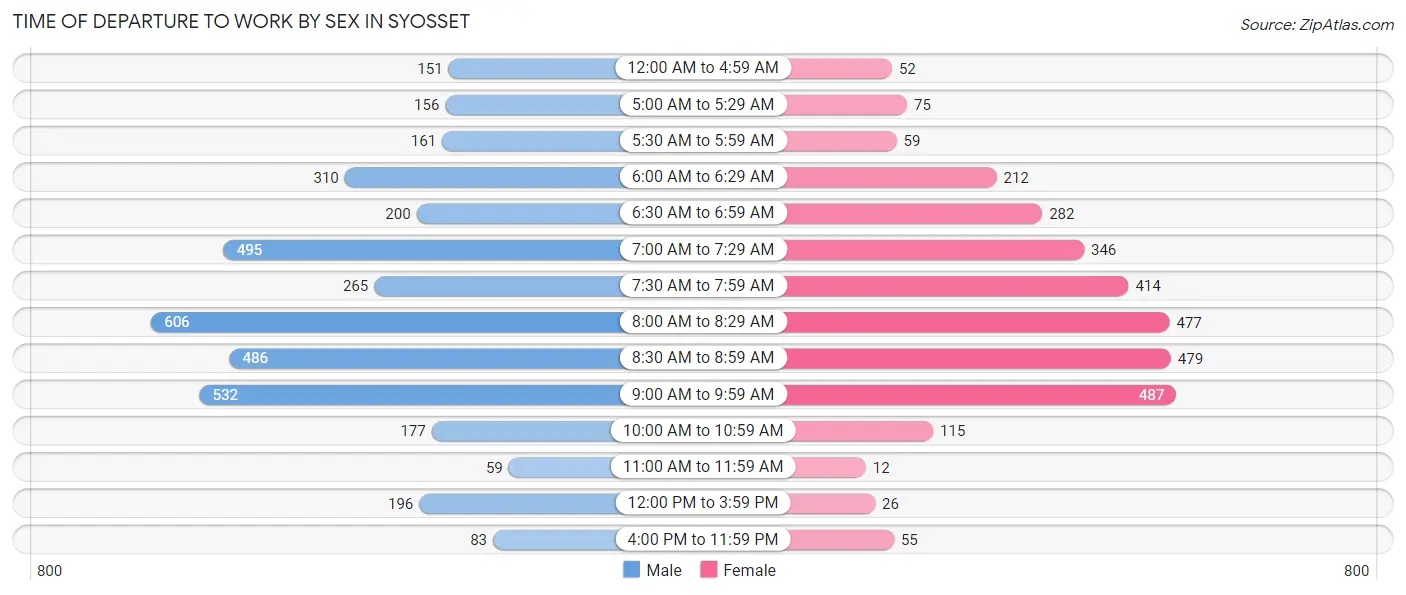
| Time of Departure | Male | Female |
| 12:00 AM to 4:59 AM | 151 (3.9%) | 52 (1.7%) |
| 5:00 AM to 5:29 AM | 156 (4.0%) | 75 (2.4%) |
| 5:30 AM to 5:59 AM | 161 (4.2%) | 59 (1.9%) |
| 6:00 AM to 6:29 AM | 310 (8.0%) | 212 (6.9%) |
| 6:30 AM to 6:59 AM | 200 (5.2%) | 282 (9.1%) |
| 7:00 AM to 7:29 AM | 495 (12.8%) | 346 (11.2%) |
| 7:30 AM to 7:59 AM | 265 (6.8%) | 414 (13.4%) |
| 8:00 AM to 8:29 AM | 606 (15.6%) | 477 (15.4%) |
| 8:30 AM to 8:59 AM | 486 (12.5%) | 479 (15.5%) |
| 9:00 AM to 9:59 AM | 532 (13.7%) | 487 (15.8%) |
| 10:00 AM to 10:59 AM | 177 (4.6%) | 115 (3.7%) |
| 11:00 AM to 11:59 AM | 59 (1.5%) | 12 (0.4%) |
| 12:00 PM to 3:59 PM | 196 (5.1%) | 26 (0.8%) |
| 4:00 PM to 11:59 PM | 83 (2.1%) | 55 (1.8%) |
| Total | 3,877 (100.0%) | 3,091 (100.0%) |
Housing Occupancy in Syosset
Occupancy by Ownership in Syosset
Of the total 6,105 dwellings in Syosset, owner-occupied units account for 5,590 (91.6%), while renter-occupied units make up 515 (8.4%).
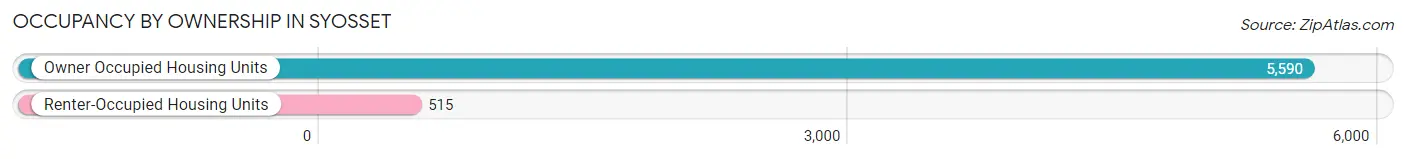
| Occupancy | # Housing Units | % Housing Units |
| Owner Occupied Housing Units | 5,590 | 91.6% |
| Renter-Occupied Housing Units | 515 | 8.4% |
| Total Occupied Housing Units | 6,105 | 100.0% |
Occupancy by Household Size in Syosset
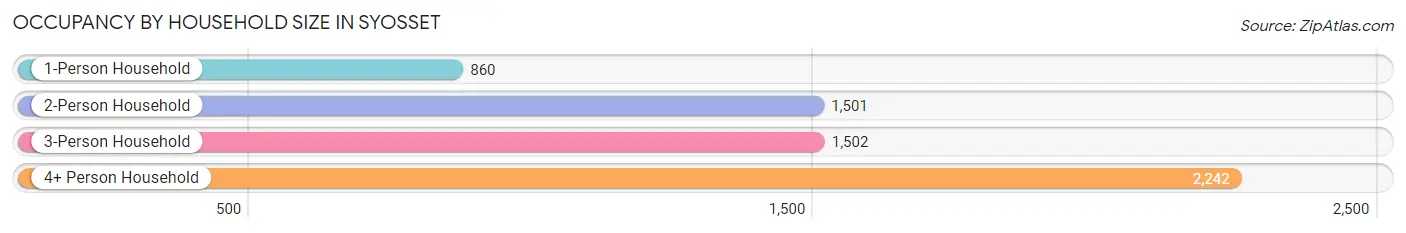
| Household Size | # Housing Units | % Housing Units |
| 1-Person Household | 860 | 14.1% |
| 2-Person Household | 1,501 | 24.6% |
| 3-Person Household | 1,502 | 24.6% |
| 4+ Person Household | 2,242 | 36.7% |
| Total Housing Units | 6,105 | 100.0% |
Occupancy by Ownership by Household Size in Syosset
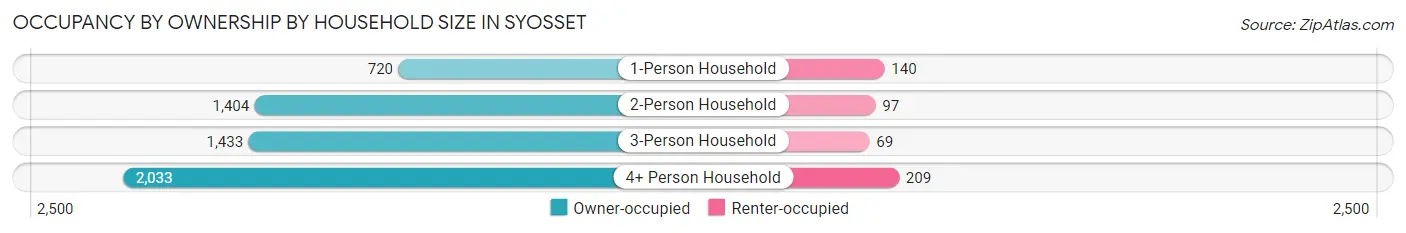
| Household Size | Owner-occupied | Renter-occupied |
| 1-Person Household | 720 (83.7%) | 140 (16.3%) |
| 2-Person Household | 1,404 (93.5%) | 97 (6.5%) |
| 3-Person Household | 1,433 (95.4%) | 69 (4.6%) |
| 4+ Person Household | 2,033 (90.7%) | 209 (9.3%) |
| Total Housing Units | 5,590 (91.6%) | 515 (8.4%) |
Occupancy by Educational Attainment in Syosset
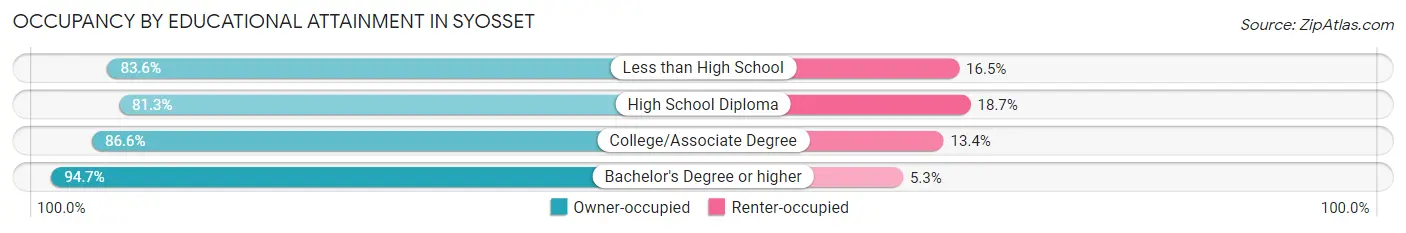
| Household Size | Owner-occupied | Renter-occupied |
| Less than High School | 127 (83.6%) | 25 (16.5%) |
| High School Diploma | 629 (81.3%) | 145 (18.7%) |
| College/Associate Degree | 751 (86.6%) | 116 (13.4%) |
| Bachelor's Degree or higher | 4,083 (94.7%) | 229 (5.3%) |
Occupancy by Age of Householder in Syosset
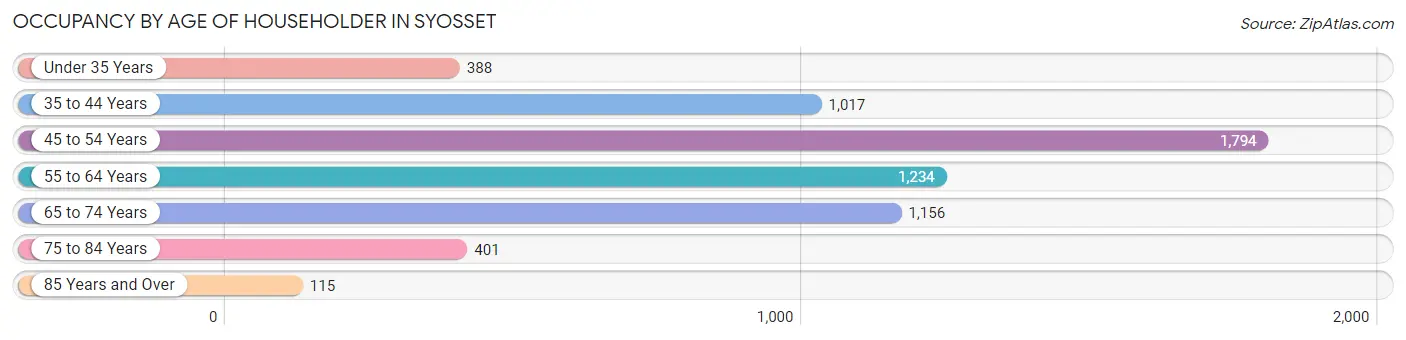
| Age Bracket | # Households | % Households |
| Under 35 Years | 388 | 6.4% |
| 35 to 44 Years | 1,017 | 16.7% |
| 45 to 54 Years | 1,794 | 29.4% |
| 55 to 64 Years | 1,234 | 20.2% |
| 65 to 74 Years | 1,156 | 18.9% |
| 75 to 84 Years | 401 | 6.6% |
| 85 Years and Over | 115 | 1.9% |
| Total | 6,105 | 100.0% |
Housing Finances in Syosset
Median Income by Occupancy in Syosset
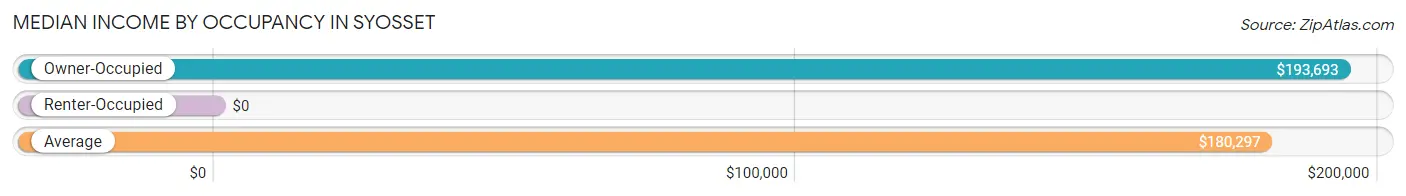
| Occupancy Type | # Households | Median Income |
| Owner-Occupied | 5,590 (91.6%) | $193,693 |
| Renter-Occupied | 515 (8.4%) | $0 |
| Average | 6,105 (100.0%) | $180,297 |
Occupancy by Householder Income Bracket in Syosset
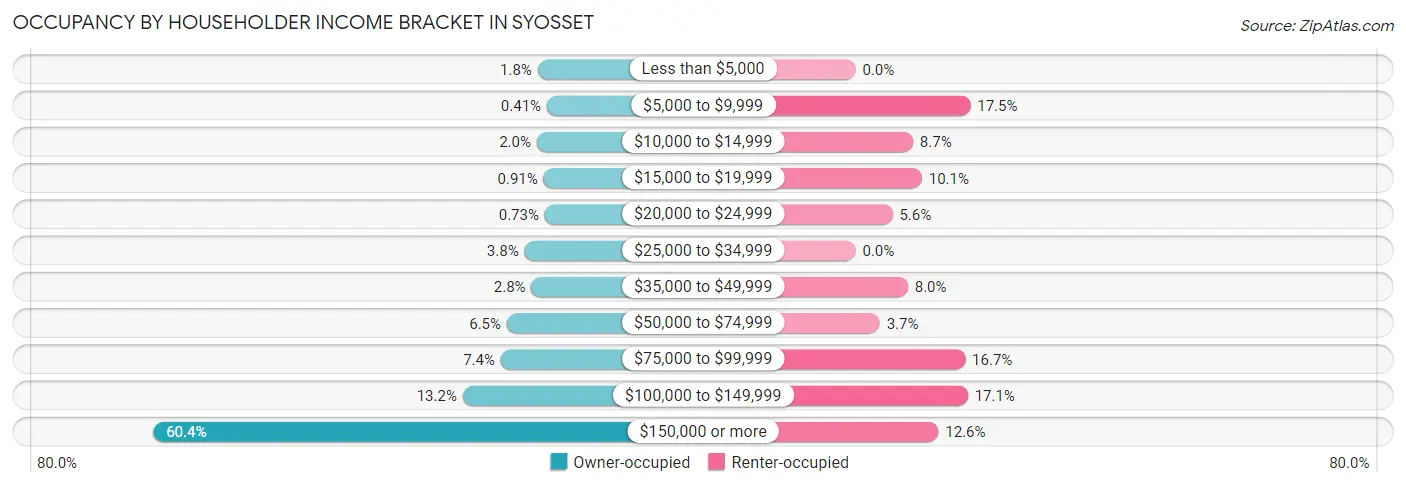
| Income Bracket | Owner-occupied | Renter-occupied |
| Less than $5,000 | 101 (1.8%) | 0 (0.0%) |
| $5,000 to $9,999 | 23 (0.4%) | 90 (17.5%) |
| $10,000 to $14,999 | 109 (1.9%) | 45 (8.7%) |
| $15,000 to $19,999 | 51 (0.9%) | 52 (10.1%) |
| $20,000 to $24,999 | 41 (0.7%) | 29 (5.6%) |
| $25,000 to $34,999 | 214 (3.8%) | 0 (0.0%) |
| $35,000 to $49,999 | 155 (2.8%) | 41 (8.0%) |
| $50,000 to $74,999 | 364 (6.5%) | 19 (3.7%) |
| $75,000 to $99,999 | 416 (7.4%) | 86 (16.7%) |
| $100,000 to $149,999 | 740 (13.2%) | 88 (17.1%) |
| $150,000 or more | 3,376 (60.4%) | 65 (12.6%) |
| Total | 5,590 (100.0%) | 515 (100.0%) |
Monthly Housing Cost Tiers in Syosset
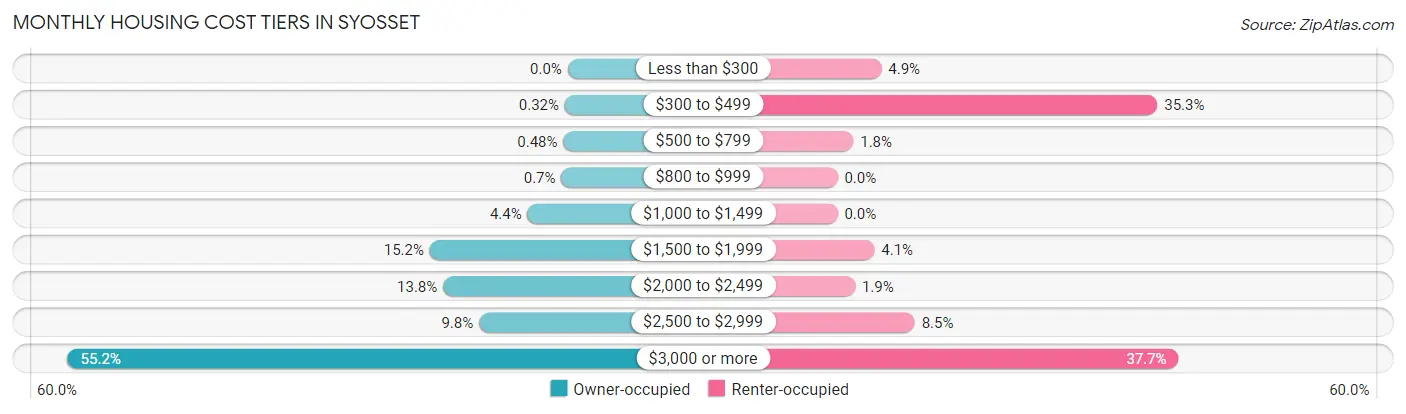
| Monthly Cost | Owner-occupied | Renter-occupied |
| Less than $300 | 0 (0.0%) | 25 (4.9%) |
| $300 to $499 | 18 (0.3%) | 182 (35.3%) |
| $500 to $799 | 27 (0.5%) | 9 (1.8%) |
| $800 to $999 | 39 (0.7%) | 0 (0.0%) |
| $1,000 to $1,499 | 248 (4.4%) | 0 (0.0%) |
| $1,500 to $1,999 | 852 (15.2%) | 21 (4.1%) |
| $2,000 to $2,499 | 770 (13.8%) | 10 (1.9%) |
| $2,500 to $2,999 | 548 (9.8%) | 44 (8.5%) |
| $3,000 or more | 3,088 (55.2%) | 194 (37.7%) |
| Total | 5,590 (100.0%) | 515 (100.0%) |
Physical Housing Characteristics in Syosset
Housing Structures in Syosset
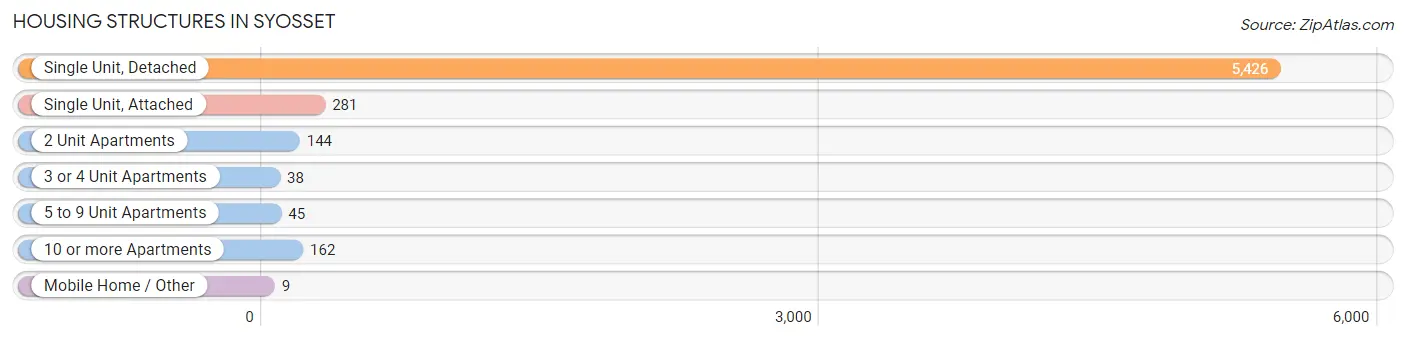
| Structure Type | # Housing Units | % Housing Units |
| Single Unit, Detached | 5,426 | 88.9% |
| Single Unit, Attached | 281 | 4.6% |
| 2 Unit Apartments | 144 | 2.4% |
| 3 or 4 Unit Apartments | 38 | 0.6% |
| 5 to 9 Unit Apartments | 45 | 0.7% |
| 10 or more Apartments | 162 | 2.6% |
| Mobile Home / Other | 9 | 0.2% |
| Total | 6,105 | 100.0% |
Housing Structures by Occupancy in Syosset
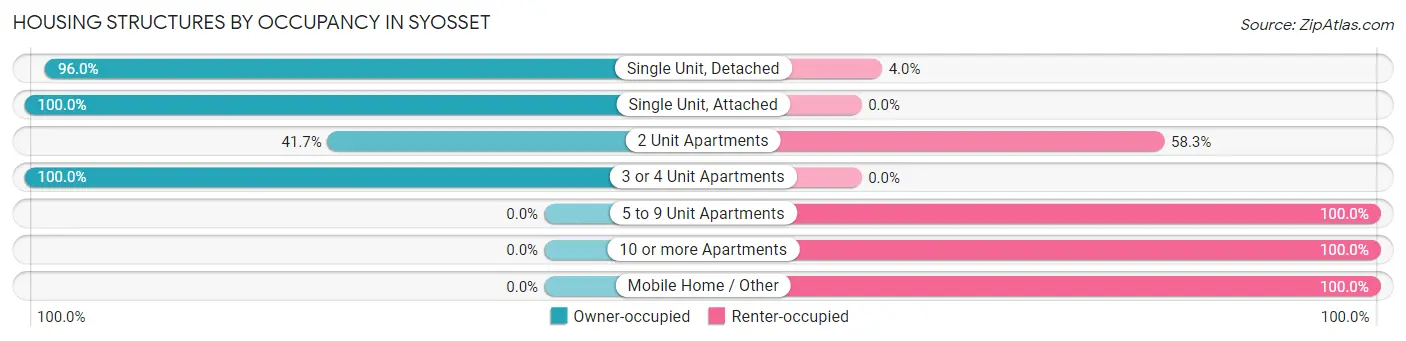
| Structure Type | Owner-occupied | Renter-occupied |
| Single Unit, Detached | 5,211 (96.0%) | 215 (4.0%) |
| Single Unit, Attached | 281 (100.0%) | 0 (0.0%) |
| 2 Unit Apartments | 60 (41.7%) | 84 (58.3%) |
| 3 or 4 Unit Apartments | 38 (100.0%) | 0 (0.0%) |
| 5 to 9 Unit Apartments | 0 (0.0%) | 45 (100.0%) |
| 10 or more Apartments | 0 (0.0%) | 162 (100.0%) |
| Mobile Home / Other | 0 (0.0%) | 9 (100.0%) |
| Total | 5,590 (91.6%) | 515 (8.4%) |
Housing Structures by Number of Rooms in Syosset
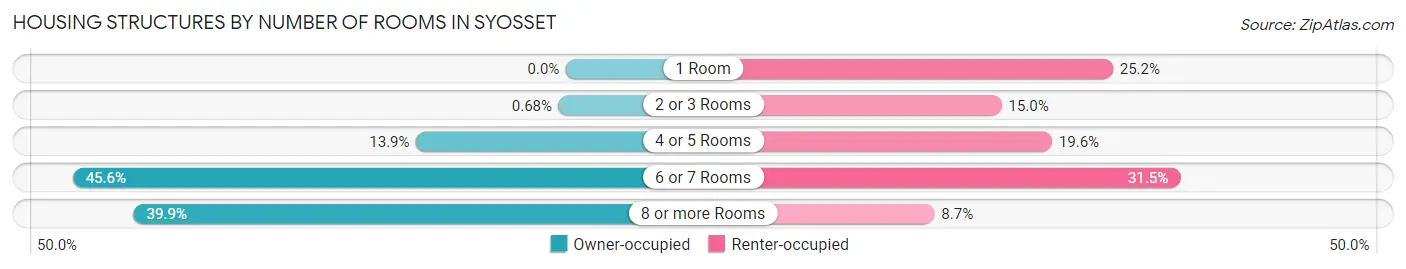
| Number of Rooms | Owner-occupied | Renter-occupied |
| 1 Room | 0 (0.0%) | 130 (25.2%) |
| 2 or 3 Rooms | 38 (0.7%) | 77 (14.9%) |
| 4 or 5 Rooms | 775 (13.9%) | 101 (19.6%) |
| 6 or 7 Rooms | 2,546 (45.6%) | 162 (31.5%) |
| 8 or more Rooms | 2,231 (39.9%) | 45 (8.7%) |
| Total | 5,590 (100.0%) | 515 (100.0%) |
Housing Structure by Heating Type in Syosset
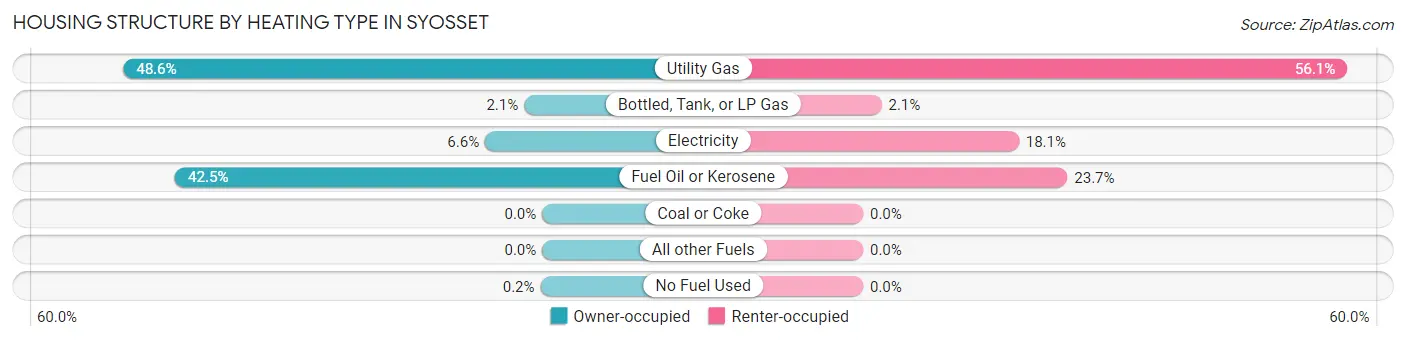
| Heating Type | Owner-occupied | Renter-occupied |
| Utility Gas | 2,714 (48.5%) | 289 (56.1%) |
| Bottled, Tank, or LP Gas | 117 (2.1%) | 11 (2.1%) |
| Electricity | 370 (6.6%) | 93 (18.1%) |
| Fuel Oil or Kerosene | 2,378 (42.5%) | 122 (23.7%) |
| Coal or Coke | 0 (0.0%) | 0 (0.0%) |
| All other Fuels | 0 (0.0%) | 0 (0.0%) |
| No Fuel Used | 11 (0.2%) | 0 (0.0%) |
| Total | 5,590 (100.0%) | 515 (100.0%) |
Household Vehicle Usage in Syosset
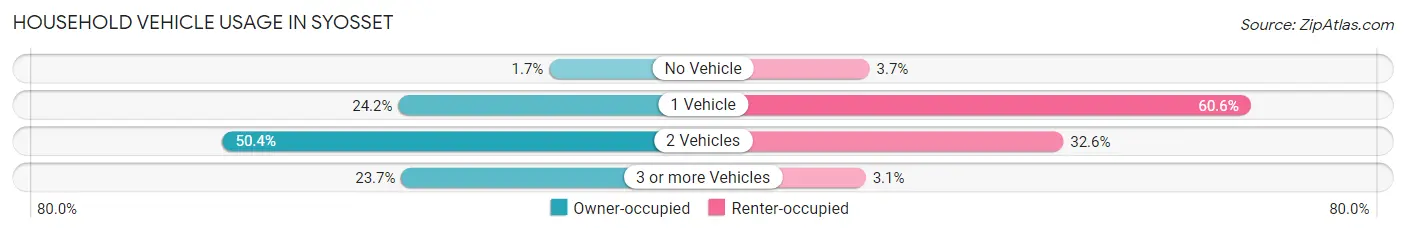
| Vehicles per Household | Owner-occupied | Renter-occupied |
| No Vehicle | 92 (1.7%) | 19 (3.7%) |
| 1 Vehicle | 1,352 (24.2%) | 312 (60.6%) |
| 2 Vehicles | 2,819 (50.4%) | 168 (32.6%) |
| 3 or more Vehicles | 1,327 (23.7%) | 16 (3.1%) |
| Total | 5,590 (100.0%) | 515 (100.0%) |
Real Estate & Mortgages in Syosset
Real Estate and Mortgage Overview in Syosset
| Characteristic | Without Mortgage | With Mortgage |
| Housing Units | 2,157 | 3,433 |
| Median Property Value | $734,700 | $857,600 |
| Median Household Income | $120,272 | $2,502 |
| Monthly Housing Costs | $1,501 | $3,024 |
| Real Estate Taxes | $10,001 | $6 |
Property Value by Mortgage Status in Syosset
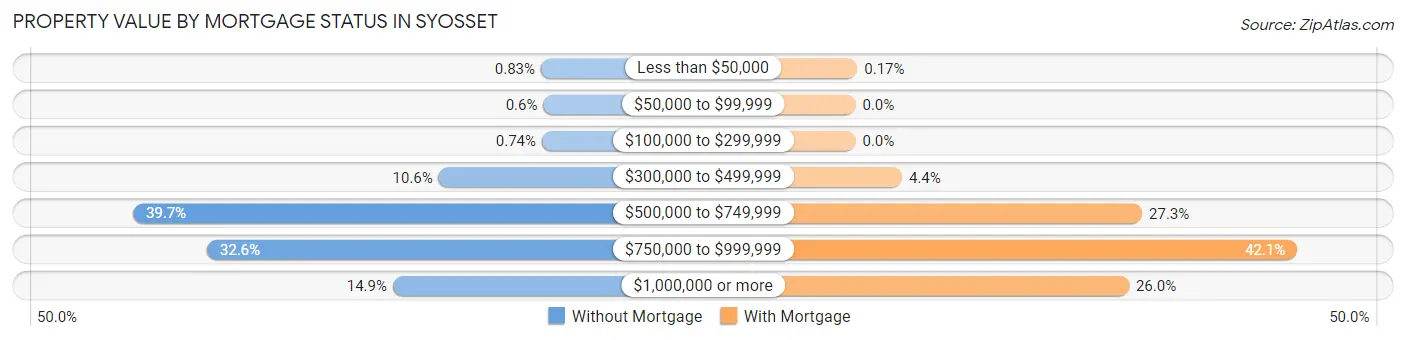
| Property Value | Without Mortgage | With Mortgage |
| Less than $50,000 | 18 (0.8%) | 6 (0.2%) |
| $50,000 to $99,999 | 13 (0.6%) | 0 (0.0%) |
| $100,000 to $299,999 | 16 (0.7%) | 0 (0.0%) |
| $300,000 to $499,999 | 228 (10.6%) | 152 (4.4%) |
| $500,000 to $749,999 | 856 (39.7%) | 937 (27.3%) |
| $750,000 to $999,999 | 704 (32.6%) | 1,444 (42.1%) |
| $1,000,000 or more | 322 (14.9%) | 894 (26.0%) |
| Total | 2,157 (100.0%) | 3,433 (100.0%) |
Household Income by Mortgage Status in Syosset
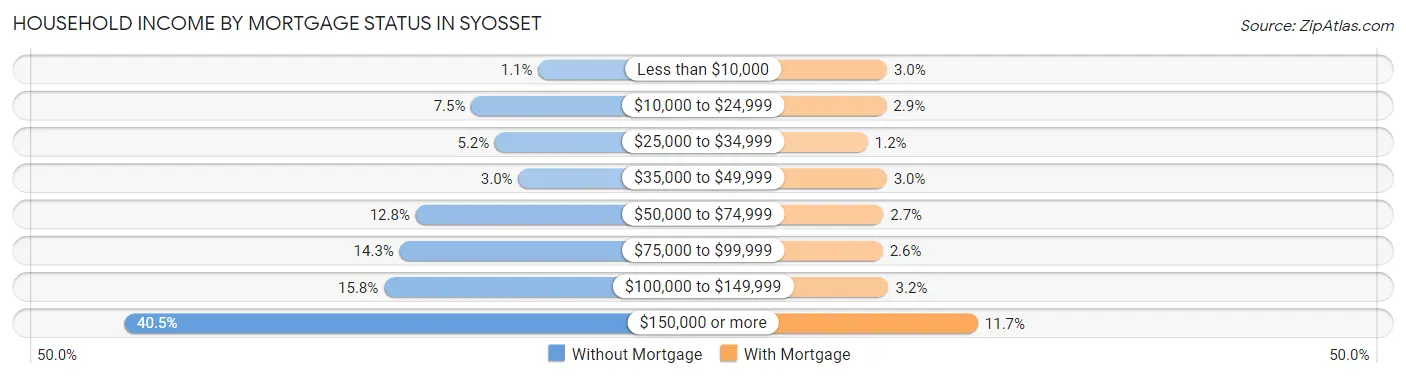
| Household Income | Without Mortgage | With Mortgage |
| Less than $10,000 | 23 (1.1%) | 103 (3.0%) |
| $10,000 to $24,999 | 161 (7.5%) | 101 (2.9%) |
| $25,000 to $34,999 | 112 (5.2%) | 40 (1.2%) |
| $35,000 to $49,999 | 64 (3.0%) | 102 (3.0%) |
| $50,000 to $74,999 | 275 (12.8%) | 91 (2.6%) |
| $75,000 to $99,999 | 308 (14.3%) | 89 (2.6%) |
| $100,000 to $149,999 | 340 (15.8%) | 108 (3.2%) |
| $150,000 or more | 874 (40.5%) | 400 (11.7%) |
| Total | 2,157 (100.0%) | 3,433 (100.0%) |
Property Value to Household Income Ratio in Syosset
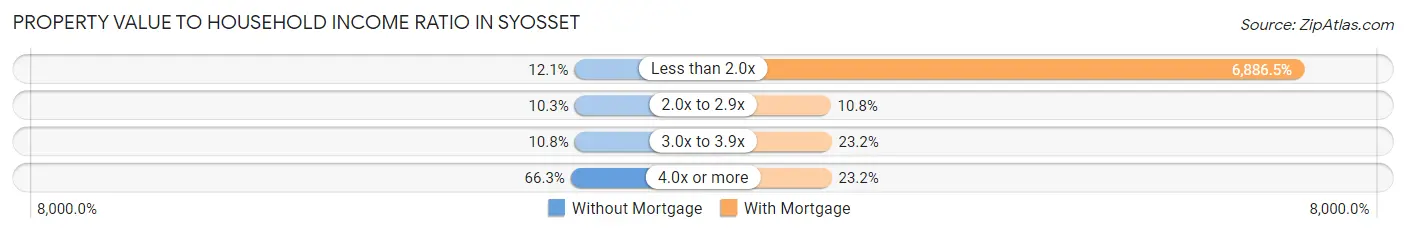
| Value-to-Income Ratio | Without Mortgage | With Mortgage |
| Less than 2.0x | 261 (12.1%) | 236,414 (6,886.5%) |
| 2.0x to 2.9x | 223 (10.3%) | 370 (10.8%) |
| 3.0x to 3.9x | 233 (10.8%) | 797 (23.2%) |
| 4.0x or more | 1,430 (66.3%) | 796 (23.2%) |
| Total | 2,157 (100.0%) | 3,433 (100.0%) |
Real Estate Taxes by Mortgage Status in Syosset
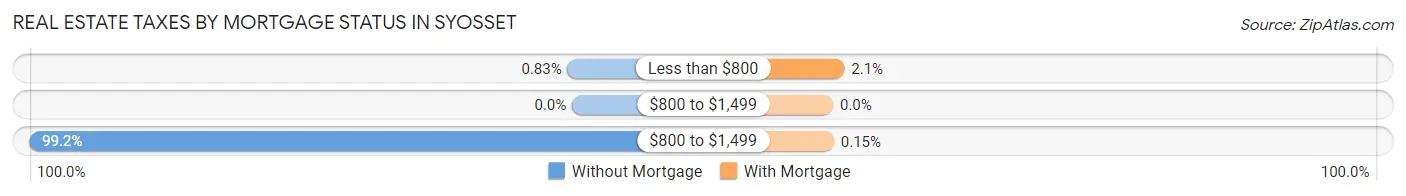
| Property Taxes | Without Mortgage | With Mortgage |
| Less than $800 | 18 (0.8%) | 71 (2.1%) |
| $800 to $1,499 | 0 (0.0%) | 0 (0.0%) |
| $800 to $1,499 | 2,139 (99.2%) | 5 (0.2%) |
| Total | 2,157 (100.0%) | 3,433 (100.0%) |
Health & Disability in Syosset
Health Insurance Coverage by Age in Syosset
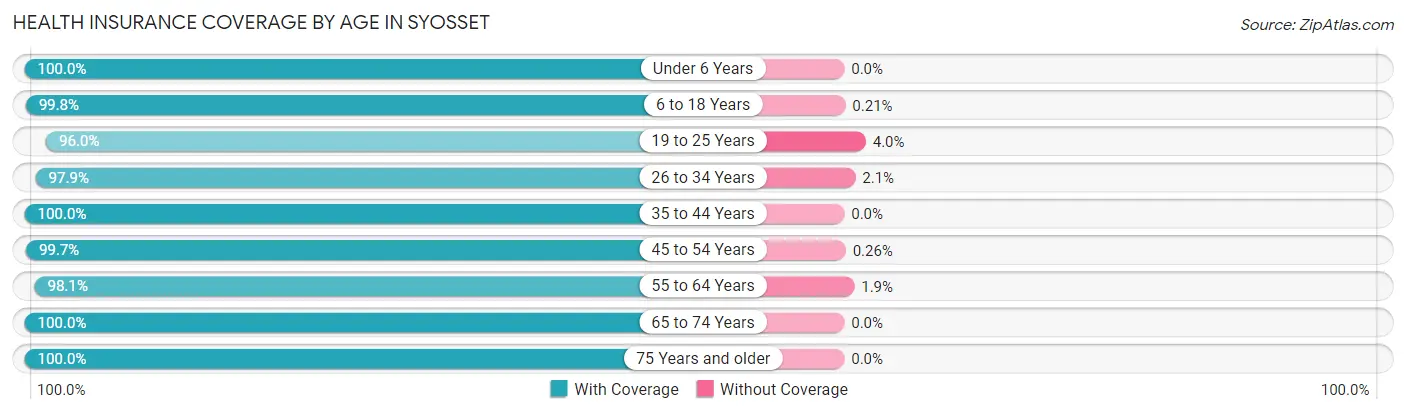
| Age Bracket | With Coverage | Without Coverage |
| Under 6 Years | 883 (100.0%) | 0 (0.0%) |
| 6 to 18 Years | 4,319 (99.8%) | 9 (0.2%) |
| 19 to 25 Years | 1,078 (96.0%) | 45 (4.0%) |
| 26 to 34 Years | 1,281 (97.9%) | 27 (2.1%) |
| 35 to 44 Years | 2,301 (100.0%) | 0 (0.0%) |
| 45 to 54 Years | 3,503 (99.7%) | 9 (0.3%) |
| 55 to 64 Years | 2,220 (98.1%) | 42 (1.9%) |
| 65 to 74 Years | 2,032 (100.0%) | 0 (0.0%) |
| 75 Years and older | 1,009 (100.0%) | 0 (0.0%) |
| Total | 18,626 (99.3%) | 132 (0.7%) |
Health Insurance Coverage by Citizenship Status in Syosset
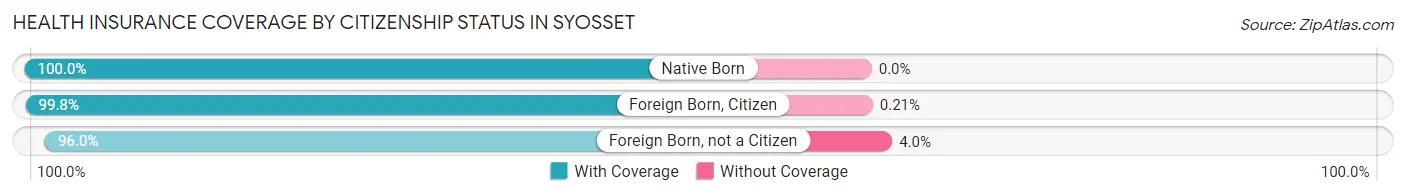
| Citizenship Status | With Coverage | Without Coverage |
| Native Born | 883 (100.0%) | 0 (0.0%) |
| Foreign Born, Citizen | 4,319 (99.8%) | 9 (0.2%) |
| Foreign Born, not a Citizen | 1,078 (96.0%) | 45 (4.0%) |
Health Insurance Coverage by Household Income in Syosset
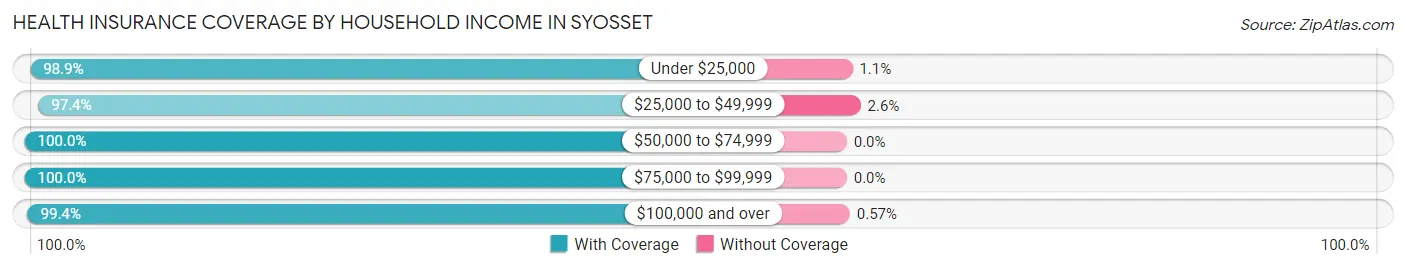
| Household Income | With Coverage | Without Coverage |
| Under $25,000 | 934 (98.9%) | 10 (1.1%) |
| $25,000 to $49,999 | 982 (97.4%) | 26 (2.6%) |
| $50,000 to $74,999 | 923 (100.0%) | 0 (0.0%) |
| $75,000 to $99,999 | 1,274 (100.0%) | 0 (0.0%) |
| $100,000 and over | 14,398 (99.4%) | 83 (0.6%) |
Public vs Private Health Insurance Coverage by Age in Syosset
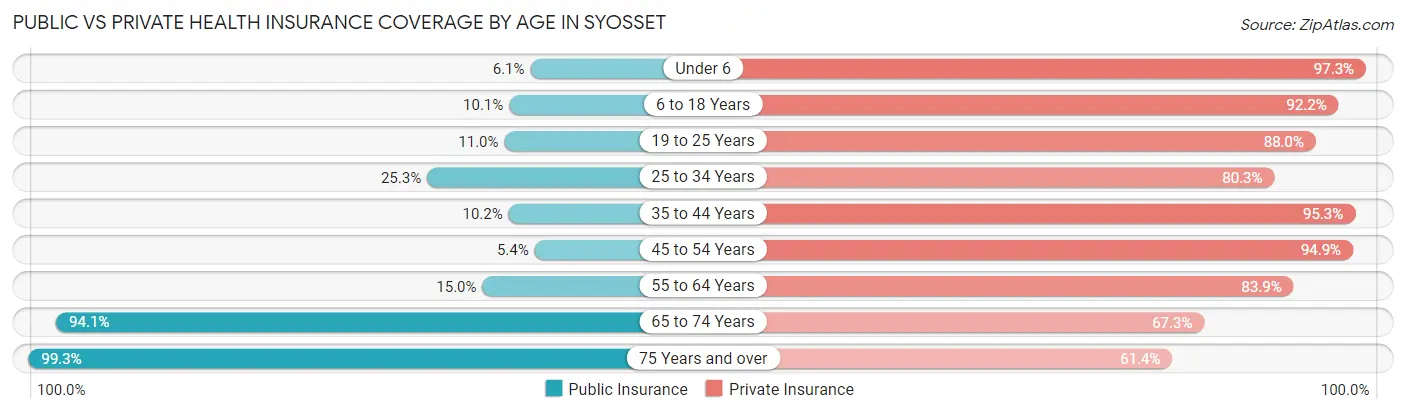
| Age Bracket | Public Insurance | Private Insurance |
| Under 6 | 54 (6.1%) | 859 (97.3%) |
| 6 to 18 Years | 436 (10.1%) | 3,991 (92.2%) |
| 19 to 25 Years | 123 (11.0%) | 988 (88.0%) |
| 25 to 34 Years | 331 (25.3%) | 1,050 (80.3%) |
| 35 to 44 Years | 234 (10.2%) | 2,192 (95.3%) |
| 45 to 54 Years | 188 (5.3%) | 3,332 (94.9%) |
| 55 to 64 Years | 340 (15.0%) | 1,897 (83.9%) |
| 65 to 74 Years | 1,913 (94.1%) | 1,367 (67.3%) |
| 75 Years and over | 1,002 (99.3%) | 619 (61.4%) |
| Total | 4,621 (24.6%) | 16,295 (86.9%) |
Disability Status by Sex by Age in Syosset
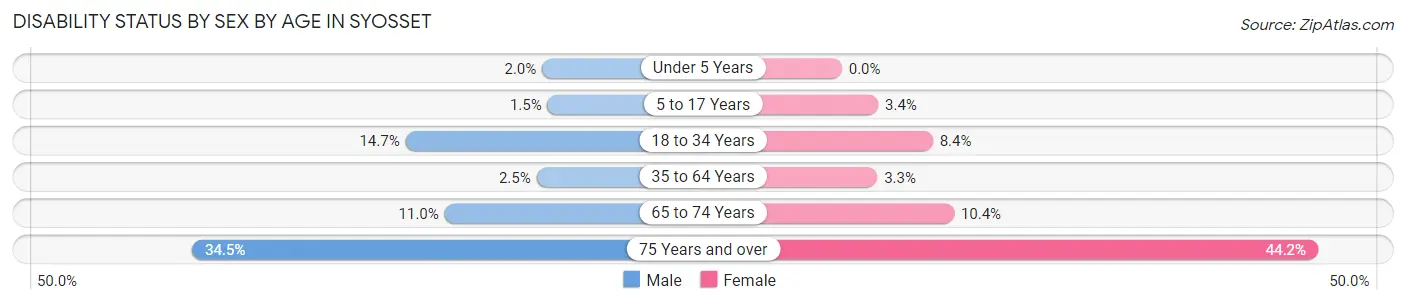
| Age Bracket | Male | Female |
| Under 5 Years | 9 (2.0%) | 0 (0.0%) |
| 5 to 17 Years | 33 (1.5%) | 75 (3.4%) |
| 18 to 34 Years | 196 (14.6%) | 100 (8.4%) |
| 35 to 64 Years | 96 (2.5%) | 139 (3.3%) |
| 65 to 74 Years | 118 (11.0%) | 100 (10.4%) |
| 75 Years and over | 173 (34.5%) | 224 (44.2%) |
Disability Class by Sex by Age in Syosset
Disability Class: Hearing Difficulty
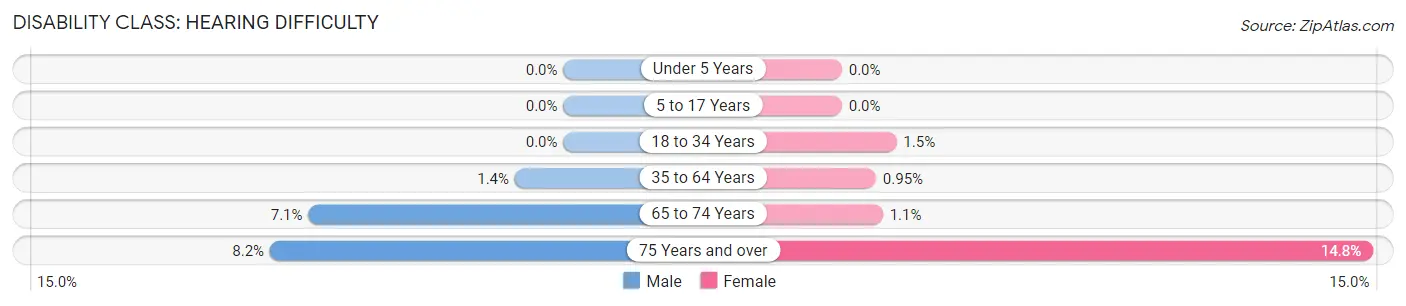
| Age Bracket | Male | Female |
| Under 5 Years | 0 (0.0%) | 0 (0.0%) |
| 5 to 17 Years | 0 (0.0%) | 0 (0.0%) |
| 18 to 34 Years | 0 (0.0%) | 18 (1.5%) |
| 35 to 64 Years | 52 (1.3%) | 40 (0.9%) |
| 65 to 74 Years | 76 (7.1%) | 11 (1.1%) |
| 75 Years and over | 41 (8.2%) | 75 (14.8%) |
Disability Class: Vision Difficulty
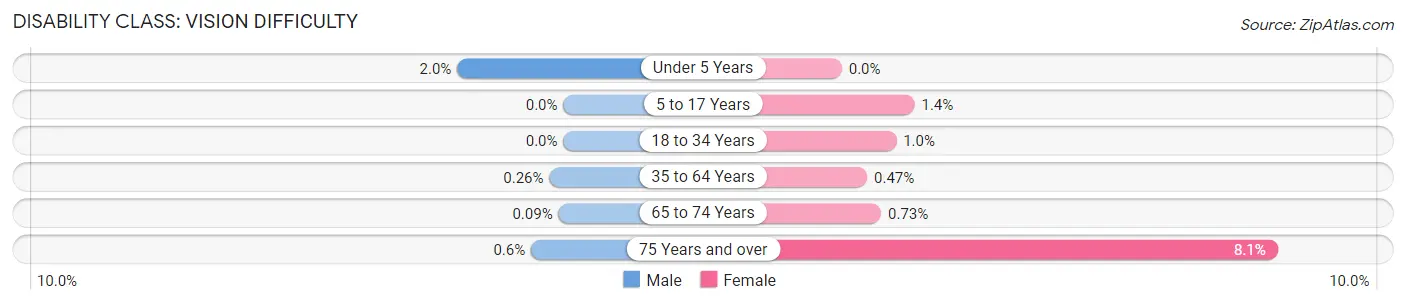
| Age Bracket | Male | Female |
| Under 5 Years | 9 (2.0%) | 0 (0.0%) |
| 5 to 17 Years | 0 (0.0%) | 30 (1.3%) |
| 18 to 34 Years | 0 (0.0%) | 12 (1.0%) |
| 35 to 64 Years | 10 (0.3%) | 20 (0.5%) |
| 65 to 74 Years | 1 (0.1%) | 7 (0.7%) |
| 75 Years and over | 3 (0.6%) | 41 (8.1%) |
Disability Class: Cognitive Difficulty
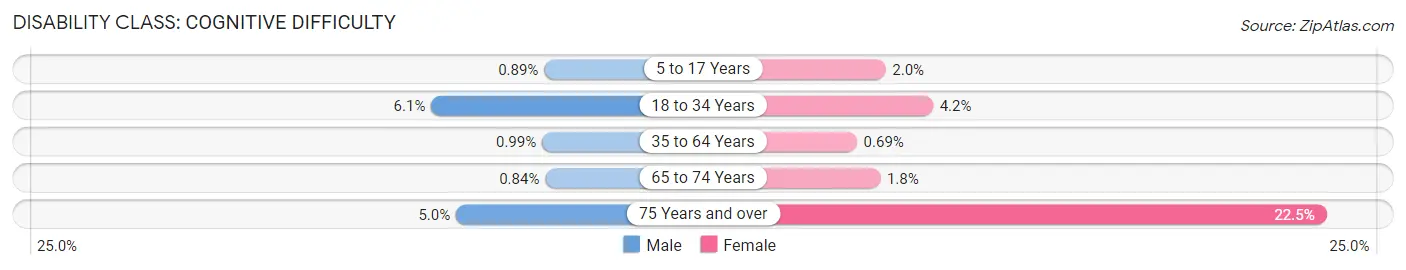
| Age Bracket | Male | Female |
| 5 to 17 Years | 20 (0.9%) | 45 (2.0%) |
| 18 to 34 Years | 82 (6.1%) | 50 (4.2%) |
| 35 to 64 Years | 38 (1.0%) | 29 (0.7%) |
| 65 to 74 Years | 9 (0.8%) | 17 (1.8%) |
| 75 Years and over | 25 (5.0%) | 114 (22.5%) |
Disability Class: Ambulatory Difficulty
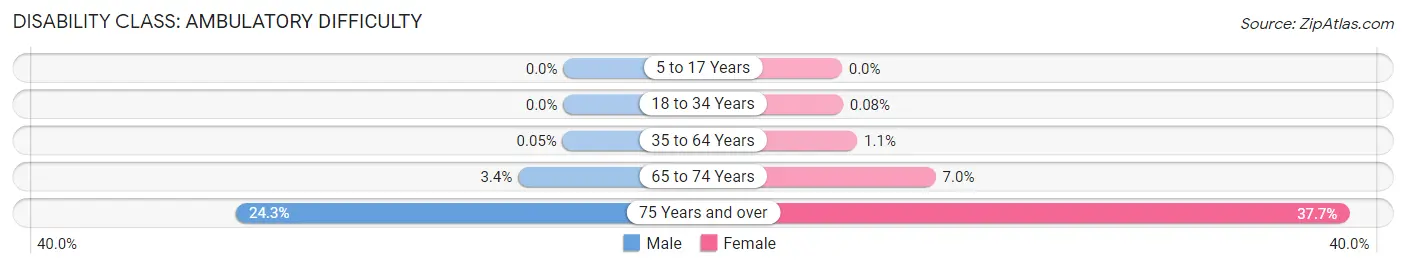
| Age Bracket | Male | Female |
| 5 to 17 Years | 0 (0.0%) | 0 (0.0%) |
| 18 to 34 Years | 0 (0.0%) | 1 (0.1%) |
| 35 to 64 Years | 2 (0.1%) | 48 (1.1%) |
| 65 to 74 Years | 36 (3.4%) | 67 (7.0%) |
| 75 Years and over | 122 (24.3%) | 191 (37.7%) |
Disability Class: Self-Care Difficulty
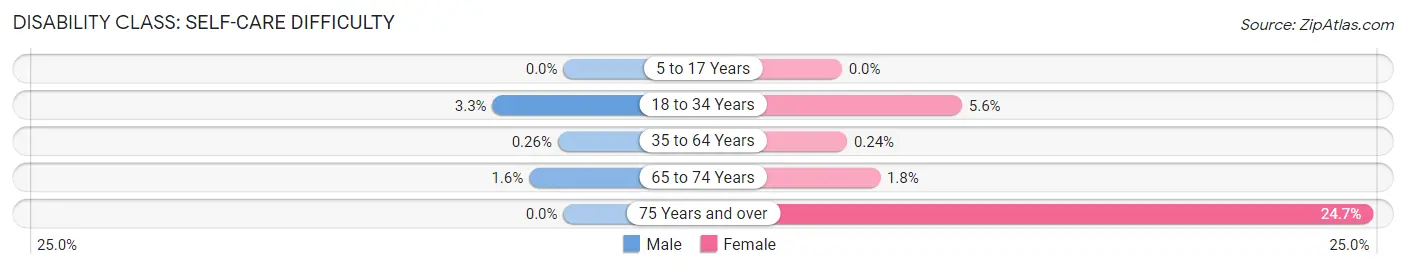
| Age Bracket | Male | Female |
| 5 to 17 Years | 0 (0.0%) | 0 (0.0%) |
| 18 to 34 Years | 44 (3.3%) | 66 (5.6%) |
| 35 to 64 Years | 10 (0.3%) | 10 (0.2%) |
| 65 to 74 Years | 17 (1.6%) | 17 (1.8%) |
| 75 Years and over | 0 (0.0%) | 125 (24.6%) |
Technology Access in Syosset
Computing Device Access in Syosset
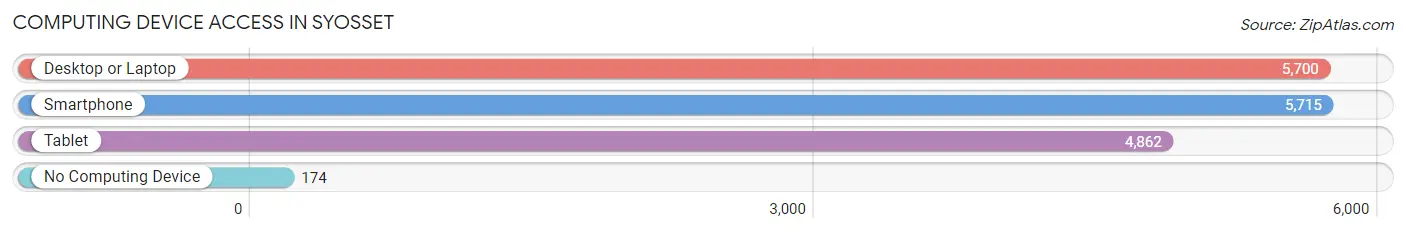
| Device Type | # Households | % Households |
| Desktop or Laptop | 5,700 | 93.4% |
| Smartphone | 5,715 | 93.6% |
| Tablet | 4,862 | 79.6% |
| No Computing Device | 174 | 2.9% |
| Total | 6,105 | 100.0% |
Internet Access in Syosset
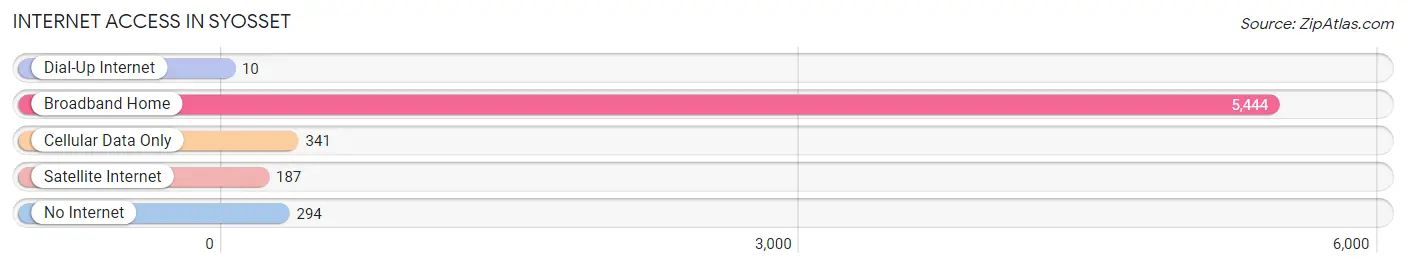
| Internet Type | # Households | % Households |
| Dial-Up Internet | 10 | 0.2% |
| Broadband Home | 5,444 | 89.2% |
| Cellular Data Only | 341 | 5.6% |
| Satellite Internet | 187 | 3.1% |
| No Internet | 294 | 4.8% |
| Total | 6,105 | 100.0% |
Syosset Summary
Syosset, NY is a hamlet located in the Town of Oyster Bay in Nassau County, New York. It is situated on the North Shore of Long Island, approximately 25 miles east of Manhattan. The hamlet is bordered by the hamlets of Jericho, Woodbury, and Muttontown, and is home to a population of approximately 19,000 people.
History
The area now known as Syosset was originally inhabited by the Matinecock Native American tribe. The first European settlers arrived in the area in 1653, and the hamlet was officially established in 1680. The name “Syosset” is derived from the Native American word “Sisawehase,” which means “place of the pines.”
In the late 19th century, Syosset became a popular summer resort destination for wealthy New Yorkers. The hamlet was home to several grand hotels, including the Syosset Hotel, which was built in 1875 and demolished in the 1950s.
In the early 20th century, Syosset began to experience rapid population growth as the Long Island Rail Road expanded its service to the area. The hamlet was officially incorporated in 1929, and the population continued to grow throughout the mid-20th century.
Geography
Syosset is located in the Town of Oyster Bay in Nassau County, New York. It is situated on the North Shore of Long Island, approximately 25 miles east of Manhattan. The hamlet is bordered by the hamlets of Jericho, Woodbury, and Muttontown.
The hamlet is located in the northern part of the Town of Oyster Bay, and is home to a total area of 8.3 square miles. The terrain is mostly flat, with some rolling hills in the northern part of the hamlet. The highest point in Syosset is located at the intersection of Jericho Turnpike and Underhill Boulevard, and is approximately 200 feet above sea level.
Economy
Syosset’s economy is largely based on the service industry, with many residents employed in retail, hospitality, and healthcare. The hamlet is also home to several corporate headquarters, including the global headquarters of the Hain Celestial Group, a natural and organic food company.
The hamlet is also home to several shopping centers, including the Syosset Shopping Center, which is home to a variety of stores and restaurants. The hamlet is also home to several parks and recreational facilities, including the Syosset-Woodbury Community Park, which features a variety of sports fields, playgrounds, and walking trails.
Demographics
As of the 2010 census, Syosset had a population of 19,000 people. The racial makeup of the hamlet was 79.2% White, 8.2% Asian, 6.7% Hispanic or Latino, and 5.9% African American. The median household income was $107,000, and the median age was 43.
Syosset is home to a variety of religious institutions, including several churches, synagogues, and mosques. The hamlet is also home to a variety of public and private schools, including Syosset High School, which is part of the Syosset Central School District.
Common Questions
What is Per Capita Income in Syosset?
Per Capita income in Syosset is $74,045.
What is the Median Family Income in Syosset?
Median Family Income in Syosset is $209,844.
What is the Median Household income in Syosset?
Median Household Income in Syosset is $180,297.
What is Income or Wage Gap in Syosset?
Income or Wage Gap in Syosset is 39.7%.
Women in Syosset earn 60.3 cents for every dollar earned by a man.
What is Family Income Deficit in Syosset?
Family Income Deficit in Syosset is $7,979.
Families that are below poverty line in Syosset earn $7,979 less on average than the poverty threshold level.
What is Inequality or Gini Index in Syosset?
Inequality or Gini Index in Syosset is 0.45.
What is the Total Population of Syosset?
Total Population of Syosset is 18,807.
What is the Total Male Population of Syosset?
Total Male Population of Syosset is 9,508.
What is the Total Female Population of Syosset?
Total Female Population of Syosset is 9,299.
What is the Ratio of Males per 100 Females in Syosset?
There are 102.25 Males per 100 Females in Syosset.
What is the Ratio of Females per 100 Males in Syosset?
There are 97.80 Females per 100 Males in Syosset.
What is the Median Population Age in Syosset?
Median Population Age in Syosset is 42.9 Years.
What is the Average Family Size in Syosset
Average Family Size in Syosset is 3.4 People.
What is the Average Household Size in Syosset
Average Household Size in Syosset is 3.0 People.
How Large is the Labor Force in Syosset?
There are 9,193 People in the Labor Forcein in Syosset.
What is the Percentage of People in the Labor Force in Syosset?
63.7% of People are in the Labor Force in Syosset.
What is the Unemployment Rate in Syosset?
Unemployment Rate in Syosset is 3.9%.