Mamaroneck, NY Map & Demographics
Mamaroneck Map
Mamaroneck Overview
$66,178
PER CAPITA INCOME
$144,886
AVG FAMILY INCOME
$121,672
AVG HOUSEHOLD INCOME
19.4%
WAGE / INCOME GAP [ % ]
80.6¢/ $1
WAGE / INCOME GAP [ $ ]
0.50
INEQUALITY / GINI INDEX
19,930
TOTAL POPULATION
10,296
MALE POPULATION
9,634
FEMALE POPULATION
106.87
MALES / 100 FEMALES
93.57
FEMALES / 100 MALES
40.8
MEDIAN AGE
3.2
AVG FAMILY SIZE
2.8
AVG HOUSEHOLD SIZE
10,851
LABOR FORCE [ PEOPLE ]
69.2%
PERCENT IN LABOR FORCE
3.6%
UNEMPLOYMENT RATE
Mamaroneck Zip Codes
Mamaroneck Area Codes
Income in Mamaroneck
Income Overview in Mamaroneck
Per Capita Income in Mamaroneck is $66,178, while median incomes of families and households are $144,886 and $121,672 respectively.
| Characteristic | Number | Measure |
| Per Capita Income | 19,930 | $66,178 |
| Median Family Income | 5,213 | $144,886 |
| Mean Family Income | 5,213 | $214,516 |
| Median Household Income | 7,057 | $121,672 |
| Mean Household Income | 7,057 | $181,847 |
| Income Deficit | 5,213 | $0 |
| Wage / Income Gap (%) | 19,930 | 19.42% |
| Wage / Income Gap ($) | 19,930 | 80.58¢ per $1 |
| Gini / Inequality Index | 19,930 | 0.50 |
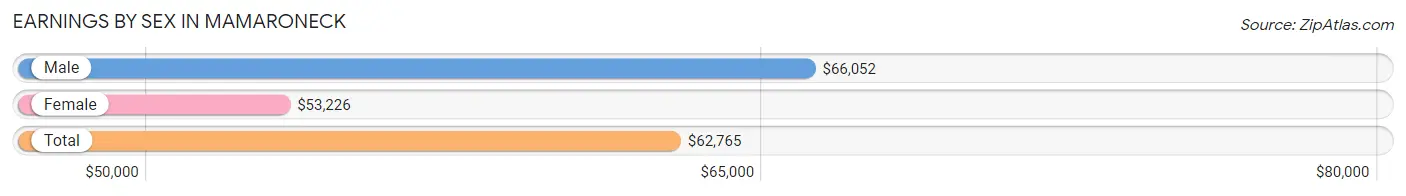
Earnings by Sex in Mamaroneck
Average Earnings in Mamaroneck are $62,765, $66,052 for men and $53,226 for women, a difference of 19.4%.
| Sex | Number | Average Earnings |
| Male | 6,287 (54.9%) | $66,052 |
| Female | 5,164 (45.1%) | $53,226 |
| Total | 11,451 (100.0%) | $62,765 |
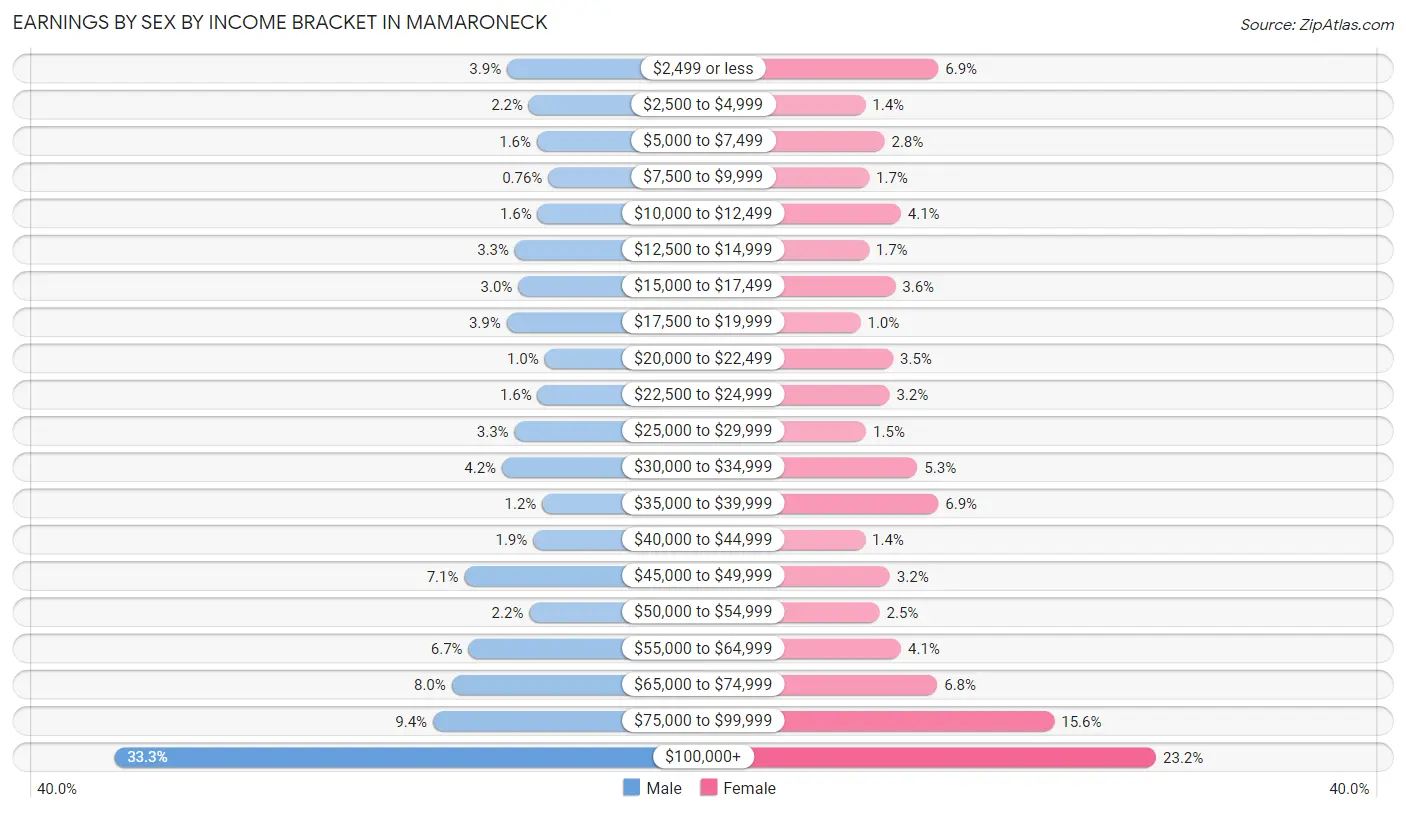
Earnings by Sex by Income Bracket in Mamaroneck
The most common earnings brackets in Mamaroneck are $100,000+ for men (2,092 | 33.3%) and $100,000+ for women (1,197 | 23.2%).
| Income | Male | Female |
| $2,499 or less | 242 (3.8%) | 354 (6.9%) |
| $2,500 to $4,999 | 139 (2.2%) | 72 (1.4%) |
| $5,000 to $7,499 | 101 (1.6%) | 146 (2.8%) |
| $7,500 to $9,999 | 48 (0.8%) | 86 (1.7%) |
| $10,000 to $12,499 | 98 (1.6%) | 209 (4.1%) |
| $12,500 to $14,999 | 205 (3.3%) | 85 (1.7%) |
| $15,000 to $17,499 | 189 (3.0%) | 188 (3.6%) |
| $17,500 to $19,999 | 244 (3.9%) | 53 (1.0%) |
| $20,000 to $22,499 | 65 (1.0%) | 179 (3.5%) |
| $22,500 to $24,999 | 98 (1.6%) | 165 (3.2%) |
| $25,000 to $29,999 | 207 (3.3%) | 75 (1.5%) |
| $30,000 to $34,999 | 266 (4.2%) | 273 (5.3%) |
| $35,000 to $39,999 | 76 (1.2%) | 354 (6.9%) |
| $40,000 to $44,999 | 119 (1.9%) | 71 (1.4%) |
| $45,000 to $49,999 | 443 (7.0%) | 167 (3.2%) |
| $50,000 to $54,999 | 137 (2.2%) | 127 (2.5%) |
| $55,000 to $64,999 | 424 (6.7%) | 210 (4.1%) |
| $65,000 to $74,999 | 503 (8.0%) | 350 (6.8%) |
| $75,000 to $99,999 | 591 (9.4%) | 803 (15.5%) |
| $100,000+ | 2,092 (33.3%) | 1,197 (23.2%) |
| Total | 6,287 (100.0%) | 5,164 (100.0%) |
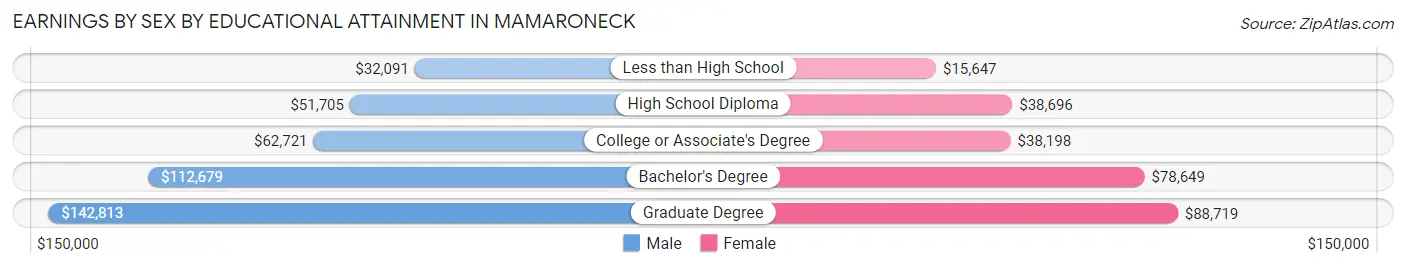
Earnings by Sex by Educational Attainment in Mamaroneck
Average earnings in Mamaroneck are $70,978 for men and $66,645 for women, a difference of 6.1%. Men with an educational attainment of graduate degree enjoy the highest average annual earnings of $142,813, while those with less than high school education earn the least with $32,091. Women with an educational attainment of graduate degree earn the most with the average annual earnings of $88,719, while those with less than high school education have the smallest earnings of $15,647.
| Educational Attainment | Male Income | Female Income |
| Less than High School | $32,091 | $15,647 |
| High School Diploma | $51,705 | $38,696 |
| College or Associate's Degree | $62,721 | $38,198 |
| Bachelor's Degree | $112,679 | $78,649 |
| Graduate Degree | $142,813 | $88,719 |
| Total | $70,978 | $66,645 |
Family Income in Mamaroneck
Family Income Brackets in Mamaroneck
According to the Mamaroneck family income data, there are 1,871 families falling into the $200,000+ income range, which is the most common income bracket and makes up 35.9% of all families.
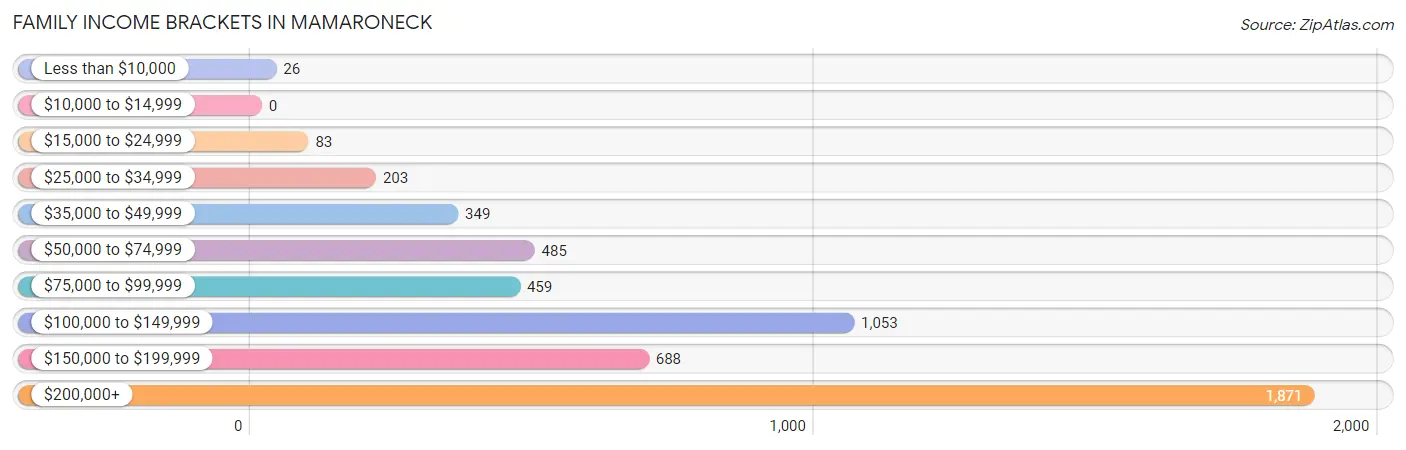
| Income Bracket | # Families | % Families |
| Less than $10,000 | 26 | 0.5% |
| $10,000 to $14,999 | 0 | 0.0% |
| $15,000 to $24,999 | 83 | 1.6% |
| $25,000 to $34,999 | 203 | 3.9% |
| $35,000 to $49,999 | 349 | 6.7% |
| $50,000 to $74,999 | 485 | 9.3% |
| $75,000 to $99,999 | 459 | 8.8% |
| $100,000 to $149,999 | 1,053 | 20.2% |
| $150,000 to $199,999 | 688 | 13.2% |
| $200,000+ | 1,871 | 35.9% |
Family Income by Famaliy Size in Mamaroneck
5-person families (341 | 6.5%) account for the highest median family income in Mamaroneck with $250,001 per family, while 3-person families (1,310 | 25.1%) have the highest median income of $63,507 per family member.
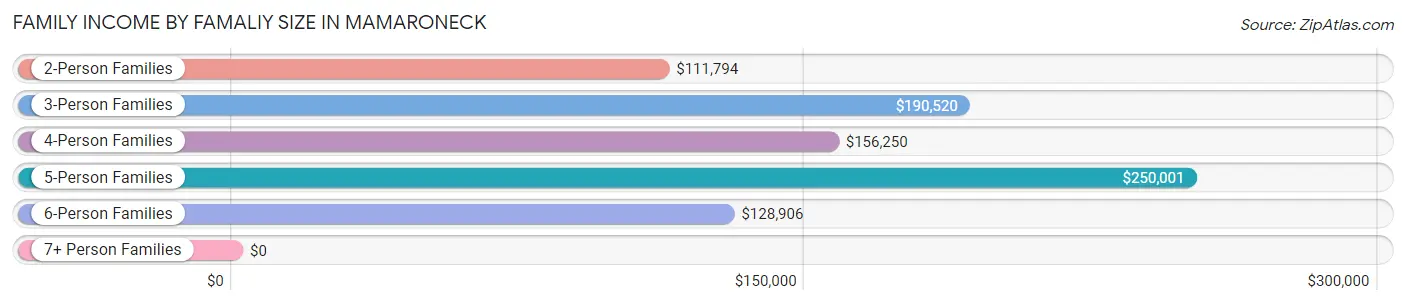
| Income Bracket | # Families | Median Income |
| 2-Person Families | 2,087 (40.0%) | $111,794 |
| 3-Person Families | 1,310 (25.1%) | $190,520 |
| 4-Person Families | 1,292 (24.8%) | $156,250 |
| 5-Person Families | 341 (6.5%) | $250,001 |
| 6-Person Families | 166 (3.2%) | $128,906 |
| 7+ Person Families | 17 (0.3%) | $0 |
| Total | 5,213 (100.0%) | $144,886 |
Family Income by Number of Earners in Mamaroneck
The median family income in Mamaroneck is $144,886, with families comprising 3+ earners (765) having the highest median family income of $187,051, while families with no earners (383) have the lowest median family income of $111,477, accounting for 14.7% and 7.3% of families, respectively.
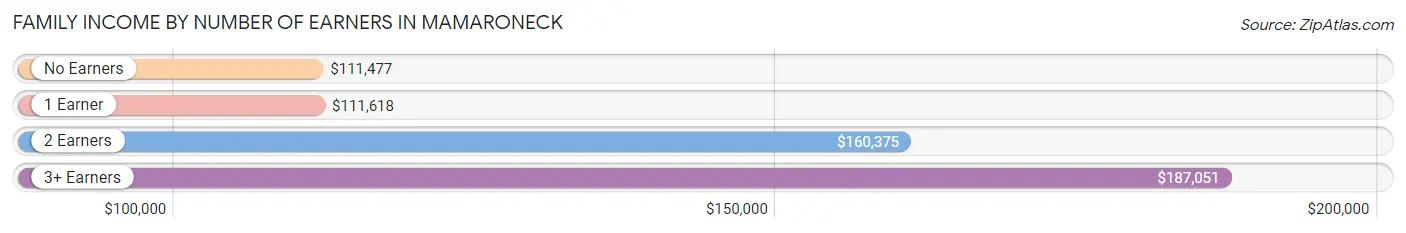
| Number of Earners | # Families | Median Income |
| No Earners | 383 (7.3%) | $111,477 |
| 1 Earner | 1,354 (26.0%) | $111,618 |
| 2 Earners | 2,711 (52.0%) | $160,375 |
| 3+ Earners | 765 (14.7%) | $187,051 |
| Total | 5,213 (100.0%) | $144,886 |
Household Income in Mamaroneck
Household Income Brackets in Mamaroneck
With 2,138 households falling in the category, the $200,000+ income range is the most frequent in Mamaroneck, accounting for 30.3% of all households. In contrast, only 106 households (1.5%) fall into the $10,000 to $14,999 income bracket, making it the least populous group.
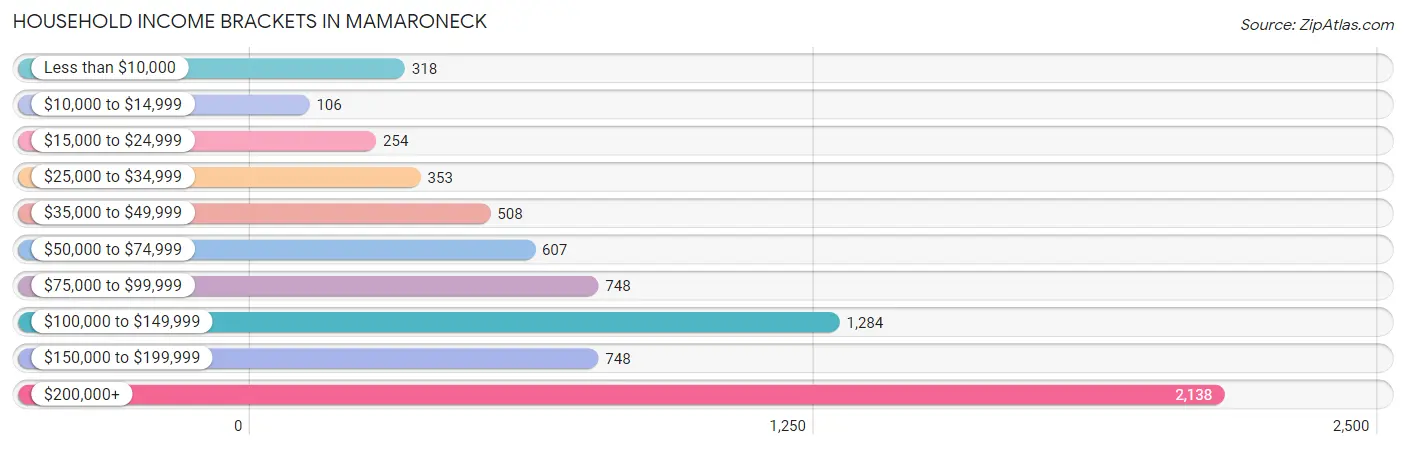
| Income Bracket | # Households | % Households |
| Less than $10,000 | 318 | 4.5% |
| $10,000 to $14,999 | 106 | 1.5% |
| $15,000 to $24,999 | 254 | 3.6% |
| $25,000 to $34,999 | 353 | 5.0% |
| $35,000 to $49,999 | 508 | 7.2% |
| $50,000 to $74,999 | 607 | 8.6% |
| $75,000 to $99,999 | 748 | 10.6% |
| $100,000 to $149,999 | 1,284 | 18.2% |
| $150,000 to $199,999 | 748 | 10.6% |
| $200,000+ | 2,138 | 30.3% |
Household Income by Householder Age in Mamaroneck
The median household income in Mamaroneck is $121,672, with the highest median household income of $155,511 found in the 25 to 44 years age bracket for the primary householder. A total of 2,125 households (30.1%) fall into this category. Meanwhile, the 15 to 24 years age bracket for the primary householder has the lowest median household income of $0, with 28 households (0.4%) in this group.
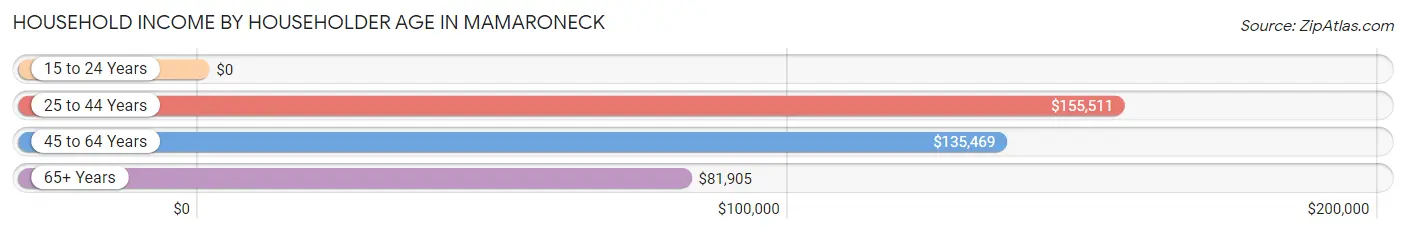
| Income Bracket | # Households | Median Income |
| 15 to 24 Years | 28 (0.4%) | $0 |
| 25 to 44 Years | 2,125 (30.1%) | $155,511 |
| 45 to 64 Years | 2,808 (39.8%) | $135,469 |
| 65+ Years | 2,096 (29.7%) | $81,905 |
| Total | 7,057 (100.0%) | $121,672 |
Poverty in Mamaroneck
Income Below Poverty by Sex and Age in Mamaroneck
With 7.7% poverty level for males and 5.3% for females among the residents of Mamaroneck, 15 year old males and under 5 year old females are the most vulnerable to poverty, with 39 males (31.5%) and 57 females (17.1%) in their respective age groups living below the poverty level.
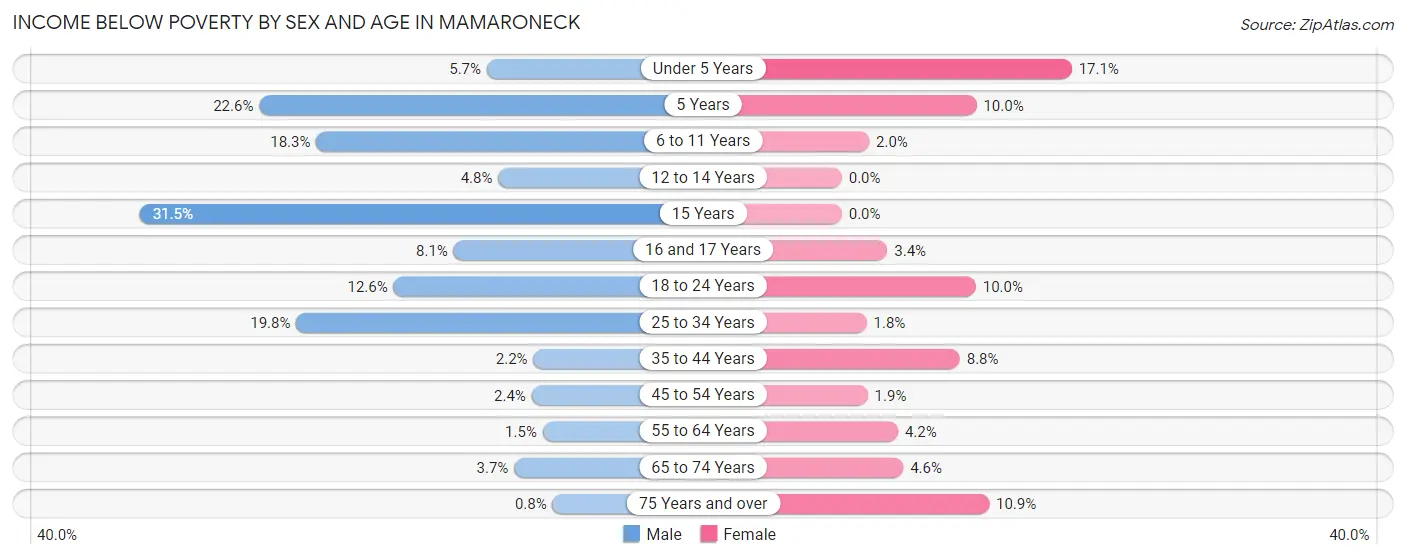
| Age Bracket | Male | Female |
| Under 5 Years | 42 (5.7%) | 57 (17.1%) |
| 5 Years | 14 (22.6%) | 7 (10.0%) |
| 6 to 11 Years | 146 (18.3%) | 24 (2.0%) |
| 12 to 14 Years | 27 (4.8%) | 0 (0.0%) |
| 15 Years | 39 (31.5%) | 0 (0.0%) |
| 16 and 17 Years | 7 (8.1%) | 9 (3.4%) |
| 18 to 24 Years | 100 (12.6%) | 65 (10.0%) |
| 25 to 34 Years | 287 (19.8%) | 16 (1.8%) |
| 35 to 44 Years | 37 (2.2%) | 103 (8.8%) |
| 45 to 54 Years | 37 (2.4%) | 30 (1.9%) |
| 55 to 64 Years | 14 (1.5%) | 51 (4.2%) |
| 65 to 74 Years | 28 (3.6%) | 38 (4.6%) |
| 75 Years and over | 5 (0.8%) | 105 (10.9%) |
| Total | 783 (7.7%) | 505 (5.3%) |
Income Above Poverty by Sex and Age in Mamaroneck
According to the poverty statistics in Mamaroneck, males aged 75 years and over and females aged 12 to 14 years are the age groups that are most secure financially, with 99.2% of males and 100.0% of females in these age groups living above the poverty line.
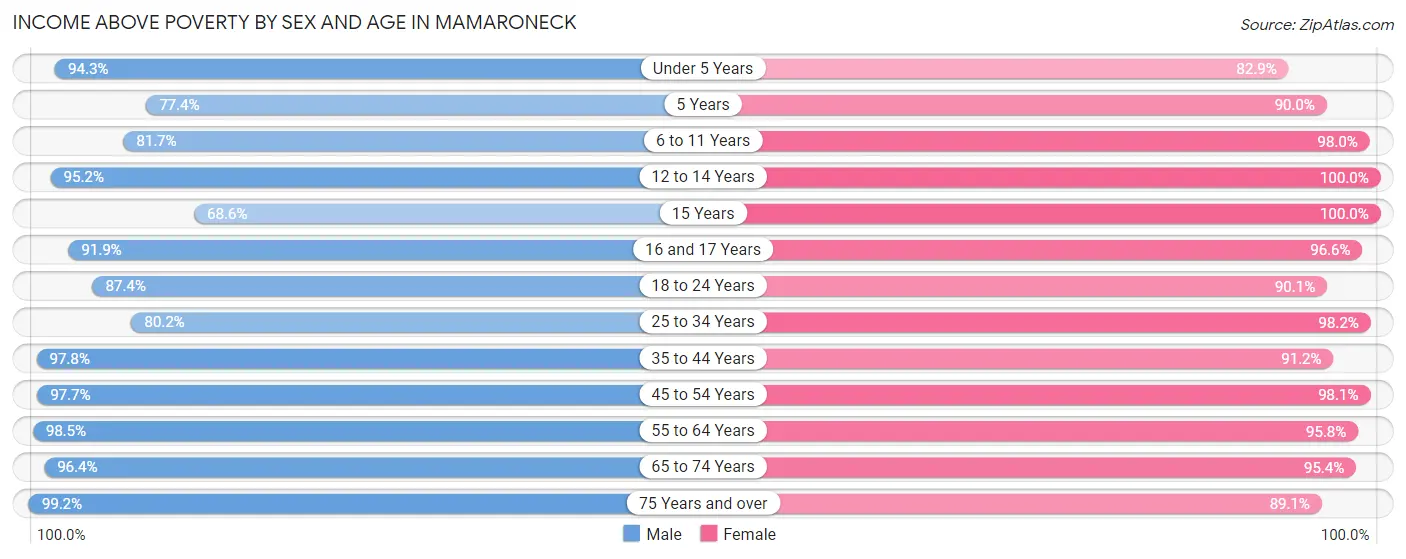
| Age Bracket | Male | Female |
| Under 5 Years | 698 (94.3%) | 277 (82.9%) |
| 5 Years | 48 (77.4%) | 63 (90.0%) |
| 6 to 11 Years | 650 (81.7%) | 1,159 (98.0%) |
| 12 to 14 Years | 532 (95.2%) | 227 (100.0%) |
| 15 Years | 85 (68.5%) | 154 (100.0%) |
| 16 and 17 Years | 79 (91.9%) | 257 (96.6%) |
| 18 to 24 Years | 693 (87.4%) | 588 (90.0%) |
| 25 to 34 Years | 1,160 (80.2%) | 855 (98.2%) |
| 35 to 44 Years | 1,626 (97.8%) | 1,073 (91.2%) |
| 45 to 54 Years | 1,536 (97.7%) | 1,535 (98.1%) |
| 55 to 64 Years | 901 (98.5%) | 1,172 (95.8%) |
| 65 to 74 Years | 740 (96.4%) | 795 (95.4%) |
| 75 Years and over | 622 (99.2%) | 856 (89.1%) |
| Total | 9,370 (92.3%) | 9,011 (94.7%) |
Income Below Poverty Among Married-Couple Families in Mamaroneck
The poverty statistics for married-couple families in Mamaroneck show that 1.3% or 54 of the total 4,083 families live below the poverty line. Families with 5 or more children have the highest poverty rate of 100.0%, comprising of 17 families. On the other hand, families with no children have the lowest poverty rate of 0.0%, which includes 0 families.
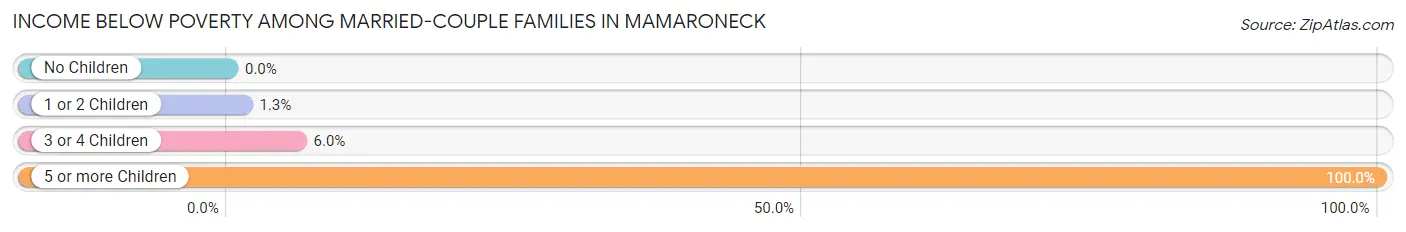
| Children | Above Poverty | Below Poverty |
| No Children | 2,125 (100.0%) | 0 (0.0%) |
| 1 or 2 Children | 1,652 (98.7%) | 21 (1.3%) |
| 3 or 4 Children | 252 (94.0%) | 16 (6.0%) |
| 5 or more Children | 0 (0.0%) | 17 (100.0%) |
| Total | 4,029 (98.7%) | 54 (1.3%) |
Income Below Poverty Among Single-Parent Households in Mamaroneck
According to the poverty data in Mamaroneck, 2.1% or 5 single-father households and 4.9% or 44 single-mother households are living below the poverty line. Among single-father households, those with no children have the highest poverty rate, with 5 households (4.7%) experiencing poverty. Likewise, among single-mother households, those with 1 or 2 children have the highest poverty rate, with 44 households (13.3%) falling below the poverty line.
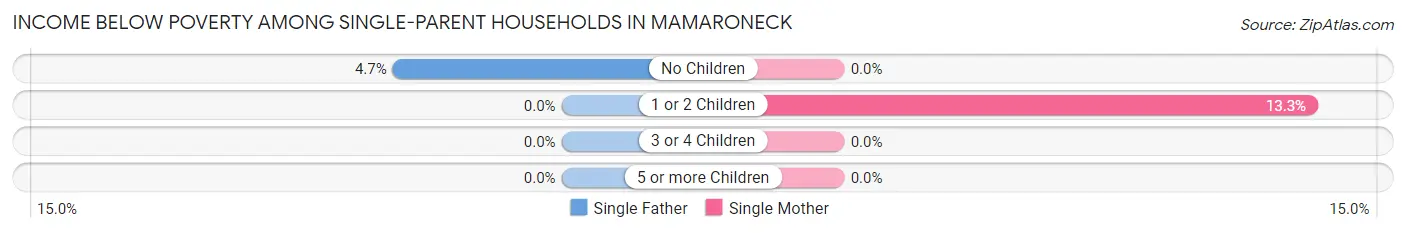
| Children | Single Father | Single Mother |
| No Children | 5 (4.7%) | 0 (0.0%) |
| 1 or 2 Children | 0 (0.0%) | 44 (13.3%) |
| 3 or 4 Children | 0 (0.0%) | 0 (0.0%) |
| 5 or more Children | 0 (0.0%) | 0 (0.0%) |
| Total | 5 (2.1%) | 44 (4.9%) |
Income Below Poverty Among Married-Couple vs Single-Parent Households in Mamaroneck
The poverty data for Mamaroneck shows that 54 of the married-couple family households (1.3%) and 49 of the single-parent households (4.3%) are living below the poverty level. Within the married-couple family households, those with 5 or more children have the highest poverty rate, with 17 households (100.0%) falling below the poverty line. Among the single-parent households, those with 1 or 2 children have the highest poverty rate, with 44 household (9.5%) living below poverty.
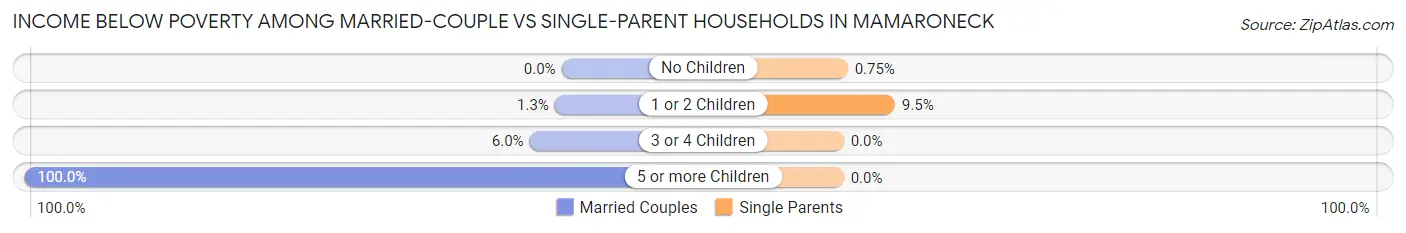
| Children | Married-Couple Families | Single-Parent Households |
| No Children | 0 (0.0%) | 5 (0.7%) |
| 1 or 2 Children | 21 (1.3%) | 44 (9.5%) |
| 3 or 4 Children | 16 (6.0%) | 0 (0.0%) |
| 5 or more Children | 17 (100.0%) | 0 (0.0%) |
| Total | 54 (1.3%) | 49 (4.3%) |
Race in Mamaroneck
The most populous races in Mamaroneck are White / Caucasian (13,910 | 69.8%), Hispanic or Latino (5,394 | 27.1%), and Some other Race (2,606 | 13.1%).
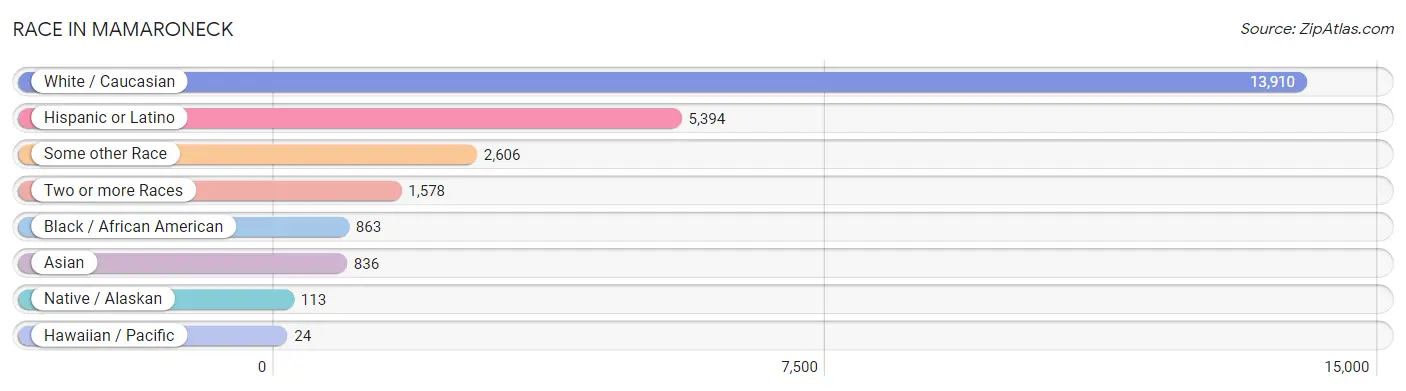
| Race | # Population | % Population |
| Asian | 836 | 4.2% |
| Black / African American | 863 | 4.3% |
| Hawaiian / Pacific | 24 | 0.1% |
| Hispanic or Latino | 5,394 | 27.1% |
| Native / Alaskan | 113 | 0.6% |
| White / Caucasian | 13,910 | 69.8% |
| Two or more Races | 1,578 | 7.9% |
| Some other Race | 2,606 | 13.1% |
| Total | 19,930 | 100.0% |
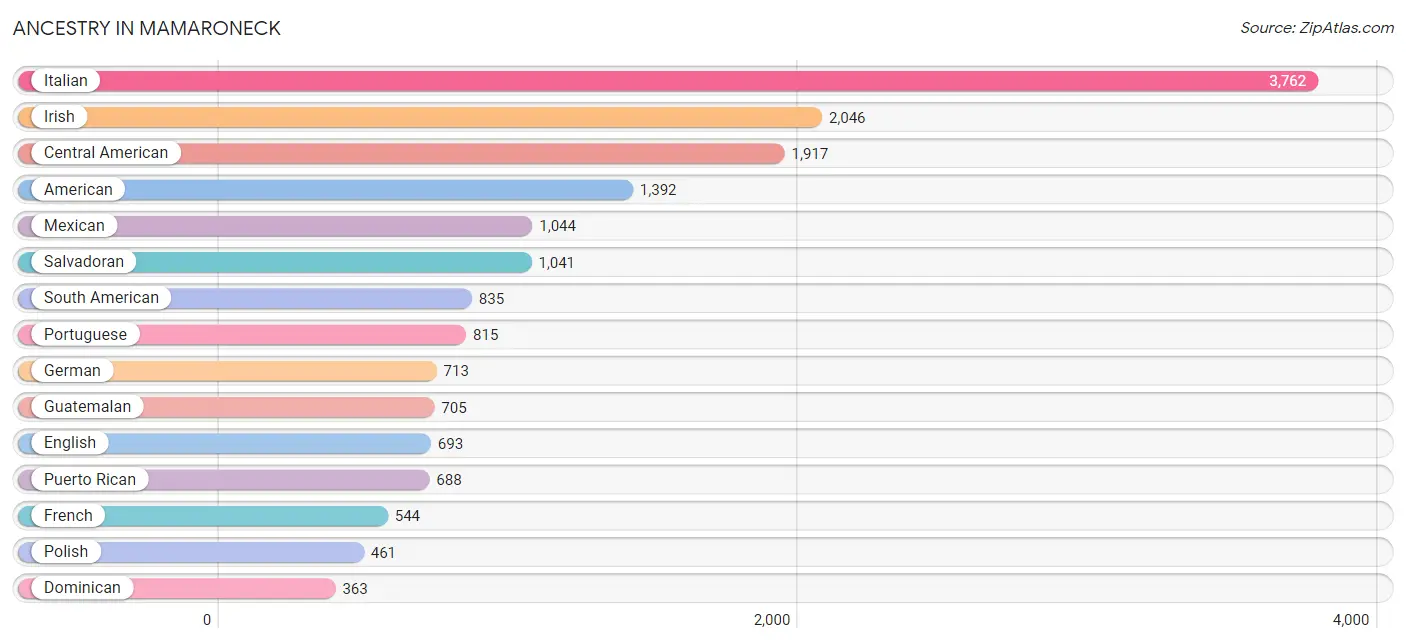
Ancestry in Mamaroneck
The most populous ancestries reported in Mamaroneck are Italian (3,762 | 18.9%), Irish (2,046 | 10.3%), Central American (1,917 | 9.6%), American (1,392 | 7.0%), and Mexican (1,044 | 5.2%), together accounting for 51.0% of all Mamaroneck residents.
| Ancestry | # Population | % Population |
| African | 67 | 0.3% |
| Albanian | 124 | 0.6% |
| Alsatian | 29 | 0.2% |
| American | 1,392 | 7.0% |
| Arab | 315 | 1.6% |
| Argentinean | 37 | 0.2% |
| Armenian | 79 | 0.4% |
| Austrian | 218 | 1.1% |
| Bhutanese | 344 | 1.7% |
| Brazilian | 338 | 1.7% |
| British West Indian | 101 | 0.5% |
| Bulgarian | 67 | 0.3% |
| Burmese | 199 | 1.0% |
| Canadian | 21 | 0.1% |
| Central American | 1,917 | 9.6% |
| Chilean | 53 | 0.3% |
| Colombian | 75 | 0.4% |
| Croatian | 122 | 0.6% |
| Cuban | 277 | 1.4% |
| Czech | 48 | 0.2% |
| Dominican | 363 | 1.8% |
| Dutch | 110 | 0.5% |
| Eastern European | 237 | 1.2% |
| Ecuadorian | 20 | 0.1% |
| English | 693 | 3.5% |
| European | 314 | 1.6% |
| French | 544 | 2.7% |
| French Canadian | 15 | 0.1% |
| German | 713 | 3.6% |
| Greek | 135 | 0.7% |
| Guamanian / Chamorro | 93 | 0.5% |
| Guatemalan | 705 | 3.5% |
| Guyanese | 74 | 0.4% |
| Haitian | 6 | 0.0% |
| Honduran | 48 | 0.2% |
| Hungarian | 147 | 0.7% |
| Indian (Asian) | 98 | 0.5% |
| Iraqi | 12 | 0.1% |
| Irish | 2,046 | 10.3% |
| Israeli | 23 | 0.1% |
| Italian | 3,762 | 18.9% |
| Jamaican | 138 | 0.7% |
| Korean | 190 | 0.9% |
| Latvian | 14 | 0.1% |
| Lebanese | 40 | 0.2% |
| Lithuanian | 78 | 0.4% |
| Mexican | 1,044 | 5.2% |
| Mexican American Indian | 37 | 0.2% |
| Moroccan | 36 | 0.2% |
| Nigerian | 4 | 0.0% |
| Norwegian | 21 | 0.1% |
| Panamanian | 123 | 0.6% |
| Paraguayan | 35 | 0.2% |
| Peruvian | 324 | 1.6% |
| Polish | 461 | 2.3% |
| Portuguese | 815 | 4.1% |
| Puerto Rican | 688 | 3.5% |
| Romanian | 102 | 0.5% |
| Russian | 323 | 1.6% |
| Salvadoran | 1,041 | 5.2% |
| Scandinavian | 33 | 0.2% |
| Scotch-Irish | 14 | 0.1% |
| Scottish | 120 | 0.6% |
| Serbian | 26 | 0.1% |
| Slovak | 20 | 0.1% |
| South American | 835 | 4.2% |
| South American Indian | 53 | 0.3% |
| Spaniard | 49 | 0.3% |
| Spanish | 48 | 0.2% |
| Sri Lankan | 29 | 0.2% |
| Subsaharan African | 71 | 0.4% |
| Swedish | 93 | 0.5% |
| Thai | 145 | 0.7% |
| Turkish | 30 | 0.2% |
| Ukrainian | 72 | 0.4% |
| Uruguayan | 148 | 0.7% |
| Venezuelan | 63 | 0.3% |
| Welsh | 77 | 0.4% |
| West Indian | 50 | 0.3% | View All 79 Rows |
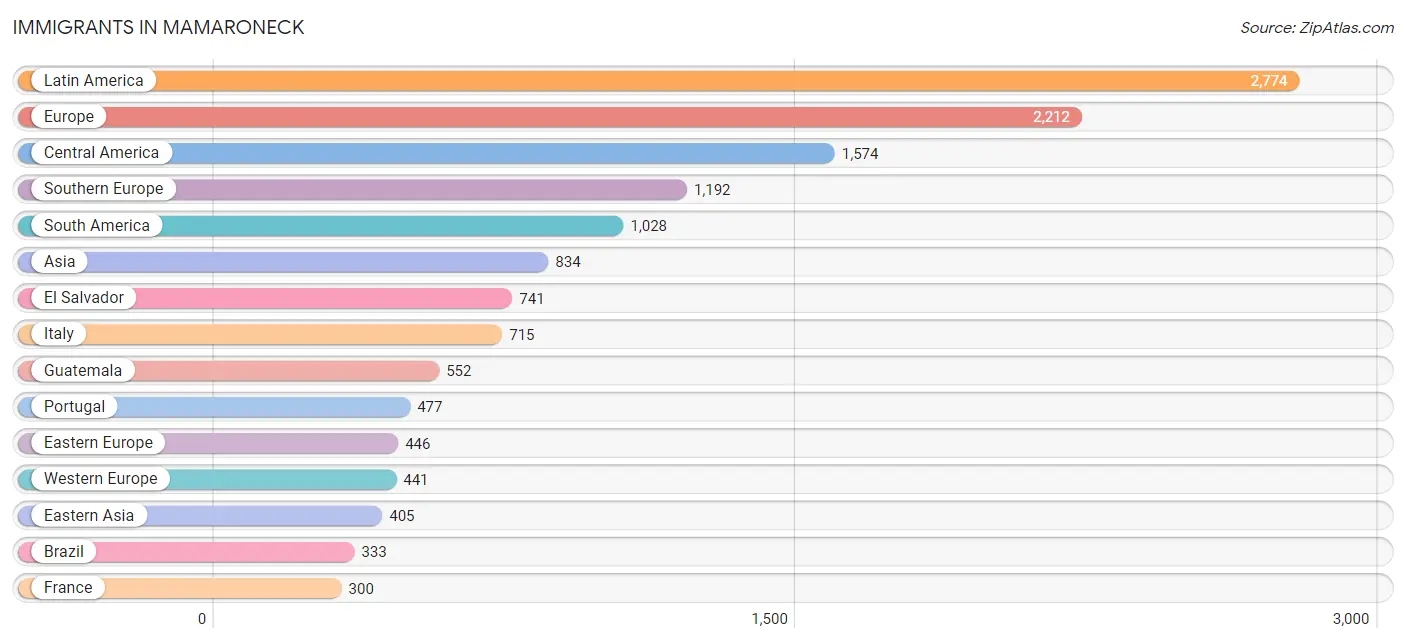
Immigrants in Mamaroneck
The most numerous immigrant groups reported in Mamaroneck came from Latin America (2,774 | 13.9%), Europe (2,212 | 11.1%), Central America (1,574 | 7.9%), Southern Europe (1,192 | 6.0%), and South America (1,028 | 5.2%), together accounting for 44.1% of all Mamaroneck residents.
| Immigration Origin | # Population | % Population |
| Africa | 214 | 1.1% |
| Albania | 54 | 0.3% |
| Argentina | 117 | 0.6% |
| Asia | 834 | 4.2% |
| Austria | 29 | 0.2% |
| Belgium | 18 | 0.1% |
| Brazil | 333 | 1.7% |
| Bulgaria | 47 | 0.2% |
| Canada | 69 | 0.4% |
| Caribbean | 172 | 0.9% |
| Central America | 1,574 | 7.9% |
| Chile | 9 | 0.1% |
| China | 32 | 0.2% |
| Colombia | 15 | 0.1% |
| Croatia | 91 | 0.5% |
| Dominican Republic | 66 | 0.3% |
| Eastern Asia | 405 | 2.0% |
| Eastern Europe | 446 | 2.2% |
| Ecuador | 22 | 0.1% |
| El Salvador | 741 | 3.7% |
| England | 19 | 0.1% |
| Europe | 2,212 | 11.1% |
| France | 300 | 1.5% |
| Germany | 94 | 0.5% |
| Guatemala | 552 | 2.8% |
| Guyana | 74 | 0.4% |
| Hungary | 63 | 0.3% |
| India | 79 | 0.4% |
| Iran | 12 | 0.1% |
| Ireland | 50 | 0.3% |
| Israel | 55 | 0.3% |
| Italy | 715 | 3.6% |
| Jamaica | 57 | 0.3% |
| Japan | 286 | 1.4% |
| Kazakhstan | 10 | 0.1% |
| Korea | 87 | 0.4% |
| Latin America | 2,774 | 13.9% |
| Lebanon | 12 | 0.1% |
| Malaysia | 26 | 0.1% |
| Mexico | 281 | 1.4% |
| Morocco | 29 | 0.2% |
| Northern Africa | 113 | 0.6% |
| Northern Europe | 133 | 0.7% |
| Pakistan | 20 | 0.1% |
| Peru | 223 | 1.1% |
| Philippines | 47 | 0.2% |
| Poland | 44 | 0.2% |
| Portugal | 477 | 2.4% |
| Romania | 23 | 0.1% |
| Russia | 109 | 0.5% |
| Senegal | 9 | 0.1% |
| Singapore | 17 | 0.1% |
| South Africa | 45 | 0.2% |
| South America | 1,028 | 5.2% |
| South Central Asia | 121 | 0.6% |
| South Eastern Asia | 90 | 0.4% |
| Southern Europe | 1,192 | 6.0% |
| Taiwan | 8 | 0.0% |
| Turkey | 52 | 0.3% |
| Ukraine | 8 | 0.0% |
| Uruguay | 102 | 0.5% |
| Venezuela | 69 | 0.4% |
| West Indies | 17 | 0.1% |
| Western Africa | 56 | 0.3% |
| Western Asia | 218 | 1.1% |
| Western Europe | 441 | 2.2% |
| Yemen | 99 | 0.5% | View All 67 Rows |
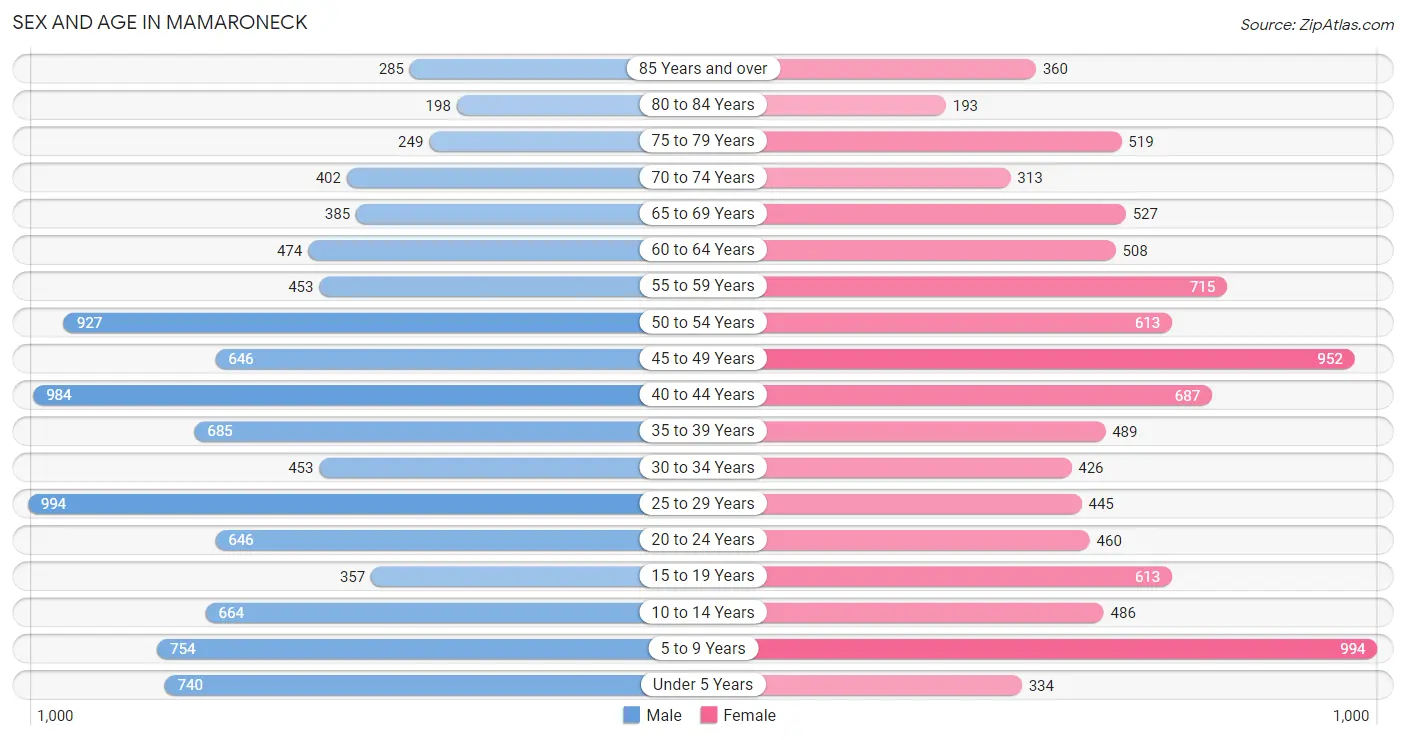
Sex and Age in Mamaroneck
Sex and Age in Mamaroneck
The most populous age groups in Mamaroneck are 25 to 29 Years (994 | 9.7%) for men and 5 to 9 Years (994 | 10.3%) for women.
| Age Bracket | Male | Female |
| Under 5 Years | 740 (7.2%) | 334 (3.5%) |
| 5 to 9 Years | 754 (7.3%) | 994 (10.3%) |
| 10 to 14 Years | 664 (6.5%) | 486 (5.0%) |
| 15 to 19 Years | 357 (3.5%) | 613 (6.4%) |
| 20 to 24 Years | 646 (6.3%) | 460 (4.8%) |
| 25 to 29 Years | 994 (9.7%) | 445 (4.6%) |
| 30 to 34 Years | 453 (4.4%) | 426 (4.4%) |
| 35 to 39 Years | 685 (6.7%) | 489 (5.1%) |
| 40 to 44 Years | 984 (9.6%) | 687 (7.1%) |
| 45 to 49 Years | 646 (6.3%) | 952 (9.9%) |
| 50 to 54 Years | 927 (9.0%) | 613 (6.4%) |
| 55 to 59 Years | 453 (4.4%) | 715 (7.4%) |
| 60 to 64 Years | 474 (4.6%) | 508 (5.3%) |
| 65 to 69 Years | 385 (3.7%) | 527 (5.5%) |
| 70 to 74 Years | 402 (3.9%) | 313 (3.3%) |
| 75 to 79 Years | 249 (2.4%) | 519 (5.4%) |
| 80 to 84 Years | 198 (1.9%) | 193 (2.0%) |
| 85 Years and over | 285 (2.8%) | 360 (3.7%) |
| Total | 10,296 (100.0%) | 9,634 (100.0%) |
Families and Households in Mamaroneck
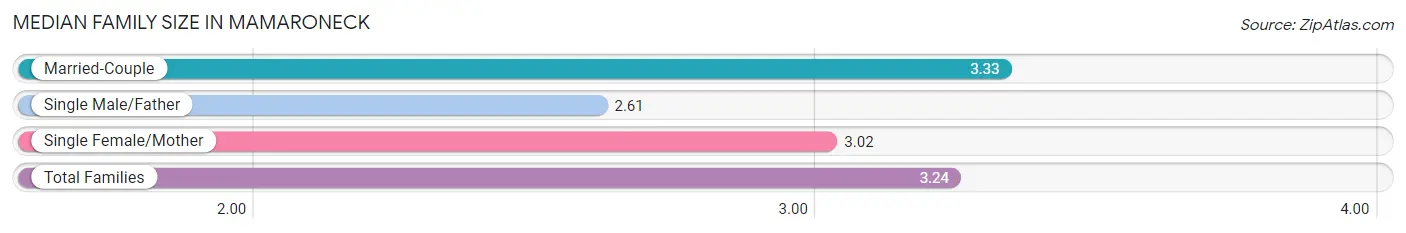
Median Family Size in Mamaroneck
The median family size in Mamaroneck is 3.24 persons per family, with married-couple families (4,083 | 78.3%) accounting for the largest median family size of 3.33 persons per family. On the other hand, single male/father families (235 | 4.5%) represent the smallest median family size with 2.61 persons per family.
| Family Type | # Families | Family Size |
| Married-Couple | 4,083 (78.3%) | 3.33 |
| Single Male/Father | 235 (4.5%) | 2.61 |
| Single Female/Mother | 895 (17.2%) | 3.02 |
| Total Families | 5,213 (100.0%) | 3.24 |
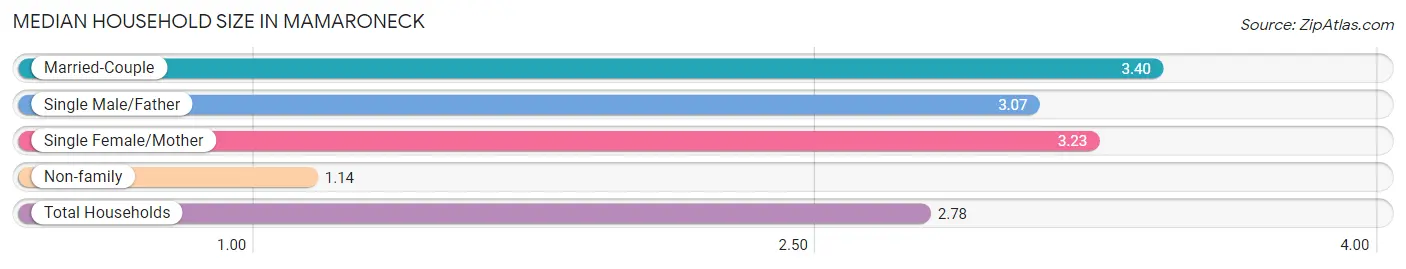
Median Household Size in Mamaroneck
The median household size in Mamaroneck is 2.78 persons per household, with married-couple households (4,083 | 57.9%) accounting for the largest median household size of 3.4 persons per household. non-family households (1,844 | 26.1%) represent the smallest median household size with 1.14 persons per household.
| Household Type | # Households | Household Size |
| Married-Couple | 4,083 (57.9%) | 3.40 |
| Single Male/Father | 235 (3.3%) | 3.07 |
| Single Female/Mother | 895 (12.7%) | 3.23 |
| Non-family | 1,844 (26.1%) | 1.14 |
| Total Households | 7,057 (100.0%) | 2.78 |
Household Size by Marriage Status in Mamaroneck
Out of a total of 7,057 households in Mamaroneck, 5,213 (73.9%) are family households, while 1,844 (26.1%) are nonfamily households. The most numerous type of family households are 2-person households, comprising 2,042, and the most common type of nonfamily households are 1-person households, comprising 1,652.
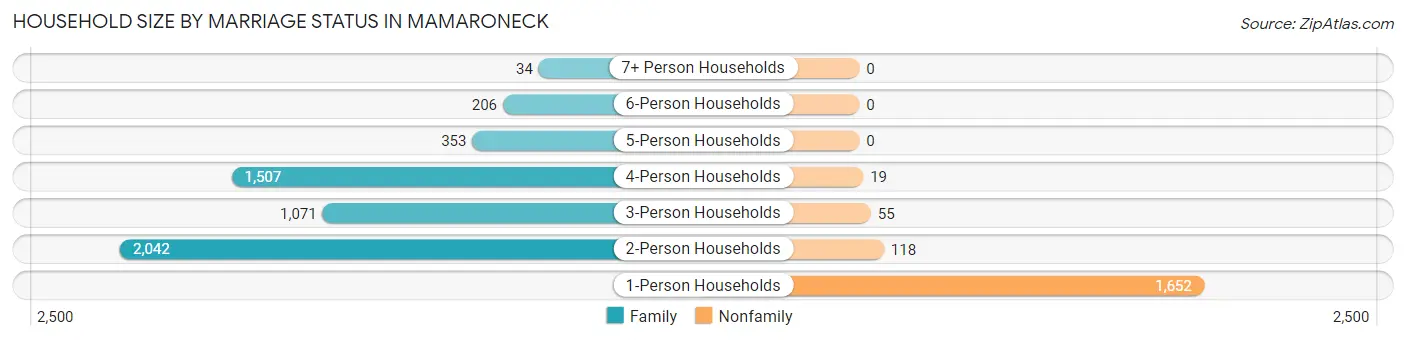
| Household Size | Family Households | Nonfamily Households |
| 1-Person Households | - | 1,652 (23.4%) |
| 2-Person Households | 2,042 (28.9%) | 118 (1.7%) |
| 3-Person Households | 1,071 (15.2%) | 55 (0.8%) |
| 4-Person Households | 1,507 (21.3%) | 19 (0.3%) |
| 5-Person Households | 353 (5.0%) | 0 (0.0%) |
| 6-Person Households | 206 (2.9%) | 0 (0.0%) |
| 7+ Person Households | 34 (0.5%) | 0 (0.0%) |
| Total | 5,213 (73.9%) | 1,844 (26.1%) |
Female Fertility in Mamaroneck
Fertility by Age in Mamaroneck
Average fertility rate in Mamaroneck is 40.0 births per 1,000 women. Women in the age bracket of 20 to 34 years have the highest fertility rate with 59.0 births per 1,000 women. Women in the age bracket of 35 to 50 years acount for 53.0% of all women with births.
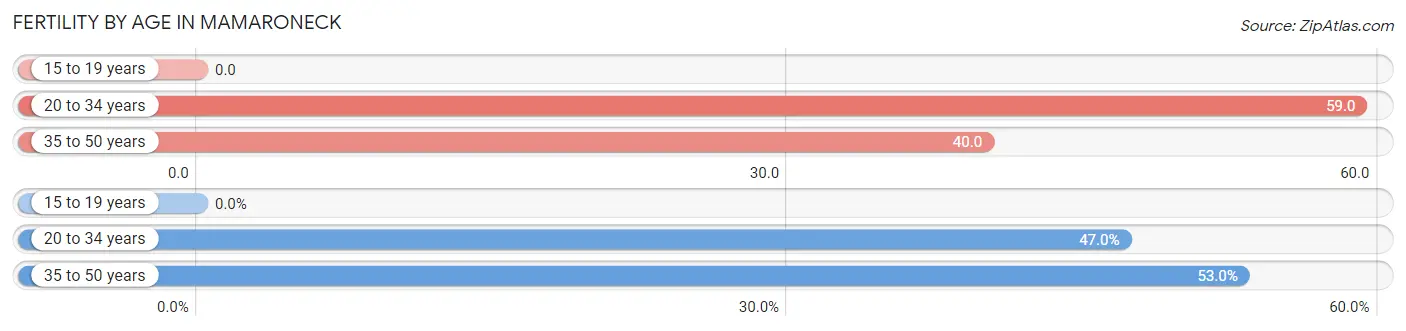
| Age Bracket | Women with Births | Births / 1,000 Women |
| 15 to 19 years | 0 (0.0%) | 0.0 |
| 20 to 34 years | 78 (47.0%) | 59.0 |
| 35 to 50 years | 88 (53.0%) | 40.0 |
| Total | 166 (100.0%) | 40.0 |
Fertility by Age by Marriage Status in Mamaroneck
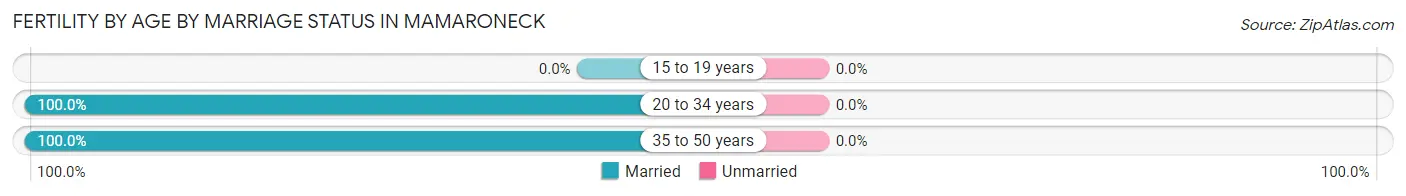
| Age Bracket | Married | Unmarried |
| 15 to 19 years | 0 (0.0%) | 0 (0.0%) |
| 20 to 34 years | 78 (100.0%) | 0 (0.0%) |
| 35 to 50 years | 88 (100.0%) | 0 (0.0%) |
| Total | 166 (100.0%) | 0 (0.0%) |
Fertility by Education in Mamaroneck
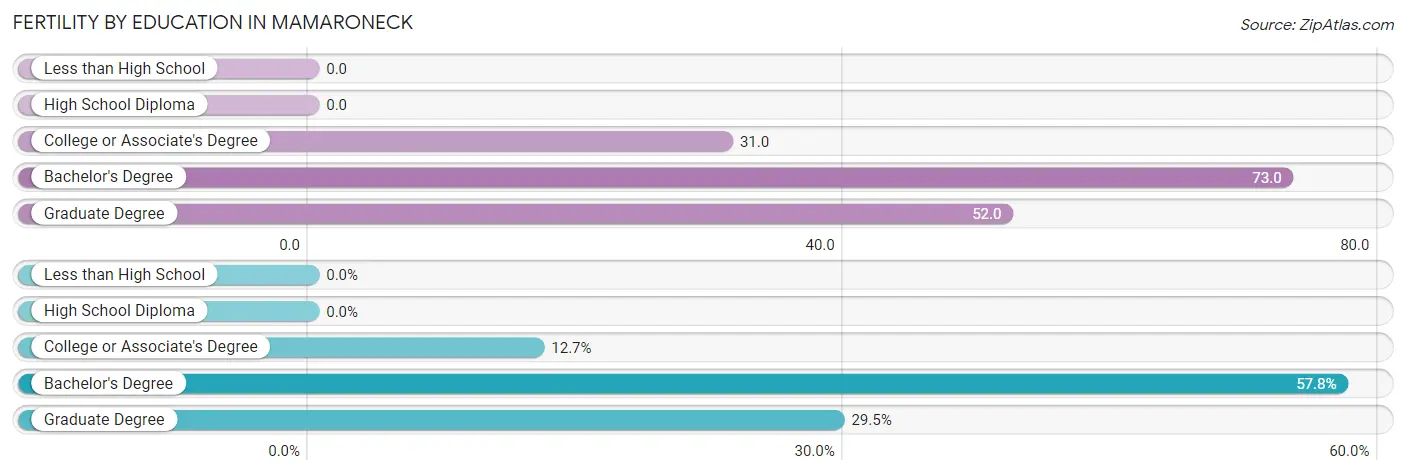
| Educational Attainment | Women with Births | Births / 1,000 Women |
| Less than High School | 0 (0.0%) | 0.0 |
| High School Diploma | 0 (0.0%) | 0.0 |
| College or Associate's Degree | 21 (12.7%) | 31.0 |
| Bachelor's Degree | 96 (57.8%) | 73.0 |
| Graduate Degree | 49 (29.5%) | 52.0 |
| Total | 166 (100.0%) | 40.0 |
Fertility by Education by Marriage Status in Mamaroneck
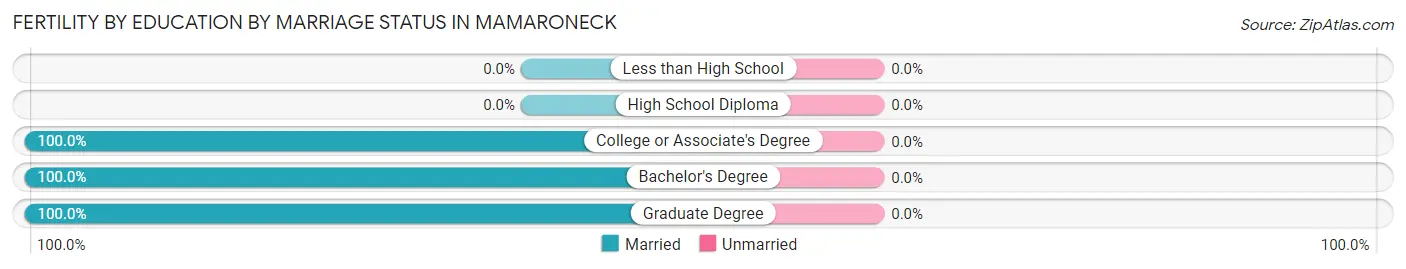
| Educational Attainment | Married | Unmarried |
| Less than High School | 0 (0.0%) | 0 (0.0%) |
| High School Diploma | 0 (0.0%) | 0 (0.0%) |
| College or Associate's Degree | 21 (100.0%) | 0 (0.0%) |
| Bachelor's Degree | 96 (100.0%) | 0 (0.0%) |
| Graduate Degree | 49 (100.0%) | 0 (0.0%) |
| Total | 166 (100.0%) | 0 (0.0%) |
Employment Characteristics in Mamaroneck
Employment by Class of Employer in Mamaroneck
Among the 10,194 employed individuals in Mamaroneck, private company employees (6,506 | 63.8%), not-for-profit organizations (1,022 | 10.0%), and self-employed (not incorporated) (935 | 9.2%) make up the most common classes of employment.
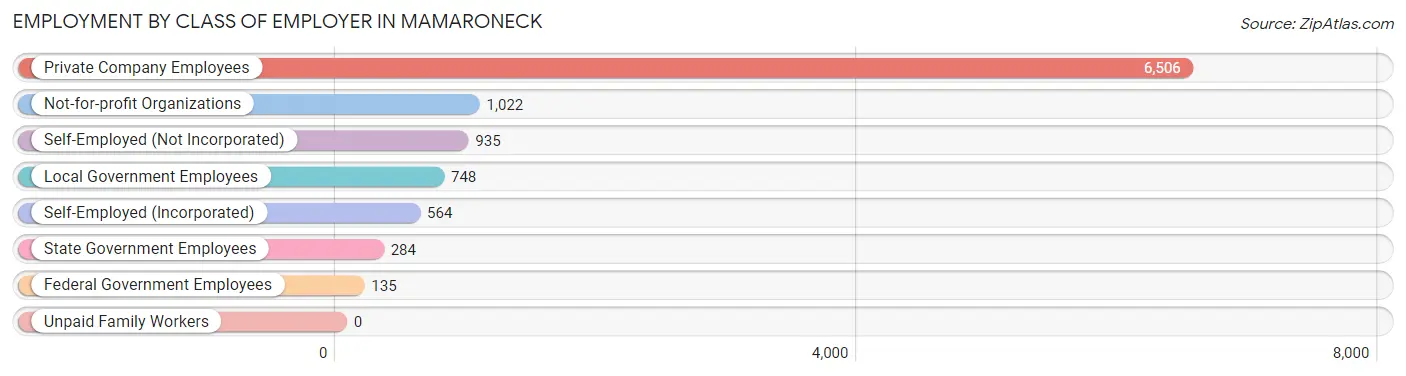
| Employer Class | # Employees | % Employees |
| Private Company Employees | 6,506 | 63.8% |
| Self-Employed (Incorporated) | 564 | 5.5% |
| Self-Employed (Not Incorporated) | 935 | 9.2% |
| Not-for-profit Organizations | 1,022 | 10.0% |
| Local Government Employees | 748 | 7.3% |
| State Government Employees | 284 | 2.8% |
| Federal Government Employees | 135 | 1.3% |
| Unpaid Family Workers | 0 | 0.0% |
| Total | 10,194 | 100.0% |
Employment Status by Age in Mamaroneck
According to the labor force statistics for Mamaroneck, out of the total population over 16 years of age (15,680), 69.2% or 10,851 individuals are in the labor force, with 3.6% or 391 of them unemployed. The age group with the highest labor force participation rate is 55 to 59 years, with 91.8% or 1,072 individuals in the labor force. Within the labor force, the 16 to 19 years age range has the highest percentage of unemployed individuals, with 13.6% or 30 of them being unemployed.
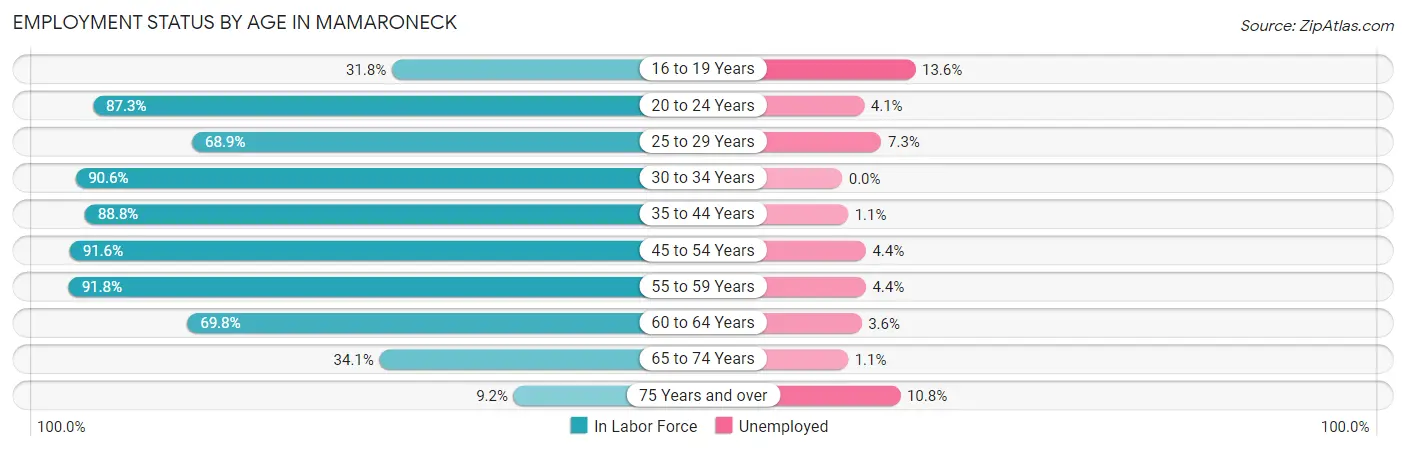
| Age Bracket | In Labor Force | Unemployed |
| 16 to 19 Years | 220 (31.8%) | 30 (13.6%) |
| 20 to 24 Years | 966 (87.3%) | 40 (4.1%) |
| 25 to 29 Years | 991 (68.9%) | 72 (7.3%) |
| 30 to 34 Years | 796 (90.6%) | 0 (0.0%) |
| 35 to 44 Years | 2,526 (88.8%) | 28 (1.1%) |
| 45 to 54 Years | 2,874 (91.6%) | 126 (4.4%) |
| 55 to 59 Years | 1,072 (91.8%) | 47 (4.4%) |
| 60 to 64 Years | 685 (69.8%) | 25 (3.6%) |
| 65 to 74 Years | 555 (34.1%) | 6 (1.1%) |
| 75 Years and over | 166 (9.2%) | 18 (10.8%) |
| Total | 10,851 (69.2%) | 391 (3.6%) |
Employment Status by Educational Attainment in Mamaroneck
According to labor force statistics for Mamaroneck, 85.6% of individuals (8,946) out of the total population between 25 and 64 years of age (10,451) are in the labor force, with 3.3% or 295 of them being unemployed. The group with the highest labor force participation rate are those with the educational attainment of bachelor's degree or higher, with 88.0% or 5,236 individuals in the labor force. Within the labor force, individuals with bachelor's degree or higher education have the highest percentage of unemployment, with 4.7% or 246 of them being unemployed.
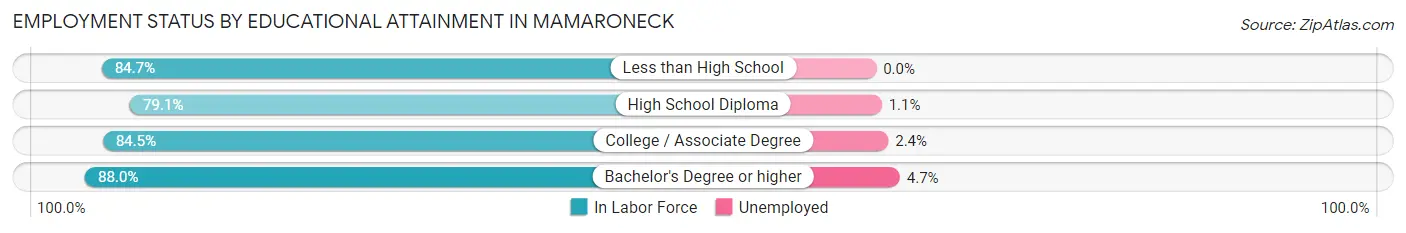
| Educational Attainment | In Labor Force | Unemployed |
| Less than High School | 834 (84.7%) | 0 (0.0%) |
| High School Diploma | 1,428 (79.1%) | 20 (1.1%) |
| College / Associate Degree | 1,446 (84.5%) | 41 (2.4%) |
| Bachelor's Degree or higher | 5,236 (88.0%) | 280 (4.7%) |
| Total | 8,946 (85.6%) | 345 (3.3%) |
Employment Occupations by Sex in Mamaroneck
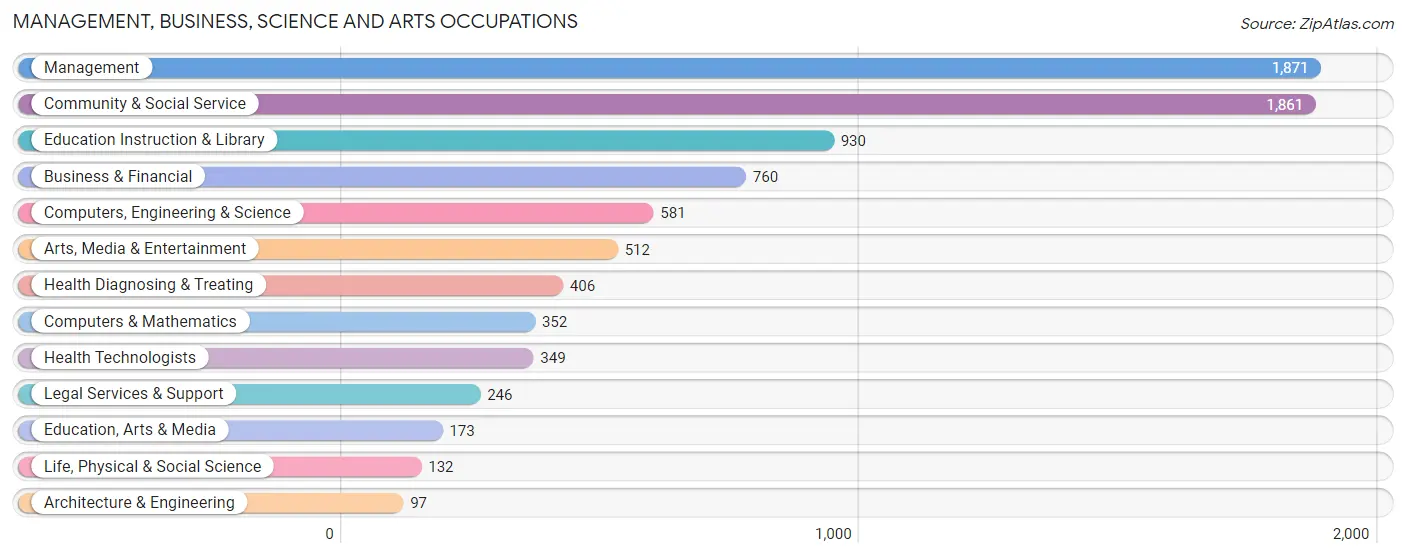
Management, Business, Science and Arts Occupations
The most common Management, Business, Science and Arts occupations in Mamaroneck are Management (1,871 | 17.9%), Community & Social Service (1,861 | 17.8%), Education Instruction & Library (930 | 8.9%), Business & Financial (760 | 7.3%), and Computers, Engineering & Science (581 | 5.6%).
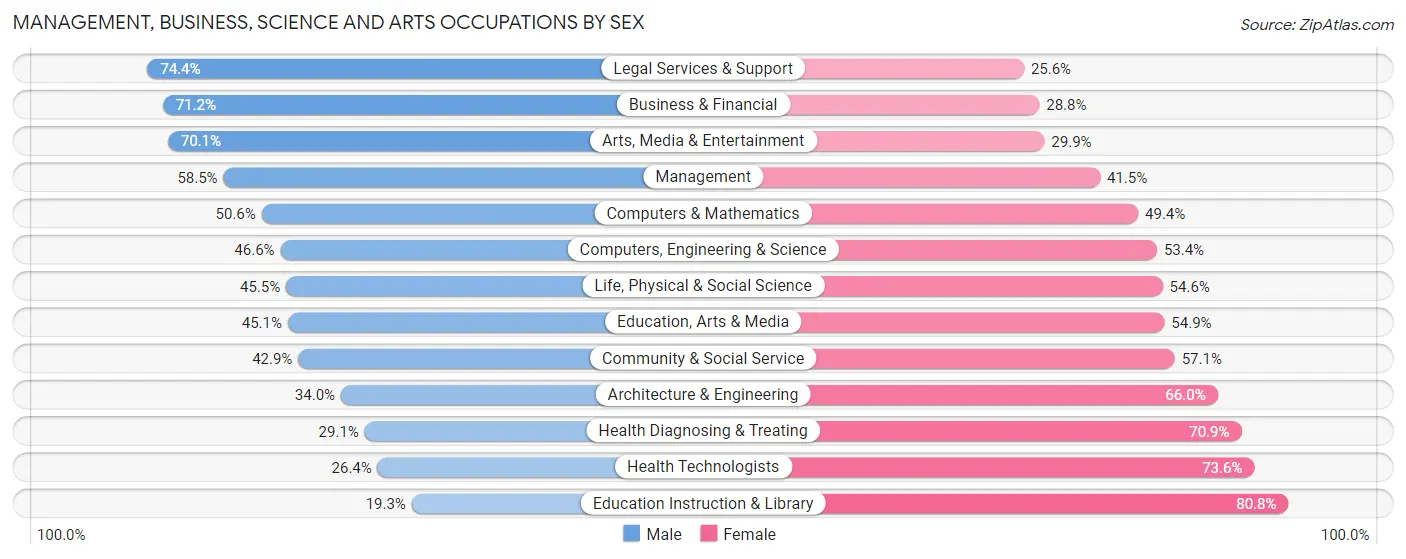
Management, Business, Science and Arts Occupations by Sex
Within the Management, Business, Science and Arts occupations in Mamaroneck, the most male-oriented occupations are Legal Services & Support (74.4%), Business & Financial (71.2%), and Arts, Media & Entertainment (70.1%), while the most female-oriented occupations are Education Instruction & Library (80.7%), Health Technologists (73.6%), and Health Diagnosing & Treating (70.9%).
| Occupation | Male | Female |
| Management | 1,095 (58.5%) | 776 (41.5%) |
| Business & Financial | 541 (71.2%) | 219 (28.8%) |
| Computers, Engineering & Science | 271 (46.6%) | 310 (53.4%) |
| Computers & Mathematics | 178 (50.6%) | 174 (49.4%) |
| Architecture & Engineering | 33 (34.0%) | 64 (66.0%) |
| Life, Physical & Social Science | 60 (45.5%) | 72 (54.5%) |
| Community & Social Service | 799 (42.9%) | 1,062 (57.1%) |
| Education, Arts & Media | 78 (45.1%) | 95 (54.9%) |
| Legal Services & Support | 183 (74.4%) | 63 (25.6%) |
| Education Instruction & Library | 179 (19.3%) | 751 (80.7%) |
| Arts, Media & Entertainment | 359 (70.1%) | 153 (29.9%) |
| Health Diagnosing & Treating | 118 (29.1%) | 288 (70.9%) |
| Health Technologists | 92 (26.4%) | 257 (73.6%) |
| Total (Category) | 2,824 (51.5%) | 2,655 (48.5%) |
| Total (Overall) | 5,860 (56.0%) | 4,599 (44.0%) |
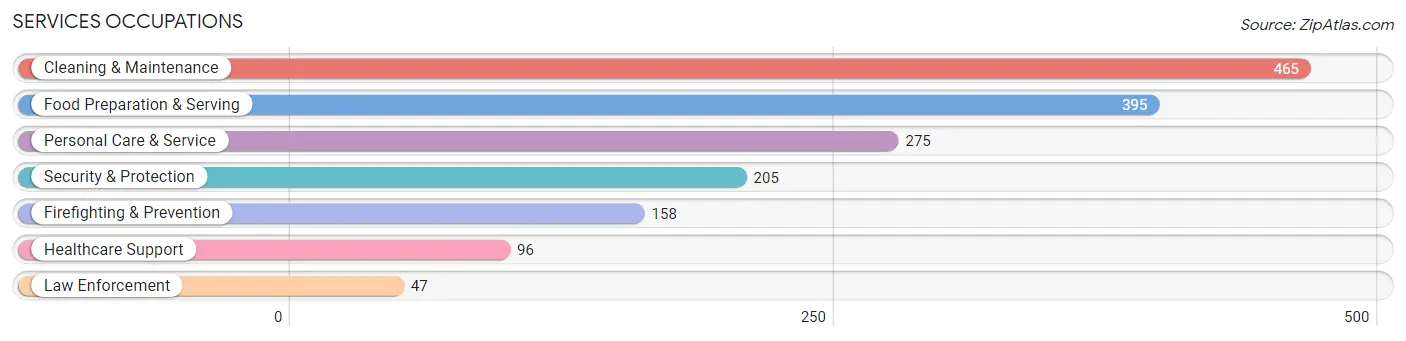
Services Occupations
The most common Services occupations in Mamaroneck are Cleaning & Maintenance (465 | 4.4%), Food Preparation & Serving (395 | 3.8%), Personal Care & Service (275 | 2.6%), Security & Protection (205 | 2.0%), and Firefighting & Prevention (158 | 1.5%).
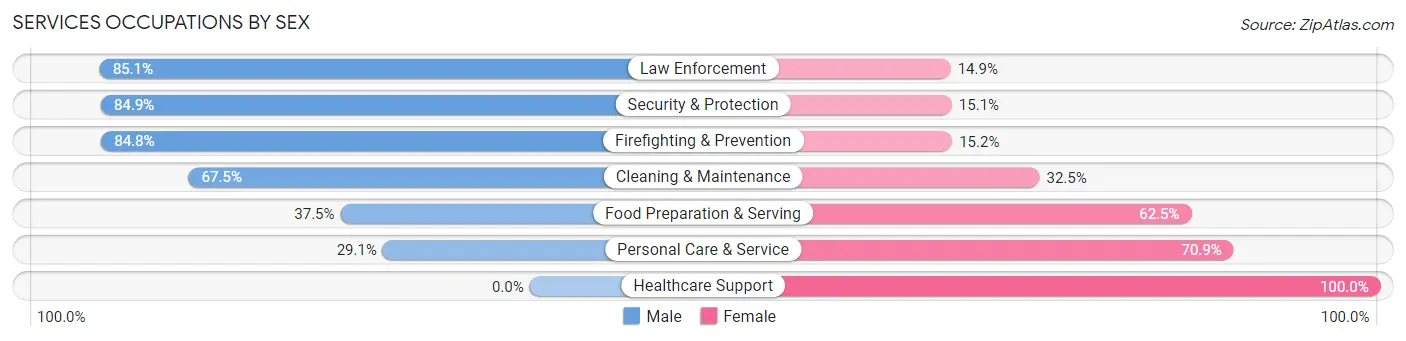
Services Occupations by Sex
Within the Services occupations in Mamaroneck, the most male-oriented occupations are Law Enforcement (85.1%), Security & Protection (84.9%), and Firefighting & Prevention (84.8%), while the most female-oriented occupations are Healthcare Support (100.0%), Personal Care & Service (70.9%), and Food Preparation & Serving (62.5%).
| Occupation | Male | Female |
| Healthcare Support | 0 (0.0%) | 96 (100.0%) |
| Security & Protection | 174 (84.9%) | 31 (15.1%) |
| Firefighting & Prevention | 134 (84.8%) | 24 (15.2%) |
| Law Enforcement | 40 (85.1%) | 7 (14.9%) |
| Food Preparation & Serving | 148 (37.5%) | 247 (62.5%) |
| Cleaning & Maintenance | 314 (67.5%) | 151 (32.5%) |
| Personal Care & Service | 80 (29.1%) | 195 (70.9%) |
| Total (Category) | 716 (49.9%) | 720 (50.1%) |
| Total (Overall) | 5,860 (56.0%) | 4,599 (44.0%) |
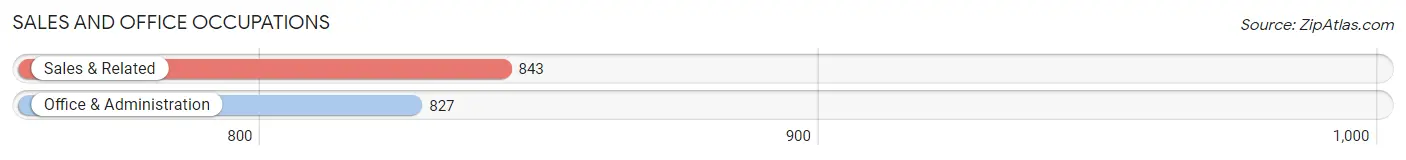
Sales and Office Occupations
The most common Sales and Office occupations in Mamaroneck are Sales & Related (843 | 8.1%), and Office & Administration (827 | 7.9%).
Sales and Office Occupations by Sex
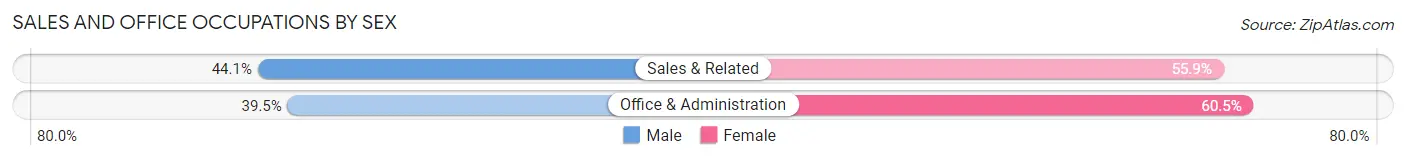
| Occupation | Male | Female |
| Sales & Related | 372 (44.1%) | 471 (55.9%) |
| Office & Administration | 327 (39.5%) | 500 (60.5%) |
| Total (Category) | 699 (41.9%) | 971 (58.1%) |
| Total (Overall) | 5,860 (56.0%) | 4,599 (44.0%) |
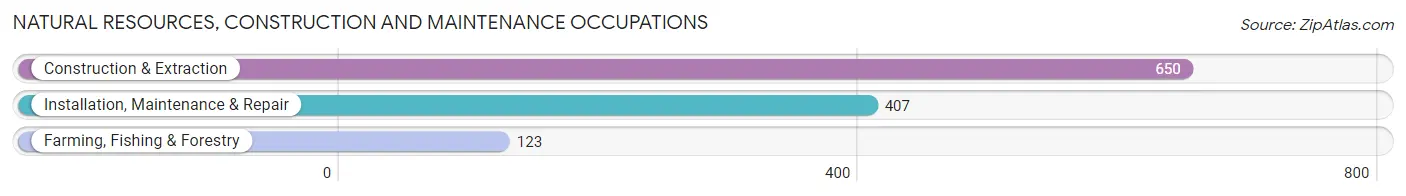
Natural Resources, Construction and Maintenance Occupations
The most common Natural Resources, Construction and Maintenance occupations in Mamaroneck are Construction & Extraction (650 | 6.2%), Installation, Maintenance & Repair (407 | 3.9%), and Farming, Fishing & Forestry (123 | 1.2%).
Natural Resources, Construction and Maintenance Occupations by Sex
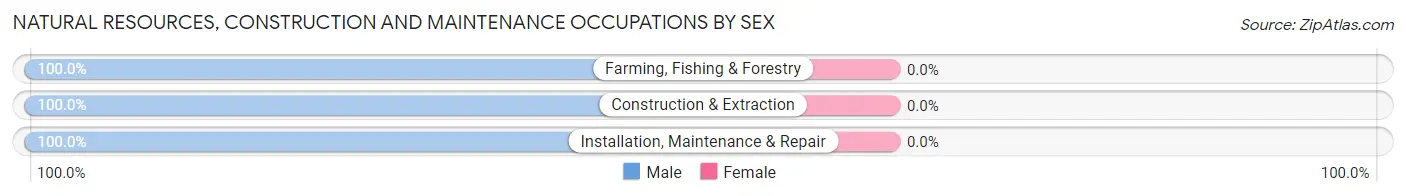
| Occupation | Male | Female |
| Farming, Fishing & Forestry | 123 (100.0%) | 0 (0.0%) |
| Construction & Extraction | 650 (100.0%) | 0 (0.0%) |
| Installation, Maintenance & Repair | 407 (100.0%) | 0 (0.0%) |
| Total (Category) | 1,180 (100.0%) | 0 (0.0%) |
| Total (Overall) | 5,860 (56.0%) | 4,599 (44.0%) |
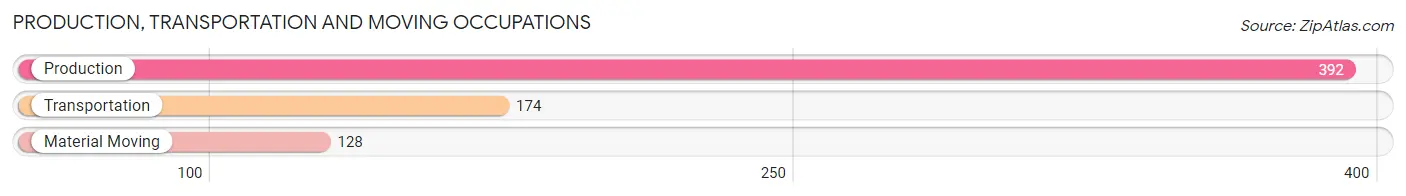
Production, Transportation and Moving Occupations
The most common Production, Transportation and Moving occupations in Mamaroneck are Production (392 | 3.7%), Transportation (174 | 1.7%), and Material Moving (128 | 1.2%).
Production, Transportation and Moving Occupations by Sex
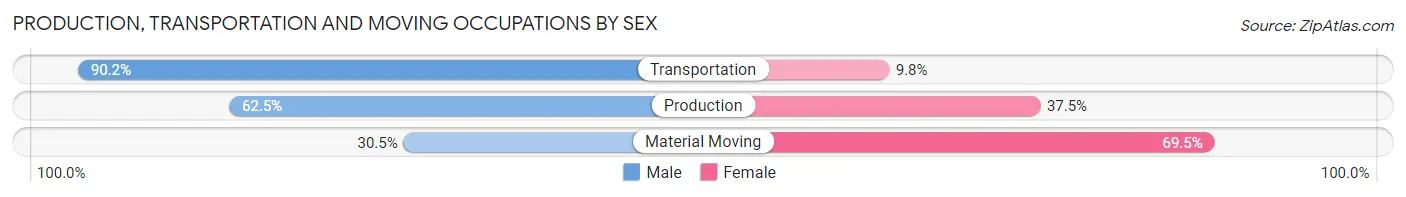
| Occupation | Male | Female |
| Production | 245 (62.5%) | 147 (37.5%) |
| Transportation | 157 (90.2%) | 17 (9.8%) |
| Material Moving | 39 (30.5%) | 89 (69.5%) |
| Total (Category) | 441 (63.5%) | 253 (36.5%) |
| Total (Overall) | 5,860 (56.0%) | 4,599 (44.0%) |
Employment Industries by Sex in Mamaroneck
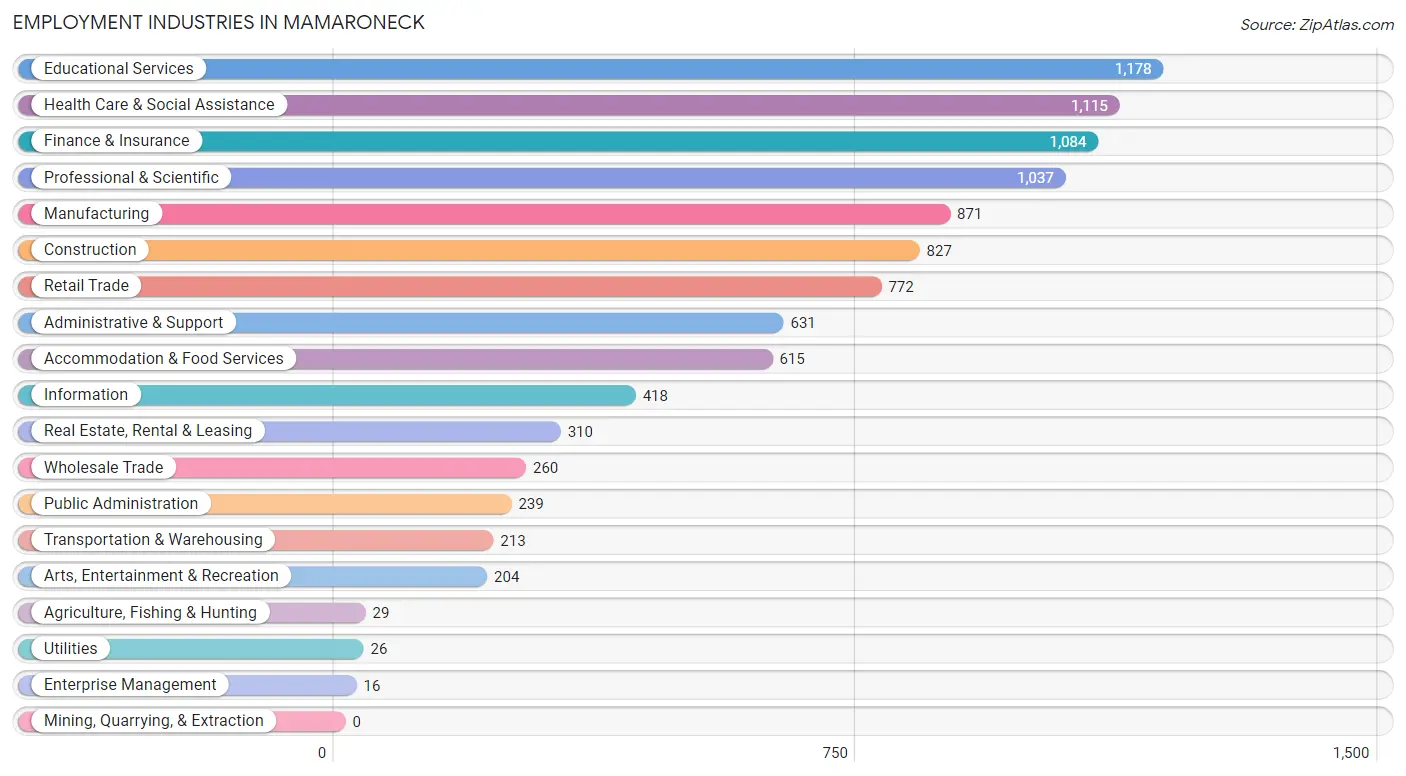
Employment Industries in Mamaroneck
The major employment industries in Mamaroneck include Educational Services (1,178 | 11.3%), Health Care & Social Assistance (1,115 | 10.7%), Finance & Insurance (1,084 | 10.4%), Professional & Scientific (1,037 | 9.9%), and Manufacturing (871 | 8.3%).
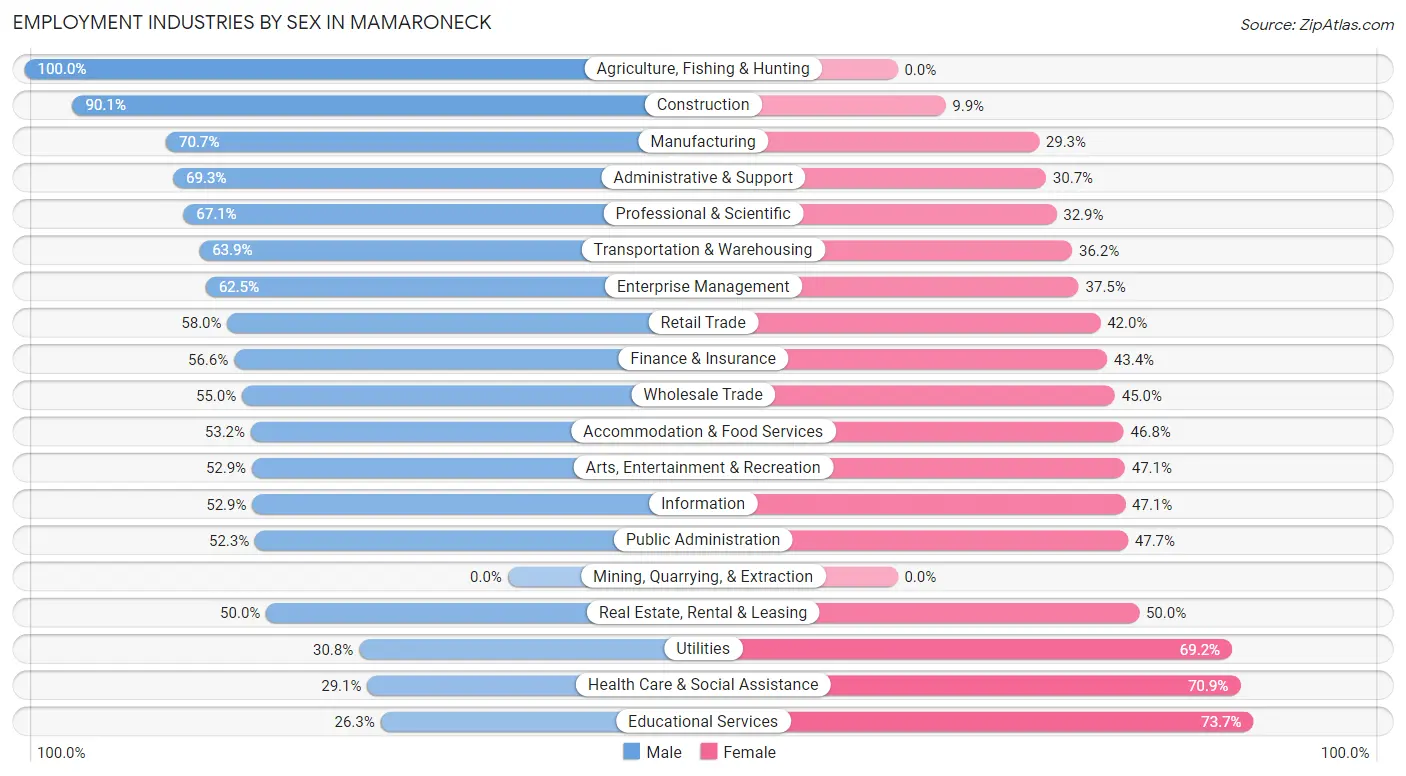
Employment Industries by Sex in Mamaroneck
The Mamaroneck industries that see more men than women are Agriculture, Fishing & Hunting (100.0%), Construction (90.1%), and Manufacturing (70.7%), whereas the industries that tend to have a higher number of women are Educational Services (73.7%), Health Care & Social Assistance (70.9%), and Utilities (69.2%).
| Industry | Male | Female |
| Agriculture, Fishing & Hunting | 29 (100.0%) | 0 (0.0%) |
| Mining, Quarrying, & Extraction | 0 (0.0%) | 0 (0.0%) |
| Construction | 745 (90.1%) | 82 (9.9%) |
| Manufacturing | 616 (70.7%) | 255 (29.3%) |
| Wholesale Trade | 143 (55.0%) | 117 (45.0%) |
| Retail Trade | 448 (58.0%) | 324 (42.0%) |
| Transportation & Warehousing | 136 (63.8%) | 77 (36.1%) |
| Utilities | 8 (30.8%) | 18 (69.2%) |
| Information | 221 (52.9%) | 197 (47.1%) |
| Finance & Insurance | 614 (56.6%) | 470 (43.4%) |
| Real Estate, Rental & Leasing | 155 (50.0%) | 155 (50.0%) |
| Professional & Scientific | 696 (67.1%) | 341 (32.9%) |
| Enterprise Management | 10 (62.5%) | 6 (37.5%) |
| Administrative & Support | 437 (69.3%) | 194 (30.7%) |
| Educational Services | 310 (26.3%) | 868 (73.7%) |
| Health Care & Social Assistance | 324 (29.1%) | 791 (70.9%) |
| Arts, Entertainment & Recreation | 108 (52.9%) | 96 (47.1%) |
| Accommodation & Food Services | 327 (53.2%) | 288 (46.8%) |
| Public Administration | 125 (52.3%) | 114 (47.7%) |
| Total | 5,860 (56.0%) | 4,599 (44.0%) |
Education in Mamaroneck
School Enrollment in Mamaroneck
The most common levels of schooling among the 4,693 students in Mamaroneck are elementary school (1,530 | 32.6%), middle school (990 | 21.1%), and high school (836 | 17.8%).
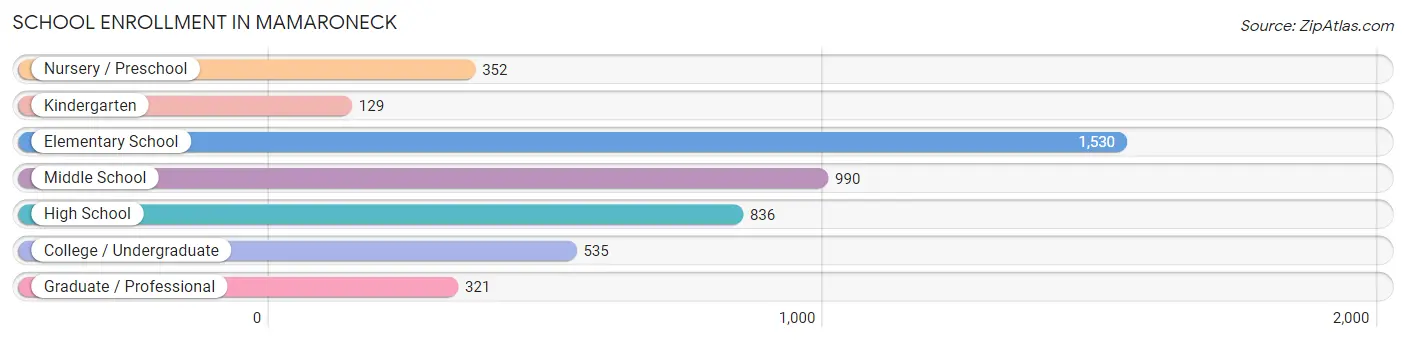
| School Level | # Students | % Students |
| Nursery / Preschool | 352 | 7.5% |
| Kindergarten | 129 | 2.8% |
| Elementary School | 1,530 | 32.6% |
| Middle School | 990 | 21.1% |
| High School | 836 | 17.8% |
| College / Undergraduate | 535 | 11.4% |
| Graduate / Professional | 321 | 6.8% |
| Total | 4,693 | 100.0% |
School Enrollment by Age by Funding Source in Mamaroneck
Out of a total of 4,693 students who are enrolled in schools in Mamaroneck, 1,262 (26.9%) attend a private institution, while the remaining 3,431 (73.1%) are enrolled in public schools. The age group of 35 years and over has the highest likelihood of being enrolled in private schools, with 149 (84.2% in the age bracket) enrolled. Conversely, the age group of 5 to 9 year old has the lowest likelihood of being enrolled in a private school, with 1,530 (87.5% in the age bracket) attending a public institution.
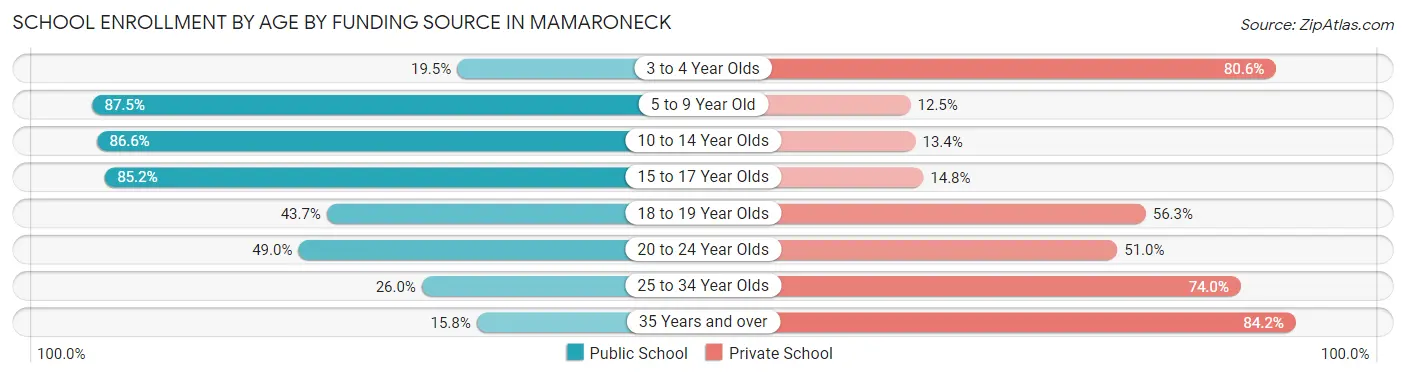
| Age Bracket | Public School | Private School |
| 3 to 4 Year Olds | 57 (19.5%) | 236 (80.5%) |
| 5 to 9 Year Old | 1,530 (87.5%) | 218 (12.5%) |
| 10 to 14 Year Olds | 996 (86.6%) | 154 (13.4%) |
| 15 to 17 Year Olds | 528 (85.2%) | 92 (14.8%) |
| 18 to 19 Year Olds | 122 (43.7%) | 157 (56.3%) |
| 20 to 24 Year Olds | 126 (49.0%) | 131 (51.0%) |
| 25 to 34 Year Olds | 44 (26.0%) | 125 (74.0%) |
| 35 Years and over | 28 (15.8%) | 149 (84.2%) |
| Total | 3,431 (73.1%) | 1,262 (26.9%) |
Educational Attainment by Field of Study in Mamaroneck
Business (1,462 | 18.1%), social sciences (1,133 | 14.1%), visual & performing arts (628 | 7.8%), education (602 | 7.5%), and liberal arts & history (586 | 7.3%) are the most common fields of study among 8,063 individuals in Mamaroneck who have obtained a bachelor's degree or higher.
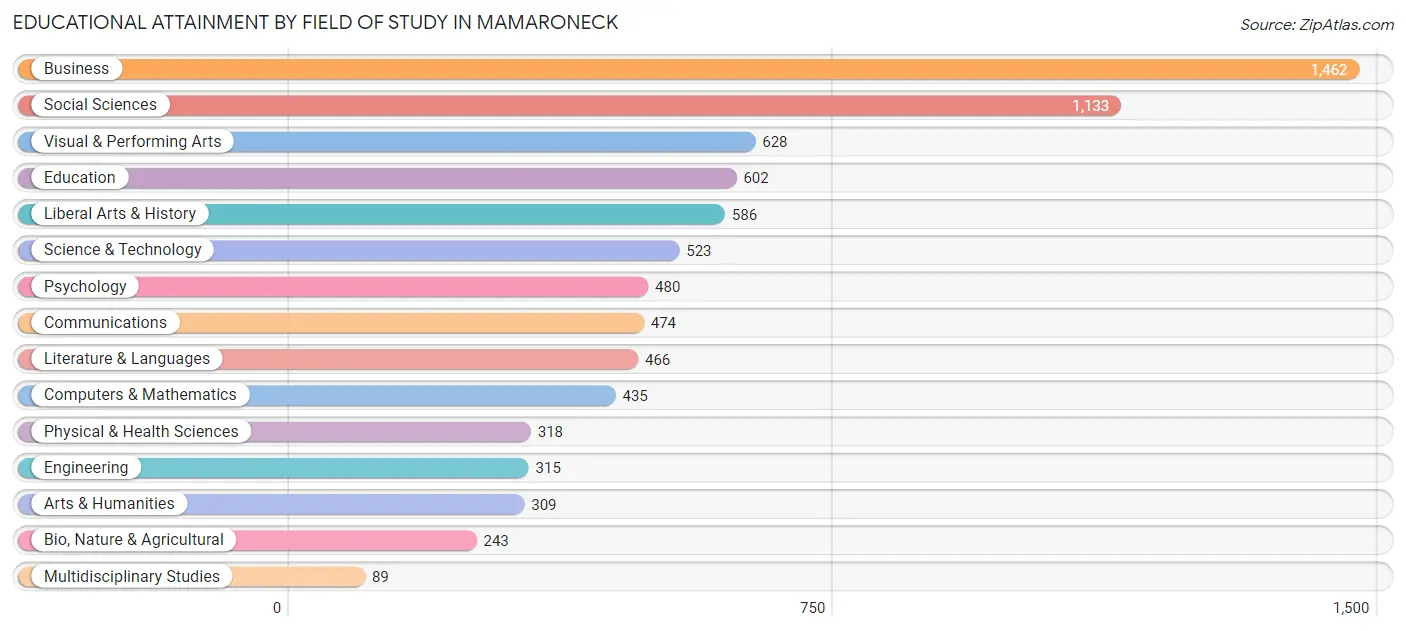
| Field of Study | # Graduates | % Graduates |
| Computers & Mathematics | 435 | 5.4% |
| Bio, Nature & Agricultural | 243 | 3.0% |
| Physical & Health Sciences | 318 | 3.9% |
| Psychology | 480 | 5.9% |
| Social Sciences | 1,133 | 14.1% |
| Engineering | 315 | 3.9% |
| Multidisciplinary Studies | 89 | 1.1% |
| Science & Technology | 523 | 6.5% |
| Business | 1,462 | 18.1% |
| Education | 602 | 7.5% |
| Literature & Languages | 466 | 5.8% |
| Liberal Arts & History | 586 | 7.3% |
| Visual & Performing Arts | 628 | 7.8% |
| Communications | 474 | 5.9% |
| Arts & Humanities | 309 | 3.8% |
| Total | 8,063 | 100.0% |
Transportation & Commute in Mamaroneck
Vehicle Availability by Sex in Mamaroneck
The most prevalent vehicle ownership categories in Mamaroneck are males with 2 vehicles (1,827, accounting for 32.0%) and females with 2 vehicles (1,634, making up 41.0%).
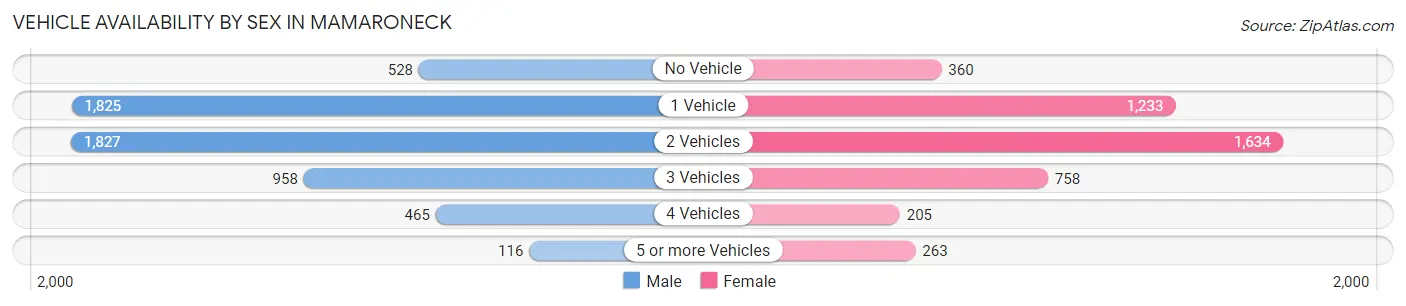
| Vehicles Available | Male | Female |
| No Vehicle | 528 (9.2%) | 360 (8.1%) |
| 1 Vehicle | 1,825 (31.9%) | 1,233 (27.7%) |
| 2 Vehicles | 1,827 (32.0%) | 1,634 (36.7%) |
| 3 Vehicles | 958 (16.8%) | 758 (17.0%) |
| 4 Vehicles | 465 (8.1%) | 205 (4.6%) |
| 5 or more Vehicles | 116 (2.0%) | 263 (5.9%) |
| Total | 5,719 (100.0%) | 4,453 (100.0%) |
Commute Time in Mamaroneck
The most frequently occuring commute durations in Mamaroneck are 60 to 89 minutes (1,243 commuters, 14.7%), 15 to 19 minutes (1,146 commuters, 13.6%), and 5 to 9 minutes (1,044 commuters, 12.3%).
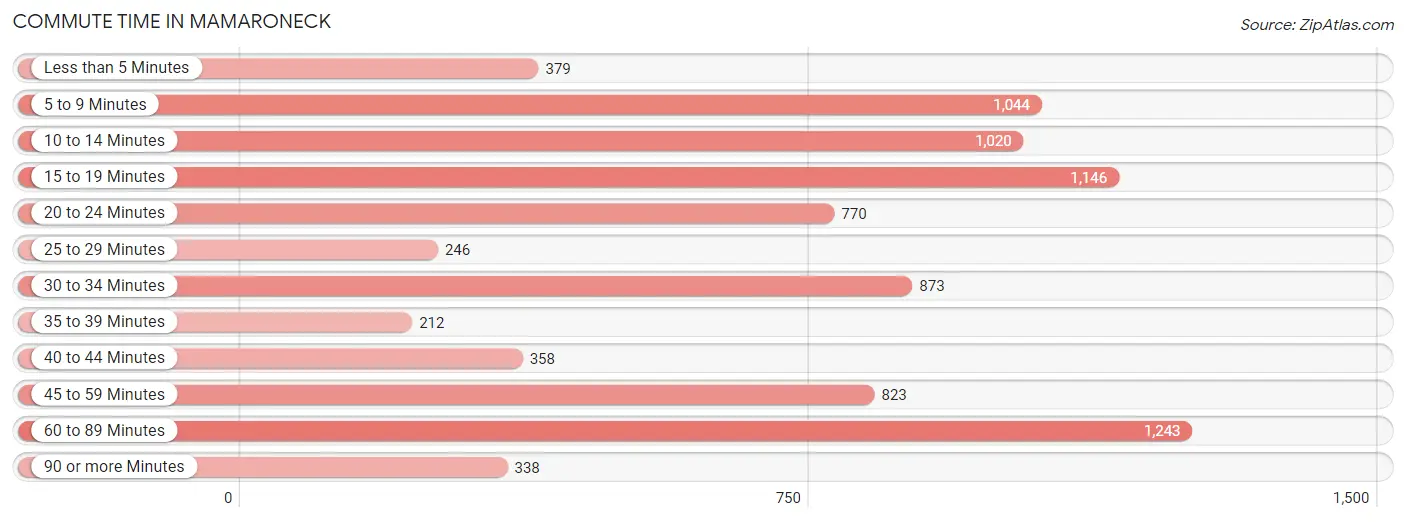
| Commute Time | # Commuters | % Commuters |
| Less than 5 Minutes | 379 | 4.5% |
| 5 to 9 Minutes | 1,044 | 12.3% |
| 10 to 14 Minutes | 1,020 | 12.1% |
| 15 to 19 Minutes | 1,146 | 13.6% |
| 20 to 24 Minutes | 770 | 9.1% |
| 25 to 29 Minutes | 246 | 2.9% |
| 30 to 34 Minutes | 873 | 10.3% |
| 35 to 39 Minutes | 212 | 2.5% |
| 40 to 44 Minutes | 358 | 4.2% |
| 45 to 59 Minutes | 823 | 9.7% |
| 60 to 89 Minutes | 1,243 | 14.7% |
| 90 or more Minutes | 338 | 4.0% |
Commute Time by Sex in Mamaroneck
The most common commute times in Mamaroneck are 60 to 89 minutes (915 commuters, 19.0%) for males and 10 to 14 minutes (645 commuters, 17.7%) for females.
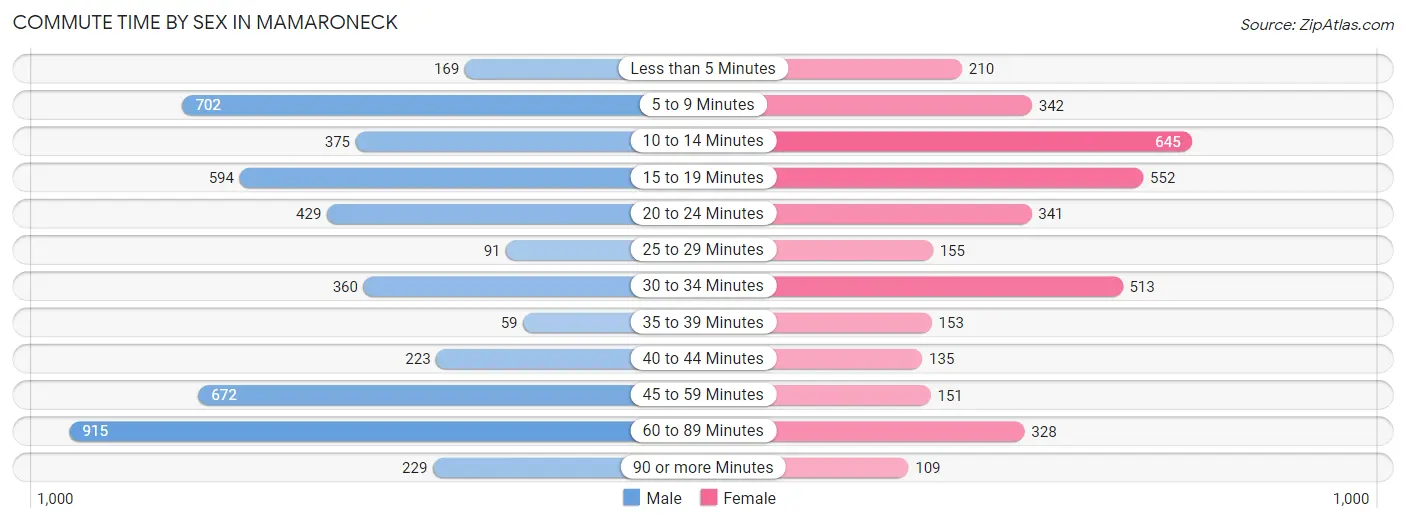
| Commute Time | Male | Female |
| Less than 5 Minutes | 169 (3.5%) | 210 (5.8%) |
| 5 to 9 Minutes | 702 (14.6%) | 342 (9.4%) |
| 10 to 14 Minutes | 375 (7.8%) | 645 (17.7%) |
| 15 to 19 Minutes | 594 (12.3%) | 552 (15.2%) |
| 20 to 24 Minutes | 429 (8.9%) | 341 (9.4%) |
| 25 to 29 Minutes | 91 (1.9%) | 155 (4.3%) |
| 30 to 34 Minutes | 360 (7.5%) | 513 (14.1%) |
| 35 to 39 Minutes | 59 (1.2%) | 153 (4.2%) |
| 40 to 44 Minutes | 223 (4.6%) | 135 (3.7%) |
| 45 to 59 Minutes | 672 (14.0%) | 151 (4.2%) |
| 60 to 89 Minutes | 915 (19.0%) | 328 (9.0%) |
| 90 or more Minutes | 229 (4.8%) | 109 (3.0%) |
Time of Departure to Work by Sex in Mamaroneck
The most frequent times of departure to work in Mamaroneck are 7:00 AM to 7:29 AM (927, 19.2%) for males and 7:30 AM to 7:59 AM (672, 18.5%) for females.
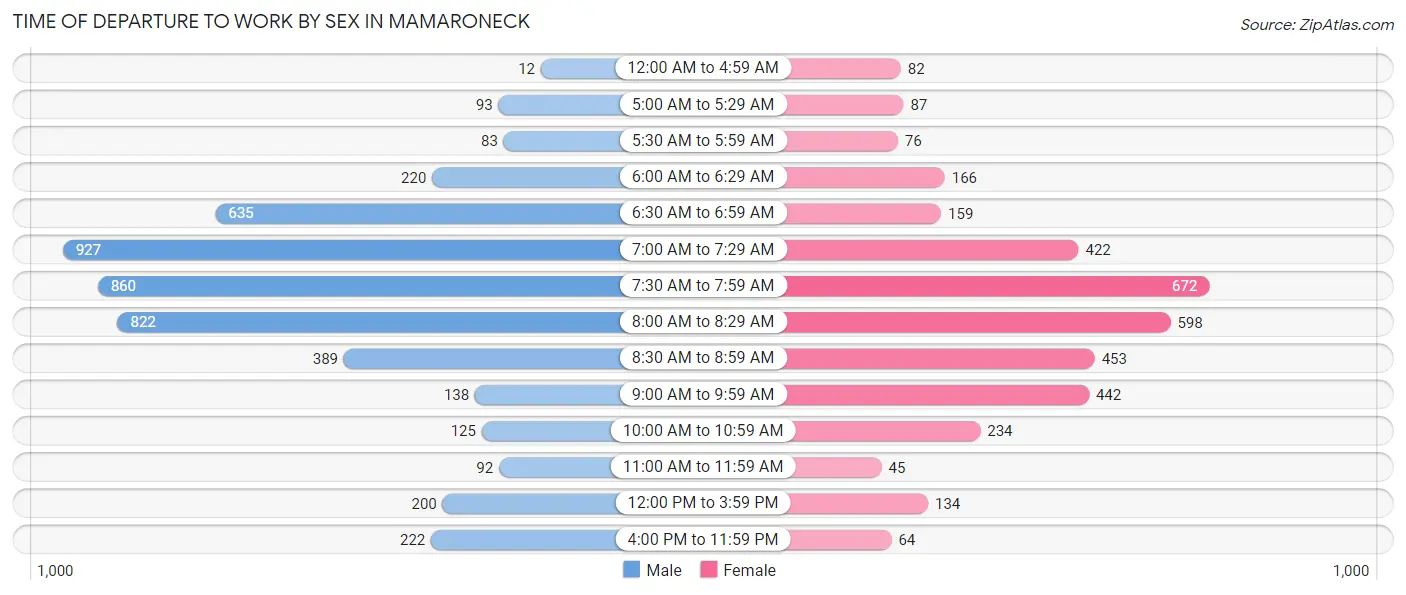
| Time of Departure | Male | Female |
| 12:00 AM to 4:59 AM | 12 (0.3%) | 82 (2.3%) |
| 5:00 AM to 5:29 AM | 93 (1.9%) | 87 (2.4%) |
| 5:30 AM to 5:59 AM | 83 (1.7%) | 76 (2.1%) |
| 6:00 AM to 6:29 AM | 220 (4.6%) | 166 (4.6%) |
| 6:30 AM to 6:59 AM | 635 (13.2%) | 159 (4.4%) |
| 7:00 AM to 7:29 AM | 927 (19.2%) | 422 (11.6%) |
| 7:30 AM to 7:59 AM | 860 (17.8%) | 672 (18.5%) |
| 8:00 AM to 8:29 AM | 822 (17.1%) | 598 (16.5%) |
| 8:30 AM to 8:59 AM | 389 (8.1%) | 453 (12.5%) |
| 9:00 AM to 9:59 AM | 138 (2.9%) | 442 (12.2%) |
| 10:00 AM to 10:59 AM | 125 (2.6%) | 234 (6.4%) |
| 11:00 AM to 11:59 AM | 92 (1.9%) | 45 (1.2%) |
| 12:00 PM to 3:59 PM | 200 (4.2%) | 134 (3.7%) |
| 4:00 PM to 11:59 PM | 222 (4.6%) | 64 (1.8%) |
| Total | 4,818 (100.0%) | 3,634 (100.0%) |
Housing Occupancy in Mamaroneck
Occupancy by Ownership in Mamaroneck
Of the total 7,057 dwellings in Mamaroneck, owner-occupied units account for 4,317 (61.2%), while renter-occupied units make up 2,740 (38.8%).
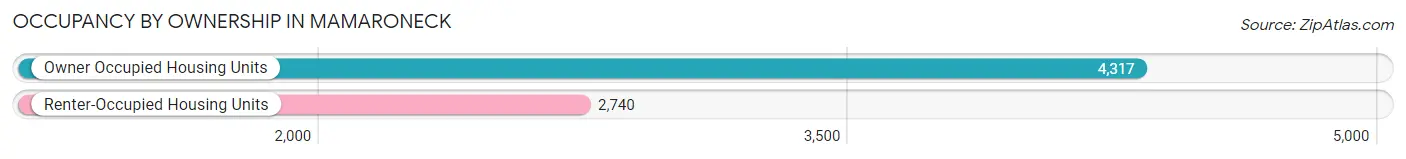
| Occupancy | # Housing Units | % Housing Units |
| Owner Occupied Housing Units | 4,317 | 61.2% |
| Renter-Occupied Housing Units | 2,740 | 38.8% |
| Total Occupied Housing Units | 7,057 | 100.0% |
Occupancy by Household Size in Mamaroneck
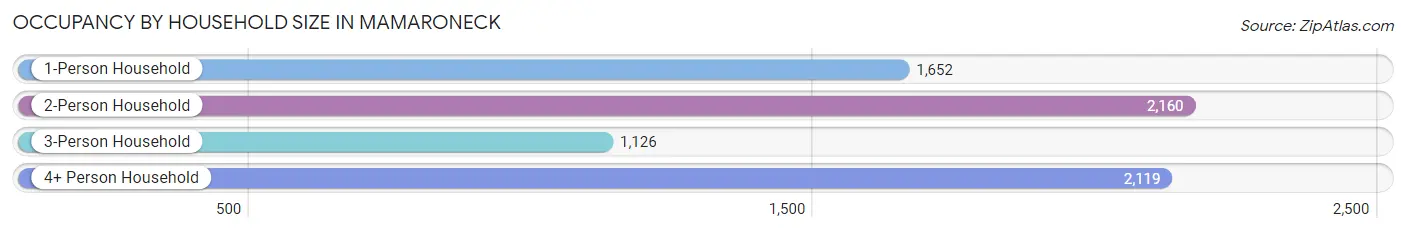
| Household Size | # Housing Units | % Housing Units |
| 1-Person Household | 1,652 | 23.4% |
| 2-Person Household | 2,160 | 30.6% |
| 3-Person Household | 1,126 | 16.0% |
| 4+ Person Household | 2,119 | 30.0% |
| Total Housing Units | 7,057 | 100.0% |
Occupancy by Ownership by Household Size in Mamaroneck
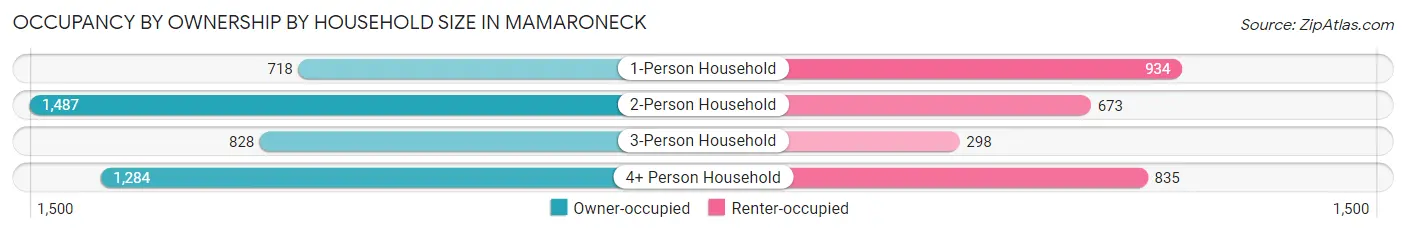
| Household Size | Owner-occupied | Renter-occupied |
| 1-Person Household | 718 (43.5%) | 934 (56.5%) |
| 2-Person Household | 1,487 (68.8%) | 673 (31.2%) |
| 3-Person Household | 828 (73.5%) | 298 (26.5%) |
| 4+ Person Household | 1,284 (60.6%) | 835 (39.4%) |
| Total Housing Units | 4,317 (61.2%) | 2,740 (38.8%) |
Occupancy by Educational Attainment in Mamaroneck
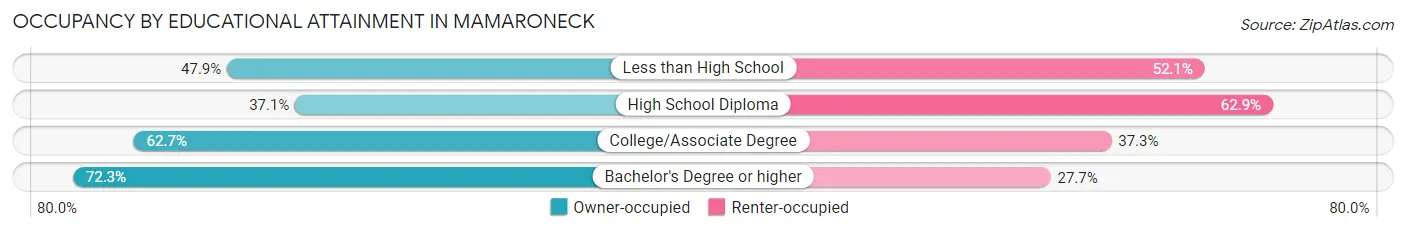
| Household Size | Owner-occupied | Renter-occupied |
| Less than High School | 328 (47.9%) | 357 (52.1%) |
| High School Diploma | 551 (37.1%) | 935 (62.9%) |
| College/Associate Degree | 629 (62.7%) | 374 (37.3%) |
| Bachelor's Degree or higher | 2,809 (72.3%) | 1,074 (27.7%) |
Occupancy by Age of Householder in Mamaroneck
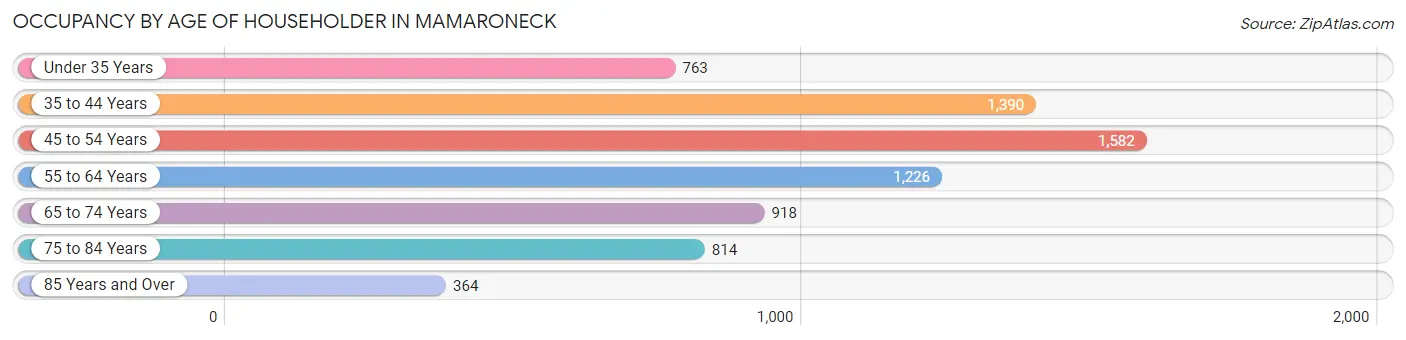
| Age Bracket | # Households | % Households |
| Under 35 Years | 763 | 10.8% |
| 35 to 44 Years | 1,390 | 19.7% |
| 45 to 54 Years | 1,582 | 22.4% |
| 55 to 64 Years | 1,226 | 17.4% |
| 65 to 74 Years | 918 | 13.0% |
| 75 to 84 Years | 814 | 11.5% |
| 85 Years and Over | 364 | 5.2% |
| Total | 7,057 | 100.0% |
Housing Finances in Mamaroneck
Median Income by Occupancy in Mamaroneck
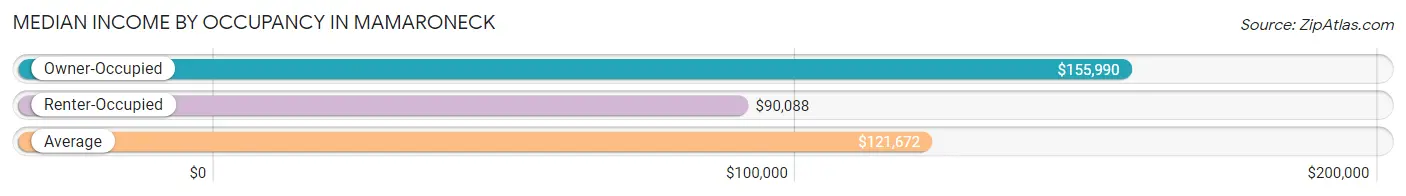
| Occupancy Type | # Households | Median Income |
| Owner-Occupied | 4,317 (61.2%) | $155,990 |
| Renter-Occupied | 2,740 (38.8%) | $90,088 |
| Average | 7,057 (100.0%) | $121,672 |
Occupancy by Householder Income Bracket in Mamaroneck
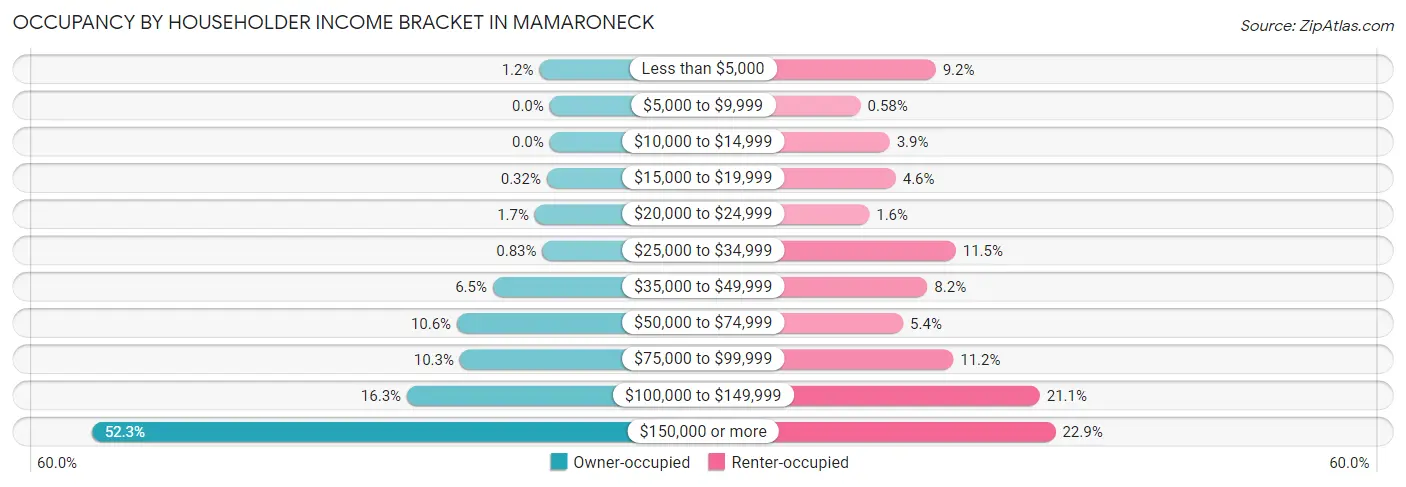
| Income Bracket | Owner-occupied | Renter-occupied |
| Less than $5,000 | 51 (1.2%) | 251 (9.2%) |
| $5,000 to $9,999 | 0 (0.0%) | 16 (0.6%) |
| $10,000 to $14,999 | 0 (0.0%) | 107 (3.9%) |
| $15,000 to $19,999 | 14 (0.3%) | 126 (4.6%) |
| $20,000 to $24,999 | 73 (1.7%) | 43 (1.6%) |
| $25,000 to $34,999 | 36 (0.8%) | 314 (11.5%) |
| $35,000 to $49,999 | 280 (6.5%) | 225 (8.2%) |
| $50,000 to $74,999 | 457 (10.6%) | 149 (5.4%) |
| $75,000 to $99,999 | 443 (10.3%) | 306 (11.2%) |
| $100,000 to $149,999 | 704 (16.3%) | 577 (21.1%) |
| $150,000 or more | 2,259 (52.3%) | 626 (22.9%) |
| Total | 4,317 (100.0%) | 2,740 (100.0%) |
Monthly Housing Cost Tiers in Mamaroneck
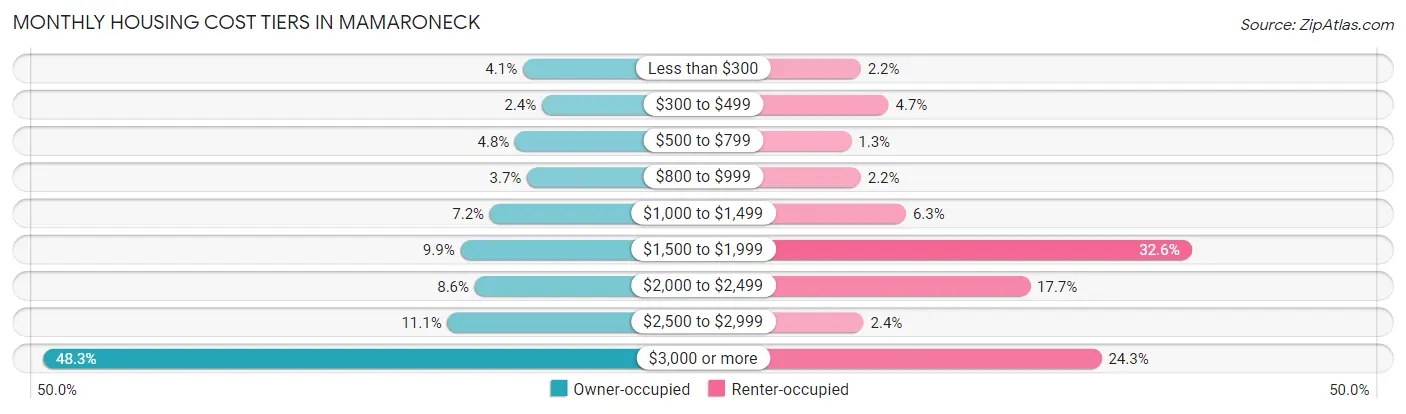
| Monthly Cost | Owner-occupied | Renter-occupied |
| Less than $300 | 178 (4.1%) | 59 (2.1%) |
| $300 to $499 | 102 (2.4%) | 129 (4.7%) |
| $500 to $799 | 209 (4.8%) | 35 (1.3%) |
| $800 to $999 | 161 (3.7%) | 59 (2.1%) |
| $1,000 to $1,499 | 309 (7.2%) | 173 (6.3%) |
| $1,500 to $1,999 | 426 (9.9%) | 893 (32.6%) |
| $2,000 to $2,499 | 369 (8.6%) | 486 (17.7%) |
| $2,500 to $2,999 | 478 (11.1%) | 66 (2.4%) |
| $3,000 or more | 2,085 (48.3%) | 666 (24.3%) |
| Total | 4,317 (100.0%) | 2,740 (100.0%) |
Physical Housing Characteristics in Mamaroneck
Housing Structures in Mamaroneck
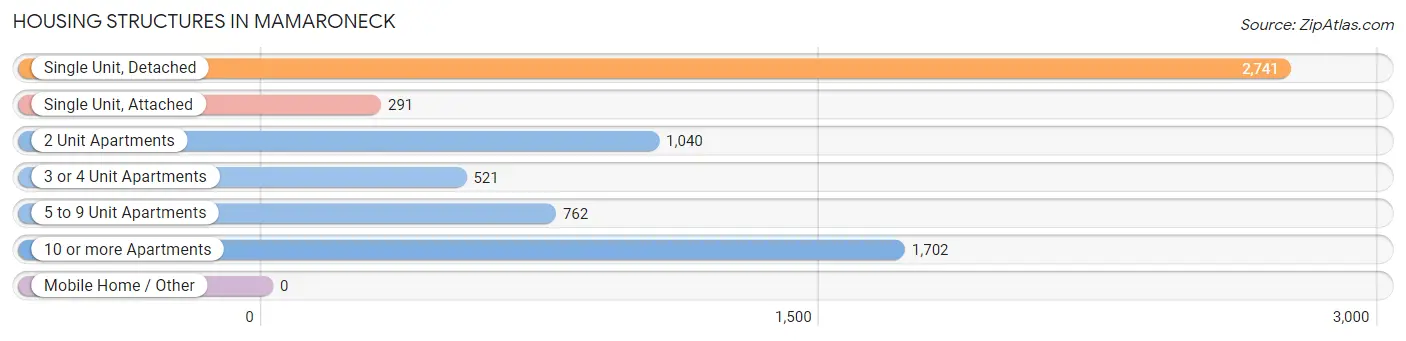
| Structure Type | # Housing Units | % Housing Units |
| Single Unit, Detached | 2,741 | 38.8% |
| Single Unit, Attached | 291 | 4.1% |
| 2 Unit Apartments | 1,040 | 14.7% |
| 3 or 4 Unit Apartments | 521 | 7.4% |
| 5 to 9 Unit Apartments | 762 | 10.8% |
| 10 or more Apartments | 1,702 | 24.1% |
| Mobile Home / Other | 0 | 0.0% |
| Total | 7,057 | 100.0% |
Housing Structures by Occupancy in Mamaroneck
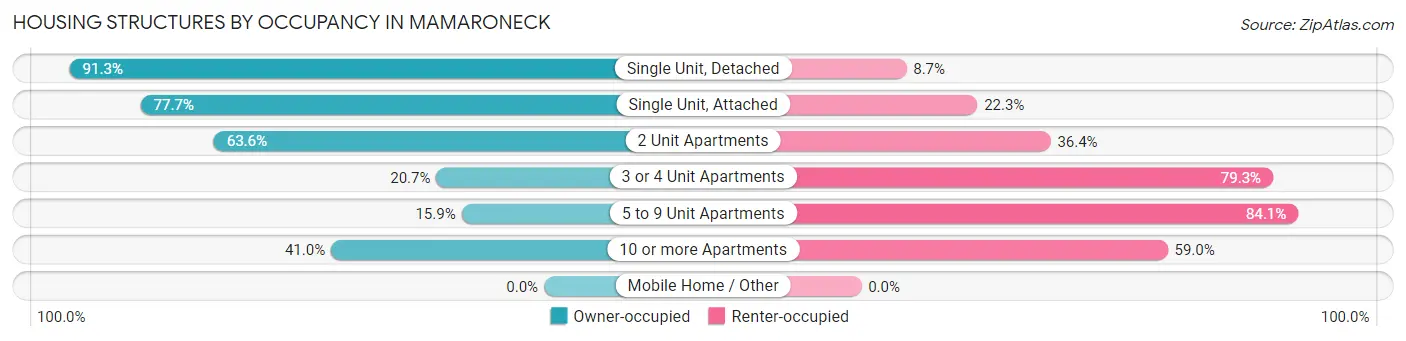
| Structure Type | Owner-occupied | Renter-occupied |
| Single Unit, Detached | 2,503 (91.3%) | 238 (8.7%) |
| Single Unit, Attached | 226 (77.7%) | 65 (22.3%) |
| 2 Unit Apartments | 661 (63.6%) | 379 (36.4%) |
| 3 or 4 Unit Apartments | 108 (20.7%) | 413 (79.3%) |
| 5 to 9 Unit Apartments | 121 (15.9%) | 641 (84.1%) |
| 10 or more Apartments | 698 (41.0%) | 1,004 (59.0%) |
| Mobile Home / Other | 0 (0.0%) | 0 (0.0%) |
| Total | 4,317 (61.2%) | 2,740 (38.8%) |
Housing Structures by Number of Rooms in Mamaroneck
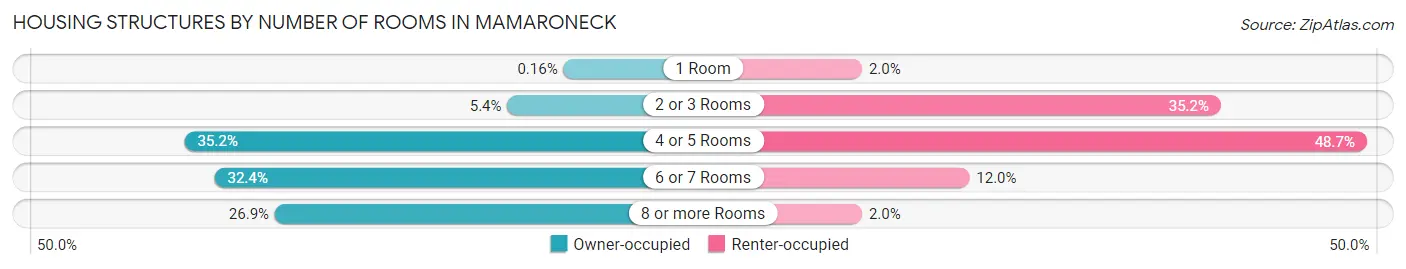
| Number of Rooms | Owner-occupied | Renter-occupied |
| 1 Room | 7 (0.2%) | 56 (2.0%) |
| 2 or 3 Rooms | 231 (5.3%) | 965 (35.2%) |
| 4 or 5 Rooms | 1,520 (35.2%) | 1,335 (48.7%) |
| 6 or 7 Rooms | 1,400 (32.4%) | 328 (12.0%) |
| 8 or more Rooms | 1,159 (26.9%) | 56 (2.0%) |
| Total | 4,317 (100.0%) | 2,740 (100.0%) |
Housing Structure by Heating Type in Mamaroneck
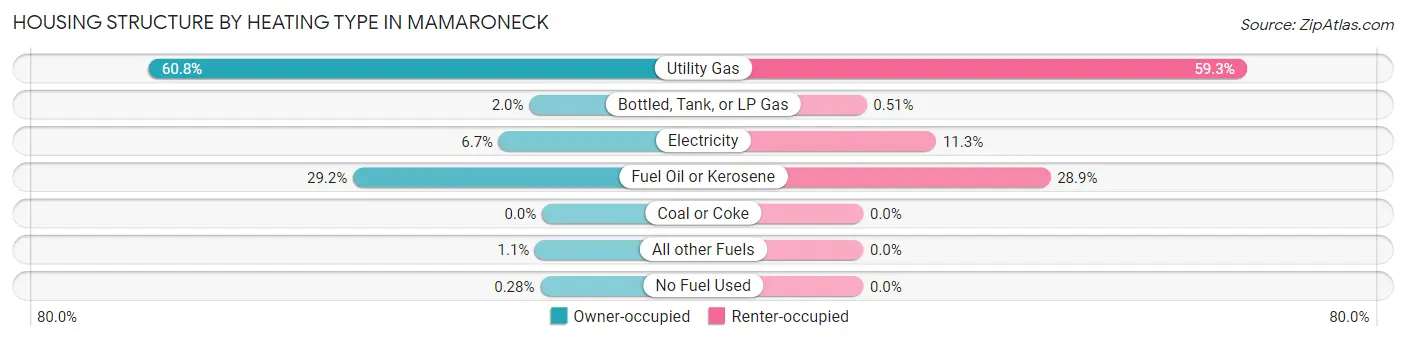
| Heating Type | Owner-occupied | Renter-occupied |
| Utility Gas | 2,624 (60.8%) | 1,624 (59.3%) |
| Bottled, Tank, or LP Gas | 85 (2.0%) | 14 (0.5%) |
| Electricity | 288 (6.7%) | 309 (11.3%) |
| Fuel Oil or Kerosene | 1,262 (29.2%) | 793 (28.9%) |
| Coal or Coke | 0 (0.0%) | 0 (0.0%) |
| All other Fuels | 46 (1.1%) | 0 (0.0%) |
| No Fuel Used | 12 (0.3%) | 0 (0.0%) |
| Total | 4,317 (100.0%) | 2,740 (100.0%) |
Household Vehicle Usage in Mamaroneck
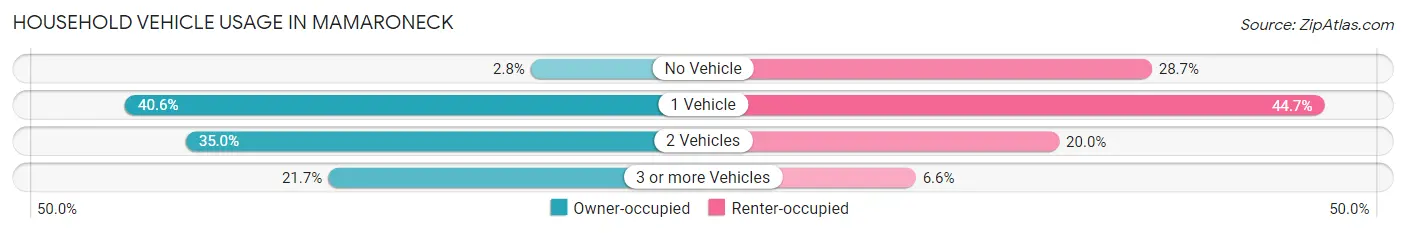
| Vehicles per Household | Owner-occupied | Renter-occupied |
| No Vehicle | 119 (2.8%) | 785 (28.6%) |
| 1 Vehicle | 1,753 (40.6%) | 1,226 (44.7%) |
| 2 Vehicles | 1,509 (34.9%) | 548 (20.0%) |
| 3 or more Vehicles | 936 (21.7%) | 181 (6.6%) |
| Total | 4,317 (100.0%) | 2,740 (100.0%) |
Real Estate & Mortgages in Mamaroneck
Real Estate and Mortgage Overview in Mamaroneck
| Characteristic | Without Mortgage | With Mortgage |
| Housing Units | 1,558 | 2,759 |
| Median Property Value | $646,200 | $769,000 |
| Median Household Income | $115,398 | $1,649 |
| Monthly Housing Costs | $1,439 | $1,968 |
| Real Estate Taxes | $10,001 | $127 |
Property Value by Mortgage Status in Mamaroneck
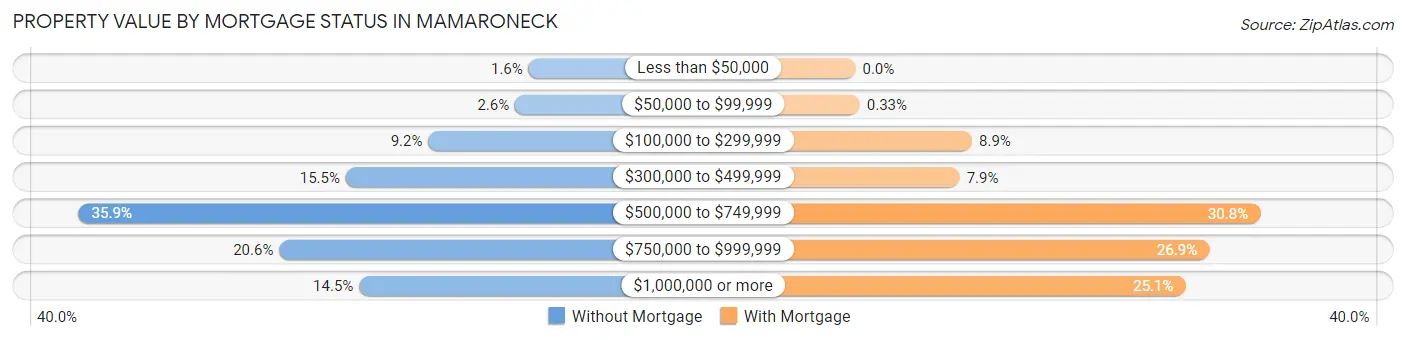
| Property Value | Without Mortgage | With Mortgage |
| Less than $50,000 | 25 (1.6%) | 0 (0.0%) |
| $50,000 to $99,999 | 41 (2.6%) | 9 (0.3%) |
| $100,000 to $299,999 | 144 (9.2%) | 245 (8.9%) |
| $300,000 to $499,999 | 242 (15.5%) | 219 (7.9%) |
| $500,000 to $749,999 | 559 (35.9%) | 850 (30.8%) |
| $750,000 to $999,999 | 321 (20.6%) | 743 (26.9%) |
| $1,000,000 or more | 226 (14.5%) | 693 (25.1%) |
| Total | 1,558 (100.0%) | 2,759 (100.0%) |
Household Income by Mortgage Status in Mamaroneck
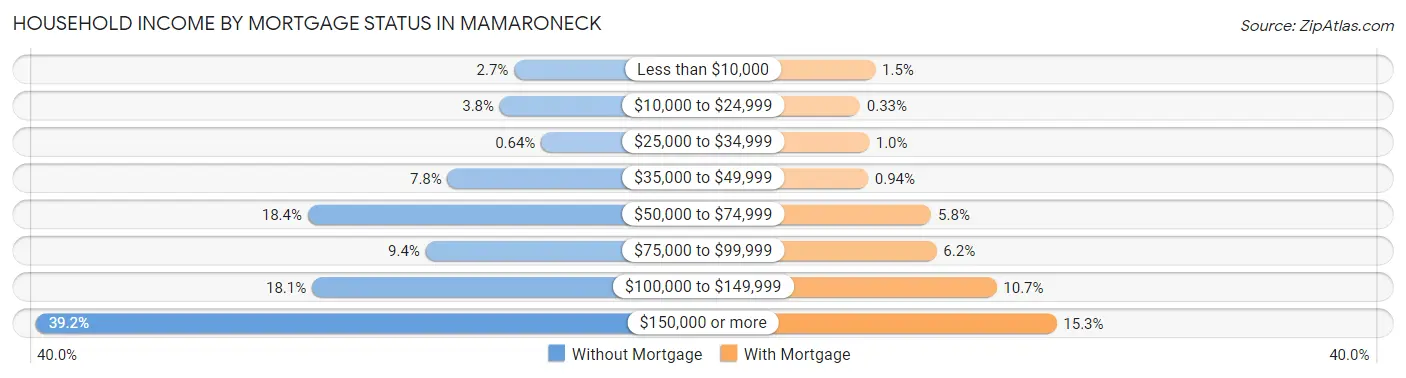
| Household Income | Without Mortgage | With Mortgage |
| Less than $10,000 | 42 (2.7%) | 41 (1.5%) |
| $10,000 to $24,999 | 59 (3.8%) | 9 (0.3%) |
| $25,000 to $34,999 | 10 (0.6%) | 28 (1.0%) |
| $35,000 to $49,999 | 121 (7.8%) | 26 (0.9%) |
| $50,000 to $74,999 | 287 (18.4%) | 159 (5.8%) |
| $75,000 to $99,999 | 147 (9.4%) | 170 (6.2%) |
| $100,000 to $149,999 | 282 (18.1%) | 296 (10.7%) |
| $150,000 or more | 610 (39.2%) | 422 (15.3%) |
| Total | 1,558 (100.0%) | 2,759 (100.0%) |
Property Value to Household Income Ratio in Mamaroneck
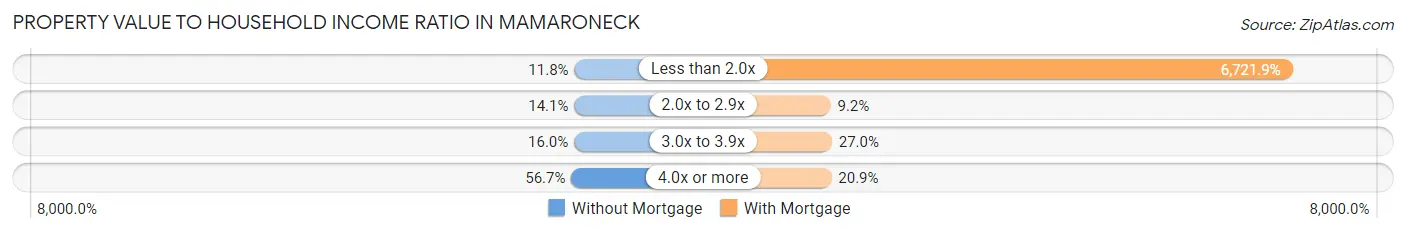
| Value-to-Income Ratio | Without Mortgage | With Mortgage |
| Less than 2.0x | 183 (11.7%) | 185,458 (6,721.9%) |
| 2.0x to 2.9x | 219 (14.1%) | 255 (9.2%) |
| 3.0x to 3.9x | 249 (16.0%) | 745 (27.0%) |
| 4.0x or more | 883 (56.7%) | 576 (20.9%) |
| Total | 1,558 (100.0%) | 2,759 (100.0%) |
Real Estate Taxes by Mortgage Status in Mamaroneck
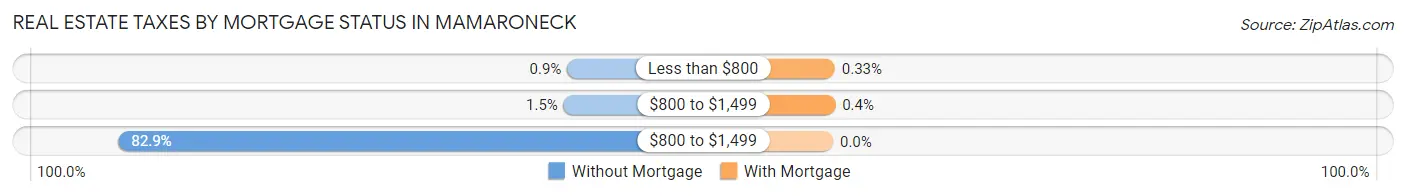
| Property Taxes | Without Mortgage | With Mortgage |
| Less than $800 | 14 (0.9%) | 9 (0.3%) |
| $800 to $1,499 | 24 (1.5%) | 11 (0.4%) |
| $800 to $1,499 | 1,291 (82.9%) | 0 (0.0%) |
| Total | 1,558 (100.0%) | 2,759 (100.0%) |
Health & Disability in Mamaroneck
Health Insurance Coverage by Age in Mamaroneck
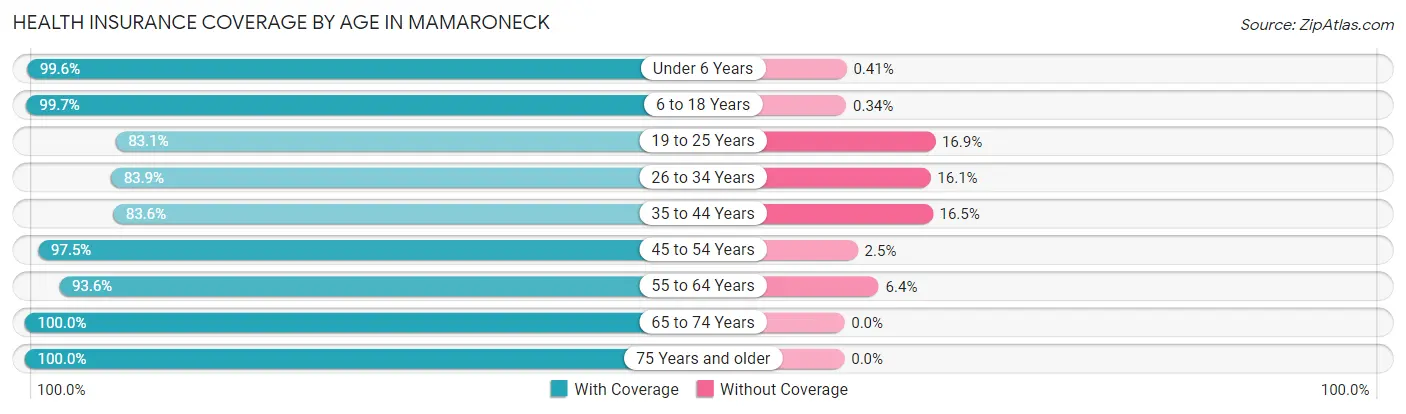
| Age Bracket | With Coverage | Without Coverage |
| Under 6 Years | 1,201 (99.6%) | 5 (0.4%) |
| 6 to 18 Years | 3,467 (99.7%) | 12 (0.3%) |
| 19 to 25 Years | 1,356 (83.1%) | 276 (16.9%) |
| 26 to 34 Years | 1,719 (83.9%) | 329 (16.1%) |
| 35 to 44 Years | 2,372 (83.6%) | 467 (16.5%) |
| 45 to 54 Years | 3,060 (97.5%) | 78 (2.5%) |
| 55 to 64 Years | 2,001 (93.6%) | 137 (6.4%) |
| 65 to 74 Years | 1,601 (100.0%) | 0 (0.0%) |
| 75 Years and older | 1,588 (100.0%) | 0 (0.0%) |
| Total | 18,365 (93.4%) | 1,304 (6.6%) |
Health Insurance Coverage by Citizenship Status in Mamaroneck
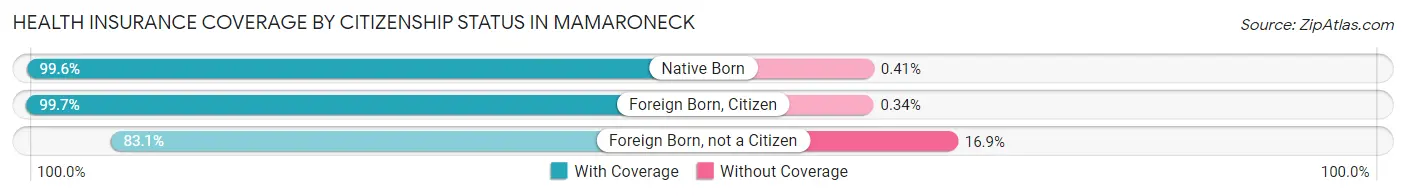
| Citizenship Status | With Coverage | Without Coverage |
| Native Born | 1,201 (99.6%) | 5 (0.4%) |
| Foreign Born, Citizen | 3,467 (99.7%) | 12 (0.3%) |
| Foreign Born, not a Citizen | 1,356 (83.1%) | 276 (16.9%) |
Health Insurance Coverage by Household Income in Mamaroneck
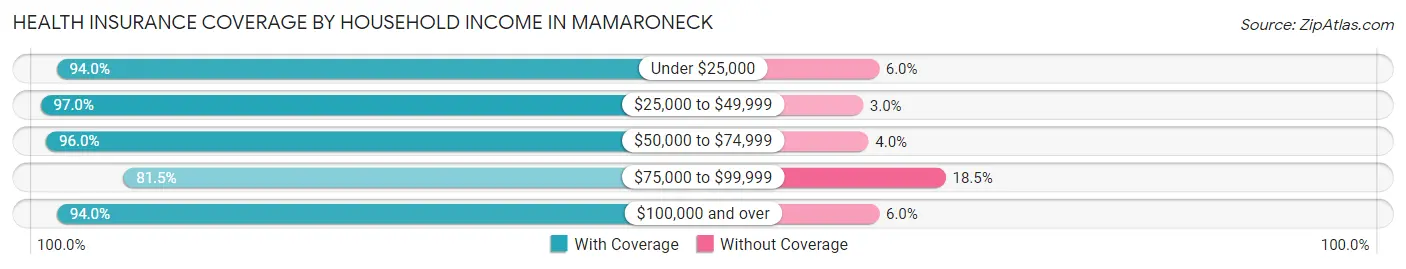
| Household Income | With Coverage | Without Coverage |
| Under $25,000 | 957 (94.0%) | 61 (6.0%) |
| $25,000 to $49,999 | 1,868 (97.0%) | 58 (3.0%) |
| $50,000 to $74,999 | 1,094 (96.0%) | 46 (4.0%) |
| $75,000 to $99,999 | 1,322 (81.5%) | 300 (18.5%) |
| $100,000 and over | 13,045 (94.0%) | 839 (6.0%) |
Public vs Private Health Insurance Coverage by Age in Mamaroneck
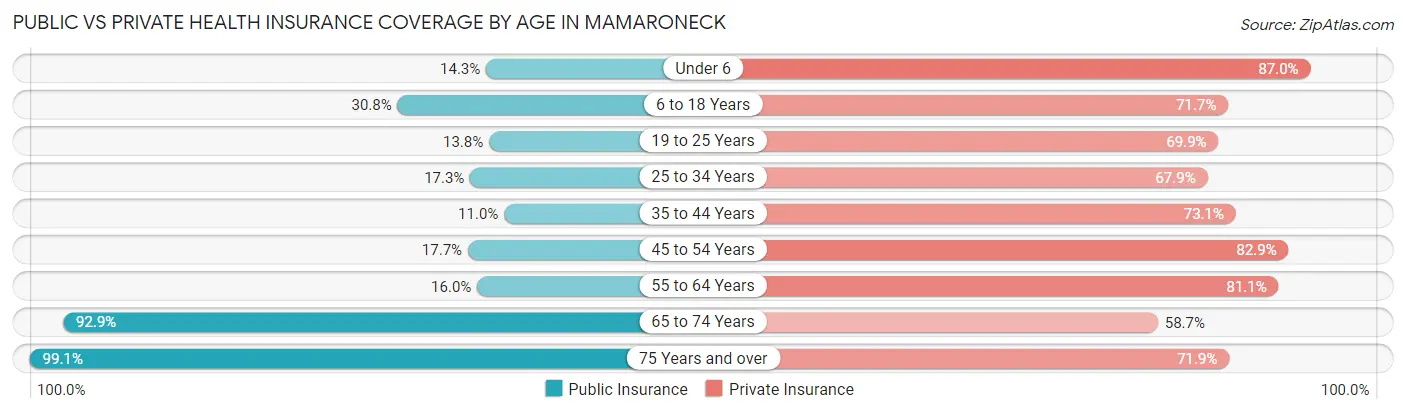
| Age Bracket | Public Insurance | Private Insurance |
| Under 6 | 173 (14.3%) | 1,049 (87.0%) |
| 6 to 18 Years | 1,071 (30.8%) | 2,495 (71.7%) |
| 19 to 25 Years | 225 (13.8%) | 1,141 (69.9%) |
| 25 to 34 Years | 354 (17.3%) | 1,390 (67.9%) |
| 35 to 44 Years | 312 (11.0%) | 2,076 (73.1%) |
| 45 to 54 Years | 556 (17.7%) | 2,602 (82.9%) |
| 55 to 64 Years | 342 (16.0%) | 1,733 (81.1%) |
| 65 to 74 Years | 1,487 (92.9%) | 939 (58.7%) |
| 75 Years and over | 1,573 (99.1%) | 1,142 (71.9%) |
| Total | 6,093 (31.0%) | 14,567 (74.1%) |
Disability Status by Sex by Age in Mamaroneck
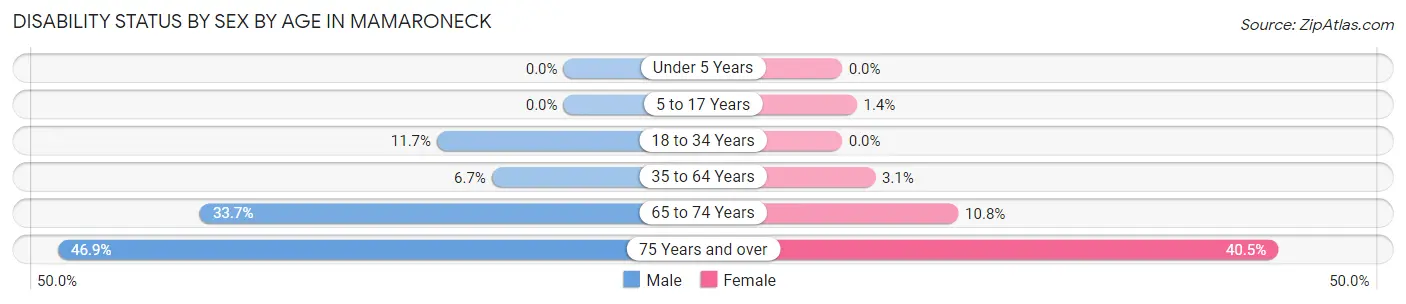
| Age Bracket | Male | Female |
| Under 5 Years | 0 (0.0%) | 0 (0.0%) |
| 5 to 17 Years | 0 (0.0%) | 26 (1.4%) |
| 18 to 34 Years | 263 (11.7%) | 0 (0.0%) |
| 35 to 64 Years | 276 (6.7%) | 122 (3.1%) |
| 65 to 74 Years | 259 (33.7%) | 90 (10.8%) |
| 75 Years and over | 294 (46.9%) | 389 (40.5%) |
Disability Class by Sex by Age in Mamaroneck
Disability Class: Hearing Difficulty
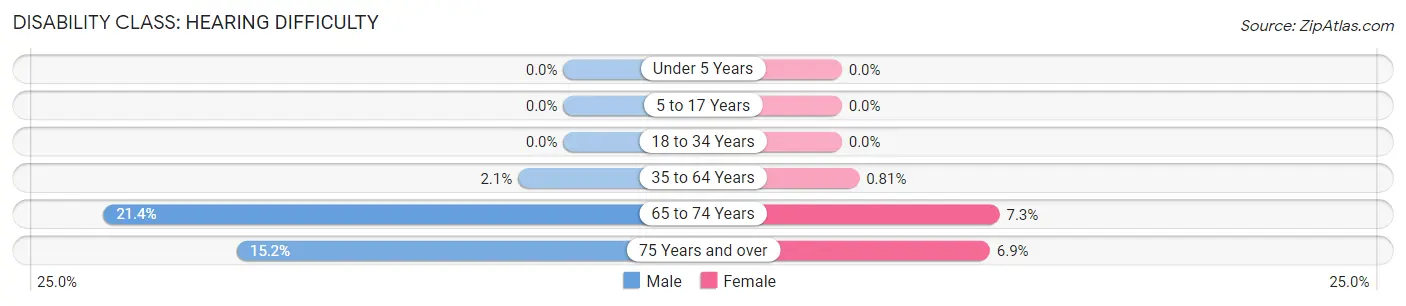
| Age Bracket | Male | Female |
| Under 5 Years | 0 (0.0%) | 0 (0.0%) |
| 5 to 17 Years | 0 (0.0%) | 0 (0.0%) |
| 18 to 34 Years | 0 (0.0%) | 0 (0.0%) |
| 35 to 64 Years | 87 (2.1%) | 32 (0.8%) |
| 65 to 74 Years | 164 (21.3%) | 61 (7.3%) |
| 75 Years and over | 95 (15.1%) | 66 (6.9%) |
Disability Class: Vision Difficulty
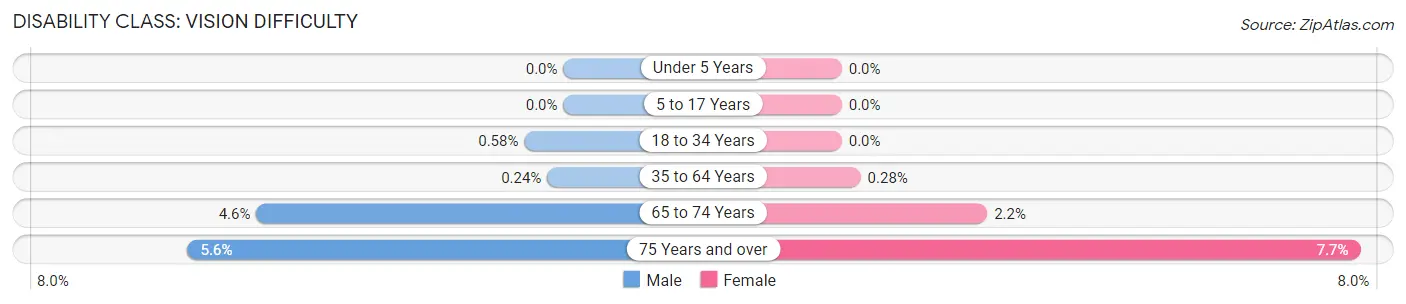
| Age Bracket | Male | Female |
| Under 5 Years | 0 (0.0%) | 0 (0.0%) |
| 5 to 17 Years | 0 (0.0%) | 0 (0.0%) |
| 18 to 34 Years | 13 (0.6%) | 0 (0.0%) |
| 35 to 64 Years | 10 (0.2%) | 11 (0.3%) |
| 65 to 74 Years | 35 (4.6%) | 18 (2.2%) |
| 75 Years and over | 35 (5.6%) | 74 (7.7%) |
Disability Class: Cognitive Difficulty
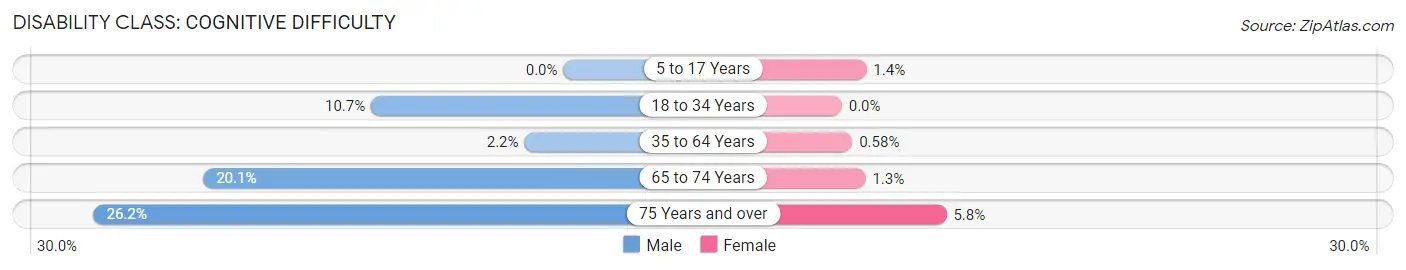
| Age Bracket | Male | Female |
| 5 to 17 Years | 0 (0.0%) | 26 (1.4%) |
| 18 to 34 Years | 240 (10.7%) | 0 (0.0%) |
| 35 to 64 Years | 90 (2.2%) | 23 (0.6%) |
| 65 to 74 Years | 154 (20.1%) | 11 (1.3%) |
| 75 Years and over | 164 (26.2%) | 56 (5.8%) |
Disability Class: Ambulatory Difficulty
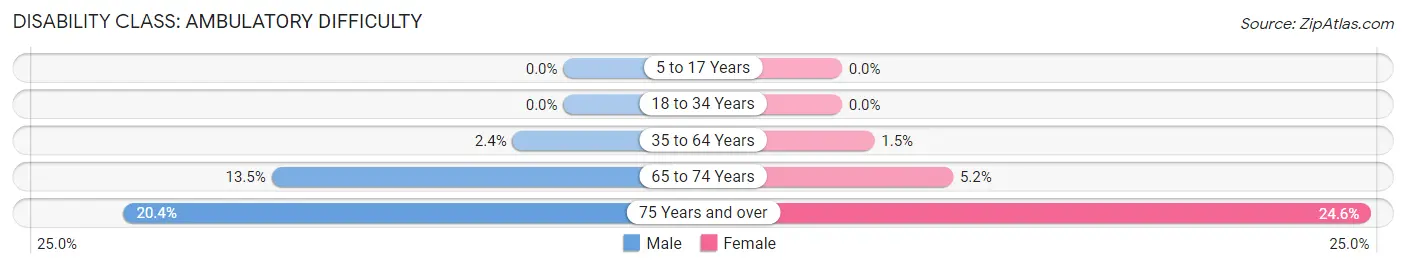
| Age Bracket | Male | Female |
| 5 to 17 Years | 0 (0.0%) | 0 (0.0%) |
| 18 to 34 Years | 0 (0.0%) | 0 (0.0%) |
| 35 to 64 Years | 98 (2.4%) | 60 (1.5%) |
| 65 to 74 Years | 104 (13.5%) | 43 (5.2%) |
| 75 Years and over | 128 (20.4%) | 236 (24.6%) |
Disability Class: Self-Care Difficulty
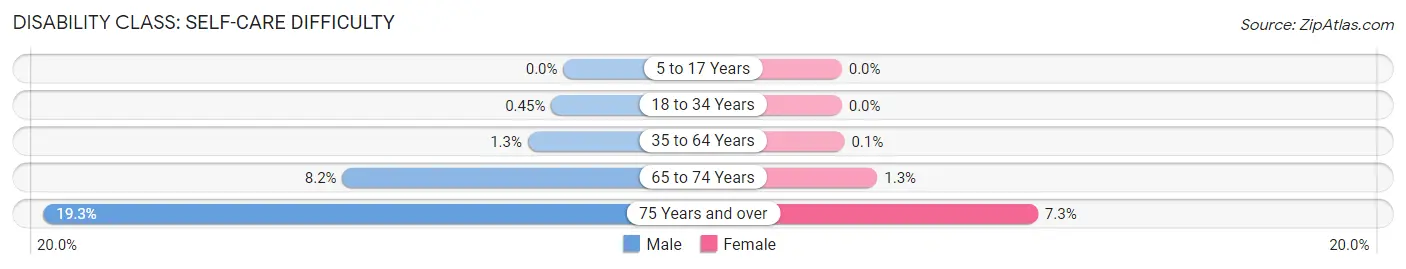
| Age Bracket | Male | Female |
| 5 to 17 Years | 0 (0.0%) | 0 (0.0%) |
| 18 to 34 Years | 10 (0.4%) | 0 (0.0%) |
| 35 to 64 Years | 55 (1.3%) | 4 (0.1%) |
| 65 to 74 Years | 63 (8.2%) | 11 (1.3%) |
| 75 Years and over | 121 (19.3%) | 70 (7.3%) |
Technology Access in Mamaroneck
Computing Device Access in Mamaroneck
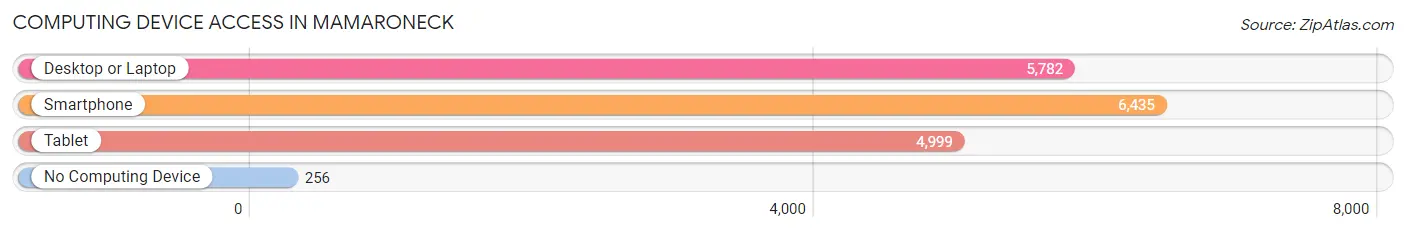
| Device Type | # Households | % Households |
| Desktop or Laptop | 5,782 | 81.9% |
| Smartphone | 6,435 | 91.2% |
| Tablet | 4,999 | 70.8% |
| No Computing Device | 256 | 3.6% |
| Total | 7,057 | 100.0% |
Internet Access in Mamaroneck
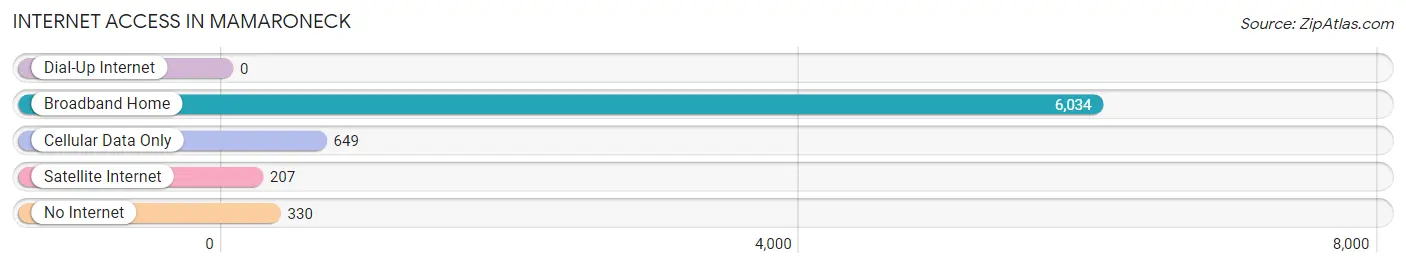
| Internet Type | # Households | % Households |
| Dial-Up Internet | 0 | 0.0% |
| Broadband Home | 6,034 | 85.5% |
| Cellular Data Only | 649 | 9.2% |
| Satellite Internet | 207 | 2.9% |
| No Internet | 330 | 4.7% |
| Total | 7,057 | 100.0% |
Mamaroneck Summary
Mamaroneck is a village located in Westchester County, New York, United States. It is situated on the Long Island Sound, about 25 miles northeast of New York City. The village is part of the town of Mamaroneck, which also includes the neighboring villages of Larchmont and Rye Neck. As of the 2010 census, the village had a population of 19,959.
History
Mamaroneck was originally inhabited by the Siwanoy Native American tribe. The first European settlers arrived in the area in 1661, when the Dutch West India Company purchased the land from the Siwanoy. The village was incorporated in 1788 and was named after the Siwanoy word for “place of good land.”
In the 19th century, Mamaroneck became a popular summer resort for wealthy New Yorkers. The village was home to several grand hotels, including the Mamaroneck Beach and Yacht Club, which was built in 1891. The village also became a popular destination for wealthy New Yorkers looking to escape the summer heat of the city.
In the early 20th century, Mamaroneck experienced a period of rapid growth. The village was home to several large factories, including the Mamaroneck Mills, which produced textiles and clothing. The village also became a popular destination for immigrants from Europe, particularly from Italy and Ireland.
Geography
Mamaroneck is located at 41° 4' N, 73° 44' W (41.0667, -73.7333). The village is situated on the Long Island Sound, about 25 miles northeast of New York City. The village is part of the town of Mamaroneck, which also includes the neighboring villages of Larchmont and Rye Neck.
The village has a total area of 4.2 square miles, of which 3.9 square miles is land and 0.3 square miles is water. The village is bordered to the north by the town of Harrison, to the east by the town of Rye, to the south by the town of New Rochelle, and to the west by the town of Eastchester.
Economy
Mamaroneck has a diverse economy, with a mix of retail, manufacturing, and service businesses. The village is home to several large employers, including the Mamaroneck Mills, which produces textiles and clothing, and the Mamaroneck Beach and Yacht Club, which is a popular destination for tourists.
The village is also home to several small businesses, including restaurants, shops, and professional services. The village is also home to several financial institutions, including the Bank of New York Mellon and the Chase Bank.
Demographics
As of the 2010 census, the village had a population of 19,959. The population density was 4,741.3 people per square mile. The racial makeup of the village was 79.2% White, 8.2% African American, 0.2% Native American, 6.3% Asian, 0.1% Pacific Islander, 3.2% from other races, and 2.9% from two or more races. Hispanic or Latino of any race were 11.3% of the population.
The median household income in the village was $87,845, and the median family income was $103,945. About 4.3% of families and 6.2% of the population were below the poverty line, including 8.2% of those under age 18 and 4.2% of those age 65 or over.
Common Questions
What is Per Capita Income in Mamaroneck?
Per Capita income in Mamaroneck is $66,178.
What is the Median Family Income in Mamaroneck?
Median Family Income in Mamaroneck is $144,886.
What is the Median Household income in Mamaroneck?
Median Household Income in Mamaroneck is $121,672.
What is Income or Wage Gap in Mamaroneck?
Income or Wage Gap in Mamaroneck is 19.4%.
Women in Mamaroneck earn 80.6 cents for every dollar earned by a man.
What is Inequality or Gini Index in Mamaroneck?
Inequality or Gini Index in Mamaroneck is 0.50.
What is the Total Population of Mamaroneck?
Total Population of Mamaroneck is 19,930.
What is the Total Male Population of Mamaroneck?
Total Male Population of Mamaroneck is 10,296.
What is the Total Female Population of Mamaroneck?
Total Female Population of Mamaroneck is 9,634.
What is the Ratio of Males per 100 Females in Mamaroneck?
There are 106.87 Males per 100 Females in Mamaroneck.
What is the Ratio of Females per 100 Males in Mamaroneck?
There are 93.57 Females per 100 Males in Mamaroneck.
What is the Median Population Age in Mamaroneck?
Median Population Age in Mamaroneck is 40.8 Years.
What is the Average Family Size in Mamaroneck
Average Family Size in Mamaroneck is 3.2 People.
What is the Average Household Size in Mamaroneck
Average Household Size in Mamaroneck is 2.8 People.
How Large is the Labor Force in Mamaroneck?
There are 10,851 People in the Labor Forcein in Mamaroneck.
What is the Percentage of People in the Labor Force in Mamaroneck?
69.2% of People are in the Labor Force in Mamaroneck.
What is the Unemployment Rate in Mamaroneck?
Unemployment Rate in Mamaroneck is 3.6%.