Union City, NJ Map & Demographics
Union City Map
Union City Overview
$31,030
PER CAPITA INCOME
$62,307
AVG FAMILY INCOME
$59,967
AVG HOUSEHOLD INCOME
26.8%
WAGE / INCOME GAP [ % ]
73.2¢/ $1
WAGE / INCOME GAP [ $ ]
$10,662
FAMILY INCOME DEFICIT
0.48
INEQUALITY / GINI INDEX
67,258
TOTAL POPULATION
32,765
MALE POPULATION
34,493
FEMALE POPULATION
94.99
MALES / 100 FEMALES
105.27
FEMALES / 100 MALES
36.6
MEDIAN AGE
3.1
AVG FAMILY SIZE
2.6
AVG HOUSEHOLD SIZE
36,724
LABOR FORCE [ PEOPLE ]
68.2%
PERCENT IN LABOR FORCE
7.8%
UNEMPLOYMENT RATE
Union City Zip Codes
Income in Union City
Income Overview in Union City
Per Capita Income in Union City is $31,030, while median incomes of families and households are $62,307 and $59,967 respectively.
| Characteristic | Number | Measure |
| Per Capita Income | 67,258 | $31,030 |
| Median Family Income | 16,801 | $62,307 |
| Mean Family Income | 16,801 | $85,197 |
| Median Household Income | 25,610 | $59,967 |
| Mean Household Income | 25,610 | $82,094 |
| Income Deficit | 16,801 | $10,662 |
| Wage / Income Gap (%) | 67,258 | 26.82% |
| Wage / Income Gap ($) | 67,258 | 73.18¢ per $1 |
| Gini / Inequality Index | 67,258 | 0.48 |
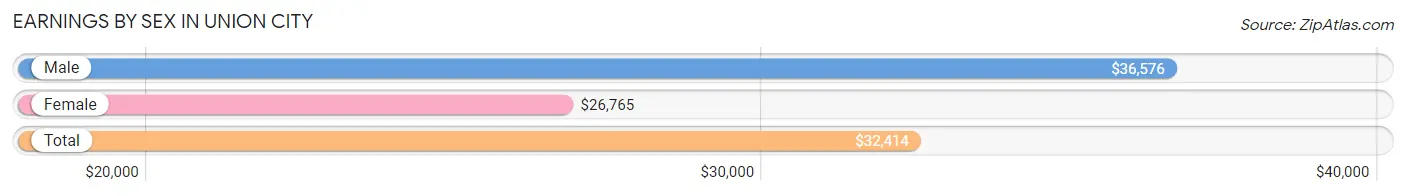
Earnings by Sex in Union City
Average Earnings in Union City are $32,414, $36,576 for men and $26,765 for women, a difference of 26.8%.
| Sex | Number | Average Earnings |
| Male | 19,707 (52.8%) | $36,576 |
| Female | 17,627 (47.2%) | $26,765 |
| Total | 37,334 (100.0%) | $32,414 |
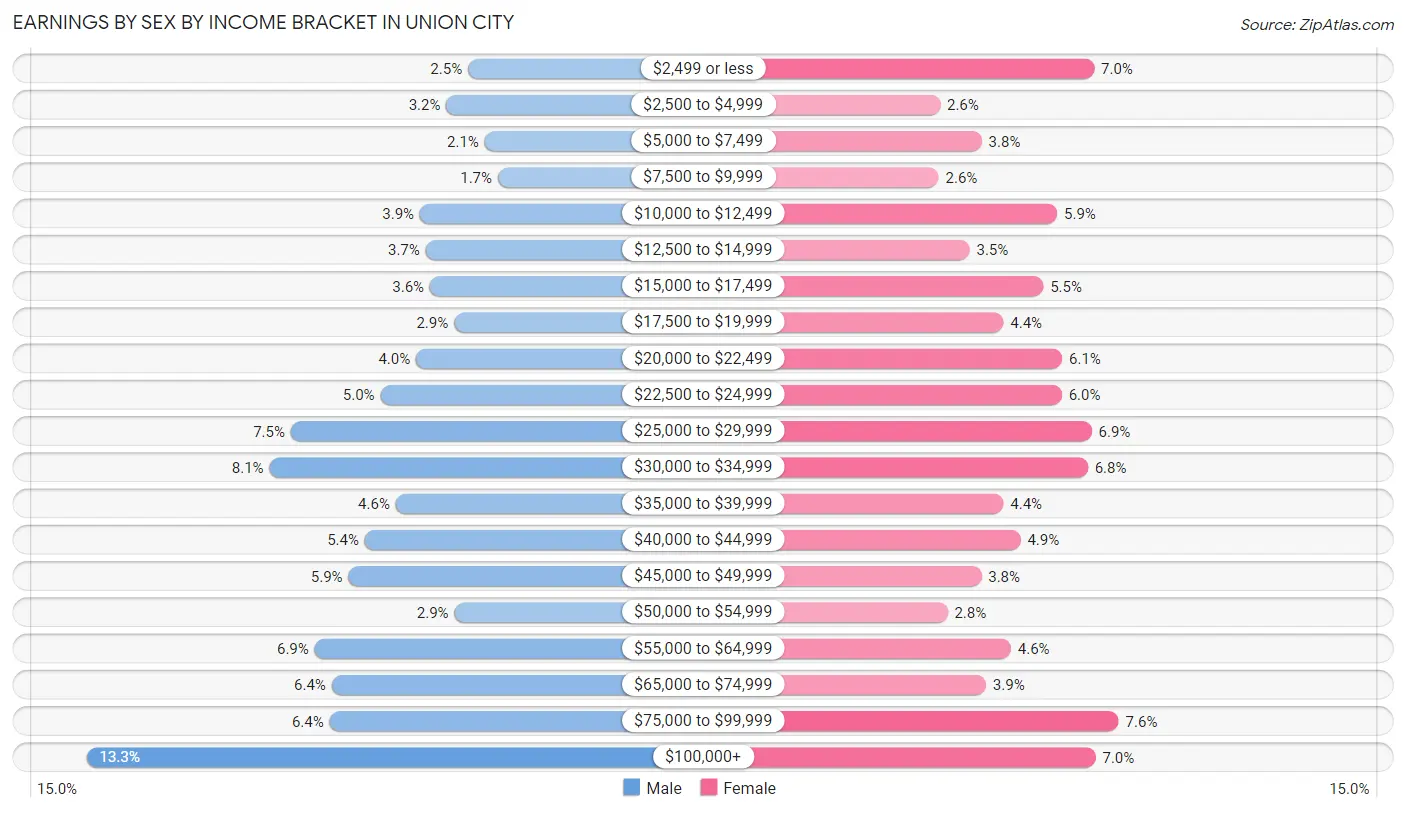
Earnings by Sex by Income Bracket in Union City
The most common earnings brackets in Union City are $100,000+ for men (2,614 | 13.3%) and $75,000 to $99,999 for women (1,347 | 7.6%).
| Income | Male | Female |
| $2,499 or less | 500 (2.5%) | 1,225 (7.0%) |
| $2,500 to $4,999 | 620 (3.2%) | 462 (2.6%) |
| $5,000 to $7,499 | 407 (2.1%) | 668 (3.8%) |
| $7,500 to $9,999 | 335 (1.7%) | 454 (2.6%) |
| $10,000 to $12,499 | 767 (3.9%) | 1,041 (5.9%) |
| $12,500 to $14,999 | 736 (3.7%) | 609 (3.5%) |
| $15,000 to $17,499 | 712 (3.6%) | 973 (5.5%) |
| $17,500 to $19,999 | 577 (2.9%) | 776 (4.4%) |
| $20,000 to $22,499 | 789 (4.0%) | 1,067 (6.0%) |
| $22,500 to $24,999 | 985 (5.0%) | 1,064 (6.0%) |
| $25,000 to $29,999 | 1,481 (7.5%) | 1,212 (6.9%) |
| $30,000 to $34,999 | 1,601 (8.1%) | 1,193 (6.8%) |
| $35,000 to $39,999 | 900 (4.6%) | 775 (4.4%) |
| $40,000 to $44,999 | 1,072 (5.4%) | 861 (4.9%) |
| $45,000 to $49,999 | 1,163 (5.9%) | 667 (3.8%) |
| $50,000 to $54,999 | 575 (2.9%) | 498 (2.8%) |
| $55,000 to $64,999 | 1,349 (6.9%) | 813 (4.6%) |
| $65,000 to $74,999 | 1,256 (6.4%) | 690 (3.9%) |
| $75,000 to $99,999 | 1,268 (6.4%) | 1,347 (7.6%) |
| $100,000+ | 2,614 (13.3%) | 1,232 (7.0%) |
| Total | 19,707 (100.0%) | 17,627 (100.0%) |
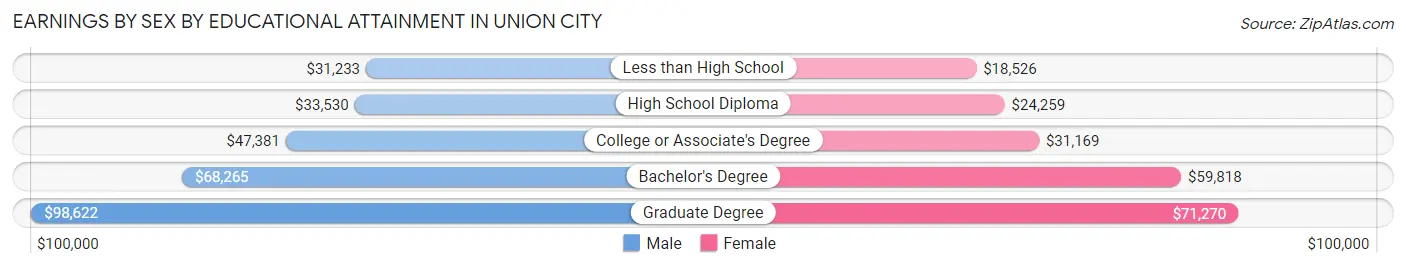
Earnings by Sex by Educational Attainment in Union City
Average earnings in Union City are $41,493 for men and $31,305 for women, a difference of 24.5%. Men with an educational attainment of graduate degree enjoy the highest average annual earnings of $98,622, while those with less than high school education earn the least with $31,233. Women with an educational attainment of graduate degree earn the most with the average annual earnings of $71,270, while those with less than high school education have the smallest earnings of $18,526.
| Educational Attainment | Male Income | Female Income |
| Less than High School | $31,233 | $18,526 |
| High School Diploma | $33,530 | $24,259 |
| College or Associate's Degree | $47,381 | $31,169 |
| Bachelor's Degree | $68,265 | $59,818 |
| Graduate Degree | $98,622 | $71,270 |
| Total | $41,493 | $31,305 |
Family Income in Union City
Family Income Brackets in Union City
According to the Union City family income data, there are 2,991 families falling into the $50,000 to $74,999 income range, which is the most common income bracket and makes up 17.8% of all families. Conversely, the $10,000 to $14,999 income bracket is the least frequent group with only 218 families (1.3%) belonging to this category.
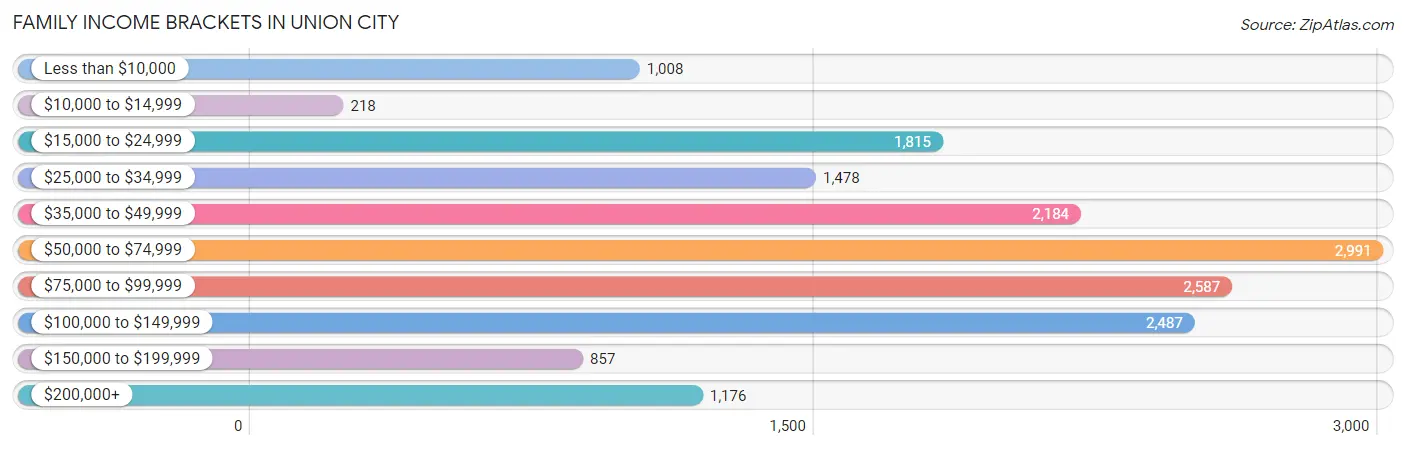
| Income Bracket | # Families | % Families |
| Less than $10,000 | 1,008 | 6.0% |
| $10,000 to $14,999 | 218 | 1.3% |
| $15,000 to $24,999 | 1,815 | 10.8% |
| $25,000 to $34,999 | 1,478 | 8.8% |
| $35,000 to $49,999 | 2,184 | 13.0% |
| $50,000 to $74,999 | 2,991 | 17.8% |
| $75,000 to $99,999 | 2,587 | 15.4% |
| $100,000 to $149,999 | 2,487 | 14.8% |
| $150,000 to $199,999 | 857 | 5.1% |
| $200,000+ | 1,176 | 7.0% |
Family Income by Famaliy Size in Union City
7+ person families (320 | 1.9%) account for the highest median family income in Union City with $120,341 per family, while 2-person families (7,125 | 42.4%) have the highest median income of $26,152 per family member.
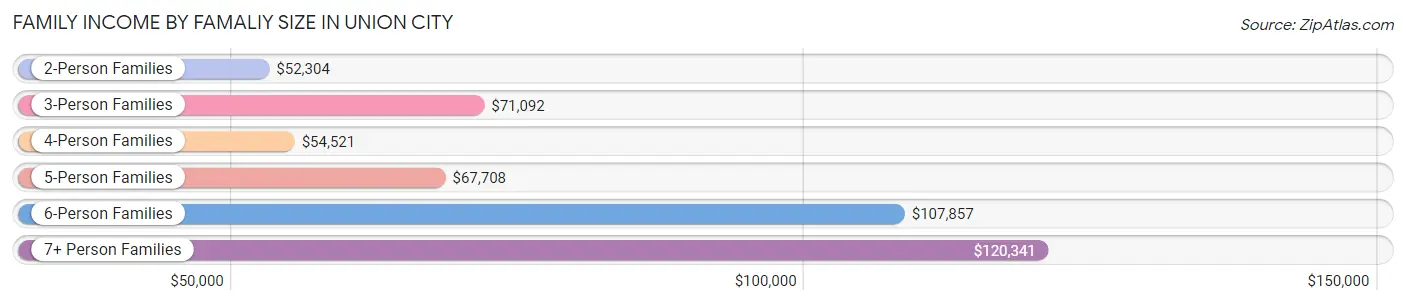
| Income Bracket | # Families | Median Income |
| 2-Person Families | 7,125 (42.4%) | $52,304 |
| 3-Person Families | 4,068 (24.2%) | $71,092 |
| 4-Person Families | 3,030 (18.0%) | $54,521 |
| 5-Person Families | 1,634 (9.7%) | $67,708 |
| 6-Person Families | 624 (3.7%) | $107,857 |
| 7+ Person Families | 320 (1.9%) | $120,341 |
| Total | 16,801 (100.0%) | $62,307 |
Family Income by Number of Earners in Union City
The median family income in Union City is $62,307, with families comprising 3+ earners (2,581) having the highest median family income of $96,290, while families with no earners (1,462) have the lowest median family income of $19,587, accounting for 15.4% and 8.7% of families, respectively.
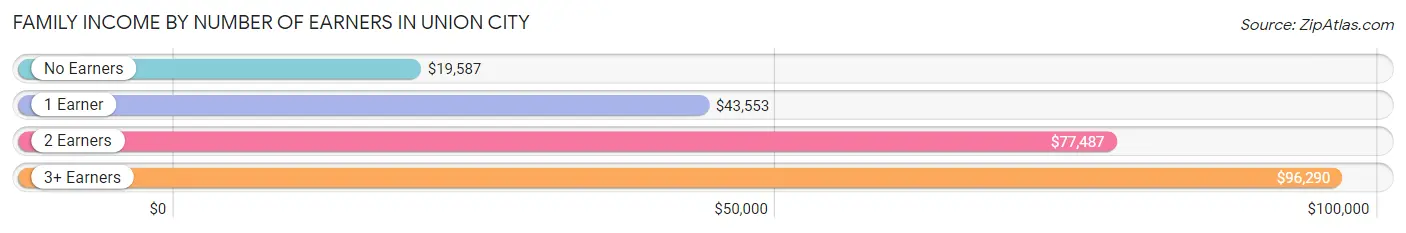
| Number of Earners | # Families | Median Income |
| No Earners | 1,462 (8.7%) | $19,587 |
| 1 Earner | 5,515 (32.8%) | $43,553 |
| 2 Earners | 7,243 (43.1%) | $77,487 |
| 3+ Earners | 2,581 (15.4%) | $96,290 |
| Total | 16,801 (100.0%) | $62,307 |
Household Income in Union City
Household Income Brackets in Union City
With 4,456 households falling in the category, the $50,000 to $74,999 income range is the most frequent in Union City, accounting for 17.4% of all households. In contrast, only 1,357 households (5.3%) fall into the $150,000 to $199,999 income bracket, making it the least populous group.
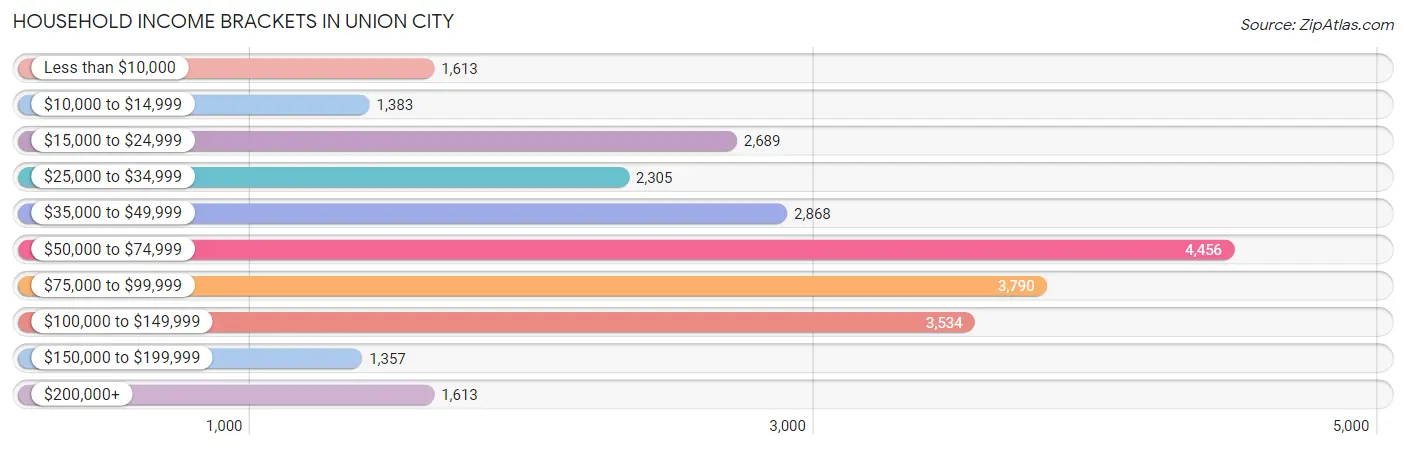
| Income Bracket | # Households | % Households |
| Less than $10,000 | 1,613 | 6.3% |
| $10,000 to $14,999 | 1,383 | 5.4% |
| $15,000 to $24,999 | 2,689 | 10.5% |
| $25,000 to $34,999 | 2,305 | 9.0% |
| $35,000 to $49,999 | 2,868 | 11.2% |
| $50,000 to $74,999 | 4,456 | 17.4% |
| $75,000 to $99,999 | 3,790 | 14.8% |
| $100,000 to $149,999 | 3,534 | 13.8% |
| $150,000 to $199,999 | 1,357 | 5.3% |
| $200,000+ | 1,613 | 6.3% |
Household Income by Householder Age in Union City
The median household income in Union City is $59,967, with the highest median household income of $68,714 found in the 25 to 44 years age bracket for the primary householder. A total of 9,848 households (38.5%) fall into this category. Meanwhile, the 65+ years age bracket for the primary householder has the lowest median household income of $30,438, with 5,009 households (19.6%) in this group.
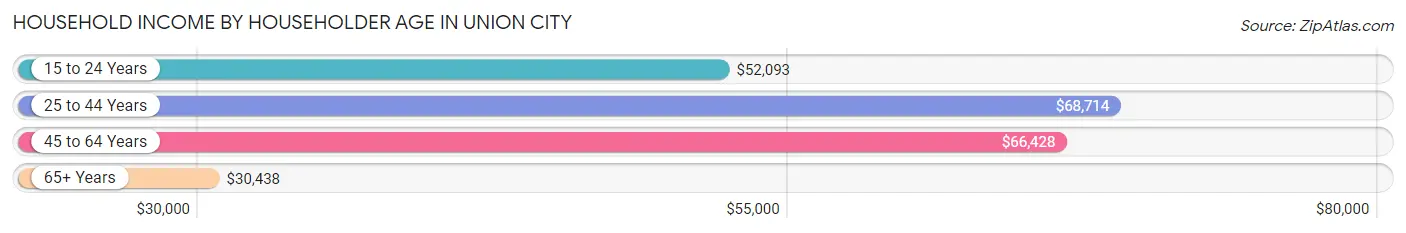
| Income Bracket | # Households | Median Income |
| 15 to 24 Years | 764 (3.0%) | $52,093 |
| 25 to 44 Years | 9,848 (38.5%) | $68,714 |
| 45 to 64 Years | 9,989 (39.0%) | $66,428 |
| 65+ Years | 5,009 (19.6%) | $30,438 |
| Total | 25,610 (100.0%) | $59,967 |
Poverty in Union City
Income Below Poverty by Sex and Age in Union City
With 19.0% poverty level for males and 21.6% for females among the residents of Union City, 5 year old males and 12 to 14 year old females are the most vulnerable to poverty, with 141 males (53.8%) and 320 females (31.3%) in their respective age groups living below the poverty level.
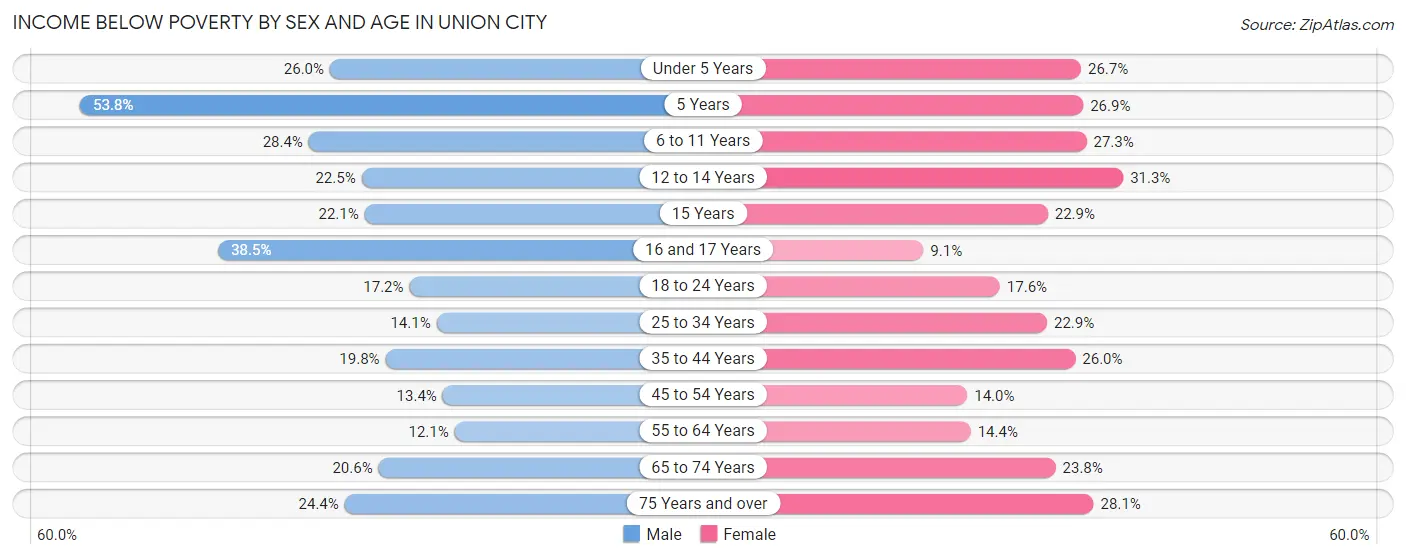
| Age Bracket | Male | Female |
| Under 5 Years | 430 (26.0%) | 646 (26.7%) |
| 5 Years | 141 (53.8%) | 110 (26.9%) |
| 6 to 11 Years | 692 (28.4%) | 648 (27.3%) |
| 12 to 14 Years | 335 (22.5%) | 320 (31.3%) |
| 15 Years | 93 (22.1%) | 128 (22.9%) |
| 16 and 17 Years | 335 (38.5%) | 78 (9.1%) |
| 18 to 24 Years | 560 (17.2%) | 673 (17.6%) |
| 25 to 34 Years | 721 (14.1%) | 1,110 (22.9%) |
| 35 to 44 Years | 1,029 (19.8%) | 1,306 (26.0%) |
| 45 to 54 Years | 643 (13.4%) | 670 (14.0%) |
| 55 to 64 Years | 449 (12.1%) | 482 (14.4%) |
| 65 to 74 Years | 402 (20.6%) | 547 (23.8%) |
| 75 Years and over | 325 (24.4%) | 657 (28.1%) |
| Total | 6,155 (19.0%) | 7,375 (21.6%) |
Income Above Poverty by Sex and Age in Union City
According to the poverty statistics in Union City, males aged 55 to 64 years and females aged 16 and 17 years are the age groups that are most secure financially, with 87.9% of males and 90.9% of females in these age groups living above the poverty line.
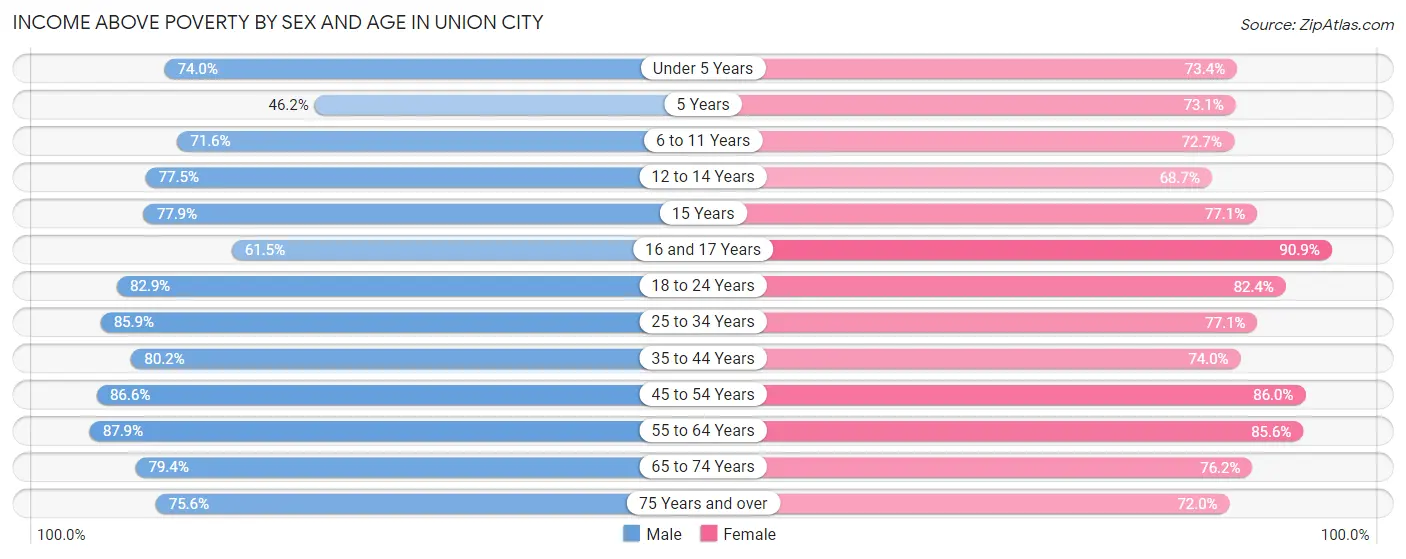
| Age Bracket | Male | Female |
| Under 5 Years | 1,224 (74.0%) | 1,778 (73.4%) |
| 5 Years | 121 (46.2%) | 299 (73.1%) |
| 6 to 11 Years | 1,748 (71.6%) | 1,729 (72.7%) |
| 12 to 14 Years | 1,155 (77.5%) | 701 (68.7%) |
| 15 Years | 327 (77.9%) | 430 (77.1%) |
| 16 and 17 Years | 536 (61.5%) | 780 (90.9%) |
| 18 to 24 Years | 2,705 (82.9%) | 3,148 (82.4%) |
| 25 to 34 Years | 4,381 (85.9%) | 3,746 (77.1%) |
| 35 to 44 Years | 4,164 (80.2%) | 3,715 (74.0%) |
| 45 to 54 Years | 4,143 (86.6%) | 4,122 (86.0%) |
| 55 to 64 Years | 3,255 (87.9%) | 2,875 (85.6%) |
| 65 to 74 Years | 1,550 (79.4%) | 1,750 (76.2%) |
| 75 Years and over | 1,009 (75.6%) | 1,685 (72.0%) |
| Total | 26,318 (81.0%) | 26,758 (78.4%) |
Income Below Poverty Among Married-Couple Families in Union City
The poverty statistics for married-couple families in Union City show that 12.3% or 1,142 of the total 9,244 families live below the poverty line. Families with 5 or more children have the highest poverty rate of 59.5%, comprising of 47 families. On the other hand, families with no children have the lowest poverty rate of 6.6%, which includes 300 families.
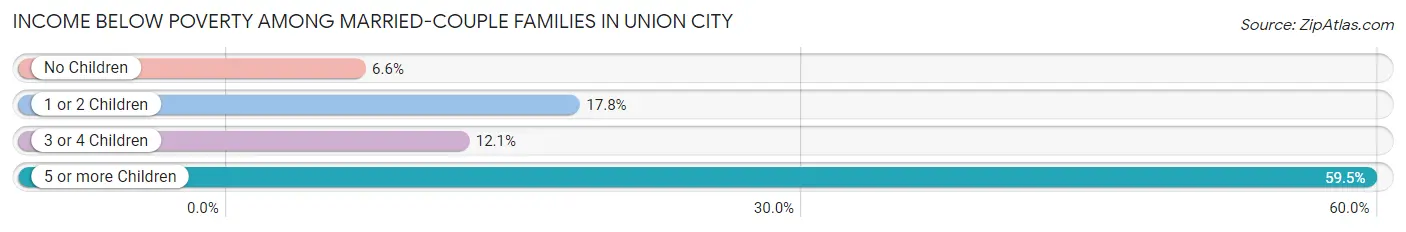
| Children | Above Poverty | Below Poverty |
| No Children | 4,218 (93.4%) | 300 (6.6%) |
| 1 or 2 Children | 3,341 (82.2%) | 725 (17.8%) |
| 3 or 4 Children | 511 (87.9%) | 70 (12.0%) |
| 5 or more Children | 32 (40.5%) | 47 (59.5%) |
| Total | 8,102 (87.6%) | 1,142 (12.3%) |
Income Below Poverty Among Single-Parent Households in Union City
According to the poverty data in Union City, 11.9% or 264 single-father households and 24.9% or 1,332 single-mother households are living below the poverty line. Among single-father households, those with 3 or 4 children have the highest poverty rate, with 30 households (39.0%) experiencing poverty. Likewise, among single-mother households, those with 3 or 4 children have the highest poverty rate, with 127 households (51.4%) falling below the poverty line.
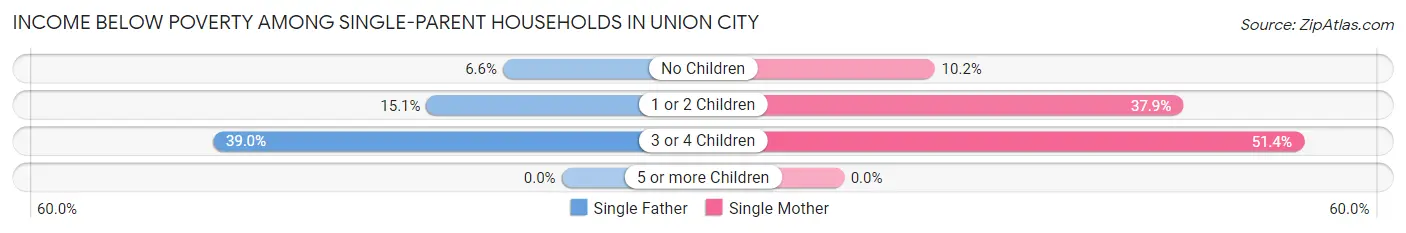
| Children | Single Father | Single Mother |
| No Children | 68 (6.6%) | 265 (10.2%) |
| 1 or 2 Children | 166 (15.1%) | 940 (37.9%) |
| 3 or 4 Children | 30 (39.0%) | 127 (51.4%) |
| 5 or more Children | 0 (0.0%) | 0 (0.0%) |
| Total | 264 (11.9%) | 1,332 (24.9%) |
Income Below Poverty Among Married-Couple vs Single-Parent Households in Union City
The poverty data for Union City shows that 1,142 of the married-couple family households (12.3%) and 1,596 of the single-parent households (21.1%) are living below the poverty level. Within the married-couple family households, those with 5 or more children have the highest poverty rate, with 47 households (59.5%) falling below the poverty line. Among the single-parent households, those with 3 or 4 children have the highest poverty rate, with 157 household (48.5%) living below poverty.
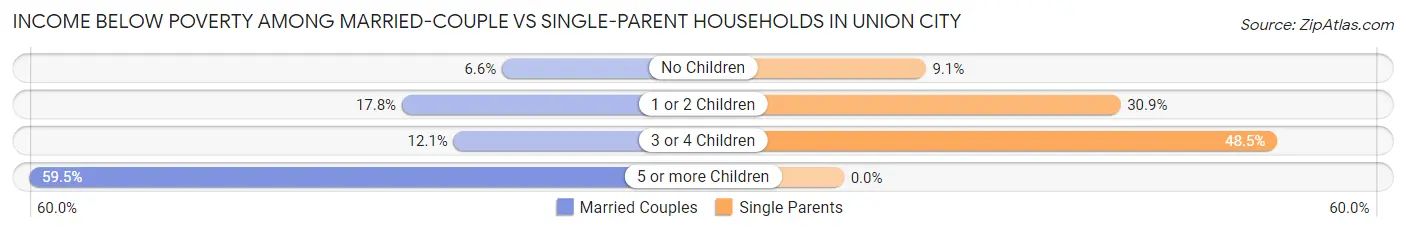
| Children | Married-Couple Families | Single-Parent Households |
| No Children | 300 (6.6%) | 333 (9.1%) |
| 1 or 2 Children | 725 (17.8%) | 1,106 (30.9%) |
| 3 or 4 Children | 70 (12.0%) | 157 (48.5%) |
| 5 or more Children | 47 (59.5%) | 0 (0.0%) |
| Total | 1,142 (12.3%) | 1,596 (21.1%) |
Race in Union City
The most populous races in Union City are Hispanic or Latino (54,707 | 81.3%), White / Caucasian (24,697 | 36.7%), and Some other Race (20,909 | 31.1%).
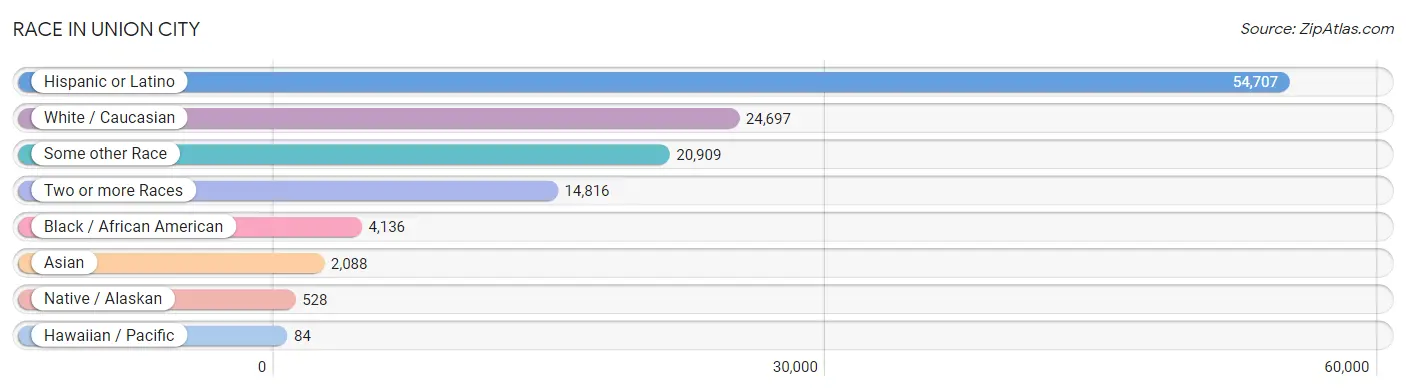
| Race | # Population | % Population |
| Asian | 2,088 | 3.1% |
| Black / African American | 4,136 | 6.1% |
| Hawaiian / Pacific | 84 | 0.1% |
| Hispanic or Latino | 54,707 | 81.3% |
| Native / Alaskan | 528 | 0.8% |
| White / Caucasian | 24,697 | 36.7% |
| Two or more Races | 14,816 | 22.0% |
| Some other Race | 20,909 | 31.1% |
| Total | 67,258 | 100.0% |
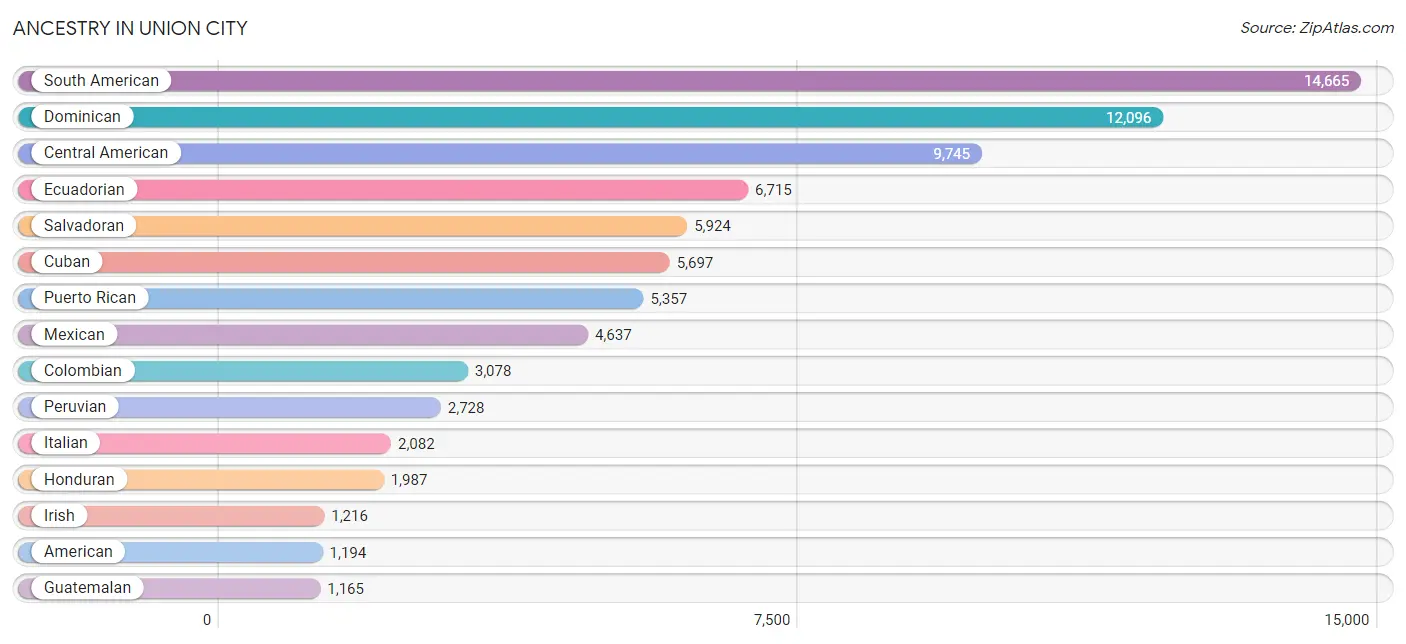
Ancestry in Union City
The most populous ancestries reported in Union City are South American (14,665 | 21.8%), Dominican (12,096 | 18.0%), Central American (9,745 | 14.5%), Ecuadorian (6,715 | 10.0%), and Salvadoran (5,924 | 8.8%), together accounting for 73.1% of all Union City residents.
| Ancestry | # Population | % Population |
| African | 548 | 0.8% |
| Albanian | 34 | 0.1% |
| American | 1,194 | 1.8% |
| Arab | 674 | 1.0% |
| Argentinean | 139 | 0.2% |
| Armenian | 8 | 0.0% |
| Assyrian / Chaldean / Syriac | 15 | 0.0% |
| Australian | 10 | 0.0% |
| Austrian | 21 | 0.0% |
| Barbadian | 10 | 0.0% |
| Basque | 9 | 0.0% |
| Bhutanese | 77 | 0.1% |
| Bolivian | 310 | 0.5% |
| Brazilian | 145 | 0.2% |
| British | 42 | 0.1% |
| British West Indian | 53 | 0.1% |
| Burmese | 237 | 0.4% |
| Canadian | 13 | 0.0% |
| Central American | 9,745 | 14.5% |
| Central American Indian | 425 | 0.6% |
| Chilean | 339 | 0.5% |
| Colombian | 3,078 | 4.6% |
| Costa Rican | 144 | 0.2% |
| Croatian | 35 | 0.1% |
| Cuban | 5,697 | 8.5% |
| Czech | 9 | 0.0% |
| Danish | 14 | 0.0% |
| Delaware | 27 | 0.0% |
| Dominican | 12,096 | 18.0% |
| Dutch | 110 | 0.2% |
| Eastern European | 154 | 0.2% |
| Ecuadorian | 6,715 | 10.0% |
| Egyptian | 58 | 0.1% |
| English | 512 | 0.8% |
| European | 270 | 0.4% |
| Finnish | 64 | 0.1% |
| French | 242 | 0.4% |
| German | 880 | 1.3% |
| Greek | 179 | 0.3% |
| Guatemalan | 1,165 | 1.7% |
| Guyanese | 49 | 0.1% |
| Haitian | 321 | 0.5% |
| Honduran | 1,987 | 2.9% |
| Hungarian | 33 | 0.1% |
| Indian (Asian) | 682 | 1.0% |
| Iranian | 56 | 0.1% |
| Irish | 1,216 | 1.8% |
| Iroquois | 9 | 0.0% |
| Israeli | 43 | 0.1% |
| Italian | 2,082 | 3.1% |
| Jamaican | 173 | 0.3% |
| Jordanian | 159 | 0.2% |
| Kenyan | 28 | 0.0% |
| Korean | 395 | 0.6% |
| Laotian | 42 | 0.1% |
| Latvian | 14 | 0.0% |
| Lebanese | 199 | 0.3% |
| Lithuanian | 59 | 0.1% |
| Macedonian | 30 | 0.0% |
| Mexican | 4,637 | 6.9% |
| Mexican American Indian | 115 | 0.2% |
| Moroccan | 36 | 0.1% |
| Native Hawaiian | 13 | 0.0% |
| Nicaraguan | 237 | 0.4% |
| Nigerian | 169 | 0.3% |
| Norwegian | 37 | 0.1% |
| Okinawan | 15 | 0.0% |
| Pakistani | 187 | 0.3% |
| Palestinian | 24 | 0.0% |
| Panamanian | 202 | 0.3% |
| Peruvian | 2,728 | 4.1% |
| Polish | 578 | 0.9% |
| Portuguese | 193 | 0.3% |
| Puerto Rican | 5,357 | 8.0% |
| Romanian | 42 | 0.1% |
| Russian | 177 | 0.3% |
| Salvadoran | 5,924 | 8.8% |
| Scotch-Irish | 41 | 0.1% |
| Scottish | 287 | 0.4% |
| Senegalese | 33 | 0.1% |
| Sierra Leonean | 5 | 0.0% |
| Slavic | 14 | 0.0% |
| Slovak | 5 | 0.0% |
| South American | 14,665 | 21.8% |
| South American Indian | 220 | 0.3% |
| Spaniard | 235 | 0.4% |
| Spanish | 111 | 0.2% |
| Sri Lankan | 53 | 0.1% |
| Subsaharan African | 788 | 1.2% |
| Swedish | 72 | 0.1% |
| Swiss | 152 | 0.2% |
| Syrian | 75 | 0.1% |
| Thai | 509 | 0.8% |
| Trinidadian and Tobagonian | 91 | 0.1% |
| Turkish | 84 | 0.1% |
| Ukrainian | 15 | 0.0% |
| Uruguayan | 219 | 0.3% |
| Venezuelan | 1,137 | 1.7% |
| Vietnamese | 25 | 0.0% |
| Welsh | 55 | 0.1% |
| West Indian | 107 | 0.2% | View All 101 Rows |
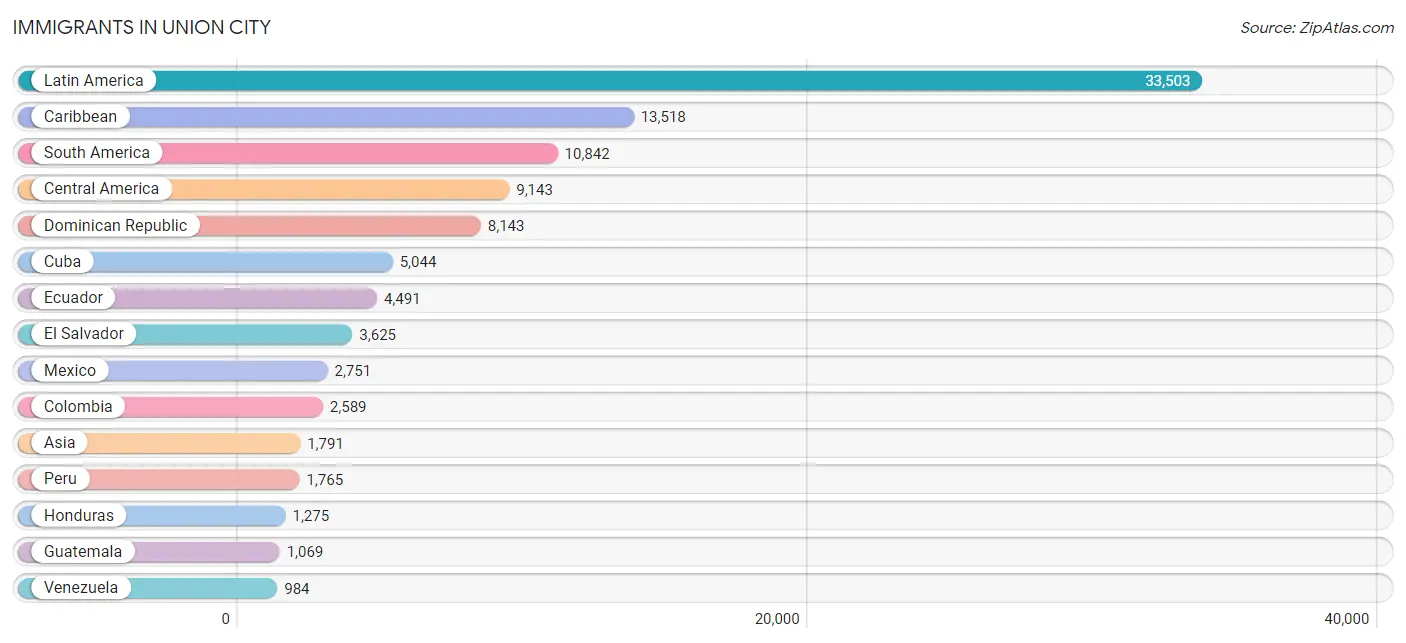
Immigrants in Union City
The most numerous immigrant groups reported in Union City came from Latin America (33,503 | 49.8%), Caribbean (13,518 | 20.1%), South America (10,842 | 16.1%), Central America (9,143 | 13.6%), and Dominican Republic (8,143 | 12.1%), together accounting for 111.7% of all Union City residents.
| Immigration Origin | # Population | % Population |
| Africa | 444 | 0.7% |
| Albania | 68 | 0.1% |
| Argentina | 84 | 0.1% |
| Asia | 1,791 | 2.7% |
| Bangladesh | 12 | 0.0% |
| Barbados | 5 | 0.0% |
| Belarus | 17 | 0.0% |
| Belgium | 8 | 0.0% |
| Bolivia | 297 | 0.4% |
| Bosnia and Herzegovina | 10 | 0.0% |
| Brazil | 123 | 0.2% |
| Canada | 11 | 0.0% |
| Caribbean | 13,518 | 20.1% |
| Central America | 9,143 | 13.6% |
| Chile | 324 | 0.5% |
| China | 283 | 0.4% |
| Colombia | 2,589 | 3.8% |
| Costa Rica | 139 | 0.2% |
| Cuba | 5,044 | 7.5% |
| Dominican Republic | 8,143 | 12.1% |
| Eastern Africa | 51 | 0.1% |
| Eastern Asia | 463 | 0.7% |
| Eastern Europe | 301 | 0.4% |
| Ecuador | 4,491 | 6.7% |
| Egypt | 20 | 0.0% |
| El Salvador | 3,625 | 5.4% |
| England | 9 | 0.0% |
| Ethiopia | 7 | 0.0% |
| Europe | 980 | 1.5% |
| France | 42 | 0.1% |
| Germany | 53 | 0.1% |
| Ghana | 16 | 0.0% |
| Guatemala | 1,069 | 1.6% |
| Guyana | 15 | 0.0% |
| Haiti | 138 | 0.2% |
| Honduras | 1,275 | 1.9% |
| Hong Kong | 36 | 0.1% |
| India | 413 | 0.6% |
| Indonesia | 33 | 0.1% |
| Iran | 9 | 0.0% |
| Ireland | 23 | 0.0% |
| Israel | 4 | 0.0% |
| Italy | 195 | 0.3% |
| Jamaica | 57 | 0.1% |
| Japan | 77 | 0.1% |
| Jordan | 86 | 0.1% |
| Kenya | 28 | 0.0% |
| Korea | 103 | 0.2% |
| Latin America | 33,503 | 49.8% |
| Lebanon | 26 | 0.0% |
| Mexico | 2,751 | 4.1% |
| Middle Africa | 35 | 0.1% |
| Morocco | 36 | 0.1% |
| Netherlands | 10 | 0.0% |
| Nicaragua | 89 | 0.1% |
| Nigeria | 64 | 0.1% |
| North Macedonia | 45 | 0.1% |
| Northern Africa | 120 | 0.2% |
| Northern Europe | 124 | 0.2% |
| Norway | 17 | 0.0% |
| Pakistan | 15 | 0.0% |
| Panama | 195 | 0.3% |
| Peru | 1,765 | 2.6% |
| Philippines | 310 | 0.5% |
| Poland | 45 | 0.1% |
| Romania | 15 | 0.0% |
| Russia | 44 | 0.1% |
| Senegal | 81 | 0.1% |
| Sierra Leone | 5 | 0.0% |
| Singapore | 18 | 0.0% |
| South Africa | 5 | 0.0% |
| South America | 10,842 | 16.1% |
| South Central Asia | 637 | 0.9% |
| South Eastern Asia | 497 | 0.7% |
| Southern Europe | 338 | 0.5% |
| Spain | 143 | 0.2% |
| Sri Lanka | 91 | 0.1% |
| St. Vincent and the Grenadines | 19 | 0.0% |
| Switzerland | 104 | 0.2% |
| Taiwan | 45 | 0.1% |
| Thailand | 124 | 0.2% |
| Trinidad and Tobago | 79 | 0.1% |
| Turkey | 4 | 0.0% |
| Ukraine | 57 | 0.1% |
| Uruguay | 170 | 0.3% |
| Uzbekistan | 97 | 0.1% |
| Venezuela | 984 | 1.5% |
| Vietnam | 12 | 0.0% |
| Western Africa | 166 | 0.3% |
| Western Asia | 175 | 0.3% |
| Western Europe | 217 | 0.3% |
| Yemen | 55 | 0.1% | View All 92 Rows |
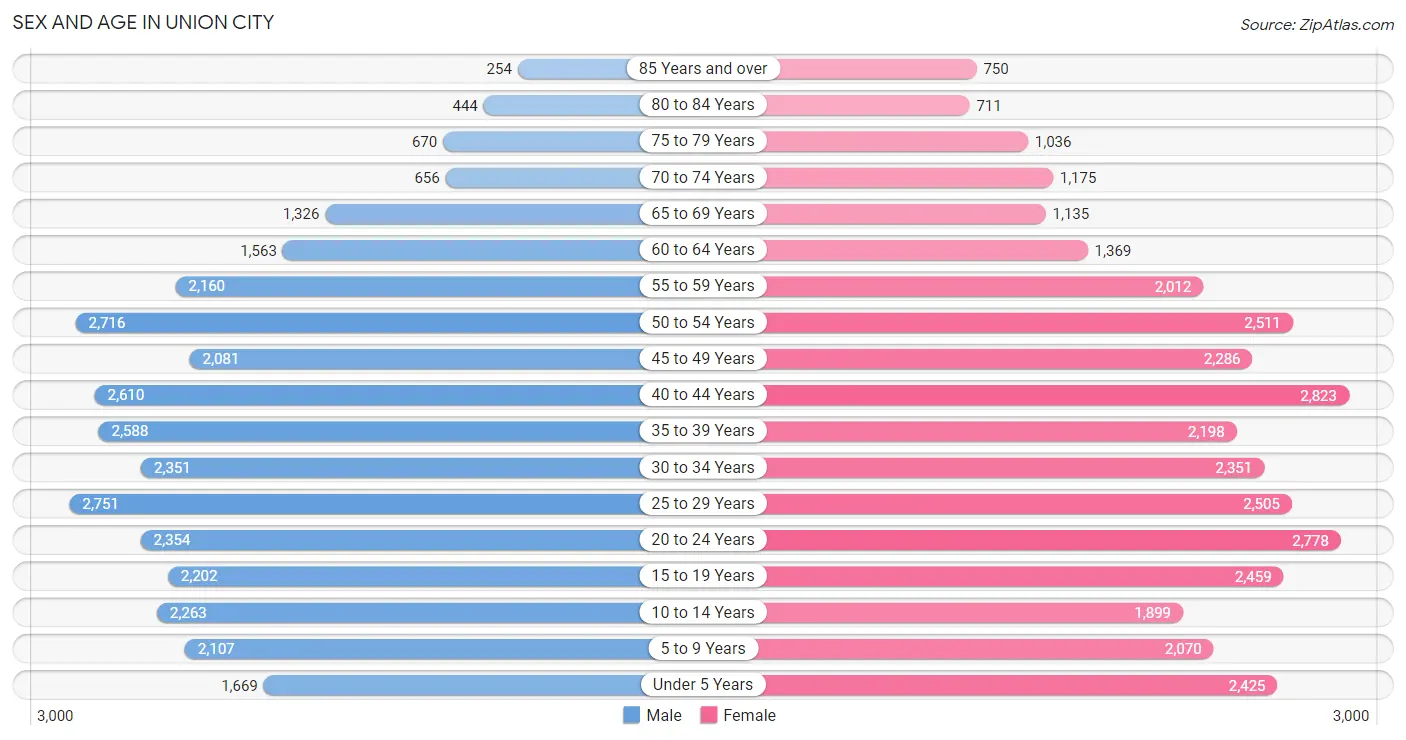
Sex and Age in Union City
Sex and Age in Union City
The most populous age groups in Union City are 25 to 29 Years (2,751 | 8.4%) for men and 40 to 44 Years (2,823 | 8.2%) for women.
| Age Bracket | Male | Female |
| Under 5 Years | 1,669 (5.1%) | 2,425 (7.0%) |
| 5 to 9 Years | 2,107 (6.4%) | 2,070 (6.0%) |
| 10 to 14 Years | 2,263 (6.9%) | 1,899 (5.5%) |
| 15 to 19 Years | 2,202 (6.7%) | 2,459 (7.1%) |
| 20 to 24 Years | 2,354 (7.2%) | 2,778 (8.1%) |
| 25 to 29 Years | 2,751 (8.4%) | 2,505 (7.3%) |
| 30 to 34 Years | 2,351 (7.2%) | 2,351 (6.8%) |
| 35 to 39 Years | 2,588 (7.9%) | 2,198 (6.4%) |
| 40 to 44 Years | 2,610 (8.0%) | 2,823 (8.2%) |
| 45 to 49 Years | 2,081 (6.4%) | 2,286 (6.6%) |
| 50 to 54 Years | 2,716 (8.3%) | 2,511 (7.3%) |
| 55 to 59 Years | 2,160 (6.6%) | 2,012 (5.8%) |
| 60 to 64 Years | 1,563 (4.8%) | 1,369 (4.0%) |
| 65 to 69 Years | 1,326 (4.1%) | 1,135 (3.3%) |
| 70 to 74 Years | 656 (2.0%) | 1,175 (3.4%) |
| 75 to 79 Years | 670 (2.0%) | 1,036 (3.0%) |
| 80 to 84 Years | 444 (1.4%) | 711 (2.1%) |
| 85 Years and over | 254 (0.8%) | 750 (2.2%) |
| Total | 32,765 (100.0%) | 34,493 (100.0%) |
Families and Households in Union City
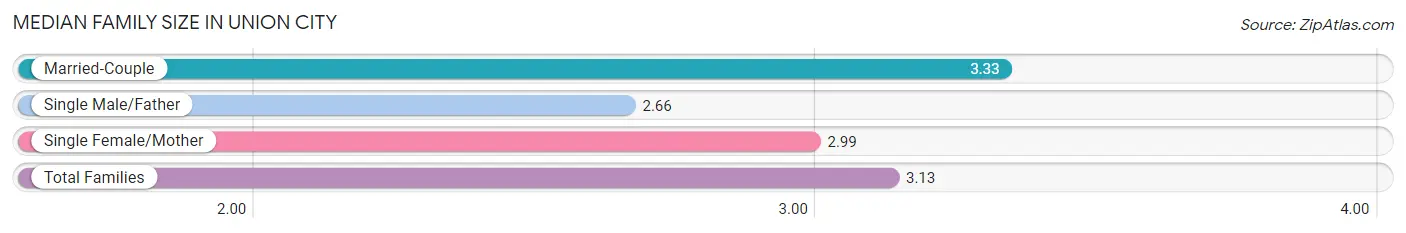
Median Family Size in Union City
The median family size in Union City is 3.13 persons per family, with married-couple families (9,244 | 55.0%) accounting for the largest median family size of 3.33 persons per family. On the other hand, single male/father families (2,213 | 13.2%) represent the smallest median family size with 2.66 persons per family.
| Family Type | # Families | Family Size |
| Married-Couple | 9,244 (55.0%) | 3.33 |
| Single Male/Father | 2,213 (13.2%) | 2.66 |
| Single Female/Mother | 5,344 (31.8%) | 2.99 |
| Total Families | 16,801 (100.0%) | 3.13 |
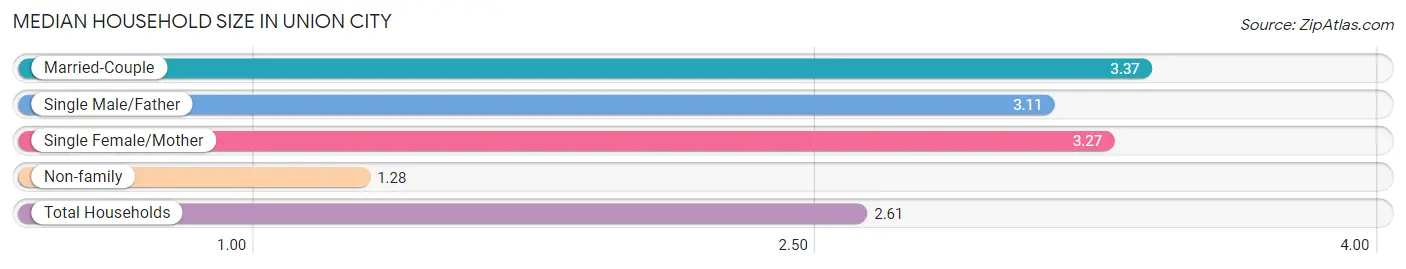
Median Household Size in Union City
The median household size in Union City is 2.61 persons per household, with married-couple households (9,244 | 36.1%) accounting for the largest median household size of 3.37 persons per household. non-family households (8,809 | 34.4%) represent the smallest median household size with 1.28 persons per household.
| Household Type | # Households | Household Size |
| Married-Couple | 9,244 (36.1%) | 3.37 |
| Single Male/Father | 2,213 (8.6%) | 3.11 |
| Single Female/Mother | 5,344 (20.9%) | 3.27 |
| Non-family | 8,809 (34.4%) | 1.28 |
| Total Households | 25,610 (100.0%) | 2.61 |
Household Size by Marriage Status in Union City
Out of a total of 25,610 households in Union City, 16,801 (65.6%) are family households, while 8,809 (34.4%) are nonfamily households. The most numerous type of family households are 2-person households, comprising 6,066, and the most common type of nonfamily households are 1-person households, comprising 6,939.
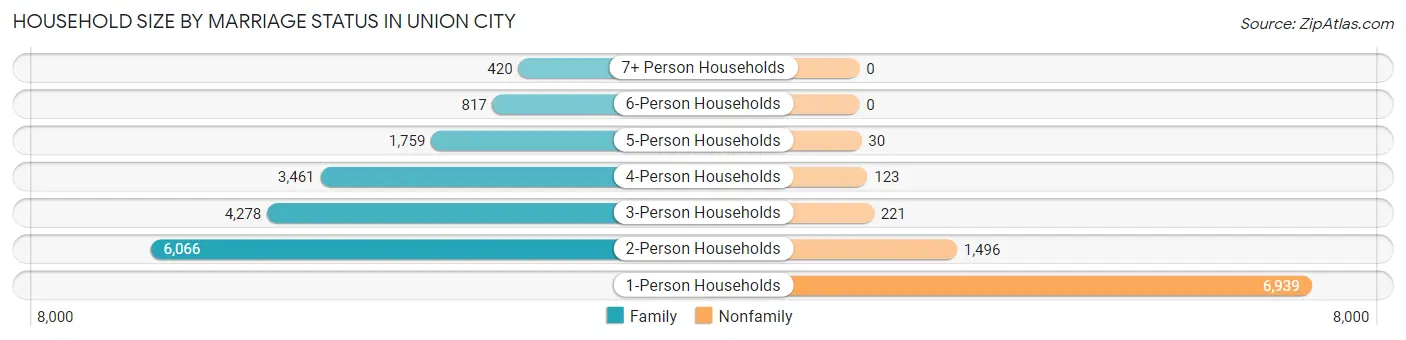
| Household Size | Family Households | Nonfamily Households |
| 1-Person Households | - | 6,939 (27.1%) |
| 2-Person Households | 6,066 (23.7%) | 1,496 (5.8%) |
| 3-Person Households | 4,278 (16.7%) | 221 (0.9%) |
| 4-Person Households | 3,461 (13.5%) | 123 (0.5%) |
| 5-Person Households | 1,759 (6.9%) | 30 (0.1%) |
| 6-Person Households | 817 (3.2%) | 0 (0.0%) |
| 7+ Person Households | 420 (1.6%) | 0 (0.0%) |
| Total | 16,801 (65.6%) | 8,809 (34.4%) |
Female Fertility in Union City
Fertility by Age in Union City
Average fertility rate in Union City is 45.0 births per 1,000 women. Women in the age bracket of 20 to 34 years have the highest fertility rate with 87.0 births per 1,000 women. Women in the age bracket of 20 to 34 years acount for 82.3% of all women with births.
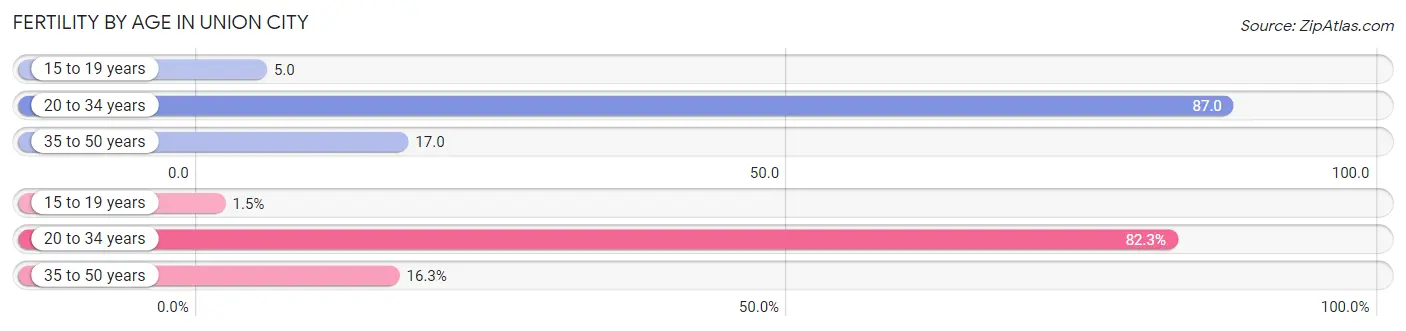
| Age Bracket | Women with Births | Births / 1,000 Women |
| 15 to 19 years | 12 (1.5%) | 5.0 |
| 20 to 34 years | 663 (82.3%) | 87.0 |
| 35 to 50 years | 131 (16.3%) | 17.0 |
| Total | 806 (100.0%) | 45.0 |
Fertility by Age by Marriage Status in Union City
73.9% of women with births (806) in Union City are married. The highest percentage of unmarried women with births falls into 15 to 19 years age bracket with 100.0% of them unmarried at the time of birth, while the lowest percentage of unmarried women with births belong to 35 to 50 years age bracket with 0.8% of them unmarried.
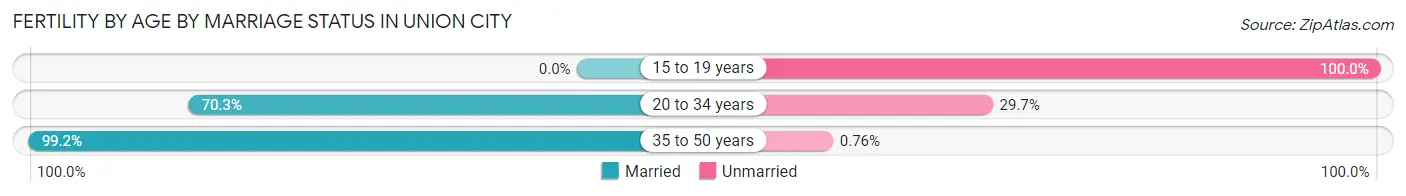
| Age Bracket | Married | Unmarried |
| 15 to 19 years | 0 (0.0%) | 12 (100.0%) |
| 20 to 34 years | 466 (70.3%) | 197 (29.7%) |
| 35 to 50 years | 130 (99.2%) | 1 (0.8%) |
| Total | 596 (74.0%) | 210 (26.1%) |
Fertility by Education in Union City
Average fertility rate in Union City is 45.0 births per 1,000 women. Women with the education attainment of graduate degree have the highest fertility rate of 114.0 births per 1,000 women, while women with the education attainment of bachelor's degree have the lowest fertility at 33.0 births per 1,000 women. Women with the education attainment of high school diploma represent 31.0% of all women with births.
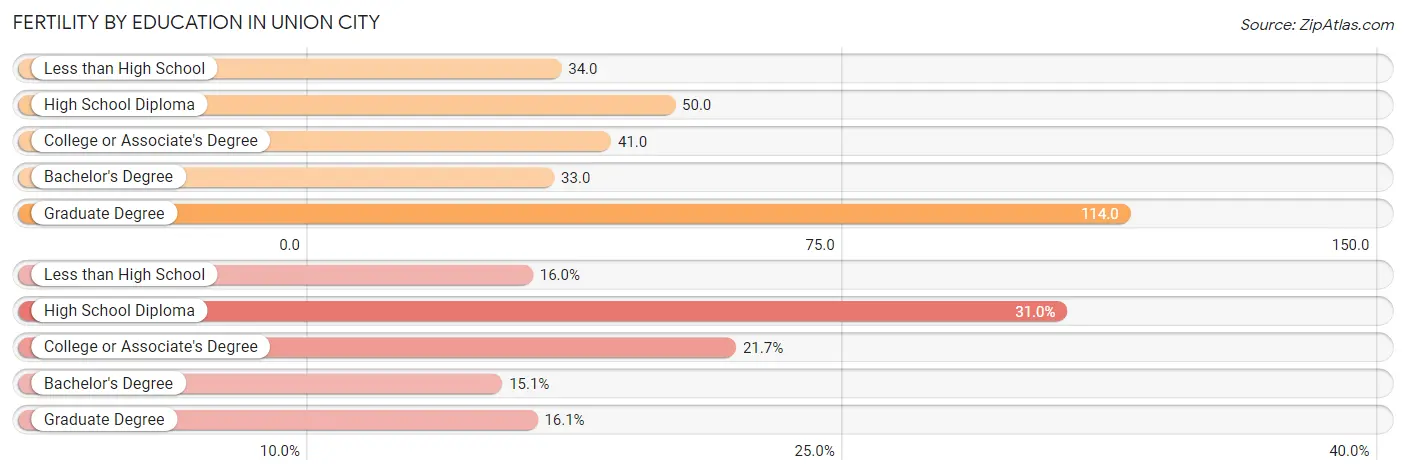
| Educational Attainment | Women with Births | Births / 1,000 Women |
| Less than High School | 129 (16.0%) | 34.0 |
| High School Diploma | 250 (31.0%) | 50.0 |
| College or Associate's Degree | 175 (21.7%) | 41.0 |
| Bachelor's Degree | 122 (15.1%) | 33.0 |
| Graduate Degree | 130 (16.1%) | 114.0 |
| Total | 806 (100.0%) | 45.0 |
Fertility by Education by Marriage Status in Union City
26.1% of women with births in Union City are unmarried. Women with the educational attainment of bachelor's degree are most likely to be married with 93.4% of them married at childbirth, while women with the educational attainment of less than high school are least likely to be married with 55.0% of them unmarried at childbirth.
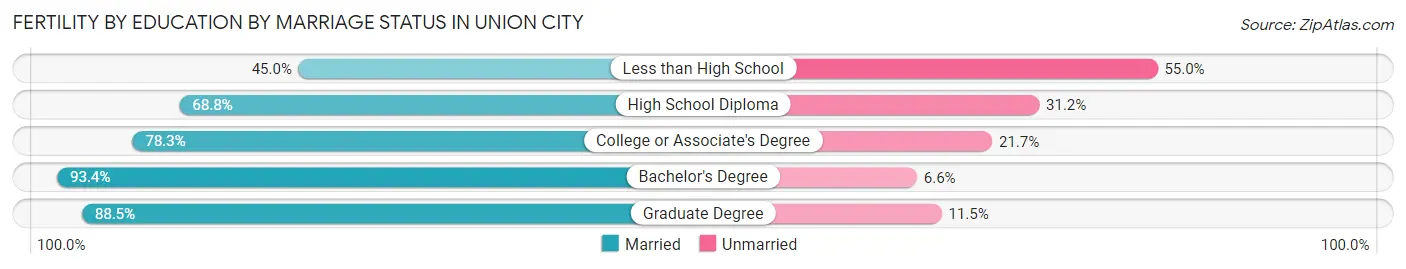
| Educational Attainment | Married | Unmarried |
| Less than High School | 58 (45.0%) | 71 (55.0%) |
| High School Diploma | 172 (68.8%) | 78 (31.2%) |
| College or Associate's Degree | 137 (78.3%) | 38 (21.7%) |
| Bachelor's Degree | 114 (93.4%) | 8 (6.6%) |
| Graduate Degree | 115 (88.5%) | 15 (11.5%) |
| Total | 596 (74.0%) | 210 (26.1%) |
Employment Characteristics in Union City
Employment by Class of Employer in Union City
Among the 32,770 employed individuals in Union City, private company employees (25,461 | 77.7%), local government employees (1,976 | 6.0%), and not-for-profit organizations (1,749 | 5.3%) make up the most common classes of employment.
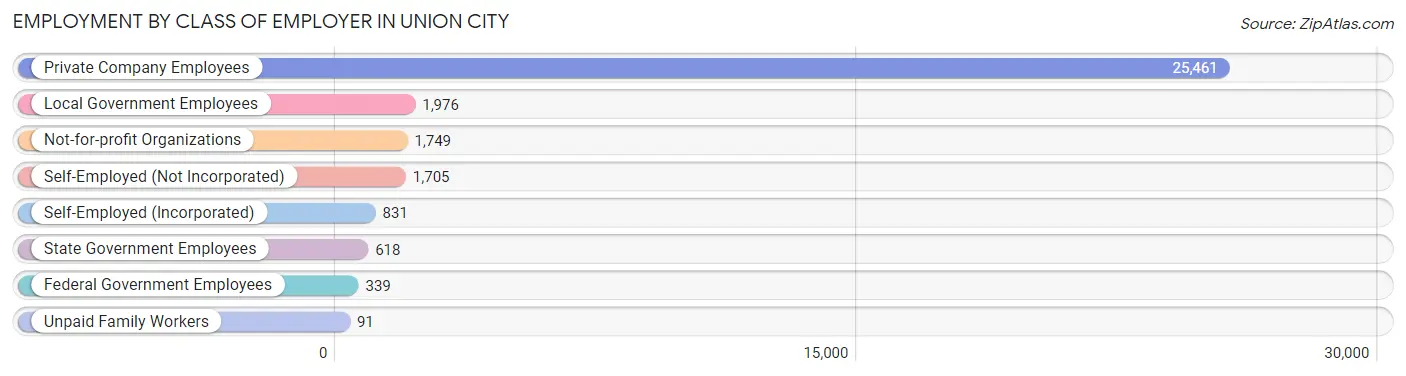
| Employer Class | # Employees | % Employees |
| Private Company Employees | 25,461 | 77.7% |
| Self-Employed (Incorporated) | 831 | 2.5% |
| Self-Employed (Not Incorporated) | 1,705 | 5.2% |
| Not-for-profit Organizations | 1,749 | 5.3% |
| Local Government Employees | 1,976 | 6.0% |
| State Government Employees | 618 | 1.9% |
| Federal Government Employees | 339 | 1.0% |
| Unpaid Family Workers | 91 | 0.3% |
| Total | 32,770 | 100.0% |
Employment Status by Age in Union City
According to the labor force statistics for Union City, out of the total population over 16 years of age (53,847), 68.2% or 36,724 individuals are in the labor force, with 7.8% or 2,864 of them unemployed. The age group with the highest labor force participation rate is 30 to 34 years, with 84.8% or 3,987 individuals in the labor force. Within the labor force, the 16 to 19 years age range has the highest percentage of unemployed individuals, with 20.4% or 224 of them being unemployed.
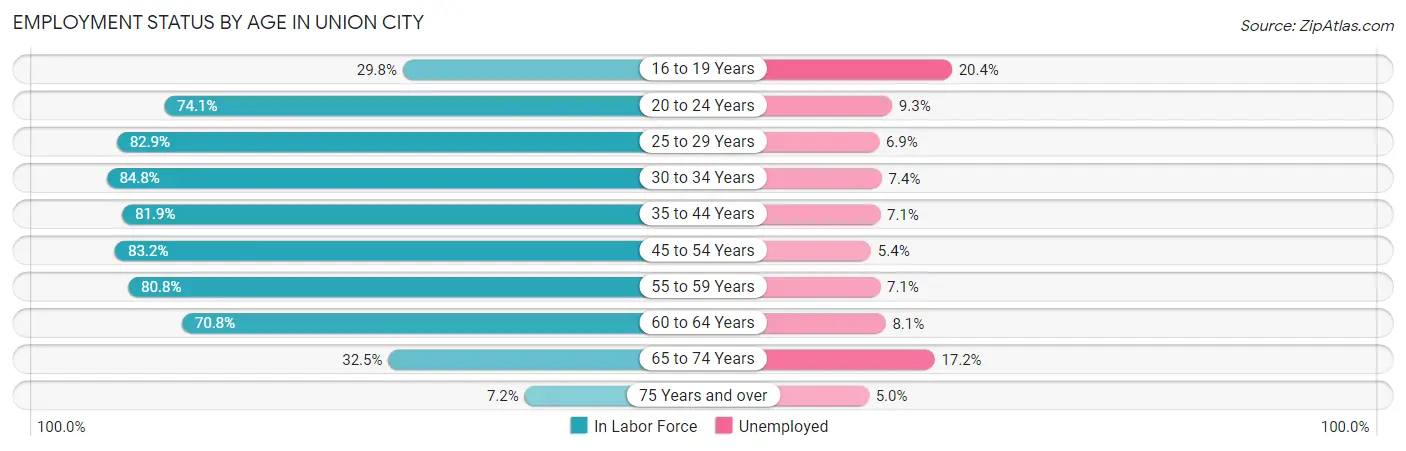
| Age Bracket | In Labor Force | Unemployed |
| 16 to 19 Years | 1,098 (29.8%) | 224 (20.4%) |
| 20 to 24 Years | 3,803 (74.1%) | 354 (9.3%) |
| 25 to 29 Years | 4,357 (82.9%) | 301 (6.9%) |
| 30 to 34 Years | 3,987 (84.8%) | 295 (7.4%) |
| 35 to 44 Years | 8,369 (81.9%) | 594 (7.1%) |
| 45 to 54 Years | 7,982 (83.2%) | 431 (5.4%) |
| 55 to 59 Years | 3,371 (80.8%) | 239 (7.1%) |
| 60 to 64 Years | 2,076 (70.8%) | 168 (8.1%) |
| 65 to 74 Years | 1,395 (32.5%) | 240 (17.2%) |
| 75 Years and over | 278 (7.2%) | 14 (5.0%) |
| Total | 36,724 (68.2%) | 2,864 (7.8%) |
Employment Status by Educational Attainment in Union City
According to labor force statistics for Union City, 81.7% of individuals (30,127) out of the total population between 25 and 64 years of age (36,875) are in the labor force, with 6.7% or 2,019 of them being unemployed. The group with the highest labor force participation rate are those with the educational attainment of bachelor's degree or higher, with 86.0% or 9,098 individuals in the labor force. Within the labor force, individuals with high school diploma education have the highest percentage of unemployment, with 10.3% or 1,047 of them being unemployed.
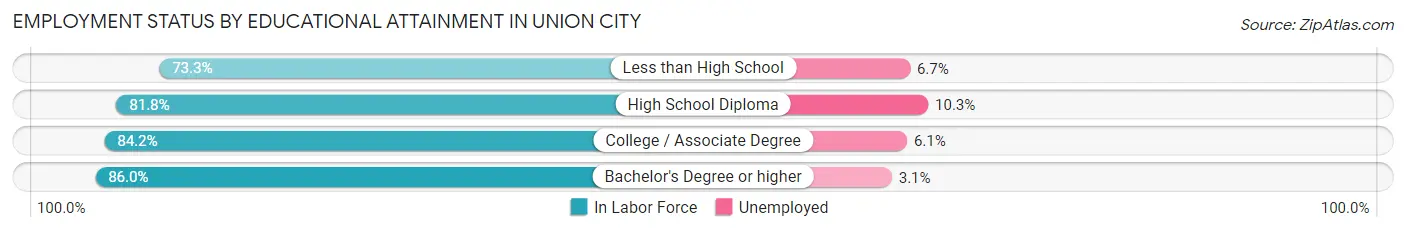
| Educational Attainment | In Labor Force | Unemployed |
| Less than High School | 5,316 (73.3%) | 486 (6.7%) |
| High School Diploma | 10,161 (81.8%) | 1,279 (10.3%) |
| College / Associate Degree | 5,575 (84.2%) | 404 (6.1%) |
| Bachelor's Degree or higher | 9,098 (86.0%) | 328 (3.1%) |
| Total | 30,127 (81.7%) | 2,471 (6.7%) |
Employment Occupations by Sex in Union City
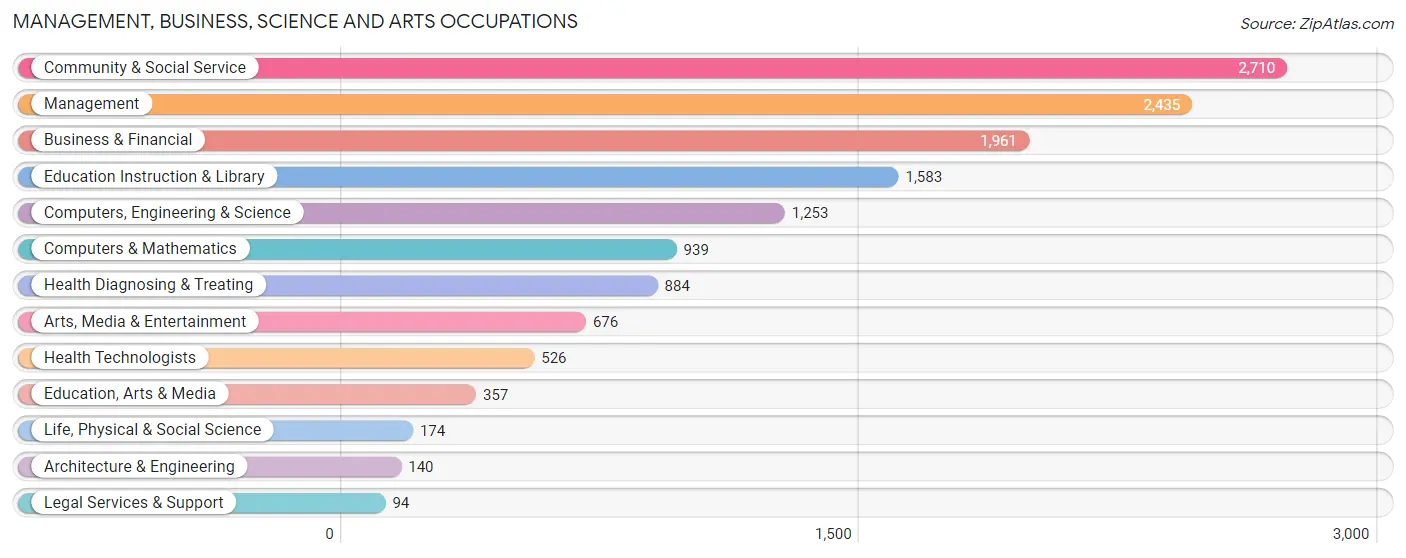
Management, Business, Science and Arts Occupations
The most common Management, Business, Science and Arts occupations in Union City are Community & Social Service (2,710 | 8.0%), Management (2,435 | 7.2%), Business & Financial (1,961 | 5.8%), Education Instruction & Library (1,583 | 4.7%), and Computers, Engineering & Science (1,253 | 3.7%).
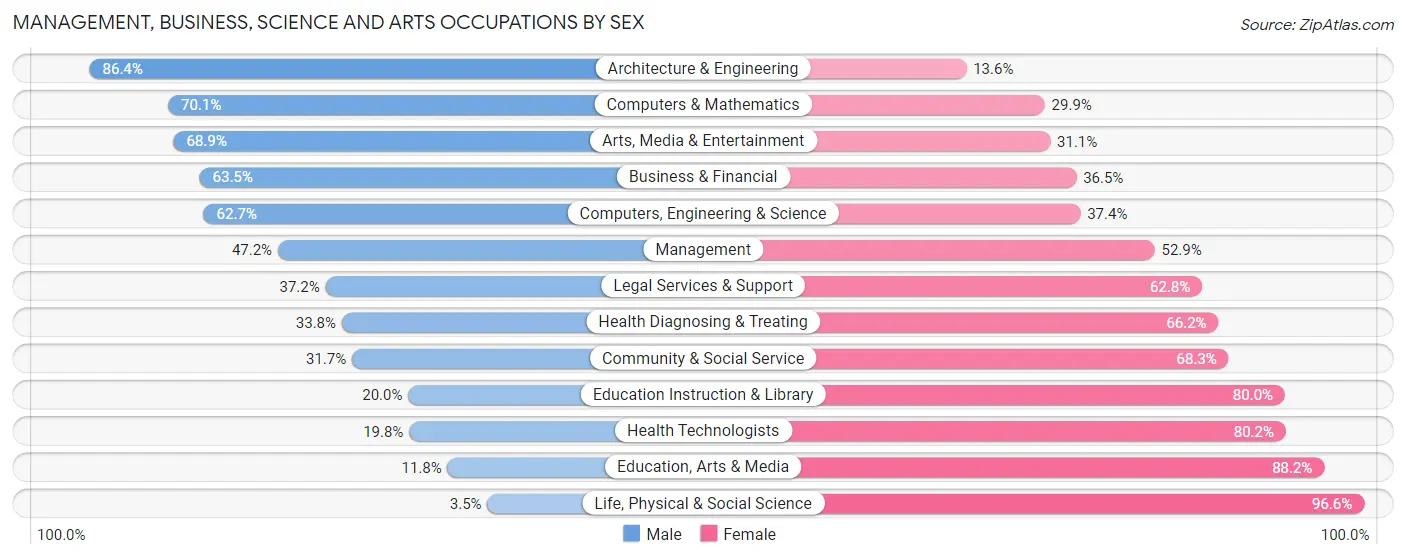
Management, Business, Science and Arts Occupations by Sex
Within the Management, Business, Science and Arts occupations in Union City, the most male-oriented occupations are Architecture & Engineering (86.4%), Computers & Mathematics (70.1%), and Arts, Media & Entertainment (68.9%), while the most female-oriented occupations are Life, Physical & Social Science (96.6%), Education, Arts & Media (88.2%), and Health Technologists (80.2%).
| Occupation | Male | Female |
| Management | 1,148 (47.1%) | 1,287 (52.8%) |
| Business & Financial | 1,245 (63.5%) | 716 (36.5%) |
| Computers, Engineering & Science | 785 (62.6%) | 468 (37.3%) |
| Computers & Mathematics | 658 (70.1%) | 281 (29.9%) |
| Architecture & Engineering | 121 (86.4%) | 19 (13.6%) |
| Life, Physical & Social Science | 6 (3.5%) | 168 (96.6%) |
| Community & Social Service | 859 (31.7%) | 1,851 (68.3%) |
| Education, Arts & Media | 42 (11.8%) | 315 (88.2%) |
| Legal Services & Support | 35 (37.2%) | 59 (62.8%) |
| Education Instruction & Library | 316 (20.0%) | 1,267 (80.0%) |
| Arts, Media & Entertainment | 466 (68.9%) | 210 (31.1%) |
| Health Diagnosing & Treating | 299 (33.8%) | 585 (66.2%) |
| Health Technologists | 104 (19.8%) | 422 (80.2%) |
| Total (Category) | 4,336 (46.9%) | 4,907 (53.1%) |
| Total (Overall) | 17,939 (53.1%) | 15,848 (46.9%) |
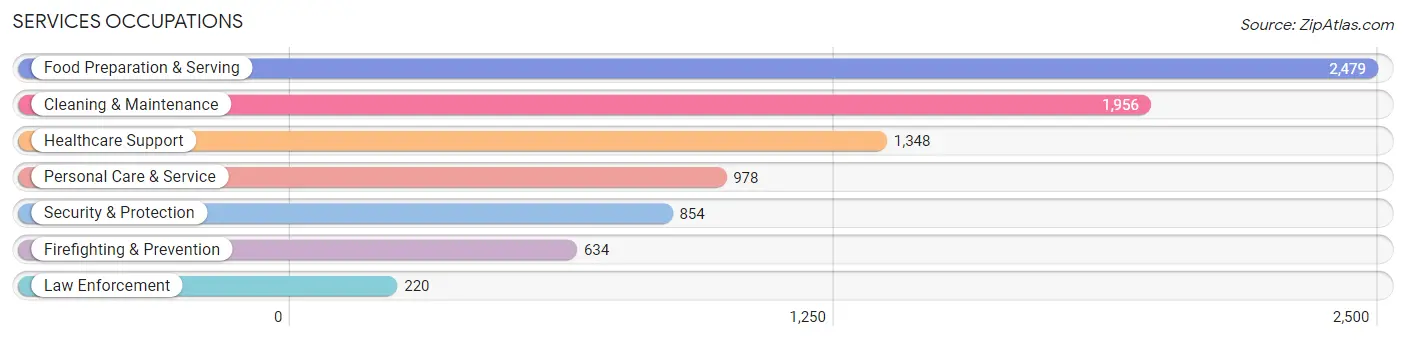
Services Occupations
The most common Services occupations in Union City are Food Preparation & Serving (2,479 | 7.3%), Cleaning & Maintenance (1,956 | 5.8%), Healthcare Support (1,348 | 4.0%), Personal Care & Service (978 | 2.9%), and Security & Protection (854 | 2.5%).
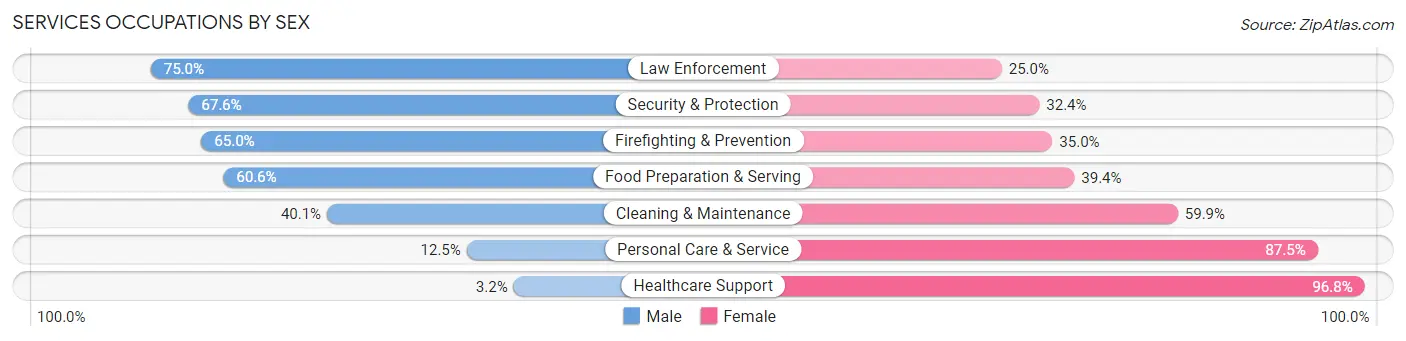
Services Occupations by Sex
Within the Services occupations in Union City, the most male-oriented occupations are Law Enforcement (75.0%), Security & Protection (67.6%), and Firefighting & Prevention (65.0%), while the most female-oriented occupations are Healthcare Support (96.8%), Personal Care & Service (87.5%), and Cleaning & Maintenance (59.9%).
| Occupation | Male | Female |
| Healthcare Support | 43 (3.2%) | 1,305 (96.8%) |
| Security & Protection | 577 (67.6%) | 277 (32.4%) |
| Firefighting & Prevention | 412 (65.0%) | 222 (35.0%) |
| Law Enforcement | 165 (75.0%) | 55 (25.0%) |
| Food Preparation & Serving | 1,503 (60.6%) | 976 (39.4%) |
| Cleaning & Maintenance | 785 (40.1%) | 1,171 (59.9%) |
| Personal Care & Service | 122 (12.5%) | 856 (87.5%) |
| Total (Category) | 3,030 (39.8%) | 4,585 (60.2%) |
| Total (Overall) | 17,939 (53.1%) | 15,848 (46.9%) |
Sales and Office Occupations
The most common Sales and Office occupations in Union City are Office & Administration (3,267 | 9.7%), and Sales & Related (2,812 | 8.3%).
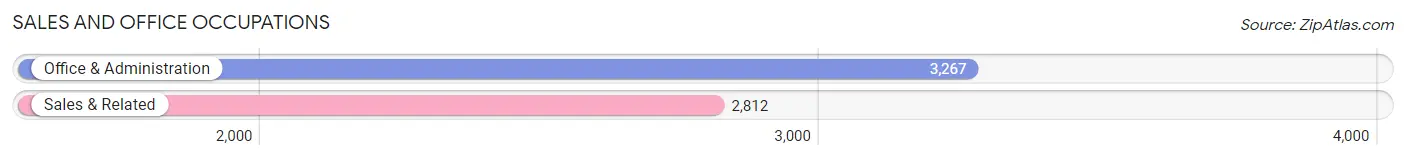
Sales and Office Occupations by Sex
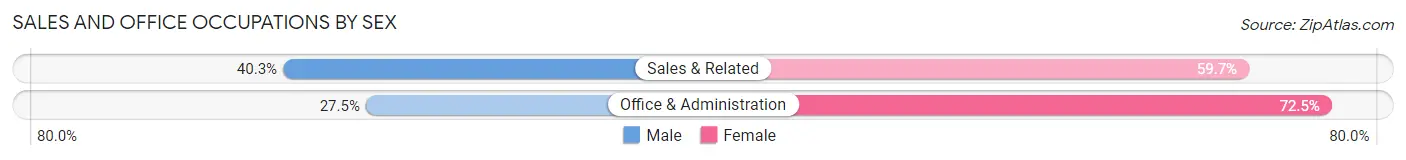
| Occupation | Male | Female |
| Sales & Related | 1,132 (40.3%) | 1,680 (59.7%) |
| Office & Administration | 899 (27.5%) | 2,368 (72.5%) |
| Total (Category) | 2,031 (33.4%) | 4,048 (66.6%) |
| Total (Overall) | 17,939 (53.1%) | 15,848 (46.9%) |
Natural Resources, Construction and Maintenance Occupations
The most common Natural Resources, Construction and Maintenance occupations in Union City are Construction & Extraction (2,546 | 7.5%), Installation, Maintenance & Repair (703 | 2.1%), and Farming, Fishing & Forestry (6 | 0.0%).
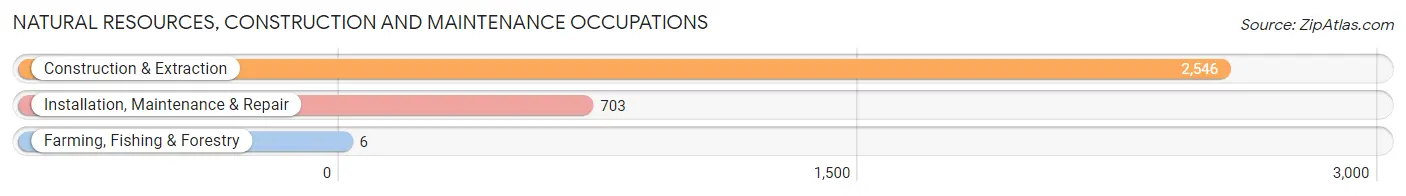
Natural Resources, Construction and Maintenance Occupations by Sex
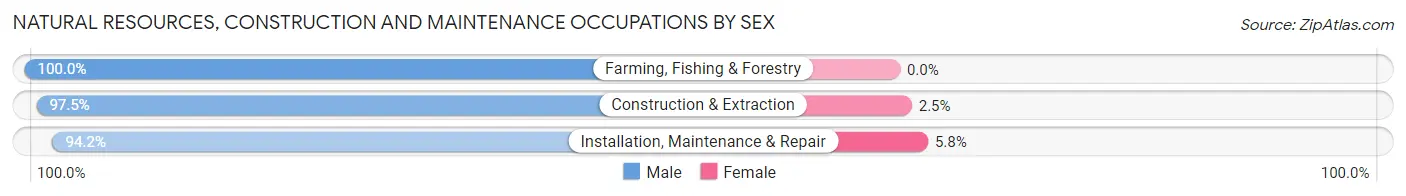
| Occupation | Male | Female |
| Farming, Fishing & Forestry | 6 (100.0%) | 0 (0.0%) |
| Construction & Extraction | 2,483 (97.5%) | 63 (2.5%) |
| Installation, Maintenance & Repair | 662 (94.2%) | 41 (5.8%) |
| Total (Category) | 3,151 (96.8%) | 104 (3.2%) |
| Total (Overall) | 17,939 (53.1%) | 15,848 (46.9%) |
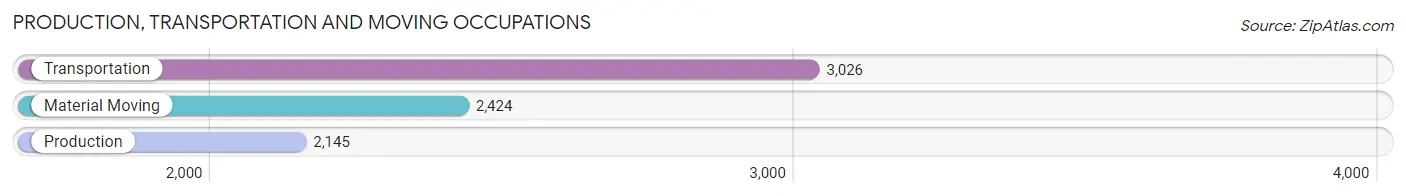
Production, Transportation and Moving Occupations
The most common Production, Transportation and Moving occupations in Union City are Transportation (3,026 | 9.0%), Material Moving (2,424 | 7.2%), and Production (2,145 | 6.4%).
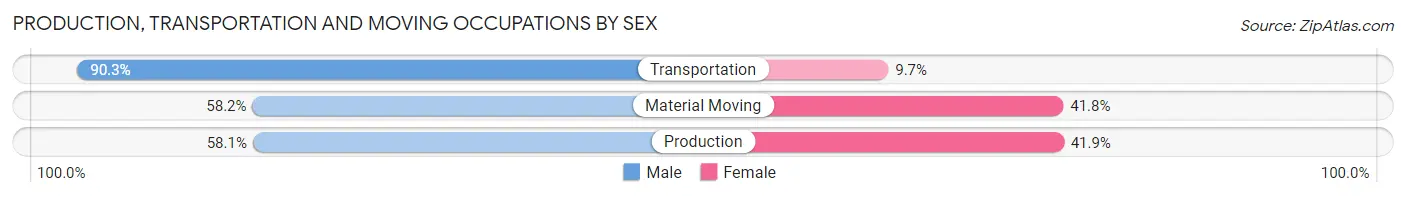
Production, Transportation and Moving Occupations by Sex
| Occupation | Male | Female |
| Production | 1,247 (58.1%) | 898 (41.9%) |
| Transportation | 2,733 (90.3%) | 293 (9.7%) |
| Material Moving | 1,411 (58.2%) | 1,013 (41.8%) |
| Total (Category) | 5,391 (71.0%) | 2,204 (29.0%) |
| Total (Overall) | 17,939 (53.1%) | 15,848 (46.9%) |
Employment Industries by Sex in Union City
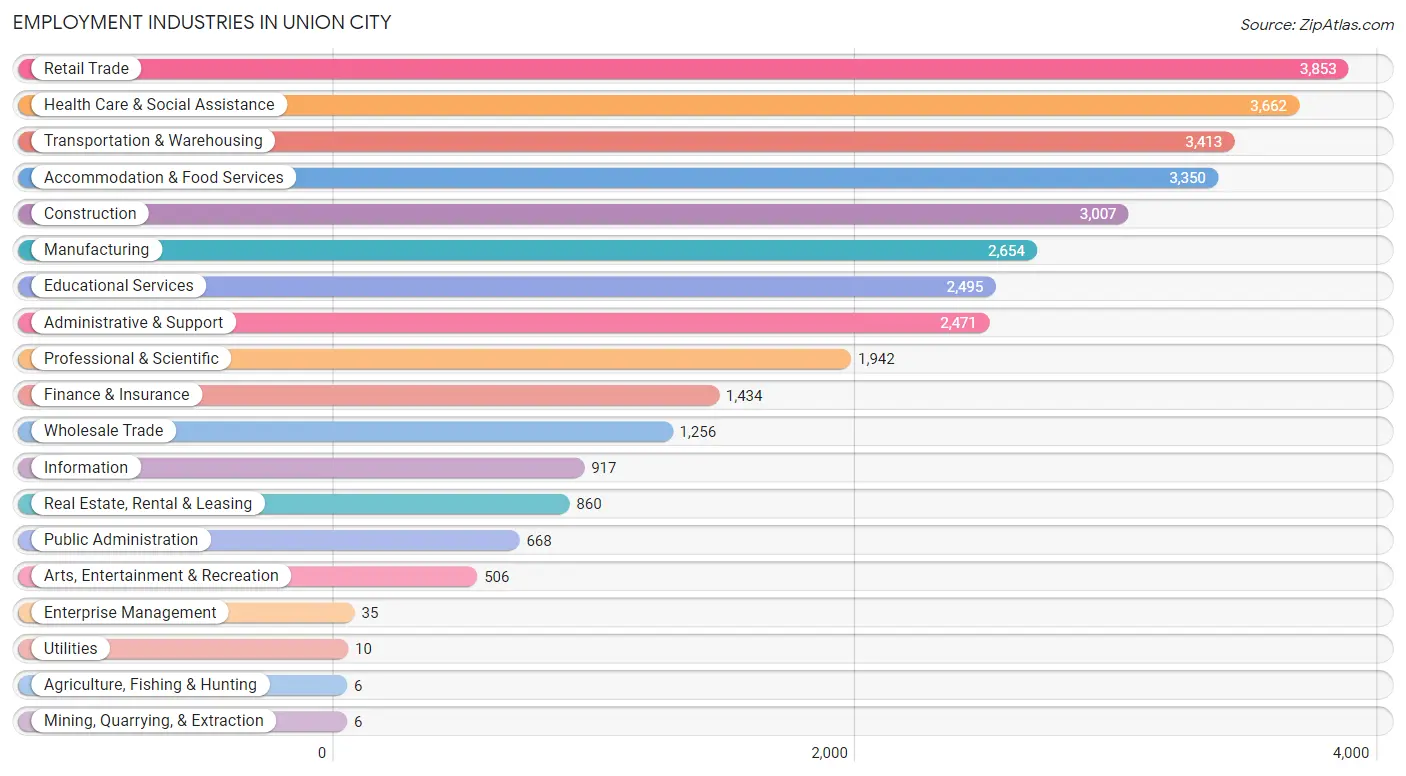
Employment Industries in Union City
The major employment industries in Union City include Retail Trade (3,853 | 11.4%), Health Care & Social Assistance (3,662 | 10.8%), Transportation & Warehousing (3,413 | 10.1%), Accommodation & Food Services (3,350 | 9.9%), and Construction (3,007 | 8.9%).
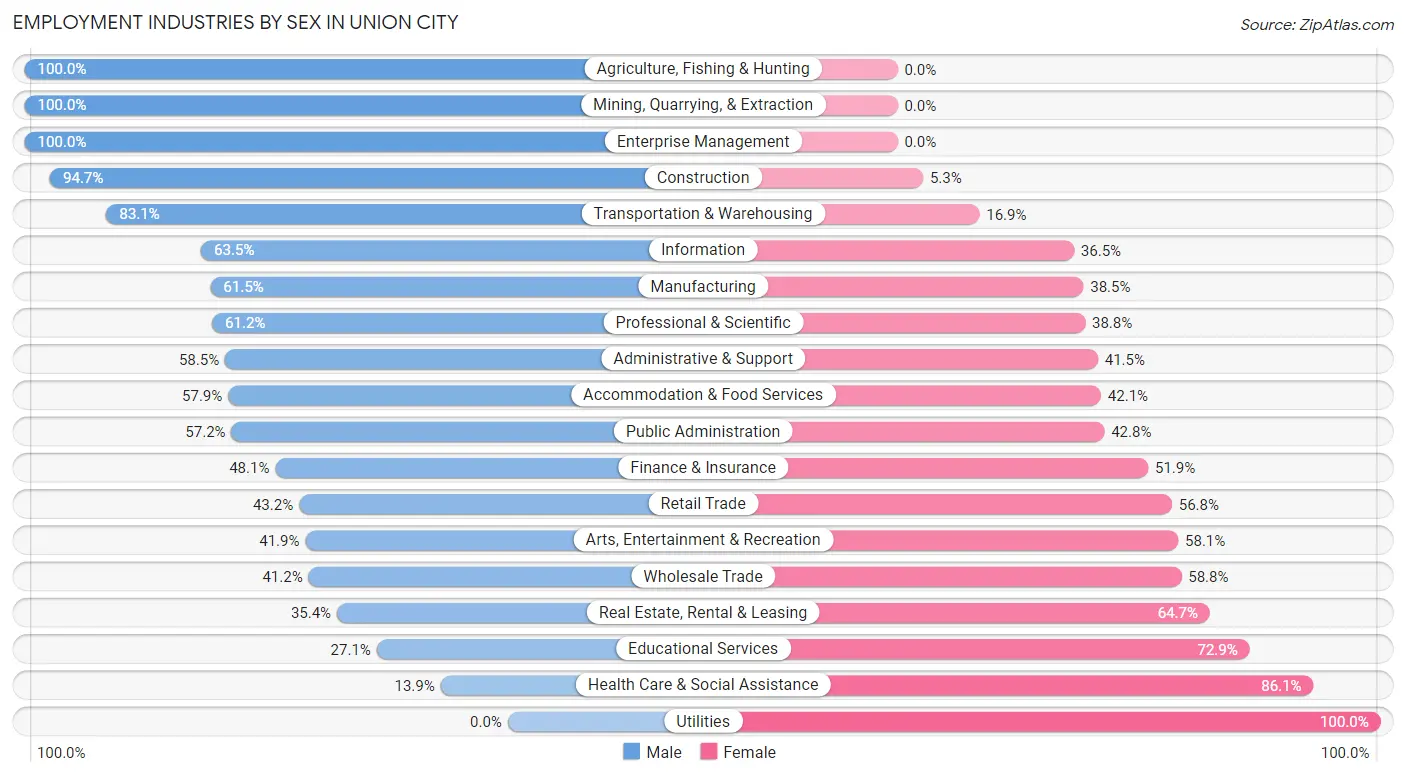
Employment Industries by Sex in Union City
The Union City industries that see more men than women are Agriculture, Fishing & Hunting (100.0%), Mining, Quarrying, & Extraction (100.0%), and Enterprise Management (100.0%), whereas the industries that tend to have a higher number of women are Utilities (100.0%), Health Care & Social Assistance (86.1%), and Educational Services (72.9%).
| Industry | Male | Female |
| Agriculture, Fishing & Hunting | 6 (100.0%) | 0 (0.0%) |
| Mining, Quarrying, & Extraction | 6 (100.0%) | 0 (0.0%) |
| Construction | 2,848 (94.7%) | 159 (5.3%) |
| Manufacturing | 1,633 (61.5%) | 1,021 (38.5%) |
| Wholesale Trade | 518 (41.2%) | 738 (58.8%) |
| Retail Trade | 1,665 (43.2%) | 2,188 (56.8%) |
| Transportation & Warehousing | 2,835 (83.1%) | 578 (16.9%) |
| Utilities | 0 (0.0%) | 10 (100.0%) |
| Information | 582 (63.5%) | 335 (36.5%) |
| Finance & Insurance | 690 (48.1%) | 744 (51.9%) |
| Real Estate, Rental & Leasing | 304 (35.3%) | 556 (64.6%) |
| Professional & Scientific | 1,188 (61.2%) | 754 (38.8%) |
| Enterprise Management | 35 (100.0%) | 0 (0.0%) |
| Administrative & Support | 1,446 (58.5%) | 1,025 (41.5%) |
| Educational Services | 677 (27.1%) | 1,818 (72.9%) |
| Health Care & Social Assistance | 509 (13.9%) | 3,153 (86.1%) |
| Arts, Entertainment & Recreation | 212 (41.9%) | 294 (58.1%) |
| Accommodation & Food Services | 1,939 (57.9%) | 1,411 (42.1%) |
| Public Administration | 382 (57.2%) | 286 (42.8%) |
| Total | 17,939 (53.1%) | 15,848 (46.9%) |
Education in Union City
School Enrollment in Union City
The most common levels of schooling among the 17,096 students in Union City are high school (3,619 | 21.2%), middle school (3,538 | 20.7%), and elementary school (3,499 | 20.5%).
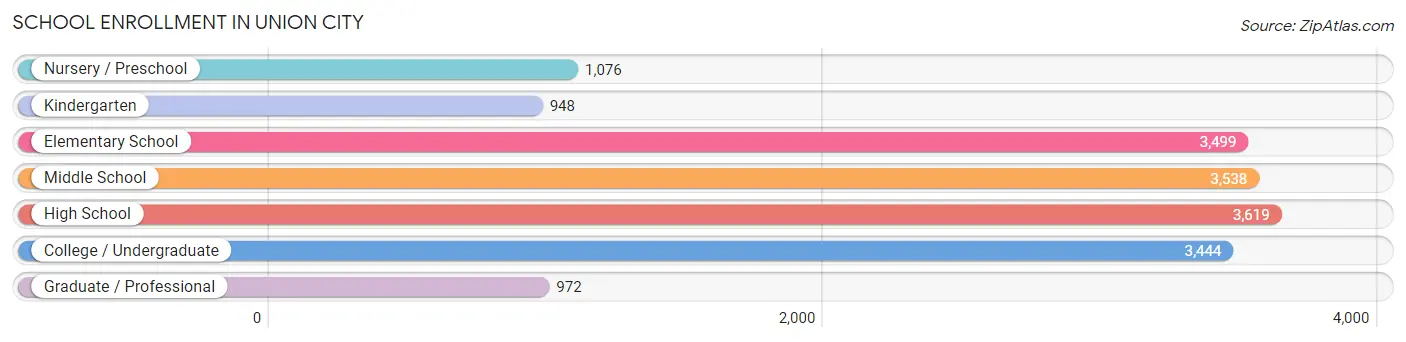
| School Level | # Students | % Students |
| Nursery / Preschool | 1,076 | 6.3% |
| Kindergarten | 948 | 5.6% |
| Elementary School | 3,499 | 20.5% |
| Middle School | 3,538 | 20.7% |
| High School | 3,619 | 21.2% |
| College / Undergraduate | 3,444 | 20.2% |
| Graduate / Professional | 972 | 5.7% |
| Total | 17,096 | 100.0% |
School Enrollment by Age by Funding Source in Union City
Out of a total of 17,096 students who are enrolled in schools in Union City, 1,573 (9.2%) attend a private institution, while the remaining 15,523 (90.8%) are enrolled in public schools. The age group of 35 years and over has the highest likelihood of being enrolled in private schools, with 441 (52.2% in the age bracket) enrolled. Conversely, the age group of 3 to 4 year olds has the lowest likelihood of being enrolled in a private school, with 1,163 (100.0% in the age bracket) attending a public institution.
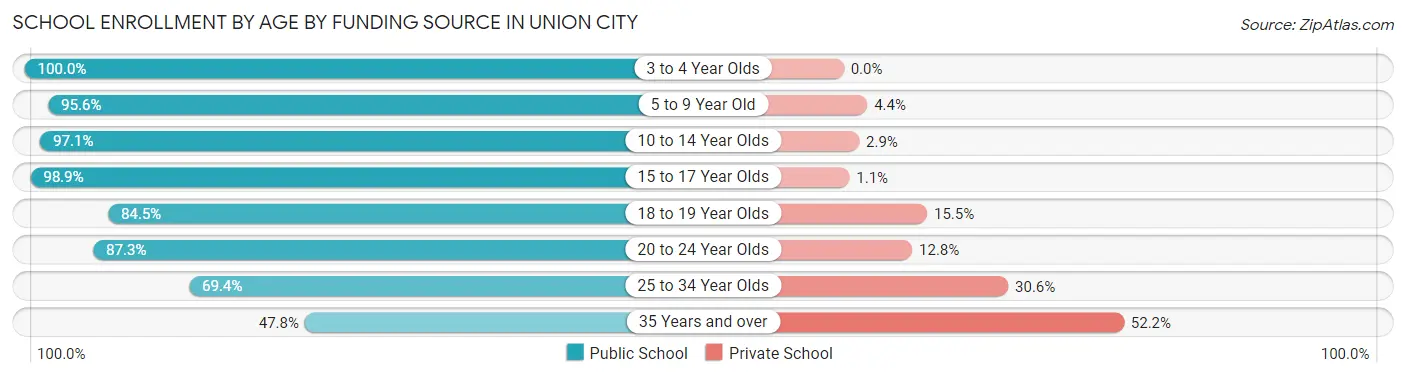
| Age Bracket | Public School | Private School |
| 3 to 4 Year Olds | 1,163 (100.0%) | 0 (0.0%) |
| 5 to 9 Year Old | 3,833 (95.6%) | 176 (4.4%) |
| 10 to 14 Year Olds | 3,843 (97.1%) | 114 (2.9%) |
| 15 to 17 Year Olds | 2,609 (98.9%) | 28 (1.1%) |
| 18 to 19 Year Olds | 1,300 (84.5%) | 239 (15.5%) |
| 20 to 24 Year Olds | 1,636 (87.3%) | 239 (12.8%) |
| 25 to 34 Year Olds | 743 (69.4%) | 328 (30.6%) |
| 35 Years and over | 404 (47.8%) | 441 (52.2%) |
| Total | 15,523 (90.8%) | 1,573 (9.2%) |
Educational Attainment by Field of Study in Union City
Business (2,915 | 23.4%), social sciences (1,224 | 9.8%), education (1,026 | 8.2%), engineering (936 | 7.5%), and science & technology (866 | 6.9%) are the most common fields of study among 12,484 individuals in Union City who have obtained a bachelor's degree or higher.
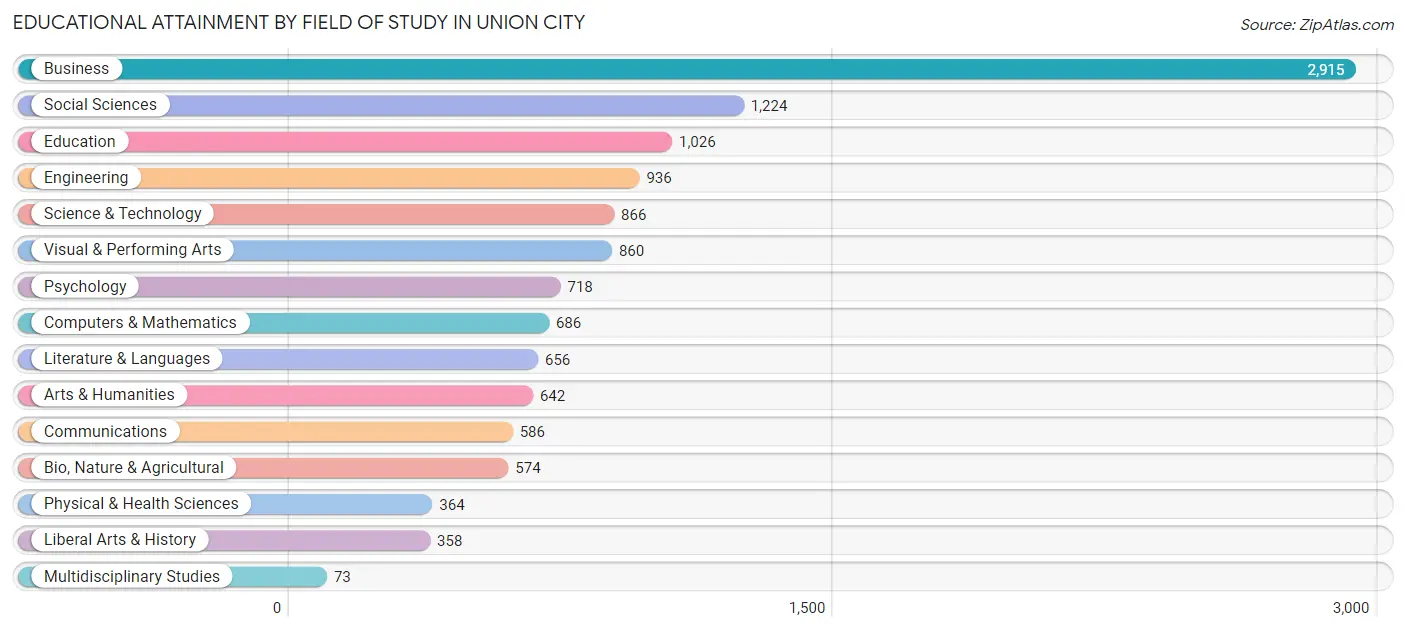
| Field of Study | # Graduates | % Graduates |
| Computers & Mathematics | 686 | 5.5% |
| Bio, Nature & Agricultural | 574 | 4.6% |
| Physical & Health Sciences | 364 | 2.9% |
| Psychology | 718 | 5.8% |
| Social Sciences | 1,224 | 9.8% |
| Engineering | 936 | 7.5% |
| Multidisciplinary Studies | 73 | 0.6% |
| Science & Technology | 866 | 6.9% |
| Business | 2,915 | 23.4% |
| Education | 1,026 | 8.2% |
| Literature & Languages | 656 | 5.2% |
| Liberal Arts & History | 358 | 2.9% |
| Visual & Performing Arts | 860 | 6.9% |
| Communications | 586 | 4.7% |
| Arts & Humanities | 642 | 5.1% |
| Total | 12,484 | 100.0% |
Transportation & Commute in Union City
Vehicle Availability by Sex in Union City
The most prevalent vehicle ownership categories in Union City are males with 1 vehicle (7,579, accounting for 43.3%) and females with 1 vehicle (6,522, making up 49.9%).
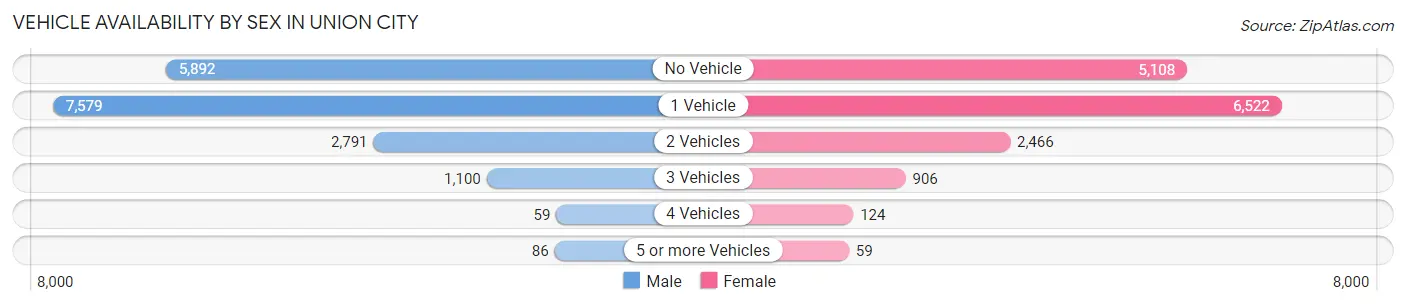
| Vehicles Available | Male | Female |
| No Vehicle | 5,892 (33.7%) | 5,108 (33.6%) |
| 1 Vehicle | 7,579 (43.3%) | 6,522 (42.9%) |
| 2 Vehicles | 2,791 (15.9%) | 2,466 (16.2%) |
| 3 Vehicles | 1,100 (6.3%) | 906 (6.0%) |
| 4 Vehicles | 59 (0.3%) | 124 (0.8%) |
| 5 or more Vehicles | 86 (0.5%) | 59 (0.4%) |
| Total | 17,507 (100.0%) | 15,185 (100.0%) |
Commute Time in Union City
The most frequently occuring commute durations in Union City are 30 to 34 minutes (6,248 commuters, 20.3%), 20 to 24 minutes (4,415 commuters, 14.3%), and 60 to 89 minutes (4,073 commuters, 13.2%).
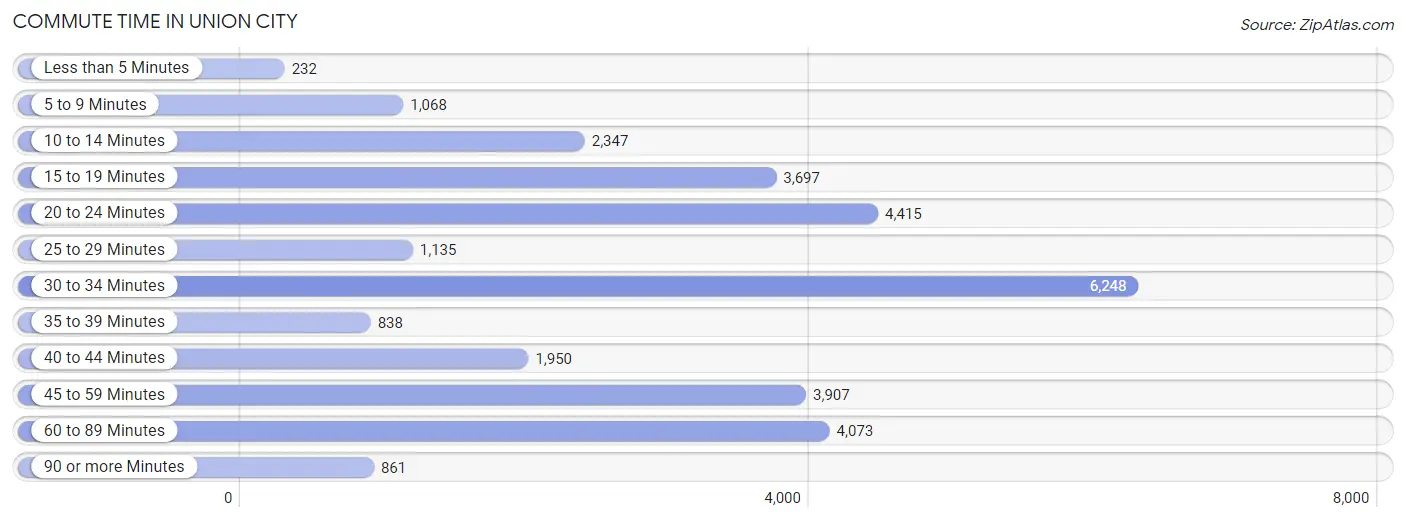
| Commute Time | # Commuters | % Commuters |
| Less than 5 Minutes | 232 | 0.7% |
| 5 to 9 Minutes | 1,068 | 3.5% |
| 10 to 14 Minutes | 2,347 | 7.6% |
| 15 to 19 Minutes | 3,697 | 12.0% |
| 20 to 24 Minutes | 4,415 | 14.3% |
| 25 to 29 Minutes | 1,135 | 3.7% |
| 30 to 34 Minutes | 6,248 | 20.3% |
| 35 to 39 Minutes | 838 | 2.7% |
| 40 to 44 Minutes | 1,950 | 6.3% |
| 45 to 59 Minutes | 3,907 | 12.7% |
| 60 to 89 Minutes | 4,073 | 13.2% |
| 90 or more Minutes | 861 | 2.8% |
Commute Time by Sex in Union City
The most common commute times in Union City are 30 to 34 minutes (3,755 commuters, 22.6%) for males and 30 to 34 minutes (2,493 commuters, 17.6%) for females.
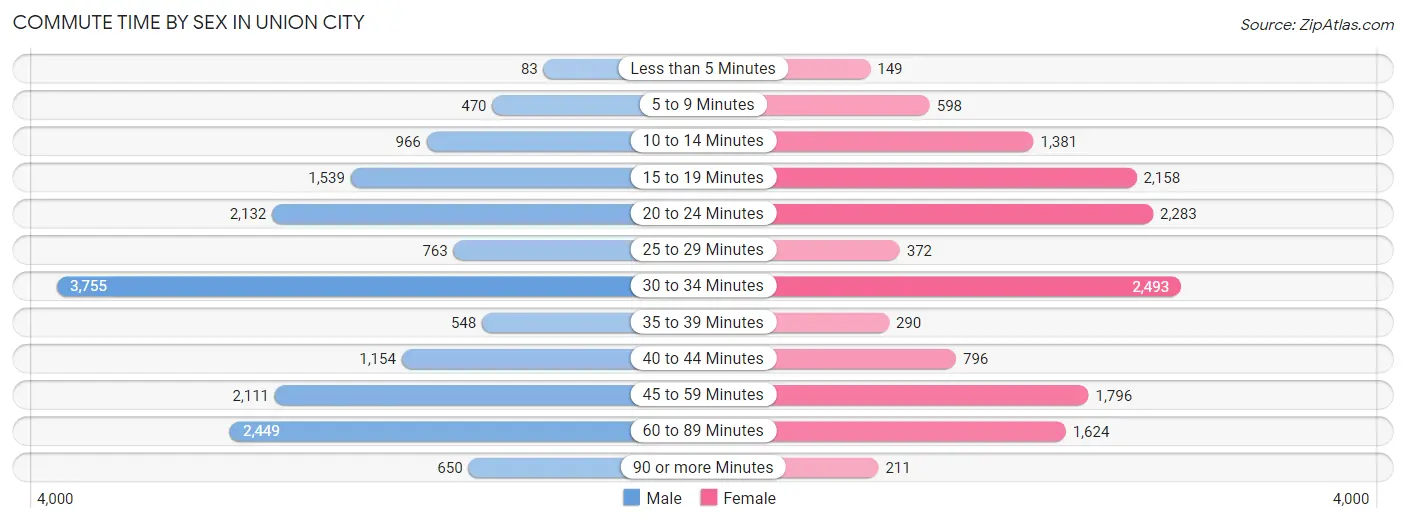
| Commute Time | Male | Female |
| Less than 5 Minutes | 83 (0.5%) | 149 (1.1%) |
| 5 to 9 Minutes | 470 (2.8%) | 598 (4.2%) |
| 10 to 14 Minutes | 966 (5.8%) | 1,381 (9.8%) |
| 15 to 19 Minutes | 1,539 (9.3%) | 2,158 (15.2%) |
| 20 to 24 Minutes | 2,132 (12.8%) | 2,283 (16.1%) |
| 25 to 29 Minutes | 763 (4.6%) | 372 (2.6%) |
| 30 to 34 Minutes | 3,755 (22.6%) | 2,493 (17.6%) |
| 35 to 39 Minutes | 548 (3.3%) | 290 (2.1%) |
| 40 to 44 Minutes | 1,154 (6.9%) | 796 (5.6%) |
| 45 to 59 Minutes | 2,111 (12.7%) | 1,796 (12.7%) |
| 60 to 89 Minutes | 2,449 (14.7%) | 1,624 (11.5%) |
| 90 or more Minutes | 650 (3.9%) | 211 (1.5%) |
Time of Departure to Work by Sex in Union City
The most frequent times of departure to work in Union City are 8:00 AM to 8:29 AM (2,667, 16.1%) for males and 8:00 AM to 8:29 AM (3,086, 21.8%) for females.
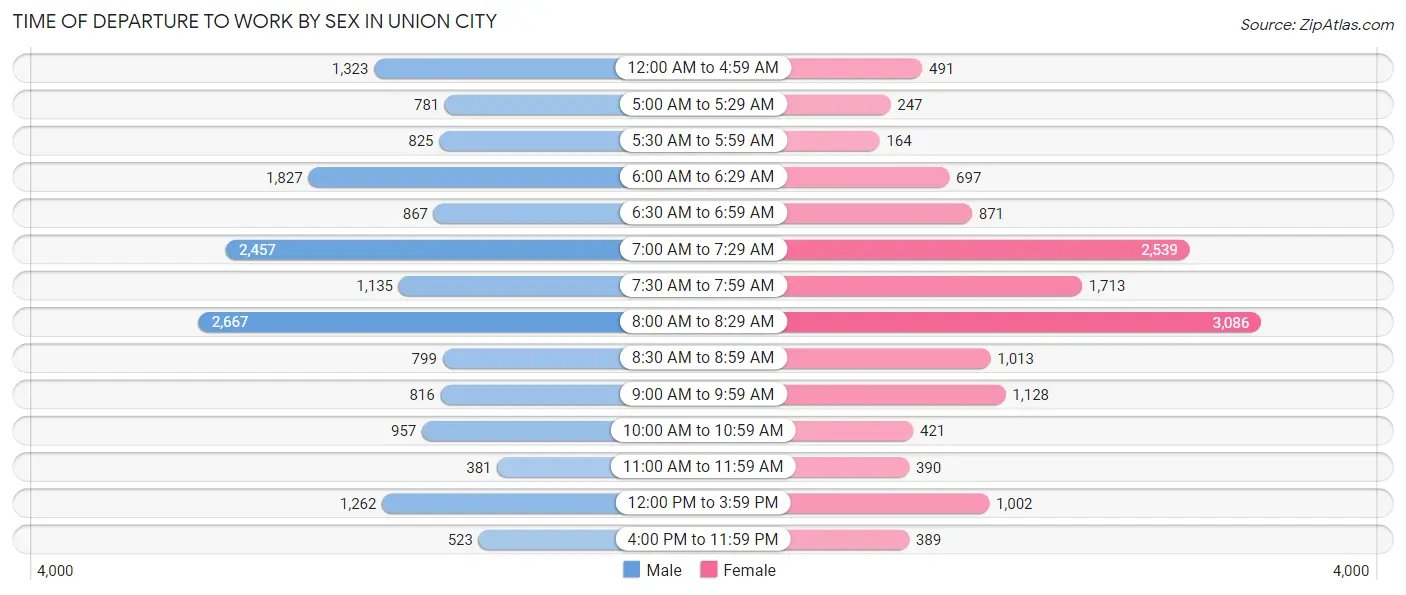
| Time of Departure | Male | Female |
| 12:00 AM to 4:59 AM | 1,323 (8.0%) | 491 (3.5%) |
| 5:00 AM to 5:29 AM | 781 (4.7%) | 247 (1.8%) |
| 5:30 AM to 5:59 AM | 825 (5.0%) | 164 (1.2%) |
| 6:00 AM to 6:29 AM | 1,827 (11.0%) | 697 (4.9%) |
| 6:30 AM to 6:59 AM | 867 (5.2%) | 871 (6.2%) |
| 7:00 AM to 7:29 AM | 2,457 (14.8%) | 2,539 (17.9%) |
| 7:30 AM to 7:59 AM | 1,135 (6.8%) | 1,713 (12.1%) |
| 8:00 AM to 8:29 AM | 2,667 (16.1%) | 3,086 (21.8%) |
| 8:30 AM to 8:59 AM | 799 (4.8%) | 1,013 (7.2%) |
| 9:00 AM to 9:59 AM | 816 (4.9%) | 1,128 (8.0%) |
| 10:00 AM to 10:59 AM | 957 (5.8%) | 421 (3.0%) |
| 11:00 AM to 11:59 AM | 381 (2.3%) | 390 (2.8%) |
| 12:00 PM to 3:59 PM | 1,262 (7.6%) | 1,002 (7.1%) |
| 4:00 PM to 11:59 PM | 523 (3.2%) | 389 (2.8%) |
| Total | 16,620 (100.0%) | 14,151 (100.0%) |
Housing Occupancy in Union City
Occupancy by Ownership in Union City
Of the total 25,610 dwellings in Union City, owner-occupied units account for 5,048 (19.7%), while renter-occupied units make up 20,562 (80.3%).
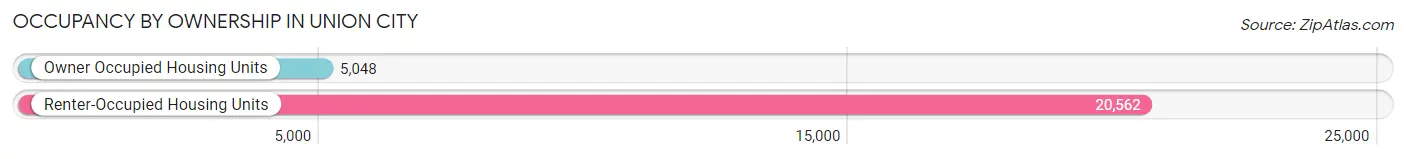
| Occupancy | # Housing Units | % Housing Units |
| Owner Occupied Housing Units | 5,048 | 19.7% |
| Renter-Occupied Housing Units | 20,562 | 80.3% |
| Total Occupied Housing Units | 25,610 | 100.0% |
Occupancy by Household Size in Union City
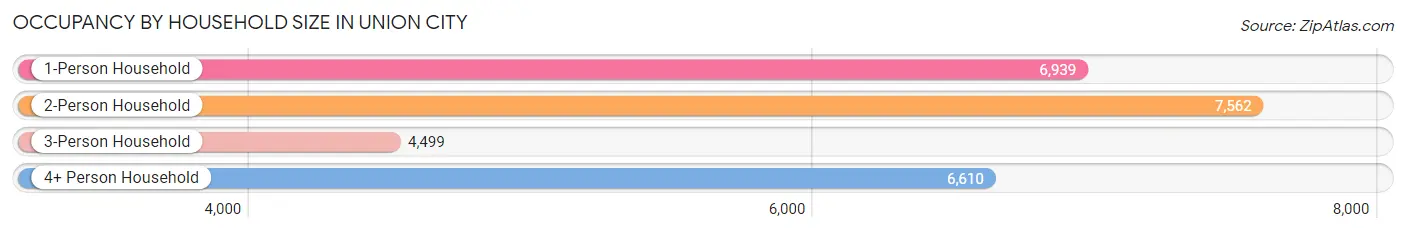
| Household Size | # Housing Units | % Housing Units |
| 1-Person Household | 6,939 | 27.1% |
| 2-Person Household | 7,562 | 29.5% |
| 3-Person Household | 4,499 | 17.6% |
| 4+ Person Household | 6,610 | 25.8% |
| Total Housing Units | 25,610 | 100.0% |
Occupancy by Ownership by Household Size in Union City
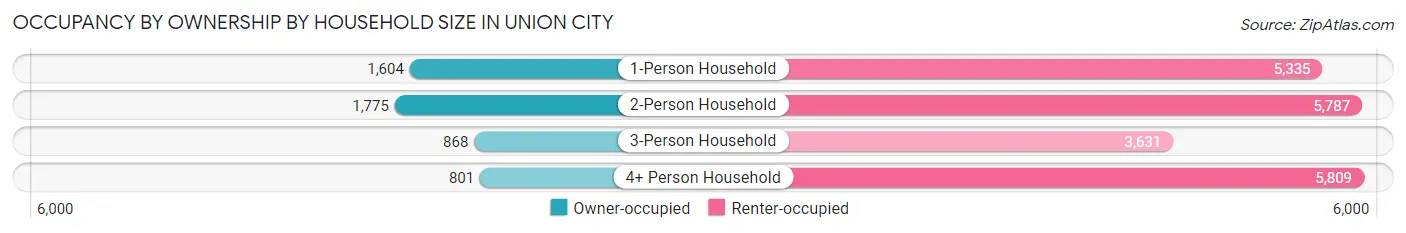
| Household Size | Owner-occupied | Renter-occupied |
| 1-Person Household | 1,604 (23.1%) | 5,335 (76.9%) |
| 2-Person Household | 1,775 (23.5%) | 5,787 (76.5%) |
| 3-Person Household | 868 (19.3%) | 3,631 (80.7%) |
| 4+ Person Household | 801 (12.1%) | 5,809 (87.9%) |
| Total Housing Units | 5,048 (19.7%) | 20,562 (80.3%) |
Occupancy by Educational Attainment in Union City
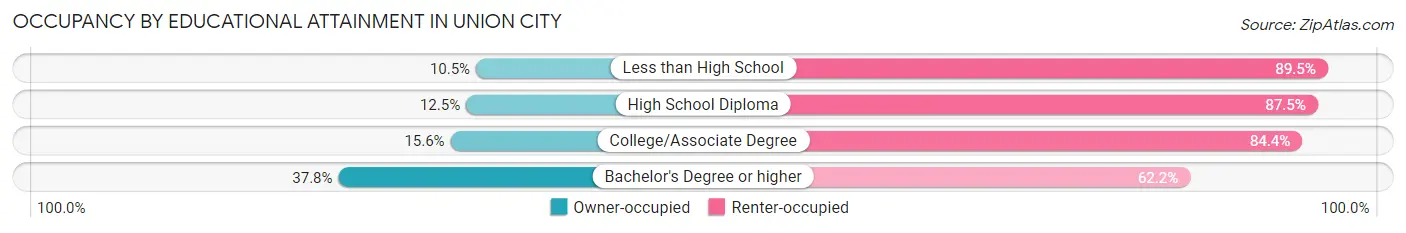
| Household Size | Owner-occupied | Renter-occupied |
| Less than High School | 629 (10.5%) | 5,353 (89.5%) |
| High School Diploma | 1,002 (12.5%) | 7,019 (87.5%) |
| College/Associate Degree | 679 (15.6%) | 3,682 (84.4%) |
| Bachelor's Degree or higher | 2,738 (37.8%) | 4,508 (62.2%) |
Occupancy by Age of Householder in Union City
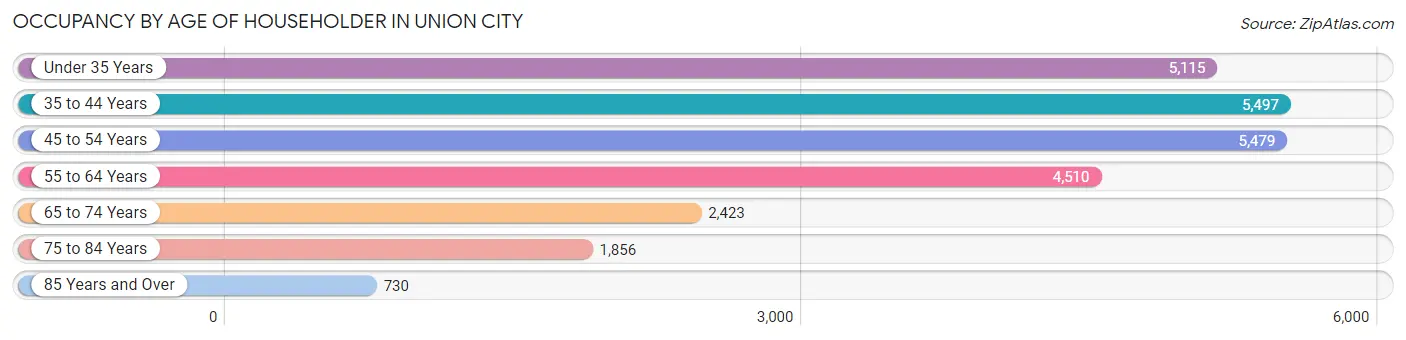
| Age Bracket | # Households | % Households |
| Under 35 Years | 5,115 | 20.0% |
| 35 to 44 Years | 5,497 | 21.5% |
| 45 to 54 Years | 5,479 | 21.4% |
| 55 to 64 Years | 4,510 | 17.6% |
| 65 to 74 Years | 2,423 | 9.5% |
| 75 to 84 Years | 1,856 | 7.2% |
| 85 Years and Over | 730 | 2.9% |
| Total | 25,610 | 100.0% |
Housing Finances in Union City
Median Income by Occupancy in Union City
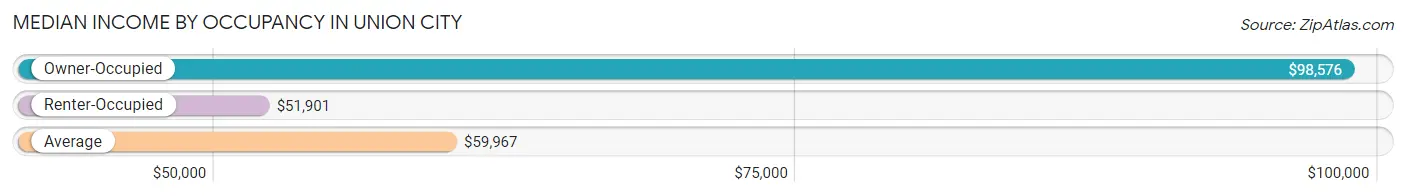
| Occupancy Type | # Households | Median Income |
| Owner-Occupied | 5,048 (19.7%) | $98,576 |
| Renter-Occupied | 20,562 (80.3%) | $51,901 |
| Average | 25,610 (100.0%) | $59,967 |
Occupancy by Householder Income Bracket in Union City
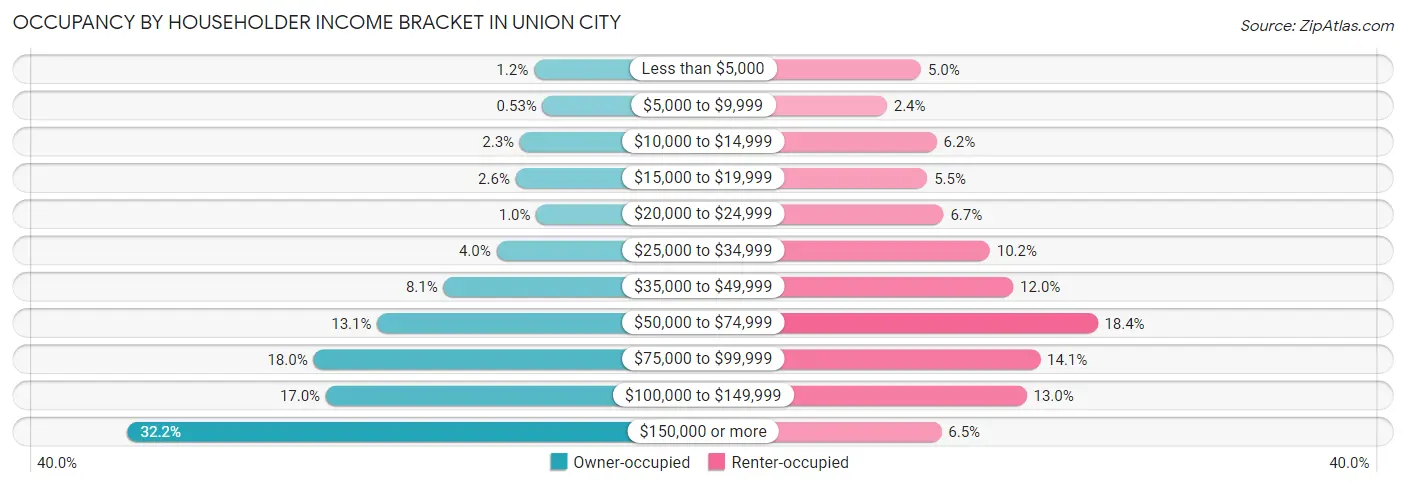
| Income Bracket | Owner-occupied | Renter-occupied |
| Less than $5,000 | 60 (1.2%) | 1,026 (5.0%) |
| $5,000 to $9,999 | 27 (0.5%) | 489 (2.4%) |
| $10,000 to $14,999 | 114 (2.3%) | 1,269 (6.2%) |
| $15,000 to $19,999 | 130 (2.6%) | 1,122 (5.5%) |
| $20,000 to $24,999 | 51 (1.0%) | 1,377 (6.7%) |
| $25,000 to $34,999 | 204 (4.0%) | 2,103 (10.2%) |
| $35,000 to $49,999 | 408 (8.1%) | 2,470 (12.0%) |
| $50,000 to $74,999 | 663 (13.1%) | 3,790 (18.4%) |
| $75,000 to $99,999 | 908 (18.0%) | 2,892 (14.1%) |
| $100,000 to $149,999 | 860 (17.0%) | 2,680 (13.0%) |
| $150,000 or more | 1,623 (32.2%) | 1,344 (6.5%) |
| Total | 5,048 (100.0%) | 20,562 (100.0%) |
Monthly Housing Cost Tiers in Union City
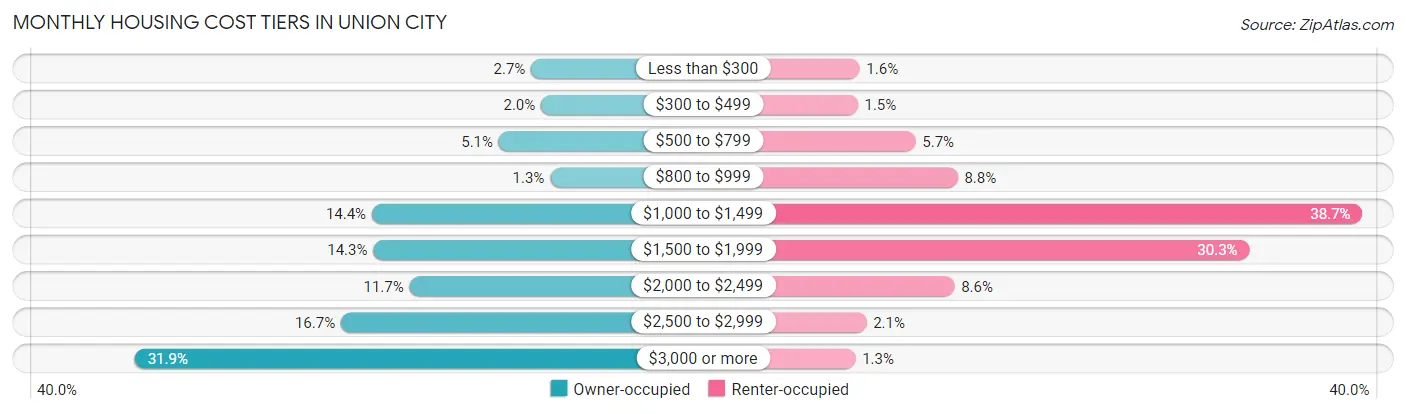
| Monthly Cost | Owner-occupied | Renter-occupied |
| Less than $300 | 136 (2.7%) | 333 (1.6%) |
| $300 to $499 | 99 (2.0%) | 305 (1.5%) |
| $500 to $799 | 256 (5.1%) | 1,181 (5.7%) |
| $800 to $999 | 65 (1.3%) | 1,817 (8.8%) |
| $1,000 to $1,499 | 728 (14.4%) | 7,950 (38.7%) |
| $1,500 to $1,999 | 723 (14.3%) | 6,239 (30.3%) |
| $2,000 to $2,499 | 588 (11.7%) | 1,769 (8.6%) |
| $2,500 to $2,999 | 843 (16.7%) | 436 (2.1%) |
| $3,000 or more | 1,610 (31.9%) | 270 (1.3%) |
| Total | 5,048 (100.0%) | 20,562 (100.0%) |
Physical Housing Characteristics in Union City
Housing Structures in Union City
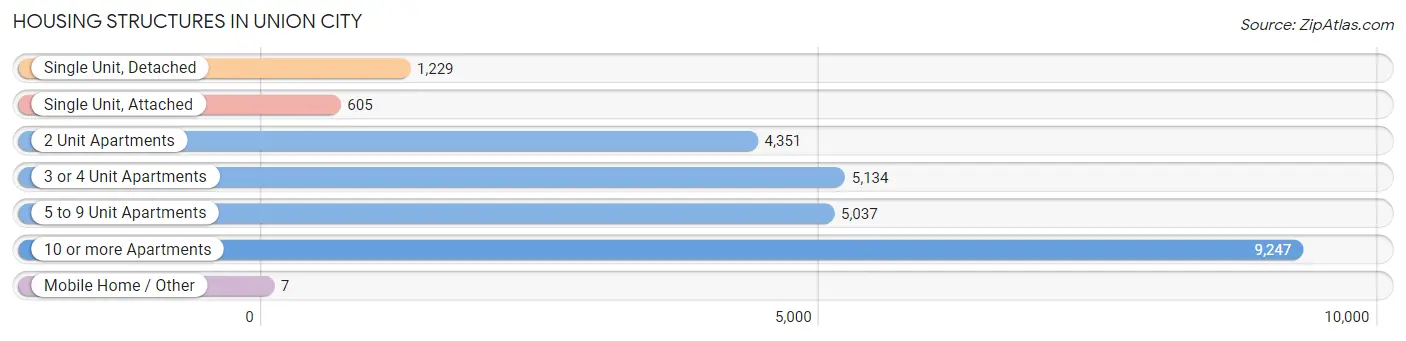
| Structure Type | # Housing Units | % Housing Units |
| Single Unit, Detached | 1,229 | 4.8% |
| Single Unit, Attached | 605 | 2.4% |
| 2 Unit Apartments | 4,351 | 17.0% |
| 3 or 4 Unit Apartments | 5,134 | 20.1% |
| 5 to 9 Unit Apartments | 5,037 | 19.7% |
| 10 or more Apartments | 9,247 | 36.1% |
| Mobile Home / Other | 7 | 0.0% |
| Total | 25,610 | 100.0% |
Housing Structures by Occupancy in Union City
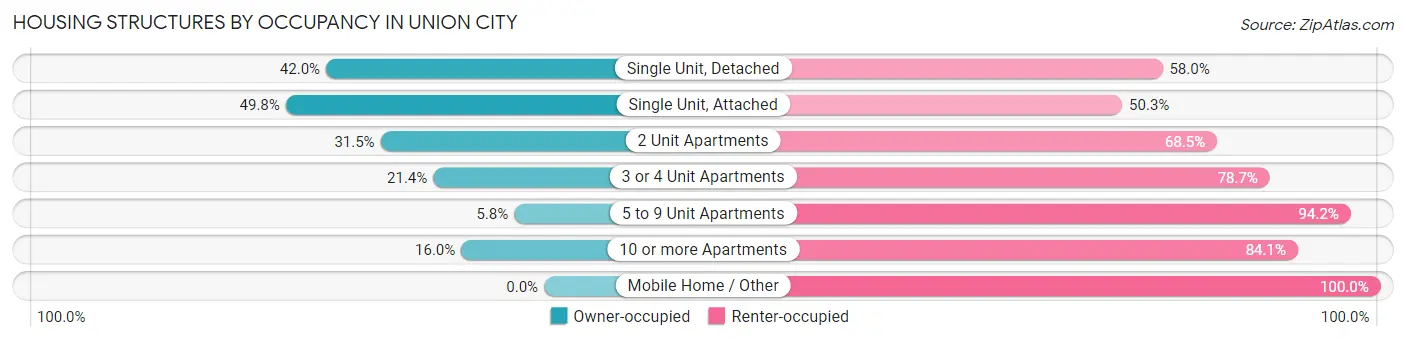
| Structure Type | Owner-occupied | Renter-occupied |
| Single Unit, Detached | 516 (42.0%) | 713 (58.0%) |
| Single Unit, Attached | 301 (49.7%) | 304 (50.2%) |
| 2 Unit Apartments | 1,370 (31.5%) | 2,981 (68.5%) |
| 3 or 4 Unit Apartments | 1,096 (21.3%) | 4,038 (78.6%) |
| 5 to 9 Unit Apartments | 290 (5.8%) | 4,747 (94.2%) |
| 10 or more Apartments | 1,475 (16.0%) | 7,772 (84.1%) |
| Mobile Home / Other | 0 (0.0%) | 7 (100.0%) |
| Total | 5,048 (19.7%) | 20,562 (80.3%) |
Housing Structures by Number of Rooms in Union City
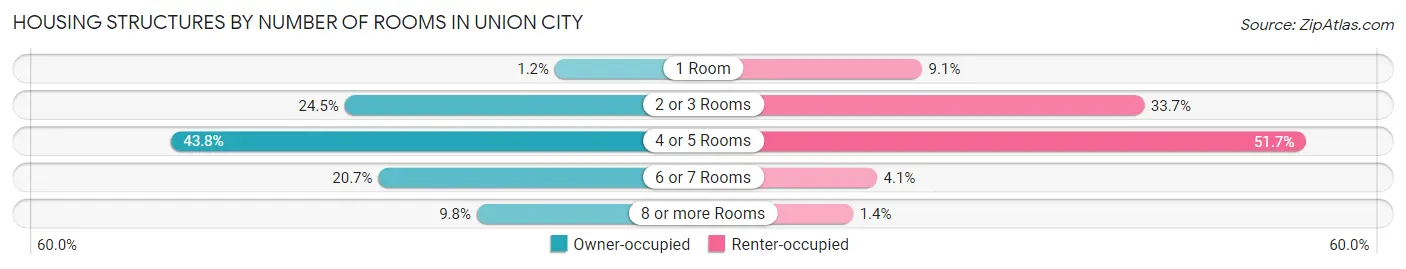
| Number of Rooms | Owner-occupied | Renter-occupied |
| 1 Room | 58 (1.1%) | 1,864 (9.1%) |
| 2 or 3 Rooms | 1,236 (24.5%) | 6,935 (33.7%) |
| 4 or 5 Rooms | 2,212 (43.8%) | 10,635 (51.7%) |
| 6 or 7 Rooms | 1,047 (20.7%) | 836 (4.1%) |
| 8 or more Rooms | 495 (9.8%) | 292 (1.4%) |
| Total | 5,048 (100.0%) | 20,562 (100.0%) |
Housing Structure by Heating Type in Union City
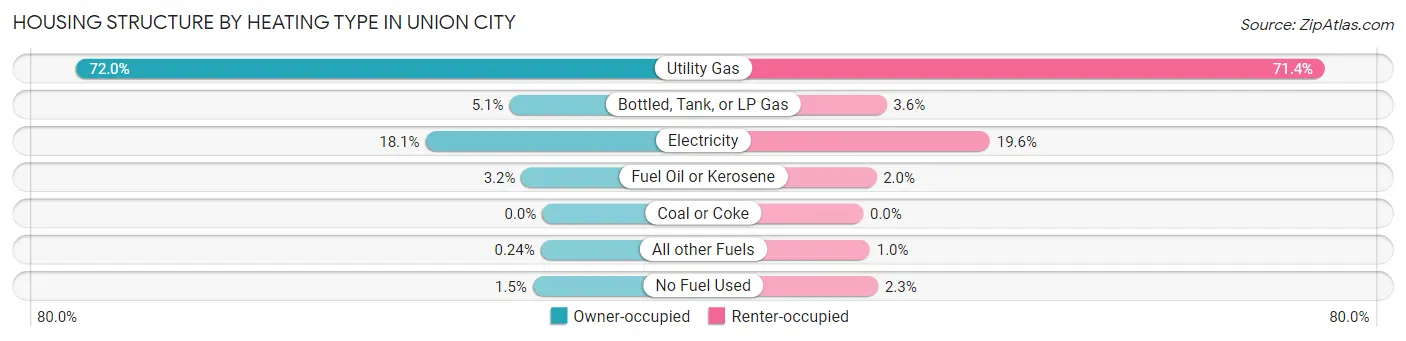
| Heating Type | Owner-occupied | Renter-occupied |
| Utility Gas | 3,634 (72.0%) | 14,682 (71.4%) |
| Bottled, Tank, or LP Gas | 256 (5.1%) | 743 (3.6%) |
| Electricity | 911 (18.0%) | 4,030 (19.6%) |
| Fuel Oil or Kerosene | 162 (3.2%) | 418 (2.0%) |
| Coal or Coke | 0 (0.0%) | 0 (0.0%) |
| All other Fuels | 12 (0.2%) | 214 (1.0%) |
| No Fuel Used | 73 (1.5%) | 475 (2.3%) |
| Total | 5,048 (100.0%) | 20,562 (100.0%) |
Household Vehicle Usage in Union City
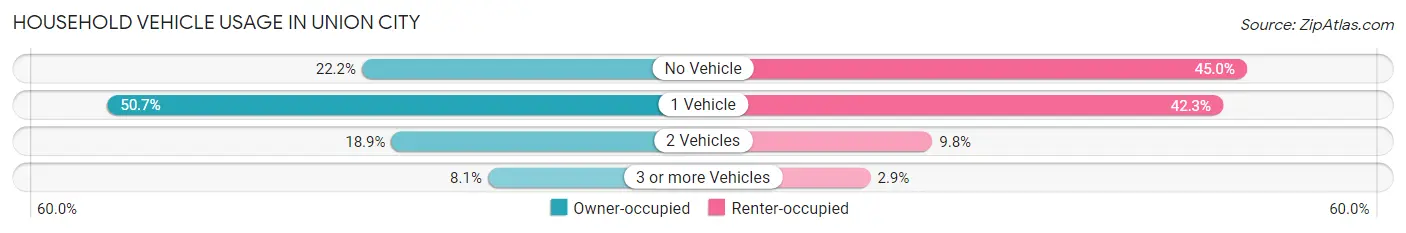
| Vehicles per Household | Owner-occupied | Renter-occupied |
| No Vehicle | 1,122 (22.2%) | 9,254 (45.0%) |
| 1 Vehicle | 2,561 (50.7%) | 8,704 (42.3%) |
| 2 Vehicles | 955 (18.9%) | 2,013 (9.8%) |
| 3 or more Vehicles | 410 (8.1%) | 591 (2.9%) |
| Total | 5,048 (100.0%) | 20,562 (100.0%) |
Real Estate & Mortgages in Union City
Real Estate and Mortgage Overview in Union City
| Characteristic | Without Mortgage | With Mortgage |
| Housing Units | 1,817 | 3,231 |
| Median Property Value | $426,600 | $461,200 |
| Median Household Income | $73,384 | $1,306 |
| Monthly Housing Costs | $1,365 | $1,593 |
| Real Estate Taxes | $10,001 | $187 |
Property Value by Mortgage Status in Union City
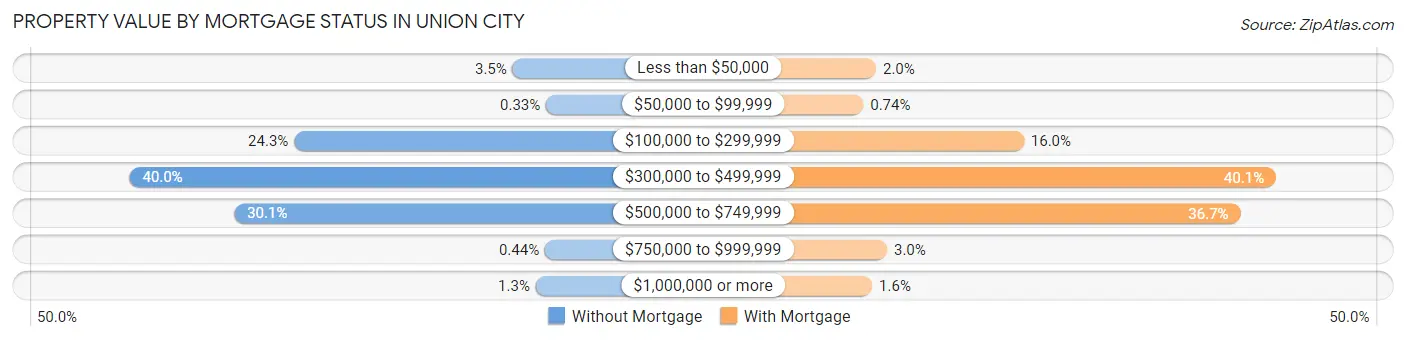
| Property Value | Without Mortgage | With Mortgage |
| Less than $50,000 | 64 (3.5%) | 63 (1.9%) |
| $50,000 to $99,999 | 6 (0.3%) | 24 (0.7%) |
| $100,000 to $299,999 | 442 (24.3%) | 518 (16.0%) |
| $300,000 to $499,999 | 727 (40.0%) | 1,294 (40.1%) |
| $500,000 to $749,999 | 546 (30.0%) | 1,184 (36.6%) |
| $750,000 to $999,999 | 8 (0.4%) | 97 (3.0%) |
| $1,000,000 or more | 24 (1.3%) | 51 (1.6%) |
| Total | 1,817 (100.0%) | 3,231 (100.0%) |
Household Income by Mortgage Status in Union City
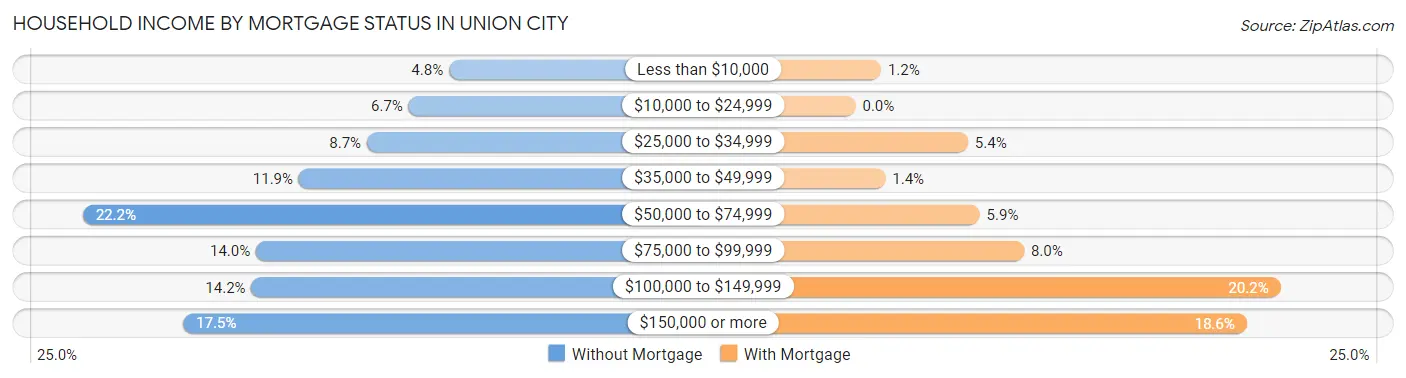
| Household Income | Without Mortgage | With Mortgage |
| Less than $10,000 | 87 (4.8%) | 39 (1.2%) |
| $10,000 to $24,999 | 122 (6.7%) | 0 (0.0%) |
| $25,000 to $34,999 | 158 (8.7%) | 173 (5.3%) |
| $35,000 to $49,999 | 217 (11.9%) | 46 (1.4%) |
| $50,000 to $74,999 | 404 (22.2%) | 191 (5.9%) |
| $75,000 to $99,999 | 254 (14.0%) | 259 (8.0%) |
| $100,000 to $149,999 | 258 (14.2%) | 654 (20.2%) |
| $150,000 or more | 317 (17.4%) | 602 (18.6%) |
| Total | 1,817 (100.0%) | 3,231 (100.0%) |
Property Value to Household Income Ratio in Union City
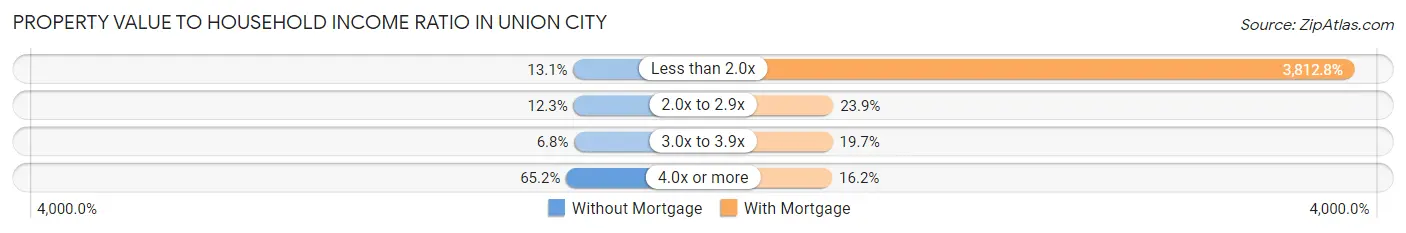
| Value-to-Income Ratio | Without Mortgage | With Mortgage |
| Less than 2.0x | 238 (13.1%) | 123,191 (3,812.8%) |
| 2.0x to 2.9x | 224 (12.3%) | 772 (23.9%) |
| 3.0x to 3.9x | 123 (6.8%) | 636 (19.7%) |
| 4.0x or more | 1,185 (65.2%) | 524 (16.2%) |
| Total | 1,817 (100.0%) | 3,231 (100.0%) |
Real Estate Taxes by Mortgage Status in Union City
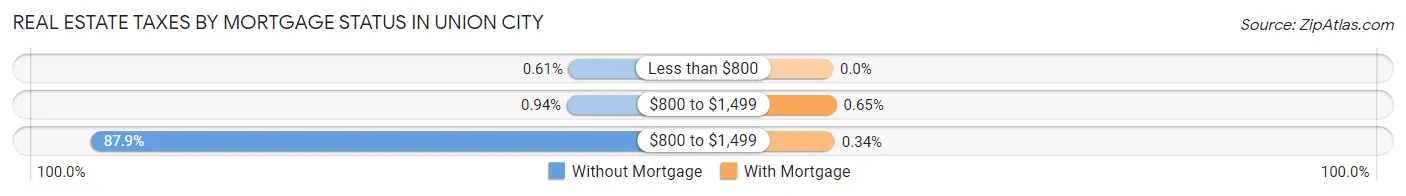
| Property Taxes | Without Mortgage | With Mortgage |
| Less than $800 | 11 (0.6%) | 0 (0.0%) |
| $800 to $1,499 | 17 (0.9%) | 21 (0.6%) |
| $800 to $1,499 | 1,597 (87.9%) | 11 (0.3%) |
| Total | 1,817 (100.0%) | 3,231 (100.0%) |
Health & Disability in Union City
Health Insurance Coverage by Age in Union City
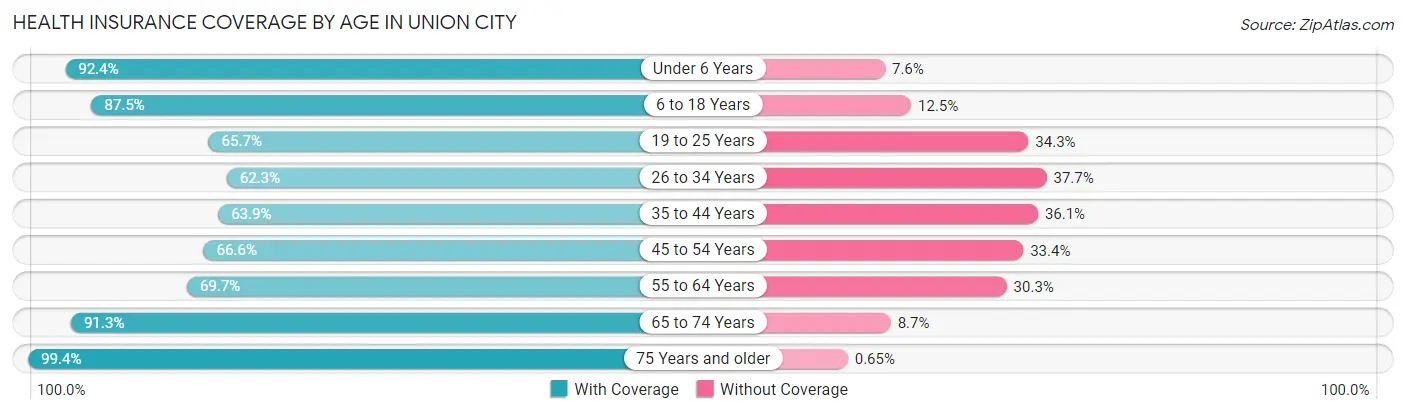
| Age Bracket | With Coverage | Without Coverage |
| Under 6 Years | 4,449 (92.4%) | 366 (7.6%) |
| 6 to 18 Years | 10,118 (87.5%) | 1,440 (12.5%) |
| 19 to 25 Years | 4,573 (65.7%) | 2,391 (34.3%) |
| 26 to 34 Years | 5,485 (62.3%) | 3,320 (37.7%) |
| 35 to 44 Years | 6,508 (63.9%) | 3,679 (36.1%) |
| 45 to 54 Years | 6,382 (66.6%) | 3,196 (33.4%) |
| 55 to 64 Years | 4,923 (69.7%) | 2,138 (30.3%) |
| 65 to 74 Years | 3,881 (91.3%) | 368 (8.7%) |
| 75 Years and older | 3,652 (99.4%) | 24 (0.6%) |
| Total | 49,971 (74.7%) | 16,922 (25.3%) |
Health Insurance Coverage by Citizenship Status in Union City
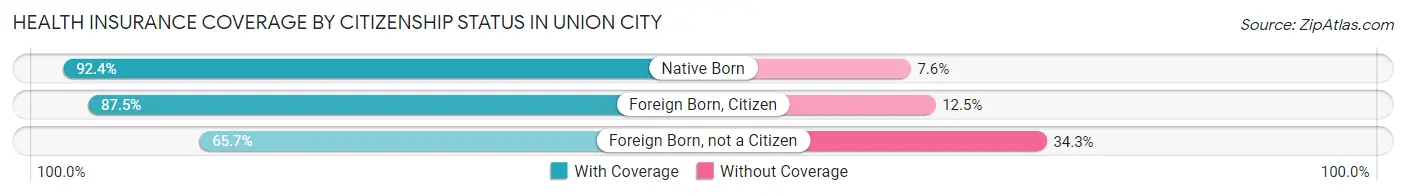
| Citizenship Status | With Coverage | Without Coverage |
| Native Born | 4,449 (92.4%) | 366 (7.6%) |
| Foreign Born, Citizen | 10,118 (87.5%) | 1,440 (12.5%) |
| Foreign Born, not a Citizen | 4,573 (65.7%) | 2,391 (34.3%) |
Health Insurance Coverage by Household Income in Union City
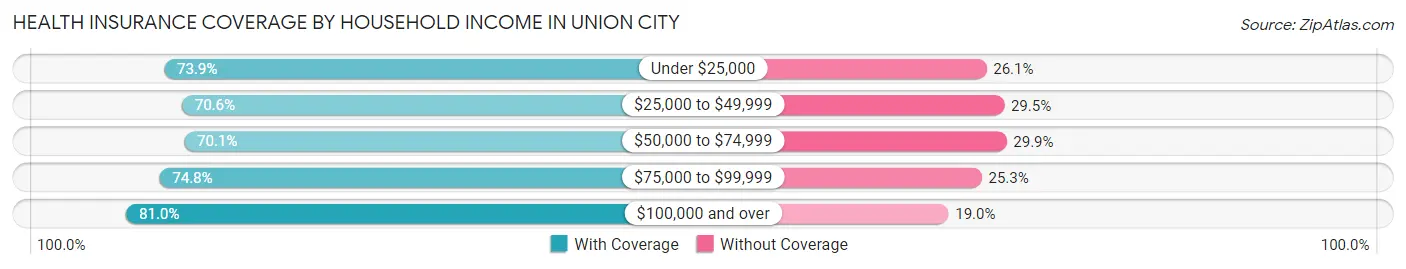
| Household Income | With Coverage | Without Coverage |
| Under $25,000 | 8,276 (73.9%) | 2,928 (26.1%) |
| $25,000 to $49,999 | 9,512 (70.6%) | 3,971 (29.4%) |
| $50,000 to $74,999 | 8,563 (70.1%) | 3,650 (29.9%) |
| $75,000 to $99,999 | 7,995 (74.8%) | 2,701 (25.3%) |
| $100,000 and over | 15,521 (81.0%) | 3,644 (19.0%) |
Public vs Private Health Insurance Coverage by Age in Union City
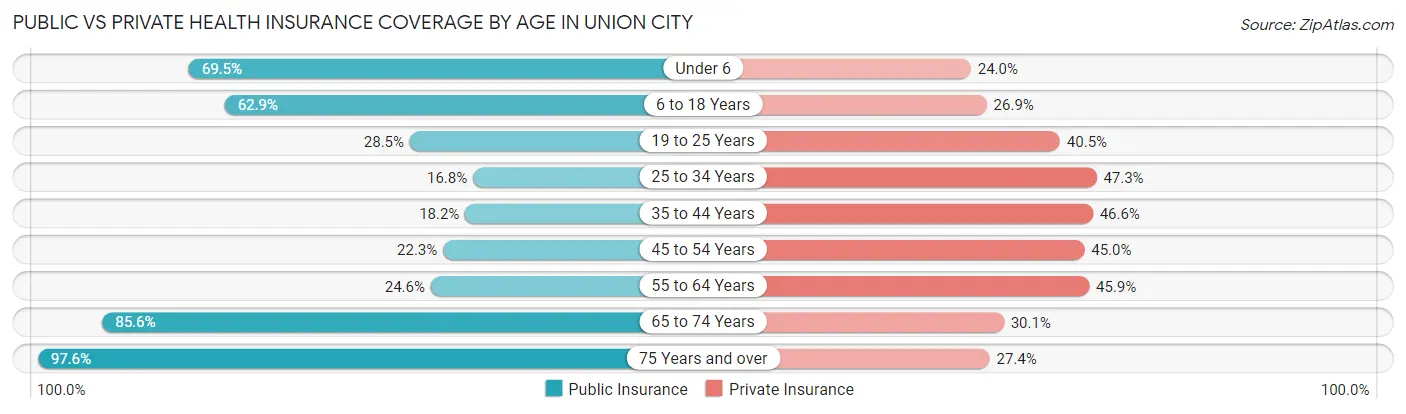
| Age Bracket | Public Insurance | Private Insurance |
| Under 6 | 3,347 (69.5%) | 1,153 (23.9%) |
| 6 to 18 Years | 7,264 (62.8%) | 3,108 (26.9%) |
| 19 to 25 Years | 1,984 (28.5%) | 2,819 (40.5%) |
| 25 to 34 Years | 1,477 (16.8%) | 4,162 (47.3%) |
| 35 to 44 Years | 1,856 (18.2%) | 4,744 (46.6%) |
| 45 to 54 Years | 2,138 (22.3%) | 4,311 (45.0%) |
| 55 to 64 Years | 1,738 (24.6%) | 3,242 (45.9%) |
| 65 to 74 Years | 3,636 (85.6%) | 1,277 (30.0%) |
| 75 Years and over | 3,586 (97.6%) | 1,008 (27.4%) |
| Total | 27,026 (40.4%) | 25,824 (38.6%) |
Disability Status by Sex by Age in Union City
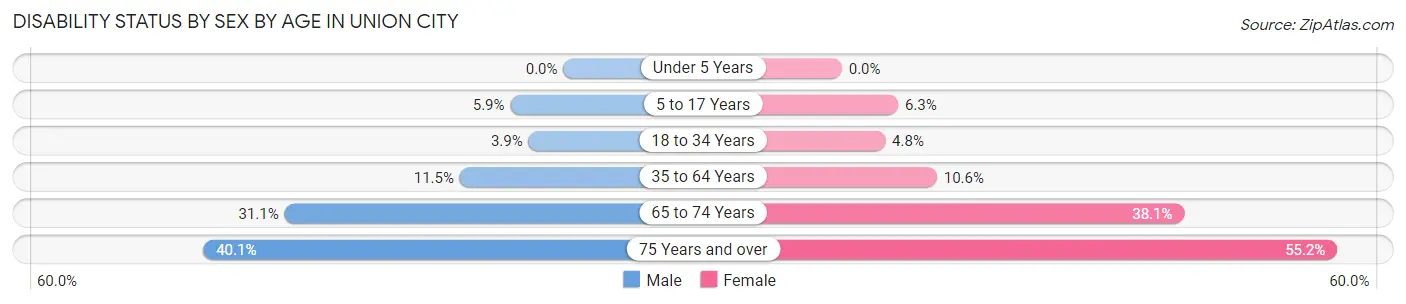
| Age Bracket | Male | Female |
| Under 5 Years | 0 (0.0%) | 0 (0.0%) |
| 5 to 17 Years | 334 (5.9%) | 337 (6.3%) |
| 18 to 34 Years | 323 (3.9%) | 419 (4.8%) |
| 35 to 64 Years | 1,575 (11.5%) | 1,393 (10.6%) |
| 65 to 74 Years | 606 (31.0%) | 876 (38.1%) |
| 75 Years and over | 535 (40.1%) | 1,292 (55.2%) |
Disability Class by Sex by Age in Union City
Disability Class: Hearing Difficulty
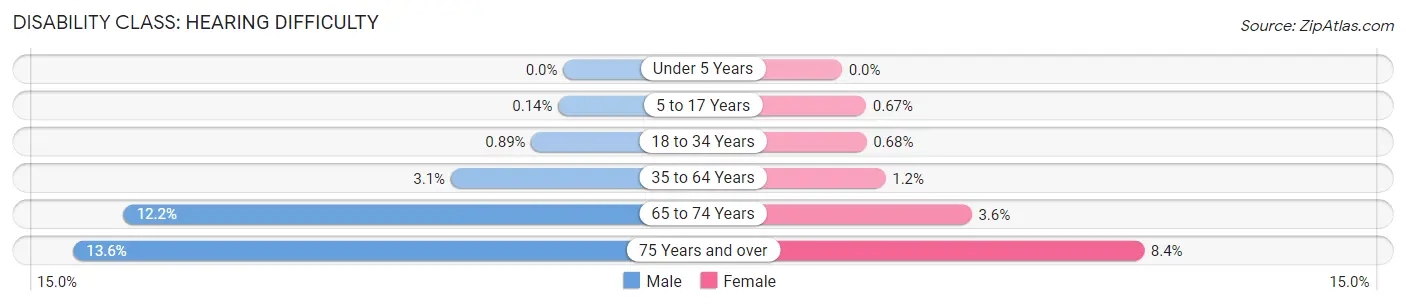
| Age Bracket | Male | Female |
| Under 5 Years | 0 (0.0%) | 0 (0.0%) |
| 5 to 17 Years | 8 (0.1%) | 36 (0.7%) |
| 18 to 34 Years | 74 (0.9%) | 59 (0.7%) |
| 35 to 64 Years | 427 (3.1%) | 159 (1.2%) |
| 65 to 74 Years | 239 (12.2%) | 83 (3.6%) |
| 75 Years and over | 182 (13.6%) | 197 (8.4%) |
Disability Class: Vision Difficulty
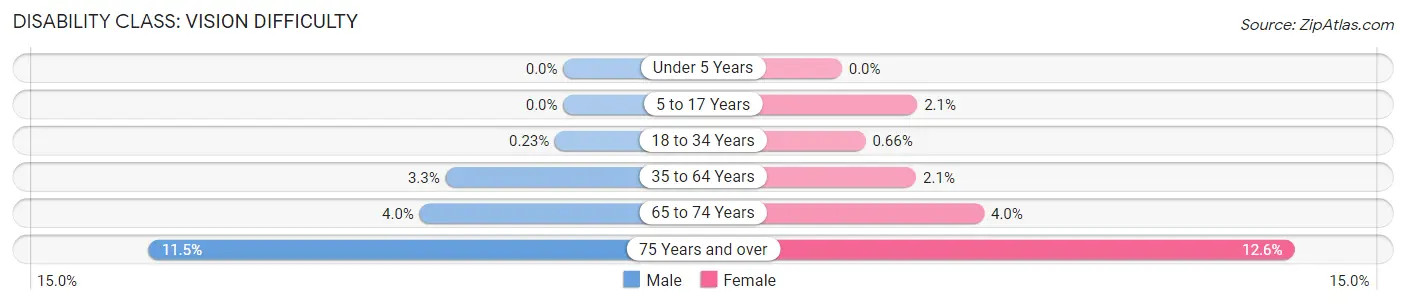
| Age Bracket | Male | Female |
| Under 5 Years | 0 (0.0%) | 0 (0.0%) |
| 5 to 17 Years | 0 (0.0%) | 113 (2.1%) |
| 18 to 34 Years | 19 (0.2%) | 57 (0.7%) |
| 35 to 64 Years | 448 (3.3%) | 272 (2.1%) |
| 65 to 74 Years | 78 (4.0%) | 91 (4.0%) |
| 75 Years and over | 154 (11.5%) | 295 (12.6%) |
Disability Class: Cognitive Difficulty
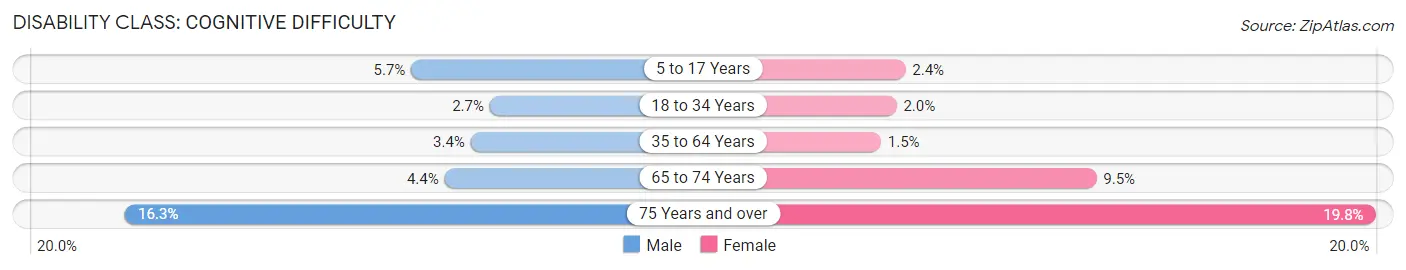
| Age Bracket | Male | Female |
| 5 to 17 Years | 320 (5.7%) | 127 (2.4%) |
| 18 to 34 Years | 227 (2.7%) | 176 (2.0%) |
| 35 to 64 Years | 470 (3.4%) | 191 (1.5%) |
| 65 to 74 Years | 86 (4.4%) | 217 (9.5%) |
| 75 Years and over | 217 (16.3%) | 464 (19.8%) |
Disability Class: Ambulatory Difficulty
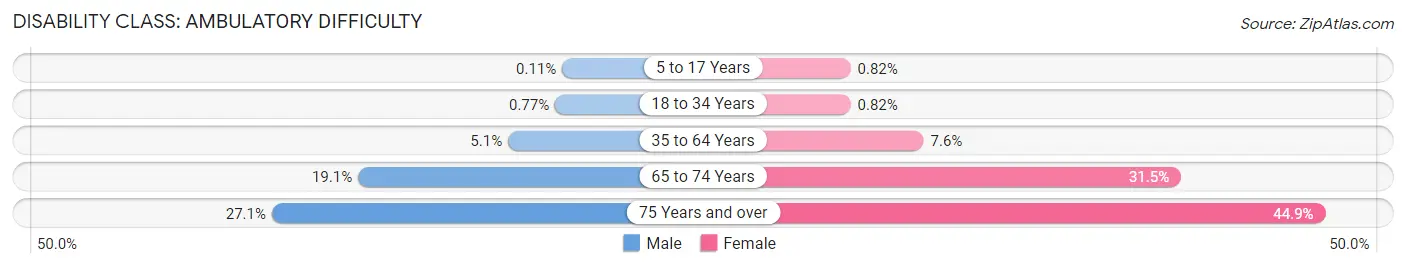
| Age Bracket | Male | Female |
| 5 to 17 Years | 6 (0.1%) | 44 (0.8%) |
| 18 to 34 Years | 64 (0.8%) | 71 (0.8%) |
| 35 to 64 Years | 702 (5.1%) | 999 (7.6%) |
| 65 to 74 Years | 372 (19.1%) | 723 (31.5%) |
| 75 Years and over | 361 (27.1%) | 1,051 (44.9%) |
Disability Class: Self-Care Difficulty
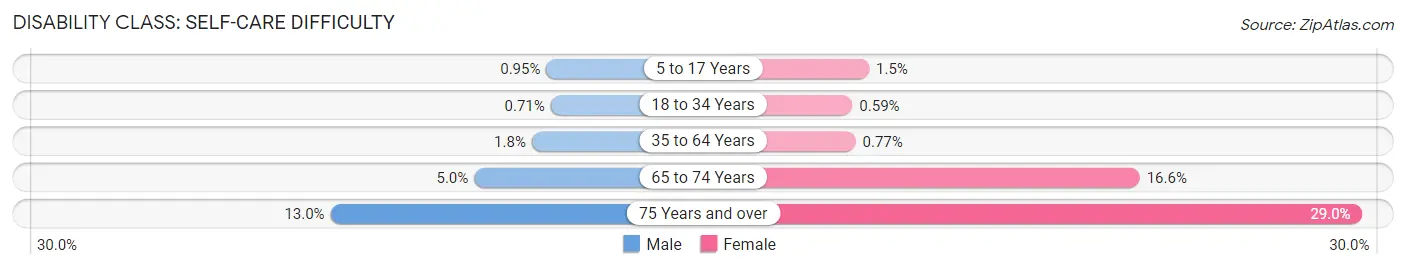
| Age Bracket | Male | Female |
| 5 to 17 Years | 54 (0.9%) | 82 (1.5%) |
| 18 to 34 Years | 59 (0.7%) | 51 (0.6%) |
| 35 to 64 Years | 240 (1.8%) | 101 (0.8%) |
| 65 to 74 Years | 97 (5.0%) | 381 (16.6%) |
| 75 Years and over | 173 (13.0%) | 679 (29.0%) |
Technology Access in Union City
Computing Device Access in Union City
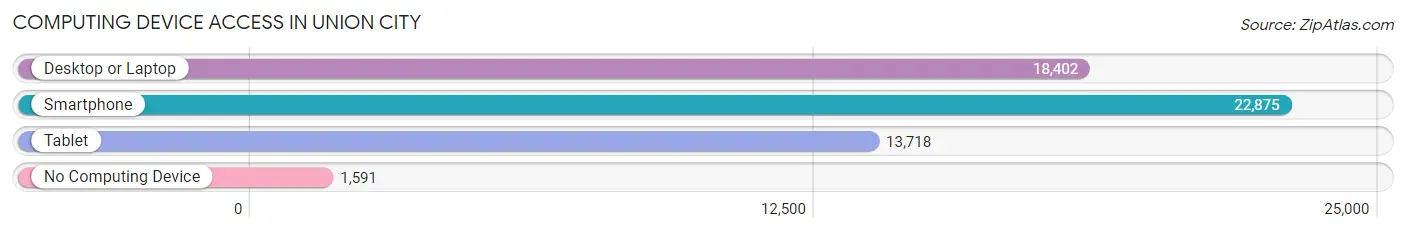
| Device Type | # Households | % Households |
| Desktop or Laptop | 18,402 | 71.9% |
| Smartphone | 22,875 | 89.3% |
| Tablet | 13,718 | 53.6% |
| No Computing Device | 1,591 | 6.2% |
| Total | 25,610 | 100.0% |
Internet Access in Union City
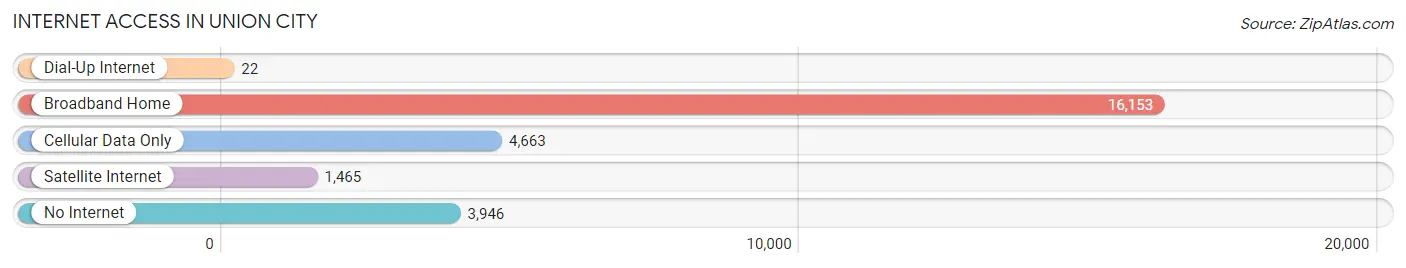
| Internet Type | # Households | % Households |
| Dial-Up Internet | 22 | 0.1% |
| Broadband Home | 16,153 | 63.1% |
| Cellular Data Only | 4,663 | 18.2% |
| Satellite Internet | 1,465 | 5.7% |
| No Internet | 3,946 | 15.4% |
| Total | 25,610 | 100.0% |
Union City Summary
Introduction
Union City, New Jersey is a city located in Hudson County, New Jersey. It is the most densely populated city in the United States, with a population of 66,455 as of the 2010 census. Union City is bordered by North Bergen to the north, West New York to the west, and Weehawken to the south. It is situated on the Hudson River, across from Manhattan. Union City is known for its diverse population, vibrant culture, and rich history.
History
Union City was originally inhabited by the Hackensack and Raritan Indians. The area was first settled by Europeans in 1668, when the Dutch West India Company purchased the land from the Indians. The area was then known as Bergen Township, and was part of Bergen County. In 1855, the area was incorporated as the Town of Union, and in 1925, it was reincorporated as the City of Union City.
Union City has a long history of immigration, beginning with the Dutch and Germans in the 17th century. In the 19th century, Irish and Italian immigrants began to settle in the area. In the early 20th century, Union City became a major destination for immigrants from Eastern Europe, particularly from Poland, Russia, and Ukraine. In the 1950s and 1960s, Union City experienced a large influx of Cuban immigrants. Today, Union City is home to a diverse population, with large numbers of immigrants from Latin America, the Caribbean, and Asia.
Geography
Union City is located in Hudson County, New Jersey, on the west bank of the Hudson River. It is bordered by North Bergen to the north, West New York to the west, and Weehawken to the south. The city covers an area of 2.2 square miles, and is the most densely populated city in the United States.
The city is situated on a ridge of the Palisades, a line of steep cliffs along the Hudson River. The city is divided into two sections, the North End and the South End, by a steep ravine known as the Palisades. The North End is the older and more residential section of the city, while the South End is the more commercial and industrial section.
Economy
Union City has a diverse economy, with a mix of manufacturing, retail, and service industries. The city is home to several large manufacturing companies, including the American Can Company, the Union City Iron Works, and the Union City Machine Works. The city is also home to a number of retail stores, restaurants, and other businesses.
Union City is also home to a number of government offices, including the Hudson County Courthouse, the Hudson County Jail, and the Hudson County Office of Emergency Management. The city is also home to a number of educational institutions, including the Union City High School, the Union City Board of Education, and the Union City Public Library.
Demographics
As of the 2010 census, Union City had a population of 66,455. The population is racially and ethnically diverse, with large numbers of immigrants from Latin America, the Caribbean, and Asia. The city is predominantly Hispanic, with a population that is 44.3% Hispanic, 33.3% White, 14.2% Black, and 8.2% Asian.
The median household income in Union City is $41,945, and the median family income is $48,945. The city has a poverty rate of 22.3%, and a high school graduation rate of 79.3%.
Conclusion
Union City, New Jersey is a city located in Hudson County, New Jersey. It is the most densely populated city in the United States, with a population of 66,455 as of the 2010 census. Union City is bordered by North Bergen to the north, West New York to the west, and Weehawken to the south. It is situated on the Hudson River, across from Manhattan. Union City is known for its diverse population, vibrant culture, and rich history. The city has a diverse economy, with a mix of manufacturing, retail, and service industries. The population is racially and ethnically diverse, with large numbers of immigrants from Latin America, the Caribbean, and Asia. Union City is a vibrant and diverse city, with a rich history and a bright future.
Common Questions
What is Per Capita Income in Union City?
Per Capita income in Union City is $31,030.
What is the Median Family Income in Union City?
Median Family Income in Union City is $62,307.
What is the Median Household income in Union City?
Median Household Income in Union City is $59,967.
What is Income or Wage Gap in Union City?
Income or Wage Gap in Union City is 26.8%.
Women in Union City earn 73.2 cents for every dollar earned by a man.
What is Family Income Deficit in Union City?
Family Income Deficit in Union City is $10,662.
Families that are below poverty line in Union City earn $10,662 less on average than the poverty threshold level.
What is Inequality or Gini Index in Union City?
Inequality or Gini Index in Union City is 0.48.
What is the Total Population of Union City?
Total Population of Union City is 67,258.
What is the Total Male Population of Union City?
Total Male Population of Union City is 32,765.
What is the Total Female Population of Union City?
Total Female Population of Union City is 34,493.
What is the Ratio of Males per 100 Females in Union City?
There are 94.99 Males per 100 Females in Union City.
What is the Ratio of Females per 100 Males in Union City?
There are 105.27 Females per 100 Males in Union City.
What is the Median Population Age in Union City?
Median Population Age in Union City is 36.6 Years.
What is the Average Family Size in Union City
Average Family Size in Union City is 3.1 People.
What is the Average Household Size in Union City
Average Household Size in Union City is 2.6 People.
How Large is the Labor Force in Union City?
There are 36,724 People in the Labor Forcein in Union City.
What is the Percentage of People in the Labor Force in Union City?
68.2% of People are in the Labor Force in Union City.
What is the Unemployment Rate in Union City?
Unemployment Rate in Union City is 7.8%.