Bayonne, NJ Map & Demographics
Bayonne Map
Bayonne Overview
$39,629
PER CAPITA INCOME
$92,521
AVG FAMILY INCOME
$80,044
AVG HOUSEHOLD INCOME
31.6%
WAGE / INCOME GAP [ % ]
68.4¢/ $1
WAGE / INCOME GAP [ $ ]
$8,620
FAMILY INCOME DEFICIT
0.45
INEQUALITY / GINI INDEX
70,497
TOTAL POPULATION
35,345
MALE POPULATION
35,152
FEMALE POPULATION
100.55
MALES / 100 FEMALES
99.45
FEMALES / 100 MALES
38.2
MEDIAN AGE
3.2
AVG FAMILY SIZE
2.6
AVG HOUSEHOLD SIZE
36,597
LABOR FORCE [ PEOPLE ]
65.5%
PERCENT IN LABOR FORCE
6.0%
UNEMPLOYMENT RATE
Bayonne Zip Codes
Income in Bayonne
Income Overview in Bayonne
Per Capita Income in Bayonne is $39,629, while median incomes of families and households are $92,521 and $80,044 respectively.
| Characteristic | Number | Measure |
| Per Capita Income | 70,497 | $39,629 |
| Median Family Income | 17,588 | $92,521 |
| Mean Family Income | 17,588 | $114,684 |
| Median Household Income | 27,198 | $80,044 |
| Mean Household Income | 27,198 | $102,566 |
| Income Deficit | 17,588 | $8,620 |
| Wage / Income Gap (%) | 70,497 | 31.61% |
| Wage / Income Gap ($) | 70,497 | 68.39¢ per $1 |
| Gini / Inequality Index | 70,497 | 0.45 |
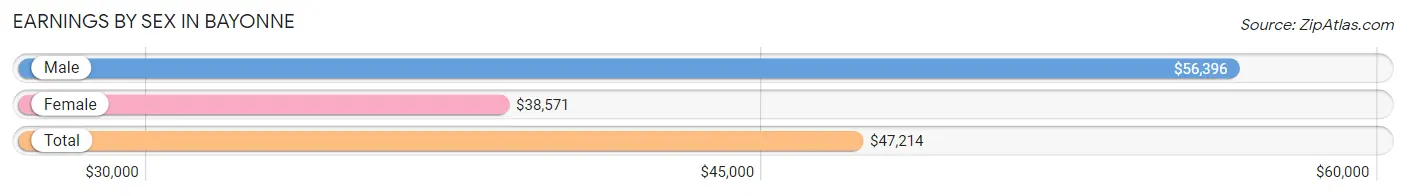
Earnings by Sex in Bayonne
Average Earnings in Bayonne are $47,214, $56,396 for men and $38,571 for women, a difference of 31.6%.
| Sex | Number | Average Earnings |
| Male | 19,728 (53.7%) | $56,396 |
| Female | 16,984 (46.3%) | $38,571 |
| Total | 36,712 (100.0%) | $47,214 |
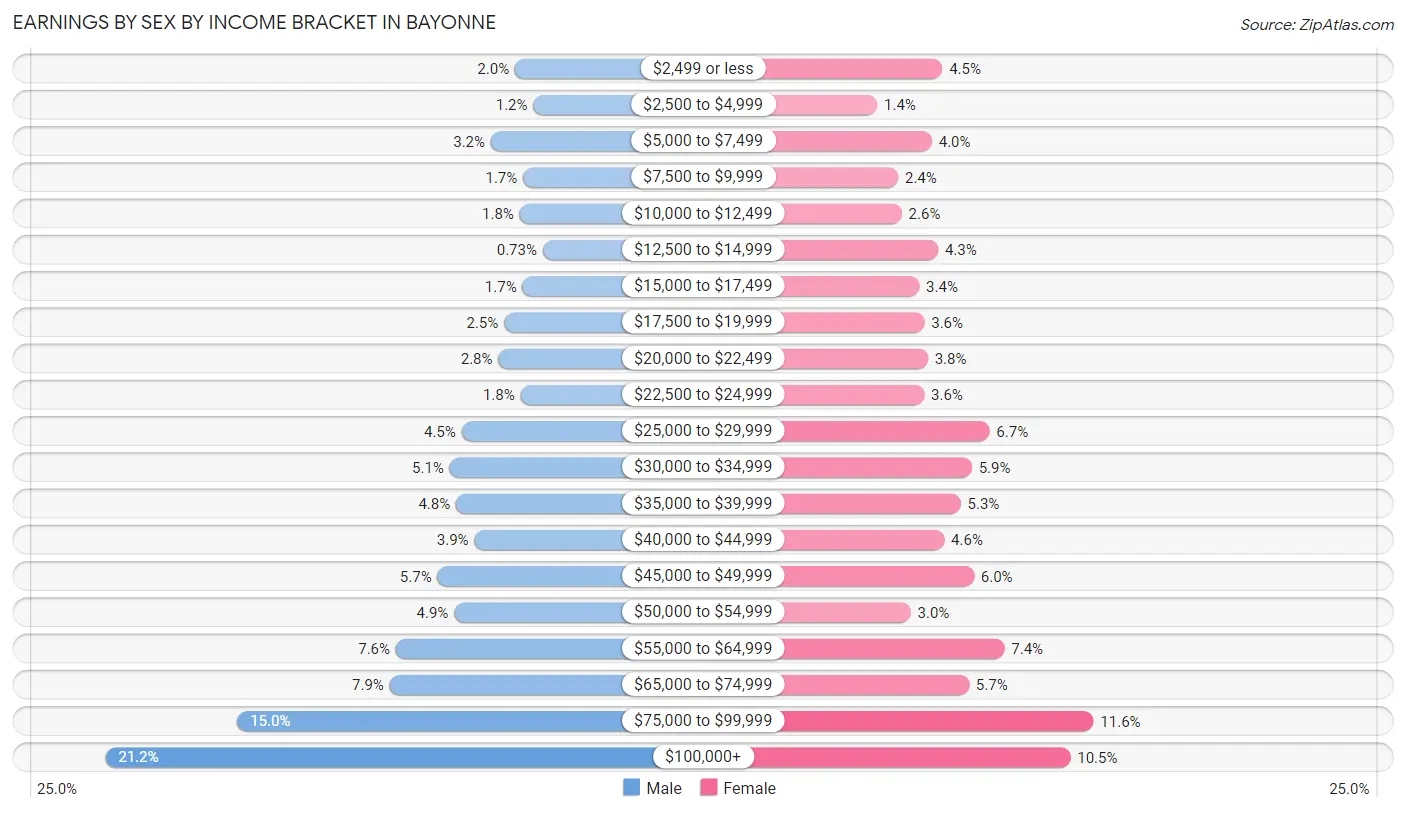
Earnings by Sex by Income Bracket in Bayonne
The most common earnings brackets in Bayonne are $100,000+ for men (4,186 | 21.2%) and $75,000 to $99,999 for women (1,961 | 11.6%).
| Income | Male | Female |
| $2,499 or less | 400 (2.0%) | 759 (4.5%) |
| $2,500 to $4,999 | 231 (1.2%) | 241 (1.4%) |
| $5,000 to $7,499 | 624 (3.2%) | 676 (4.0%) |
| $7,500 to $9,999 | 326 (1.7%) | 408 (2.4%) |
| $10,000 to $12,499 | 358 (1.8%) | 436 (2.6%) |
| $12,500 to $14,999 | 145 (0.7%) | 725 (4.3%) |
| $15,000 to $17,499 | 331 (1.7%) | 575 (3.4%) |
| $17,500 to $19,999 | 501 (2.5%) | 617 (3.6%) |
| $20,000 to $22,499 | 554 (2.8%) | 644 (3.8%) |
| $22,500 to $24,999 | 349 (1.8%) | 614 (3.6%) |
| $25,000 to $29,999 | 893 (4.5%) | 1,135 (6.7%) |
| $30,000 to $34,999 | 1,004 (5.1%) | 993 (5.9%) |
| $35,000 to $39,999 | 944 (4.8%) | 905 (5.3%) |
| $40,000 to $44,999 | 776 (3.9%) | 774 (4.6%) |
| $45,000 to $49,999 | 1,116 (5.7%) | 1,011 (5.9%) |
| $50,000 to $54,999 | 963 (4.9%) | 508 (3.0%) |
| $55,000 to $64,999 | 1,501 (7.6%) | 1,253 (7.4%) |
| $65,000 to $74,999 | 1,559 (7.9%) | 971 (5.7%) |
| $75,000 to $99,999 | 2,967 (15.0%) | 1,961 (11.6%) |
| $100,000+ | 4,186 (21.2%) | 1,778 (10.5%) |
| Total | 19,728 (100.0%) | 16,984 (100.0%) |
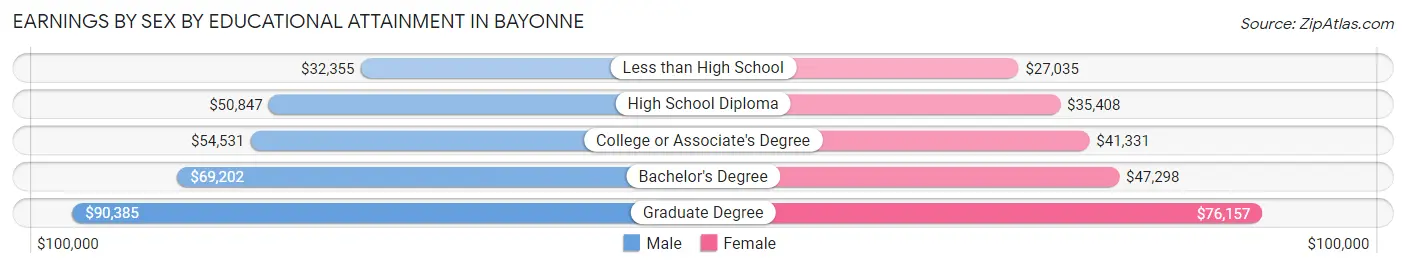
Earnings by Sex by Educational Attainment in Bayonne
Average earnings in Bayonne are $59,871 for men and $43,271 for women, a difference of 27.7%. Men with an educational attainment of graduate degree enjoy the highest average annual earnings of $90,385, while those with less than high school education earn the least with $32,355. Women with an educational attainment of graduate degree earn the most with the average annual earnings of $76,157, while those with less than high school education have the smallest earnings of $27,035.
| Educational Attainment | Male Income | Female Income |
| Less than High School | $32,355 | $27,035 |
| High School Diploma | $50,847 | $35,408 |
| College or Associate's Degree | $54,531 | $41,331 |
| Bachelor's Degree | $69,202 | $47,298 |
| Graduate Degree | $90,385 | $76,157 |
| Total | $59,871 | $43,271 |
Family Income in Bayonne
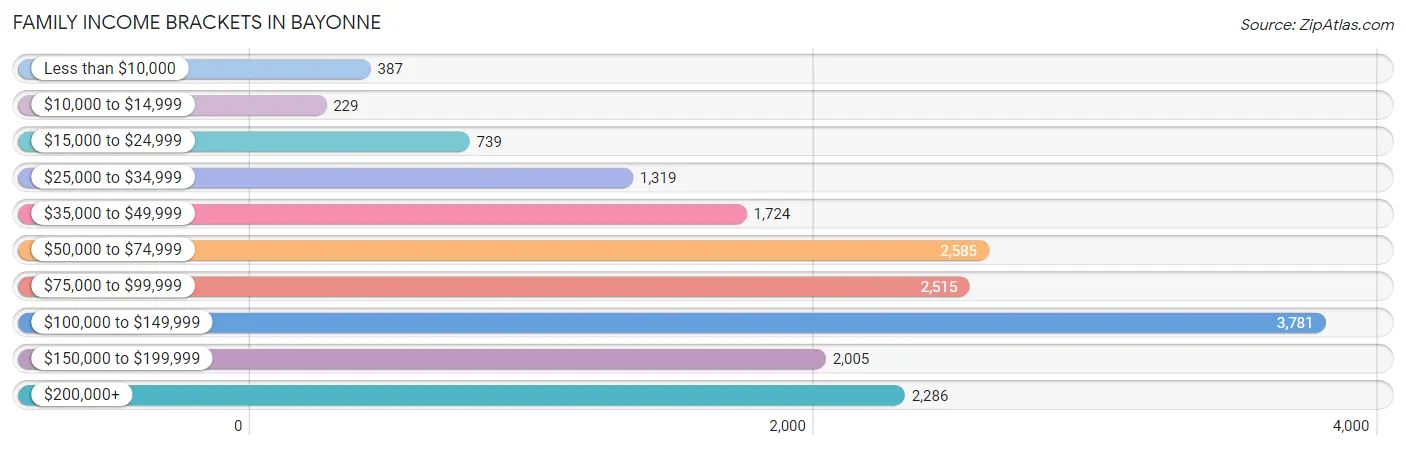
Family Income Brackets in Bayonne
According to the Bayonne family income data, there are 3,781 families falling into the $100,000 to $149,999 income range, which is the most common income bracket and makes up 21.5% of all families. Conversely, the $10,000 to $14,999 income bracket is the least frequent group with only 229 families (1.3%) belonging to this category.
| Income Bracket | # Families | % Families |
| Less than $10,000 | 387 | 2.2% |
| $10,000 to $14,999 | 229 | 1.3% |
| $15,000 to $24,999 | 739 | 4.2% |
| $25,000 to $34,999 | 1,319 | 7.5% |
| $35,000 to $49,999 | 1,724 | 9.8% |
| $50,000 to $74,999 | 2,585 | 14.7% |
| $75,000 to $99,999 | 2,515 | 14.3% |
| $100,000 to $149,999 | 3,781 | 21.5% |
| $150,000 to $199,999 | 2,005 | 11.4% |
| $200,000+ | 2,286 | 13.0% |
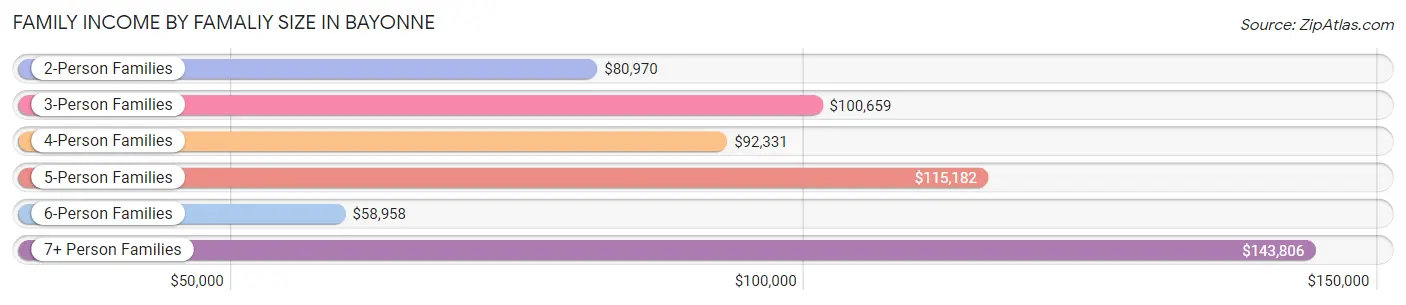
Family Income by Famaliy Size in Bayonne
7+ person families (564 | 3.2%) account for the highest median family income in Bayonne with $143,806 per family, while 2-person families (6,521 | 37.1%) have the highest median income of $40,485 per family member.
| Income Bracket | # Families | Median Income |
| 2-Person Families | 6,521 (37.1%) | $80,970 |
| 3-Person Families | 5,251 (29.9%) | $100,659 |
| 4-Person Families | 2,851 (16.2%) | $92,331 |
| 5-Person Families | 2,075 (11.8%) | $115,182 |
| 6-Person Families | 326 (1.8%) | $58,958 |
| 7+ Person Families | 564 (3.2%) | $143,806 |
| Total | 17,588 (100.0%) | $92,521 |
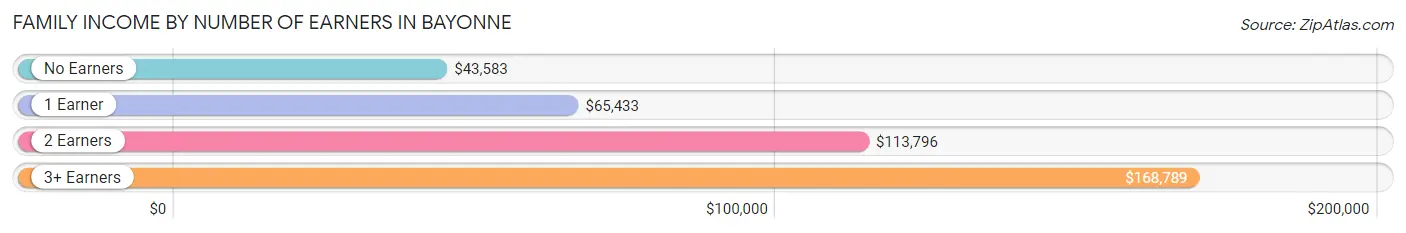
Family Income by Number of Earners in Bayonne
The median family income in Bayonne is $92,521, with families comprising 3+ earners (2,599) having the highest median family income of $168,789, while families with no earners (1,586) have the lowest median family income of $43,583, accounting for 14.8% and 9.0% of families, respectively.
| Number of Earners | # Families | Median Income |
| No Earners | 1,586 (9.0%) | $43,583 |
| 1 Earner | 6,877 (39.1%) | $65,433 |
| 2 Earners | 6,526 (37.1%) | $113,796 |
| 3+ Earners | 2,599 (14.8%) | $168,789 |
| Total | 17,588 (100.0%) | $92,521 |
Household Income in Bayonne
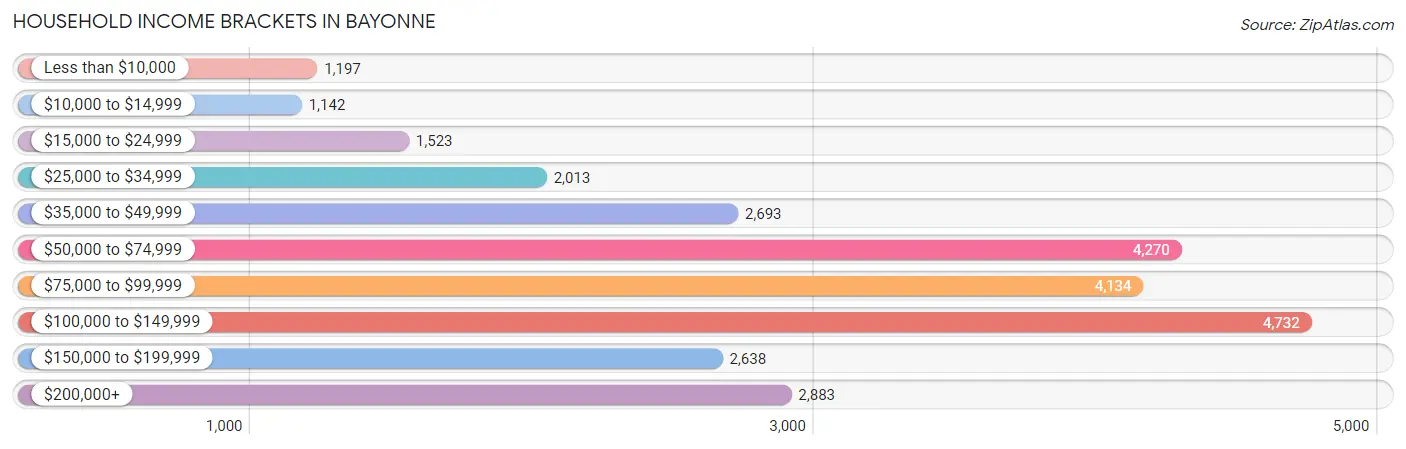
Household Income Brackets in Bayonne
With 4,732 households falling in the category, the $100,000 to $149,999 income range is the most frequent in Bayonne, accounting for 17.4% of all households. In contrast, only 1,142 households (4.2%) fall into the $10,000 to $14,999 income bracket, making it the least populous group.
| Income Bracket | # Households | % Households |
| Less than $10,000 | 1,197 | 4.4% |
| $10,000 to $14,999 | 1,142 | 4.2% |
| $15,000 to $24,999 | 1,523 | 5.6% |
| $25,000 to $34,999 | 2,013 | 7.4% |
| $35,000 to $49,999 | 2,693 | 9.9% |
| $50,000 to $74,999 | 4,270 | 15.7% |
| $75,000 to $99,999 | 4,134 | 15.2% |
| $100,000 to $149,999 | 4,732 | 17.4% |
| $150,000 to $199,999 | 2,638 | 9.7% |
| $200,000+ | 2,883 | 10.6% |
Household Income by Householder Age in Bayonne
The median household income in Bayonne is $80,044, with the highest median household income of $84,694 found in the 45 to 64 years age bracket for the primary householder. A total of 10,848 households (39.9%) fall into this category. Meanwhile, the 65+ years age bracket for the primary householder has the lowest median household income of $52,927, with 6,006 households (22.1%) in this group.
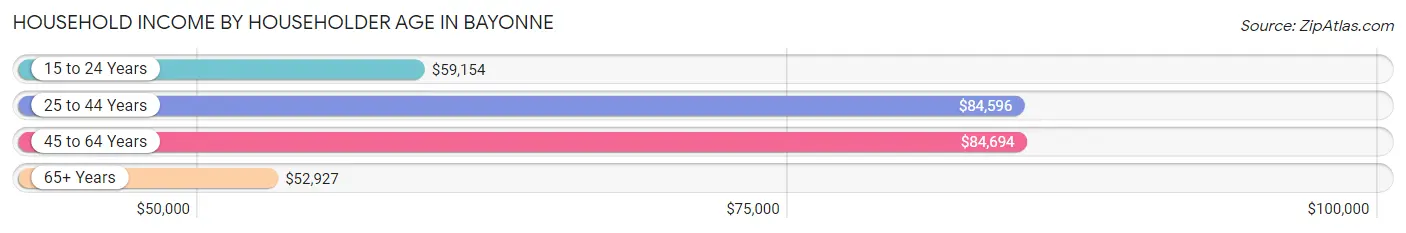
| Income Bracket | # Households | Median Income |
| 15 to 24 Years | 517 (1.9%) | $59,154 |
| 25 to 44 Years | 9,827 (36.1%) | $84,596 |
| 45 to 64 Years | 10,848 (39.9%) | $84,694 |
| 65+ Years | 6,006 (22.1%) | $52,927 |
| Total | 27,198 (100.0%) | $80,044 |
Poverty in Bayonne
Income Below Poverty by Sex and Age in Bayonne
With 11.0% poverty level for males and 12.9% for females among the residents of Bayonne, 5 year old males and 5 year old females are the most vulnerable to poverty, with 224 males (40.5%) and 81 females (30.2%) in their respective age groups living below the poverty level.
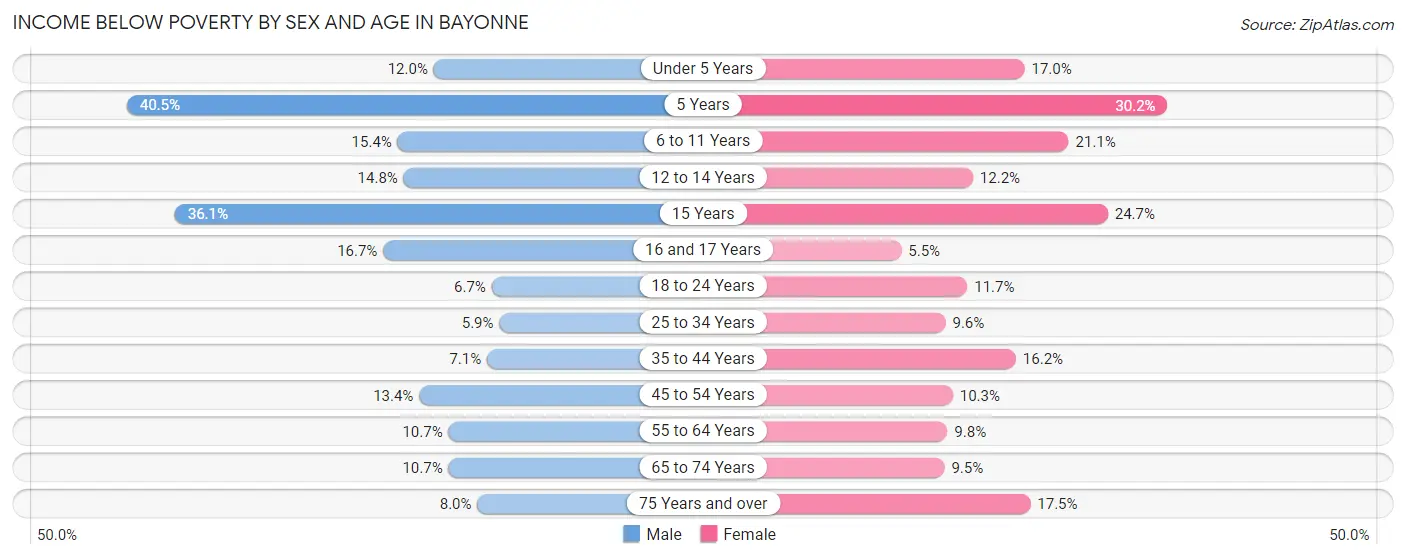
| Age Bracket | Male | Female |
| Under 5 Years | 387 (12.0%) | 313 (17.0%) |
| 5 Years | 224 (40.5%) | 81 (30.2%) |
| 6 to 11 Years | 436 (15.4%) | 503 (21.0%) |
| 12 to 14 Years | 205 (14.8%) | 142 (12.2%) |
| 15 Years | 203 (36.1%) | 79 (24.7%) |
| 16 and 17 Years | 105 (16.7%) | 55 (5.5%) |
| 18 to 24 Years | 138 (6.7%) | 348 (11.7%) |
| 25 to 34 Years | 310 (5.9%) | 496 (9.6%) |
| 35 to 44 Years | 381 (7.1%) | 861 (16.2%) |
| 45 to 54 Years | 571 (13.4%) | 439 (10.3%) |
| 55 to 64 Years | 504 (10.7%) | 478 (9.8%) |
| 65 to 74 Years | 320 (10.7%) | 288 (9.5%) |
| 75 Years and over | 116 (8.0%) | 434 (17.5%) |
| Total | 3,900 (11.0%) | 4,517 (12.9%) |
Income Above Poverty by Sex and Age in Bayonne
According to the poverty statistics in Bayonne, males aged 25 to 34 years and females aged 16 and 17 years are the age groups that are most secure financially, with 94.1% of males and 94.5% of females in these age groups living above the poverty line.
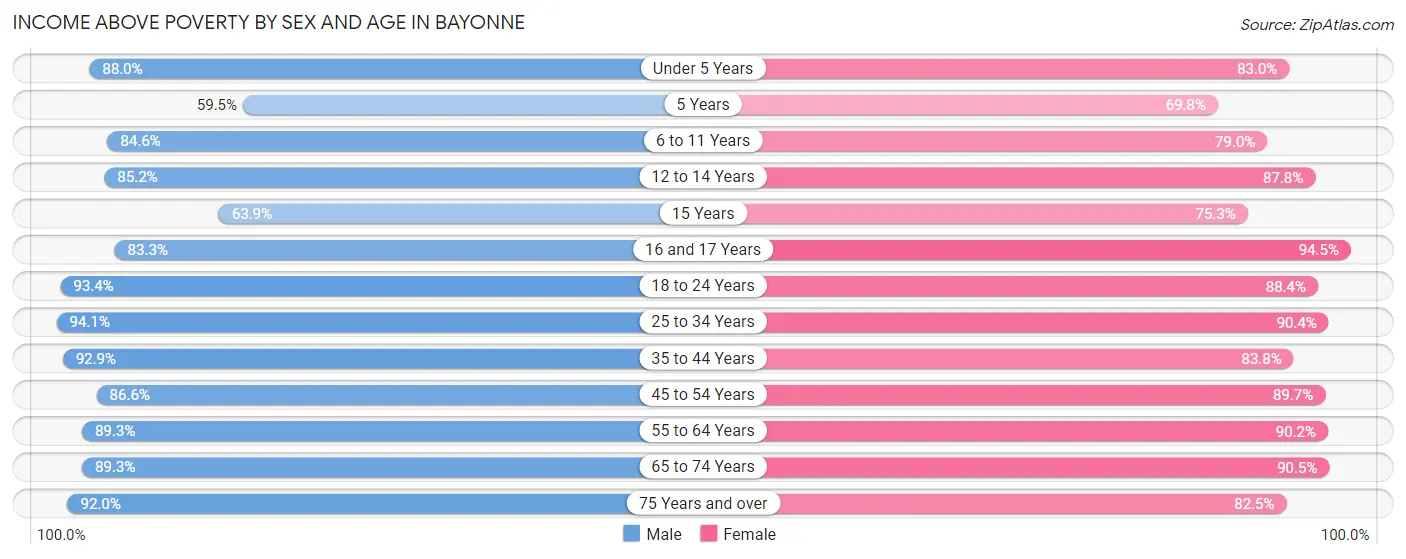
| Age Bracket | Male | Female |
| Under 5 Years | 2,831 (88.0%) | 1,532 (83.0%) |
| 5 Years | 329 (59.5%) | 187 (69.8%) |
| 6 to 11 Years | 2,398 (84.6%) | 1,887 (78.9%) |
| 12 to 14 Years | 1,178 (85.2%) | 1,025 (87.8%) |
| 15 Years | 360 (63.9%) | 241 (75.3%) |
| 16 and 17 Years | 523 (83.3%) | 939 (94.5%) |
| 18 to 24 Years | 1,938 (93.3%) | 2,638 (88.3%) |
| 25 to 34 Years | 4,911 (94.1%) | 4,655 (90.4%) |
| 35 to 44 Years | 5,004 (92.9%) | 4,466 (83.8%) |
| 45 to 54 Years | 3,698 (86.6%) | 3,824 (89.7%) |
| 55 to 64 Years | 4,223 (89.3%) | 4,402 (90.2%) |
| 65 to 74 Years | 2,682 (89.3%) | 2,734 (90.5%) |
| 75 Years and over | 1,338 (92.0%) | 2,046 (82.5%) |
| Total | 31,413 (89.0%) | 30,576 (87.1%) |
Income Below Poverty Among Married-Couple Families in Bayonne
The poverty statistics for married-couple families in Bayonne show that 6.2% or 717 of the total 11,470 families live below the poverty line. Families with 3 or 4 children have the highest poverty rate of 14.3%, comprising of 152 families. On the other hand, families with no children have the lowest poverty rate of 3.3%, which includes 202 families.
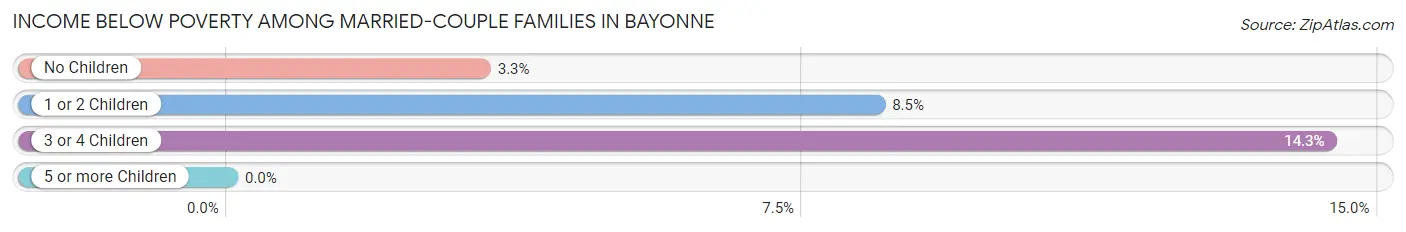
| Children | Above Poverty | Below Poverty |
| No Children | 5,913 (96.7%) | 202 (3.3%) |
| 1 or 2 Children | 3,932 (91.5%) | 363 (8.5%) |
| 3 or 4 Children | 908 (85.7%) | 152 (14.3%) |
| 5 or more Children | 0 (0.0%) | 0 (0.0%) |
| Total | 10,753 (93.8%) | 717 (6.2%) |
Income Below Poverty Among Single-Parent Households in Bayonne
According to the poverty data in Bayonne, 4.7% or 93 single-father households and 16.4% or 682 single-mother households are living below the poverty line. Among single-father households, those with 1 or 2 children have the highest poverty rate, with 86 households (15.0%) experiencing poverty. Likewise, among single-mother households, those with 3 or 4 children have the highest poverty rate, with 120 households (65.6%) falling below the poverty line.
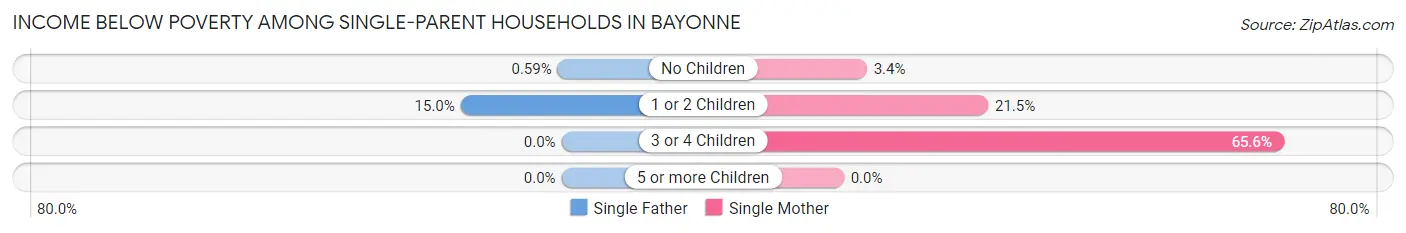
| Children | Single Father | Single Mother |
| No Children | 7 (0.6%) | 54 (3.4%) |
| 1 or 2 Children | 86 (15.0%) | 508 (21.5%) |
| 3 or 4 Children | 0 (0.0%) | 120 (65.6%) |
| 5 or more Children | 0 (0.0%) | 0 (0.0%) |
| Total | 93 (4.7%) | 682 (16.4%) |
Income Below Poverty Among Married-Couple vs Single-Parent Households in Bayonne
The poverty data for Bayonne shows that 717 of the married-couple family households (6.2%) and 775 of the single-parent households (12.7%) are living below the poverty level. Within the married-couple family households, those with 3 or 4 children have the highest poverty rate, with 152 households (14.3%) falling below the poverty line. Among the single-parent households, those with 3 or 4 children have the highest poverty rate, with 120 household (29.8%) living below poverty.
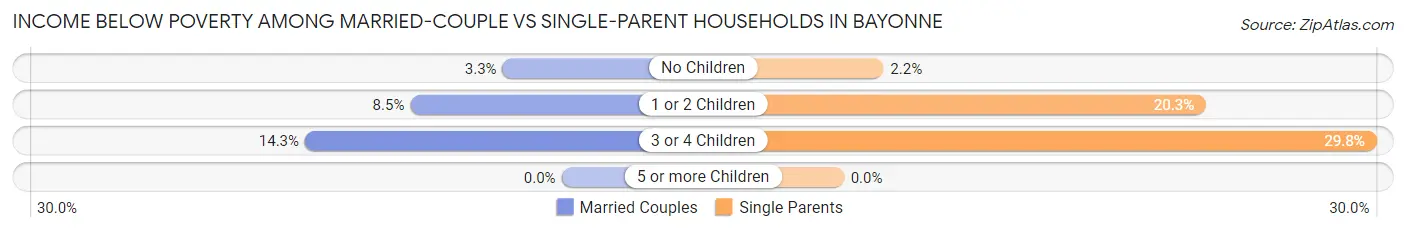
| Children | Married-Couple Families | Single-Parent Households |
| No Children | 202 (3.3%) | 61 (2.2%) |
| 1 or 2 Children | 363 (8.5%) | 594 (20.3%) |
| 3 or 4 Children | 152 (14.3%) | 120 (29.8%) |
| 5 or more Children | 0 (0.0%) | 0 (0.0%) |
| Total | 717 (6.2%) | 775 (12.7%) |
Race in Bayonne
The most populous races in Bayonne are White / Caucasian (38,067 | 54.0%), Hispanic or Latino (24,469 | 34.7%), and Two or more Races (9,988 | 14.2%).
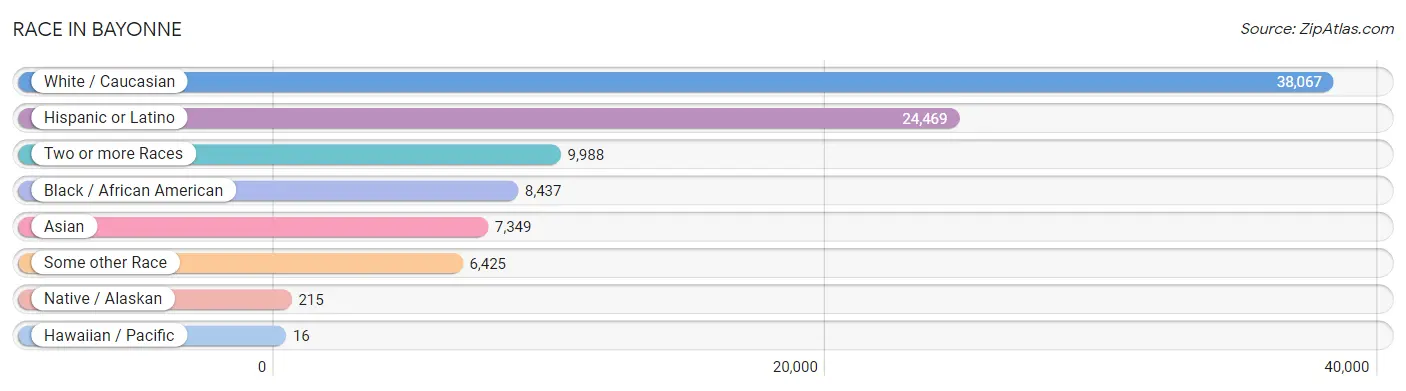
| Race | # Population | % Population |
| Asian | 7,349 | 10.4% |
| Black / African American | 8,437 | 12.0% |
| Hawaiian / Pacific | 16 | 0.0% |
| Hispanic or Latino | 24,469 | 34.7% |
| Native / Alaskan | 215 | 0.3% |
| White / Caucasian | 38,067 | 54.0% |
| Two or more Races | 9,988 | 14.2% |
| Some other Race | 6,425 | 9.1% |
| Total | 70,497 | 100.0% |
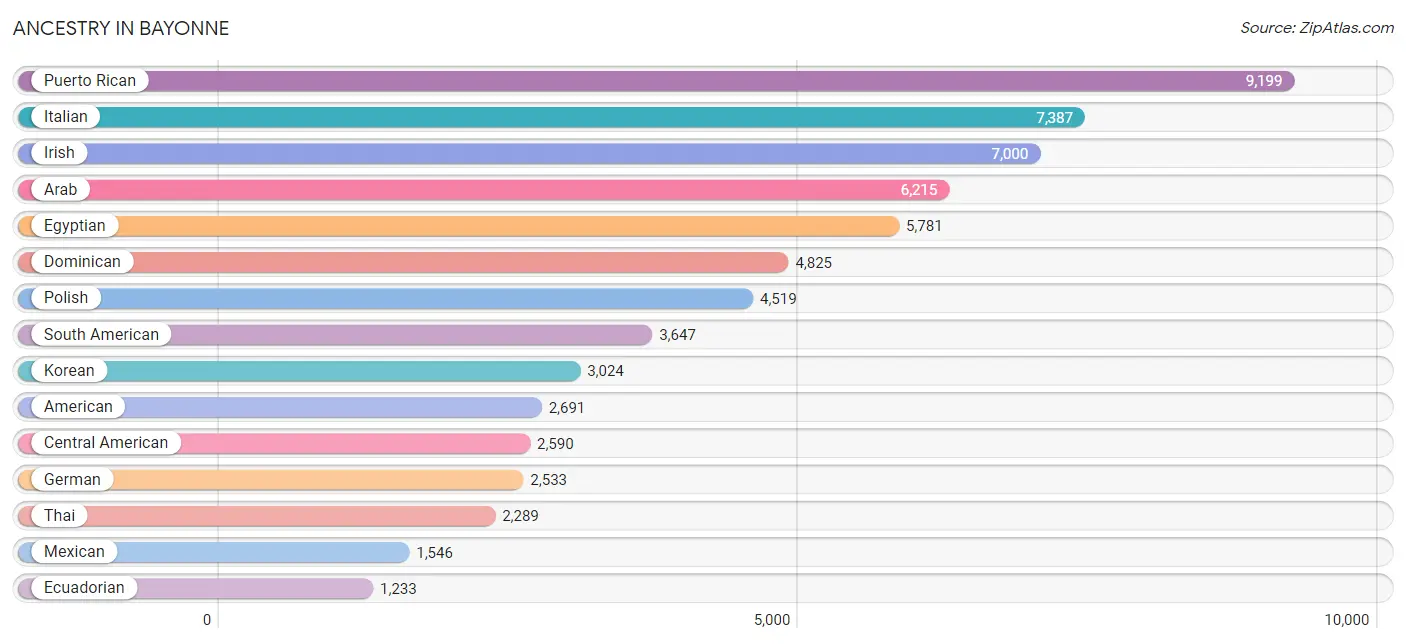
Ancestry in Bayonne
The most populous ancestries reported in Bayonne are Puerto Rican (9,199 | 13.1%), Italian (7,387 | 10.5%), Irish (7,000 | 9.9%), Arab (6,215 | 8.8%), and Egyptian (5,781 | 8.2%), together accounting for 50.5% of all Bayonne residents.
| Ancestry | # Population | % Population |
| Afghan | 26 | 0.0% |
| African | 356 | 0.5% |
| American | 2,691 | 3.8% |
| Arab | 6,215 | 8.8% |
| Argentinean | 119 | 0.2% |
| Armenian | 81 | 0.1% |
| Austrian | 88 | 0.1% |
| Barbadian | 46 | 0.1% |
| Belgian | 54 | 0.1% |
| Belizean | 100 | 0.1% |
| Bermudan | 22 | 0.0% |
| Bhutanese | 32 | 0.1% |
| Blackfeet | 59 | 0.1% |
| Bolivian | 314 | 0.4% |
| Brazilian | 160 | 0.2% |
| British | 74 | 0.1% |
| British West Indian | 28 | 0.0% |
| Burmese | 108 | 0.2% |
| Canadian | 43 | 0.1% |
| Carpatho Rusyn | 88 | 0.1% |
| Central American | 2,590 | 3.7% |
| Central American Indian | 265 | 0.4% |
| Cherokee | 126 | 0.2% |
| Chilean | 189 | 0.3% |
| Colombian | 1,199 | 1.7% |
| Costa Rican | 210 | 0.3% |
| Croatian | 40 | 0.1% |
| Cuban | 601 | 0.9% |
| Czech | 77 | 0.1% |
| Czechoslovakian | 50 | 0.1% |
| Danish | 12 | 0.0% |
| Delaware | 16 | 0.0% |
| Dominican | 4,825 | 6.8% |
| Dutch | 130 | 0.2% |
| Eastern European | 69 | 0.1% |
| Ecuadorian | 1,233 | 1.8% |
| Egyptian | 5,781 | 8.2% |
| English | 953 | 1.3% |
| Ethiopian | 2 | 0.0% |
| European | 346 | 0.5% |
| Filipino | 24 | 0.0% |
| Finnish | 6 | 0.0% |
| French | 226 | 0.3% |
| French Canadian | 53 | 0.1% |
| German | 2,533 | 3.6% |
| Ghanaian | 65 | 0.1% |
| Greek | 323 | 0.5% |
| Guamanian / Chamorro | 16 | 0.0% |
| Guatemalan | 495 | 0.7% |
| Guyanese | 75 | 0.1% |
| Haitian | 473 | 0.7% |
| Honduran | 692 | 1.0% |
| Hungarian | 49 | 0.1% |
| Indian (Asian) | 618 | 0.9% |
| Iranian | 22 | 0.0% |
| Iraqi | 20 | 0.0% |
| Irish | 7,000 | 9.9% |
| Israeli | 74 | 0.1% |
| Italian | 7,387 | 10.5% |
| Jamaican | 204 | 0.3% |
| Korean | 3,024 | 4.3% |
| Laotian | 16 | 0.0% |
| Latvian | 7 | 0.0% |
| Lebanese | 44 | 0.1% |
| Liberian | 52 | 0.1% |
| Lithuanian | 214 | 0.3% |
| Maltese | 31 | 0.0% |
| Mexican | 1,546 | 2.2% |
| Moroccan | 206 | 0.3% |
| Native Hawaiian | 8 | 0.0% |
| Nicaraguan | 194 | 0.3% |
| Nigerian | 169 | 0.2% |
| Northern European | 5 | 0.0% |
| Norwegian | 114 | 0.2% |
| Pakistani | 7 | 0.0% |
| Palestinian | 36 | 0.1% |
| Panamanian | 91 | 0.1% |
| Paraguayan | 16 | 0.0% |
| Pennsylvania German | 9 | 0.0% |
| Peruvian | 258 | 0.4% |
| Polish | 4,519 | 6.4% |
| Portuguese | 109 | 0.2% |
| Puerto Rican | 9,199 | 13.1% |
| Romanian | 84 | 0.1% |
| Russian | 533 | 0.8% |
| Salvadoran | 908 | 1.3% |
| Scotch-Irish | 35 | 0.1% |
| Scottish | 112 | 0.2% |
| Seminole | 10 | 0.0% |
| Senegalese | 149 | 0.2% |
| Serbian | 199 | 0.3% |
| Sioux | 7 | 0.0% |
| Slavic | 191 | 0.3% |
| Slovak | 360 | 0.5% |
| South American | 3,647 | 5.2% |
| South American Indian | 16 | 0.0% |
| Spaniard | 777 | 1.1% |
| Spanish | 266 | 0.4% |
| Sri Lankan | 290 | 0.4% |
| Subsaharan African | 815 | 1.2% |
| Swedish | 96 | 0.1% |
| Swiss | 11 | 0.0% |
| Thai | 2,289 | 3.3% |
| Trinidadian and Tobagonian | 188 | 0.3% |
| Turkish | 29 | 0.0% |
| Ukrainian | 574 | 0.8% |
| Uruguayan | 167 | 0.2% |
| Venezuelan | 152 | 0.2% |
| Vietnamese | 40 | 0.1% |
| Welsh | 31 | 0.0% |
| West Indian | 97 | 0.1% | View All 111 Rows |
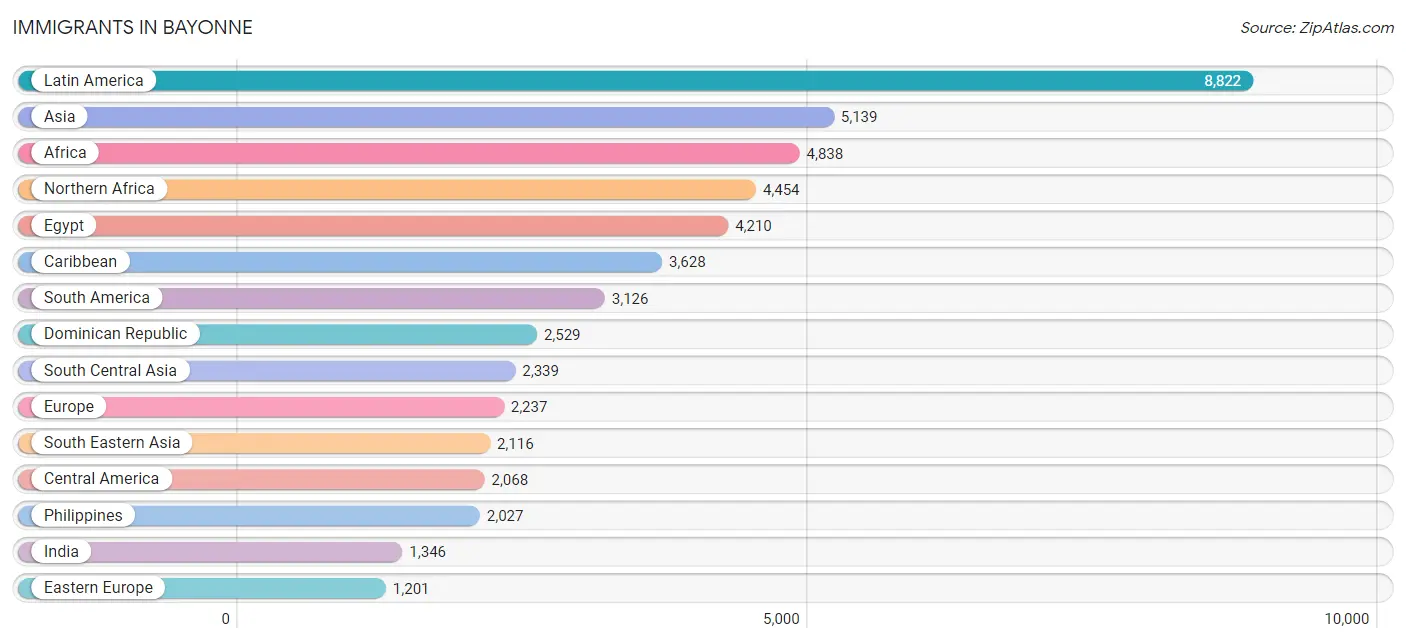
Immigrants in Bayonne
The most numerous immigrant groups reported in Bayonne came from Latin America (8,822 | 12.5%), Asia (5,139 | 7.3%), Africa (4,838 | 6.9%), Northern Africa (4,454 | 6.3%), and Egypt (4,210 | 6.0%), together accounting for 38.9% of all Bayonne residents.
| Immigration Origin | # Population | % Population |
| Afghanistan | 26 | 0.0% |
| Africa | 4,838 | 6.9% |
| Argentina | 65 | 0.1% |
| Asia | 5,139 | 7.3% |
| Bangladesh | 40 | 0.1% |
| Barbados | 34 | 0.1% |
| Belarus | 13 | 0.0% |
| Belgium | 10 | 0.0% |
| Belize | 100 | 0.1% |
| Bolivia | 314 | 0.4% |
| Brazil | 160 | 0.2% |
| Cabo Verde | 9 | 0.0% |
| Cameroon | 89 | 0.1% |
| Canada | 106 | 0.2% |
| Caribbean | 3,628 | 5.1% |
| Central America | 2,068 | 2.9% |
| Chile | 156 | 0.2% |
| China | 337 | 0.5% |
| Colombia | 924 | 1.3% |
| Costa Rica | 119 | 0.2% |
| Croatia | 31 | 0.0% |
| Cuba | 286 | 0.4% |
| Czechoslovakia | 43 | 0.1% |
| Dominican Republic | 2,529 | 3.6% |
| Eastern Africa | 26 | 0.0% |
| Eastern Asia | 416 | 0.6% |
| Eastern Europe | 1,201 | 1.7% |
| Ecuador | 816 | 1.2% |
| Egypt | 4,210 | 6.0% |
| El Salvador | 411 | 0.6% |
| England | 10 | 0.0% |
| Ethiopia | 2 | 0.0% |
| Europe | 2,237 | 3.2% |
| France | 66 | 0.1% |
| Germany | 84 | 0.1% |
| Ghana | 62 | 0.1% |
| Greece | 115 | 0.2% |
| Guatemala | 271 | 0.4% |
| Guyana | 73 | 0.1% |
| Haiti | 340 | 0.5% |
| Honduras | 324 | 0.5% |
| Hong Kong | 26 | 0.0% |
| India | 1,346 | 1.9% |
| Indonesia | 53 | 0.1% |
| Iran | 11 | 0.0% |
| Iraq | 9 | 0.0% |
| Ireland | 16 | 0.0% |
| Israel | 74 | 0.1% |
| Italy | 426 | 0.6% |
| Jamaica | 103 | 0.2% |
| Korea | 79 | 0.1% |
| Kuwait | 19 | 0.0% |
| Latin America | 8,822 | 12.5% |
| Liberia | 52 | 0.1% |
| Malaysia | 15 | 0.0% |
| Mexico | 685 | 1.0% |
| Middle Africa | 89 | 0.1% |
| Morocco | 196 | 0.3% |
| Nicaragua | 93 | 0.1% |
| Nigeria | 53 | 0.1% |
| Northern Africa | 4,454 | 6.3% |
| Northern Europe | 93 | 0.1% |
| Oceania | 41 | 0.1% |
| Pakistan | 866 | 1.2% |
| Panama | 65 | 0.1% |
| Peru | 249 | 0.4% |
| Philippines | 2,027 | 2.9% |
| Poland | 579 | 0.8% |
| Portugal | 16 | 0.0% |
| Romania | 25 | 0.0% |
| Russia | 116 | 0.2% |
| Saudi Arabia | 44 | 0.1% |
| Senegal | 56 | 0.1% |
| Serbia | 59 | 0.1% |
| Sierra Leone | 4 | 0.0% |
| South Africa | 13 | 0.0% |
| South America | 3,126 | 4.4% |
| South Central Asia | 2,339 | 3.3% |
| South Eastern Asia | 2,116 | 3.0% |
| Southern Europe | 783 | 1.1% |
| Spain | 179 | 0.3% |
| Sri Lanka | 13 | 0.0% |
| Sudan | 21 | 0.0% |
| Taiwan | 24 | 0.0% |
| Thailand | 7 | 0.0% |
| Trinidad and Tobago | 215 | 0.3% |
| Ukraine | 335 | 0.5% |
| Uruguay | 98 | 0.1% |
| Uzbekistan | 37 | 0.1% |
| Venezuela | 187 | 0.3% |
| Vietnam | 14 | 0.0% |
| Western Africa | 256 | 0.4% |
| Western Asia | 241 | 0.3% |
| Western Europe | 160 | 0.2% |
| Zimbabwe | 24 | 0.0% | View All 95 Rows |
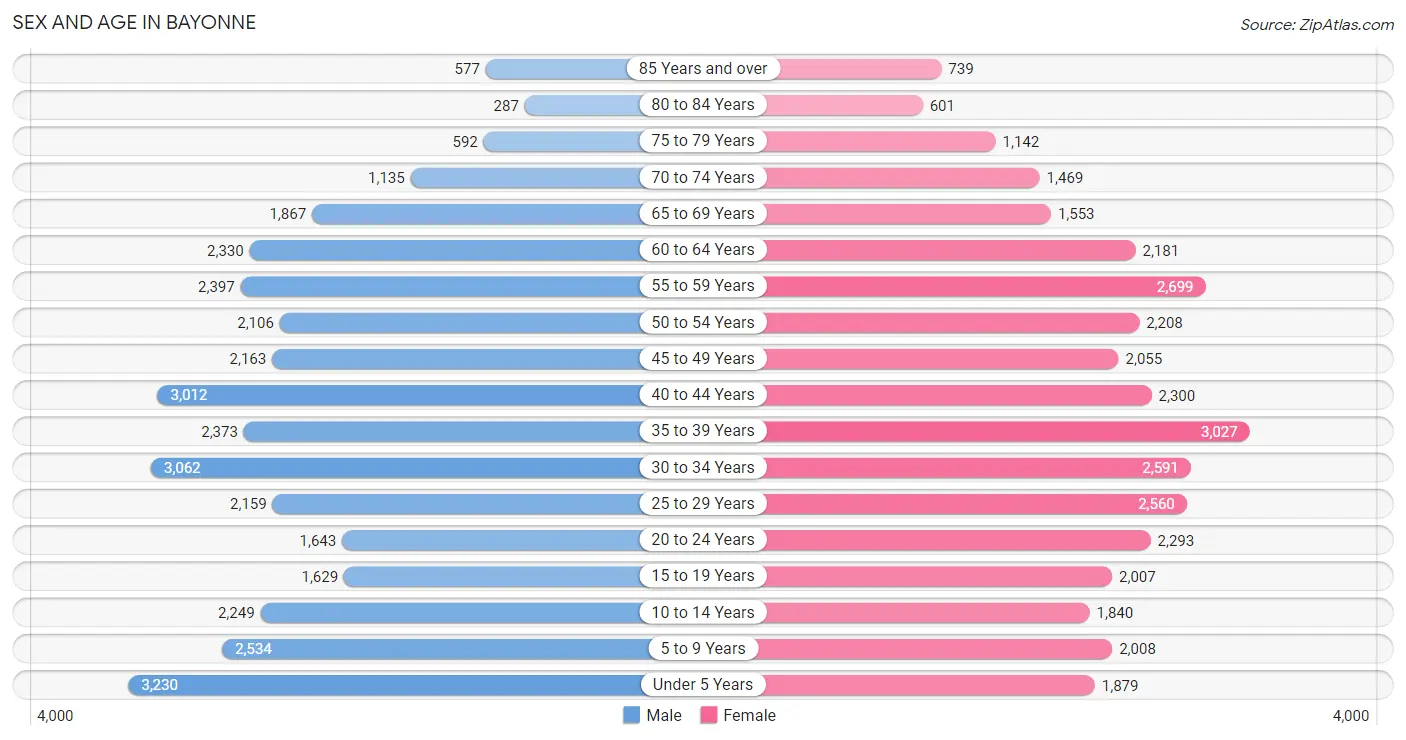
Sex and Age in Bayonne
Sex and Age in Bayonne
The most populous age groups in Bayonne are Under 5 Years (3,230 | 9.1%) for men and 35 to 39 Years (3,027 | 8.6%) for women.
| Age Bracket | Male | Female |
| Under 5 Years | 3,230 (9.1%) | 1,879 (5.3%) |
| 5 to 9 Years | 2,534 (7.2%) | 2,008 (5.7%) |
| 10 to 14 Years | 2,249 (6.4%) | 1,840 (5.2%) |
| 15 to 19 Years | 1,629 (4.6%) | 2,007 (5.7%) |
| 20 to 24 Years | 1,643 (4.6%) | 2,293 (6.5%) |
| 25 to 29 Years | 2,159 (6.1%) | 2,560 (7.3%) |
| 30 to 34 Years | 3,062 (8.7%) | 2,591 (7.4%) |
| 35 to 39 Years | 2,373 (6.7%) | 3,027 (8.6%) |
| 40 to 44 Years | 3,012 (8.5%) | 2,300 (6.5%) |
| 45 to 49 Years | 2,163 (6.1%) | 2,055 (5.9%) |
| 50 to 54 Years | 2,106 (6.0%) | 2,208 (6.3%) |
| 55 to 59 Years | 2,397 (6.8%) | 2,699 (7.7%) |
| 60 to 64 Years | 2,330 (6.6%) | 2,181 (6.2%) |
| 65 to 69 Years | 1,867 (5.3%) | 1,553 (4.4%) |
| 70 to 74 Years | 1,135 (3.2%) | 1,469 (4.2%) |
| 75 to 79 Years | 592 (1.7%) | 1,142 (3.3%) |
| 80 to 84 Years | 287 (0.8%) | 601 (1.7%) |
| 85 Years and over | 577 (1.6%) | 739 (2.1%) |
| Total | 35,345 (100.0%) | 35,152 (100.0%) |
Families and Households in Bayonne
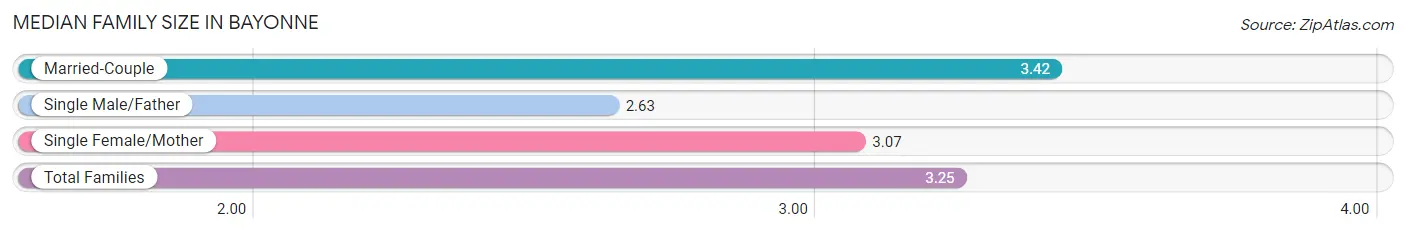
Median Family Size in Bayonne
The median family size in Bayonne is 3.25 persons per family, with married-couple families (11,470 | 65.2%) accounting for the largest median family size of 3.42 persons per family. On the other hand, single male/father families (1,970 | 11.2%) represent the smallest median family size with 2.63 persons per family.
| Family Type | # Families | Family Size |
| Married-Couple | 11,470 (65.2%) | 3.42 |
| Single Male/Father | 1,970 (11.2%) | 2.63 |
| Single Female/Mother | 4,148 (23.6%) | 3.07 |
| Total Families | 17,588 (100.0%) | 3.25 |
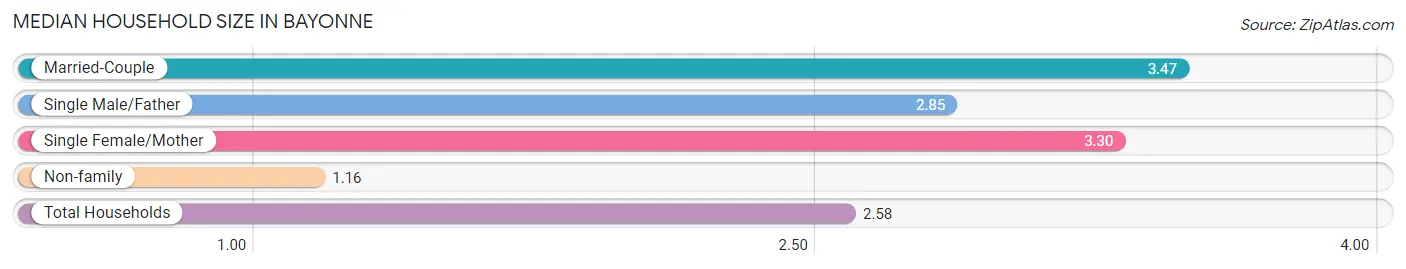
Median Household Size in Bayonne
The median household size in Bayonne is 2.58 persons per household, with married-couple households (11,470 | 42.2%) accounting for the largest median household size of 3.47 persons per household. non-family households (9,610 | 35.3%) represent the smallest median household size with 1.16 persons per household.
| Household Type | # Households | Household Size |
| Married-Couple | 11,470 (42.2%) | 3.47 |
| Single Male/Father | 1,970 (7.2%) | 2.85 |
| Single Female/Mother | 4,148 (15.2%) | 3.30 |
| Non-family | 9,610 (35.3%) | 1.16 |
| Total Households | 27,198 (100.0%) | 2.58 |
Household Size by Marriage Status in Bayonne
Out of a total of 27,198 households in Bayonne, 17,588 (64.7%) are family households, while 9,610 (35.3%) are nonfamily households. The most numerous type of family households are 2-person households, comprising 5,741, and the most common type of nonfamily households are 1-person households, comprising 8,308.
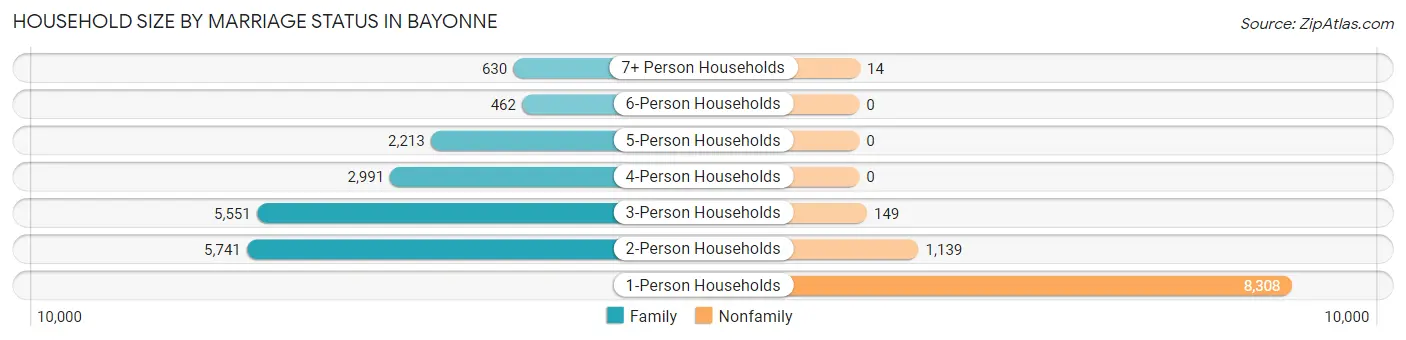
| Household Size | Family Households | Nonfamily Households |
| 1-Person Households | - | 8,308 (30.5%) |
| 2-Person Households | 5,741 (21.1%) | 1,139 (4.2%) |
| 3-Person Households | 5,551 (20.4%) | 149 (0.5%) |
| 4-Person Households | 2,991 (11.0%) | 0 (0.0%) |
| 5-Person Households | 2,213 (8.1%) | 0 (0.0%) |
| 6-Person Households | 462 (1.7%) | 0 (0.0%) |
| 7+ Person Households | 630 (2.3%) | 14 (0.1%) |
| Total | 17,588 (64.7%) | 9,610 (35.3%) |
Female Fertility in Bayonne
Fertility by Age in Bayonne
Average fertility rate in Bayonne is 59.0 births per 1,000 women. Women in the age bracket of 20 to 34 years have the highest fertility rate with 73.0 births per 1,000 women. Women in the age bracket of 20 to 34 years acount for 53.6% of all women with births.
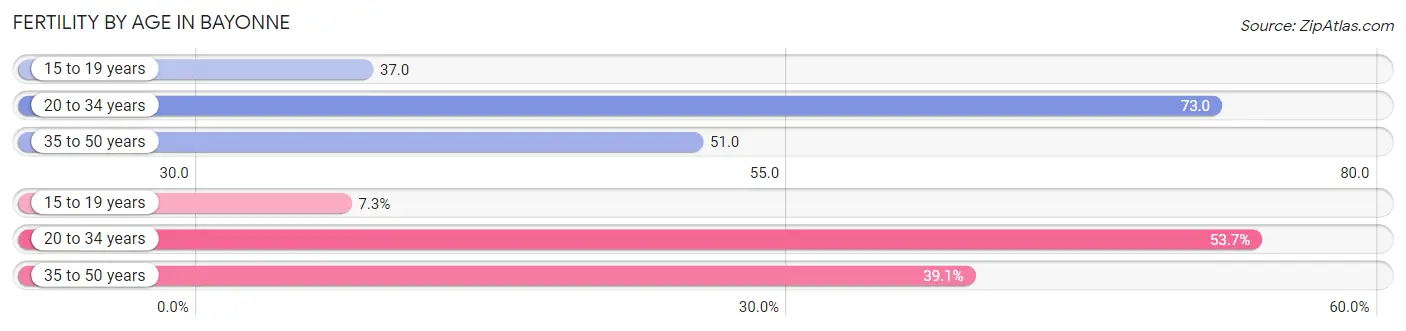
| Age Bracket | Women with Births | Births / 1,000 Women |
| 15 to 19 years | 74 (7.3%) | 37.0 |
| 20 to 34 years | 544 (53.6%) | 73.0 |
| 35 to 50 years | 396 (39.1%) | 51.0 |
| Total | 1,014 (100.0%) | 59.0 |
Fertility by Age by Marriage Status in Bayonne
58.3% of women with births (1,014) in Bayonne are married. The highest percentage of unmarried women with births falls into 15 to 19 years age bracket with 100.0% of them unmarried at the time of birth, while the lowest percentage of unmarried women with births belong to 35 to 50 years age bracket with 26.0% of them unmarried.
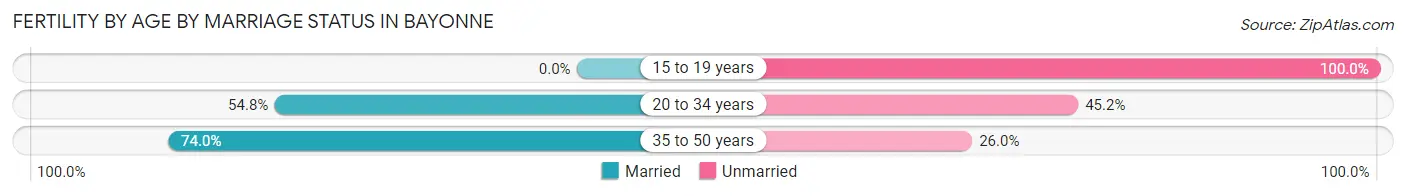
| Age Bracket | Married | Unmarried |
| 15 to 19 years | 0 (0.0%) | 74 (100.0%) |
| 20 to 34 years | 298 (54.8%) | 246 (45.2%) |
| 35 to 50 years | 293 (74.0%) | 103 (26.0%) |
| Total | 591 (58.3%) | 423 (41.7%) |
Fertility by Education in Bayonne
Average fertility rate in Bayonne is 59.0 births per 1,000 women. Women with the education attainment of bachelor's degree have the highest fertility rate of 90.0 births per 1,000 women, while women with the education attainment of high school diploma have the lowest fertility at 27.0 births per 1,000 women. Women with the education attainment of bachelor's degree represent 43.0% of all women with births.
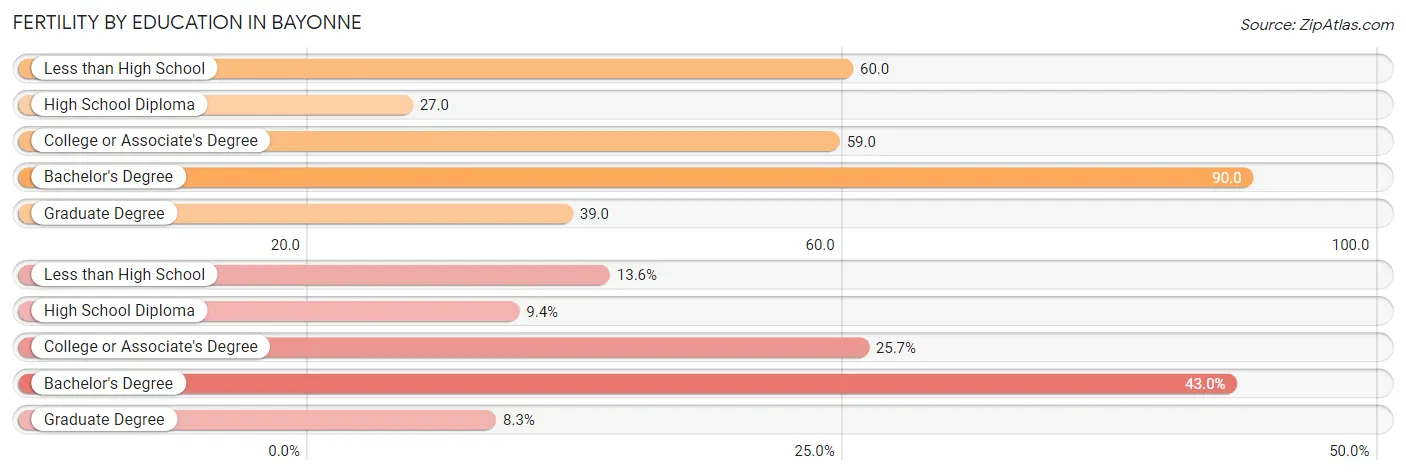
| Educational Attainment | Women with Births | Births / 1,000 Women |
| Less than High School | 138 (13.6%) | 60.0 |
| High School Diploma | 95 (9.4%) | 27.0 |
| College or Associate's Degree | 261 (25.7%) | 59.0 |
| Bachelor's Degree | 436 (43.0%) | 90.0 |
| Graduate Degree | 84 (8.3%) | 39.0 |
| Total | 1,014 (100.0%) | 59.0 |
Fertility by Education by Marriage Status in Bayonne
41.7% of women with births in Bayonne are unmarried. Women with the educational attainment of high school diploma are most likely to be married with 100.0% of them married at childbirth, while women with the educational attainment of less than high school are least likely to be married with 100.0% of them unmarried at childbirth.
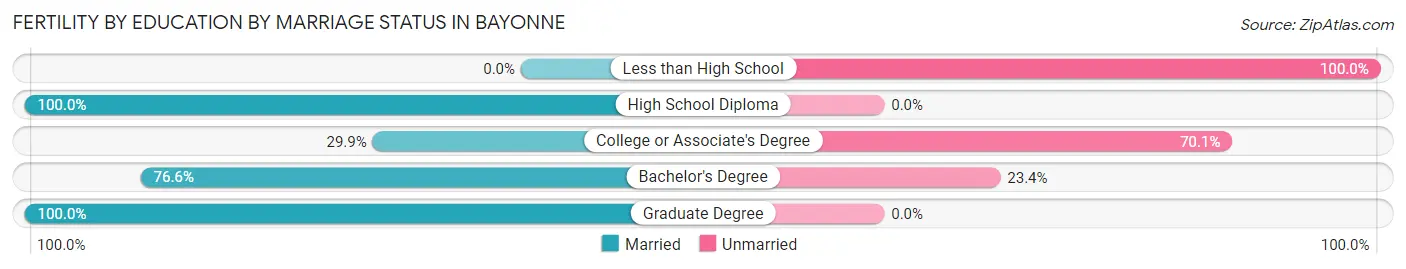
| Educational Attainment | Married | Unmarried |
| Less than High School | 0 (0.0%) | 138 (100.0%) |
| High School Diploma | 95 (100.0%) | 0 (0.0%) |
| College or Associate's Degree | 78 (29.9%) | 183 (70.1%) |
| Bachelor's Degree | 334 (76.6%) | 102 (23.4%) |
| Graduate Degree | 84 (100.0%) | 0 (0.0%) |
| Total | 591 (58.3%) | 423 (41.7%) |
Employment Characteristics in Bayonne
Employment by Class of Employer in Bayonne
Among the 33,735 employed individuals in Bayonne, private company employees (24,347 | 72.2%), local government employees (3,556 | 10.5%), and not-for-profit organizations (2,089 | 6.2%) make up the most common classes of employment.
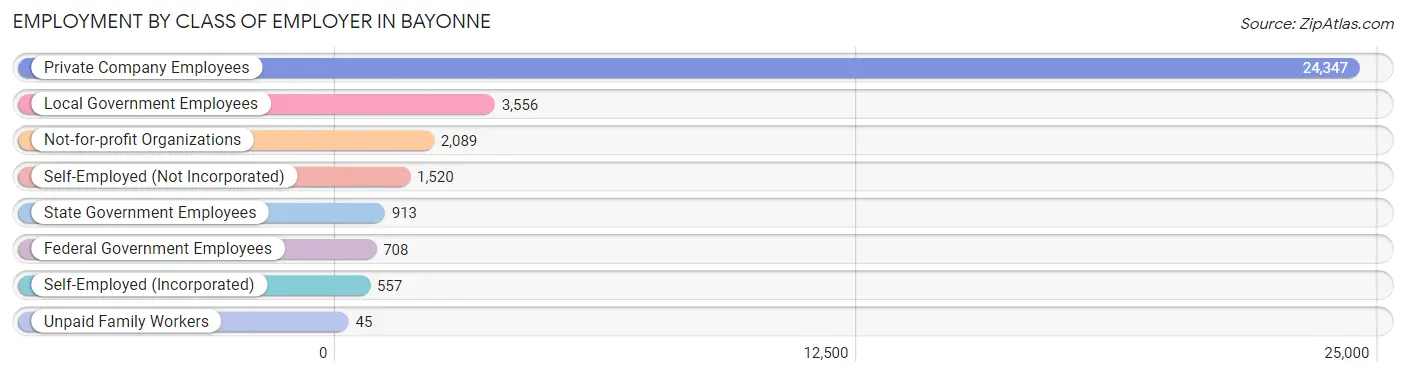
| Employer Class | # Employees | % Employees |
| Private Company Employees | 24,347 | 72.2% |
| Self-Employed (Incorporated) | 557 | 1.7% |
| Self-Employed (Not Incorporated) | 1,520 | 4.5% |
| Not-for-profit Organizations | 2,089 | 6.2% |
| Local Government Employees | 3,556 | 10.5% |
| State Government Employees | 913 | 2.7% |
| Federal Government Employees | 708 | 2.1% |
| Unpaid Family Workers | 45 | 0.1% |
| Total | 33,735 | 100.0% |
Employment Status by Age in Bayonne
According to the labor force statistics for Bayonne, out of the total population over 16 years of age (55,874), 65.5% or 36,597 individuals are in the labor force, with 6.0% or 2,196 of them unemployed. The age group with the highest labor force participation rate is 25 to 29 years, with 86.5% or 4,082 individuals in the labor force. Within the labor force, the 16 to 19 years age range has the highest percentage of unemployed individuals, with 20.3% or 153 of them being unemployed.
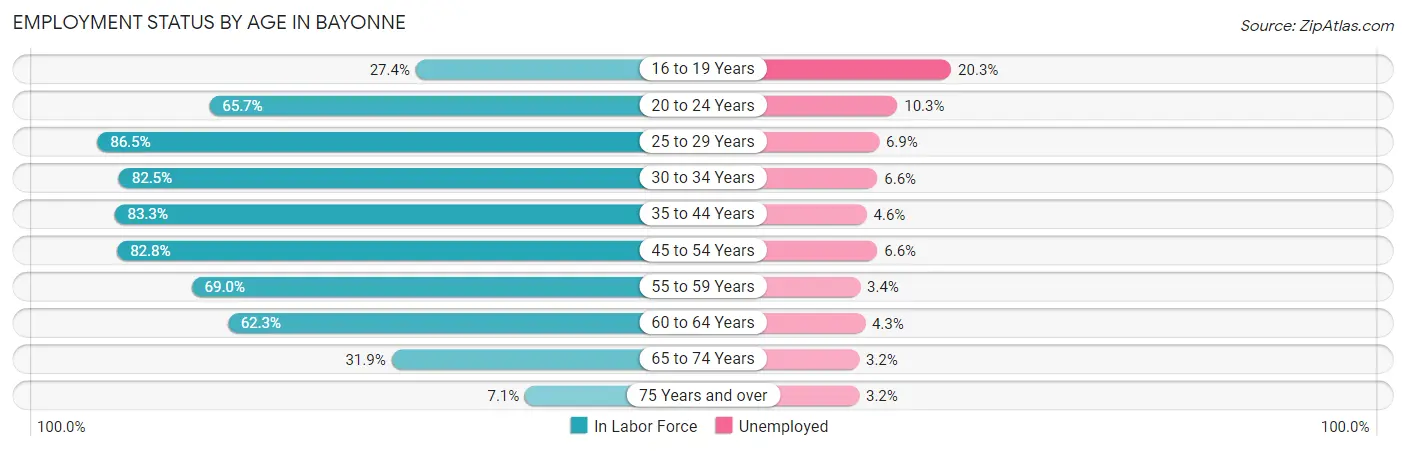
| Age Bracket | In Labor Force | Unemployed |
| 16 to 19 Years | 754 (27.4%) | 153 (20.3%) |
| 20 to 24 Years | 2,586 (65.7%) | 266 (10.3%) |
| 25 to 29 Years | 4,082 (86.5%) | 282 (6.9%) |
| 30 to 34 Years | 4,664 (82.5%) | 308 (6.6%) |
| 35 to 44 Years | 8,923 (83.3%) | 410 (4.6%) |
| 45 to 54 Years | 7,064 (82.8%) | 466 (6.6%) |
| 55 to 59 Years | 3,516 (69.0%) | 120 (3.4%) |
| 60 to 64 Years | 2,810 (62.3%) | 121 (4.3%) |
| 65 to 74 Years | 1,922 (31.9%) | 62 (3.2%) |
| 75 Years and over | 280 (7.1%) | 9 (3.2%) |
| Total | 36,597 (65.5%) | 2,196 (6.0%) |
Employment Status by Educational Attainment in Bayonne
According to labor force statistics for Bayonne, 79.2% of individuals (31,065) out of the total population between 25 and 64 years of age (39,223) are in the labor force, with 5.5% or 1,709 of them being unemployed. The group with the highest labor force participation rate are those with the educational attainment of bachelor's degree or higher, with 87.1% or 14,271 individuals in the labor force. Within the labor force, individuals with high school diploma education have the highest percentage of unemployment, with 5.7% or 434 of them being unemployed.
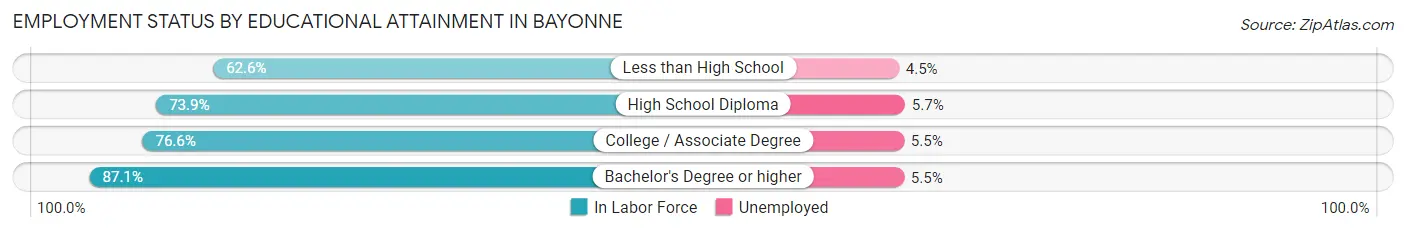
| Educational Attainment | In Labor Force | Unemployed |
| Less than High School | 1,961 (62.6%) | 141 (4.5%) |
| High School Diploma | 7,607 (73.9%) | 587 (5.7%) |
| College / Associate Degree | 7,210 (76.6%) | 518 (5.5%) |
| Bachelor's Degree or higher | 14,271 (87.1%) | 901 (5.5%) |
| Total | 31,065 (79.2%) | 2,157 (5.5%) |
Employment Occupations by Sex in Bayonne
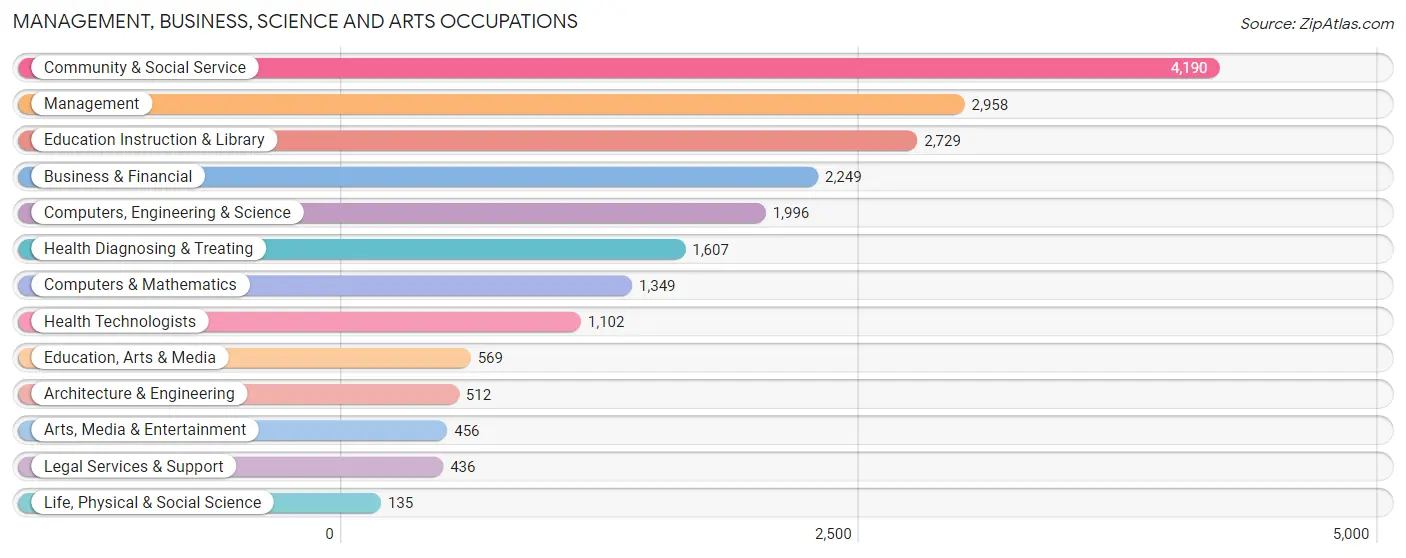
Management, Business, Science and Arts Occupations
The most common Management, Business, Science and Arts occupations in Bayonne are Community & Social Service (4,190 | 12.2%), Management (2,958 | 8.6%), Education Instruction & Library (2,729 | 8.0%), Business & Financial (2,249 | 6.6%), and Computers, Engineering & Science (1,996 | 5.8%).
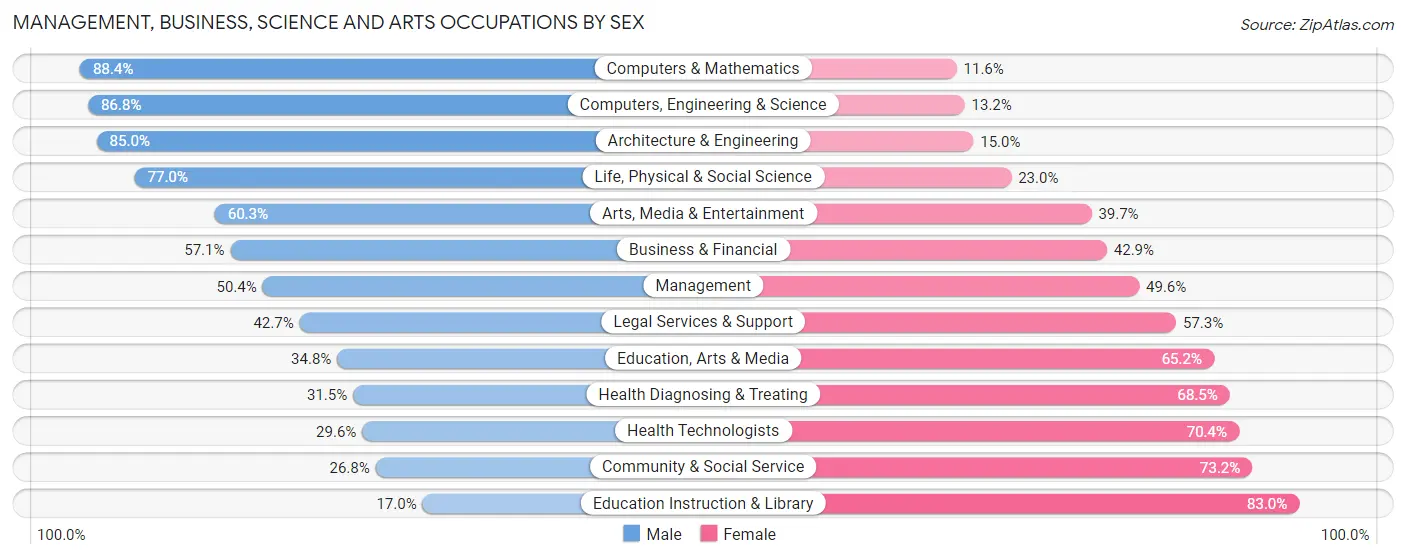
Management, Business, Science and Arts Occupations by Sex
Within the Management, Business, Science and Arts occupations in Bayonne, the most male-oriented occupations are Computers & Mathematics (88.4%), Computers, Engineering & Science (86.8%), and Architecture & Engineering (85.0%), while the most female-oriented occupations are Education Instruction & Library (83.0%), Community & Social Service (73.2%), and Health Technologists (70.4%).
| Occupation | Male | Female |
| Management | 1,490 (50.4%) | 1,468 (49.6%) |
| Business & Financial | 1,284 (57.1%) | 965 (42.9%) |
| Computers, Engineering & Science | 1,732 (86.8%) | 264 (13.2%) |
| Computers & Mathematics | 1,193 (88.4%) | 156 (11.6%) |
| Architecture & Engineering | 435 (85.0%) | 77 (15.0%) |
| Life, Physical & Social Science | 104 (77.0%) | 31 (23.0%) |
| Community & Social Service | 1,123 (26.8%) | 3,067 (73.2%) |
| Education, Arts & Media | 198 (34.8%) | 371 (65.2%) |
| Legal Services & Support | 186 (42.7%) | 250 (57.3%) |
| Education Instruction & Library | 464 (17.0%) | 2,265 (83.0%) |
| Arts, Media & Entertainment | 275 (60.3%) | 181 (39.7%) |
| Health Diagnosing & Treating | 506 (31.5%) | 1,101 (68.5%) |
| Health Technologists | 326 (29.6%) | 776 (70.4%) |
| Total (Category) | 6,135 (47.2%) | 6,865 (52.8%) |
| Total (Overall) | 18,487 (54.0%) | 15,775 (46.0%) |
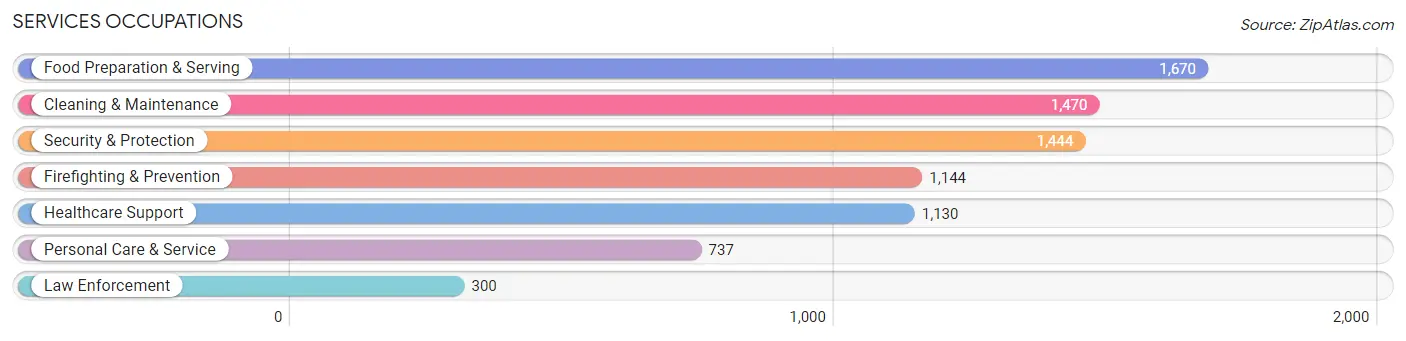
Services Occupations
The most common Services occupations in Bayonne are Food Preparation & Serving (1,670 | 4.9%), Cleaning & Maintenance (1,470 | 4.3%), Security & Protection (1,444 | 4.2%), Firefighting & Prevention (1,144 | 3.3%), and Healthcare Support (1,130 | 3.3%).
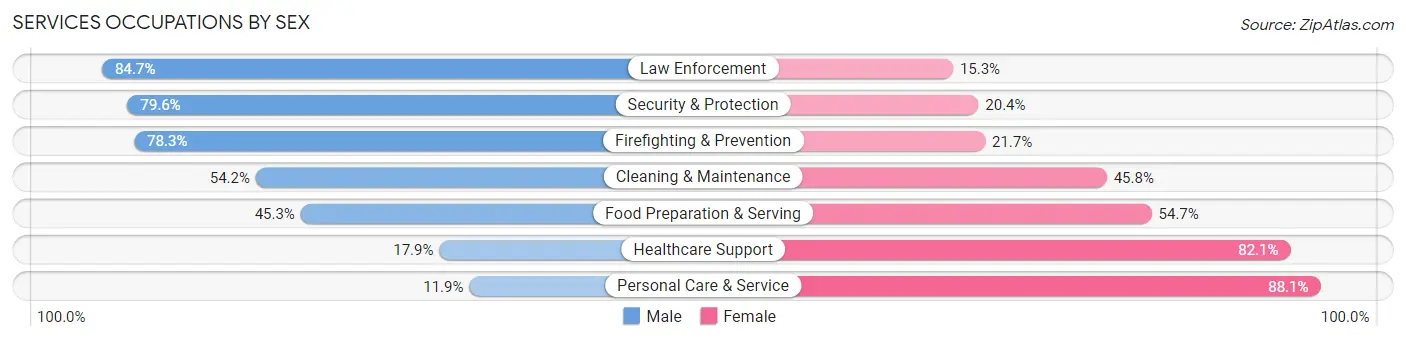
Services Occupations by Sex
Within the Services occupations in Bayonne, the most male-oriented occupations are Law Enforcement (84.7%), Security & Protection (79.6%), and Firefighting & Prevention (78.3%), while the most female-oriented occupations are Personal Care & Service (88.1%), Healthcare Support (82.1%), and Food Preparation & Serving (54.7%).
| Occupation | Male | Female |
| Healthcare Support | 202 (17.9%) | 928 (82.1%) |
| Security & Protection | 1,150 (79.6%) | 294 (20.4%) |
| Firefighting & Prevention | 896 (78.3%) | 248 (21.7%) |
| Law Enforcement | 254 (84.7%) | 46 (15.3%) |
| Food Preparation & Serving | 757 (45.3%) | 913 (54.7%) |
| Cleaning & Maintenance | 797 (54.2%) | 673 (45.8%) |
| Personal Care & Service | 88 (11.9%) | 649 (88.1%) |
| Total (Category) | 2,994 (46.4%) | 3,457 (53.6%) |
| Total (Overall) | 18,487 (54.0%) | 15,775 (46.0%) |
Sales and Office Occupations
The most common Sales and Office occupations in Bayonne are Office & Administration (4,565 | 13.3%), and Sales & Related (3,130 | 9.1%).

Sales and Office Occupations by Sex
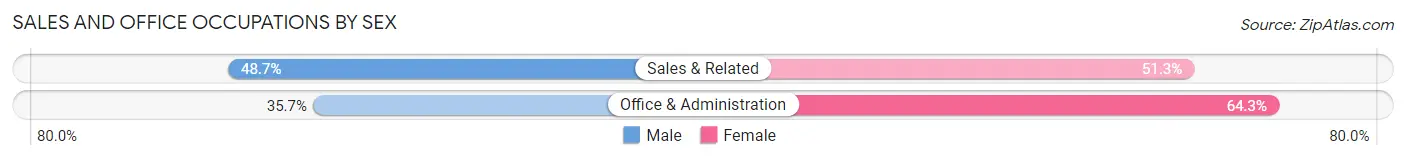
| Occupation | Male | Female |
| Sales & Related | 1,524 (48.7%) | 1,606 (51.3%) |
| Office & Administration | 1,628 (35.7%) | 2,937 (64.3%) |
| Total (Category) | 3,152 (41.0%) | 4,543 (59.0%) |
| Total (Overall) | 18,487 (54.0%) | 15,775 (46.0%) |
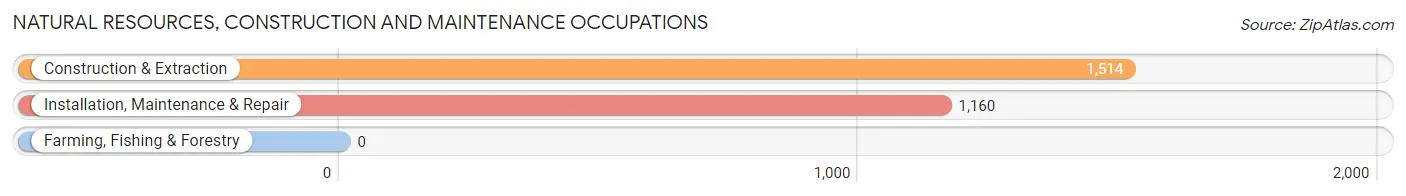
Natural Resources, Construction and Maintenance Occupations
The most common Natural Resources, Construction and Maintenance occupations in Bayonne are Construction & Extraction (1,514 | 4.4%), and Installation, Maintenance & Repair (1,160 | 3.4%).
Natural Resources, Construction and Maintenance Occupations by Sex
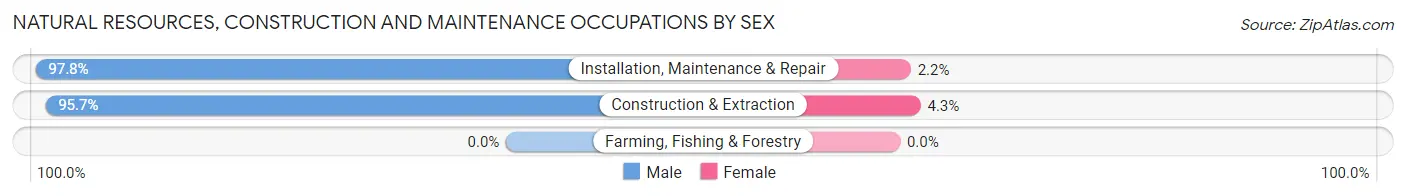
| Occupation | Male | Female |
| Farming, Fishing & Forestry | 0 (0.0%) | 0 (0.0%) |
| Construction & Extraction | 1,449 (95.7%) | 65 (4.3%) |
| Installation, Maintenance & Repair | 1,134 (97.8%) | 26 (2.2%) |
| Total (Category) | 2,583 (96.6%) | 91 (3.4%) |
| Total (Overall) | 18,487 (54.0%) | 15,775 (46.0%) |
Production, Transportation and Moving Occupations
The most common Production, Transportation and Moving occupations in Bayonne are Transportation (1,920 | 5.6%), Material Moving (1,438 | 4.2%), and Production (1,084 | 3.2%).
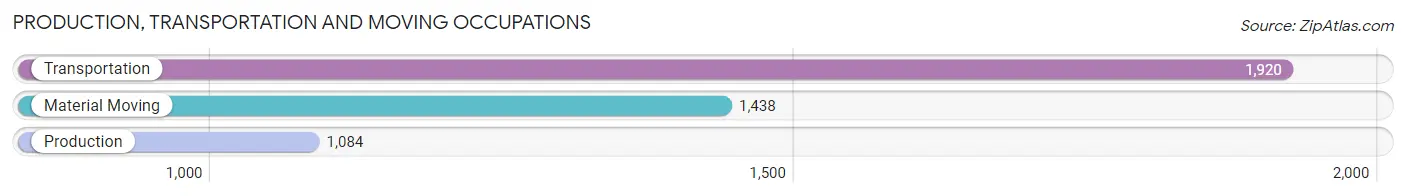
Production, Transportation and Moving Occupations by Sex
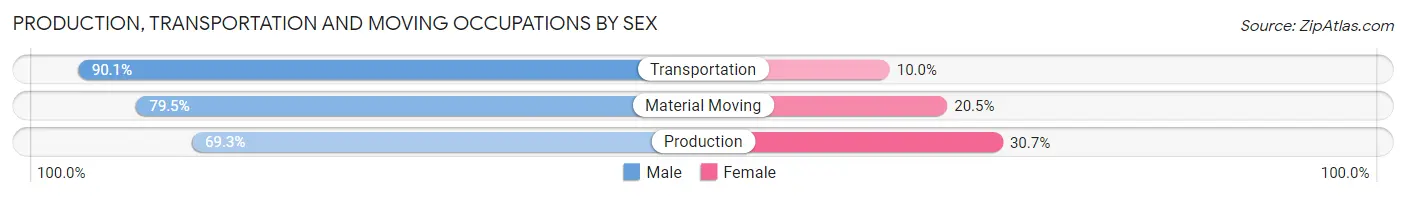
| Occupation | Male | Female |
| Production | 751 (69.3%) | 333 (30.7%) |
| Transportation | 1,729 (90.0%) | 191 (10.0%) |
| Material Moving | 1,143 (79.5%) | 295 (20.5%) |
| Total (Category) | 3,623 (81.6%) | 819 (18.4%) |
| Total (Overall) | 18,487 (54.0%) | 15,775 (46.0%) |
Employment Industries by Sex in Bayonne
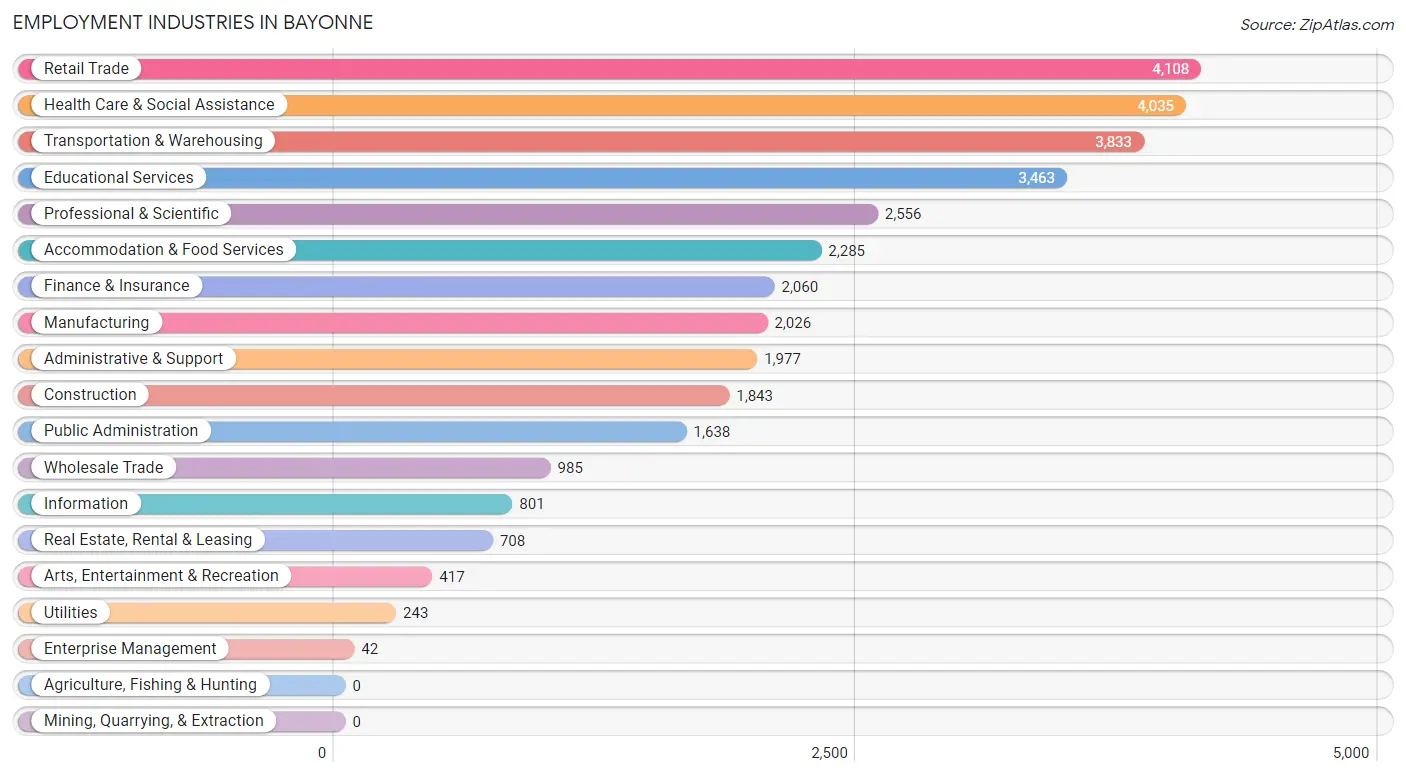
Employment Industries in Bayonne
The major employment industries in Bayonne include Retail Trade (4,108 | 12.0%), Health Care & Social Assistance (4,035 | 11.8%), Transportation & Warehousing (3,833 | 11.2%), Educational Services (3,463 | 10.1%), and Professional & Scientific (2,556 | 7.5%).
Employment Industries by Sex in Bayonne
The Bayonne industries that see more men than women are Utilities (87.2%), Construction (85.4%), and Transportation & Warehousing (81.1%), whereas the industries that tend to have a higher number of women are Enterprise Management (100.0%), Educational Services (75.9%), and Health Care & Social Assistance (74.6%).
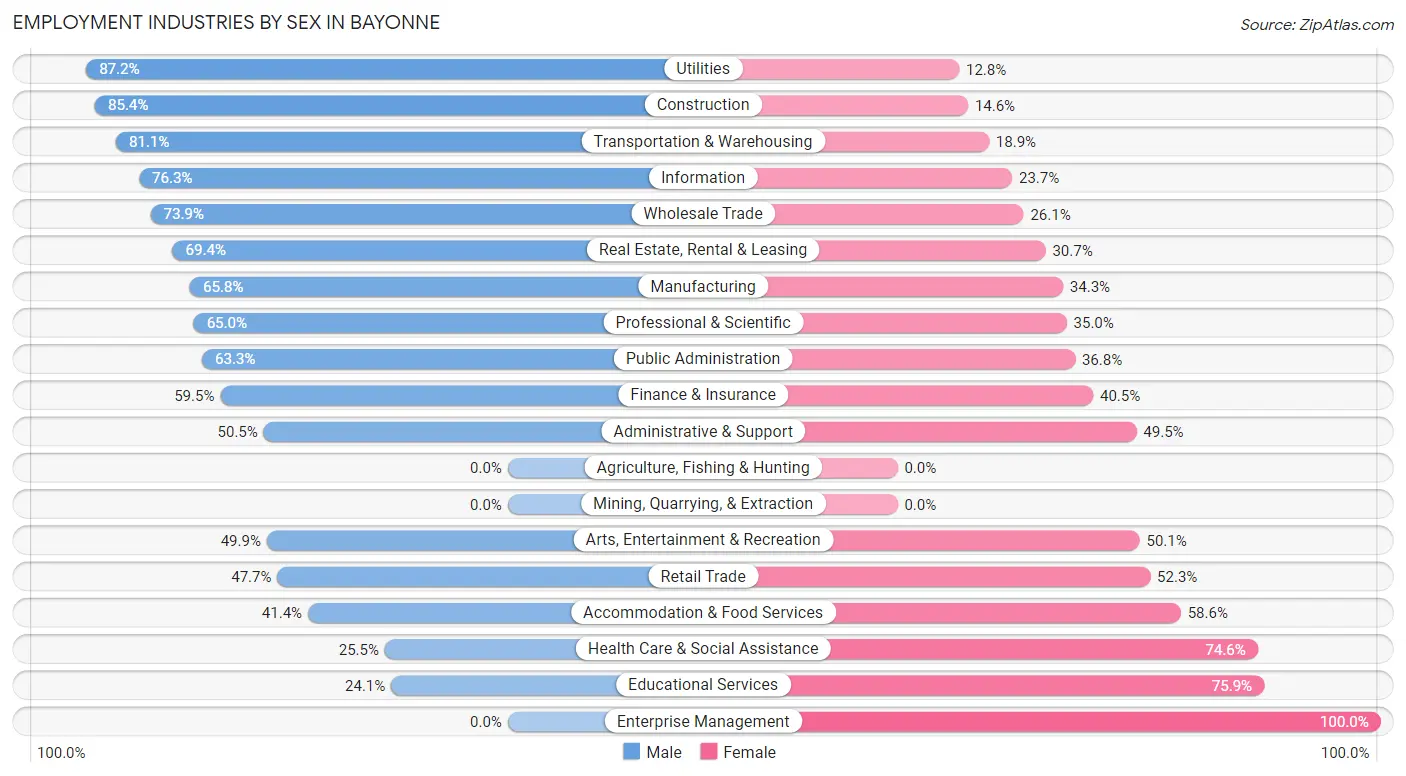
| Industry | Male | Female |
| Agriculture, Fishing & Hunting | 0 (0.0%) | 0 (0.0%) |
| Mining, Quarrying, & Extraction | 0 (0.0%) | 0 (0.0%) |
| Construction | 1,574 (85.4%) | 269 (14.6%) |
| Manufacturing | 1,332 (65.7%) | 694 (34.3%) |
| Wholesale Trade | 728 (73.9%) | 257 (26.1%) |
| Retail Trade | 1,959 (47.7%) | 2,149 (52.3%) |
| Transportation & Warehousing | 3,107 (81.1%) | 726 (18.9%) |
| Utilities | 212 (87.2%) | 31 (12.8%) |
| Information | 611 (76.3%) | 190 (23.7%) |
| Finance & Insurance | 1,226 (59.5%) | 834 (40.5%) |
| Real Estate, Rental & Leasing | 491 (69.4%) | 217 (30.6%) |
| Professional & Scientific | 1,661 (65.0%) | 895 (35.0%) |
| Enterprise Management | 0 (0.0%) | 42 (100.0%) |
| Administrative & Support | 999 (50.5%) | 978 (49.5%) |
| Educational Services | 836 (24.1%) | 2,627 (75.9%) |
| Health Care & Social Assistance | 1,027 (25.5%) | 3,008 (74.6%) |
| Arts, Entertainment & Recreation | 208 (49.9%) | 209 (50.1%) |
| Accommodation & Food Services | 945 (41.4%) | 1,340 (58.6%) |
| Public Administration | 1,036 (63.2%) | 602 (36.7%) |
| Total | 18,487 (54.0%) | 15,775 (46.0%) |
Education in Bayonne
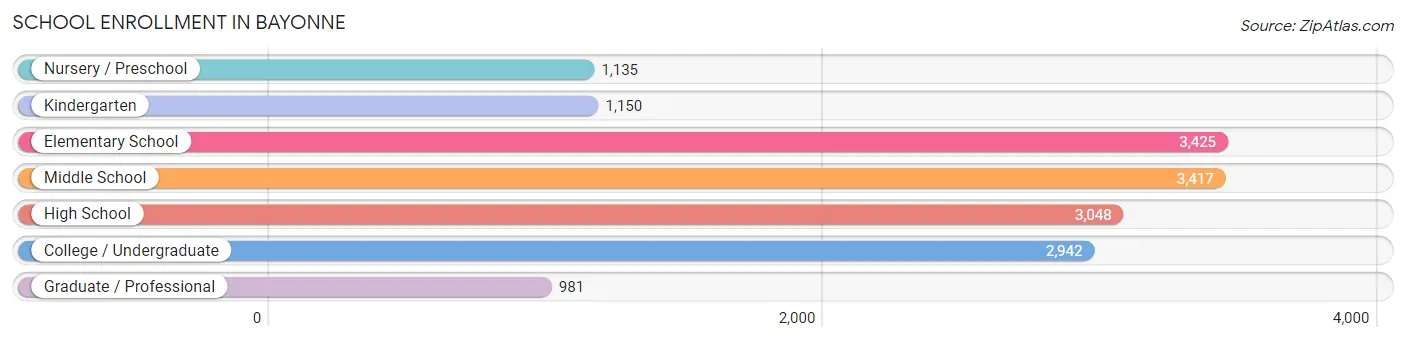
School Enrollment in Bayonne
The most common levels of schooling among the 16,098 students in Bayonne are elementary school (3,425 | 21.3%), middle school (3,417 | 21.2%), and high school (3,048 | 18.9%).
| School Level | # Students | % Students |
| Nursery / Preschool | 1,135 | 7.0% |
| Kindergarten | 1,150 | 7.1% |
| Elementary School | 3,425 | 21.3% |
| Middle School | 3,417 | 21.2% |
| High School | 3,048 | 18.9% |
| College / Undergraduate | 2,942 | 18.3% |
| Graduate / Professional | 981 | 6.1% |
| Total | 16,098 | 100.0% |
School Enrollment by Age by Funding Source in Bayonne
Out of a total of 16,098 students who are enrolled in schools in Bayonne, 1,803 (11.2%) attend a private institution, while the remaining 14,295 (88.8%) are enrolled in public schools. The age group of 35 years and over has the highest likelihood of being enrolled in private schools, with 217 (41.2% in the age bracket) enrolled. Conversely, the age group of 15 to 17 year olds has the lowest likelihood of being enrolled in a private school, with 2,334 (95.3% in the age bracket) attending a public institution.
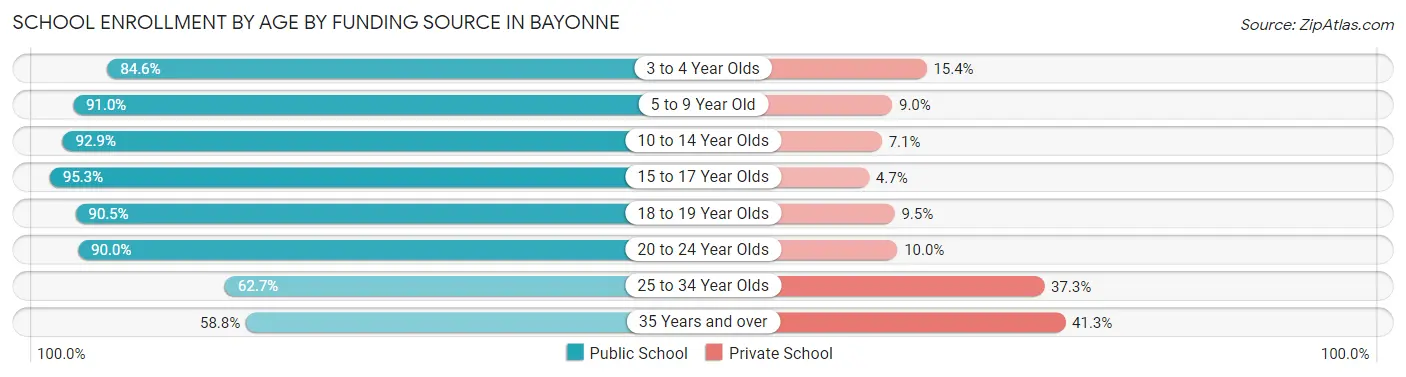
| Age Bracket | Public School | Private School |
| 3 to 4 Year Olds | 845 (84.6%) | 154 (15.4%) |
| 5 to 9 Year Old | 3,989 (91.0%) | 395 (9.0%) |
| 10 to 14 Year Olds | 3,787 (92.9%) | 289 (7.1%) |
| 15 to 17 Year Olds | 2,334 (95.3%) | 115 (4.7%) |
| 18 to 19 Year Olds | 842 (90.5%) | 88 (9.5%) |
| 20 to 24 Year Olds | 1,581 (90.0%) | 175 (10.0%) |
| 25 to 34 Year Olds | 613 (62.7%) | 365 (37.3%) |
| 35 Years and over | 309 (58.8%) | 217 (41.2%) |
| Total | 14,295 (88.8%) | 1,803 (11.2%) |
Educational Attainment by Field of Study in Bayonne
Business (4,676 | 23.7%), education (2,001 | 10.1%), engineering (1,750 | 8.9%), science & technology (1,657 | 8.4%), and computers & mathematics (1,513 | 7.7%) are the most common fields of study among 19,757 individuals in Bayonne who have obtained a bachelor's degree or higher.
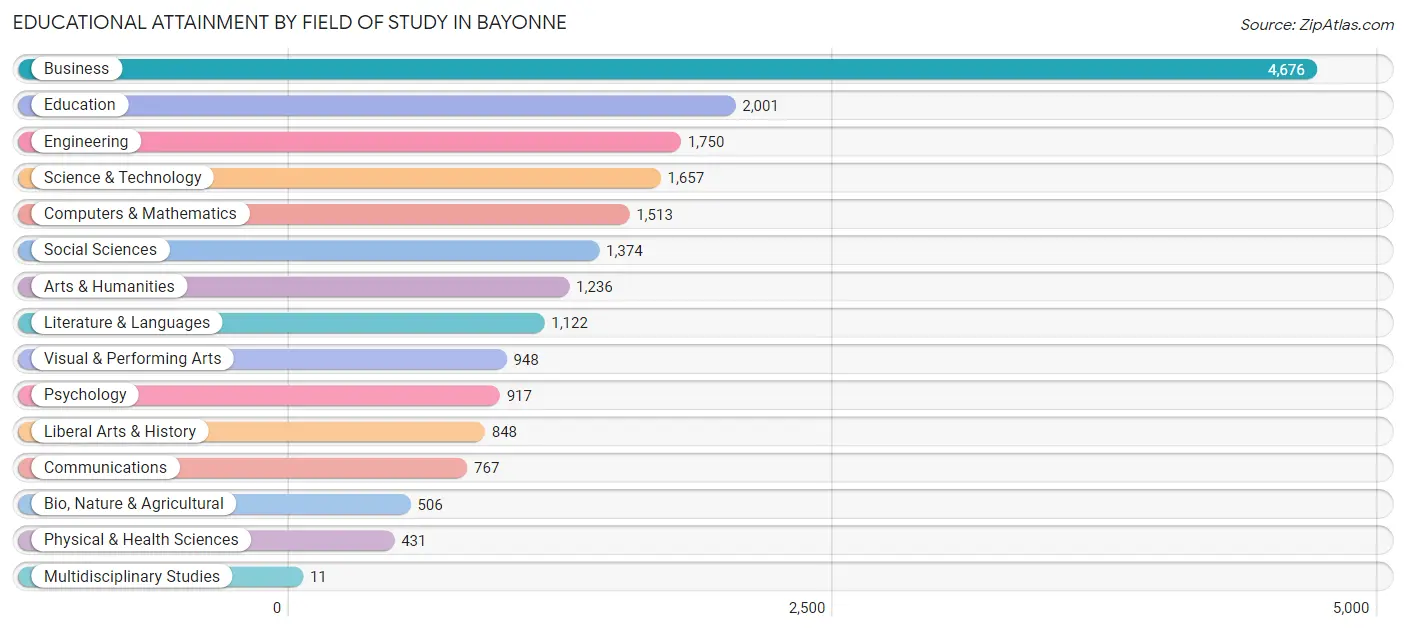
| Field of Study | # Graduates | % Graduates |
| Computers & Mathematics | 1,513 | 7.7% |
| Bio, Nature & Agricultural | 506 | 2.6% |
| Physical & Health Sciences | 431 | 2.2% |
| Psychology | 917 | 4.6% |
| Social Sciences | 1,374 | 7.0% |
| Engineering | 1,750 | 8.9% |
| Multidisciplinary Studies | 11 | 0.1% |
| Science & Technology | 1,657 | 8.4% |
| Business | 4,676 | 23.7% |
| Education | 2,001 | 10.1% |
| Literature & Languages | 1,122 | 5.7% |
| Liberal Arts & History | 848 | 4.3% |
| Visual & Performing Arts | 948 | 4.8% |
| Communications | 767 | 3.9% |
| Arts & Humanities | 1,236 | 6.3% |
| Total | 19,757 | 100.0% |
Transportation & Commute in Bayonne
Vehicle Availability by Sex in Bayonne
The most prevalent vehicle ownership categories in Bayonne are males with 1 vehicle (7,286, accounting for 40.0%) and females with 1 vehicle (6,074, making up 47.3%).
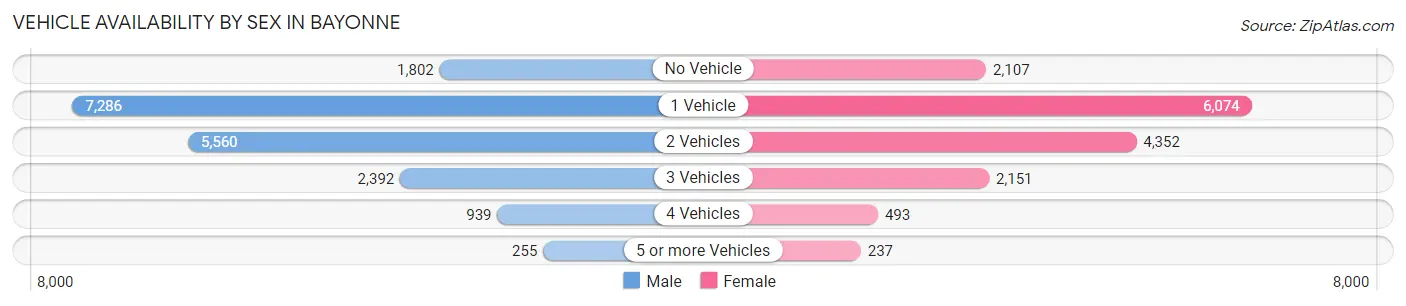
| Vehicles Available | Male | Female |
| No Vehicle | 1,802 (9.9%) | 2,107 (13.7%) |
| 1 Vehicle | 7,286 (40.0%) | 6,074 (39.4%) |
| 2 Vehicles | 5,560 (30.5%) | 4,352 (28.2%) |
| 3 Vehicles | 2,392 (13.1%) | 2,151 (14.0%) |
| 4 Vehicles | 939 (5.1%) | 493 (3.2%) |
| 5 or more Vehicles | 255 (1.4%) | 237 (1.5%) |
| Total | 18,234 (100.0%) | 15,414 (100.0%) |
Commute Time in Bayonne
The most frequently occuring commute durations in Bayonne are 30 to 34 minutes (4,905 commuters, 16.2%), 45 to 59 minutes (4,046 commuters, 13.4%), and 60 to 89 minutes (3,566 commuters, 11.8%).
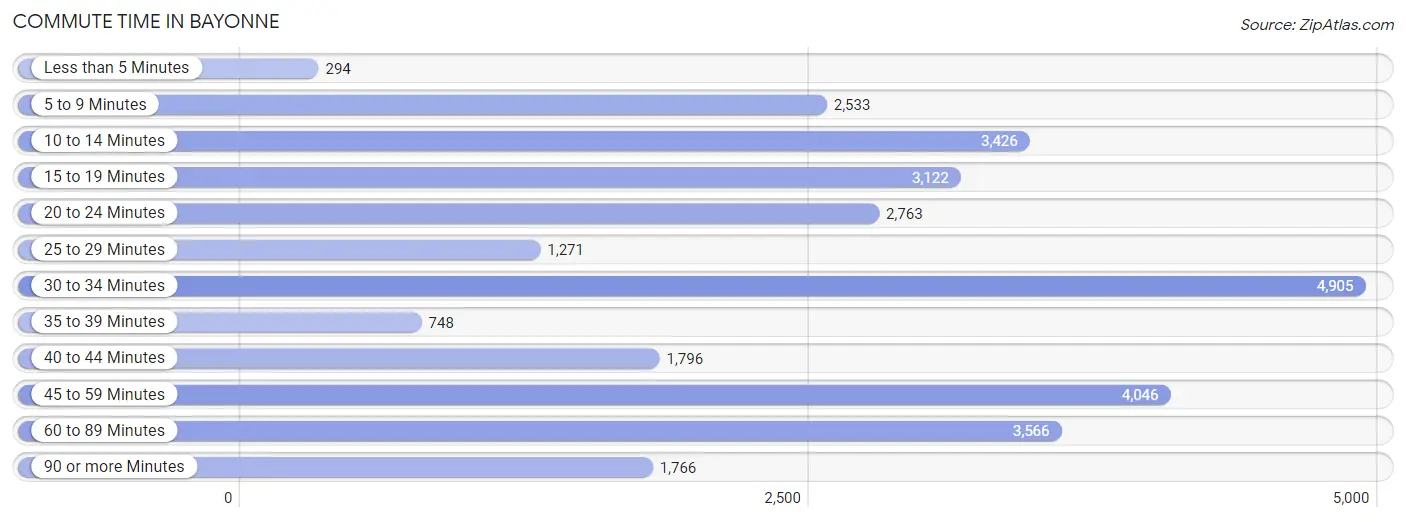
| Commute Time | # Commuters | % Commuters |
| Less than 5 Minutes | 294 | 1.0% |
| 5 to 9 Minutes | 2,533 | 8.4% |
| 10 to 14 Minutes | 3,426 | 11.3% |
| 15 to 19 Minutes | 3,122 | 10.3% |
| 20 to 24 Minutes | 2,763 | 9.1% |
| 25 to 29 Minutes | 1,271 | 4.2% |
| 30 to 34 Minutes | 4,905 | 16.2% |
| 35 to 39 Minutes | 748 | 2.5% |
| 40 to 44 Minutes | 1,796 | 5.9% |
| 45 to 59 Minutes | 4,046 | 13.4% |
| 60 to 89 Minutes | 3,566 | 11.8% |
| 90 or more Minutes | 1,766 | 5.8% |
Commute Time by Sex in Bayonne
The most common commute times in Bayonne are 30 to 34 minutes (2,970 commuters, 17.7%) for males and 30 to 34 minutes (1,935 commuters, 14.3%) for females.
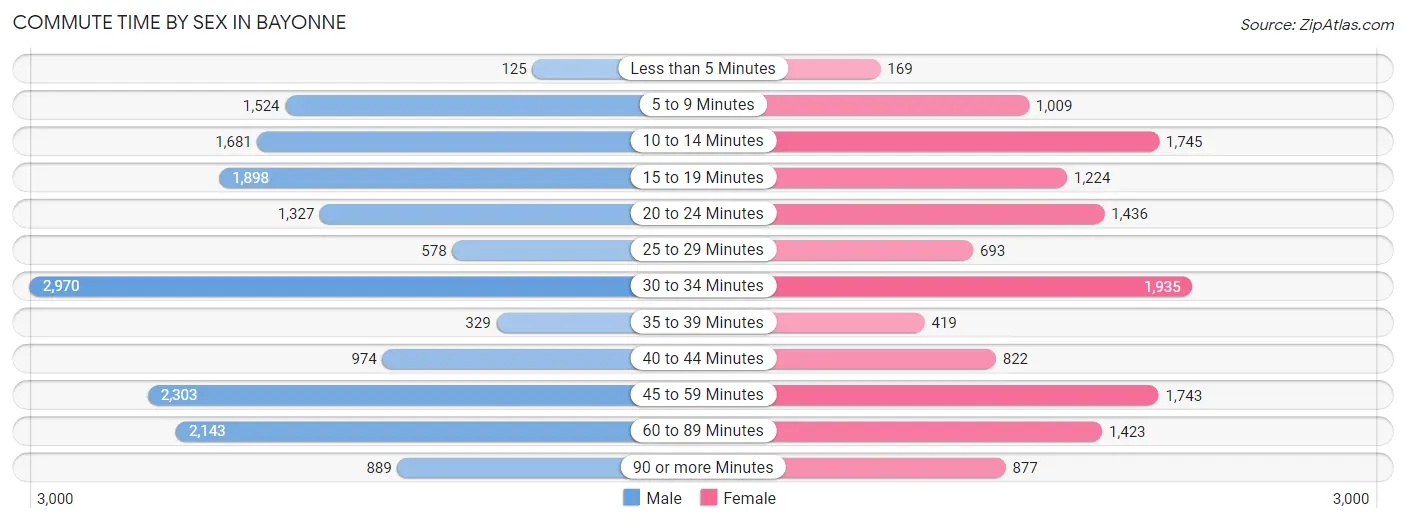
| Commute Time | Male | Female |
| Less than 5 Minutes | 125 (0.7%) | 169 (1.3%) |
| 5 to 9 Minutes | 1,524 (9.1%) | 1,009 (7.5%) |
| 10 to 14 Minutes | 1,681 (10.0%) | 1,745 (12.9%) |
| 15 to 19 Minutes | 1,898 (11.3%) | 1,224 (9.1%) |
| 20 to 24 Minutes | 1,327 (7.9%) | 1,436 (10.6%) |
| 25 to 29 Minutes | 578 (3.5%) | 693 (5.1%) |
| 30 to 34 Minutes | 2,970 (17.7%) | 1,935 (14.3%) |
| 35 to 39 Minutes | 329 (2.0%) | 419 (3.1%) |
| 40 to 44 Minutes | 974 (5.8%) | 822 (6.1%) |
| 45 to 59 Minutes | 2,303 (13.8%) | 1,743 (12.9%) |
| 60 to 89 Minutes | 2,143 (12.8%) | 1,423 (10.5%) |
| 90 or more Minutes | 889 (5.3%) | 877 (6.5%) |
Time of Departure to Work by Sex in Bayonne
The most frequent times of departure to work in Bayonne are 7:00 AM to 7:29 AM (2,586, 15.4%) for males and 8:00 AM to 8:29 AM (2,474, 18.3%) for females.
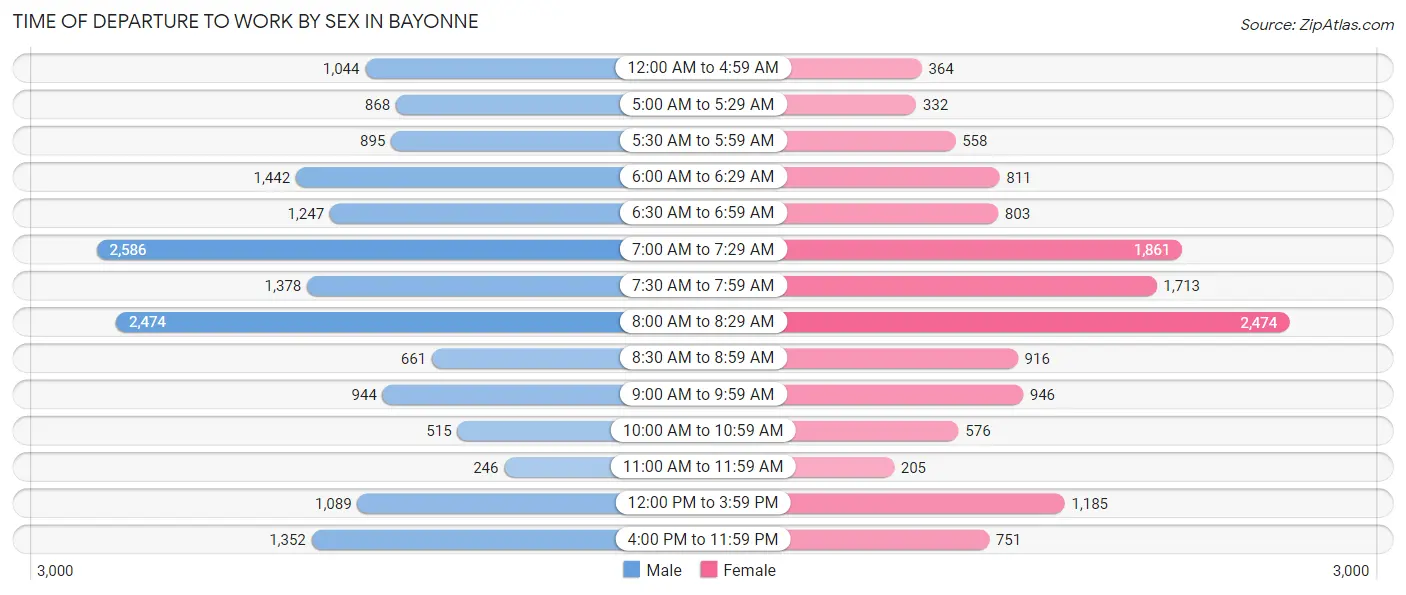
| Time of Departure | Male | Female |
| 12:00 AM to 4:59 AM | 1,044 (6.2%) | 364 (2.7%) |
| 5:00 AM to 5:29 AM | 868 (5.2%) | 332 (2.5%) |
| 5:30 AM to 5:59 AM | 895 (5.3%) | 558 (4.1%) |
| 6:00 AM to 6:29 AM | 1,442 (8.6%) | 811 (6.0%) |
| 6:30 AM to 6:59 AM | 1,247 (7.4%) | 803 (5.9%) |
| 7:00 AM to 7:29 AM | 2,586 (15.4%) | 1,861 (13.8%) |
| 7:30 AM to 7:59 AM | 1,378 (8.2%) | 1,713 (12.7%) |
| 8:00 AM to 8:29 AM | 2,474 (14.8%) | 2,474 (18.3%) |
| 8:30 AM to 8:59 AM | 661 (4.0%) | 916 (6.8%) |
| 9:00 AM to 9:59 AM | 944 (5.6%) | 946 (7.0%) |
| 10:00 AM to 10:59 AM | 515 (3.1%) | 576 (4.3%) |
| 11:00 AM to 11:59 AM | 246 (1.5%) | 205 (1.5%) |
| 12:00 PM to 3:59 PM | 1,089 (6.5%) | 1,185 (8.8%) |
| 4:00 PM to 11:59 PM | 1,352 (8.1%) | 751 (5.6%) |
| Total | 16,741 (100.0%) | 13,495 (100.0%) |
Housing Occupancy in Bayonne
Occupancy by Ownership in Bayonne
Of the total 27,198 dwellings in Bayonne, owner-occupied units account for 10,654 (39.2%), while renter-occupied units make up 16,544 (60.8%).
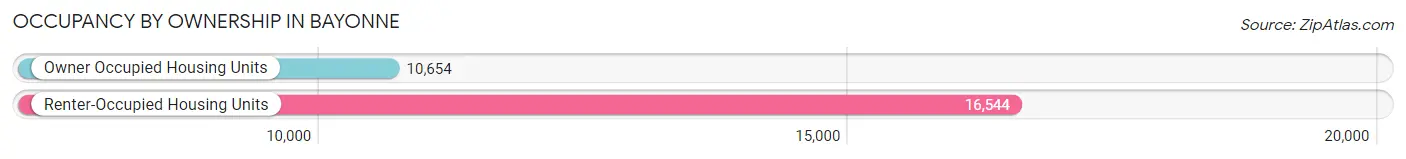
| Occupancy | # Housing Units | % Housing Units |
| Owner Occupied Housing Units | 10,654 | 39.2% |
| Renter-Occupied Housing Units | 16,544 | 60.8% |
| Total Occupied Housing Units | 27,198 | 100.0% |
Occupancy by Household Size in Bayonne
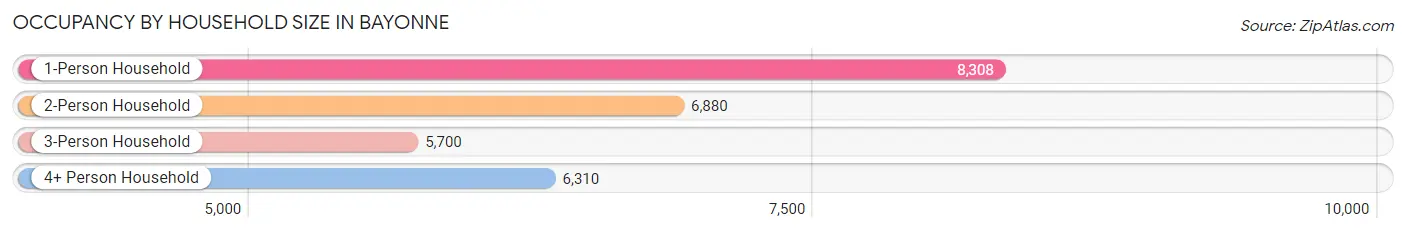
| Household Size | # Housing Units | % Housing Units |
| 1-Person Household | 8,308 | 30.5% |
| 2-Person Household | 6,880 | 25.3% |
| 3-Person Household | 5,700 | 21.0% |
| 4+ Person Household | 6,310 | 23.2% |
| Total Housing Units | 27,198 | 100.0% |
Occupancy by Ownership by Household Size in Bayonne
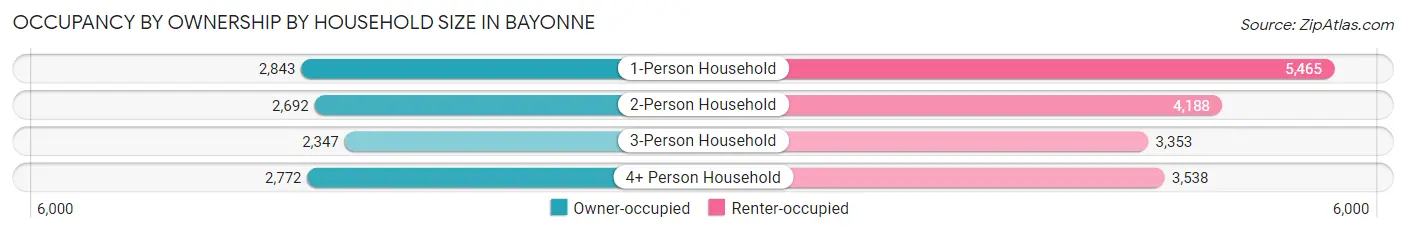
| Household Size | Owner-occupied | Renter-occupied |
| 1-Person Household | 2,843 (34.2%) | 5,465 (65.8%) |
| 2-Person Household | 2,692 (39.1%) | 4,188 (60.9%) |
| 3-Person Household | 2,347 (41.2%) | 3,353 (58.8%) |
| 4+ Person Household | 2,772 (43.9%) | 3,538 (56.1%) |
| Total Housing Units | 10,654 (39.2%) | 16,544 (60.8%) |
Occupancy by Educational Attainment in Bayonne
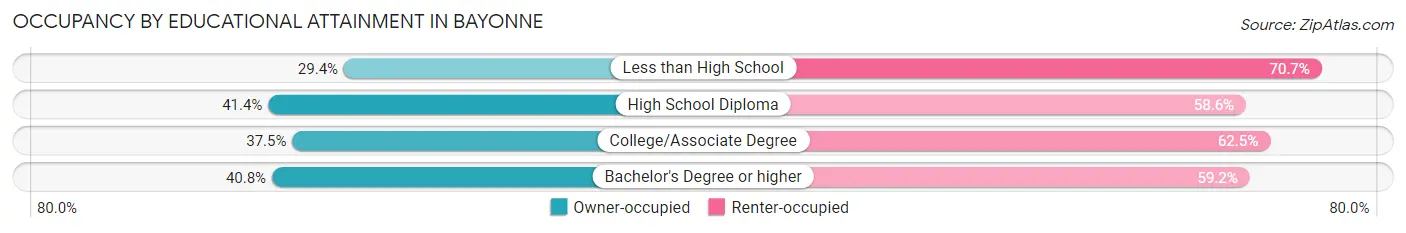
| Household Size | Owner-occupied | Renter-occupied |
| Less than High School | 707 (29.3%) | 1,702 (70.7%) |
| High School Diploma | 3,082 (41.4%) | 4,369 (58.6%) |
| College/Associate Degree | 2,366 (37.5%) | 3,937 (62.5%) |
| Bachelor's Degree or higher | 4,499 (40.8%) | 6,536 (59.2%) |
Occupancy by Age of Householder in Bayonne
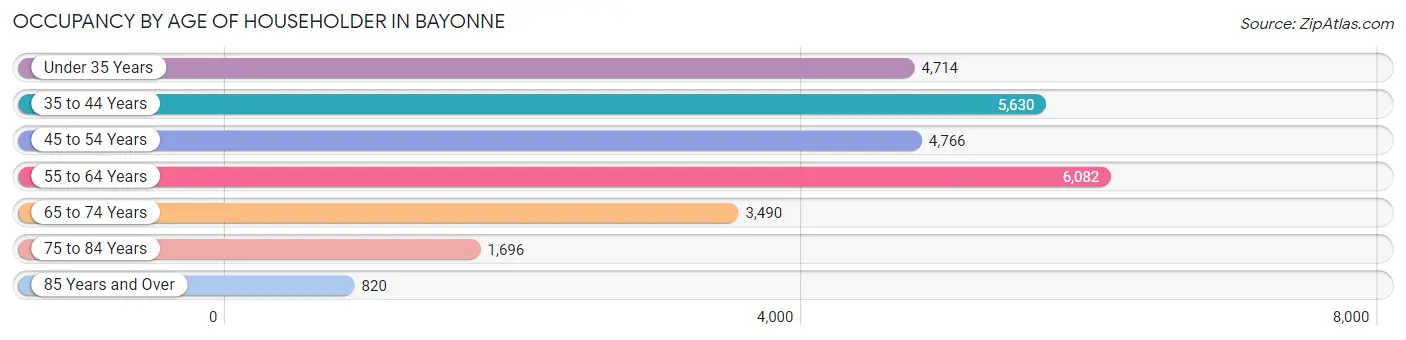
| Age Bracket | # Households | % Households |
| Under 35 Years | 4,714 | 17.3% |
| 35 to 44 Years | 5,630 | 20.7% |
| 45 to 54 Years | 4,766 | 17.5% |
| 55 to 64 Years | 6,082 | 22.4% |
| 65 to 74 Years | 3,490 | 12.8% |
| 75 to 84 Years | 1,696 | 6.2% |
| 85 Years and Over | 820 | 3.0% |
| Total | 27,198 | 100.0% |
Housing Finances in Bayonne
Median Income by Occupancy in Bayonne
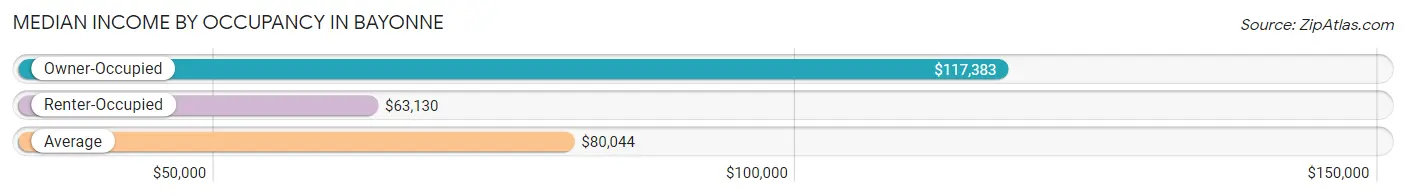
| Occupancy Type | # Households | Median Income |
| Owner-Occupied | 10,654 (39.2%) | $117,383 |
| Renter-Occupied | 16,544 (60.8%) | $63,130 |
| Average | 27,198 (100.0%) | $80,044 |
Occupancy by Householder Income Bracket in Bayonne
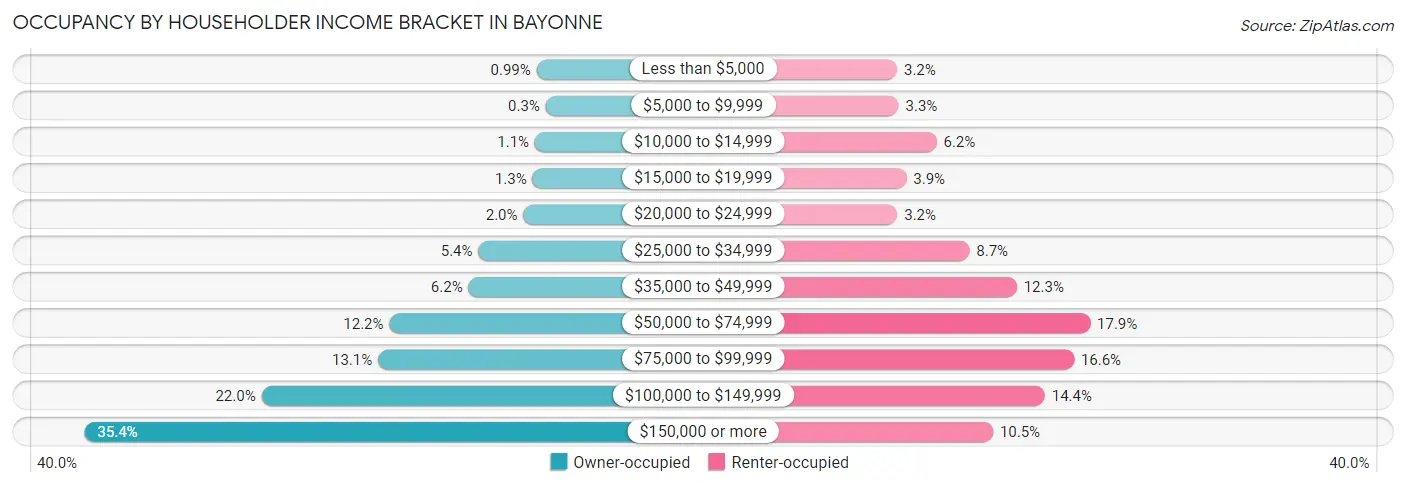
| Income Bracket | Owner-occupied | Renter-occupied |
| Less than $5,000 | 106 (1.0%) | 522 (3.2%) |
| $5,000 to $9,999 | 32 (0.3%) | 542 (3.3%) |
| $10,000 to $14,999 | 119 (1.1%) | 1,020 (6.2%) |
| $15,000 to $19,999 | 139 (1.3%) | 640 (3.9%) |
| $20,000 to $24,999 | 213 (2.0%) | 526 (3.2%) |
| $25,000 to $34,999 | 579 (5.4%) | 1,435 (8.7%) |
| $35,000 to $49,999 | 658 (6.2%) | 2,032 (12.3%) |
| $50,000 to $74,999 | 1,301 (12.2%) | 2,956 (17.9%) |
| $75,000 to $99,999 | 1,392 (13.1%) | 2,753 (16.6%) |
| $100,000 to $149,999 | 2,339 (22.0%) | 2,386 (14.4%) |
| $150,000 or more | 3,776 (35.4%) | 1,732 (10.5%) |
| Total | 10,654 (100.0%) | 16,544 (100.0%) |
Monthly Housing Cost Tiers in Bayonne
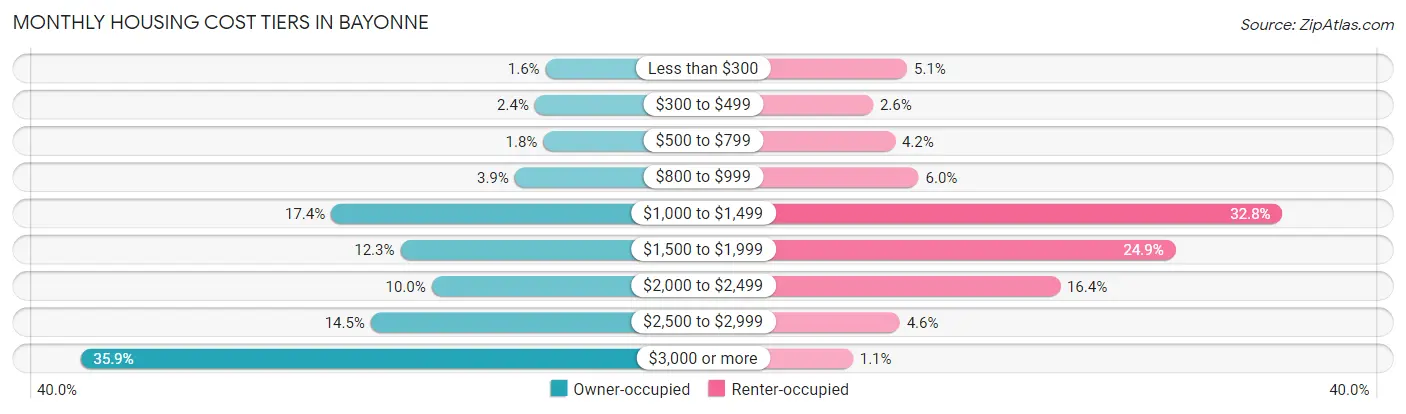
| Monthly Cost | Owner-occupied | Renter-occupied |
| Less than $300 | 175 (1.6%) | 849 (5.1%) |
| $300 to $499 | 259 (2.4%) | 434 (2.6%) |
| $500 to $799 | 193 (1.8%) | 701 (4.2%) |
| $800 to $999 | 417 (3.9%) | 989 (6.0%) |
| $1,000 to $1,499 | 1,857 (17.4%) | 5,422 (32.8%) |
| $1,500 to $1,999 | 1,314 (12.3%) | 4,120 (24.9%) |
| $2,000 to $2,499 | 1,069 (10.0%) | 2,711 (16.4%) |
| $2,500 to $2,999 | 1,546 (14.5%) | 760 (4.6%) |
| $3,000 or more | 3,824 (35.9%) | 187 (1.1%) |
| Total | 10,654 (100.0%) | 16,544 (100.0%) |
Physical Housing Characteristics in Bayonne
Housing Structures in Bayonne
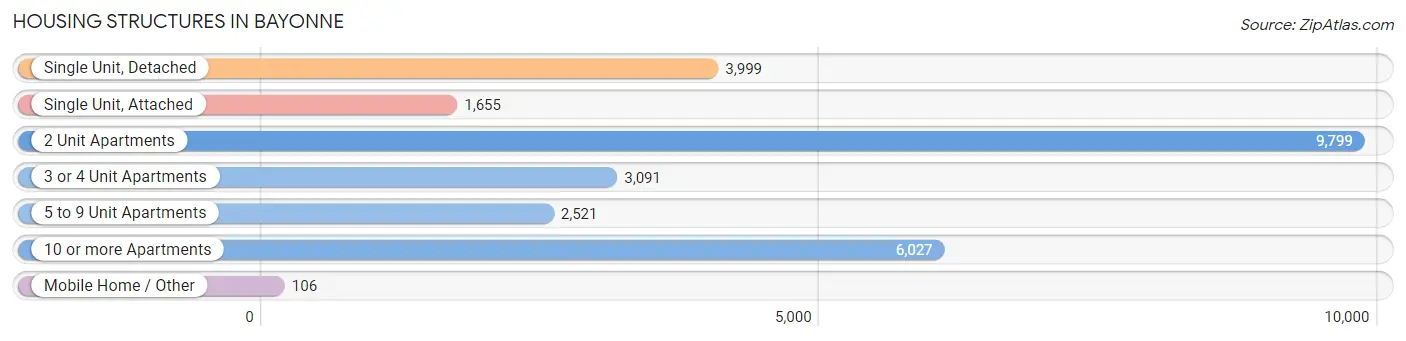
| Structure Type | # Housing Units | % Housing Units |
| Single Unit, Detached | 3,999 | 14.7% |
| Single Unit, Attached | 1,655 | 6.1% |
| 2 Unit Apartments | 9,799 | 36.0% |
| 3 or 4 Unit Apartments | 3,091 | 11.4% |
| 5 to 9 Unit Apartments | 2,521 | 9.3% |
| 10 or more Apartments | 6,027 | 22.2% |
| Mobile Home / Other | 106 | 0.4% |
| Total | 27,198 | 100.0% |
Housing Structures by Occupancy in Bayonne
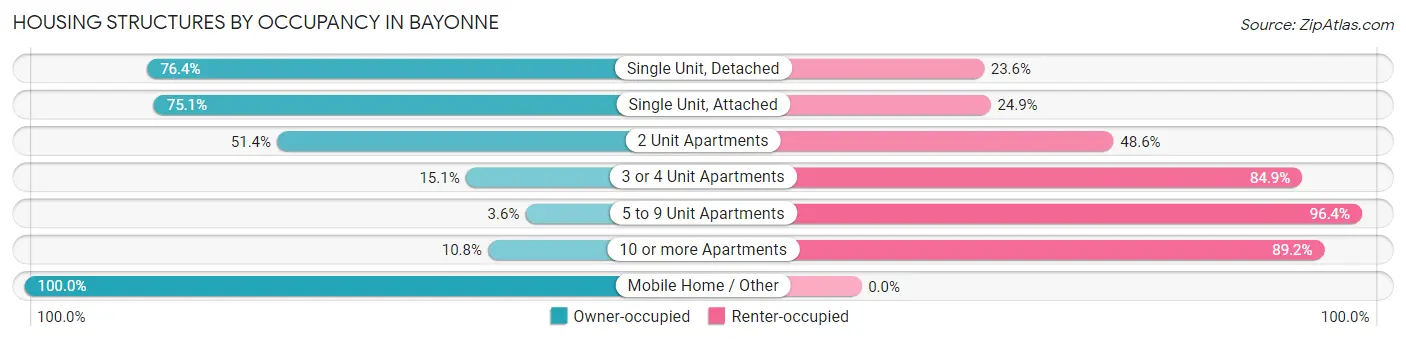
| Structure Type | Owner-occupied | Renter-occupied |
| Single Unit, Detached | 3,055 (76.4%) | 944 (23.6%) |
| Single Unit, Attached | 1,243 (75.1%) | 412 (24.9%) |
| 2 Unit Apartments | 5,040 (51.4%) | 4,759 (48.6%) |
| 3 or 4 Unit Apartments | 467 (15.1%) | 2,624 (84.9%) |
| 5 to 9 Unit Apartments | 91 (3.6%) | 2,430 (96.4%) |
| 10 or more Apartments | 652 (10.8%) | 5,375 (89.2%) |
| Mobile Home / Other | 106 (100.0%) | 0 (0.0%) |
| Total | 10,654 (39.2%) | 16,544 (60.8%) |
Housing Structures by Number of Rooms in Bayonne
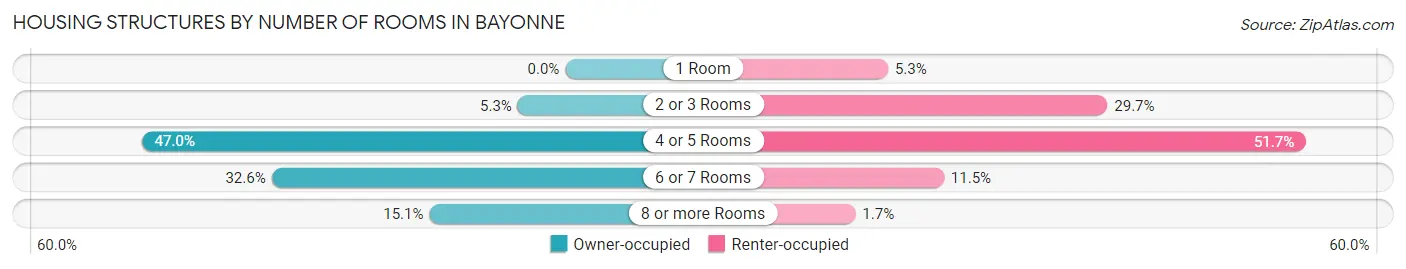
| Number of Rooms | Owner-occupied | Renter-occupied |
| 1 Room | 0 (0.0%) | 881 (5.3%) |
| 2 or 3 Rooms | 563 (5.3%) | 4,910 (29.7%) |
| 4 or 5 Rooms | 5,010 (47.0%) | 8,558 (51.7%) |
| 6 or 7 Rooms | 3,473 (32.6%) | 1,910 (11.5%) |
| 8 or more Rooms | 1,608 (15.1%) | 285 (1.7%) |
| Total | 10,654 (100.0%) | 16,544 (100.0%) |
Housing Structure by Heating Type in Bayonne
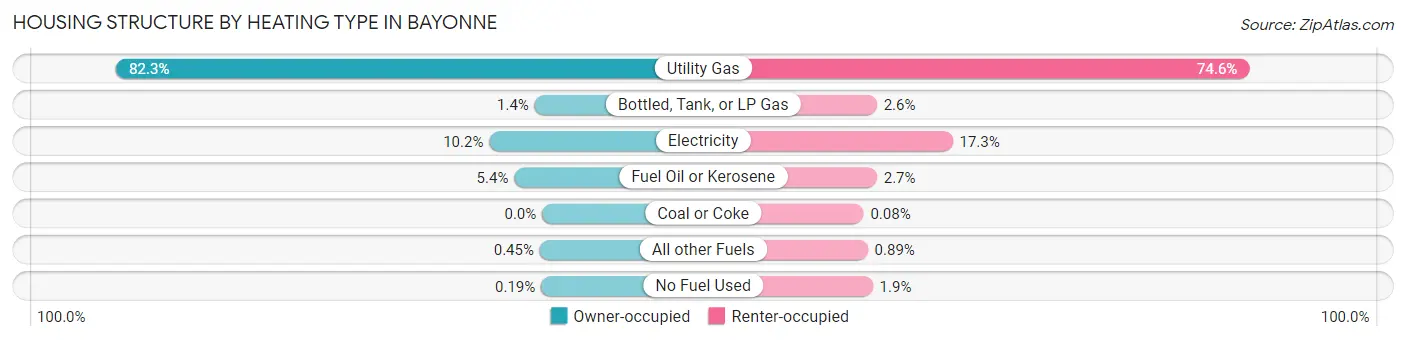
| Heating Type | Owner-occupied | Renter-occupied |
| Utility Gas | 8,771 (82.3%) | 12,341 (74.6%) |
| Bottled, Tank, or LP Gas | 153 (1.4%) | 436 (2.6%) |
| Electricity | 1,089 (10.2%) | 2,860 (17.3%) |
| Fuel Oil or Kerosene | 573 (5.4%) | 440 (2.7%) |
| Coal or Coke | 0 (0.0%) | 13 (0.1%) |
| All other Fuels | 48 (0.4%) | 147 (0.9%) |
| No Fuel Used | 20 (0.2%) | 307 (1.9%) |
| Total | 10,654 (100.0%) | 16,544 (100.0%) |
Household Vehicle Usage in Bayonne
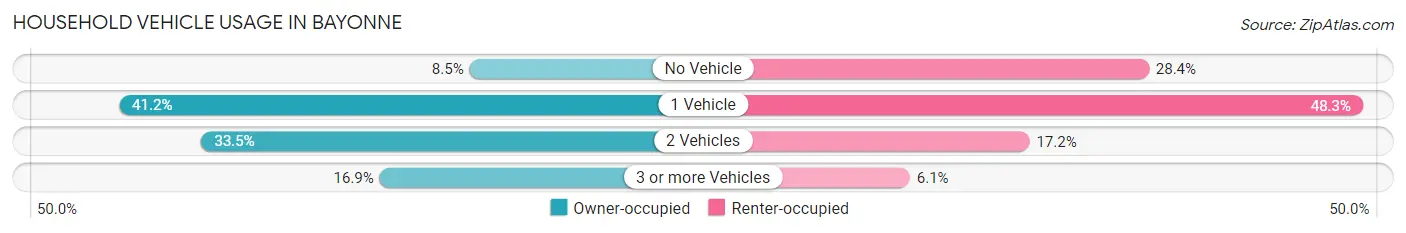
| Vehicles per Household | Owner-occupied | Renter-occupied |
| No Vehicle | 902 (8.5%) | 4,694 (28.4%) |
| 1 Vehicle | 4,386 (41.2%) | 7,998 (48.3%) |
| 2 Vehicles | 3,569 (33.5%) | 2,850 (17.2%) |
| 3 or more Vehicles | 1,797 (16.9%) | 1,002 (6.1%) |
| Total | 10,654 (100.0%) | 16,544 (100.0%) |
Real Estate & Mortgages in Bayonne
Real Estate and Mortgage Overview in Bayonne
| Characteristic | Without Mortgage | With Mortgage |
| Housing Units | 3,820 | 6,834 |
| Median Property Value | $364,900 | $441,300 |
| Median Household Income | $88,148 | $2,937 |
| Monthly Housing Costs | $1,320 | $3,824 |
| Real Estate Taxes | $10,001 | $143 |
Property Value by Mortgage Status in Bayonne
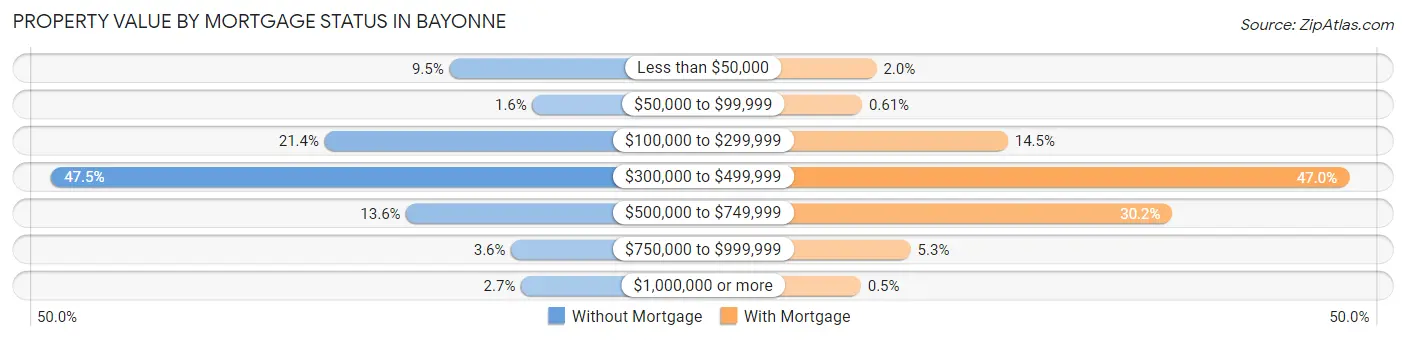
| Property Value | Without Mortgage | With Mortgage |
| Less than $50,000 | 364 (9.5%) | 136 (2.0%) |
| $50,000 to $99,999 | 62 (1.6%) | 42 (0.6%) |
| $100,000 to $299,999 | 818 (21.4%) | 991 (14.5%) |
| $300,000 to $499,999 | 1,813 (47.5%) | 3,211 (47.0%) |
| $500,000 to $749,999 | 521 (13.6%) | 2,061 (30.2%) |
| $750,000 to $999,999 | 139 (3.6%) | 359 (5.2%) |
| $1,000,000 or more | 103 (2.7%) | 34 (0.5%) |
| Total | 3,820 (100.0%) | 6,834 (100.0%) |
Household Income by Mortgage Status in Bayonne
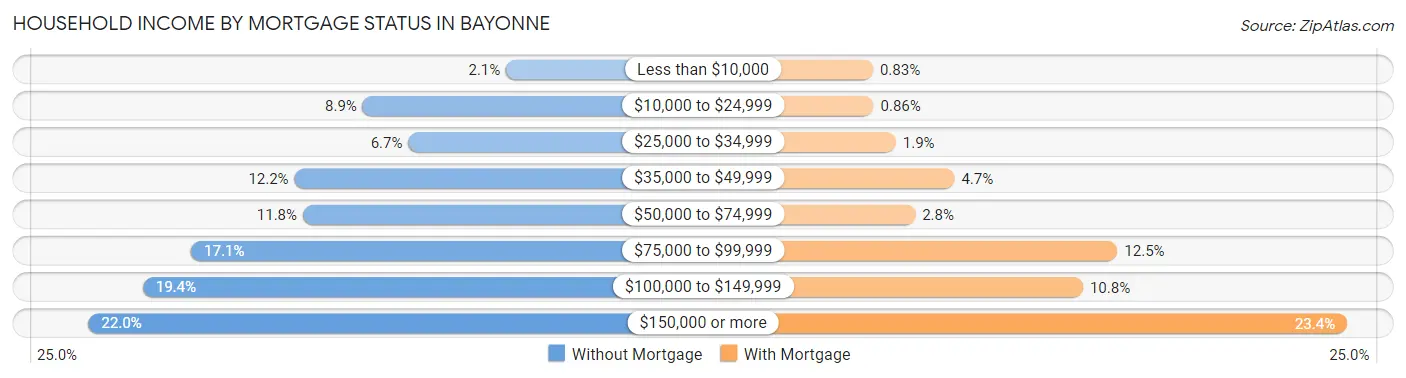
| Household Income | Without Mortgage | With Mortgage |
| Less than $10,000 | 79 (2.1%) | 57 (0.8%) |
| $10,000 to $24,999 | 340 (8.9%) | 59 (0.9%) |
| $25,000 to $34,999 | 257 (6.7%) | 131 (1.9%) |
| $35,000 to $49,999 | 464 (12.1%) | 322 (4.7%) |
| $50,000 to $74,999 | 449 (11.7%) | 194 (2.8%) |
| $75,000 to $99,999 | 652 (17.1%) | 852 (12.5%) |
| $100,000 to $149,999 | 740 (19.4%) | 740 (10.8%) |
| $150,000 or more | 839 (22.0%) | 1,599 (23.4%) |
| Total | 3,820 (100.0%) | 6,834 (100.0%) |
Property Value to Household Income Ratio in Bayonne
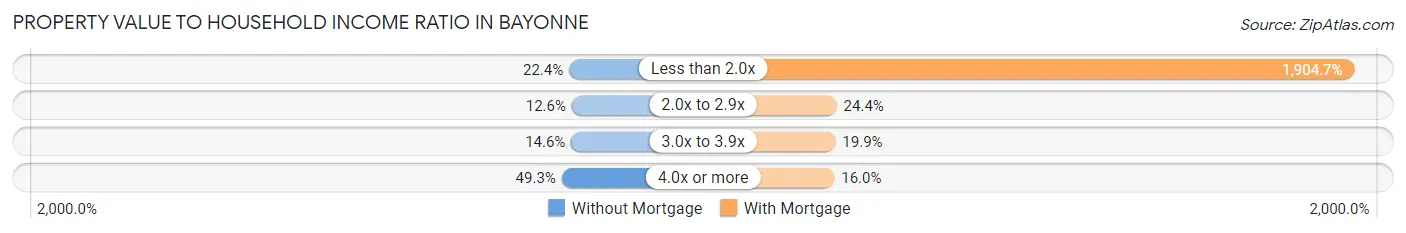
| Value-to-Income Ratio | Without Mortgage | With Mortgage |
| Less than 2.0x | 856 (22.4%) | 130,164 (1,904.7%) |
| 2.0x to 2.9x | 482 (12.6%) | 1,670 (24.4%) |
| 3.0x to 3.9x | 559 (14.6%) | 1,362 (19.9%) |
| 4.0x or more | 1,884 (49.3%) | 1,091 (16.0%) |
| Total | 3,820 (100.0%) | 6,834 (100.0%) |
Real Estate Taxes by Mortgage Status in Bayonne
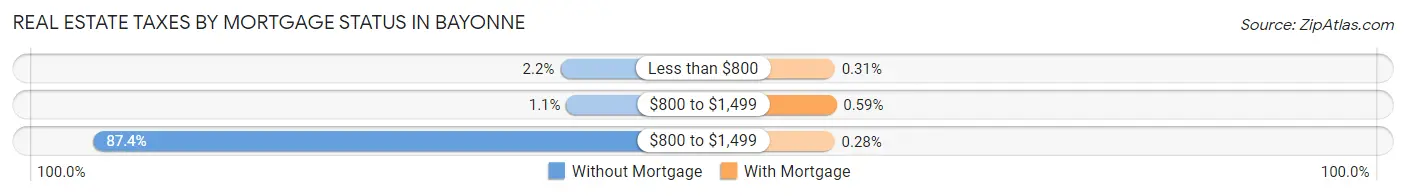
| Property Taxes | Without Mortgage | With Mortgage |
| Less than $800 | 83 (2.2%) | 21 (0.3%) |
| $800 to $1,499 | 40 (1.1%) | 40 (0.6%) |
| $800 to $1,499 | 3,340 (87.4%) | 19 (0.3%) |
| Total | 3,820 (100.0%) | 6,834 (100.0%) |
Health & Disability in Bayonne
Health Insurance Coverage by Age in Bayonne
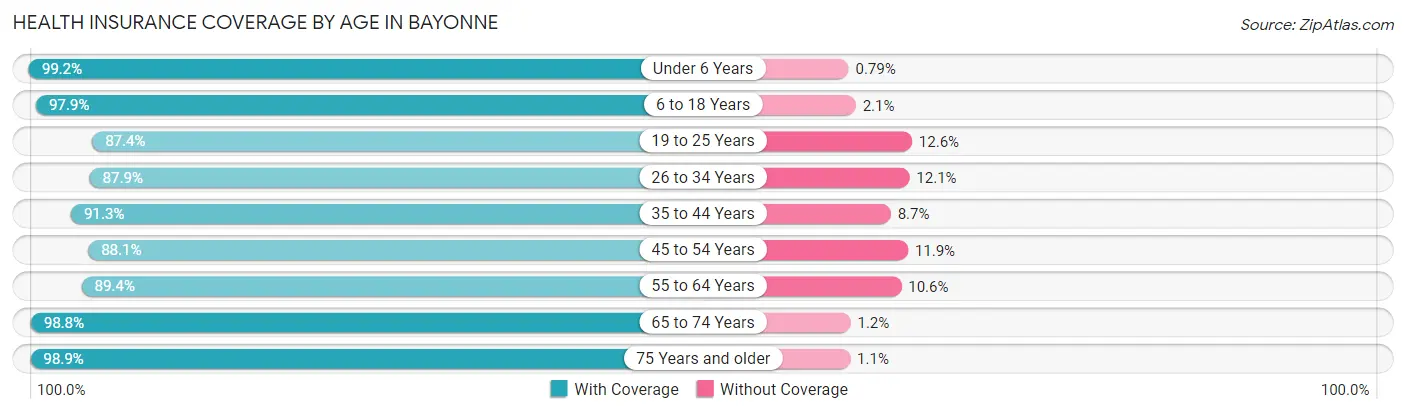
| Age Bracket | With Coverage | Without Coverage |
| Under 6 Years | 5,883 (99.2%) | 47 (0.8%) |
| 6 to 18 Years | 10,684 (97.9%) | 232 (2.1%) |
| 19 to 25 Years | 4,574 (87.4%) | 660 (12.6%) |
| 26 to 34 Years | 8,369 (87.9%) | 1,156 (12.1%) |
| 35 to 44 Years | 9,784 (91.3%) | 928 (8.7%) |
| 45 to 54 Years | 7,460 (88.1%) | 1,005 (11.9%) |
| 55 to 64 Years | 8,586 (89.4%) | 1,021 (10.6%) |
| 65 to 74 Years | 5,954 (98.8%) | 70 (1.2%) |
| 75 Years and older | 3,891 (98.9%) | 43 (1.1%) |
| Total | 65,185 (92.7%) | 5,162 (7.3%) |
Health Insurance Coverage by Citizenship Status in Bayonne
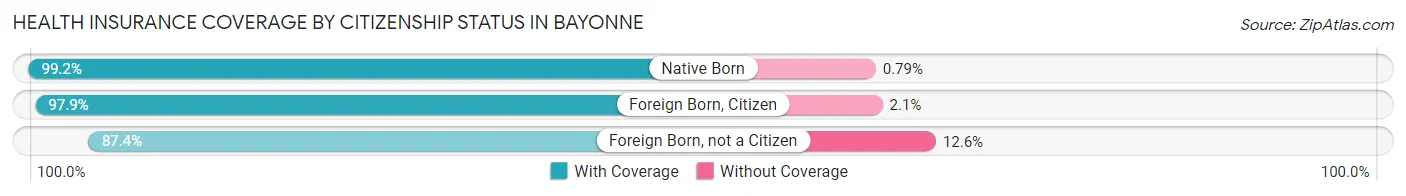
| Citizenship Status | With Coverage | Without Coverage |
| Native Born | 5,883 (99.2%) | 47 (0.8%) |
| Foreign Born, Citizen | 10,684 (97.9%) | 232 (2.1%) |
| Foreign Born, not a Citizen | 4,574 (87.4%) | 660 (12.6%) |
Health Insurance Coverage by Household Income in Bayonne
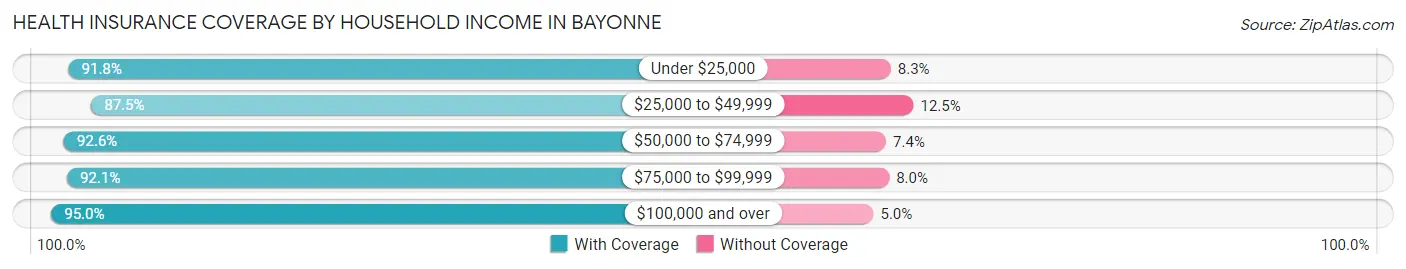
| Household Income | With Coverage | Without Coverage |
| Under $25,000 | 5,824 (91.7%) | 524 (8.3%) |
| $25,000 to $49,999 | 9,282 (87.5%) | 1,326 (12.5%) |
| $50,000 to $74,999 | 9,820 (92.6%) | 781 (7.4%) |
| $75,000 to $99,999 | 10,185 (92.0%) | 880 (8.0%) |
| $100,000 and over | 29,900 (95.0%) | 1,576 (5.0%) |
Public vs Private Health Insurance Coverage by Age in Bayonne
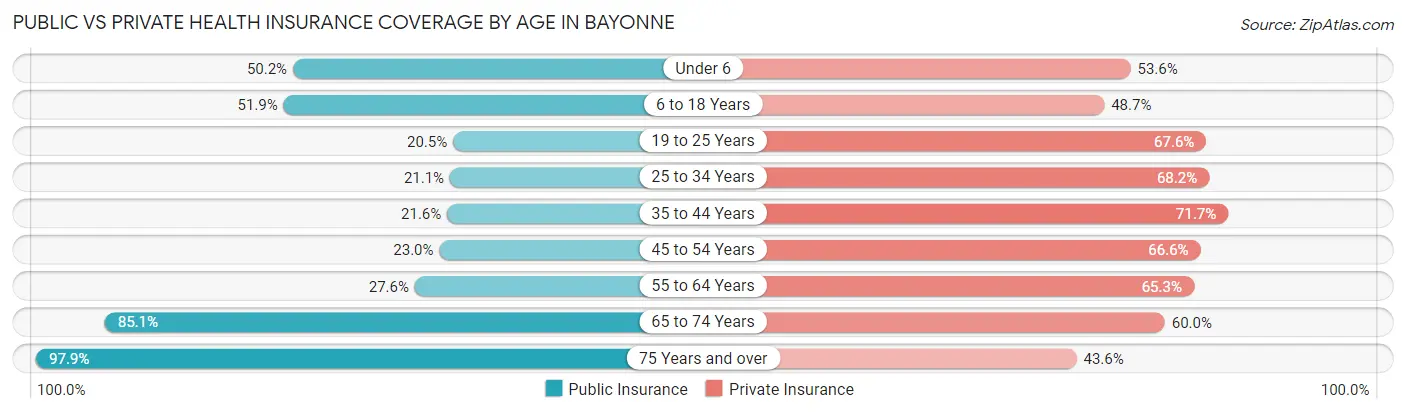
| Age Bracket | Public Insurance | Private Insurance |
| Under 6 | 2,976 (50.2%) | 3,178 (53.6%) |
| 6 to 18 Years | 5,670 (51.9%) | 5,317 (48.7%) |
| 19 to 25 Years | 1,072 (20.5%) | 3,539 (67.6%) |
| 25 to 34 Years | 2,005 (21.0%) | 6,491 (68.1%) |
| 35 to 44 Years | 2,312 (21.6%) | 7,681 (71.7%) |
| 45 to 54 Years | 1,948 (23.0%) | 5,634 (66.6%) |
| 55 to 64 Years | 2,649 (27.6%) | 6,275 (65.3%) |
| 65 to 74 Years | 5,127 (85.1%) | 3,612 (60.0%) |
| 75 Years and over | 3,850 (97.9%) | 1,714 (43.6%) |
| Total | 27,609 (39.3%) | 43,441 (61.8%) |
Disability Status by Sex by Age in Bayonne
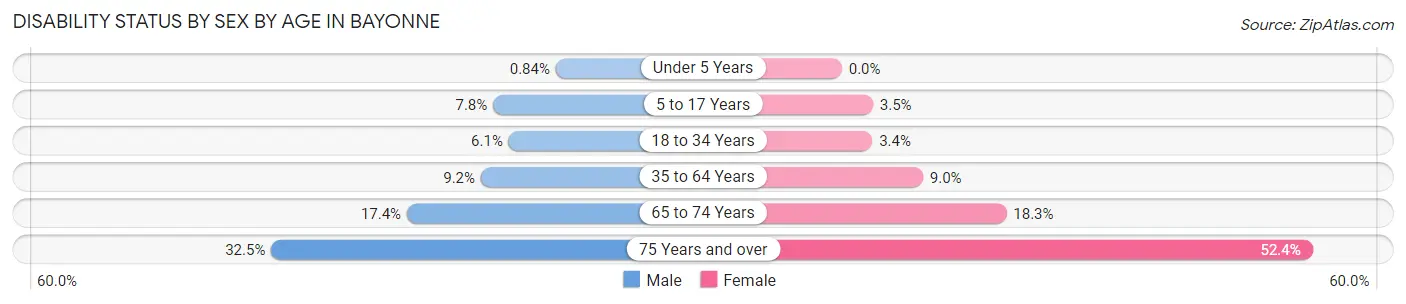
| Age Bracket | Male | Female |
| Under 5 Years | 27 (0.8%) | 0 (0.0%) |
| 5 to 17 Years | 467 (7.8%) | 178 (3.5%) |
| 18 to 34 Years | 440 (6.1%) | 276 (3.4%) |
| 35 to 64 Years | 1,316 (9.2%) | 1,307 (9.0%) |
| 65 to 74 Years | 523 (17.4%) | 554 (18.3%) |
| 75 Years and over | 473 (32.5%) | 1,300 (52.4%) |
Disability Class by Sex by Age in Bayonne
Disability Class: Hearing Difficulty
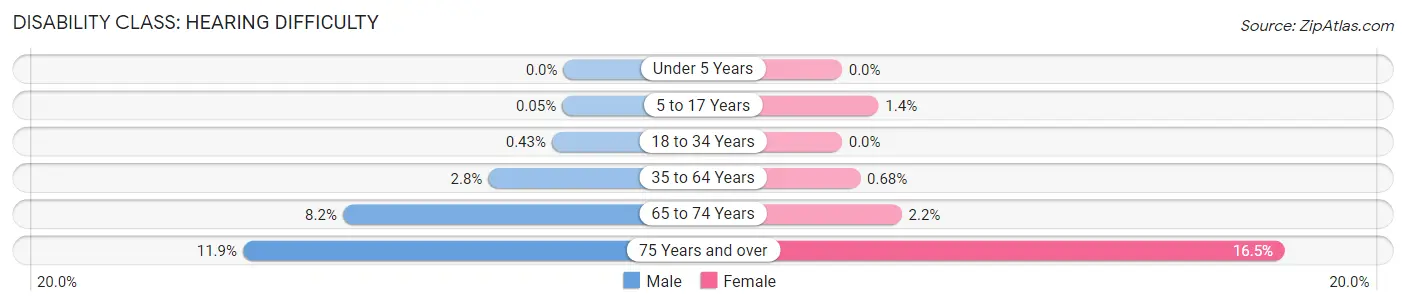
| Age Bracket | Male | Female |
| Under 5 Years | 0 (0.0%) | 0 (0.0%) |
| 5 to 17 Years | 3 (0.1%) | 70 (1.4%) |
| 18 to 34 Years | 31 (0.4%) | 0 (0.0%) |
| 35 to 64 Years | 400 (2.8%) | 98 (0.7%) |
| 65 to 74 Years | 246 (8.2%) | 67 (2.2%) |
| 75 Years and over | 173 (11.9%) | 408 (16.5%) |
Disability Class: Vision Difficulty
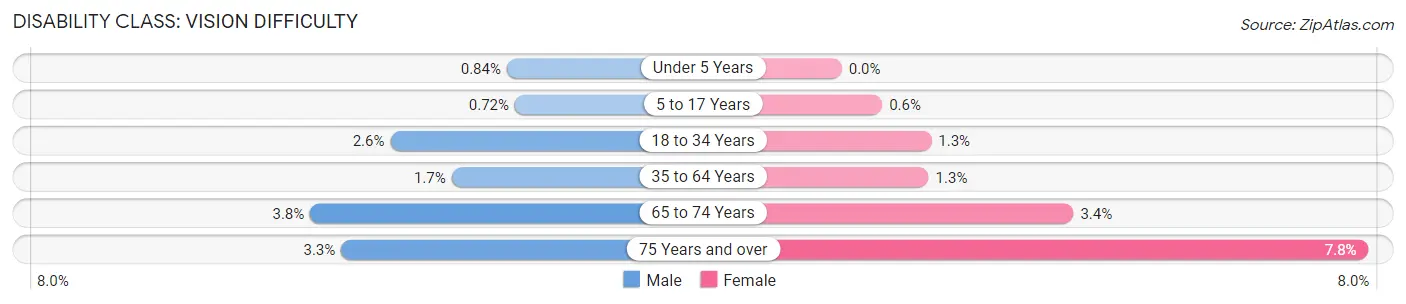
| Age Bracket | Male | Female |
| Under 5 Years | 27 (0.8%) | 0 (0.0%) |
| 5 to 17 Years | 43 (0.7%) | 31 (0.6%) |
| 18 to 34 Years | 186 (2.6%) | 108 (1.3%) |
| 35 to 64 Years | 237 (1.7%) | 187 (1.3%) |
| 65 to 74 Years | 113 (3.8%) | 104 (3.4%) |
| 75 Years and over | 48 (3.3%) | 194 (7.8%) |
Disability Class: Cognitive Difficulty
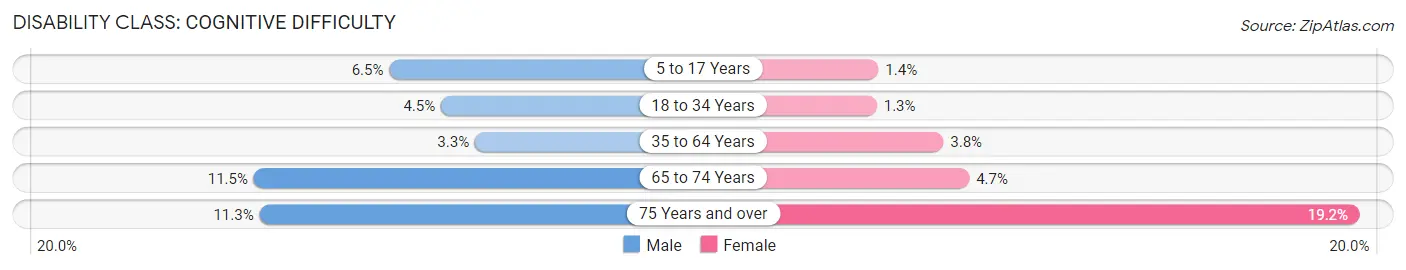
| Age Bracket | Male | Female |
| 5 to 17 Years | 386 (6.5%) | 70 (1.4%) |
| 18 to 34 Years | 329 (4.5%) | 106 (1.3%) |
| 35 to 64 Years | 470 (3.3%) | 546 (3.8%) |
| 65 to 74 Years | 345 (11.5%) | 143 (4.7%) |
| 75 Years and over | 164 (11.3%) | 477 (19.2%) |
Disability Class: Ambulatory Difficulty
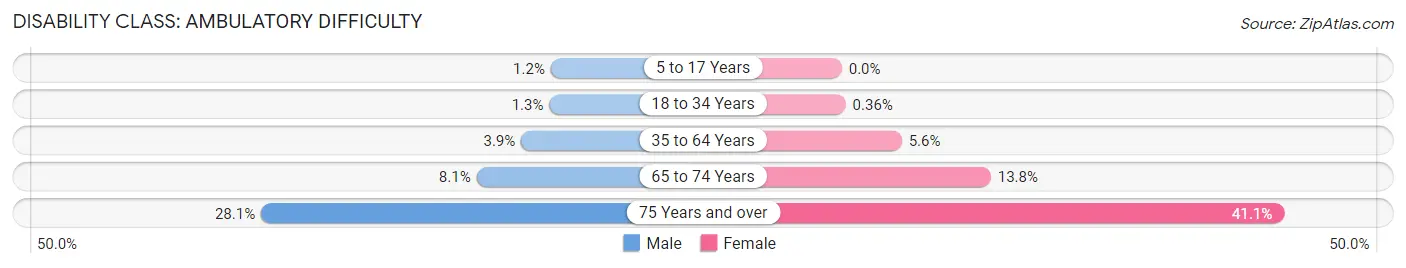
| Age Bracket | Male | Female |
| 5 to 17 Years | 70 (1.2%) | 0 (0.0%) |
| 18 to 34 Years | 94 (1.3%) | 29 (0.4%) |
| 35 to 64 Years | 561 (3.9%) | 804 (5.6%) |
| 65 to 74 Years | 242 (8.1%) | 418 (13.8%) |
| 75 Years and over | 408 (28.1%) | 1,018 (41.0%) |
Disability Class: Self-Care Difficulty
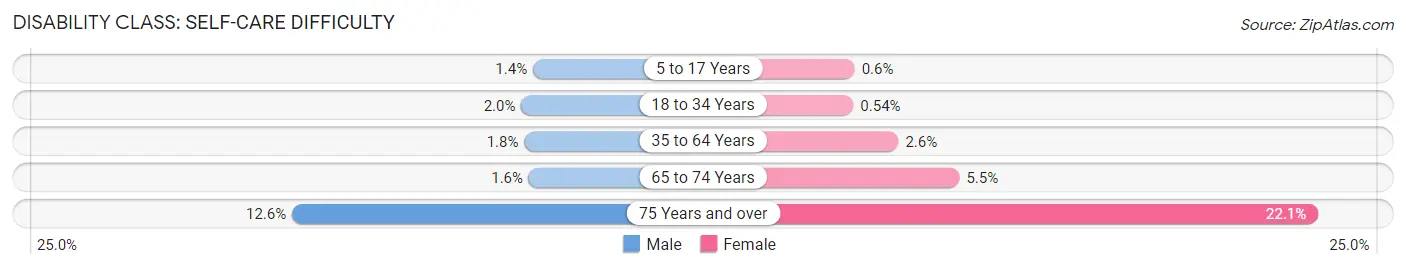
| Age Bracket | Male | Female |
| 5 to 17 Years | 84 (1.4%) | 31 (0.6%) |
| 18 to 34 Years | 141 (1.9%) | 44 (0.5%) |
| 35 to 64 Years | 259 (1.8%) | 380 (2.6%) |
| 65 to 74 Years | 48 (1.6%) | 165 (5.5%) |
| 75 Years and over | 183 (12.6%) | 548 (22.1%) |
Technology Access in Bayonne
Computing Device Access in Bayonne
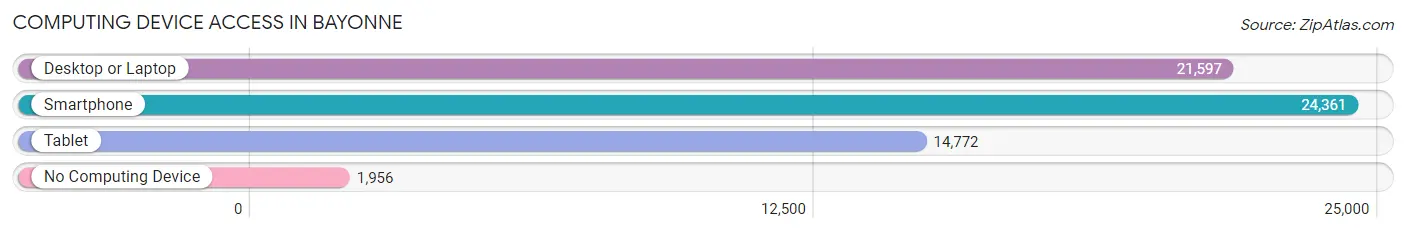
| Device Type | # Households | % Households |
| Desktop or Laptop | 21,597 | 79.4% |
| Smartphone | 24,361 | 89.6% |
| Tablet | 14,772 | 54.3% |
| No Computing Device | 1,956 | 7.2% |
| Total | 27,198 | 100.0% |
Internet Access in Bayonne
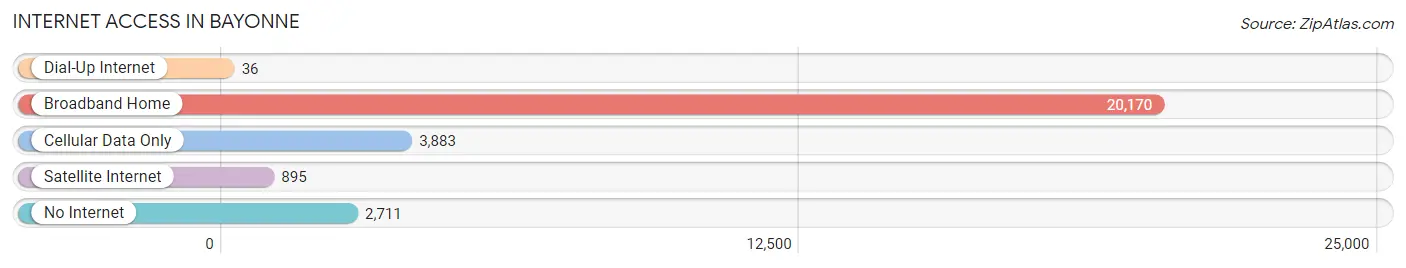
| Internet Type | # Households | % Households |
| Dial-Up Internet | 36 | 0.1% |
| Broadband Home | 20,170 | 74.2% |
| Cellular Data Only | 3,883 | 14.3% |
| Satellite Internet | 895 | 3.3% |
| No Internet | 2,711 | 10.0% |
| Total | 27,198 | 100.0% |
Bayonne Summary
Bayonne, NJ is a city located in Hudson County, New Jersey. It is situated on a peninsula between Newark Bay and the Kill Van Kull. The city is bordered by Jersey City to the north, the Hudson River to the east, and the Hackensack River to the south. As of the 2010 United States Census, Bayonne had a population of 63,024, making it the 15th most populous city in the state of New Jersey.
History
The area that is now Bayonne was originally inhabited by the Hackensack Indians, who were part of the Lenape tribe. The first European settlers arrived in the area in 1660, when the Dutch West India Company purchased the land from the Hackensack Indians. The area was then known as Bergen Neck, and was part of Bergen Township. In the late 1700s, the area was renamed Constable Hook, after the Constable family who owned a large tract of land in the area.
In 1869, the city of Bayonne was incorporated, and was named after Bayonne, France. The city quickly grew in population and industry, and by the early 1900s, it was a major port city. During World War II, the city was a major shipbuilding center, and was home to the largest dry dock in the world.
Geography
Bayonne is located at 40°41'N 74°07'W (40.68, -74.12). According to the United States Census Bureau, the city has a total area of 5.3 square miles (13.7 km2), of which 4.9 square miles (12.7 km2) is land and 0.4 square miles (1.0 km2) is water.
The city is situated on a peninsula between Newark Bay and the Kill Van Kull. It is bordered by Jersey City to the north, the Hudson River to the east, and the Hackensack River to the south.
Economy
Bayonne has a diverse economy, with a mix of manufacturing, retail, and service industries. The city is home to several major employers, including the Bayonne Medical Center, the Bayonne Refinery, and the Bayonne Port Authority.
The city is also home to several major retailers including Walmart Target and Home Depot
Demographics
As of the 2010 United States Census, there were 63,024 people, 24,817 households, and 15,845 families residing in the city. The population density was 12,845.3 per square mile (4,958.2/km2). There were 26,845 housing units at an average density of 5,457.2 per square mile (2,112.2/km2). The racial makeup of the city was 68.2% White, 15.2% African American, 0.4% Native American, 5.2% Asian, 0.1% Pacific Islander, 8.2% from other races, and 2.9% from two or more races. Hispanic or Latino of any race were 24.7% of the population.
There were 24,817 households, out of which 28.2% had children under the age of 18 living with them, 40.2% were married couples living together, 16.7% had a female householder with no husband present, and 36.7% were non-families. 30.2% of all households were made up of individuals, and 11.3% had someone living alone who was 65 years of age or older. The average household size was 2.50 and the average family size was 3.14.
In the city, the population was spread out, with 22.2% under the age of 18, 8.7% from 18 to 24, 30.2% from 25 to 44, 25.2% from 45 to 64, and 13.7% who were 65 years of age or older. The median age was 37.4 years. For every 100 females, there were 93.2 males. For every 100 females ages 18 and older there were 90.2 males.
The median income for a household in the city was $48,837, and the median income for a family was $58,837. Males had a median income of $41,837 versus $35,837 for females. The per capita income for the city was $24,837. About 11.2% of families and 13.7% of the population were below the poverty line, including 19.2% of those under age 18 and 10.2% of those age 65 or over.
Common Questions
What is Per Capita Income in Bayonne?
Per Capita income in Bayonne is $39,629.
What is the Median Family Income in Bayonne?
Median Family Income in Bayonne is $92,521.
What is the Median Household income in Bayonne?
Median Household Income in Bayonne is $80,044.
What is Income or Wage Gap in Bayonne?
Income or Wage Gap in Bayonne is 31.6%.
Women in Bayonne earn 68.4 cents for every dollar earned by a man.
What is Family Income Deficit in Bayonne?
Family Income Deficit in Bayonne is $8,620.
Families that are below poverty line in Bayonne earn $8,620 less on average than the poverty threshold level.
What is Inequality or Gini Index in Bayonne?
Inequality or Gini Index in Bayonne is 0.45.
What is the Total Population of Bayonne?
Total Population of Bayonne is 70,497.
What is the Total Male Population of Bayonne?
Total Male Population of Bayonne is 35,345.
What is the Total Female Population of Bayonne?
Total Female Population of Bayonne is 35,152.
What is the Ratio of Males per 100 Females in Bayonne?
There are 100.55 Males per 100 Females in Bayonne.
What is the Ratio of Females per 100 Males in Bayonne?
There are 99.45 Females per 100 Males in Bayonne.
What is the Median Population Age in Bayonne?
Median Population Age in Bayonne is 38.2 Years.
What is the Average Family Size in Bayonne
Average Family Size in Bayonne is 3.2 People.
What is the Average Household Size in Bayonne
Average Household Size in Bayonne is 2.6 People.
How Large is the Labor Force in Bayonne?
There are 36,597 People in the Labor Forcein in Bayonne.
What is the Percentage of People in the Labor Force in Bayonne?
65.5% of People are in the Labor Force in Bayonne.
What is the Unemployment Rate in Bayonne?
Unemployment Rate in Bayonne is 6.0%.