Ogden, UT Map & Demographics
Ogden Map
Ogden Overview
$31,437
PER CAPITA INCOME
$76,861
AVG FAMILY INCOME
$66,226
AVG HOUSEHOLD INCOME
29.1%
WAGE / INCOME GAP [ % ]
70.9¢/ $1
WAGE / INCOME GAP [ $ ]
$11,171
FAMILY INCOME DEFICIT
0.42
INEQUALITY / GINI INDEX
86,754
TOTAL POPULATION
45,297
MALE POPULATION
41,457
FEMALE POPULATION
109.26
MALES / 100 FEMALES
91.52
FEMALES / 100 MALES
32.8
MEDIAN AGE
3.3
AVG FAMILY SIZE
2.6
AVG HOUSEHOLD SIZE
46,544
LABOR FORCE [ PEOPLE ]
68.1%
PERCENT IN LABOR FORCE
4.3%
UNEMPLOYMENT RATE
Income in Ogden
Income Overview in Ogden
Per Capita Income in Ogden is $31,437, while median incomes of families and households are $76,861 and $66,226 respectively.
| Characteristic | Number | Measure |
| Per Capita Income | 86,754 | $31,437 |
| Median Family Income | 20,127 | $76,861 |
| Mean Family Income | 20,127 | $95,353 |
| Median Household Income | 32,326 | $66,226 |
| Mean Household Income | 32,326 | $82,216 |
| Income Deficit | 20,127 | $11,171 |
| Wage / Income Gap (%) | 86,754 | 29.13% |
| Wage / Income Gap ($) | 86,754 | 70.87¢ per $1 |
| Gini / Inequality Index | 86,754 | 0.42 |
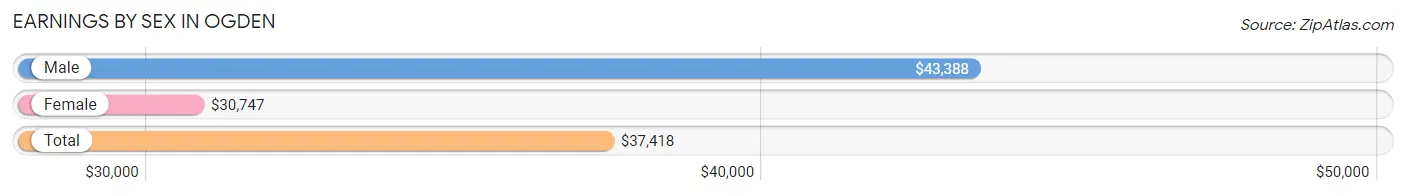
Earnings by Sex in Ogden
Average Earnings in Ogden are $37,418, $43,388 for men and $30,747 for women, a difference of 29.1%.
| Sex | Number | Average Earnings |
| Male | 27,941 (57.4%) | $43,388 |
| Female | 20,711 (42.6%) | $30,747 |
| Total | 48,652 (100.0%) | $37,418 |
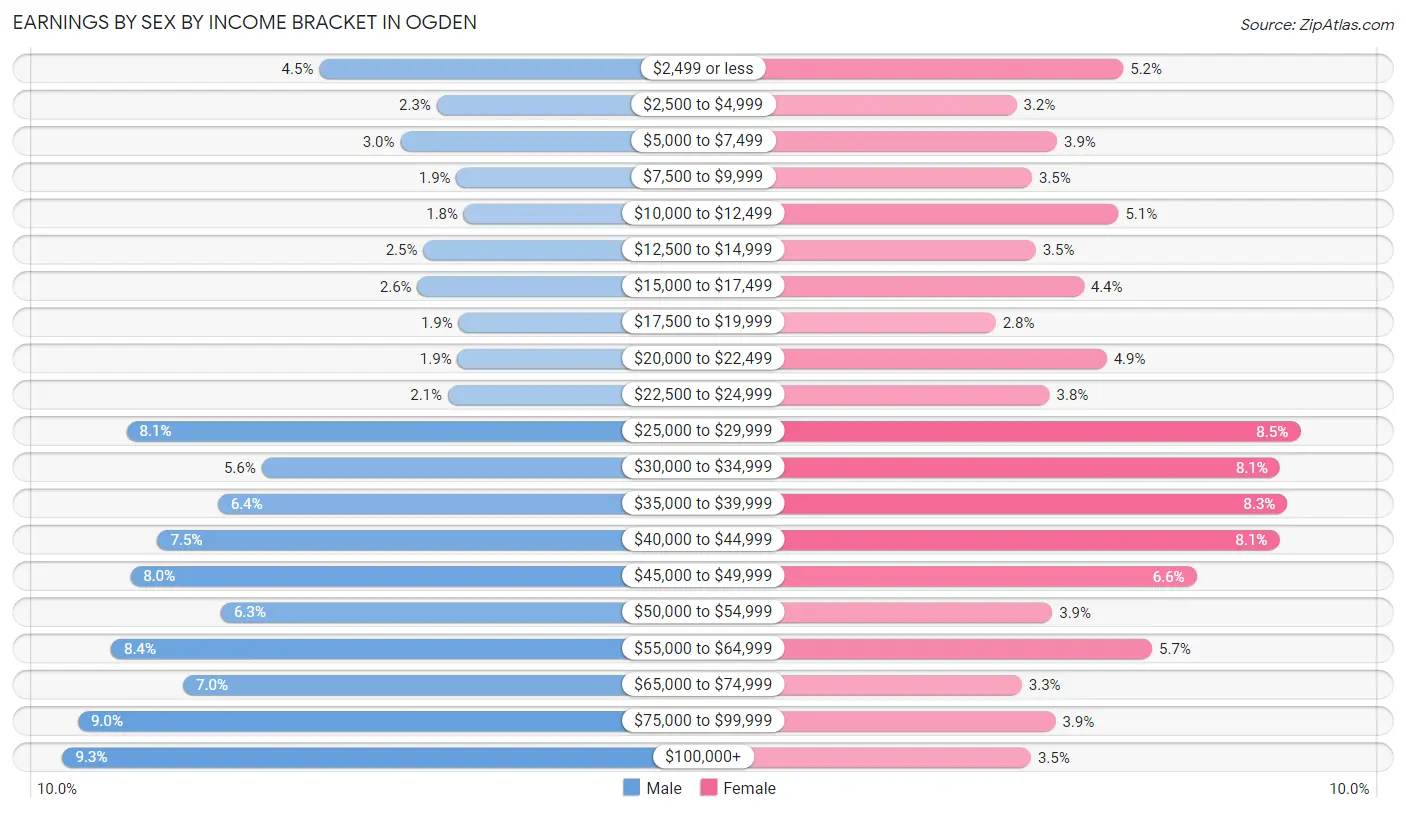
Earnings by Sex by Income Bracket in Ogden
The most common earnings brackets in Ogden are $100,000+ for men (2,597 | 9.3%) and $25,000 to $29,999 for women (1,759 | 8.5%).
| Income | Male | Female |
| $2,499 or less | 1,253 (4.5%) | 1,072 (5.2%) |
| $2,500 to $4,999 | 638 (2.3%) | 659 (3.2%) |
| $5,000 to $7,499 | 827 (3.0%) | 817 (3.9%) |
| $7,500 to $9,999 | 535 (1.9%) | 718 (3.5%) |
| $10,000 to $12,499 | 495 (1.8%) | 1,055 (5.1%) |
| $12,500 to $14,999 | 708 (2.5%) | 733 (3.5%) |
| $15,000 to $17,499 | 739 (2.6%) | 919 (4.4%) |
| $17,500 to $19,999 | 522 (1.9%) | 578 (2.8%) |
| $20,000 to $22,499 | 527 (1.9%) | 1,008 (4.9%) |
| $22,500 to $24,999 | 579 (2.1%) | 787 (3.8%) |
| $25,000 to $29,999 | 2,261 (8.1%) | 1,759 (8.5%) |
| $30,000 to $34,999 | 1,553 (5.6%) | 1,679 (8.1%) |
| $35,000 to $39,999 | 1,782 (6.4%) | 1,708 (8.3%) |
| $40,000 to $44,999 | 2,099 (7.5%) | 1,677 (8.1%) |
| $45,000 to $49,999 | 2,241 (8.0%) | 1,357 (6.6%) |
| $50,000 to $54,999 | 1,766 (6.3%) | 797 (3.8%) |
| $55,000 to $64,999 | 2,341 (8.4%) | 1,185 (5.7%) |
| $65,000 to $74,999 | 1,964 (7.0%) | 679 (3.3%) |
| $75,000 to $99,999 | 2,514 (9.0%) | 809 (3.9%) |
| $100,000+ | 2,597 (9.3%) | 715 (3.5%) |
| Total | 27,941 (100.0%) | 20,711 (100.0%) |
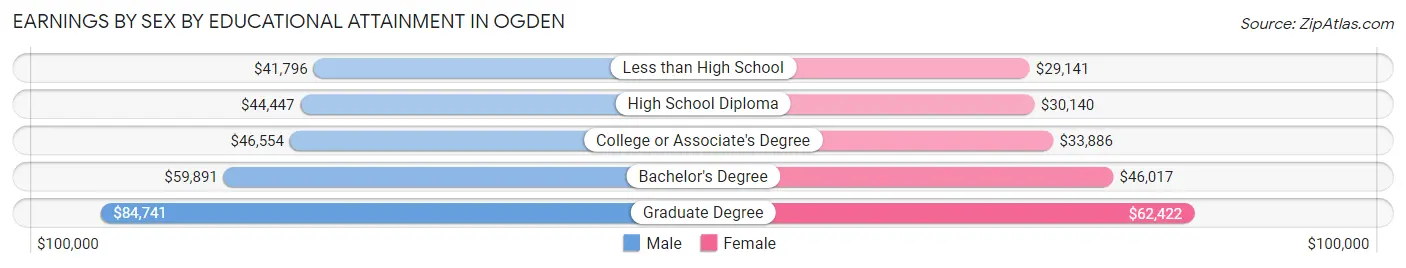
Earnings by Sex by Educational Attainment in Ogden
Average earnings in Ogden are $47,985 for men and $35,374 for women, a difference of 26.3%. Men with an educational attainment of graduate degree enjoy the highest average annual earnings of $84,741, while those with less than high school education earn the least with $41,796. Women with an educational attainment of graduate degree earn the most with the average annual earnings of $62,422, while those with less than high school education have the smallest earnings of $29,141.
| Educational Attainment | Male Income | Female Income |
| Less than High School | $41,796 | $29,141 |
| High School Diploma | $44,447 | $30,140 |
| College or Associate's Degree | $46,554 | $33,886 |
| Bachelor's Degree | $59,891 | $46,017 |
| Graduate Degree | $84,741 | $62,422 |
| Total | $47,985 | $35,374 |
Family Income in Ogden
Family Income Brackets in Ogden
According to the Ogden family income data, there are 4,488 families falling into the $50,000 to $74,999 income range, which is the most common income bracket and makes up 22.3% of all families. Conversely, the $10,000 to $14,999 income bracket is the least frequent group with only 221 families (1.1%) belonging to this category.
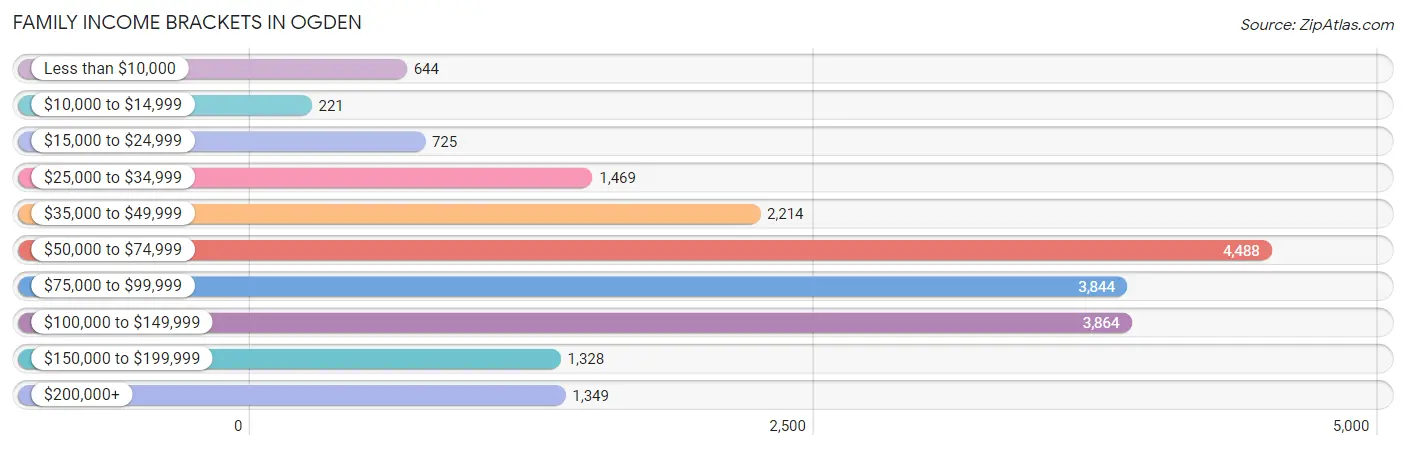
| Income Bracket | # Families | % Families |
| Less than $10,000 | 644 | 3.2% |
| $10,000 to $14,999 | 221 | 1.1% |
| $15,000 to $24,999 | 725 | 3.6% |
| $25,000 to $34,999 | 1,469 | 7.3% |
| $35,000 to $49,999 | 2,214 | 11.0% |
| $50,000 to $74,999 | 4,488 | 22.3% |
| $75,000 to $99,999 | 3,844 | 19.1% |
| $100,000 to $149,999 | 3,864 | 19.2% |
| $150,000 to $199,999 | 1,328 | 6.6% |
| $200,000+ | 1,349 | 6.7% |
Family Income by Famaliy Size in Ogden
7+ person families (629 | 3.1%) account for the highest median family income in Ogden with $107,101 per family, while 2-person families (8,585 | 42.6%) have the highest median income of $34,956 per family member.
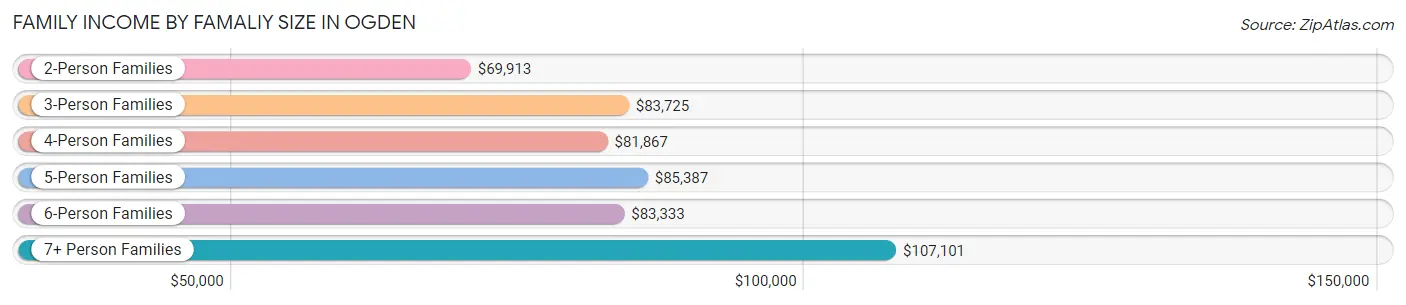
| Income Bracket | # Families | Median Income |
| 2-Person Families | 8,585 (42.6%) | $69,913 |
| 3-Person Families | 4,314 (21.4%) | $83,725 |
| 4-Person Families | 3,601 (17.9%) | $81,867 |
| 5-Person Families | 2,166 (10.8%) | $85,387 |
| 6-Person Families | 832 (4.1%) | $83,333 |
| 7+ Person Families | 629 (3.1%) | $107,101 |
| Total | 20,127 (100.0%) | $76,861 |
Family Income by Number of Earners in Ogden
The median family income in Ogden is $76,861, with families comprising 3+ earners (2,849) having the highest median family income of $117,149, while families with no earners (2,215) have the lowest median family income of $50,233, accounting for 14.2% and 11.0% of families, respectively.
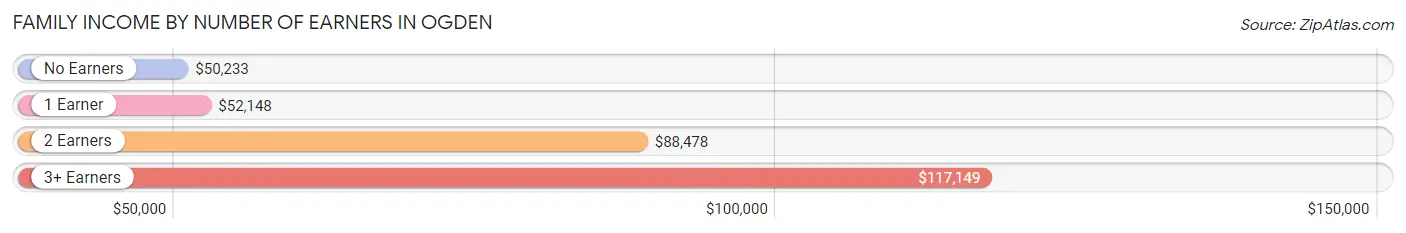
| Number of Earners | # Families | Median Income |
| No Earners | 2,215 (11.0%) | $50,233 |
| 1 Earner | 6,436 (32.0%) | $52,148 |
| 2 Earners | 8,627 (42.9%) | $88,478 |
| 3+ Earners | 2,849 (14.2%) | $117,149 |
| Total | 20,127 (100.0%) | $76,861 |
Household Income in Ogden
Household Income Brackets in Ogden
With 6,562 households falling in the category, the $50,000 to $74,999 income range is the most frequent in Ogden, accounting for 20.3% of all households. In contrast, only 1,293 households (4.0%) fall into the $10,000 to $14,999 income bracket, making it the least populous group.
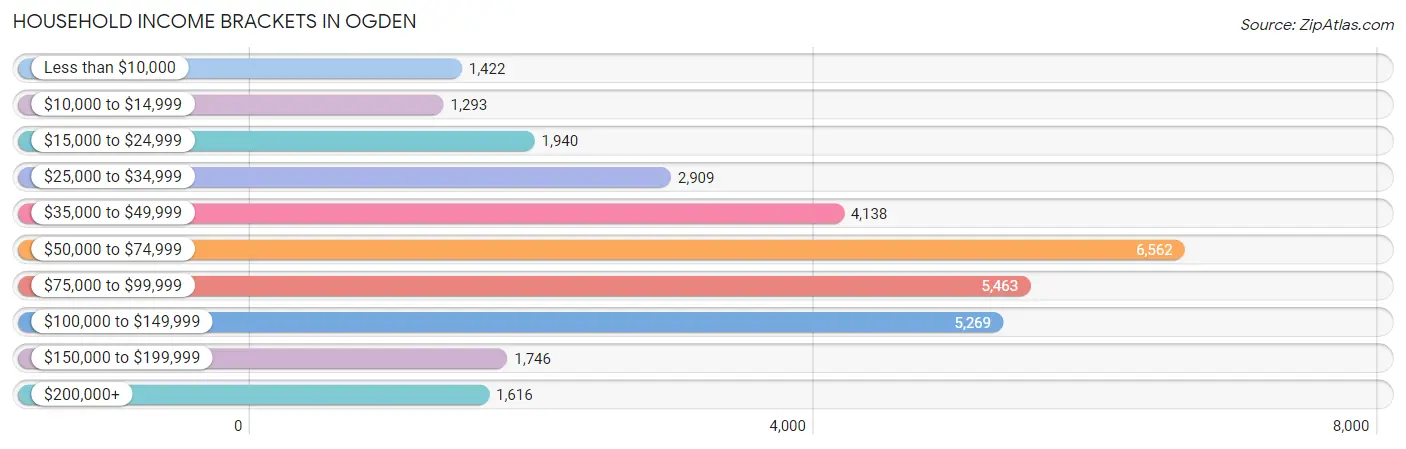
| Income Bracket | # Households | % Households |
| Less than $10,000 | 1,422 | 4.4% |
| $10,000 to $14,999 | 1,293 | 4.0% |
| $15,000 to $24,999 | 1,940 | 6.0% |
| $25,000 to $34,999 | 2,909 | 9.0% |
| $35,000 to $49,999 | 4,138 | 12.8% |
| $50,000 to $74,999 | 6,562 | 20.3% |
| $75,000 to $99,999 | 5,463 | 16.9% |
| $100,000 to $149,999 | 5,269 | 16.3% |
| $150,000 to $199,999 | 1,746 | 5.4% |
| $200,000+ | 1,616 | 5.0% |
Household Income by Householder Age in Ogden
The median household income in Ogden is $66,226, with the highest median household income of $77,042 found in the 45 to 64 years age bracket for the primary householder. A total of 10,360 households (32.1%) fall into this category. Meanwhile, the 15 to 24 years age bracket for the primary householder has the lowest median household income of $48,939, with 2,413 households (7.5%) in this group.
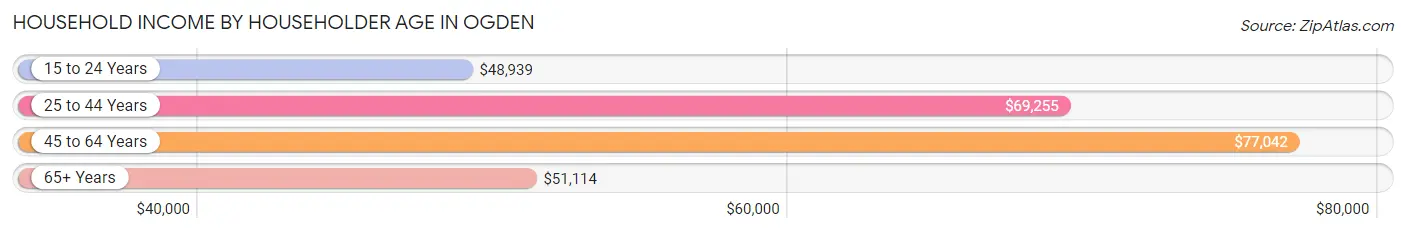
| Income Bracket | # Households | Median Income |
| 15 to 24 Years | 2,413 (7.5%) | $48,939 |
| 25 to 44 Years | 13,173 (40.7%) | $69,255 |
| 45 to 64 Years | 10,360 (32.1%) | $77,042 |
| 65+ Years | 6,380 (19.7%) | $51,114 |
| Total | 32,326 (100.0%) | $66,226 |
Poverty in Ogden
Income Below Poverty by Sex and Age in Ogden
With 10.9% poverty level for males and 13.4% for females among the residents of Ogden, 15 year old males and 15 year old females are the most vulnerable to poverty, with 117 males (19.1%) and 113 females (19.5%) in their respective age groups living below the poverty level.
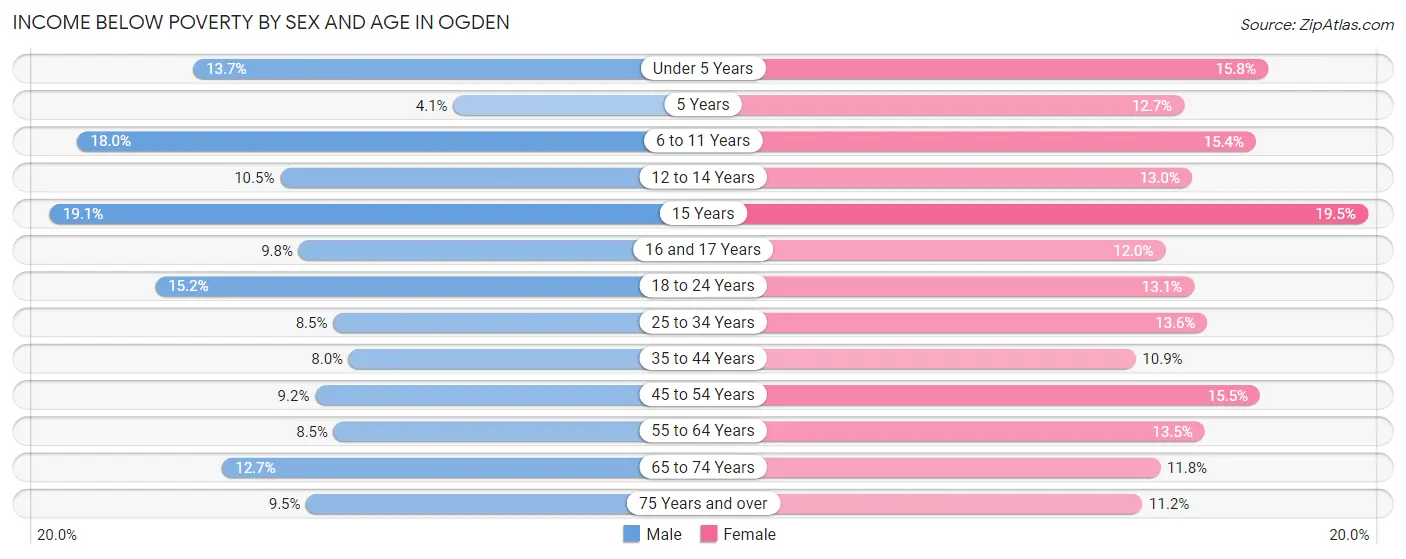
| Age Bracket | Male | Female |
| Under 5 Years | 396 (13.7%) | 460 (15.8%) |
| 5 Years | 31 (4.1%) | 62 (12.7%) |
| 6 to 11 Years | 681 (18.0%) | 484 (15.4%) |
| 12 to 14 Years | 152 (10.5%) | 201 (13.0%) |
| 15 Years | 117 (19.1%) | 113 (19.5%) |
| 16 and 17 Years | 121 (9.8%) | 114 (12.0%) |
| 18 to 24 Years | 767 (15.1%) | 628 (13.1%) |
| 25 to 34 Years | 712 (8.5%) | 968 (13.6%) |
| 35 to 44 Years | 487 (8.0%) | 555 (10.9%) |
| 45 to 54 Years | 453 (9.2%) | 659 (15.5%) |
| 55 to 64 Years | 395 (8.5%) | 629 (13.5%) |
| 65 to 74 Years | 379 (12.7%) | 357 (11.8%) |
| 75 Years and over | 121 (9.5%) | 248 (11.2%) |
| Total | 4,812 (10.9%) | 5,478 (13.4%) |
Income Above Poverty by Sex and Age in Ogden
According to the poverty statistics in Ogden, males aged 5 years and females aged 35 to 44 years are the age groups that are most secure financially, with 95.9% of males and 89.1% of females in these age groups living above the poverty line.
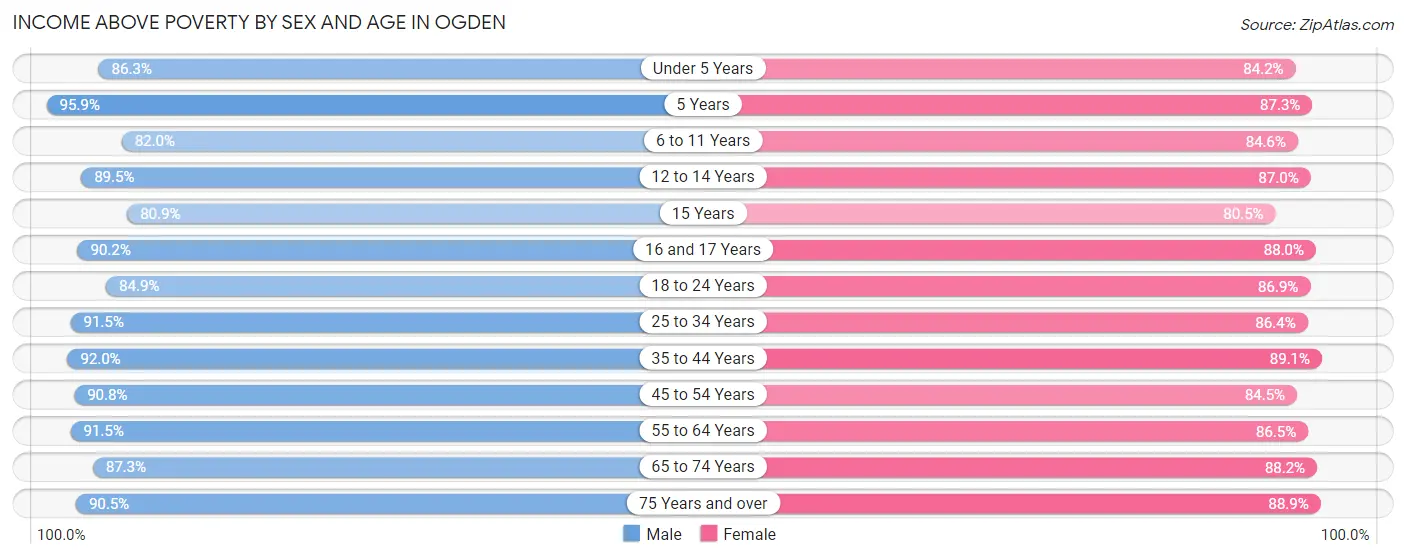
| Age Bracket | Male | Female |
| Under 5 Years | 2,487 (86.3%) | 2,449 (84.2%) |
| 5 Years | 729 (95.9%) | 426 (87.3%) |
| 6 to 11 Years | 3,097 (82.0%) | 2,665 (84.6%) |
| 12 to 14 Years | 1,294 (89.5%) | 1,346 (87.0%) |
| 15 Years | 497 (80.9%) | 466 (80.5%) |
| 16 and 17 Years | 1,111 (90.2%) | 835 (88.0%) |
| 18 to 24 Years | 4,297 (84.9%) | 4,178 (86.9%) |
| 25 to 34 Years | 7,625 (91.5%) | 6,168 (86.4%) |
| 35 to 44 Years | 5,630 (92.0%) | 4,537 (89.1%) |
| 45 to 54 Years | 4,465 (90.8%) | 3,588 (84.5%) |
| 55 to 64 Years | 4,239 (91.5%) | 4,042 (86.5%) |
| 65 to 74 Years | 2,615 (87.3%) | 2,667 (88.2%) |
| 75 Years and over | 1,148 (90.5%) | 1,977 (88.8%) |
| Total | 39,234 (89.1%) | 35,344 (86.6%) |
Income Below Poverty Among Married-Couple Families in Ogden
The poverty statistics for married-couple families in Ogden show that 2.9% or 408 of the total 13,919 families live below the poverty line. Families with 3 or 4 children have the highest poverty rate of 7.0%, comprising of 109 families. On the other hand, families with no children have the lowest poverty rate of 1.9%, which includes 139 families.
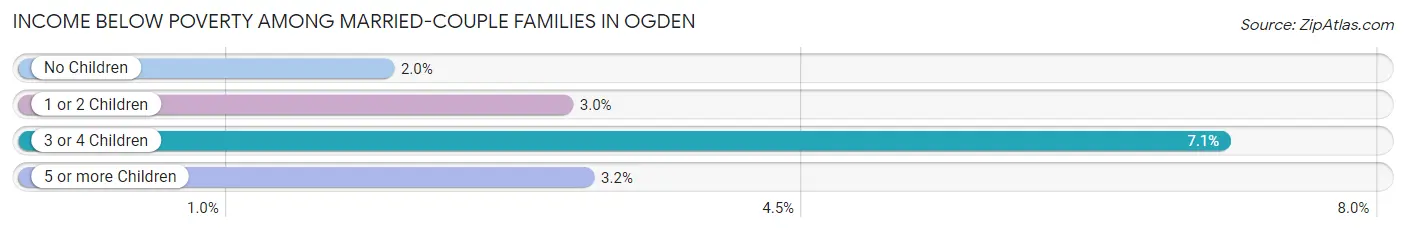
| Children | Above Poverty | Below Poverty |
| No Children | 6,981 (98.1%) | 139 (1.9%) |
| 1 or 2 Children | 4,849 (97.0%) | 152 (3.0%) |
| 3 or 4 Children | 1,437 (92.9%) | 109 (7.0%) |
| 5 or more Children | 244 (96.8%) | 8 (3.2%) |
| Total | 13,511 (97.1%) | 408 (2.9%) |
Income Below Poverty Among Single-Parent Households in Ogden
According to the poverty data in Ogden, 5.7% or 123 single-father households and 26.2% or 1,061 single-mother households are living below the poverty line. Among single-father households, those with 5 or more children have the highest poverty rate, with 34 households (72.3%) experiencing poverty. Likewise, among single-mother households, those with 3 or 4 children have the highest poverty rate, with 276 households (46.5%) falling below the poverty line.
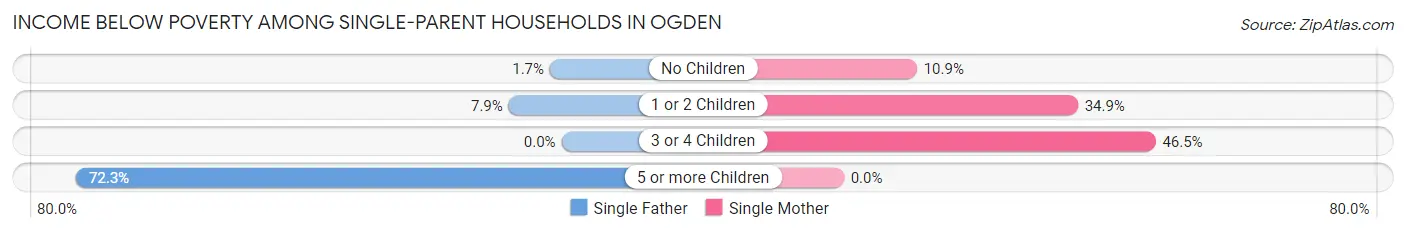
| Children | Single Father | Single Mother |
| No Children | 13 (1.7%) | 189 (10.9%) |
| 1 or 2 Children | 76 (7.9%) | 596 (34.9%) |
| 3 or 4 Children | 0 (0.0%) | 276 (46.5%) |
| 5 or more Children | 34 (72.3%) | 0 (0.0%) |
| Total | 123 (5.7%) | 1,061 (26.2%) |
Income Below Poverty Among Married-Couple vs Single-Parent Households in Ogden
The poverty data for Ogden shows that 408 of the married-couple family households (2.9%) and 1,184 of the single-parent households (19.1%) are living below the poverty level. Within the married-couple family households, those with 3 or 4 children have the highest poverty rate, with 109 households (7.0%) falling below the poverty line. Among the single-parent households, those with 5 or more children have the highest poverty rate, with 34 household (60.7%) living below poverty.
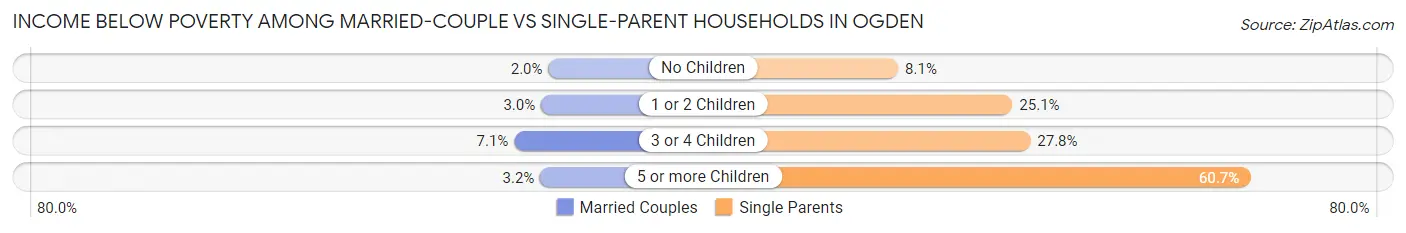
| Children | Married-Couple Families | Single-Parent Households |
| No Children | 139 (1.9%) | 202 (8.1%) |
| 1 or 2 Children | 152 (3.0%) | 672 (25.1%) |
| 3 or 4 Children | 109 (7.0%) | 276 (27.8%) |
| 5 or more Children | 8 (3.2%) | 34 (60.7%) |
| Total | 408 (2.9%) | 1,184 (19.1%) |
Race in Ogden
The most populous races in Ogden are White / Caucasian (68,467 | 78.9%), Hispanic or Latino (25,711 | 29.6%), and Two or more Races (7,543 | 8.7%).
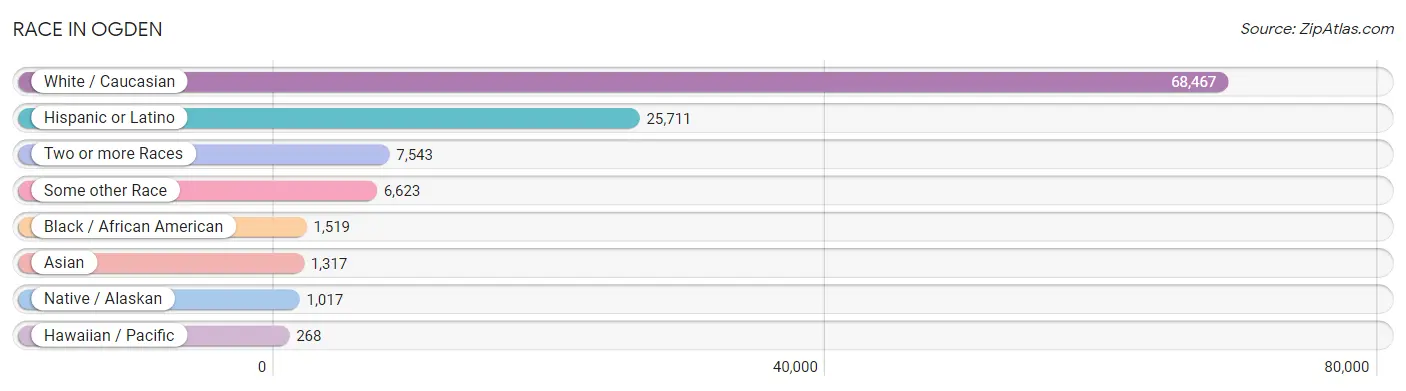
| Race | # Population | % Population |
| Asian | 1,317 | 1.5% |
| Black / African American | 1,519 | 1.8% |
| Hawaiian / Pacific | 268 | 0.3% |
| Hispanic or Latino | 25,711 | 29.6% |
| Native / Alaskan | 1,017 | 1.2% |
| White / Caucasian | 68,467 | 78.9% |
| Two or more Races | 7,543 | 8.7% |
| Some other Race | 6,623 | 7.6% |
| Total | 86,754 | 100.0% |
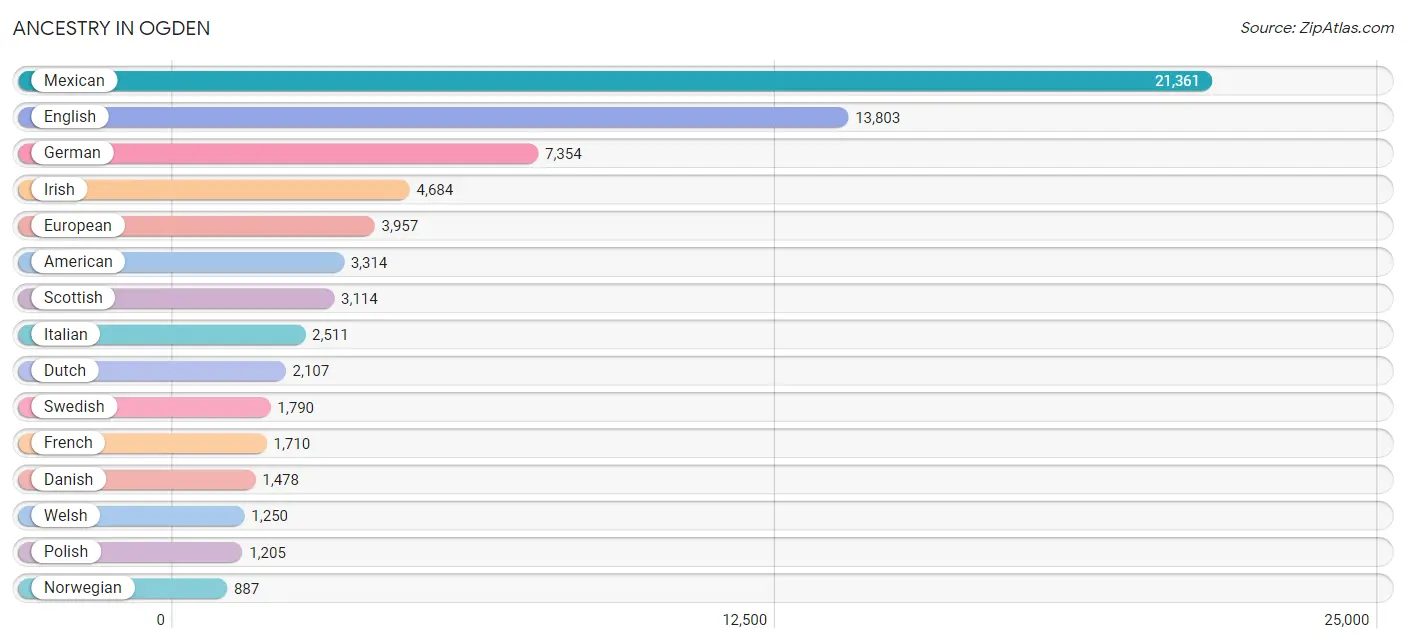
Ancestry in Ogden
The most populous ancestries reported in Ogden are Mexican (21,361 | 24.6%), English (13,803 | 15.9%), German (7,354 | 8.5%), Irish (4,684 | 5.4%), and European (3,957 | 4.6%), together accounting for 59.0% of all Ogden residents.
| Ancestry | # Population | % Population |
| African | 180 | 0.2% |
| Alaskan Athabascan | 27 | 0.0% |
| American | 3,314 | 3.8% |
| Apache | 13 | 0.0% |
| Arab | 373 | 0.4% |
| Arapaho | 10 | 0.0% |
| Argentinean | 151 | 0.2% |
| Armenian | 12 | 0.0% |
| Australian | 31 | 0.0% |
| Austrian | 77 | 0.1% |
| Bangladeshi | 50 | 0.1% |
| Basque | 63 | 0.1% |
| Belgian | 43 | 0.1% |
| Bhutanese | 695 | 0.8% |
| Blackfeet | 122 | 0.1% |
| Bolivian | 13 | 0.0% |
| Brazilian | 168 | 0.2% |
| British | 801 | 0.9% |
| Bulgarian | 27 | 0.0% |
| Burmese | 160 | 0.2% |
| Canadian | 283 | 0.3% |
| Central American | 625 | 0.7% |
| Central American Indian | 208 | 0.2% |
| Cherokee | 214 | 0.3% |
| Cheyenne | 69 | 0.1% |
| Chilean | 165 | 0.2% |
| Chippewa | 16 | 0.0% |
| Choctaw | 44 | 0.1% |
| Colombian | 56 | 0.1% |
| Costa Rican | 53 | 0.1% |
| Creek | 16 | 0.0% |
| Croatian | 32 | 0.0% |
| Cuban | 62 | 0.1% |
| Czech | 99 | 0.1% |
| Czechoslovakian | 25 | 0.0% |
| Danish | 1,478 | 1.7% |
| Dominican | 39 | 0.0% |
| Dutch | 2,107 | 2.4% |
| Eastern European | 265 | 0.3% |
| Ecuadorian | 67 | 0.1% |
| English | 13,803 | 15.9% |
| European | 3,957 | 4.6% |
| Fijian | 21 | 0.0% |
| Filipino | 56 | 0.1% |
| Finnish | 397 | 0.5% |
| French | 1,710 | 2.0% |
| French Canadian | 355 | 0.4% |
| German | 7,354 | 8.5% |
| Ghanaian | 11 | 0.0% |
| Greek | 200 | 0.2% |
| Guamanian / Chamorro | 73 | 0.1% |
| Guatemalan | 102 | 0.1% |
| Guyanese | 11 | 0.0% |
| Haitian | 17 | 0.0% |
| Honduran | 36 | 0.0% |
| Hungarian | 126 | 0.2% |
| Icelander | 14 | 0.0% |
| Indian (Asian) | 561 | 0.6% |
| Inupiat | 76 | 0.1% |
| Iranian | 16 | 0.0% |
| Irish | 4,684 | 5.4% |
| Italian | 2,511 | 2.9% |
| Jamaican | 22 | 0.0% |
| Japanese | 34 | 0.0% |
| Kiowa | 21 | 0.0% |
| Korean | 289 | 0.3% |
| Latvian | 11 | 0.0% |
| Lebanese | 83 | 0.1% |
| Liberian | 8 | 0.0% |
| Lithuanian | 20 | 0.0% |
| Macedonian | 42 | 0.1% |
| Marshallese | 17 | 0.0% |
| Mexican | 21,361 | 24.6% |
| Mexican American Indian | 328 | 0.4% |
| Moroccan | 238 | 0.3% |
| Native Hawaiian | 201 | 0.2% |
| Navajo | 338 | 0.4% |
| New Zealander | 9 | 0.0% |
| Nicaraguan | 49 | 0.1% |
| Nigerian | 38 | 0.0% |
| Northern European | 264 | 0.3% |
| Norwegian | 887 | 1.0% |
| Osage | 8 | 0.0% |
| Pakistani | 83 | 0.1% |
| Panamanian | 23 | 0.0% |
| Paraguayan | 50 | 0.1% |
| Peruvian | 190 | 0.2% |
| Polish | 1,205 | 1.4% |
| Portuguese | 135 | 0.2% |
| Pueblo | 49 | 0.1% |
| Puerto Rican | 644 | 0.7% |
| Romanian | 52 | 0.1% |
| Russian | 208 | 0.2% |
| Salvadoran | 362 | 0.4% |
| Samoan | 344 | 0.4% |
| Scandinavian | 569 | 0.7% |
| Scotch-Irish | 699 | 0.8% |
| Scottish | 3,114 | 3.6% |
| Serbian | 65 | 0.1% |
| Shoshone | 54 | 0.1% |
| Sioux | 95 | 0.1% |
| Slavic | 96 | 0.1% |
| Slovak | 14 | 0.0% |
| Slovene | 101 | 0.1% |
| Somali | 37 | 0.0% |
| South American | 730 | 0.8% |
| South American Indian | 57 | 0.1% |
| Spaniard | 574 | 0.7% |
| Spanish | 586 | 0.7% |
| Spanish American | 55 | 0.1% |
| Spanish American Indian | 146 | 0.2% |
| Sri Lankan | 444 | 0.5% |
| Subsaharan African | 390 | 0.4% |
| Sudanese | 37 | 0.0% |
| Swedish | 1,790 | 2.1% |
| Swiss | 357 | 0.4% |
| Syrian | 41 | 0.1% |
| Thai | 63 | 0.1% |
| Tongan | 56 | 0.1% |
| Trinidadian and Tobagonian | 58 | 0.1% |
| Turkish | 30 | 0.0% |
| Ukrainian | 18 | 0.0% |
| Uruguayan | 31 | 0.0% |
| Ute | 26 | 0.0% |
| Venezuelan | 7 | 0.0% |
| Welsh | 1,250 | 1.4% |
| West Indian | 47 | 0.1% |
| Yugoslavian | 9 | 0.0% |
| Yup'ik | 10 | 0.0% | View All 129 Rows |
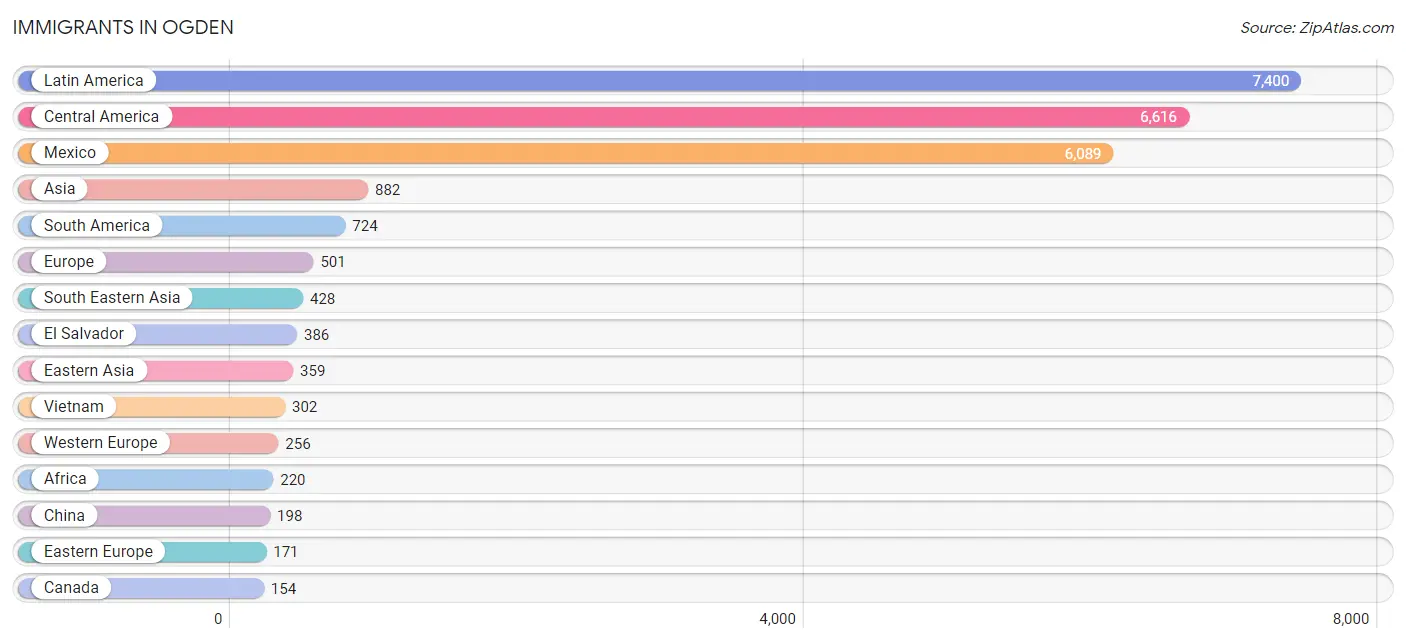
Immigrants in Ogden
The most numerous immigrant groups reported in Ogden came from Latin America (7,400 | 8.5%), Central America (6,616 | 7.6%), Mexico (6,089 | 7.0%), Asia (882 | 1.0%), and South America (724 | 0.8%), together accounting for 25.0% of all Ogden residents.
| Immigration Origin | # Population | % Population |
| Africa | 220 | 0.3% |
| Argentina | 124 | 0.1% |
| Asia | 882 | 1.0% |
| Australia | 8 | 0.0% |
| Belgium | 152 | 0.2% |
| Belize | 5 | 0.0% |
| Bolivia | 13 | 0.0% |
| Brazil | 97 | 0.1% |
| Bulgaria | 27 | 0.0% |
| Canada | 154 | 0.2% |
| Caribbean | 60 | 0.1% |
| Central America | 6,616 | 7.6% |
| Chile | 78 | 0.1% |
| China | 198 | 0.2% |
| Colombia | 48 | 0.1% |
| Croatia | 23 | 0.0% |
| Cuba | 11 | 0.0% |
| Czechoslovakia | 15 | 0.0% |
| Eastern Africa | 149 | 0.2% |
| Eastern Asia | 359 | 0.4% |
| Eastern Europe | 171 | 0.2% |
| Ecuador | 9 | 0.0% |
| El Salvador | 386 | 0.4% |
| England | 21 | 0.0% |
| Europe | 501 | 0.6% |
| Germany | 93 | 0.1% |
| Guatemala | 64 | 0.1% |
| Honduras | 23 | 0.0% |
| Hong Kong | 25 | 0.0% |
| Hungary | 14 | 0.0% |
| India | 31 | 0.0% |
| Indonesia | 10 | 0.0% |
| Iran | 16 | 0.0% |
| Italy | 11 | 0.0% |
| Jamaica | 3 | 0.0% |
| Japan | 51 | 0.1% |
| Kenya | 19 | 0.0% |
| Korea | 110 | 0.1% |
| Kuwait | 8 | 0.0% |
| Laos | 7 | 0.0% |
| Latin America | 7,400 | 8.5% |
| Liberia | 15 | 0.0% |
| Mexico | 6,089 | 7.0% |
| Moldova | 21 | 0.0% |
| Netherlands | 11 | 0.0% |
| Nicaragua | 49 | 0.1% |
| Nigeria | 19 | 0.0% |
| Northern Europe | 41 | 0.1% |
| Oceania | 76 | 0.1% |
| Pakistan | 24 | 0.0% |
| Peru | 144 | 0.2% |
| Philippines | 97 | 0.1% |
| Poland | 25 | 0.0% |
| Romania | 16 | 0.0% |
| Russia | 12 | 0.0% |
| Saudi Arabia | 16 | 0.0% |
| Scotland | 15 | 0.0% |
| Somalia | 37 | 0.0% |
| South Africa | 6 | 0.0% |
| South America | 724 | 0.8% |
| South Central Asia | 71 | 0.1% |
| South Eastern Asia | 428 | 0.5% |
| Southern Europe | 33 | 0.0% |
| Spain | 22 | 0.0% |
| Taiwan | 44 | 0.1% |
| Thailand | 12 | 0.0% |
| Trinidad and Tobago | 46 | 0.1% |
| Ukraine | 18 | 0.0% |
| Uruguay | 154 | 0.2% |
| Venezuela | 7 | 0.0% |
| Vietnam | 302 | 0.4% |
| Western Africa | 64 | 0.1% |
| Western Asia | 24 | 0.0% |
| Western Europe | 256 | 0.3% | View All 74 Rows |
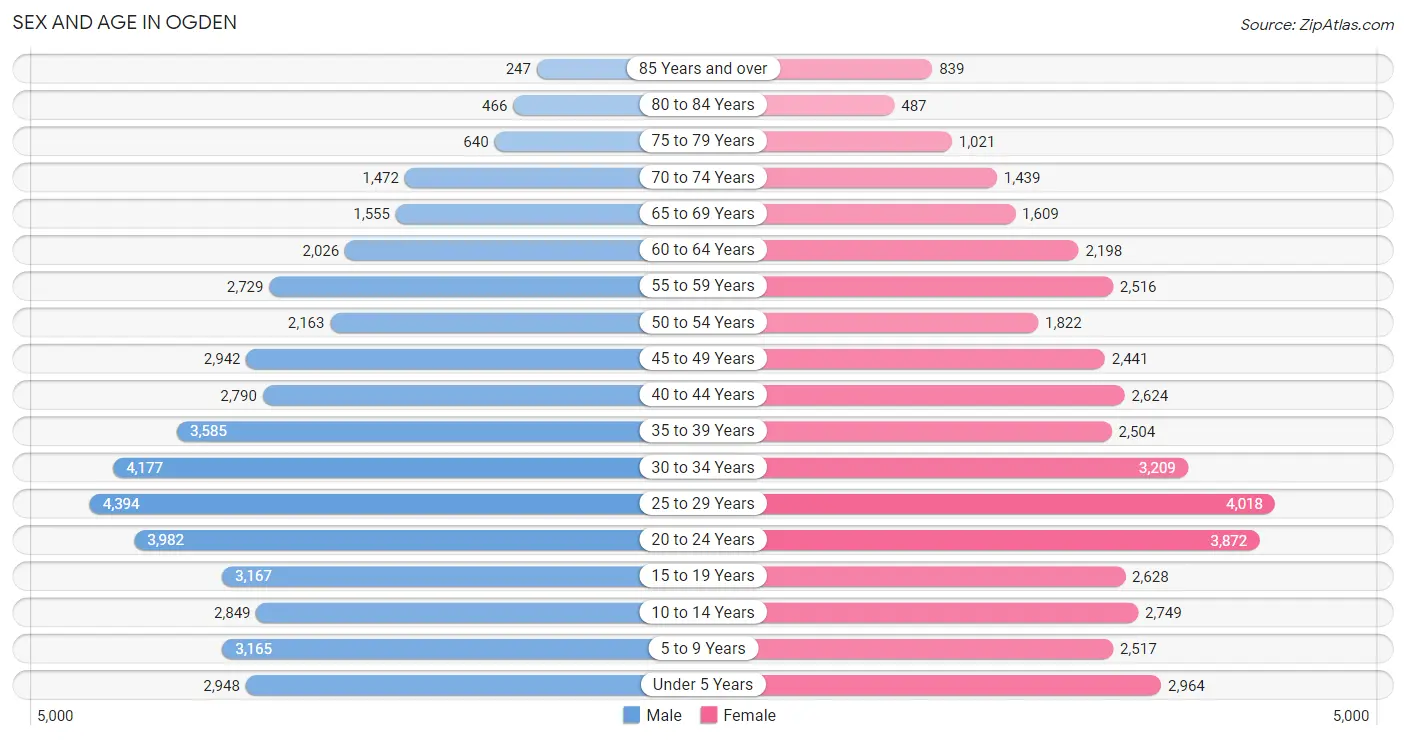
Sex and Age in Ogden
Sex and Age in Ogden
The most populous age groups in Ogden are 25 to 29 Years (4,394 | 9.7%) for men and 25 to 29 Years (4,018 | 9.7%) for women.
| Age Bracket | Male | Female |
| Under 5 Years | 2,948 (6.5%) | 2,964 (7.1%) |
| 5 to 9 Years | 3,165 (7.0%) | 2,517 (6.1%) |
| 10 to 14 Years | 2,849 (6.3%) | 2,749 (6.6%) |
| 15 to 19 Years | 3,167 (7.0%) | 2,628 (6.3%) |
| 20 to 24 Years | 3,982 (8.8%) | 3,872 (9.3%) |
| 25 to 29 Years | 4,394 (9.7%) | 4,018 (9.7%) |
| 30 to 34 Years | 4,177 (9.2%) | 3,209 (7.7%) |
| 35 to 39 Years | 3,585 (7.9%) | 2,504 (6.0%) |
| 40 to 44 Years | 2,790 (6.2%) | 2,624 (6.3%) |
| 45 to 49 Years | 2,942 (6.5%) | 2,441 (5.9%) |
| 50 to 54 Years | 2,163 (4.8%) | 1,822 (4.4%) |
| 55 to 59 Years | 2,729 (6.0%) | 2,516 (6.1%) |
| 60 to 64 Years | 2,026 (4.5%) | 2,198 (5.3%) |
| 65 to 69 Years | 1,555 (3.4%) | 1,609 (3.9%) |
| 70 to 74 Years | 1,472 (3.3%) | 1,439 (3.5%) |
| 75 to 79 Years | 640 (1.4%) | 1,021 (2.5%) |
| 80 to 84 Years | 466 (1.0%) | 487 (1.2%) |
| 85 Years and over | 247 (0.5%) | 839 (2.0%) |
| Total | 45,297 (100.0%) | 41,457 (100.0%) |
Families and Households in Ogden
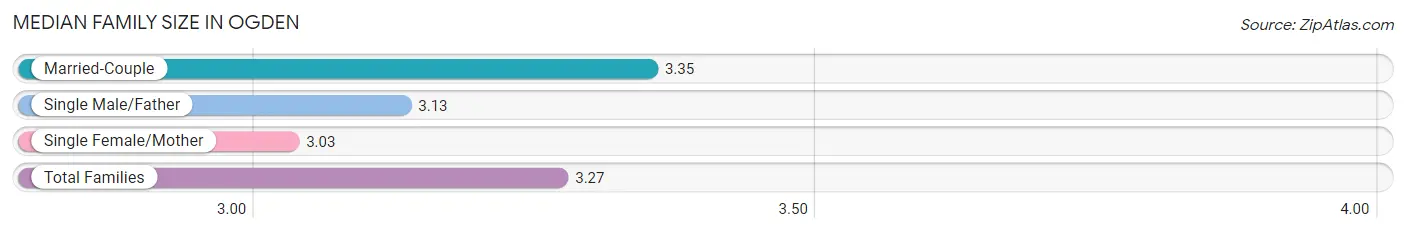
Median Family Size in Ogden
The median family size in Ogden is 3.27 persons per family, with married-couple families (13,919 | 69.2%) accounting for the largest median family size of 3.35 persons per family. On the other hand, single female/mother families (4,047 | 20.1%) represent the smallest median family size with 3.03 persons per family.
| Family Type | # Families | Family Size |
| Married-Couple | 13,919 (69.2%) | 3.35 |
| Single Male/Father | 2,161 (10.7%) | 3.13 |
| Single Female/Mother | 4,047 (20.1%) | 3.03 |
| Total Families | 20,127 (100.0%) | 3.27 |
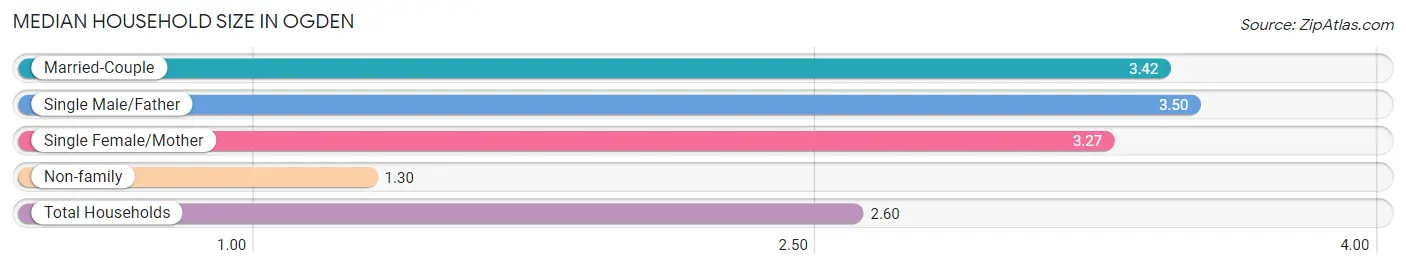
Median Household Size in Ogden
The median household size in Ogden is 2.60 persons per household, with single male/father households (2,161 | 6.7%) accounting for the largest median household size of 3.5 persons per household. non-family households (12,199 | 37.7%) represent the smallest median household size with 1.30 persons per household.
| Household Type | # Households | Household Size |
| Married-Couple | 13,919 (43.1%) | 3.42 |
| Single Male/Father | 2,161 (6.7%) | 3.50 |
| Single Female/Mother | 4,047 (12.5%) | 3.27 |
| Non-family | 12,199 (37.7%) | 1.30 |
| Total Households | 32,326 (100.0%) | 2.60 |
Household Size by Marriage Status in Ogden
Out of a total of 32,326 households in Ogden, 20,127 (62.3%) are family households, while 12,199 (37.7%) are nonfamily households. The most numerous type of family households are 2-person households, comprising 7,580, and the most common type of nonfamily households are 1-person households, comprising 9,513.
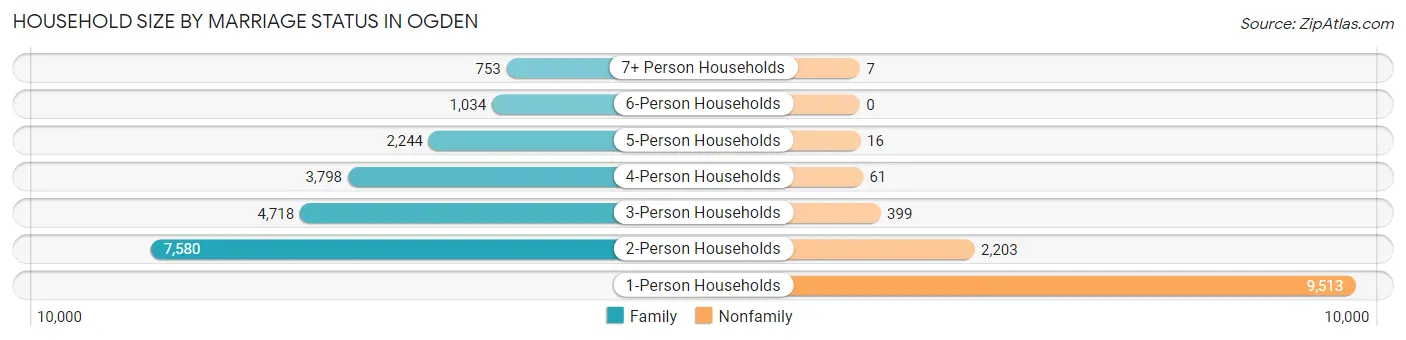
| Household Size | Family Households | Nonfamily Households |
| 1-Person Households | - | 9,513 (29.4%) |
| 2-Person Households | 7,580 (23.4%) | 2,203 (6.8%) |
| 3-Person Households | 4,718 (14.6%) | 399 (1.2%) |
| 4-Person Households | 3,798 (11.7%) | 61 (0.2%) |
| 5-Person Households | 2,244 (6.9%) | 16 (0.1%) |
| 6-Person Households | 1,034 (3.2%) | 0 (0.0%) |
| 7+ Person Households | 753 (2.3%) | 7 (0.0%) |
| Total | 20,127 (62.3%) | 12,199 (37.7%) |
Female Fertility in Ogden
Fertility by Age in Ogden
Average fertility rate in Ogden is 58.0 births per 1,000 women. Women in the age bracket of 20 to 34 years have the highest fertility rate with 92.0 births per 1,000 women. Women in the age bracket of 20 to 34 years acount for 82.3% of all women with births.
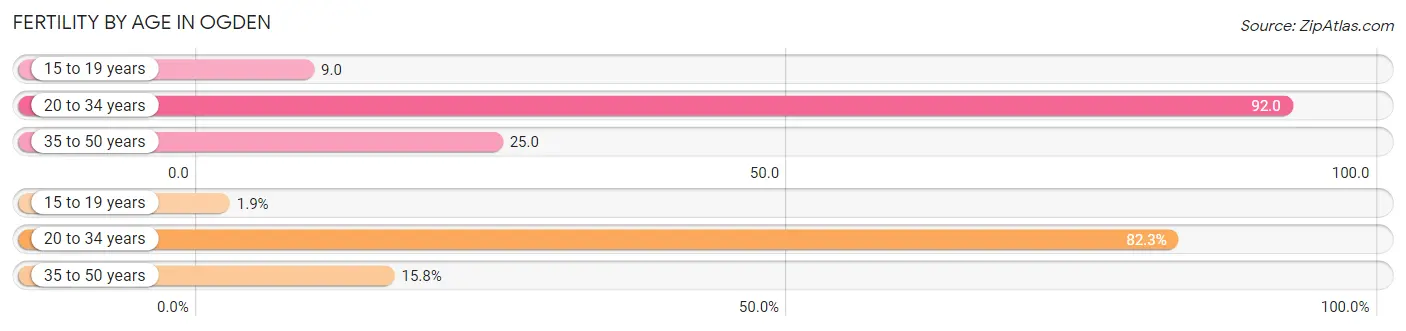
| Age Bracket | Women with Births | Births / 1,000 Women |
| 15 to 19 years | 23 (1.8%) | 9.0 |
| 20 to 34 years | 1,025 (82.3%) | 92.0 |
| 35 to 50 years | 197 (15.8%) | 25.0 |
| Total | 1,245 (100.0%) | 58.0 |
Fertility by Age by Marriage Status in Ogden
67.6% of women with births (1,245) in Ogden are married. The highest percentage of unmarried women with births falls into 15 to 19 years age bracket with 100.0% of them unmarried at the time of birth, while the lowest percentage of unmarried women with births belong to 35 to 50 years age bracket with 26.9% of them unmarried.
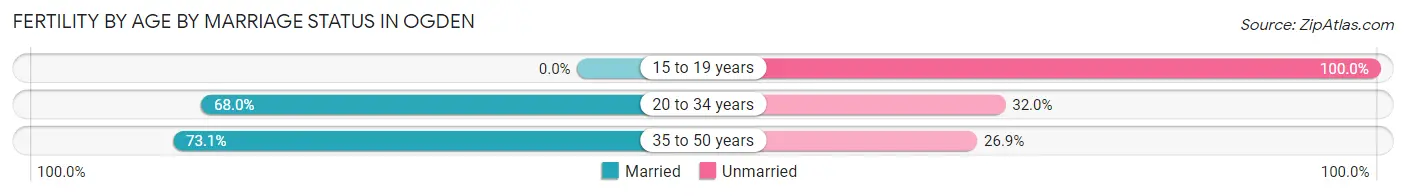
| Age Bracket | Married | Unmarried |
| 15 to 19 years | 0 (0.0%) | 23 (100.0%) |
| 20 to 34 years | 697 (68.0%) | 328 (32.0%) |
| 35 to 50 years | 144 (73.1%) | 53 (26.9%) |
| Total | 842 (67.6%) | 403 (32.4%) |
Fertility by Education in Ogden
Average fertility rate in Ogden is 58.0 births per 1,000 women. Women with the education attainment of bachelor's degree have the highest fertility rate of 78.0 births per 1,000 women, while women with the education attainment of college or associate's degree have the lowest fertility at 38.0 births per 1,000 women. Women with the education attainment of high school diploma represent 35.3% of all women with births.
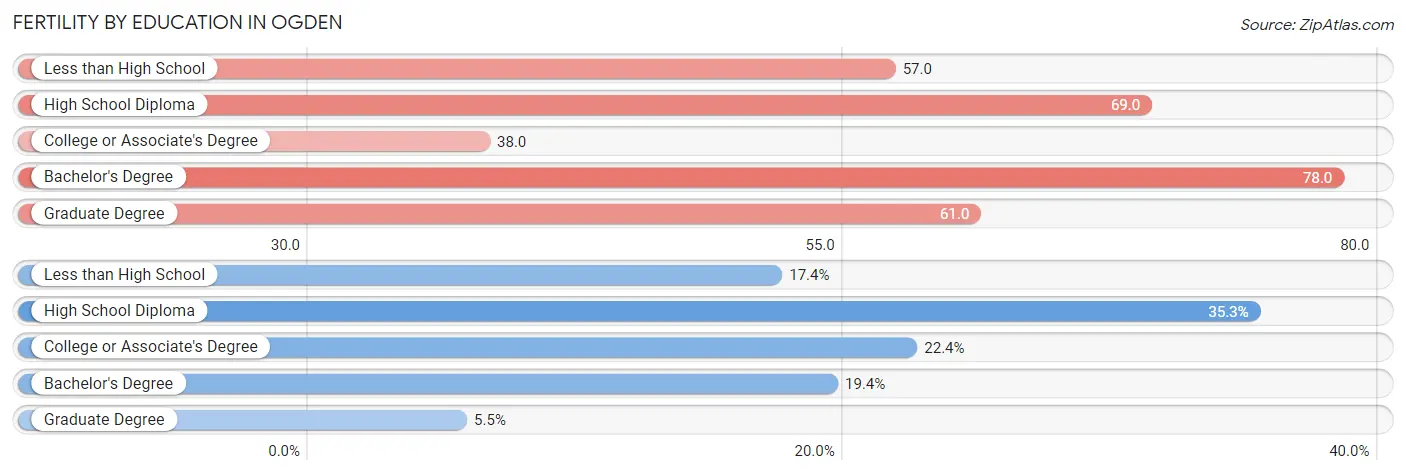
| Educational Attainment | Women with Births | Births / 1,000 Women |
| Less than High School | 216 (17.3%) | 57.0 |
| High School Diploma | 439 (35.3%) | 69.0 |
| College or Associate's Degree | 279 (22.4%) | 38.0 |
| Bachelor's Degree | 242 (19.4%) | 78.0 |
| Graduate Degree | 69 (5.5%) | 61.0 |
| Total | 1,245 (100.0%) | 58.0 |
Fertility by Education by Marriage Status in Ogden
32.4% of women with births in Ogden are unmarried. Women with the educational attainment of bachelor's degree are most likely to be married with 100.0% of them married at childbirth, while women with the educational attainment of high school diploma are least likely to be married with 48.7% of them unmarried at childbirth.
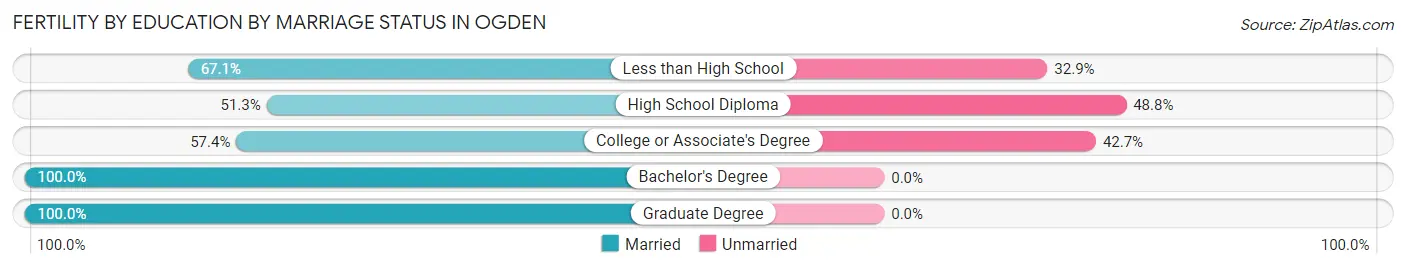
| Educational Attainment | Married | Unmarried |
| Less than High School | 145 (67.1%) | 71 (32.9%) |
| High School Diploma | 225 (51.2%) | 214 (48.7%) |
| College or Associate's Degree | 160 (57.4%) | 119 (42.6%) |
| Bachelor's Degree | 242 (100.0%) | 0 (0.0%) |
| Graduate Degree | 69 (100.0%) | 0 (0.0%) |
| Total | 842 (67.6%) | 403 (32.4%) |
Employment Characteristics in Ogden
Employment by Class of Employer in Ogden
Among the 43,686 employed individuals in Ogden, private company employees (31,441 | 72.0%), federal government employees (2,786 | 6.4%), and not-for-profit organizations (2,300 | 5.3%) make up the most common classes of employment.
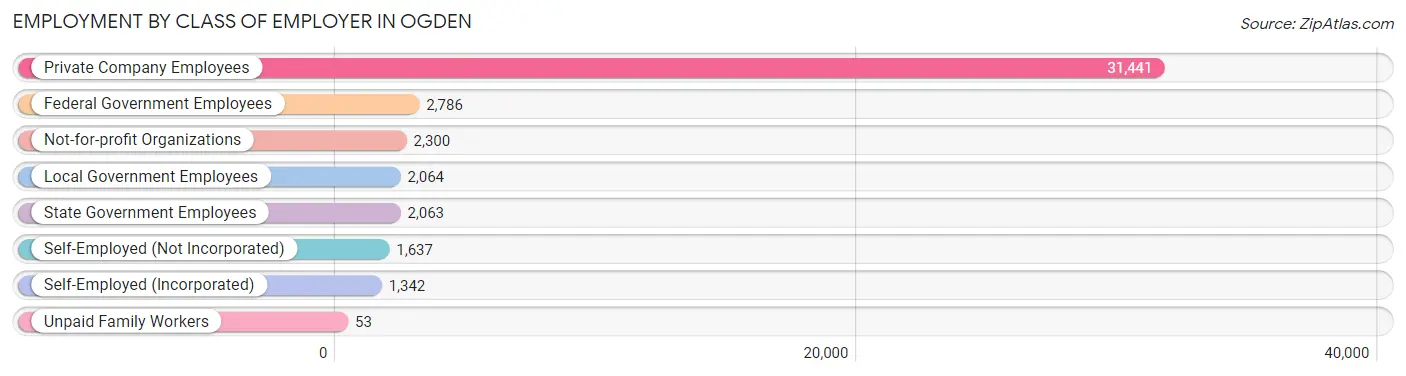
| Employer Class | # Employees | % Employees |
| Private Company Employees | 31,441 | 72.0% |
| Self-Employed (Incorporated) | 1,342 | 3.1% |
| Self-Employed (Not Incorporated) | 1,637 | 3.7% |
| Not-for-profit Organizations | 2,300 | 5.3% |
| Local Government Employees | 2,064 | 4.7% |
| State Government Employees | 2,063 | 4.7% |
| Federal Government Employees | 2,786 | 6.4% |
| Unpaid Family Workers | 53 | 0.1% |
| Total | 43,686 | 100.0% |
Employment Status by Age in Ogden
According to the labor force statistics for Ogden, out of the total population over 16 years of age (68,346), 68.1% or 46,544 individuals are in the labor force, with 4.3% or 2,001 of them unemployed. The age group with the highest labor force participation rate is 25 to 29 years, with 84.3% or 7,091 individuals in the labor force. Within the labor force, the 16 to 19 years age range has the highest percentage of unemployed individuals, with 13.6% or 295 of them being unemployed.
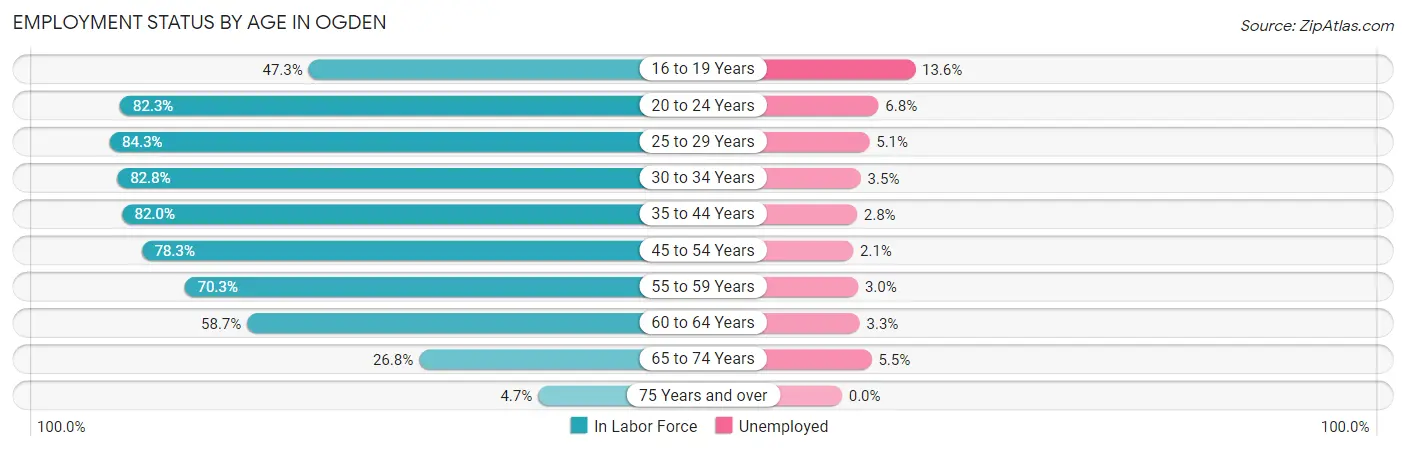
| Age Bracket | In Labor Force | Unemployed |
| 16 to 19 Years | 2,166 (47.3%) | 295 (13.6%) |
| 20 to 24 Years | 6,464 (82.3%) | 440 (6.8%) |
| 25 to 29 Years | 7,091 (84.3%) | 362 (5.1%) |
| 30 to 34 Years | 6,116 (82.8%) | 214 (3.5%) |
| 35 to 44 Years | 9,432 (82.0%) | 264 (2.8%) |
| 45 to 54 Years | 7,335 (78.3%) | 154 (2.1%) |
| 55 to 59 Years | 3,687 (70.3%) | 111 (3.0%) |
| 60 to 64 Years | 2,479 (58.7%) | 82 (3.3%) |
| 65 to 74 Years | 1,628 (26.8%) | 90 (5.5%) |
| 75 Years and over | 174 (4.7%) | 0 (0.0%) |
| Total | 46,544 (68.1%) | 2,001 (4.3%) |
Employment Status by Educational Attainment in Ogden
According to labor force statistics for Ogden, 78.3% of individuals (36,126) out of the total population between 25 and 64 years of age (46,138) are in the labor force, with 3.3% or 1,192 of them being unemployed. The group with the highest labor force participation rate are those with the educational attainment of bachelor's degree or higher, with 86.1% or 9,617 individuals in the labor force. Within the labor force, individuals with less than high school education have the highest percentage of unemployment, with 3.8% or 142 of them being unemployed.
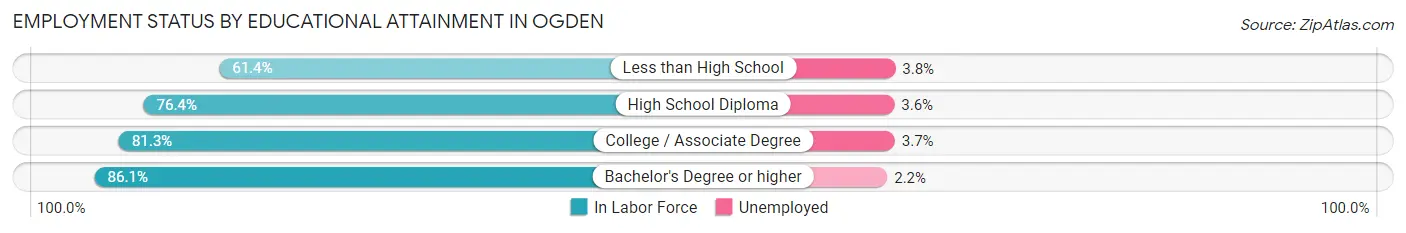
| Educational Attainment | In Labor Force | Unemployed |
| Less than High School | 3,747 (61.4%) | 232 (3.8%) |
| High School Diploma | 10,714 (76.4%) | 505 (3.6%) |
| College / Associate Degree | 12,066 (81.3%) | 549 (3.7%) |
| Bachelor's Degree or higher | 9,617 (86.1%) | 246 (2.2%) |
| Total | 36,126 (78.3%) | 1,523 (3.3%) |
Employment Occupations by Sex in Ogden
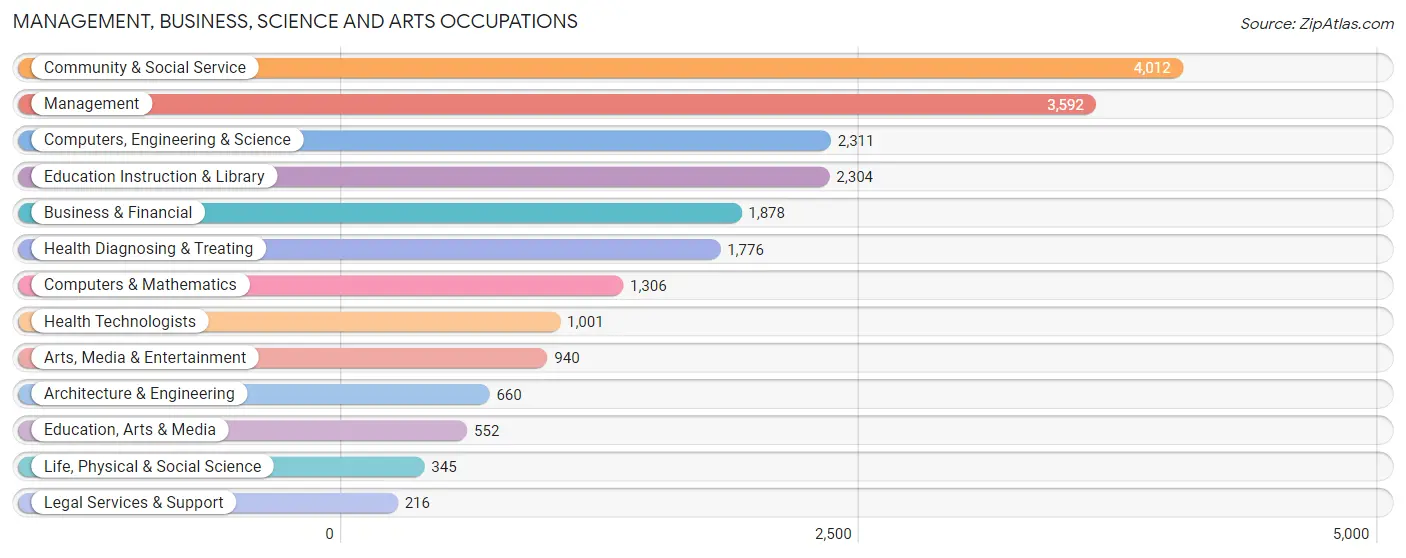
Management, Business, Science and Arts Occupations
The most common Management, Business, Science and Arts occupations in Ogden are Community & Social Service (4,012 | 9.0%), Management (3,592 | 8.1%), Computers, Engineering & Science (2,311 | 5.2%), Education Instruction & Library (2,304 | 5.2%), and Business & Financial (1,878 | 4.2%).
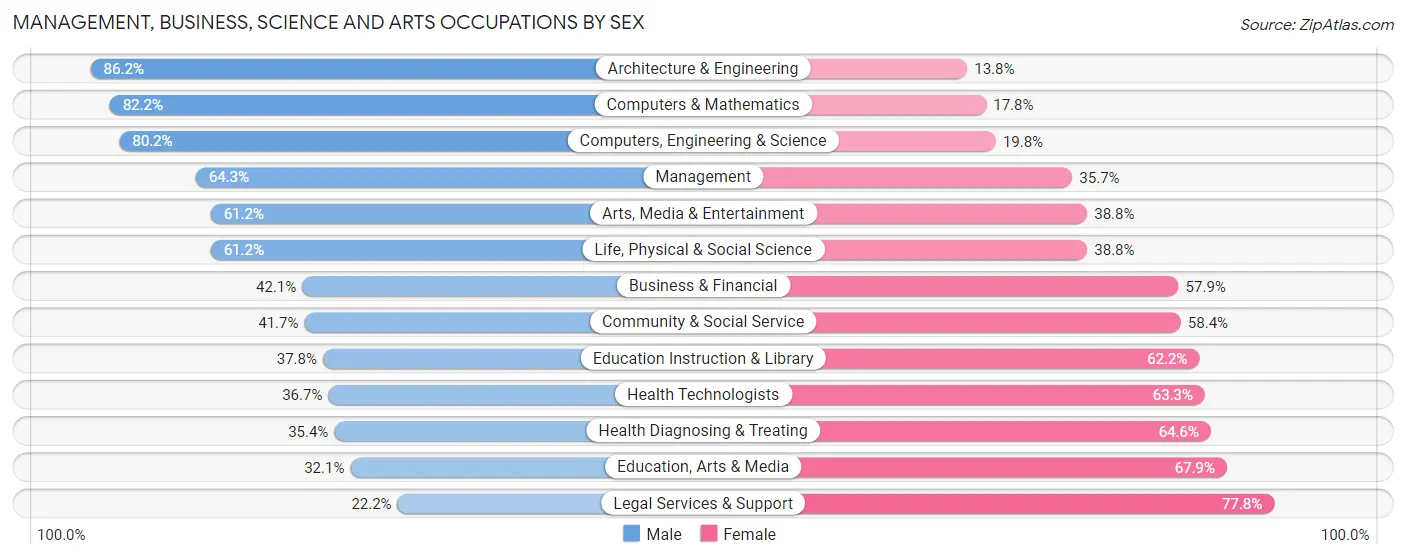
Management, Business, Science and Arts Occupations by Sex
Within the Management, Business, Science and Arts occupations in Ogden, the most male-oriented occupations are Architecture & Engineering (86.2%), Computers & Mathematics (82.2%), and Computers, Engineering & Science (80.2%), while the most female-oriented occupations are Legal Services & Support (77.8%), Education, Arts & Media (67.9%), and Health Diagnosing & Treating (64.6%).
| Occupation | Male | Female |
| Management | 2,309 (64.3%) | 1,283 (35.7%) |
| Business & Financial | 791 (42.1%) | 1,087 (57.9%) |
| Computers, Engineering & Science | 1,854 (80.2%) | 457 (19.8%) |
| Computers & Mathematics | 1,074 (82.2%) | 232 (17.8%) |
| Architecture & Engineering | 569 (86.2%) | 91 (13.8%) |
| Life, Physical & Social Science | 211 (61.2%) | 134 (38.8%) |
| Community & Social Service | 1,671 (41.6%) | 2,341 (58.4%) |
| Education, Arts & Media | 177 (32.1%) | 375 (67.9%) |
| Legal Services & Support | 48 (22.2%) | 168 (77.8%) |
| Education Instruction & Library | 871 (37.8%) | 1,433 (62.2%) |
| Arts, Media & Entertainment | 575 (61.2%) | 365 (38.8%) |
| Health Diagnosing & Treating | 629 (35.4%) | 1,147 (64.6%) |
| Health Technologists | 367 (36.7%) | 634 (63.3%) |
| Total (Category) | 7,254 (53.5%) | 6,315 (46.5%) |
| Total (Overall) | 25,416 (57.2%) | 19,044 (42.8%) |
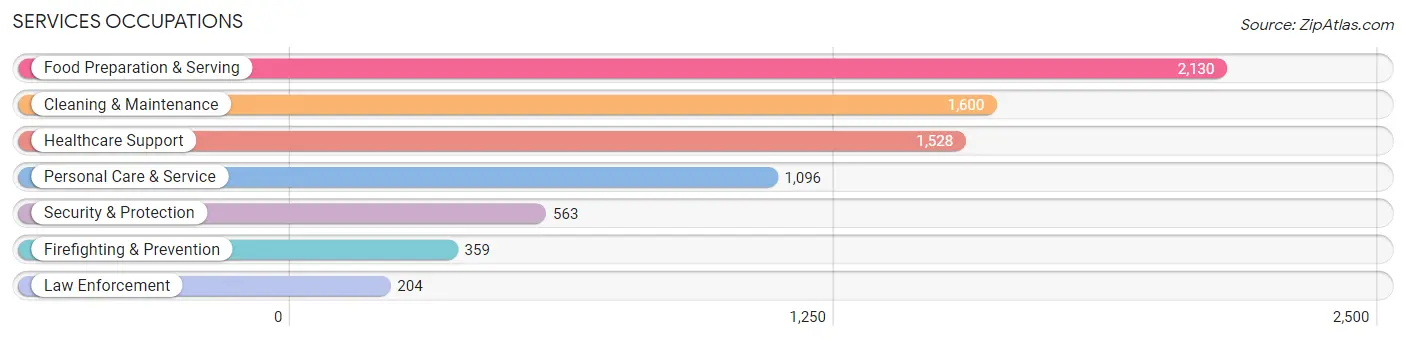
Services Occupations
The most common Services occupations in Ogden are Food Preparation & Serving (2,130 | 4.8%), Cleaning & Maintenance (1,600 | 3.6%), Healthcare Support (1,528 | 3.4%), Personal Care & Service (1,096 | 2.5%), and Security & Protection (563 | 1.3%).
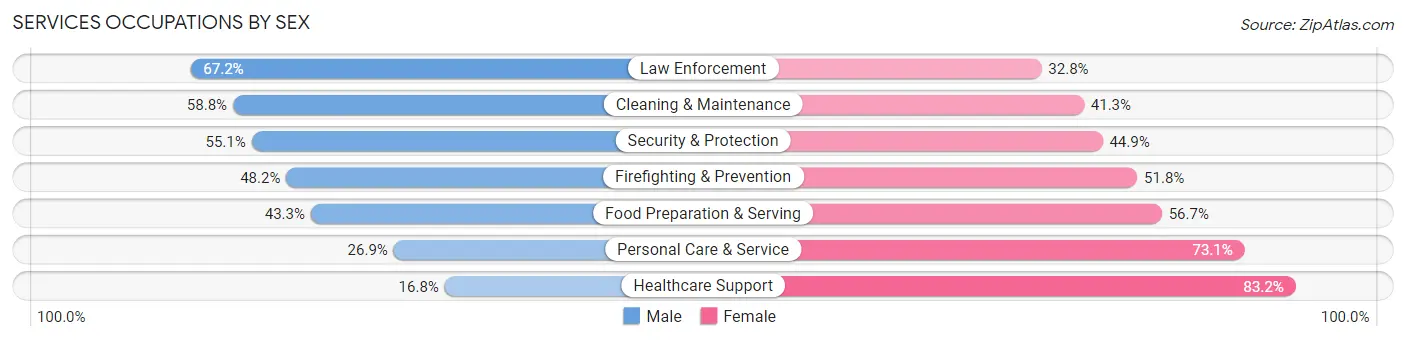
Services Occupations by Sex
Within the Services occupations in Ogden, the most male-oriented occupations are Law Enforcement (67.2%), Cleaning & Maintenance (58.8%), and Security & Protection (55.1%), while the most female-oriented occupations are Healthcare Support (83.2%), Personal Care & Service (73.1%), and Food Preparation & Serving (56.7%).
| Occupation | Male | Female |
| Healthcare Support | 257 (16.8%) | 1,271 (83.2%) |
| Security & Protection | 310 (55.1%) | 253 (44.9%) |
| Firefighting & Prevention | 173 (48.2%) | 186 (51.8%) |
| Law Enforcement | 137 (67.2%) | 67 (32.8%) |
| Food Preparation & Serving | 923 (43.3%) | 1,207 (56.7%) |
| Cleaning & Maintenance | 940 (58.8%) | 660 (41.2%) |
| Personal Care & Service | 295 (26.9%) | 801 (73.1%) |
| Total (Category) | 2,725 (39.4%) | 4,192 (60.6%) |
| Total (Overall) | 25,416 (57.2%) | 19,044 (42.8%) |
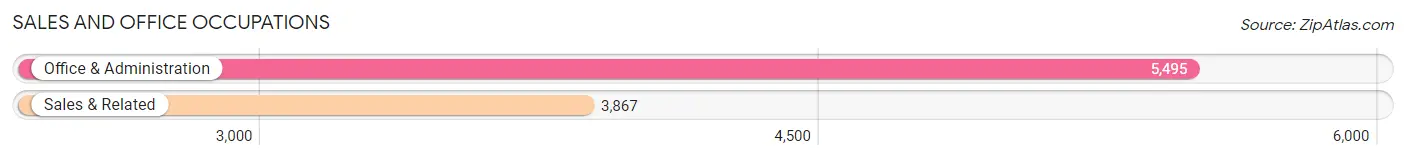
Sales and Office Occupations
The most common Sales and Office occupations in Ogden are Office & Administration (5,495 | 12.4%), and Sales & Related (3,867 | 8.7%).
Sales and Office Occupations by Sex
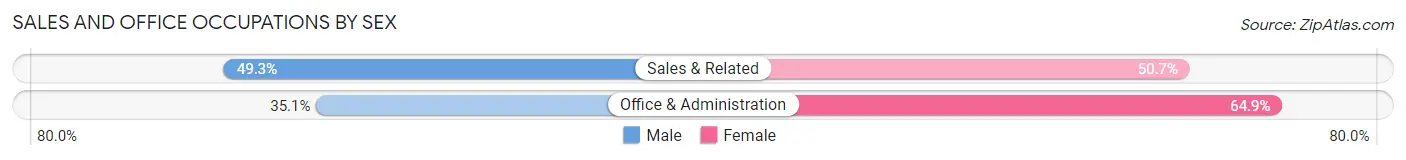
| Occupation | Male | Female |
| Sales & Related | 1,908 (49.3%) | 1,959 (50.7%) |
| Office & Administration | 1,930 (35.1%) | 3,565 (64.9%) |
| Total (Category) | 3,838 (41.0%) | 5,524 (59.0%) |
| Total (Overall) | 25,416 (57.2%) | 19,044 (42.8%) |
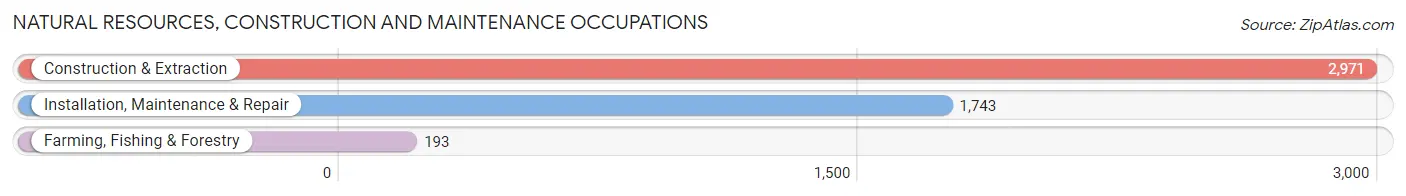
Natural Resources, Construction and Maintenance Occupations
The most common Natural Resources, Construction and Maintenance occupations in Ogden are Construction & Extraction (2,971 | 6.7%), Installation, Maintenance & Repair (1,743 | 3.9%), and Farming, Fishing & Forestry (193 | 0.4%).
Natural Resources, Construction and Maintenance Occupations by Sex
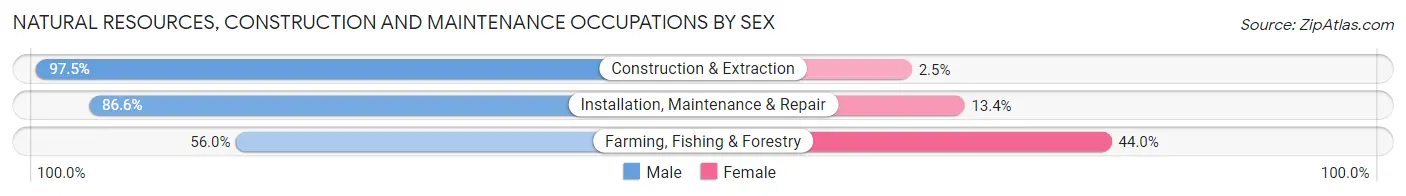
| Occupation | Male | Female |
| Farming, Fishing & Forestry | 108 (56.0%) | 85 (44.0%) |
| Construction & Extraction | 2,898 (97.5%) | 73 (2.5%) |
| Installation, Maintenance & Repair | 1,509 (86.6%) | 234 (13.4%) |
| Total (Category) | 4,515 (92.0%) | 392 (8.0%) |
| Total (Overall) | 25,416 (57.2%) | 19,044 (42.8%) |
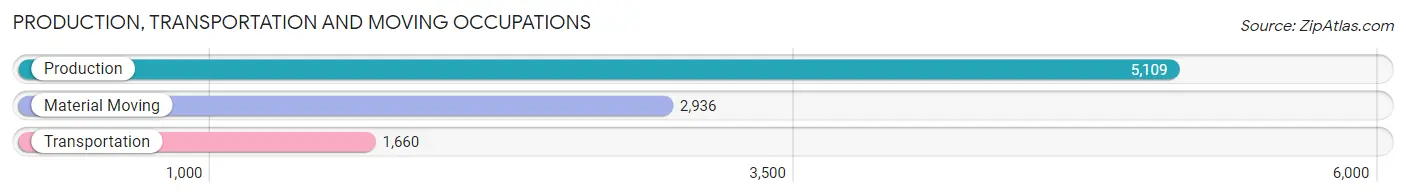
Production, Transportation and Moving Occupations
The most common Production, Transportation and Moving occupations in Ogden are Production (5,109 | 11.5%), Material Moving (2,936 | 6.6%), and Transportation (1,660 | 3.7%).
Production, Transportation and Moving Occupations by Sex
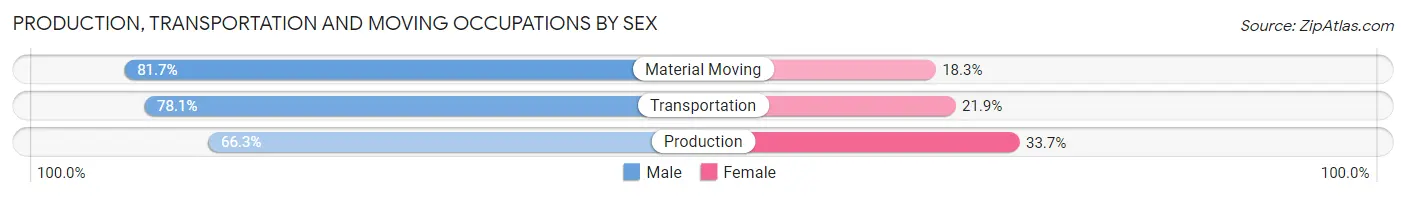
| Occupation | Male | Female |
| Production | 3,389 (66.3%) | 1,720 (33.7%) |
| Transportation | 1,296 (78.1%) | 364 (21.9%) |
| Material Moving | 2,399 (81.7%) | 537 (18.3%) |
| Total (Category) | 7,084 (73.0%) | 2,621 (27.0%) |
| Total (Overall) | 25,416 (57.2%) | 19,044 (42.8%) |
Employment Industries by Sex in Ogden
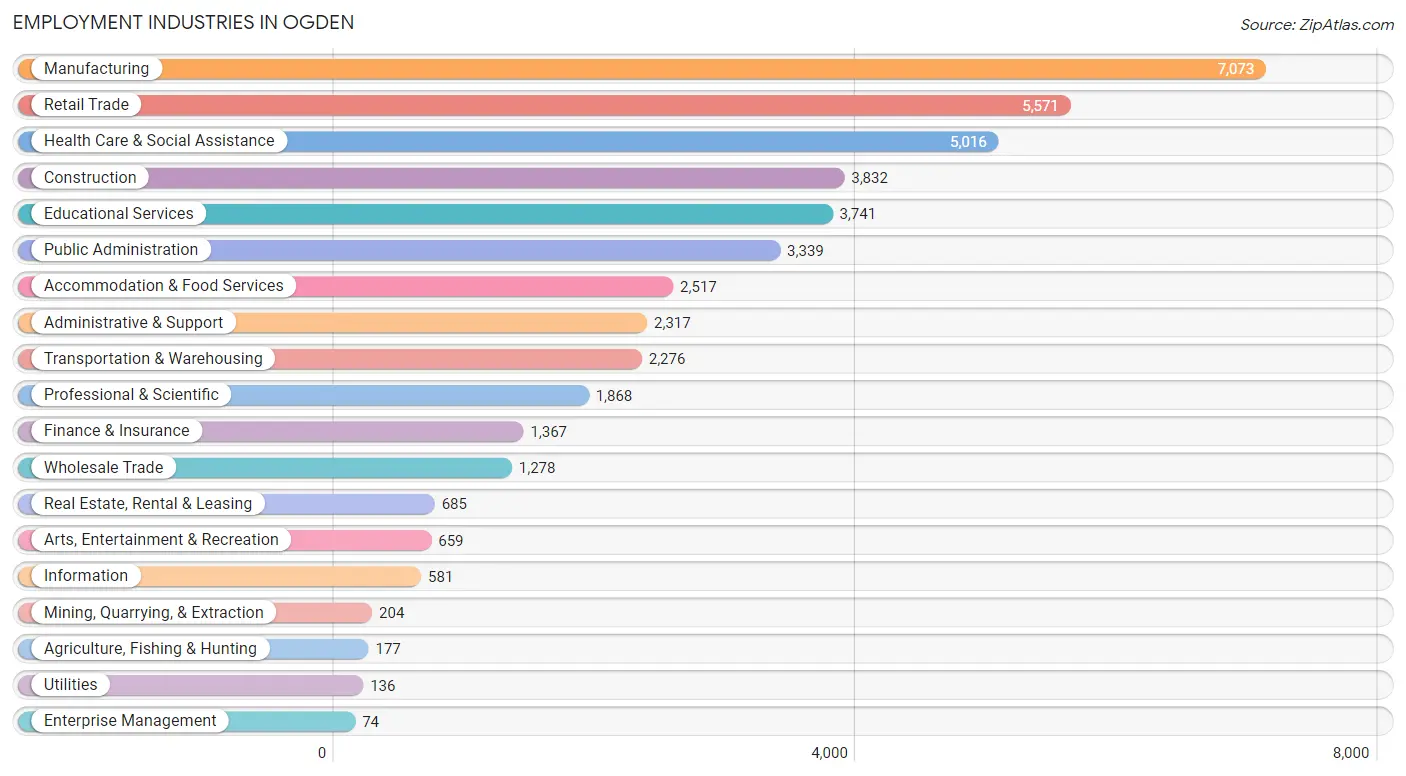
Employment Industries in Ogden
The major employment industries in Ogden include Manufacturing (7,073 | 15.9%), Retail Trade (5,571 | 12.5%), Health Care & Social Assistance (5,016 | 11.3%), Construction (3,832 | 8.6%), and Educational Services (3,741 | 8.4%).
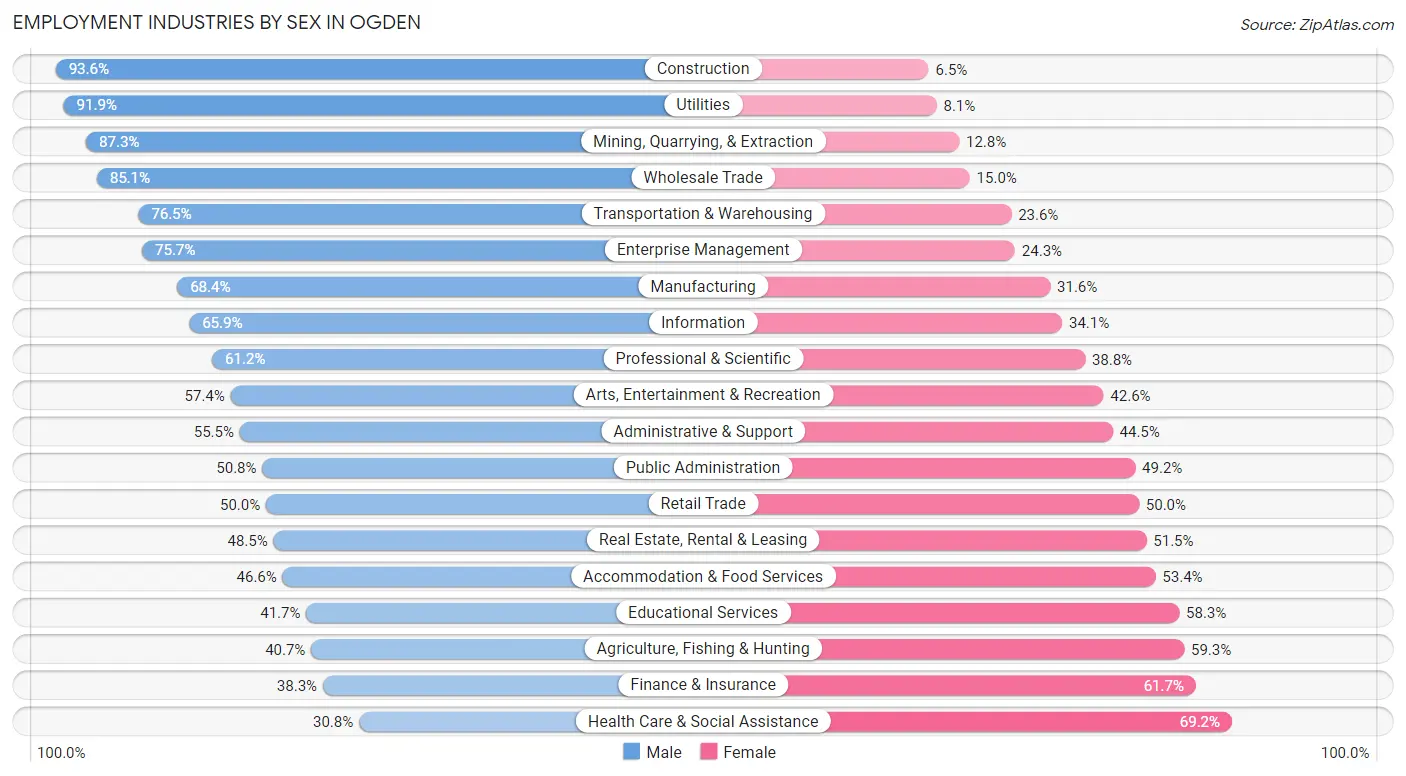
Employment Industries by Sex in Ogden
The Ogden industries that see more men than women are Construction (93.5%), Utilities (91.9%), and Mining, Quarrying, & Extraction (87.3%), whereas the industries that tend to have a higher number of women are Health Care & Social Assistance (69.2%), Finance & Insurance (61.7%), and Agriculture, Fishing & Hunting (59.3%).
| Industry | Male | Female |
| Agriculture, Fishing & Hunting | 72 (40.7%) | 105 (59.3%) |
| Mining, Quarrying, & Extraction | 178 (87.3%) | 26 (12.8%) |
| Construction | 3,585 (93.5%) | 247 (6.5%) |
| Manufacturing | 4,838 (68.4%) | 2,235 (31.6%) |
| Wholesale Trade | 1,087 (85.1%) | 191 (14.9%) |
| Retail Trade | 2,787 (50.0%) | 2,784 (50.0%) |
| Transportation & Warehousing | 1,740 (76.4%) | 536 (23.5%) |
| Utilities | 125 (91.9%) | 11 (8.1%) |
| Information | 383 (65.9%) | 198 (34.1%) |
| Finance & Insurance | 523 (38.3%) | 844 (61.7%) |
| Real Estate, Rental & Leasing | 332 (48.5%) | 353 (51.5%) |
| Professional & Scientific | 1,143 (61.2%) | 725 (38.8%) |
| Enterprise Management | 56 (75.7%) | 18 (24.3%) |
| Administrative & Support | 1,285 (55.5%) | 1,032 (44.5%) |
| Educational Services | 1,560 (41.7%) | 2,181 (58.3%) |
| Health Care & Social Assistance | 1,544 (30.8%) | 3,472 (69.2%) |
| Arts, Entertainment & Recreation | 378 (57.4%) | 281 (42.6%) |
| Accommodation & Food Services | 1,173 (46.6%) | 1,344 (53.4%) |
| Public Administration | 1,696 (50.8%) | 1,643 (49.2%) |
| Total | 25,416 (57.2%) | 19,044 (42.8%) |
Education in Ogden
School Enrollment in Ogden
The most common levels of schooling among the 21,782 students in Ogden are college / undergraduate (5,390 | 24.7%), elementary school (4,642 | 21.3%), and middle school (4,536 | 20.8%).
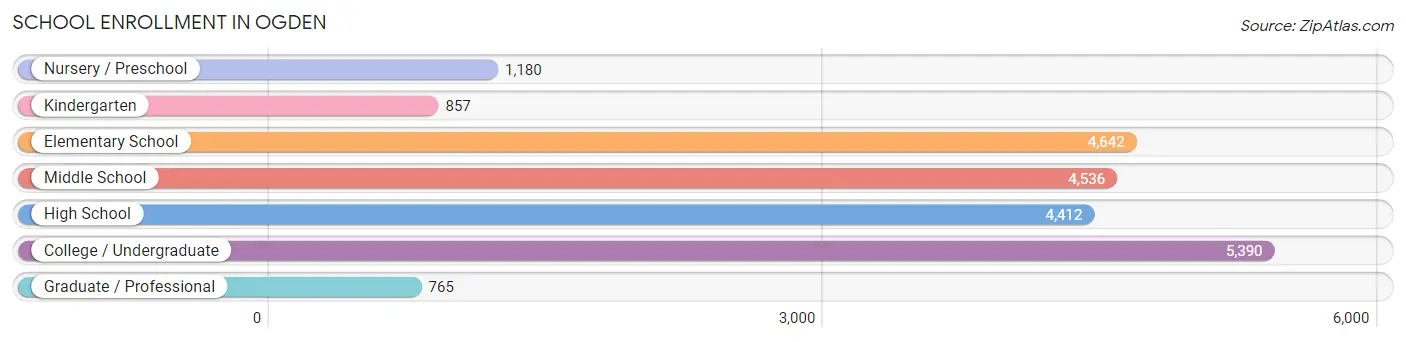
| School Level | # Students | % Students |
| Nursery / Preschool | 1,180 | 5.4% |
| Kindergarten | 857 | 3.9% |
| Elementary School | 4,642 | 21.3% |
| Middle School | 4,536 | 20.8% |
| High School | 4,412 | 20.3% |
| College / Undergraduate | 5,390 | 24.7% |
| Graduate / Professional | 765 | 3.5% |
| Total | 21,782 | 100.0% |
School Enrollment by Age by Funding Source in Ogden
Out of a total of 21,782 students who are enrolled in schools in Ogden, 2,418 (11.1%) attend a private institution, while the remaining 19,364 (88.9%) are enrolled in public schools. The age group of 3 to 4 year olds has the highest likelihood of being enrolled in private schools, with 321 (39.9% in the age bracket) enrolled. Conversely, the age group of 10 to 14 year olds has the lowest likelihood of being enrolled in a private school, with 5,080 (92.8% in the age bracket) attending a public institution.
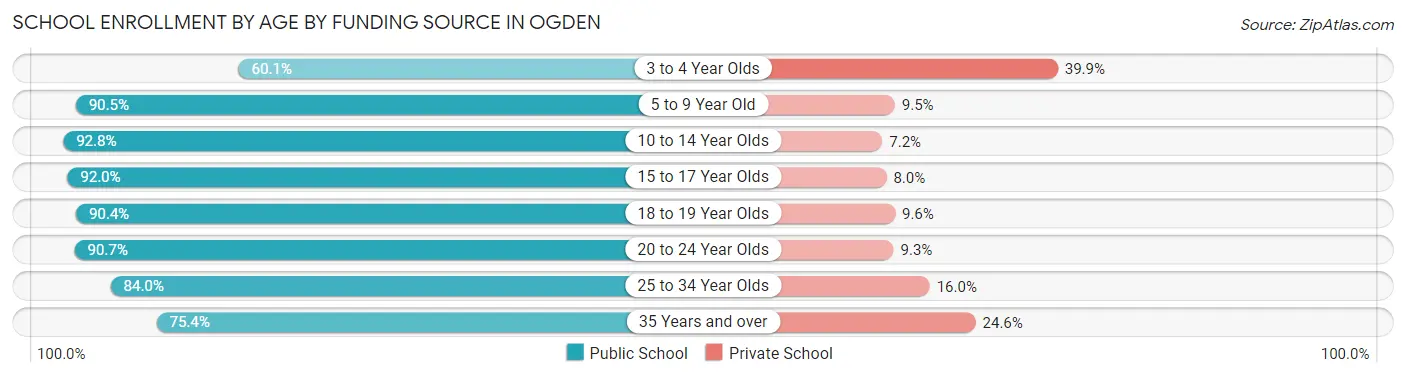
| Age Bracket | Public School | Private School |
| 3 to 4 Year Olds | 484 (60.1%) | 321 (39.9%) |
| 5 to 9 Year Old | 4,796 (90.5%) | 505 (9.5%) |
| 10 to 14 Year Olds | 5,080 (92.8%) | 394 (7.2%) |
| 15 to 17 Year Olds | 3,037 (92.0%) | 263 (8.0%) |
| 18 to 19 Year Olds | 1,191 (90.4%) | 126 (9.6%) |
| 20 to 24 Year Olds | 2,293 (90.7%) | 235 (9.3%) |
| 25 to 34 Year Olds | 1,713 (84.0%) | 327 (16.0%) |
| 35 Years and over | 767 (75.4%) | 250 (24.6%) |
| Total | 19,364 (88.9%) | 2,418 (11.1%) |
Educational Attainment by Field of Study in Ogden
Business (2,248 | 14.8%), education (1,572 | 10.3%), science & technology (1,537 | 10.1%), engineering (1,219 | 8.0%), and visual & performing arts (1,207 | 7.9%) are the most common fields of study among 15,215 individuals in Ogden who have obtained a bachelor's degree or higher.
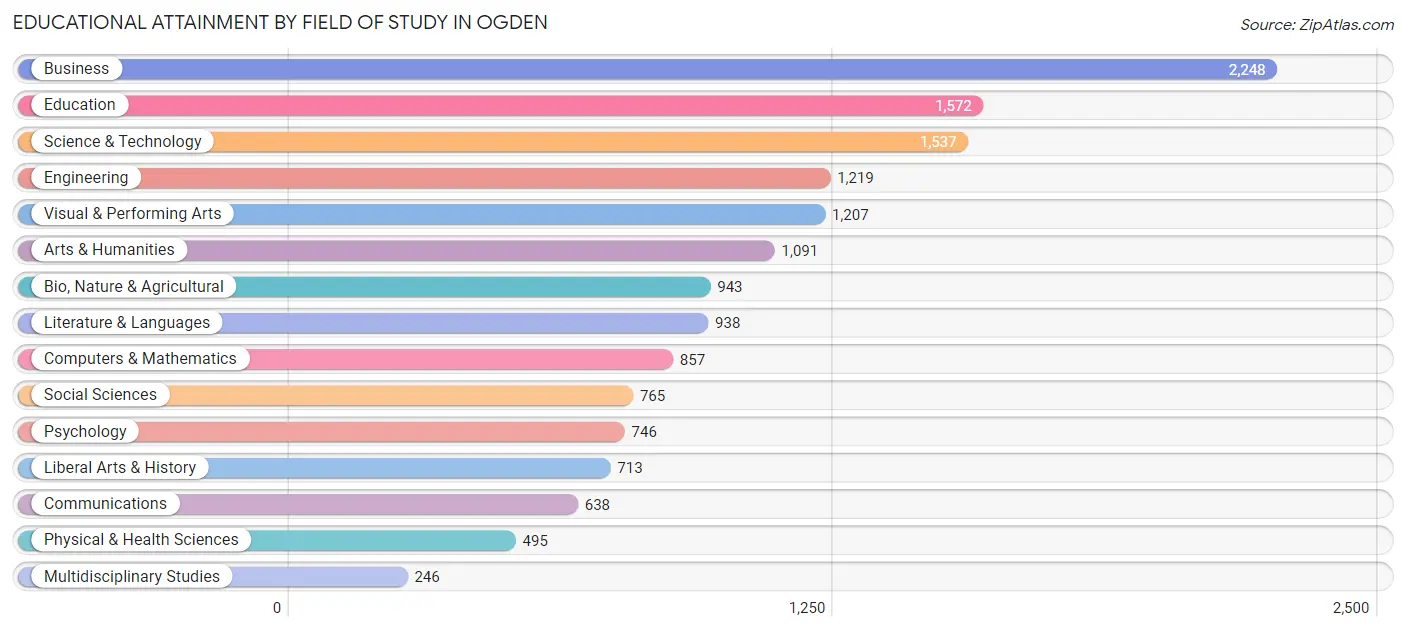
| Field of Study | # Graduates | % Graduates |
| Computers & Mathematics | 857 | 5.6% |
| Bio, Nature & Agricultural | 943 | 6.2% |
| Physical & Health Sciences | 495 | 3.3% |
| Psychology | 746 | 4.9% |
| Social Sciences | 765 | 5.0% |
| Engineering | 1,219 | 8.0% |
| Multidisciplinary Studies | 246 | 1.6% |
| Science & Technology | 1,537 | 10.1% |
| Business | 2,248 | 14.8% |
| Education | 1,572 | 10.3% |
| Literature & Languages | 938 | 6.2% |
| Liberal Arts & History | 713 | 4.7% |
| Visual & Performing Arts | 1,207 | 7.9% |
| Communications | 638 | 4.2% |
| Arts & Humanities | 1,091 | 7.2% |
| Total | 15,215 | 100.0% |
Transportation & Commute in Ogden
Vehicle Availability by Sex in Ogden
The most prevalent vehicle ownership categories in Ogden are males with 2 vehicles (10,421, accounting for 42.0%) and females with 2 vehicles (7,959, making up 56.4%).
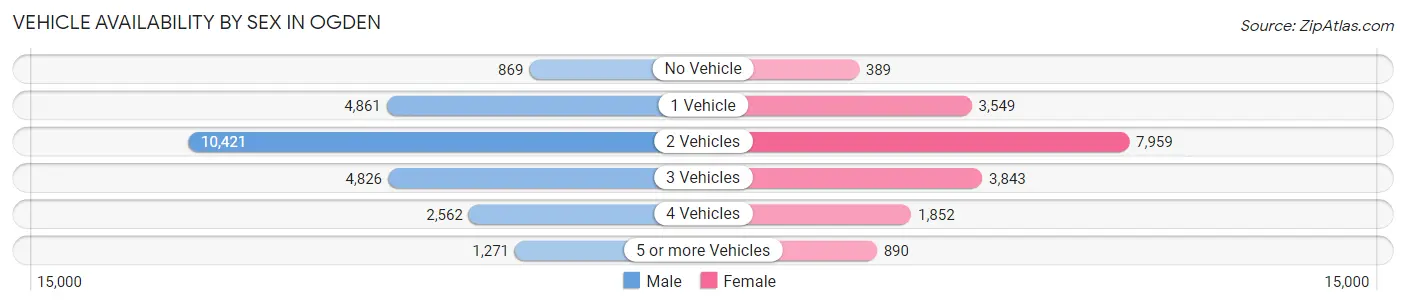
| Vehicles Available | Male | Female |
| No Vehicle | 869 (3.5%) | 389 (2.1%) |
| 1 Vehicle | 4,861 (19.6%) | 3,549 (19.2%) |
| 2 Vehicles | 10,421 (42.0%) | 7,959 (43.1%) |
| 3 Vehicles | 4,826 (19.5%) | 3,843 (20.8%) |
| 4 Vehicles | 2,562 (10.3%) | 1,852 (10.0%) |
| 5 or more Vehicles | 1,271 (5.1%) | 890 (4.8%) |
| Total | 24,810 (100.0%) | 18,482 (100.0%) |
Commute Time in Ogden
The most frequently occuring commute durations in Ogden are 15 to 19 minutes (8,106 commuters, 20.7%), 10 to 14 minutes (7,166 commuters, 18.3%), and 20 to 24 minutes (6,233 commuters, 15.9%).
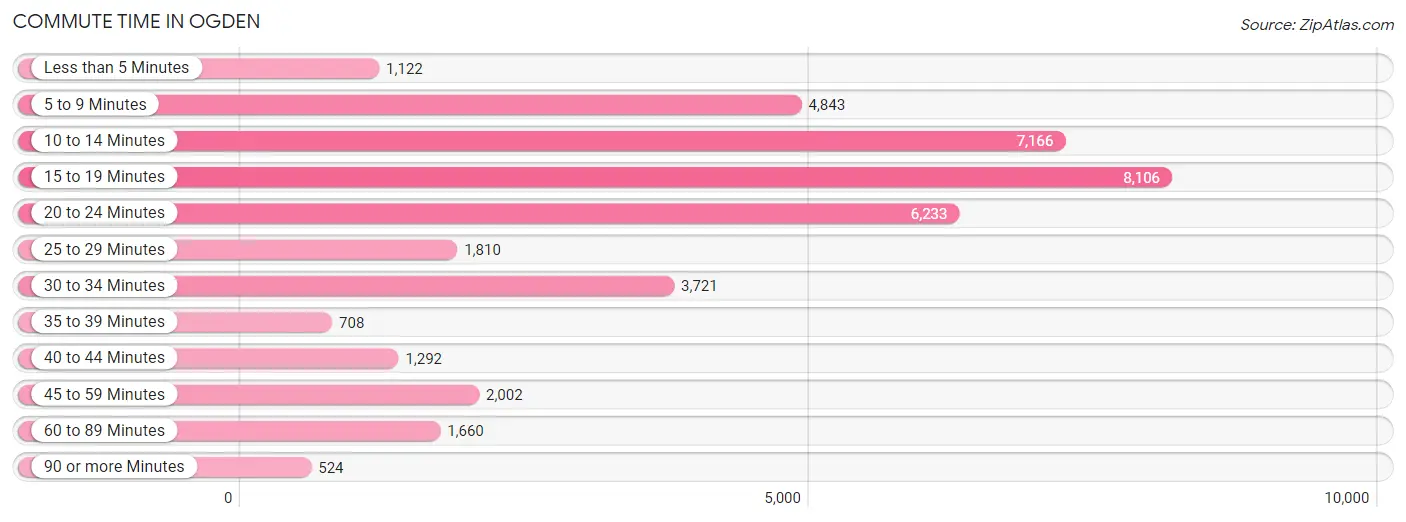
| Commute Time | # Commuters | % Commuters |
| Less than 5 Minutes | 1,122 | 2.9% |
| 5 to 9 Minutes | 4,843 | 12.4% |
| 10 to 14 Minutes | 7,166 | 18.3% |
| 15 to 19 Minutes | 8,106 | 20.7% |
| 20 to 24 Minutes | 6,233 | 15.9% |
| 25 to 29 Minutes | 1,810 | 4.6% |
| 30 to 34 Minutes | 3,721 | 9.5% |
| 35 to 39 Minutes | 708 | 1.8% |
| 40 to 44 Minutes | 1,292 | 3.3% |
| 45 to 59 Minutes | 2,002 | 5.1% |
| 60 to 89 Minutes | 1,660 | 4.2% |
| 90 or more Minutes | 524 | 1.3% |
Commute Time by Sex in Ogden
The most common commute times in Ogden are 15 to 19 minutes (4,355 commuters, 19.1%) for males and 15 to 19 minutes (3,751 commuters, 22.9%) for females.
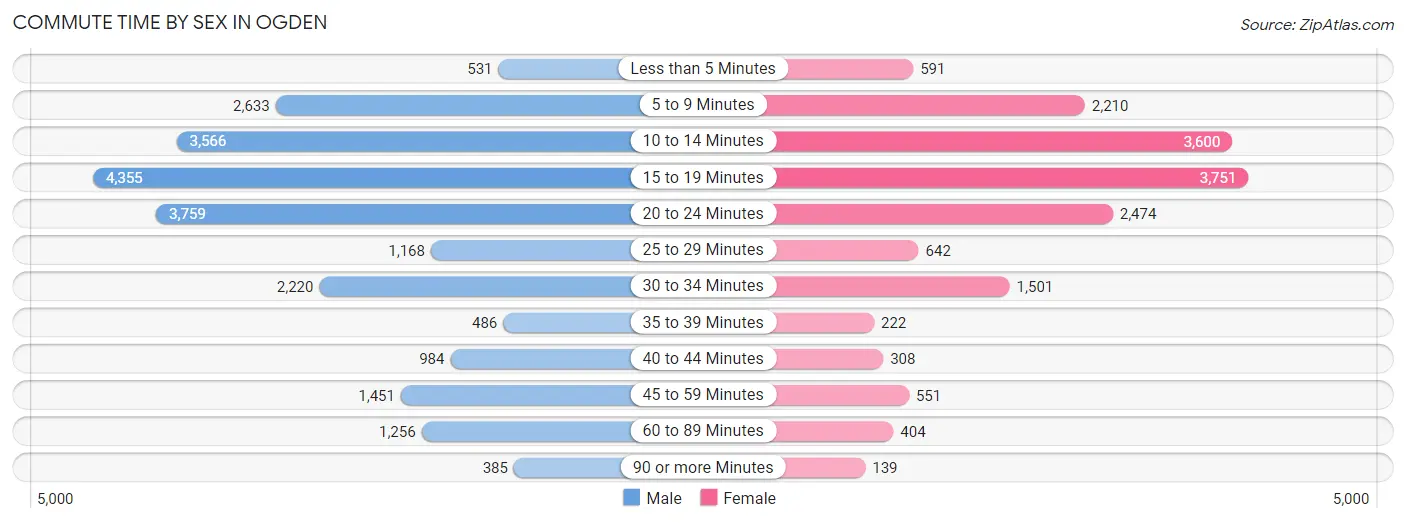
| Commute Time | Male | Female |
| Less than 5 Minutes | 531 (2.3%) | 591 (3.6%) |
| 5 to 9 Minutes | 2,633 (11.6%) | 2,210 (13.5%) |
| 10 to 14 Minutes | 3,566 (15.6%) | 3,600 (22.0%) |
| 15 to 19 Minutes | 4,355 (19.1%) | 3,751 (22.9%) |
| 20 to 24 Minutes | 3,759 (16.5%) | 2,474 (15.1%) |
| 25 to 29 Minutes | 1,168 (5.1%) | 642 (3.9%) |
| 30 to 34 Minutes | 2,220 (9.7%) | 1,501 (9.2%) |
| 35 to 39 Minutes | 486 (2.1%) | 222 (1.3%) |
| 40 to 44 Minutes | 984 (4.3%) | 308 (1.9%) |
| 45 to 59 Minutes | 1,451 (6.4%) | 551 (3.4%) |
| 60 to 89 Minutes | 1,256 (5.5%) | 404 (2.5%) |
| 90 or more Minutes | 385 (1.7%) | 139 (0.9%) |
Time of Departure to Work by Sex in Ogden
The most frequent times of departure to work in Ogden are 12:00 PM to 3:59 PM (2,536, 11.1%) for males and 7:30 AM to 7:59 AM (2,438, 14.9%) for females.
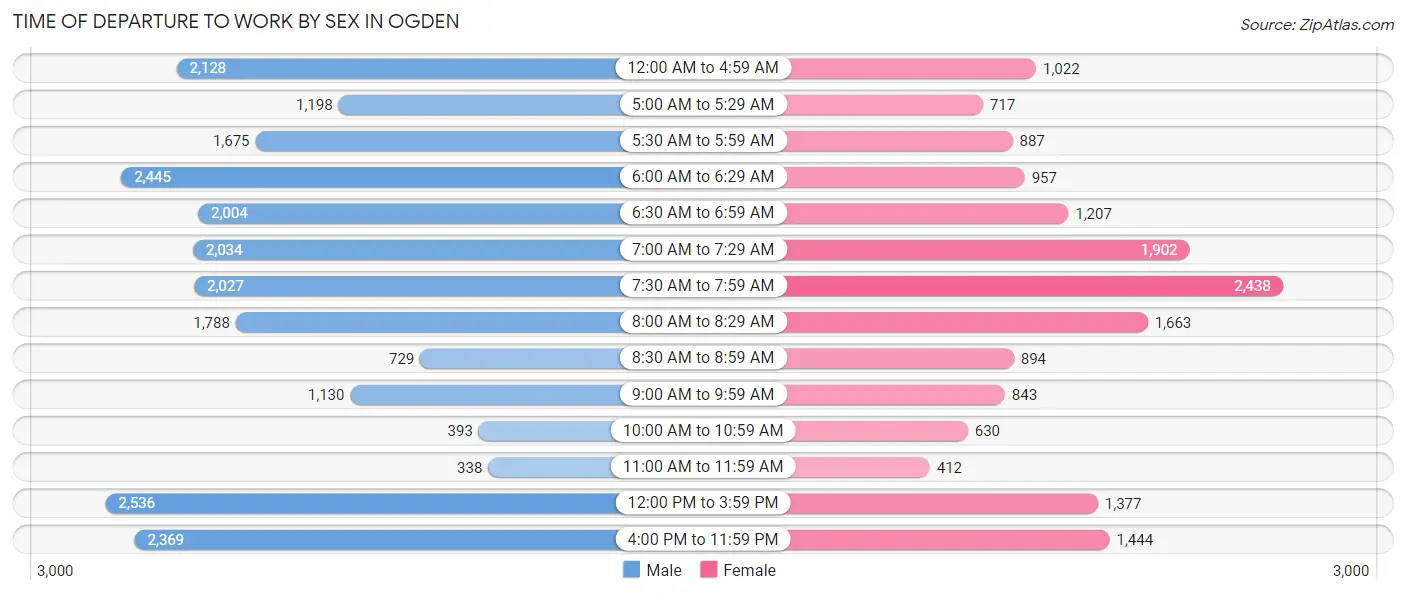
| Time of Departure | Male | Female |
| 12:00 AM to 4:59 AM | 2,128 (9.3%) | 1,022 (6.2%) |
| 5:00 AM to 5:29 AM | 1,198 (5.3%) | 717 (4.4%) |
| 5:30 AM to 5:59 AM | 1,675 (7.3%) | 887 (5.4%) |
| 6:00 AM to 6:29 AM | 2,445 (10.7%) | 957 (5.8%) |
| 6:30 AM to 6:59 AM | 2,004 (8.8%) | 1,207 (7.4%) |
| 7:00 AM to 7:29 AM | 2,034 (8.9%) | 1,902 (11.6%) |
| 7:30 AM to 7:59 AM | 2,027 (8.9%) | 2,438 (14.9%) |
| 8:00 AM to 8:29 AM | 1,788 (7.8%) | 1,663 (10.1%) |
| 8:30 AM to 8:59 AM | 729 (3.2%) | 894 (5.4%) |
| 9:00 AM to 9:59 AM | 1,130 (5.0%) | 843 (5.1%) |
| 10:00 AM to 10:59 AM | 393 (1.7%) | 630 (3.8%) |
| 11:00 AM to 11:59 AM | 338 (1.5%) | 412 (2.5%) |
| 12:00 PM to 3:59 PM | 2,536 (11.1%) | 1,377 (8.4%) |
| 4:00 PM to 11:59 PM | 2,369 (10.4%) | 1,444 (8.8%) |
| Total | 22,794 (100.0%) | 16,393 (100.0%) |
Housing Occupancy in Ogden
Occupancy by Ownership in Ogden
Of the total 32,326 dwellings in Ogden, owner-occupied units account for 19,464 (60.2%), while renter-occupied units make up 12,862 (39.8%).
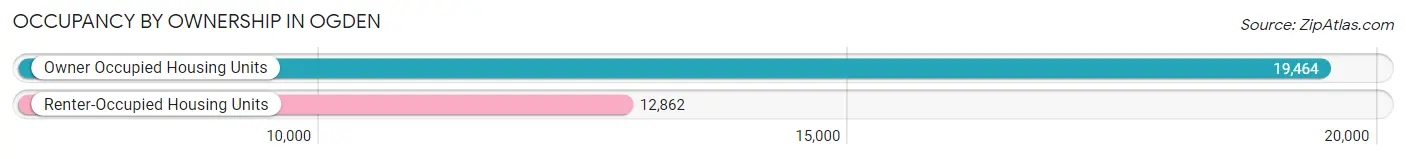
| Occupancy | # Housing Units | % Housing Units |
| Owner Occupied Housing Units | 19,464 | 60.2% |
| Renter-Occupied Housing Units | 12,862 | 39.8% |
| Total Occupied Housing Units | 32,326 | 100.0% |
Occupancy by Household Size in Ogden
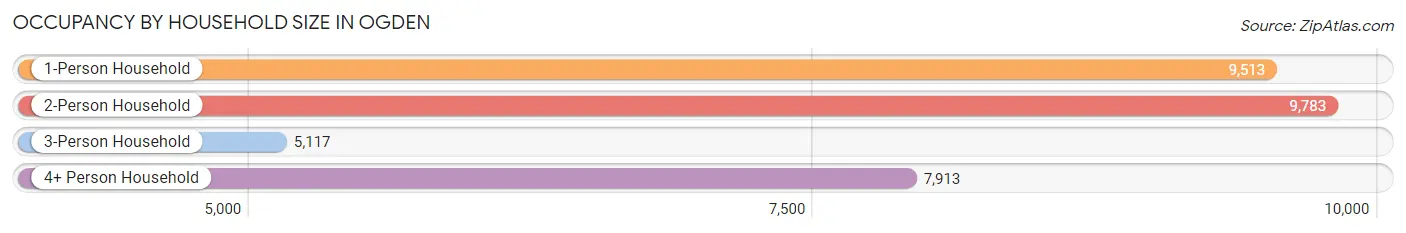
| Household Size | # Housing Units | % Housing Units |
| 1-Person Household | 9,513 | 29.4% |
| 2-Person Household | 9,783 | 30.3% |
| 3-Person Household | 5,117 | 15.8% |
| 4+ Person Household | 7,913 | 24.5% |
| Total Housing Units | 32,326 | 100.0% |
Occupancy by Ownership by Household Size in Ogden
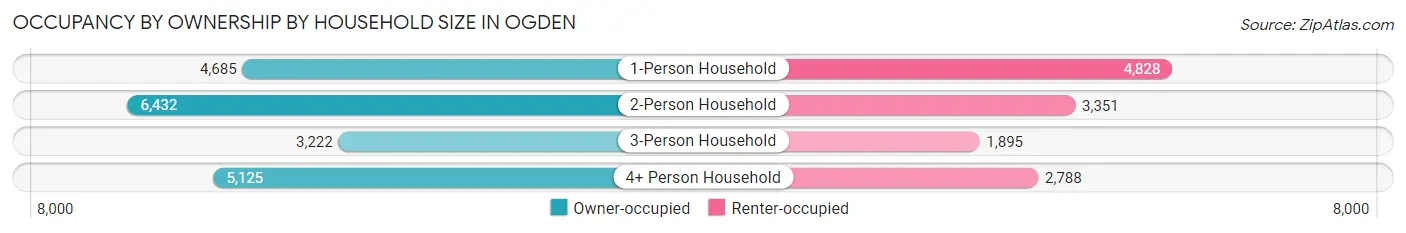
| Household Size | Owner-occupied | Renter-occupied |
| 1-Person Household | 4,685 (49.2%) | 4,828 (50.7%) |
| 2-Person Household | 6,432 (65.7%) | 3,351 (34.3%) |
| 3-Person Household | 3,222 (63.0%) | 1,895 (37.0%) |
| 4+ Person Household | 5,125 (64.8%) | 2,788 (35.2%) |
| Total Housing Units | 19,464 (60.2%) | 12,862 (39.8%) |
Occupancy by Educational Attainment in Ogden
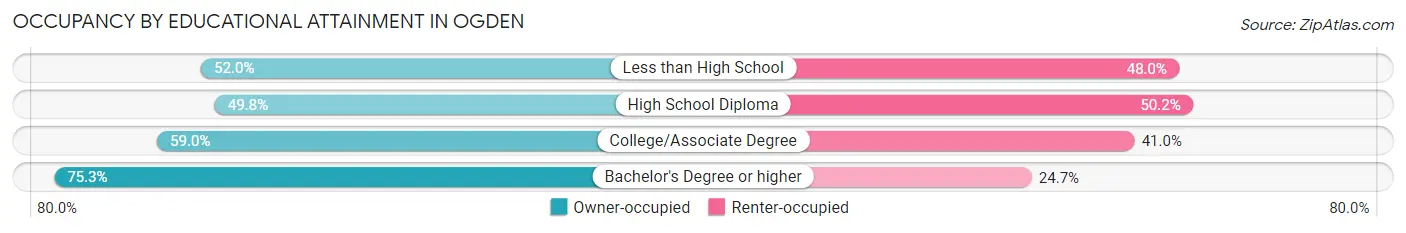
| Household Size | Owner-occupied | Renter-occupied |
| Less than High School | 1,741 (52.0%) | 1,607 (48.0%) |
| High School Diploma | 4,282 (49.8%) | 4,311 (50.2%) |
| College/Associate Degree | 6,905 (59.0%) | 4,800 (41.0%) |
| Bachelor's Degree or higher | 6,536 (75.3%) | 2,144 (24.7%) |
Occupancy by Age of Householder in Ogden
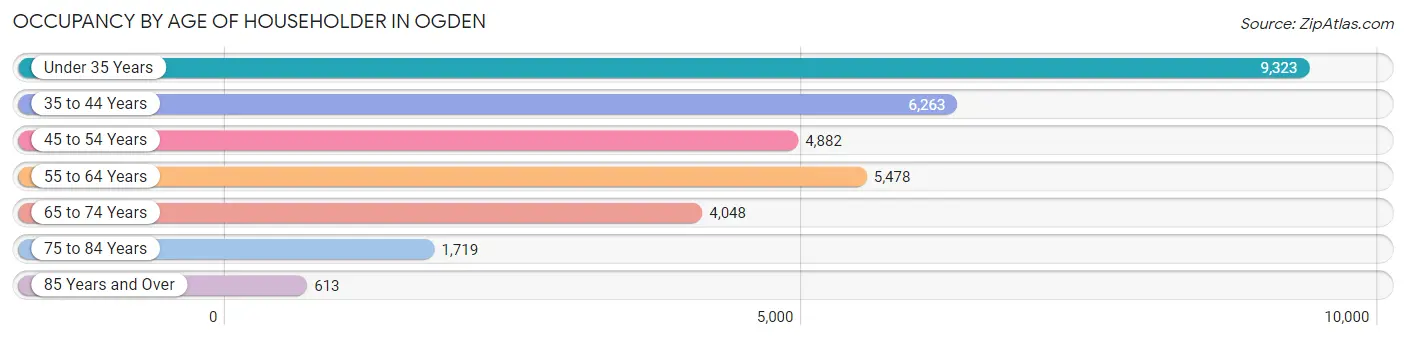
| Age Bracket | # Households | % Households |
| Under 35 Years | 9,323 | 28.8% |
| 35 to 44 Years | 6,263 | 19.4% |
| 45 to 54 Years | 4,882 | 15.1% |
| 55 to 64 Years | 5,478 | 17.0% |
| 65 to 74 Years | 4,048 | 12.5% |
| 75 to 84 Years | 1,719 | 5.3% |
| 85 Years and Over | 613 | 1.9% |
| Total | 32,326 | 100.0% |
Housing Finances in Ogden
Median Income by Occupancy in Ogden
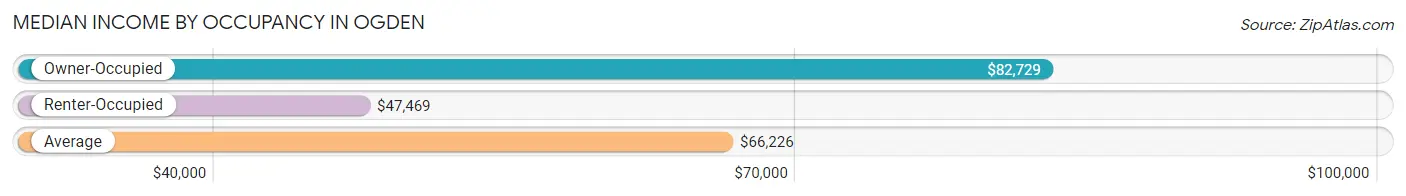
| Occupancy Type | # Households | Median Income |
| Owner-Occupied | 19,464 (60.2%) | $82,729 |
| Renter-Occupied | 12,862 (39.8%) | $47,469 |
| Average | 32,326 (100.0%) | $66,226 |
Occupancy by Householder Income Bracket in Ogden
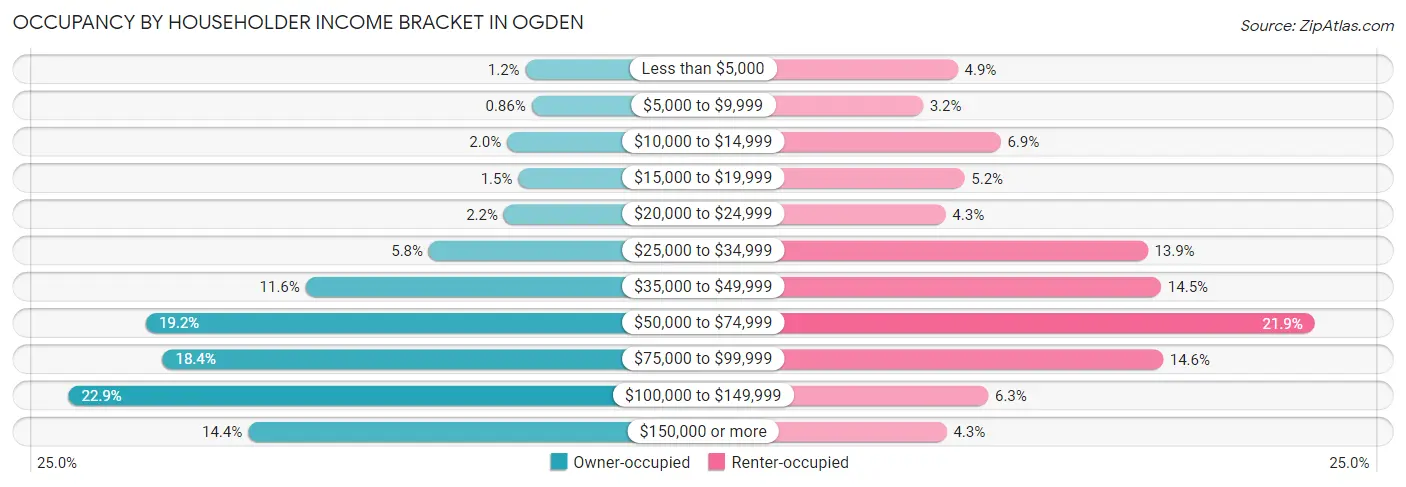
| Income Bracket | Owner-occupied | Renter-occupied |
| Less than $5,000 | 224 (1.1%) | 625 (4.9%) |
| $5,000 to $9,999 | 167 (0.9%) | 412 (3.2%) |
| $10,000 to $14,999 | 395 (2.0%) | 888 (6.9%) |
| $15,000 to $19,999 | 290 (1.5%) | 666 (5.2%) |
| $20,000 to $24,999 | 424 (2.2%) | 551 (4.3%) |
| $25,000 to $34,999 | 1,119 (5.8%) | 1,788 (13.9%) |
| $35,000 to $49,999 | 2,262 (11.6%) | 1,870 (14.5%) |
| $50,000 to $74,999 | 3,741 (19.2%) | 2,812 (21.9%) |
| $75,000 to $99,999 | 3,587 (18.4%) | 1,882 (14.6%) |
| $100,000 to $149,999 | 4,459 (22.9%) | 811 (6.3%) |
| $150,000 or more | 2,796 (14.4%) | 557 (4.3%) |
| Total | 19,464 (100.0%) | 12,862 (100.0%) |
Monthly Housing Cost Tiers in Ogden
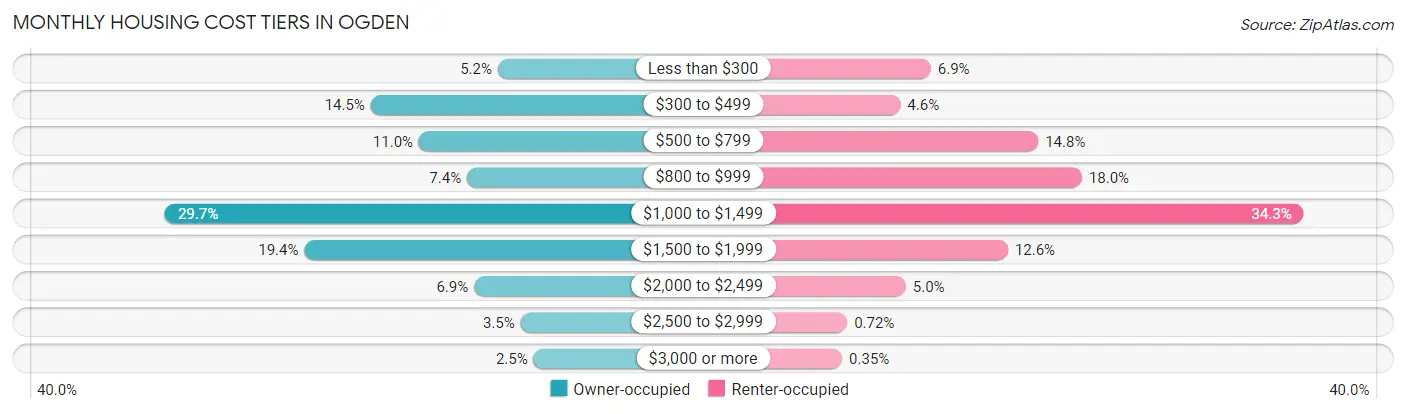
| Monthly Cost | Owner-occupied | Renter-occupied |
| Less than $300 | 1,003 (5.1%) | 885 (6.9%) |
| $300 to $499 | 2,824 (14.5%) | 597 (4.6%) |
| $500 to $799 | 2,134 (11.0%) | 1,902 (14.8%) |
| $800 to $999 | 1,444 (7.4%) | 2,316 (18.0%) |
| $1,000 to $1,499 | 5,773 (29.7%) | 4,416 (34.3%) |
| $1,500 to $1,999 | 3,776 (19.4%) | 1,616 (12.6%) |
| $2,000 to $2,499 | 1,343 (6.9%) | 648 (5.0%) |
| $2,500 to $2,999 | 676 (3.5%) | 93 (0.7%) |
| $3,000 or more | 491 (2.5%) | 45 (0.4%) |
| Total | 19,464 (100.0%) | 12,862 (100.0%) |
Physical Housing Characteristics in Ogden
Housing Structures in Ogden
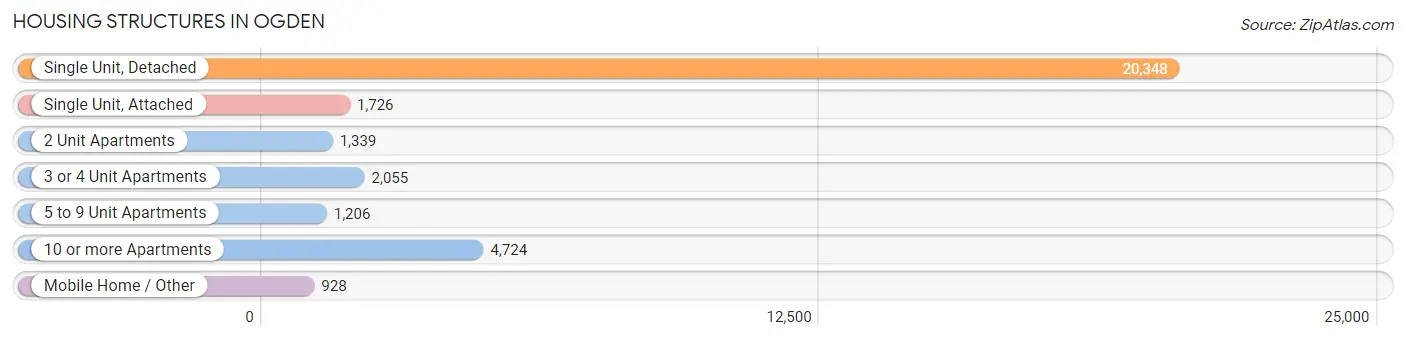
| Structure Type | # Housing Units | % Housing Units |
| Single Unit, Detached | 20,348 | 62.9% |
| Single Unit, Attached | 1,726 | 5.3% |
| 2 Unit Apartments | 1,339 | 4.1% |
| 3 or 4 Unit Apartments | 2,055 | 6.4% |
| 5 to 9 Unit Apartments | 1,206 | 3.7% |
| 10 or more Apartments | 4,724 | 14.6% |
| Mobile Home / Other | 928 | 2.9% |
| Total | 32,326 | 100.0% |
Housing Structures by Occupancy in Ogden
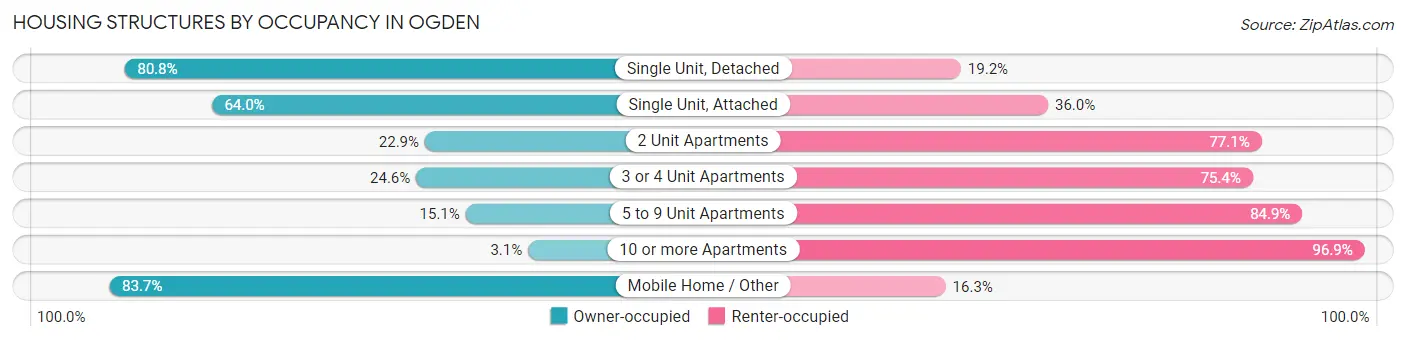
| Structure Type | Owner-occupied | Renter-occupied |
| Single Unit, Detached | 16,442 (80.8%) | 3,906 (19.2%) |
| Single Unit, Attached | 1,105 (64.0%) | 621 (36.0%) |
| 2 Unit Apartments | 307 (22.9%) | 1,032 (77.1%) |
| 3 or 4 Unit Apartments | 506 (24.6%) | 1,549 (75.4%) |
| 5 to 9 Unit Apartments | 182 (15.1%) | 1,024 (84.9%) |
| 10 or more Apartments | 145 (3.1%) | 4,579 (96.9%) |
| Mobile Home / Other | 777 (83.7%) | 151 (16.3%) |
| Total | 19,464 (60.2%) | 12,862 (39.8%) |
Housing Structures by Number of Rooms in Ogden
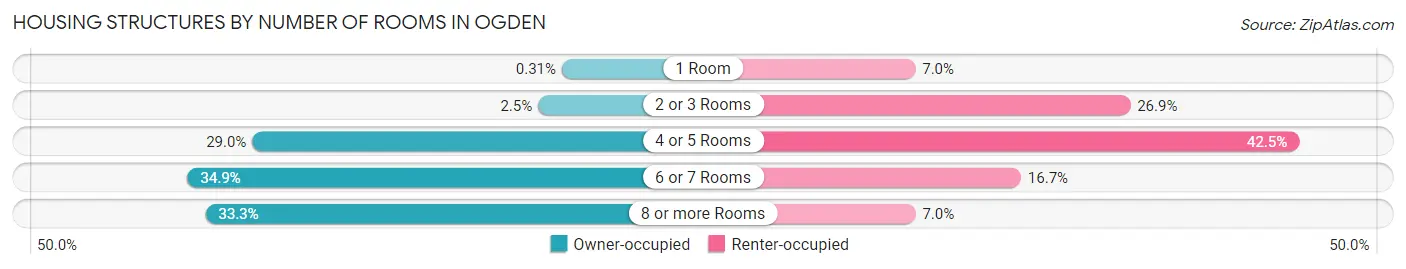
| Number of Rooms | Owner-occupied | Renter-occupied |
| 1 Room | 61 (0.3%) | 896 (7.0%) |
| 2 or 3 Rooms | 489 (2.5%) | 3,453 (26.9%) |
| 4 or 5 Rooms | 5,635 (28.9%) | 5,461 (42.5%) |
| 6 or 7 Rooms | 6,801 (34.9%) | 2,153 (16.7%) |
| 8 or more Rooms | 6,478 (33.3%) | 899 (7.0%) |
| Total | 19,464 (100.0%) | 12,862 (100.0%) |
Housing Structure by Heating Type in Ogden
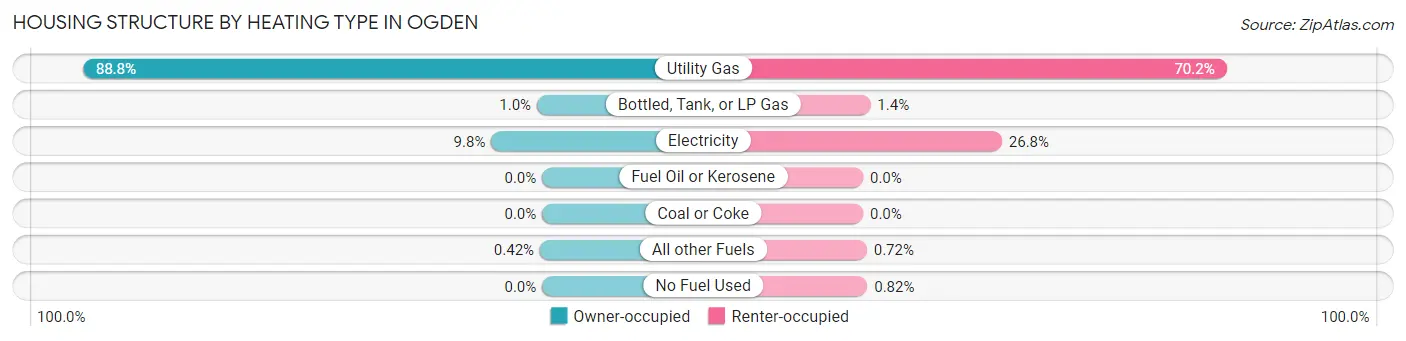
| Heating Type | Owner-occupied | Renter-occupied |
| Utility Gas | 17,275 (88.7%) | 9,032 (70.2%) |
| Bottled, Tank, or LP Gas | 194 (1.0%) | 182 (1.4%) |
| Electricity | 1,914 (9.8%) | 3,450 (26.8%) |
| Fuel Oil or Kerosene | 0 (0.0%) | 0 (0.0%) |
| Coal or Coke | 0 (0.0%) | 0 (0.0%) |
| All other Fuels | 81 (0.4%) | 93 (0.7%) |
| No Fuel Used | 0 (0.0%) | 105 (0.8%) |
| Total | 19,464 (100.0%) | 12,862 (100.0%) |
Household Vehicle Usage in Ogden
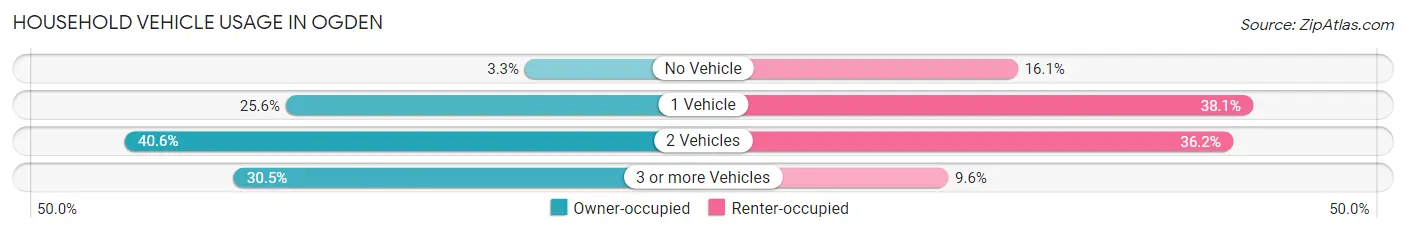
| Vehicles per Household | Owner-occupied | Renter-occupied |
| No Vehicle | 642 (3.3%) | 2,074 (16.1%) |
| 1 Vehicle | 4,987 (25.6%) | 4,897 (38.1%) |
| 2 Vehicles | 7,907 (40.6%) | 4,653 (36.2%) |
| 3 or more Vehicles | 5,928 (30.5%) | 1,238 (9.6%) |
| Total | 19,464 (100.0%) | 12,862 (100.0%) |
Real Estate & Mortgages in Ogden
Real Estate and Mortgage Overview in Ogden
| Characteristic | Without Mortgage | With Mortgage |
| Housing Units | 5,739 | 13,725 |
| Median Property Value | $255,000 | $273,700 |
| Median Household Income | $66,209 | $1,888 |
| Monthly Housing Costs | $456 | $480 |
| Real Estate Taxes | $1,867 | $434 |
Property Value by Mortgage Status in Ogden
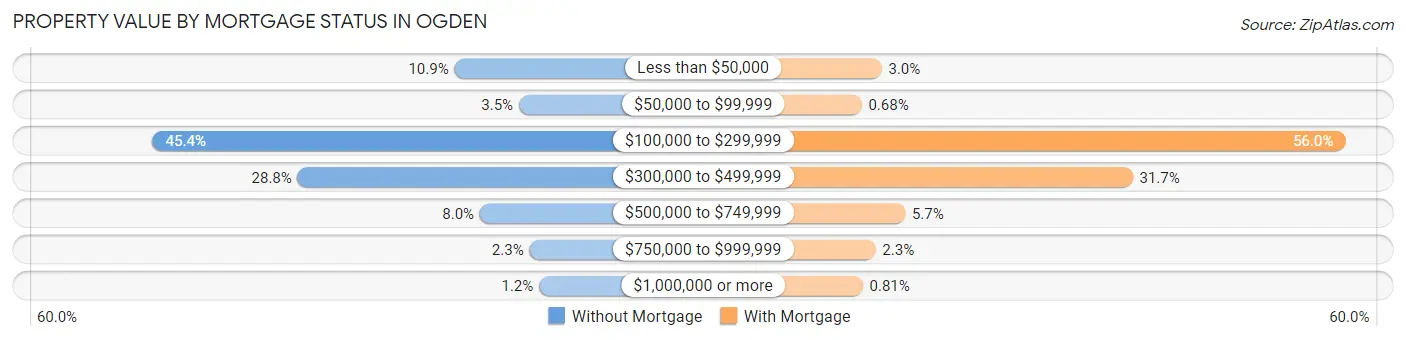
| Property Value | Without Mortgage | With Mortgage |
| Less than $50,000 | 624 (10.9%) | 407 (3.0%) |
| $50,000 to $99,999 | 201 (3.5%) | 94 (0.7%) |
| $100,000 to $299,999 | 2,603 (45.4%) | 7,680 (56.0%) |
| $300,000 to $499,999 | 1,653 (28.8%) | 4,346 (31.7%) |
| $500,000 to $749,999 | 457 (8.0%) | 775 (5.7%) |
| $750,000 to $999,999 | 132 (2.3%) | 312 (2.3%) |
| $1,000,000 or more | 69 (1.2%) | 111 (0.8%) |
| Total | 5,739 (100.0%) | 13,725 (100.0%) |
Household Income by Mortgage Status in Ogden
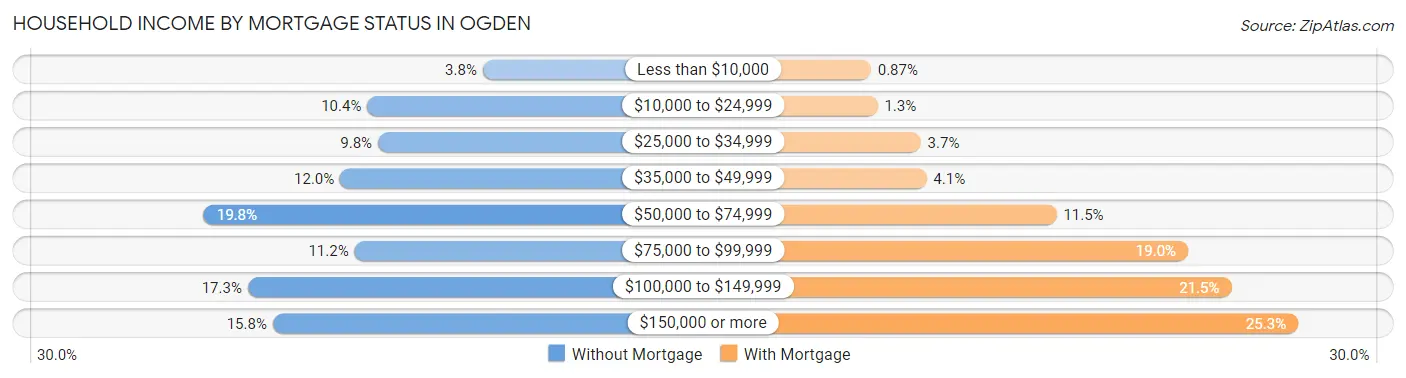
| Household Income | Without Mortgage | With Mortgage |
| Less than $10,000 | 219 (3.8%) | 119 (0.9%) |
| $10,000 to $24,999 | 598 (10.4%) | 172 (1.3%) |
| $25,000 to $34,999 | 563 (9.8%) | 511 (3.7%) |
| $35,000 to $49,999 | 687 (12.0%) | 556 (4.1%) |
| $50,000 to $74,999 | 1,134 (19.8%) | 1,575 (11.5%) |
| $75,000 to $99,999 | 640 (11.2%) | 2,607 (19.0%) |
| $100,000 to $149,999 | 990 (17.2%) | 2,947 (21.5%) |
| $150,000 or more | 908 (15.8%) | 3,469 (25.3%) |
| Total | 5,739 (100.0%) | 13,725 (100.0%) |
Property Value to Household Income Ratio in Ogden
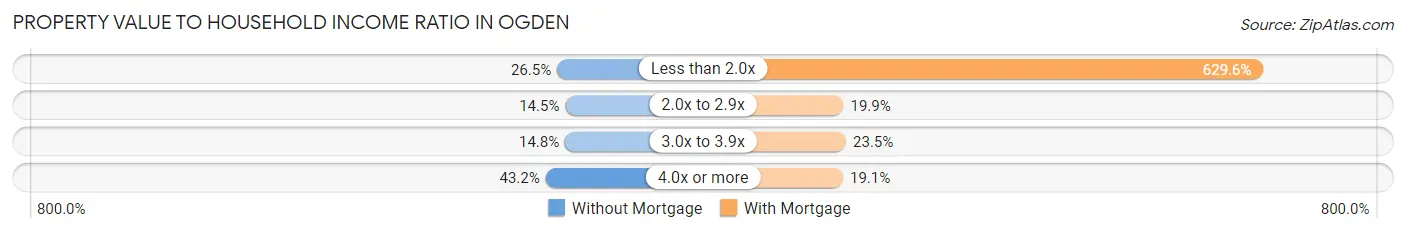
| Value-to-Income Ratio | Without Mortgage | With Mortgage |
| Less than 2.0x | 1,522 (26.5%) | 86,407 (629.6%) |
| 2.0x to 2.9x | 831 (14.5%) | 2,725 (19.9%) |
| 3.0x to 3.9x | 850 (14.8%) | 3,226 (23.5%) |
| 4.0x or more | 2,477 (43.2%) | 2,614 (19.1%) |
| Total | 5,739 (100.0%) | 13,725 (100.0%) |
Real Estate Taxes by Mortgage Status in Ogden
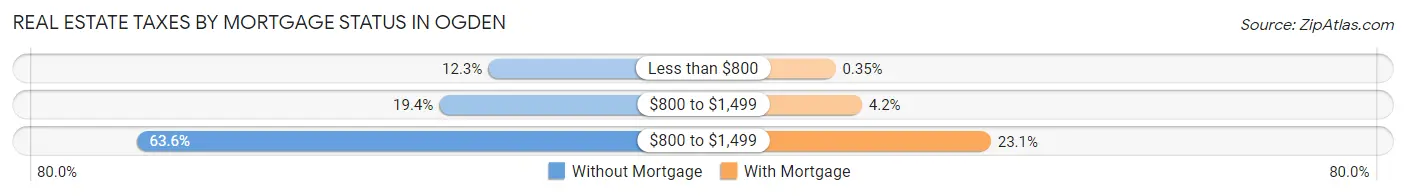
| Property Taxes | Without Mortgage | With Mortgage |
| Less than $800 | 704 (12.3%) | 48 (0.4%) |
| $800 to $1,499 | 1,115 (19.4%) | 578 (4.2%) |
| $800 to $1,499 | 3,651 (63.6%) | 3,163 (23.1%) |
| Total | 5,739 (100.0%) | 13,725 (100.0%) |
Health & Disability in Ogden
Health Insurance Coverage by Age in Ogden
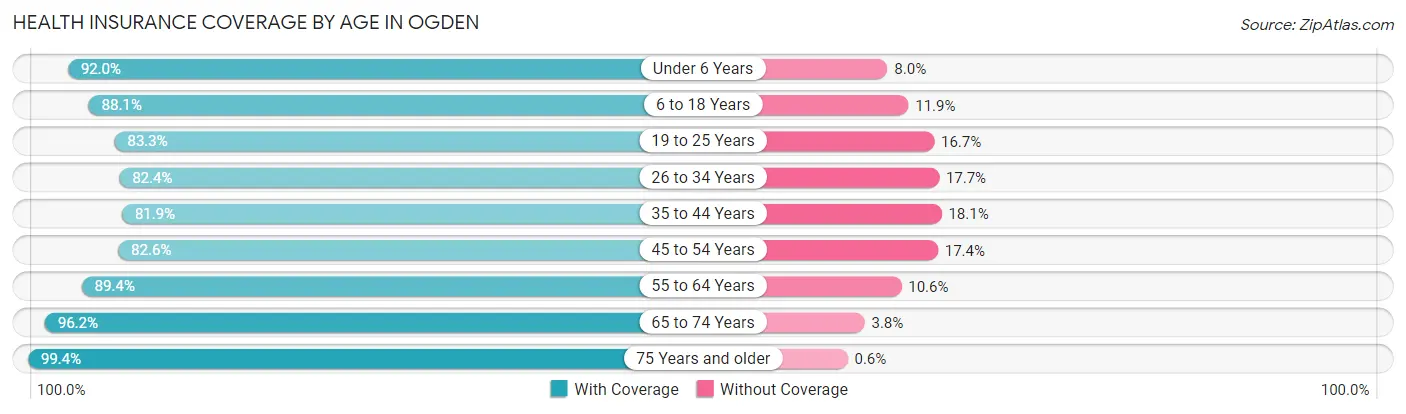
| Age Bracket | With Coverage | Without Coverage |
| Under 6 Years | 6,591 (92.0%) | 576 (8.0%) |
| 6 to 18 Years | 12,991 (88.1%) | 1,762 (11.9%) |
| 19 to 25 Years | 8,712 (83.3%) | 1,750 (16.7%) |
| 26 to 34 Years | 11,284 (82.4%) | 2,419 (17.6%) |
| 35 to 44 Years | 9,152 (81.9%) | 2,025 (18.1%) |
| 45 to 54 Years | 7,558 (82.6%) | 1,596 (17.4%) |
| 55 to 64 Years | 8,316 (89.4%) | 989 (10.6%) |
| 65 to 74 Years | 5,791 (96.2%) | 227 (3.8%) |
| 75 Years and older | 3,473 (99.4%) | 21 (0.6%) |
| Total | 73,868 (86.7%) | 11,365 (13.3%) |
Health Insurance Coverage by Citizenship Status in Ogden
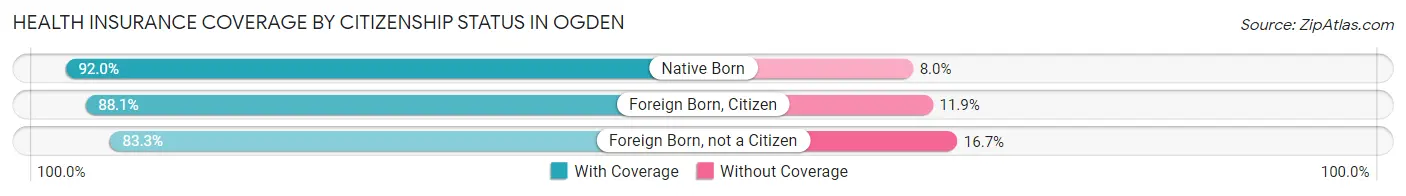
| Citizenship Status | With Coverage | Without Coverage |
| Native Born | 6,591 (92.0%) | 576 (8.0%) |
| Foreign Born, Citizen | 12,991 (88.1%) | 1,762 (11.9%) |
| Foreign Born, not a Citizen | 8,712 (83.3%) | 1,750 (16.7%) |
Health Insurance Coverage by Household Income in Ogden
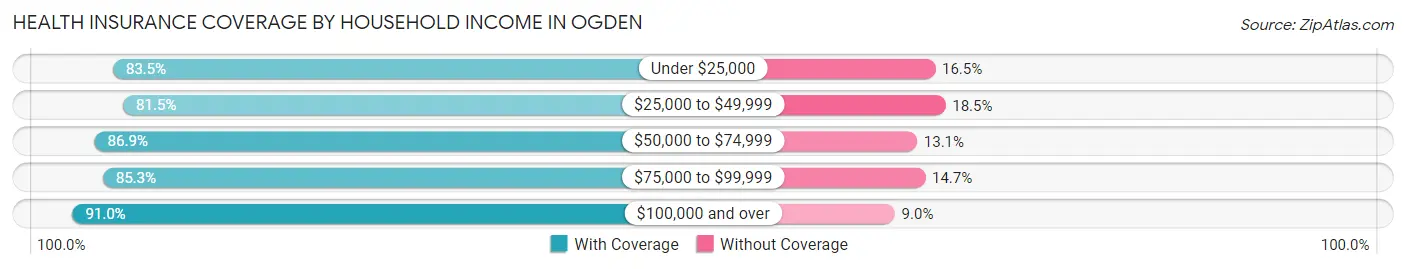
| Household Income | With Coverage | Without Coverage |
| Under $25,000 | 6,453 (83.5%) | 1,278 (16.5%) |
| $25,000 to $49,999 | 12,210 (81.5%) | 2,765 (18.5%) |
| $50,000 to $74,999 | 14,962 (86.9%) | 2,261 (13.1%) |
| $75,000 to $99,999 | 14,159 (85.3%) | 2,433 (14.7%) |
| $100,000 and over | 25,088 (91.0%) | 2,473 (9.0%) |
Public vs Private Health Insurance Coverage by Age in Ogden
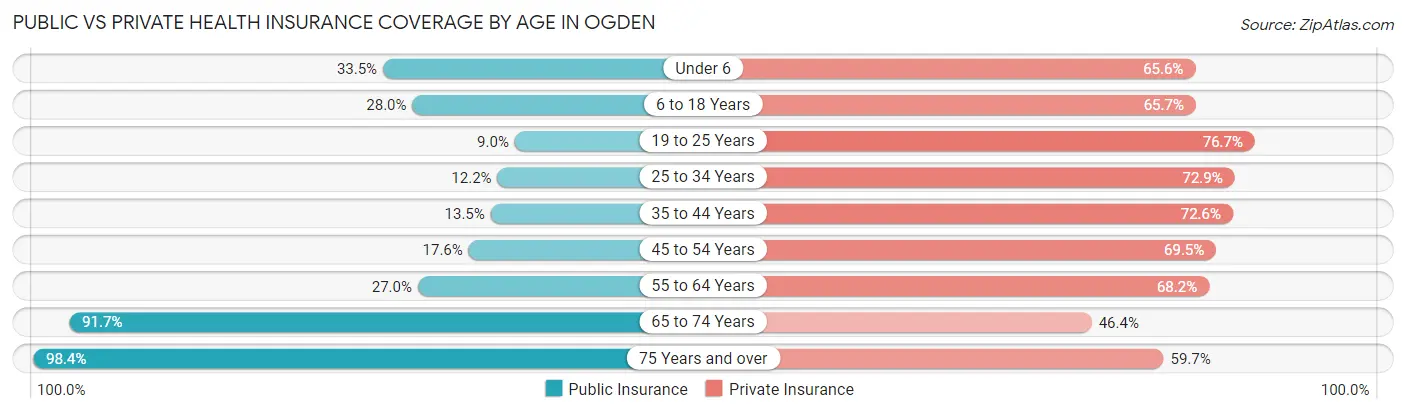
| Age Bracket | Public Insurance | Private Insurance |
| Under 6 | 2,400 (33.5%) | 4,701 (65.6%) |
| 6 to 18 Years | 4,134 (28.0%) | 9,691 (65.7%) |
| 19 to 25 Years | 944 (9.0%) | 8,019 (76.6%) |
| 25 to 34 Years | 1,677 (12.2%) | 9,989 (72.9%) |
| 35 to 44 Years | 1,509 (13.5%) | 8,111 (72.6%) |
| 45 to 54 Years | 1,609 (17.6%) | 6,359 (69.5%) |
| 55 to 64 Years | 2,514 (27.0%) | 6,341 (68.1%) |
| 65 to 74 Years | 5,520 (91.7%) | 2,792 (46.4%) |
| 75 Years and over | 3,439 (98.4%) | 2,087 (59.7%) |
| Total | 23,746 (27.9%) | 58,090 (68.1%) |
Disability Status by Sex by Age in Ogden
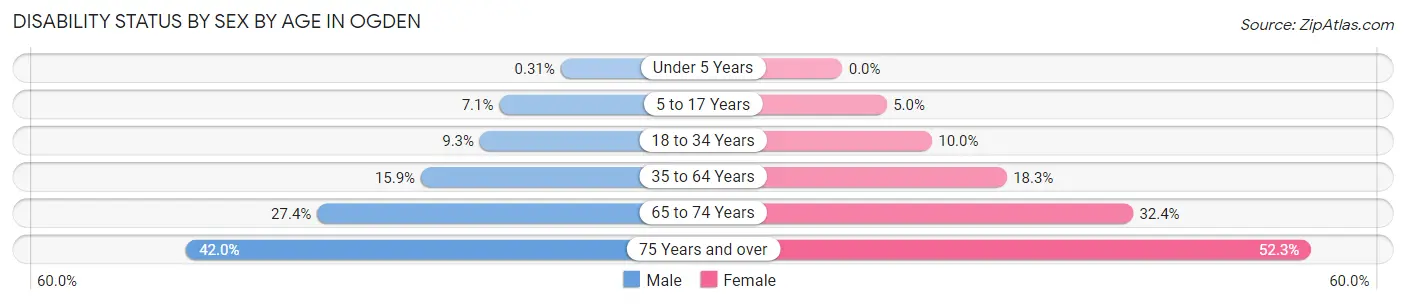
| Age Bracket | Male | Female |
| Under 5 Years | 9 (0.3%) | 0 (0.0%) |
| 5 to 17 Years | 560 (7.1%) | 336 (5.0%) |
| 18 to 34 Years | 1,250 (9.3%) | 1,204 (10.0%) |
| 35 to 64 Years | 2,480 (15.9%) | 2,564 (18.3%) |
| 65 to 74 Years | 821 (27.4%) | 979 (32.4%) |
| 75 Years and over | 533 (42.0%) | 1,163 (52.3%) |
Disability Class by Sex by Age in Ogden
Disability Class: Hearing Difficulty
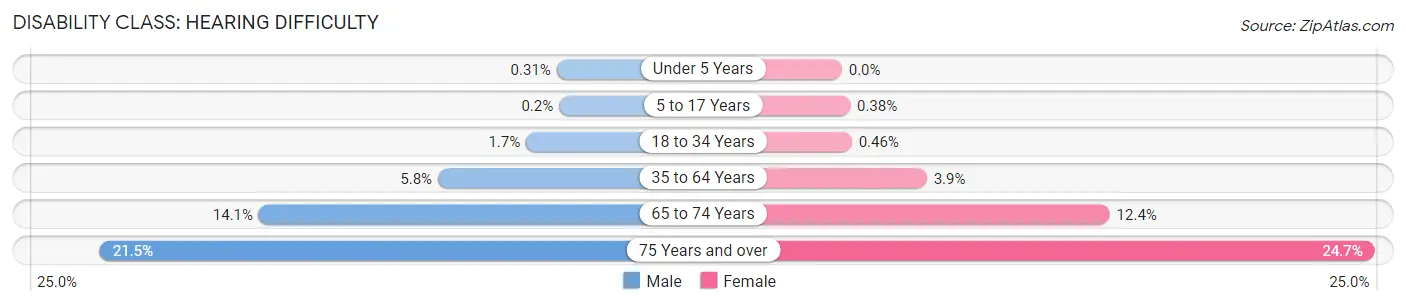
| Age Bracket | Male | Female |
| Under 5 Years | 9 (0.3%) | 0 (0.0%) |
| 5 to 17 Years | 16 (0.2%) | 26 (0.4%) |
| 18 to 34 Years | 233 (1.7%) | 55 (0.5%) |
| 35 to 64 Years | 910 (5.8%) | 552 (3.9%) |
| 65 to 74 Years | 423 (14.1%) | 376 (12.4%) |
| 75 Years and over | 273 (21.5%) | 550 (24.7%) |
Disability Class: Vision Difficulty
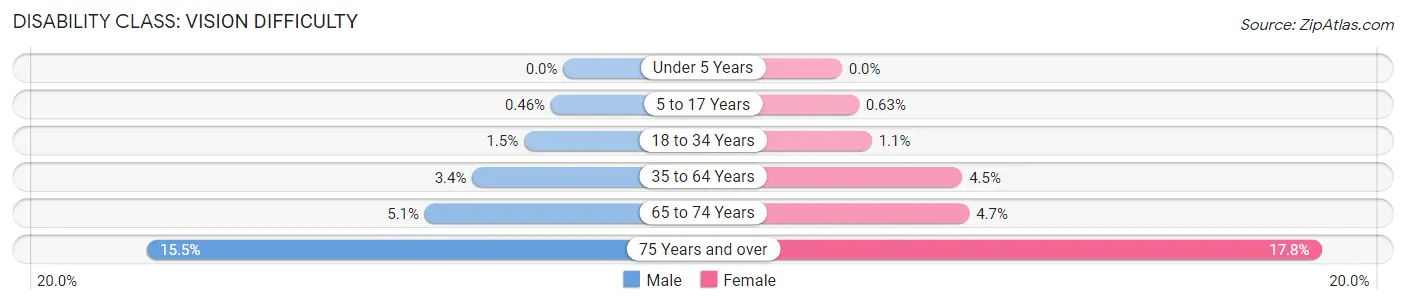
| Age Bracket | Male | Female |
| Under 5 Years | 0 (0.0%) | 0 (0.0%) |
| 5 to 17 Years | 36 (0.5%) | 43 (0.6%) |
| 18 to 34 Years | 196 (1.5%) | 134 (1.1%) |
| 35 to 64 Years | 529 (3.4%) | 626 (4.5%) |
| 65 to 74 Years | 154 (5.1%) | 143 (4.7%) |
| 75 Years and over | 196 (15.4%) | 396 (17.8%) |
Disability Class: Cognitive Difficulty
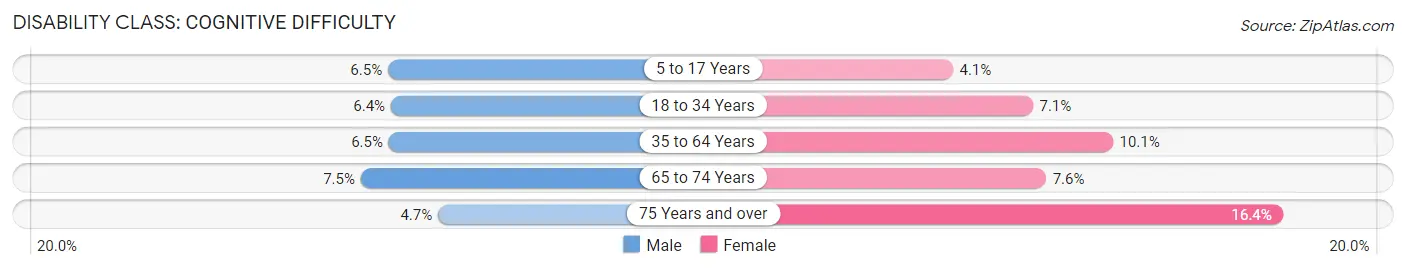
| Age Bracket | Male | Female |
| 5 to 17 Years | 512 (6.5%) | 279 (4.1%) |
| 18 to 34 Years | 860 (6.4%) | 855 (7.1%) |
| 35 to 64 Years | 1,013 (6.5%) | 1,407 (10.1%) |
| 65 to 74 Years | 225 (7.5%) | 229 (7.6%) |
| 75 Years and over | 59 (4.6%) | 365 (16.4%) |
Disability Class: Ambulatory Difficulty
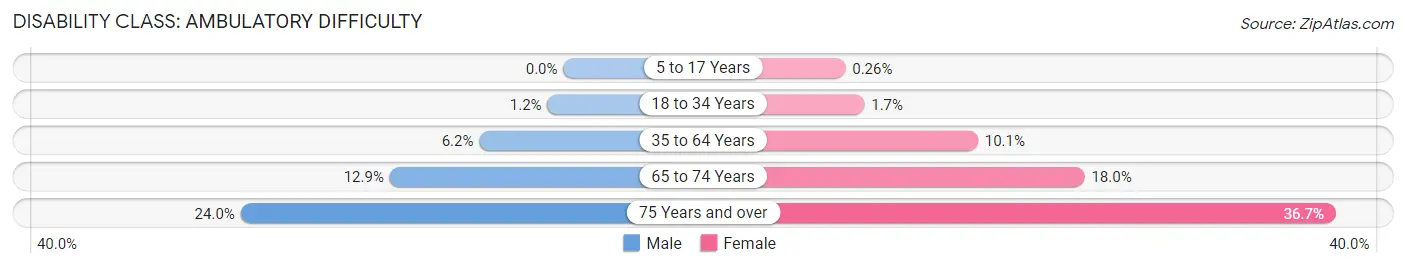
| Age Bracket | Male | Female |
| 5 to 17 Years | 0 (0.0%) | 18 (0.3%) |
| 18 to 34 Years | 159 (1.2%) | 202 (1.7%) |
| 35 to 64 Years | 976 (6.2%) | 1,414 (10.1%) |
| 65 to 74 Years | 386 (12.9%) | 545 (18.0%) |
| 75 Years and over | 304 (24.0%) | 816 (36.7%) |
Disability Class: Self-Care Difficulty
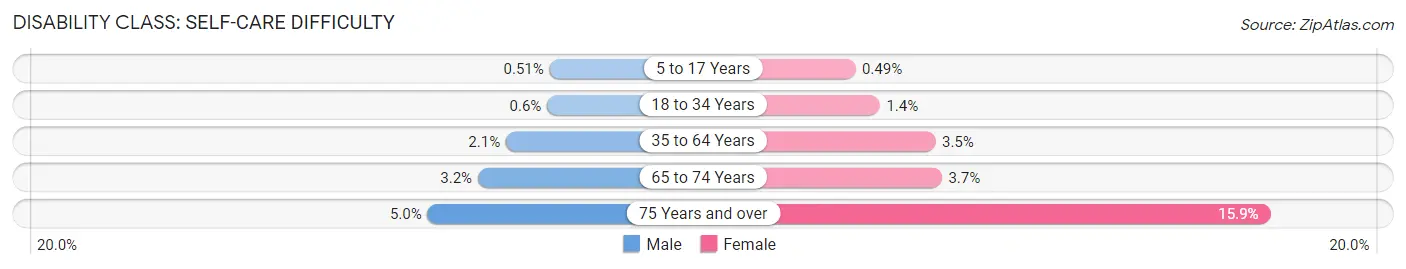
| Age Bracket | Male | Female |
| 5 to 17 Years | 40 (0.5%) | 33 (0.5%) |
| 18 to 34 Years | 81 (0.6%) | 169 (1.4%) |
| 35 to 64 Years | 333 (2.1%) | 485 (3.5%) |
| 65 to 74 Years | 95 (3.2%) | 112 (3.7%) |
| 75 Years and over | 64 (5.0%) | 354 (15.9%) |
Technology Access in Ogden
Computing Device Access in Ogden
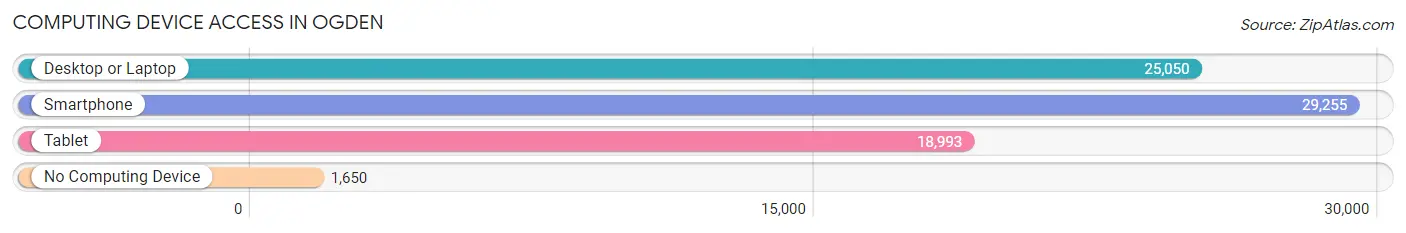
| Device Type | # Households | % Households |
| Desktop or Laptop | 25,050 | 77.5% |
| Smartphone | 29,255 | 90.5% |
| Tablet | 18,993 | 58.8% |
| No Computing Device | 1,650 | 5.1% |
| Total | 32,326 | 100.0% |
Internet Access in Ogden
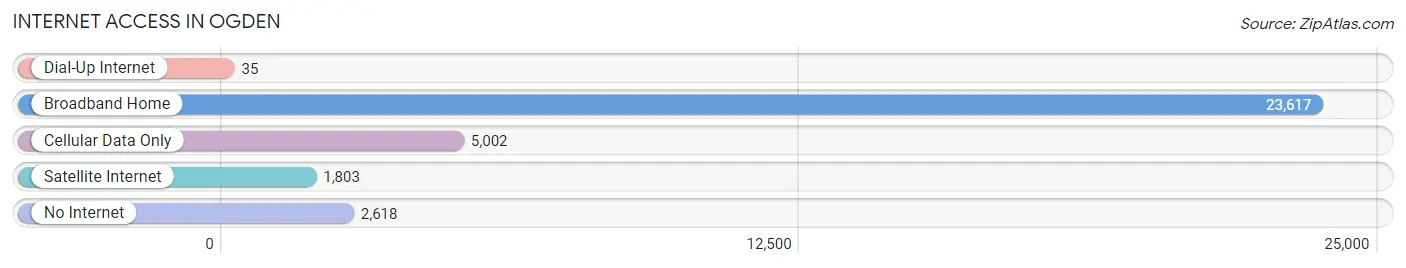
| Internet Type | # Households | % Households |
| Dial-Up Internet | 35 | 0.1% |
| Broadband Home | 23,617 | 73.1% |
| Cellular Data Only | 5,002 | 15.5% |
| Satellite Internet | 1,803 | 5.6% |
| No Internet | 2,618 | 8.1% |
| Total | 32,326 | 100.0% |
Ogden Summary
Ogden, Utah is a city located in the northern part of the state, about 40 miles north of Salt Lake City. It is the county seat of Weber County and is the principal city of the Ogden-Clearfield Metropolitan Statistical Area. The city has a population of about 87,000 people and is the ninth-largest city in Utah.
Geography
Ogden is located in the Wasatch Front region of Utah, at the base of the Wasatch Mountains. The city is situated at the confluence of the Ogden and Weber Rivers, which form the Ogden River. The city is bordered by the cities of Layton to the north, Clearfield to the northwest, South Ogden to the west, and Riverdale to the south. The city is also located near the Great Salt Lake, which is about 30 miles to the west.
The city has a total area of about 24 square miles, with a total land area of about 22 square miles. The city has an elevation of about 4,300 feet above sea level. The climate in Ogden is generally mild, with hot summers and cold winters.
Economy
Ogden has a diverse economy, with a variety of industries and businesses. The city is home to several large employers, including the Hill Air Force Base, Weber State University, and the Ogden-Hinckley Airport. The city is also home to several major corporations, including ATK, Autoliv, and Questar.
The city is also home to several major industries, including manufacturing, transportation, and healthcare. The city is home to several major manufacturing companies, including ATK, Autoliv, and Questar. The city is also home to several major transportation companies, including Union Pacific Railroad, BNSF Railway, and Greyhound Lines. The city is also home to several major healthcare companies, including Intermountain Healthcare and Ogden Regional Medical Center.
Demographics
As of the 2010 census, Ogden had a population of 87,316 people. The racial makeup of the city was 79.2% White, 1.3% African American, 1.2% Native American, 1.7% Asian, 0.2% Pacific Islander, 13.2% from other races, and 3.4% from two or more races. Hispanic or Latino of any race were 22.3% of the population.
The median income for a household in the city was $41,919, and the median income for a family was $50,919. The per capita income for the city was $20,919. About 13.2% of families and 17.2% of the population were below the poverty line, including 25.2% of those under age 18 and 8.2% of those age 65 or over.
Conclusion
Ogden, Utah is a city located in the northern part of the state, about 40 miles north of Salt Lake City. It is the county seat of Weber County and is the principal city of the Ogden-Clearfield Metropolitan Statistical Area. The city has a population of about 87,000 people and is the ninth-largest city in Utah. Ogden is located in the Wasatch Front region of Utah, at the base of the Wasatch Mountains. The city has a diverse economy, with a variety of industries and businesses. The city is home to several large employers, including the Hill Air Force Base, Weber State University, and the Ogden-Hinckley Airport. As of the 2010 census, Ogden had a population of 87,316 people. The racial makeup of the city was 79.2% White, 1.3% African American, 1.2% Native American, 1.7% Asian, 0.2% Pacific Islander, 13.2% from other races, and 3.4% from two or more races. The median income for a household in the city was $41,919, and the median income for a family was $50,919.
Common Questions
What is Per Capita Income in Ogden?
Per Capita income in Ogden is $31,437.
What is the Median Family Income in Ogden?
Median Family Income in Ogden is $76,861.
What is the Median Household income in Ogden?
Median Household Income in Ogden is $66,226.
What is Income or Wage Gap in Ogden?
Income or Wage Gap in Ogden is 29.1%.
Women in Ogden earn 70.9 cents for every dollar earned by a man.
What is Family Income Deficit in Ogden?
Family Income Deficit in Ogden is $11,171.
Families that are below poverty line in Ogden earn $11,171 less on average than the poverty threshold level.
What is Inequality or Gini Index in Ogden?
Inequality or Gini Index in Ogden is 0.42.
What is the Total Population of Ogden?
Total Population of Ogden is 86,754.
What is the Total Male Population of Ogden?
Total Male Population of Ogden is 45,297.
What is the Total Female Population of Ogden?
Total Female Population of Ogden is 41,457.
What is the Ratio of Males per 100 Females in Ogden?
There are 109.26 Males per 100 Females in Ogden.
What is the Ratio of Females per 100 Males in Ogden?
There are 91.52 Females per 100 Males in Ogden.
What is the Median Population Age in Ogden?
Median Population Age in Ogden is 32.8 Years.
What is the Average Family Size in Ogden
Average Family Size in Ogden is 3.3 People.
What is the Average Household Size in Ogden
Average Household Size in Ogden is 2.6 People.
How Large is the Labor Force in Ogden?
There are 46,544 People in the Labor Forcein in Ogden.
What is the Percentage of People in the Labor Force in Ogden?
68.1% of People are in the Labor Force in Ogden.
What is the Unemployment Rate in Ogden?
Unemployment Rate in Ogden is 4.3%.