Berea, SC Map & Demographics
Berea Map
Berea Overview
$25,048
PER CAPITA INCOME
$58,306
AVG FAMILY INCOME
$46,393
AVG HOUSEHOLD INCOME
22.3%
WAGE / INCOME GAP [ % ]
77.7¢/ $1
WAGE / INCOME GAP [ $ ]
$11,452
FAMILY INCOME DEFICIT
0.45
INEQUALITY / GINI INDEX
16,184
TOTAL POPULATION
7,853
MALE POPULATION
8,331
FEMALE POPULATION
94.26
MALES / 100 FEMALES
106.09
FEMALES / 100 MALES
37.9
MEDIAN AGE
3.2
AVG FAMILY SIZE
2.6
AVG HOUSEHOLD SIZE
7,914
LABOR FORCE [ PEOPLE ]
60.2%
PERCENT IN LABOR FORCE
6.9%
UNEMPLOYMENT RATE
Income in Berea
Income Overview in Berea
Per Capita Income in Berea is $25,048, while median incomes of families and households are $58,306 and $46,393 respectively.
| Characteristic | Number | Measure |
| Per Capita Income | 16,184 | $25,048 |
| Median Family Income | 3,878 | $58,306 |
| Mean Family Income | 3,878 | $71,737 |
| Median Household Income | 6,048 | $46,393 |
| Mean Household Income | 6,048 | $65,446 |
| Income Deficit | 3,878 | $11,452 |
| Wage / Income Gap (%) | 16,184 | 22.30% |
| Wage / Income Gap ($) | 16,184 | 77.70¢ per $1 |
| Gini / Inequality Index | 16,184 | 0.45 |
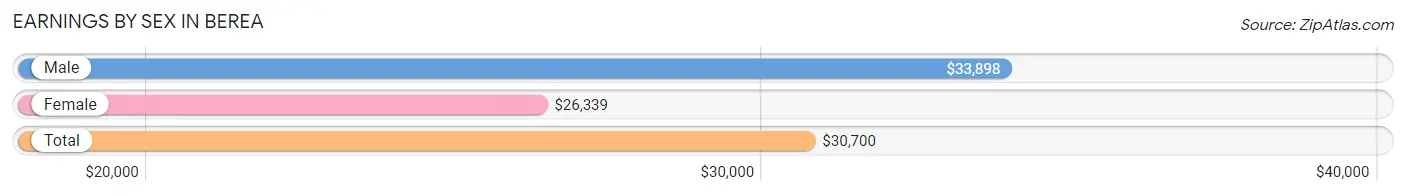
Earnings by Sex in Berea
Average Earnings in Berea are $30,700, $33,898 for men and $26,339 for women, a difference of 22.3%.
| Sex | Number | Average Earnings |
| Male | 4,311 (51.7%) | $33,898 |
| Female | 4,028 (48.3%) | $26,339 |
| Total | 8,339 (100.0%) | $30,700 |
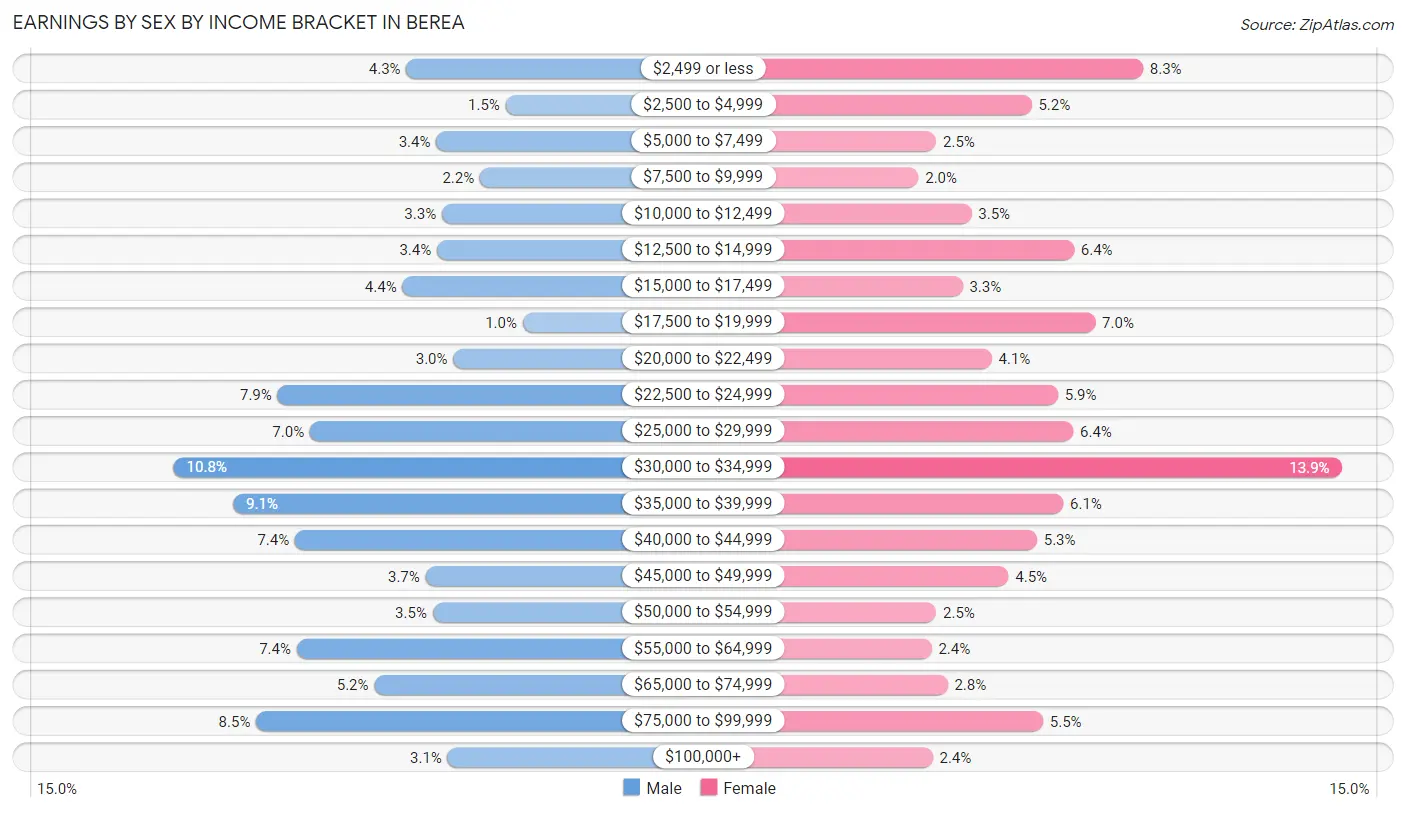
Earnings by Sex by Income Bracket in Berea
The most common earnings brackets in Berea are $30,000 to $34,999 for men (466 | 10.8%) and $30,000 to $34,999 for women (560 | 13.9%).
| Income | Male | Female |
| $2,499 or less | 184 (4.3%) | 335 (8.3%) |
| $2,500 to $4,999 | 64 (1.5%) | 209 (5.2%) |
| $5,000 to $7,499 | 148 (3.4%) | 101 (2.5%) |
| $7,500 to $9,999 | 95 (2.2%) | 81 (2.0%) |
| $10,000 to $12,499 | 141 (3.3%) | 141 (3.5%) |
| $12,500 to $14,999 | 147 (3.4%) | 257 (6.4%) |
| $15,000 to $17,499 | 189 (4.4%) | 131 (3.3%) |
| $17,500 to $19,999 | 43 (1.0%) | 281 (7.0%) |
| $20,000 to $22,499 | 127 (2.9%) | 164 (4.1%) |
| $22,500 to $24,999 | 340 (7.9%) | 239 (5.9%) |
| $25,000 to $29,999 | 301 (7.0%) | 256 (6.4%) |
| $30,000 to $34,999 | 466 (10.8%) | 560 (13.9%) |
| $35,000 to $39,999 | 394 (9.1%) | 245 (6.1%) |
| $40,000 to $44,999 | 319 (7.4%) | 215 (5.3%) |
| $45,000 to $49,999 | 161 (3.7%) | 183 (4.5%) |
| $50,000 to $54,999 | 152 (3.5%) | 101 (2.5%) |
| $55,000 to $64,999 | 317 (7.3%) | 96 (2.4%) |
| $65,000 to $74,999 | 223 (5.2%) | 114 (2.8%) |
| $75,000 to $99,999 | 366 (8.5%) | 222 (5.5%) |
| $100,000+ | 134 (3.1%) | 97 (2.4%) |
| Total | 4,311 (100.0%) | 4,028 (100.0%) |
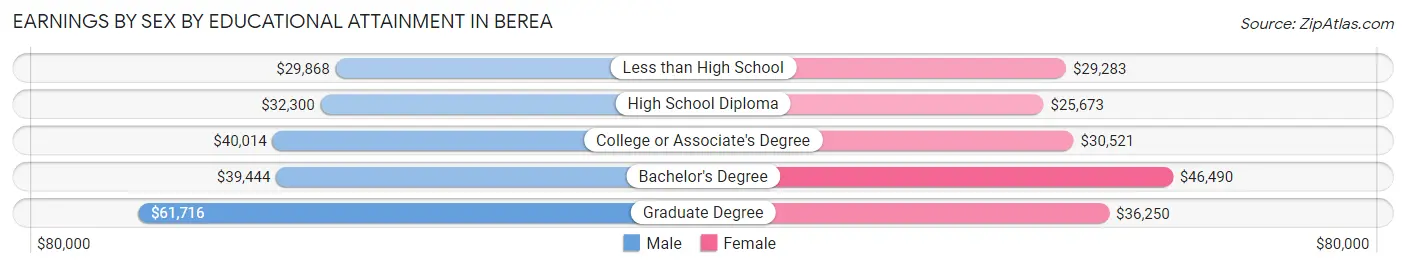
Earnings by Sex by Educational Attainment in Berea
Average earnings in Berea are $36,324 for men and $30,750 for women, a difference of 15.3%. Men with an educational attainment of graduate degree enjoy the highest average annual earnings of $61,716, while those with less than high school education earn the least with $29,868. Women with an educational attainment of bachelor's degree earn the most with the average annual earnings of $46,490, while those with high school diploma education have the smallest earnings of $25,673.
| Educational Attainment | Male Income | Female Income |
| Less than High School | $29,868 | $29,283 |
| High School Diploma | $32,300 | $25,673 |
| College or Associate's Degree | $40,014 | $30,521 |
| Bachelor's Degree | $39,444 | $46,490 |
| Graduate Degree | $61,716 | $36,250 |
| Total | $36,324 | $30,750 |
Family Income in Berea
Family Income Brackets in Berea
According to the Berea family income data, there are 690 families falling into the $35,000 to $49,999 income range, which is the most common income bracket and makes up 17.8% of all families. Conversely, the $200,000+ income bracket is the least frequent group with only 66 families (1.7%) belonging to this category.
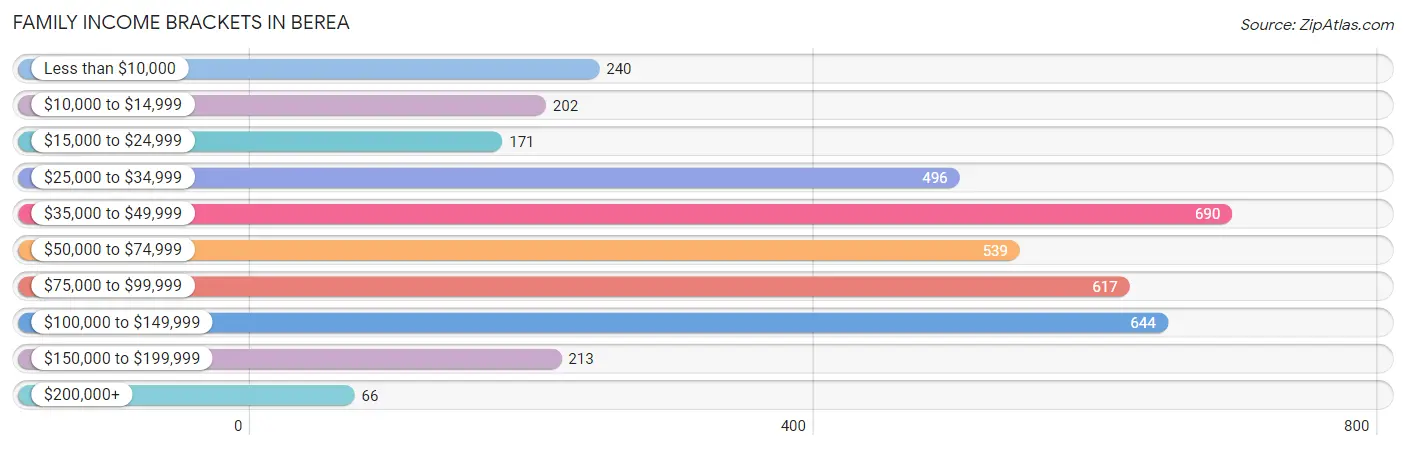
| Income Bracket | # Families | % Families |
| Less than $10,000 | 240 | 6.2% |
| $10,000 to $14,999 | 202 | 5.2% |
| $15,000 to $24,999 | 171 | 4.4% |
| $25,000 to $34,999 | 496 | 12.8% |
| $35,000 to $49,999 | 690 | 17.8% |
| $50,000 to $74,999 | 539 | 13.9% |
| $75,000 to $99,999 | 617 | 15.9% |
| $100,000 to $149,999 | 644 | 16.6% |
| $150,000 to $199,999 | 213 | 5.5% |
| $200,000+ | 66 | 1.7% |
Family Income by Famaliy Size in Berea
7+ person families (153 | 4.0%) account for the highest median family income in Berea with $114,402 per family, while 2-person families (1,753 | 45.2%) have the highest median income of $25,573 per family member.
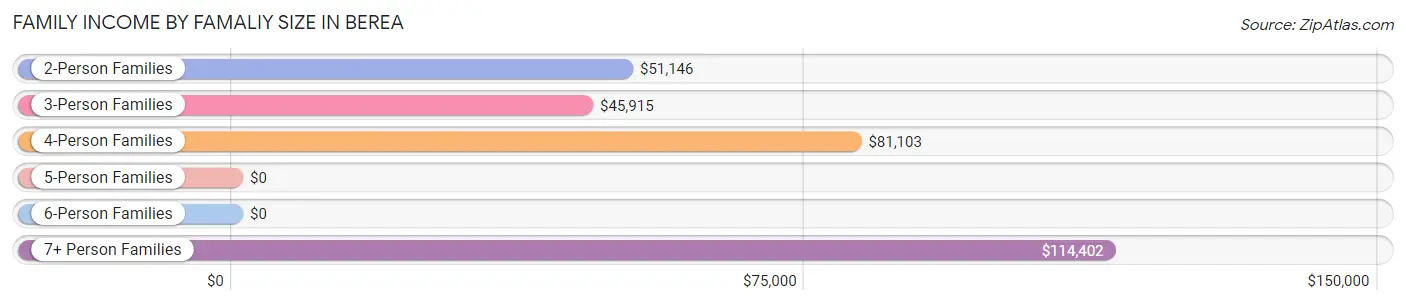
| Income Bracket | # Families | Median Income |
| 2-Person Families | 1,753 (45.2%) | $51,146 |
| 3-Person Families | 894 (23.1%) | $45,915 |
| 4-Person Families | 709 (18.3%) | $81,103 |
| 5-Person Families | 357 (9.2%) | $0 |
| 6-Person Families | 12 (0.3%) | $0 |
| 7+ Person Families | 153 (4.0%) | $114,402 |
| Total | 3,878 (100.0%) | $58,306 |
Family Income by Number of Earners in Berea
The median family income in Berea is $58,306, with families comprising 3+ earners (543) having the highest median family income of $103,065, while families with no earners (565) have the lowest median family income of $37,375, accounting for 14.0% and 14.6% of families, respectively.
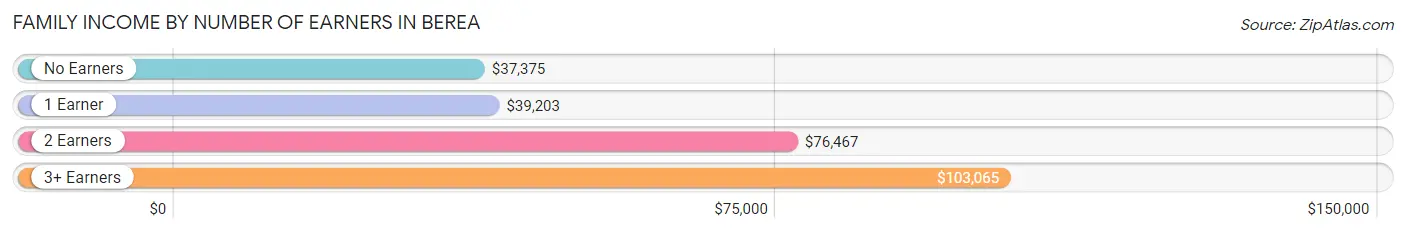
| Number of Earners | # Families | Median Income |
| No Earners | 565 (14.6%) | $37,375 |
| 1 Earner | 1,454 (37.5%) | $39,203 |
| 2 Earners | 1,316 (33.9%) | $76,467 |
| 3+ Earners | 543 (14.0%) | $103,065 |
| Total | 3,878 (100.0%) | $58,306 |
Household Income in Berea
Household Income Brackets in Berea
With 1,016 households falling in the category, the $35,000 to $49,999 income range is the most frequent in Berea, accounting for 16.8% of all households. In contrast, only 121 households (2.0%) fall into the $200,000+ income bracket, making it the least populous group.
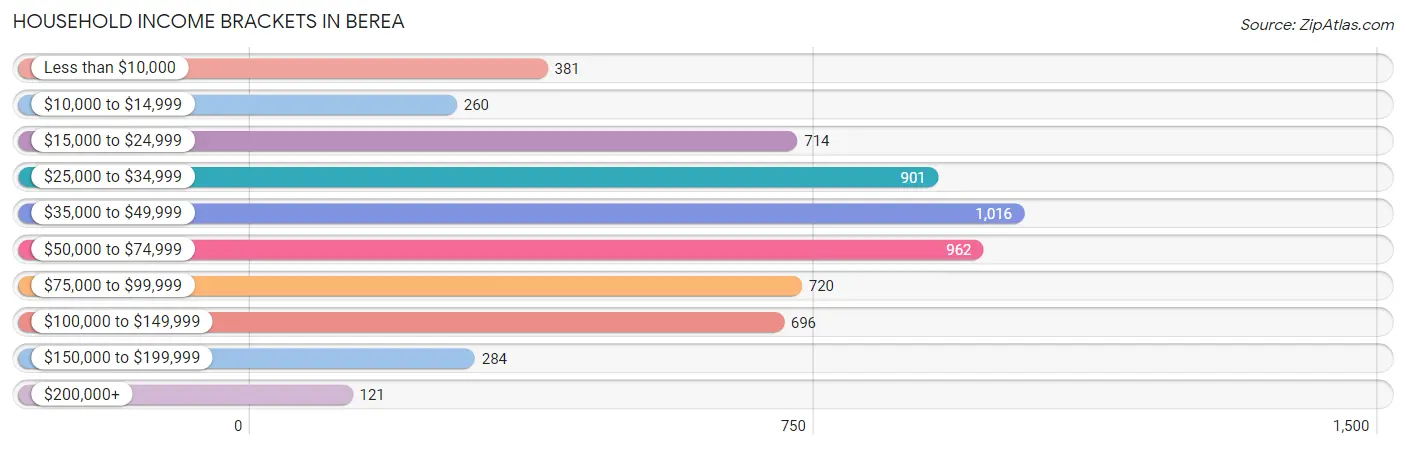
| Income Bracket | # Households | % Households |
| Less than $10,000 | 381 | 6.3% |
| $10,000 to $14,999 | 260 | 4.3% |
| $15,000 to $24,999 | 714 | 11.8% |
| $25,000 to $34,999 | 901 | 14.9% |
| $35,000 to $49,999 | 1,016 | 16.8% |
| $50,000 to $74,999 | 962 | 15.9% |
| $75,000 to $99,999 | 720 | 11.9% |
| $100,000 to $149,999 | 696 | 11.5% |
| $150,000 to $199,999 | 284 | 4.7% |
| $200,000+ | 121 | 2.0% |
Household Income by Householder Age in Berea
The median household income in Berea is $46,393, with the highest median household income of $55,842 found in the 45 to 64 years age bracket for the primary householder. A total of 2,239 households (37.0%) fall into this category. Meanwhile, the 65+ years age bracket for the primary householder has the lowest median household income of $36,897, with 1,508 households (24.9%) in this group.
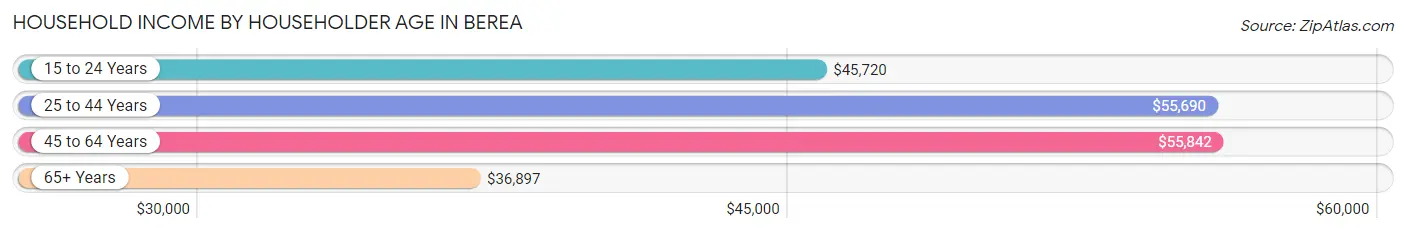
| Income Bracket | # Households | Median Income |
| 15 to 24 Years | 397 (6.6%) | $45,720 |
| 25 to 44 Years | 1,904 (31.5%) | $55,690 |
| 45 to 64 Years | 2,239 (37.0%) | $55,842 |
| 65+ Years | 1,508 (24.9%) | $36,897 |
| Total | 6,048 (100.0%) | $46,393 |
Poverty in Berea
Income Below Poverty by Sex and Age in Berea
With 17.7% poverty level for males and 22.0% for females among the residents of Berea, 15 year old males and 16 and 17 year old females are the most vulnerable to poverty, with 45 males (73.8%) and 98 females (48.8%) in their respective age groups living below the poverty level.
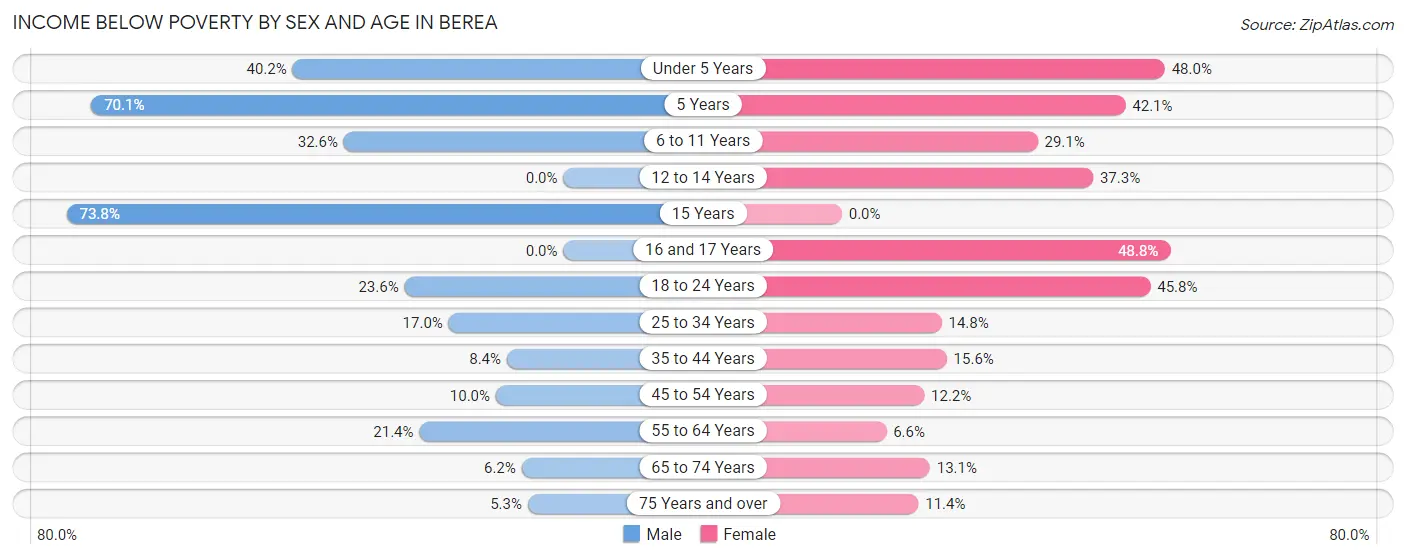
| Age Bracket | Male | Female |
| Under 5 Years | 234 (40.2%) | 257 (47.9%) |
| 5 Years | 68 (70.1%) | 32 (42.1%) |
| 6 to 11 Years | 179 (32.6%) | 100 (29.1%) |
| 12 to 14 Years | 0 (0.0%) | 185 (37.3%) |
| 15 Years | 45 (73.8%) | 0 (0.0%) |
| 16 and 17 Years | 0 (0.0%) | 98 (48.8%) |
| 18 to 24 Years | 159 (23.6%) | 426 (45.8%) |
| 25 to 34 Years | 220 (17.0%) | 136 (14.8%) |
| 35 to 44 Years | 60 (8.4%) | 182 (15.6%) |
| 45 to 54 Years | 127 (10.0%) | 97 (12.2%) |
| 55 to 64 Years | 201 (21.4%) | 66 (6.6%) |
| 65 to 74 Years | 49 (6.2%) | 118 (13.1%) |
| 75 Years and over | 17 (5.3%) | 77 (11.4%) |
| Total | 1,359 (17.7%) | 1,774 (22.0%) |
Income Above Poverty by Sex and Age in Berea
According to the poverty statistics in Berea, males aged 12 to 14 years and females aged 15 years are the age groups that are most secure financially, with 100.0% of males and 100.0% of females in these age groups living above the poverty line.
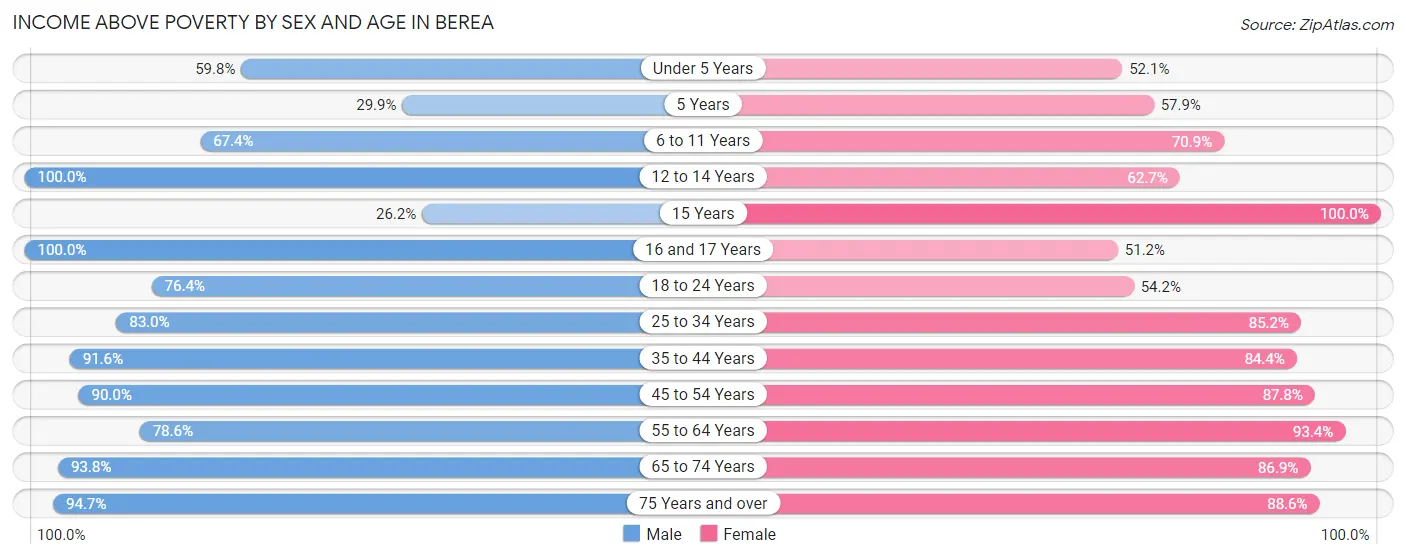
| Age Bracket | Male | Female |
| Under 5 Years | 348 (59.8%) | 279 (52.0%) |
| 5 Years | 29 (29.9%) | 44 (57.9%) |
| 6 to 11 Years | 370 (67.4%) | 244 (70.9%) |
| 12 to 14 Years | 117 (100.0%) | 311 (62.7%) |
| 15 Years | 16 (26.2%) | 22 (100.0%) |
| 16 and 17 Years | 255 (100.0%) | 103 (51.2%) |
| 18 to 24 Years | 515 (76.4%) | 504 (54.2%) |
| 25 to 34 Years | 1,072 (83.0%) | 782 (85.2%) |
| 35 to 44 Years | 655 (91.6%) | 987 (84.4%) |
| 45 to 54 Years | 1,141 (90.0%) | 697 (87.8%) |
| 55 to 64 Years | 739 (78.6%) | 935 (93.4%) |
| 65 to 74 Years | 741 (93.8%) | 785 (86.9%) |
| 75 Years and over | 305 (94.7%) | 601 (88.6%) |
| Total | 6,303 (82.3%) | 6,294 (78.0%) |
Income Below Poverty Among Married-Couple Families in Berea
The poverty statistics for married-couple families in Berea show that 7.4% or 166 of the total 2,229 families live below the poverty line. Families with 5 or more children have the highest poverty rate of 100.0%, comprising of 31 families. On the other hand, families with 1 or 2 children have the lowest poverty rate of 1.7%, which includes 11 families.
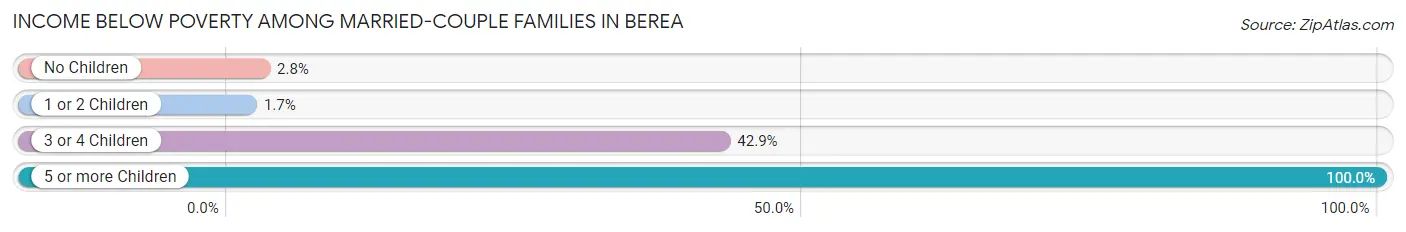
| Children | Above Poverty | Below Poverty |
| No Children | 1,291 (97.2%) | 37 (2.8%) |
| 1 or 2 Children | 656 (98.4%) | 11 (1.7%) |
| 3 or 4 Children | 116 (57.1%) | 87 (42.9%) |
| 5 or more Children | 0 (0.0%) | 31 (100.0%) |
| Total | 2,063 (92.5%) | 166 (7.4%) |
Income Below Poverty Among Single-Parent Households in Berea
According to the poverty data in Berea, 20.6% or 96 single-father households and 33.3% or 394 single-mother households are living below the poverty line. Among single-father households, those with 1 or 2 children have the highest poverty rate, with 66 households (24.4%) experiencing poverty. Likewise, among single-mother households, those with 3 or 4 children have the highest poverty rate, with 81 households (61.4%) falling below the poverty line.
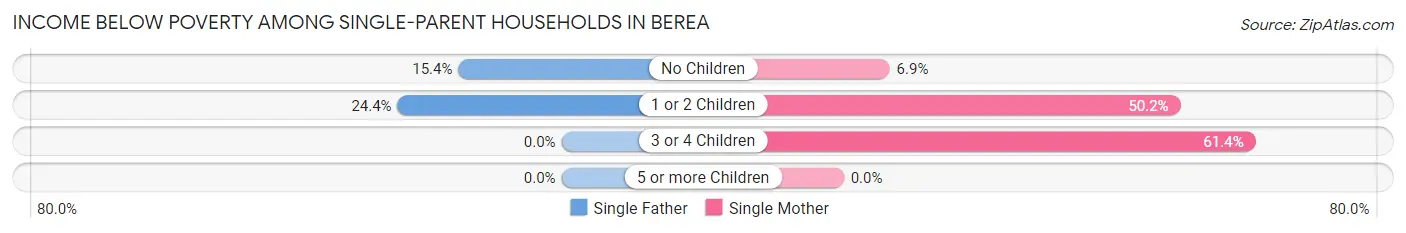
| Children | Single Father | Single Mother |
| No Children | 30 (15.4%) | 34 (6.9%) |
| 1 or 2 Children | 66 (24.4%) | 279 (50.2%) |
| 3 or 4 Children | 0 (0.0%) | 81 (61.4%) |
| 5 or more Children | 0 (0.0%) | 0 (0.0%) |
| Total | 96 (20.6%) | 394 (33.3%) |
Income Below Poverty Among Married-Couple vs Single-Parent Households in Berea
The poverty data for Berea shows that 166 of the married-couple family households (7.4%) and 490 of the single-parent households (29.7%) are living below the poverty level. Within the married-couple family households, those with 5 or more children have the highest poverty rate, with 31 households (100.0%) falling below the poverty line. Among the single-parent households, those with 3 or 4 children have the highest poverty rate, with 81 household (61.4%) living below poverty.
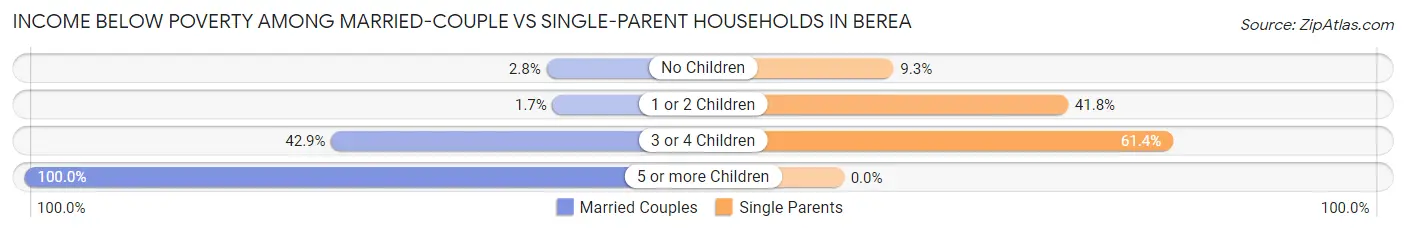
| Children | Married-Couple Families | Single-Parent Households |
| No Children | 37 (2.8%) | 64 (9.3%) |
| 1 or 2 Children | 11 (1.7%) | 345 (41.8%) |
| 3 or 4 Children | 87 (42.9%) | 81 (61.4%) |
| 5 or more Children | 31 (100.0%) | 0 (0.0%) |
| Total | 166 (7.4%) | 490 (29.7%) |
Race in Berea
The most populous races in Berea are White / Caucasian (7,976 | 49.3%), Hispanic or Latino (4,439 | 27.4%), and Black / African American (3,601 | 22.3%).
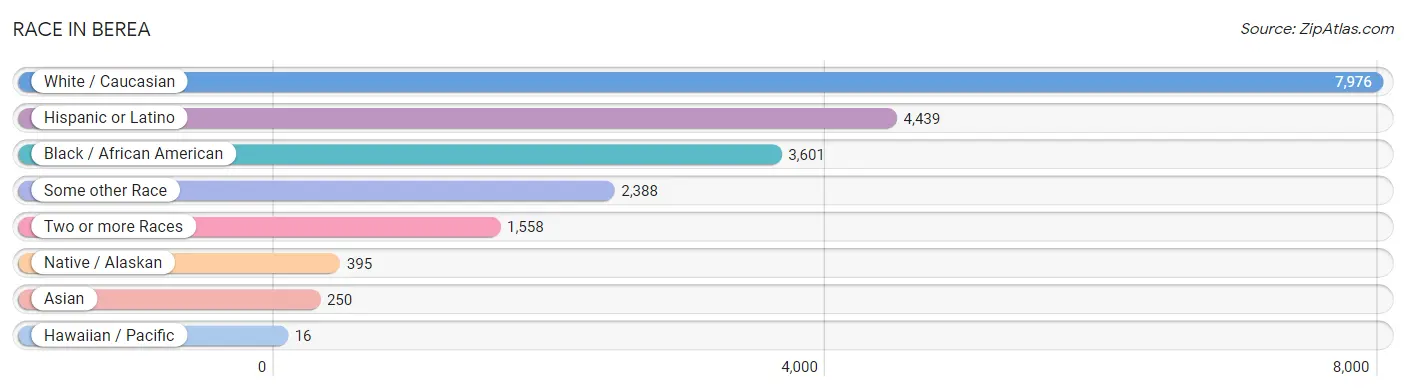
| Race | # Population | % Population |
| Asian | 250 | 1.5% |
| Black / African American | 3,601 | 22.3% |
| Hawaiian / Pacific | 16 | 0.1% |
| Hispanic or Latino | 4,439 | 27.4% |
| Native / Alaskan | 395 | 2.4% |
| White / Caucasian | 7,976 | 49.3% |
| Two or more Races | 1,558 | 9.6% |
| Some other Race | 2,388 | 14.8% |
| Total | 16,184 | 100.0% |
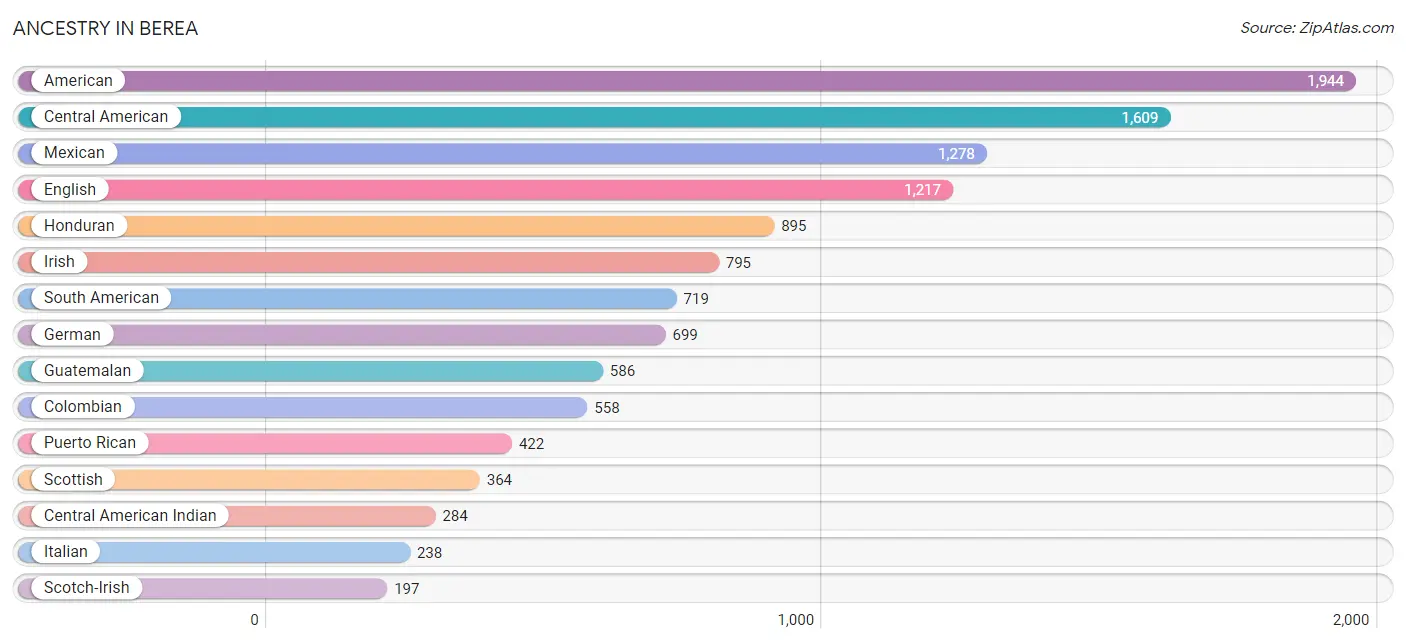
Ancestry in Berea
The most populous ancestries reported in Berea are American (1,944 | 12.0%), Central American (1,609 | 9.9%), Mexican (1,278 | 7.9%), English (1,217 | 7.5%), and Honduran (895 | 5.5%), together accounting for 42.9% of all Berea residents.
| Ancestry | # Population | % Population |
| African | 175 | 1.1% |
| American | 1,944 | 12.0% |
| Arab | 26 | 0.2% |
| British | 54 | 0.3% |
| Central American | 1,609 | 9.9% |
| Central American Indian | 284 | 1.8% |
| Cherokee | 5 | 0.0% |
| Colombian | 558 | 3.5% |
| Costa Rican | 124 | 0.8% |
| Creek | 9 | 0.1% |
| Cuban | 69 | 0.4% |
| Czech | 6 | 0.0% |
| Czechoslovakian | 5 | 0.0% |
| Dutch | 31 | 0.2% |
| Eastern European | 17 | 0.1% |
| Ecuadorian | 65 | 0.4% |
| English | 1,217 | 7.5% |
| European | 132 | 0.8% |
| Finnish | 10 | 0.1% |
| French | 193 | 1.2% |
| French Canadian | 90 | 0.6% |
| German | 699 | 4.3% |
| Guatemalan | 586 | 3.6% |
| Honduran | 895 | 5.5% |
| Hungarian | 28 | 0.2% |
| Iranian | 12 | 0.1% |
| Iraqi | 14 | 0.1% |
| Irish | 795 | 4.9% |
| Italian | 238 | 1.5% |
| Korean | 128 | 0.8% |
| Lebanese | 2 | 0.0% |
| Lithuanian | 12 | 0.1% |
| Mexican | 1,278 | 7.9% |
| Mexican American Indian | 170 | 1.1% |
| Native Hawaiian | 15 | 0.1% |
| Nicaraguan | 4 | 0.0% |
| Nigerian | 9 | 0.1% |
| Northern European | 46 | 0.3% |
| Norwegian | 40 | 0.3% |
| Polish | 112 | 0.7% |
| Puerto Rican | 422 | 2.6% |
| Russian | 188 | 1.2% |
| Scandinavian | 17 | 0.1% |
| Scotch-Irish | 197 | 1.2% |
| Scottish | 364 | 2.2% |
| South American | 719 | 4.4% |
| Spaniard | 20 | 0.1% |
| Sri Lankan | 171 | 1.1% |
| Subsaharan African | 184 | 1.1% |
| Swedish | 62 | 0.4% |
| Thai | 37 | 0.2% |
| Ukrainian | 23 | 0.1% |
| Uruguayan | 96 | 0.6% |
| Welsh | 9 | 0.1% |
| West Indian | 11 | 0.1% | View All 55 Rows |
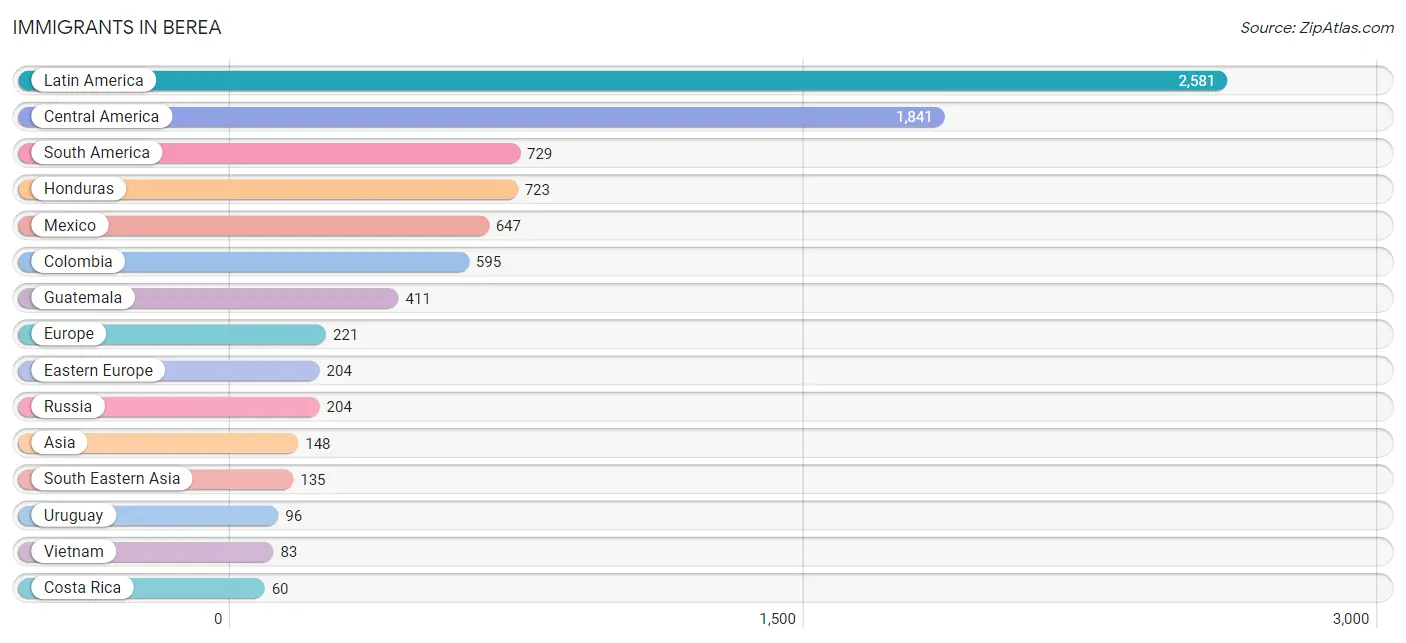
Immigrants in Berea
The most numerous immigrant groups reported in Berea came from Latin America (2,581 | 16.0%), Central America (1,841 | 11.4%), South America (729 | 4.5%), Honduras (723 | 4.5%), and Mexico (647 | 4.0%), together accounting for 40.3% of all Berea residents.
| Immigration Origin | # Population | % Population |
| Africa | 9 | 0.1% |
| Asia | 148 | 0.9% |
| Canada | 24 | 0.2% |
| Caribbean | 11 | 0.1% |
| Central America | 1,841 | 11.4% |
| Colombia | 595 | 3.7% |
| Costa Rica | 60 | 0.4% |
| Eastern Europe | 204 | 1.3% |
| Ecuador | 38 | 0.2% |
| England | 9 | 0.1% |
| Europe | 221 | 1.4% |
| Germany | 8 | 0.1% |
| Guatemala | 411 | 2.5% |
| Honduras | 723 | 4.5% |
| India | 13 | 0.1% |
| Latin America | 2,581 | 16.0% |
| Mexico | 647 | 4.0% |
| Nigeria | 9 | 0.1% |
| Northern Europe | 9 | 0.1% |
| Philippines | 52 | 0.3% |
| Russia | 204 | 1.3% |
| South America | 729 | 4.5% |
| South Central Asia | 13 | 0.1% |
| South Eastern Asia | 135 | 0.8% |
| Trinidad and Tobago | 11 | 0.1% |
| Uruguay | 96 | 0.6% |
| Vietnam | 83 | 0.5% |
| Western Africa | 9 | 0.1% |
| Western Europe | 8 | 0.1% | View All 29 Rows |
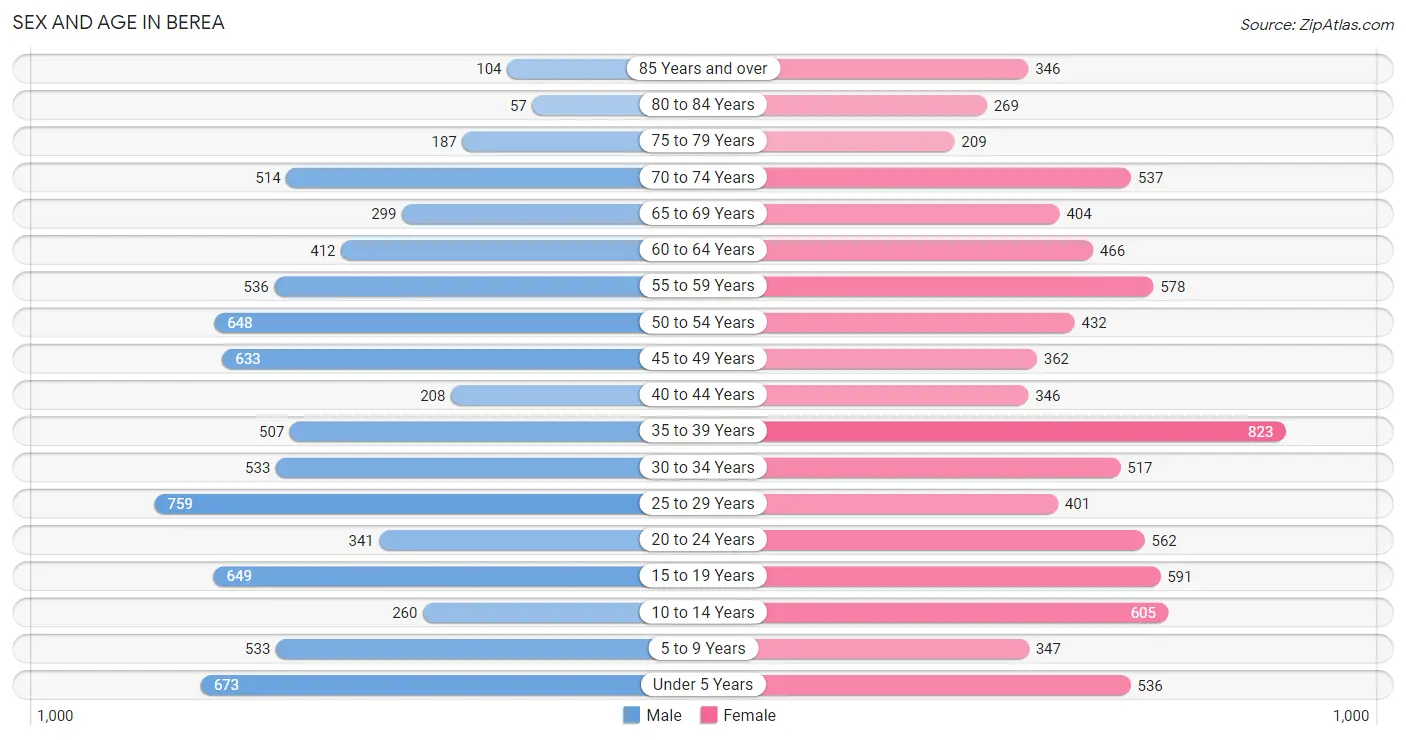
Sex and Age in Berea
Sex and Age in Berea
The most populous age groups in Berea are 25 to 29 Years (759 | 9.7%) for men and 35 to 39 Years (823 | 9.9%) for women.
| Age Bracket | Male | Female |
| Under 5 Years | 673 (8.6%) | 536 (6.4%) |
| 5 to 9 Years | 533 (6.8%) | 347 (4.2%) |
| 10 to 14 Years | 260 (3.3%) | 605 (7.3%) |
| 15 to 19 Years | 649 (8.3%) | 591 (7.1%) |
| 20 to 24 Years | 341 (4.3%) | 562 (6.8%) |
| 25 to 29 Years | 759 (9.7%) | 401 (4.8%) |
| 30 to 34 Years | 533 (6.8%) | 517 (6.2%) |
| 35 to 39 Years | 507 (6.5%) | 823 (9.9%) |
| 40 to 44 Years | 208 (2.6%) | 346 (4.2%) |
| 45 to 49 Years | 633 (8.1%) | 362 (4.3%) |
| 50 to 54 Years | 648 (8.3%) | 432 (5.2%) |
| 55 to 59 Years | 536 (6.8%) | 578 (6.9%) |
| 60 to 64 Years | 412 (5.2%) | 466 (5.6%) |
| 65 to 69 Years | 299 (3.8%) | 404 (4.9%) |
| 70 to 74 Years | 514 (6.6%) | 537 (6.5%) |
| 75 to 79 Years | 187 (2.4%) | 209 (2.5%) |
| 80 to 84 Years | 57 (0.7%) | 269 (3.2%) |
| 85 Years and over | 104 (1.3%) | 346 (4.2%) |
| Total | 7,853 (100.0%) | 8,331 (100.0%) |
Families and Households in Berea
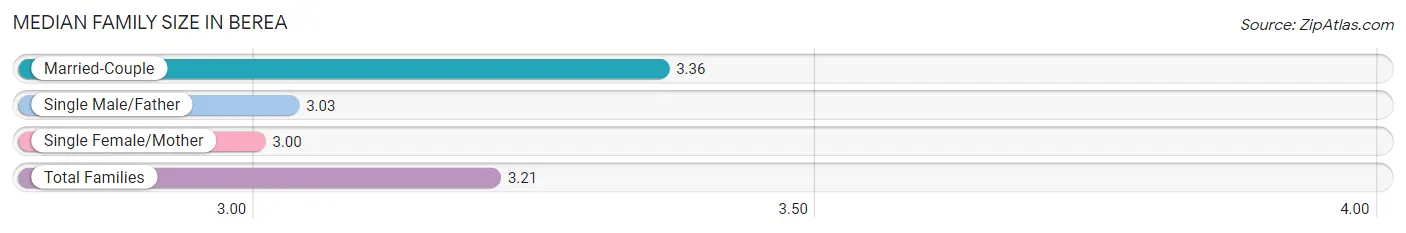
Median Family Size in Berea
The median family size in Berea is 3.21 persons per family, with married-couple families (2,229 | 57.5%) accounting for the largest median family size of 3.36 persons per family. On the other hand, single female/mother families (1,184 | 30.5%) represent the smallest median family size with 3.00 persons per family.
| Family Type | # Families | Family Size |
| Married-Couple | 2,229 (57.5%) | 3.36 |
| Single Male/Father | 465 (12.0%) | 3.03 |
| Single Female/Mother | 1,184 (30.5%) | 3.00 |
| Total Families | 3,878 (100.0%) | 3.21 |
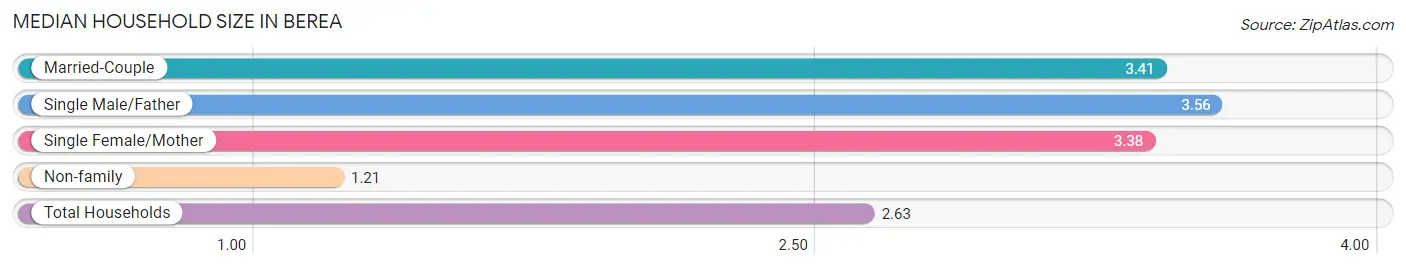
Median Household Size in Berea
The median household size in Berea is 2.63 persons per household, with single male/father households (465 | 7.7%) accounting for the largest median household size of 3.56 persons per household. non-family households (2,170 | 35.9%) represent the smallest median household size with 1.21 persons per household.
| Household Type | # Households | Household Size |
| Married-Couple | 2,229 (36.9%) | 3.41 |
| Single Male/Father | 465 (7.7%) | 3.56 |
| Single Female/Mother | 1,184 (19.6%) | 3.38 |
| Non-family | 2,170 (35.9%) | 1.21 |
| Total Households | 6,048 (100.0%) | 2.63 |
Household Size by Marriage Status in Berea
Out of a total of 6,048 households in Berea, 3,878 (64.1%) are family households, while 2,170 (35.9%) are nonfamily households. The most numerous type of family households are 2-person households, comprising 1,455, and the most common type of nonfamily households are 1-person households, comprising 1,813.
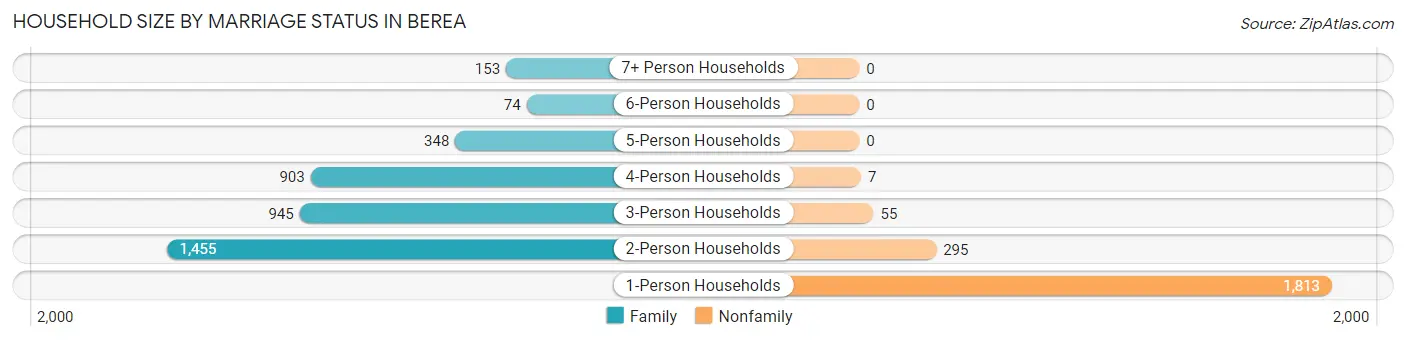
| Household Size | Family Households | Nonfamily Households |
| 1-Person Households | - | 1,813 (30.0%) |
| 2-Person Households | 1,455 (24.1%) | 295 (4.9%) |
| 3-Person Households | 945 (15.6%) | 55 (0.9%) |
| 4-Person Households | 903 (14.9%) | 7 (0.1%) |
| 5-Person Households | 348 (5.8%) | 0 (0.0%) |
| 6-Person Households | 74 (1.2%) | 0 (0.0%) |
| 7+ Person Households | 153 (2.5%) | 0 (0.0%) |
| Total | 3,878 (64.1%) | 2,170 (35.9%) |
Female Fertility in Berea
Fertility by Age in Berea
Average fertility rate in Berea is 61.0 births per 1,000 women. Women in the age bracket of 20 to 34 years have the highest fertility rate with 136.0 births per 1,000 women. Women in the age bracket of 20 to 34 years acount for 91.4% of all women with births.
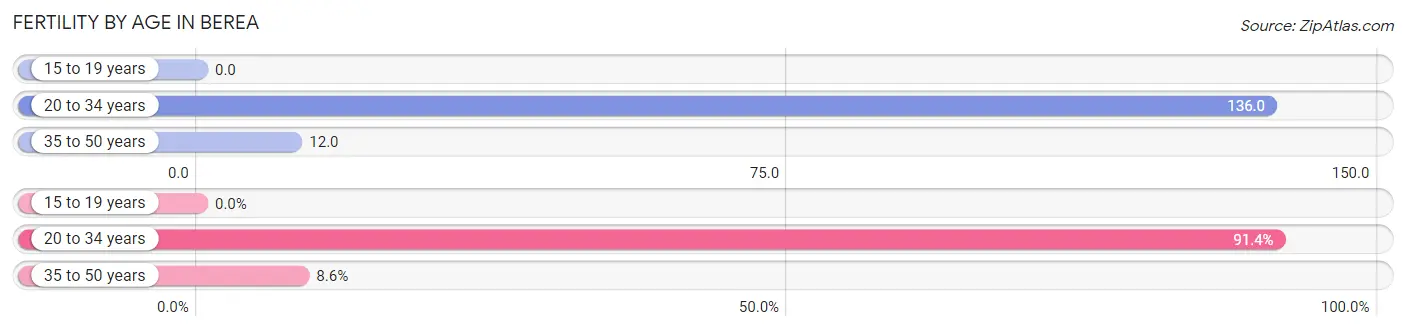
| Age Bracket | Women with Births | Births / 1,000 Women |
| 15 to 19 years | 0 (0.0%) | 0.0 |
| 20 to 34 years | 202 (91.4%) | 136.0 |
| 35 to 50 years | 19 (8.6%) | 12.0 |
| Total | 221 (100.0%) | 61.0 |
Fertility by Age by Marriage Status in Berea
59.7% of women with births (221) in Berea are married. The highest percentage of unmarried women with births falls into 20 to 34 years age bracket with 44.1% of them unmarried at the time of birth, while the lowest percentage of unmarried women with births belong to 35 to 50 years age bracket with 0.0% of them unmarried.
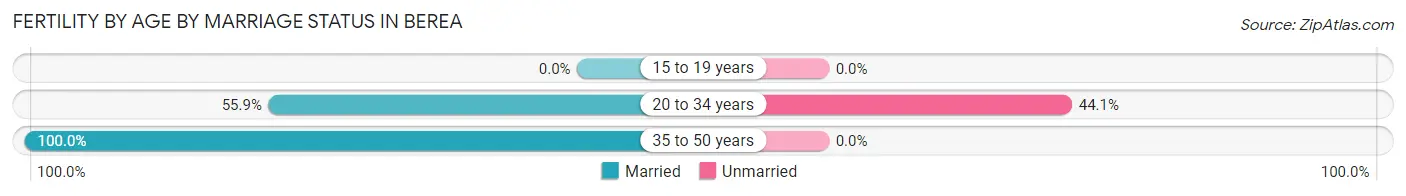
| Age Bracket | Married | Unmarried |
| 15 to 19 years | 0 (0.0%) | 0 (0.0%) |
| 20 to 34 years | 113 (55.9%) | 89 (44.1%) |
| 35 to 50 years | 19 (100.0%) | 0 (0.0%) |
| Total | 132 (59.7%) | 89 (40.3%) |
Fertility by Education in Berea
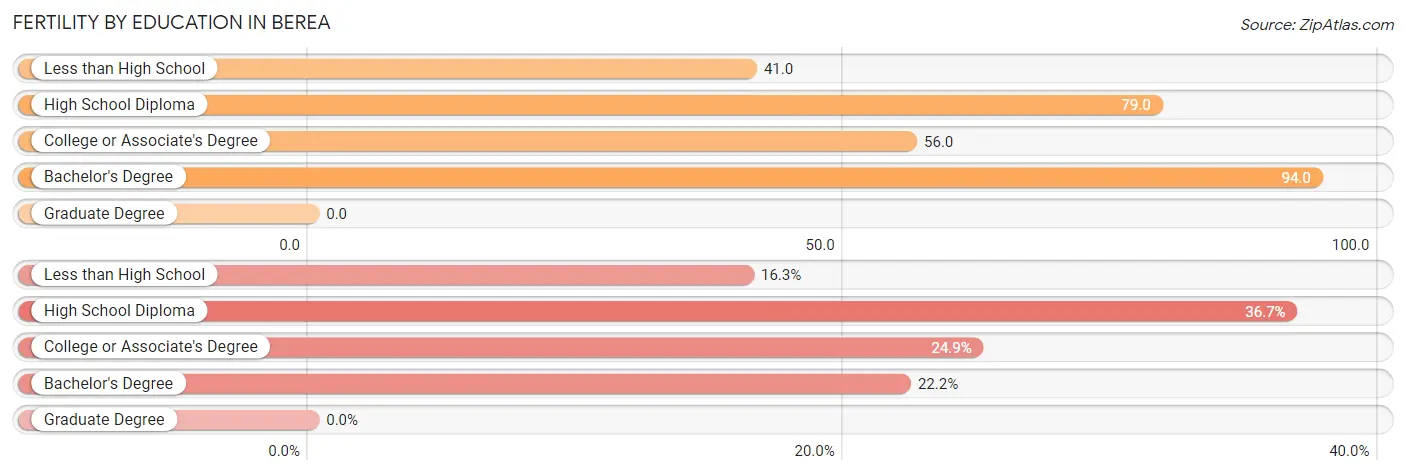
| Educational Attainment | Women with Births | Births / 1,000 Women |
| Less than High School | 36 (16.3%) | 41.0 |
| High School Diploma | 81 (36.6%) | 79.0 |
| College or Associate's Degree | 55 (24.9%) | 56.0 |
| Bachelor's Degree | 49 (22.2%) | 94.0 |
| Graduate Degree | 0 (0.0%) | 0.0 |
| Total | 221 (100.0%) | 61.0 |
Fertility by Education by Marriage Status in Berea
40.3% of women with births in Berea are unmarried. Women with the educational attainment of less than high school are most likely to be married with 100.0% of them married at childbirth, while women with the educational attainment of college or associate's degree are least likely to be married with 65.4% of them unmarried at childbirth.
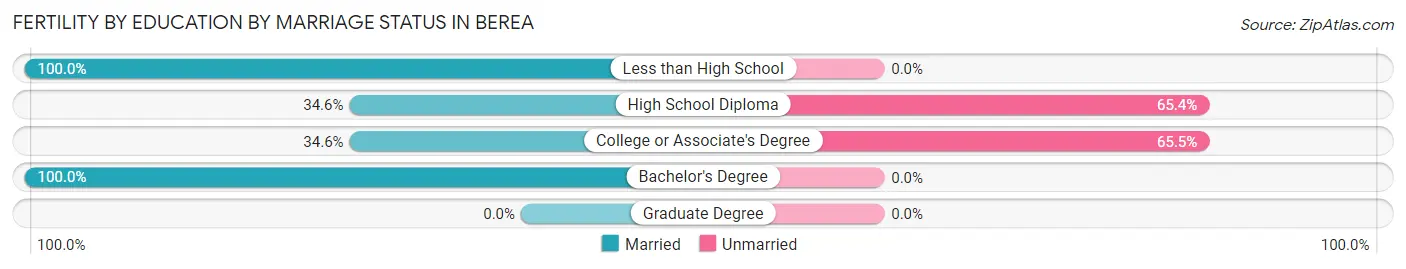
| Educational Attainment | Married | Unmarried |
| Less than High School | 36 (100.0%) | 0 (0.0%) |
| High School Diploma | 28 (34.6%) | 53 (65.4%) |
| College or Associate's Degree | 19 (34.5%) | 36 (65.4%) |
| Bachelor's Degree | 49 (100.0%) | 0 (0.0%) |
| Graduate Degree | 0 (0.0%) | 0 (0.0%) |
| Total | 132 (59.7%) | 89 (40.3%) |
Employment Characteristics in Berea
Employment by Class of Employer in Berea
Among the 7,273 employed individuals in Berea, private company employees (5,451 | 75.0%), not-for-profit organizations (607 | 8.4%), and self-employed (not incorporated) (295 | 4.1%) make up the most common classes of employment.
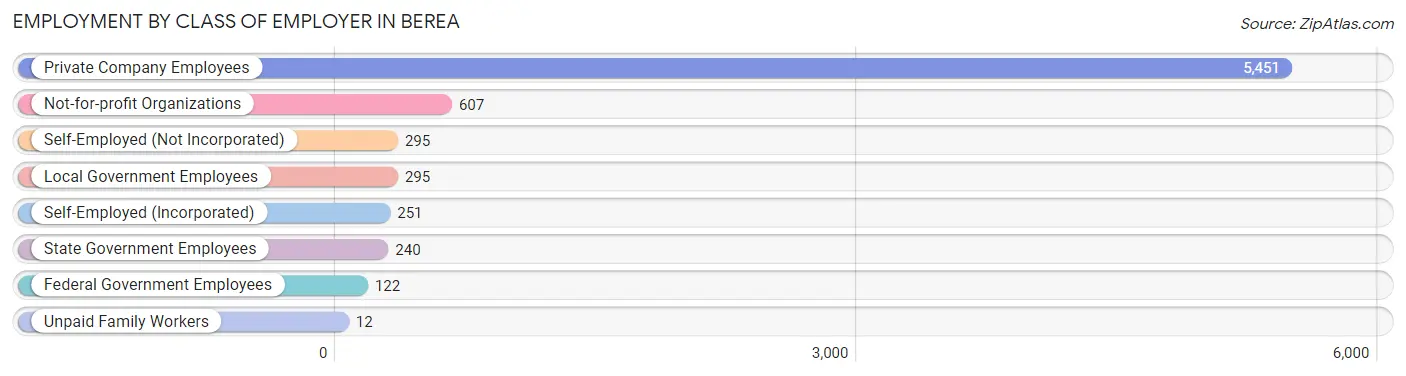
| Employer Class | # Employees | % Employees |
| Private Company Employees | 5,451 | 75.0% |
| Self-Employed (Incorporated) | 251 | 3.5% |
| Self-Employed (Not Incorporated) | 295 | 4.1% |
| Not-for-profit Organizations | 607 | 8.4% |
| Local Government Employees | 295 | 4.1% |
| State Government Employees | 240 | 3.3% |
| Federal Government Employees | 122 | 1.7% |
| Unpaid Family Workers | 12 | 0.2% |
| Total | 7,273 | 100.0% |
Employment Status by Age in Berea
According to the labor force statistics for Berea, out of the total population over 16 years of age (13,147), 60.2% or 7,914 individuals are in the labor force, with 6.9% or 546 of them unemployed. The age group with the highest labor force participation rate is 30 to 34 years, with 89.2% or 937 individuals in the labor force. Within the labor force, the 16 to 19 years age range has the highest percentage of unemployed individuals, with 35.3% or 207 of them being unemployed.
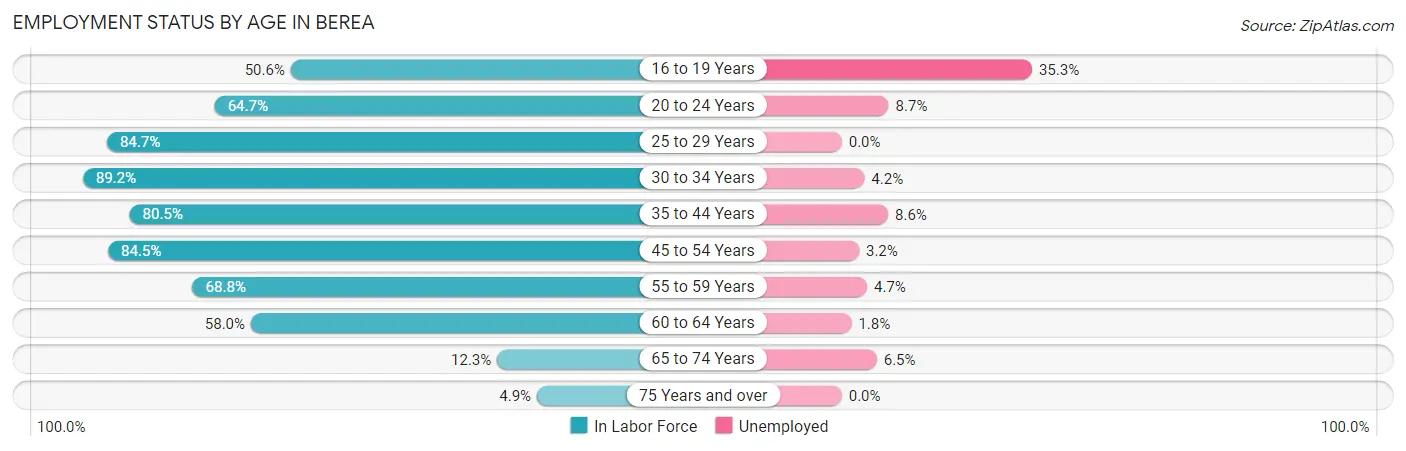
| Age Bracket | In Labor Force | Unemployed |
| 16 to 19 Years | 585 (50.6%) | 207 (35.3%) |
| 20 to 24 Years | 584 (64.7%) | 51 (8.7%) |
| 25 to 29 Years | 983 (84.7%) | 0 (0.0%) |
| 30 to 34 Years | 937 (89.2%) | 39 (4.2%) |
| 35 to 44 Years | 1,517 (80.5%) | 130 (8.6%) |
| 45 to 54 Years | 1,753 (84.5%) | 56 (3.2%) |
| 55 to 59 Years | 766 (68.8%) | 36 (4.7%) |
| 60 to 64 Years | 509 (58.0%) | 9 (1.8%) |
| 65 to 74 Years | 216 (12.3%) | 14 (6.5%) |
| 75 Years and over | 57 (4.9%) | 0 (0.0%) |
| Total | 7,914 (60.2%) | 546 (6.9%) |
Employment Status by Educational Attainment in Berea
According to labor force statistics for Berea, 79.2% of individuals (6,464) out of the total population between 25 and 64 years of age (8,161) are in the labor force, with 4.2% or 271 of them being unemployed. The group with the highest labor force participation rate are those with the educational attainment of college / associate degree, with 86.3% or 2,169 individuals in the labor force. Within the labor force, individuals with high school diploma education have the highest percentage of unemployment, with 6.4% or 119 of them being unemployed.
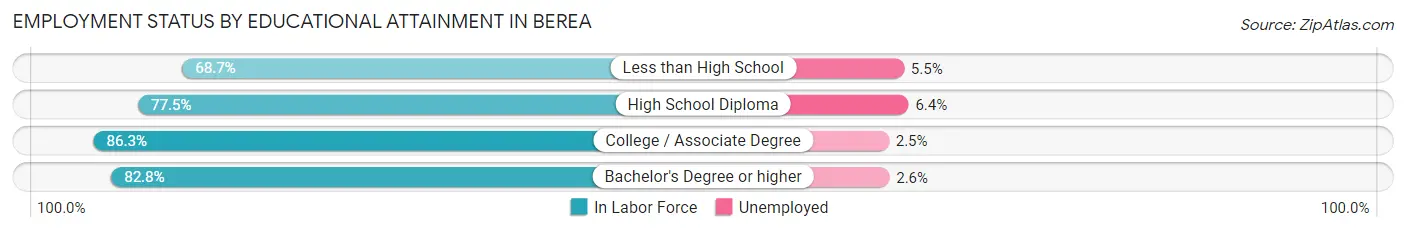
| Educational Attainment | In Labor Force | Unemployed |
| Less than High School | 1,222 (68.7%) | 98 (5.5%) |
| High School Diploma | 1,865 (77.5%) | 154 (6.4%) |
| College / Associate Degree | 2,169 (86.3%) | 63 (2.5%) |
| Bachelor's Degree or higher | 1,211 (82.8%) | 38 (2.6%) |
| Total | 6,464 (79.2%) | 343 (4.2%) |
Employment Occupations by Sex in Berea
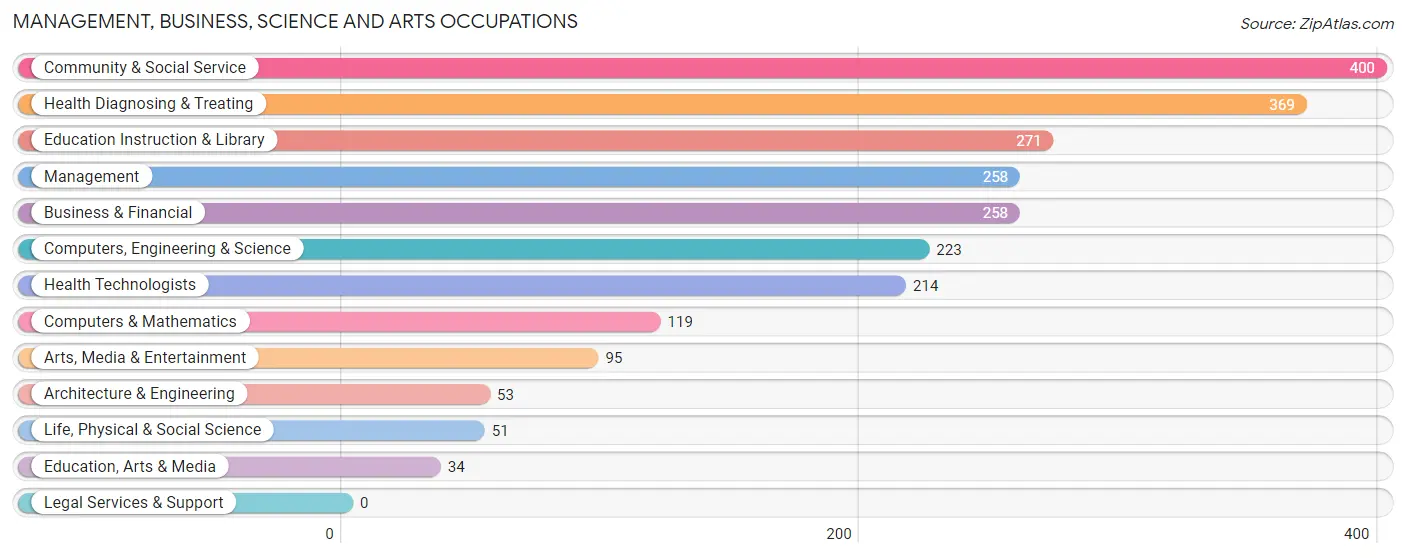
Management, Business, Science and Arts Occupations
The most common Management, Business, Science and Arts occupations in Berea are Community & Social Service (400 | 5.4%), Health Diagnosing & Treating (369 | 5.0%), Education Instruction & Library (271 | 3.7%), Management (258 | 3.5%), and Business & Financial (258 | 3.5%).
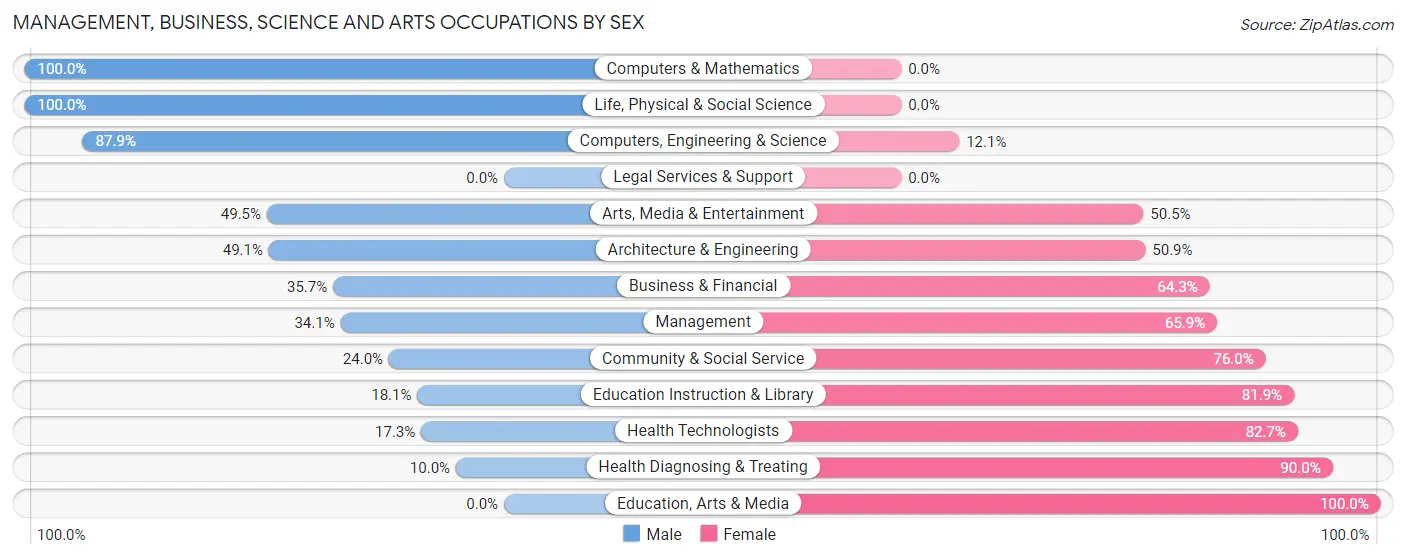
Management, Business, Science and Arts Occupations by Sex
Within the Management, Business, Science and Arts occupations in Berea, the most male-oriented occupations are Computers & Mathematics (100.0%), Life, Physical & Social Science (100.0%), and Computers, Engineering & Science (87.9%), while the most female-oriented occupations are Education, Arts & Media (100.0%), Health Diagnosing & Treating (90.0%), and Health Technologists (82.7%).
| Occupation | Male | Female |
| Management | 88 (34.1%) | 170 (65.9%) |
| Business & Financial | 92 (35.7%) | 166 (64.3%) |
| Computers, Engineering & Science | 196 (87.9%) | 27 (12.1%) |
| Computers & Mathematics | 119 (100.0%) | 0 (0.0%) |
| Architecture & Engineering | 26 (49.1%) | 27 (50.9%) |
| Life, Physical & Social Science | 51 (100.0%) | 0 (0.0%) |
| Community & Social Service | 96 (24.0%) | 304 (76.0%) |
| Education, Arts & Media | 0 (0.0%) | 34 (100.0%) |
| Legal Services & Support | 0 (0.0%) | 0 (0.0%) |
| Education Instruction & Library | 49 (18.1%) | 222 (81.9%) |
| Arts, Media & Entertainment | 47 (49.5%) | 48 (50.5%) |
| Health Diagnosing & Treating | 37 (10.0%) | 332 (90.0%) |
| Health Technologists | 37 (17.3%) | 177 (82.7%) |
| Total (Category) | 509 (33.8%) | 999 (66.2%) |
| Total (Overall) | 3,853 (52.3%) | 3,513 (47.7%) |
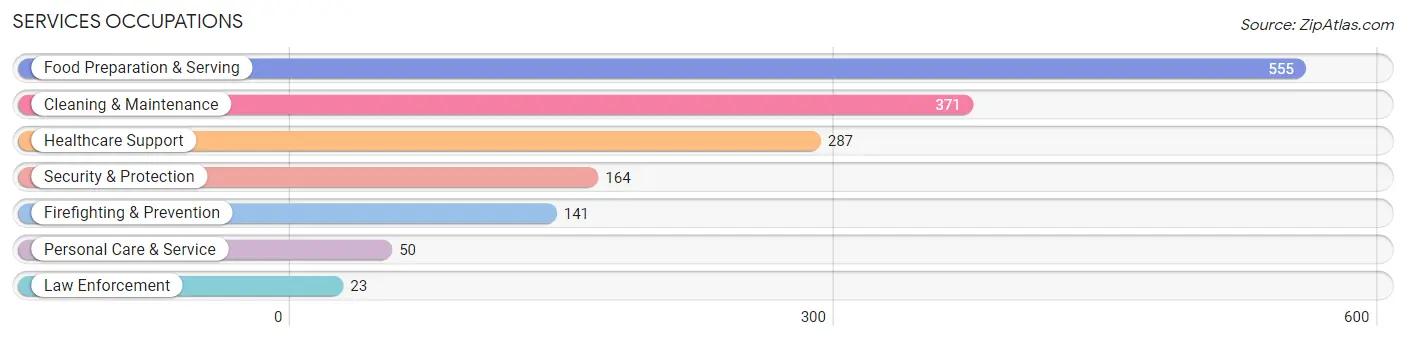
Services Occupations
The most common Services occupations in Berea are Food Preparation & Serving (555 | 7.5%), Cleaning & Maintenance (371 | 5.0%), Healthcare Support (287 | 3.9%), Security & Protection (164 | 2.2%), and Firefighting & Prevention (141 | 1.9%).
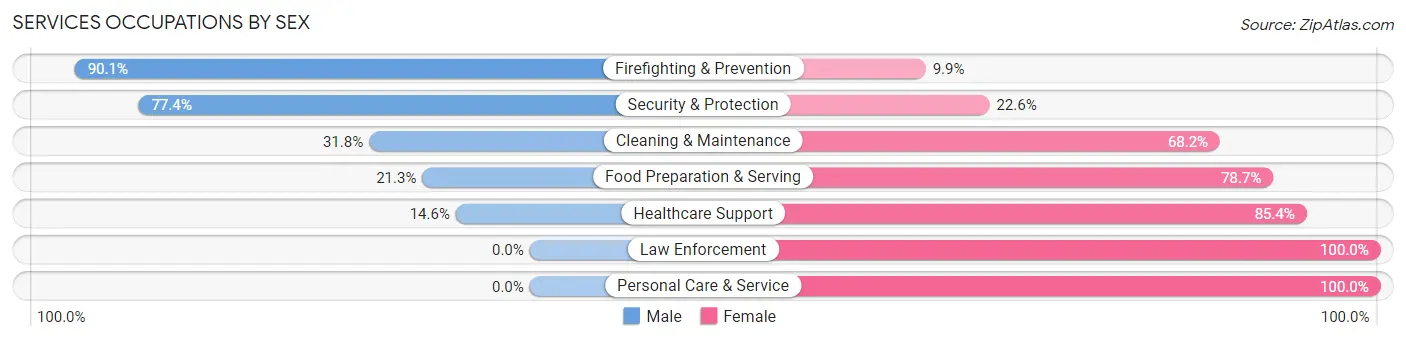
Services Occupations by Sex
Within the Services occupations in Berea, the most male-oriented occupations are Firefighting & Prevention (90.1%), Security & Protection (77.4%), and Cleaning & Maintenance (31.8%), while the most female-oriented occupations are Law Enforcement (100.0%), Personal Care & Service (100.0%), and Healthcare Support (85.4%).
| Occupation | Male | Female |
| Healthcare Support | 42 (14.6%) | 245 (85.4%) |
| Security & Protection | 127 (77.4%) | 37 (22.6%) |
| Firefighting & Prevention | 127 (90.1%) | 14 (9.9%) |
| Law Enforcement | 0 (0.0%) | 23 (100.0%) |
| Food Preparation & Serving | 118 (21.3%) | 437 (78.7%) |
| Cleaning & Maintenance | 118 (31.8%) | 253 (68.2%) |
| Personal Care & Service | 0 (0.0%) | 50 (100.0%) |
| Total (Category) | 405 (28.4%) | 1,022 (71.6%) |
| Total (Overall) | 3,853 (52.3%) | 3,513 (47.7%) |
Sales and Office Occupations
The most common Sales and Office occupations in Berea are Sales & Related (670 | 9.1%), and Office & Administration (654 | 8.9%).
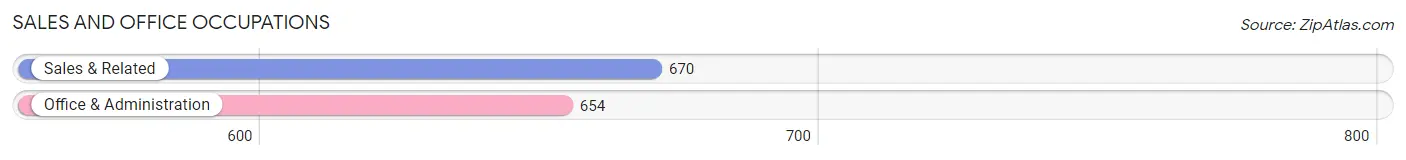
Sales and Office Occupations by Sex
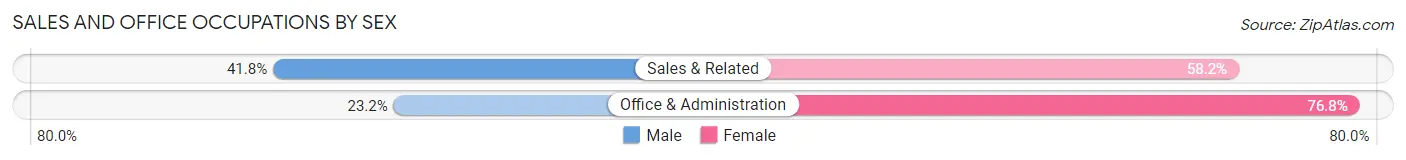
| Occupation | Male | Female |
| Sales & Related | 280 (41.8%) | 390 (58.2%) |
| Office & Administration | 152 (23.2%) | 502 (76.8%) |
| Total (Category) | 432 (32.6%) | 892 (67.4%) |
| Total (Overall) | 3,853 (52.3%) | 3,513 (47.7%) |
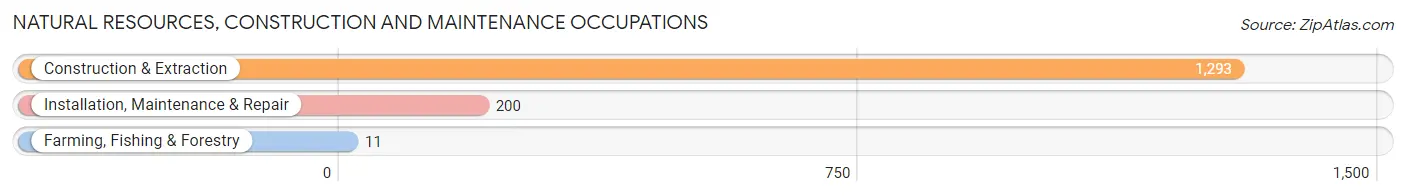
Natural Resources, Construction and Maintenance Occupations
The most common Natural Resources, Construction and Maintenance occupations in Berea are Construction & Extraction (1,293 | 17.5%), Installation, Maintenance & Repair (200 | 2.7%), and Farming, Fishing & Forestry (11 | 0.2%).
Natural Resources, Construction and Maintenance Occupations by Sex
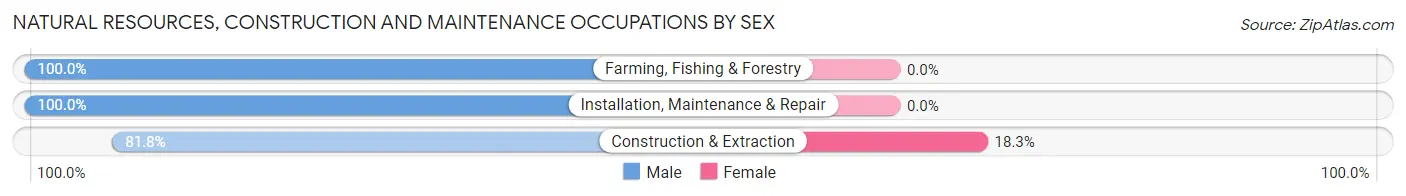
| Occupation | Male | Female |
| Farming, Fishing & Forestry | 11 (100.0%) | 0 (0.0%) |
| Construction & Extraction | 1,057 (81.8%) | 236 (18.2%) |
| Installation, Maintenance & Repair | 200 (100.0%) | 0 (0.0%) |
| Total (Category) | 1,268 (84.3%) | 236 (15.7%) |
| Total (Overall) | 3,853 (52.3%) | 3,513 (47.7%) |
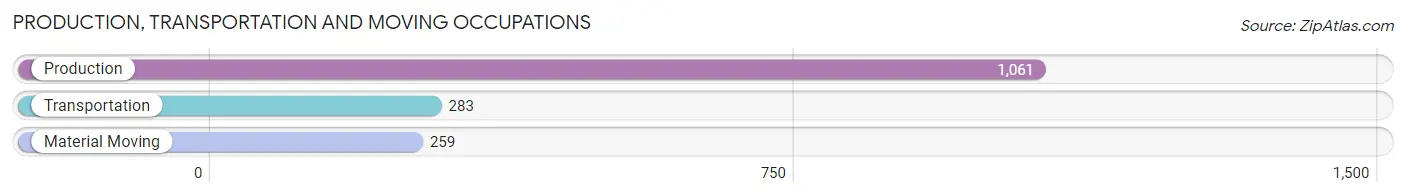
Production, Transportation and Moving Occupations
The most common Production, Transportation and Moving occupations in Berea are Production (1,061 | 14.4%), Transportation (283 | 3.8%), and Material Moving (259 | 3.5%).
Production, Transportation and Moving Occupations by Sex
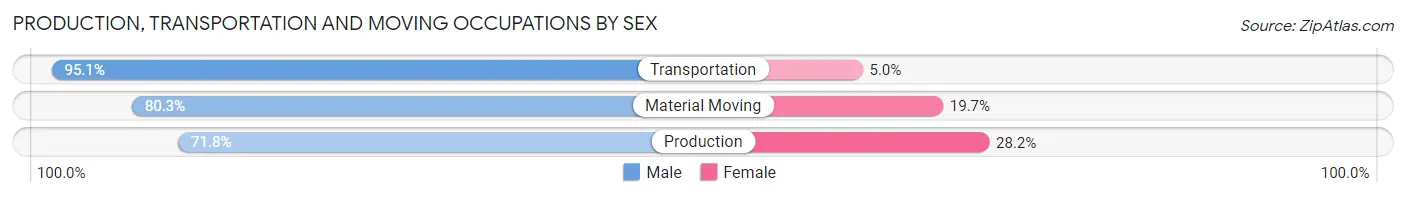
| Occupation | Male | Female |
| Production | 762 (71.8%) | 299 (28.2%) |
| Transportation | 269 (95.1%) | 14 (5.0%) |
| Material Moving | 208 (80.3%) | 51 (19.7%) |
| Total (Category) | 1,239 (77.3%) | 364 (22.7%) |
| Total (Overall) | 3,853 (52.3%) | 3,513 (47.7%) |
Employment Industries by Sex in Berea
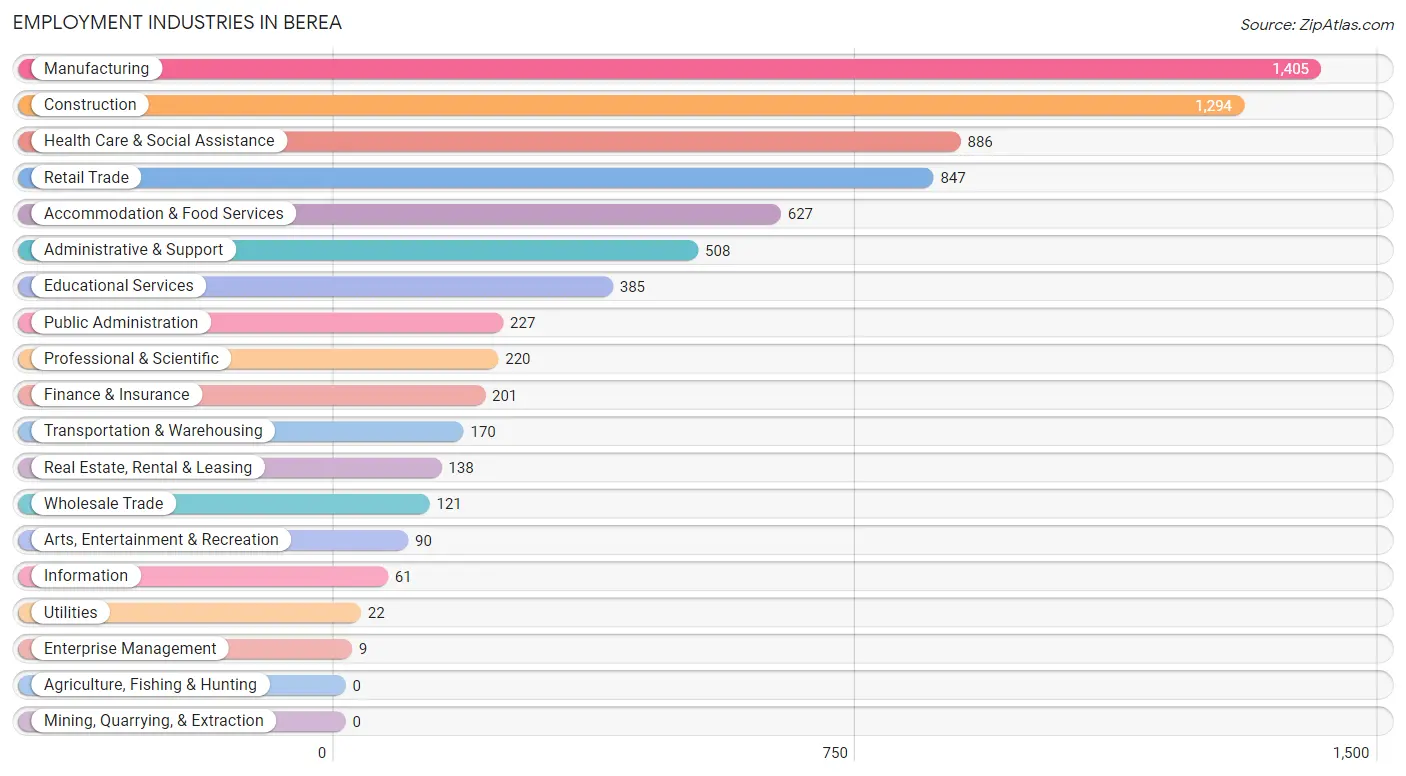
Employment Industries in Berea
The major employment industries in Berea include Manufacturing (1,405 | 19.1%), Construction (1,294 | 17.6%), Health Care & Social Assistance (886 | 12.0%), Retail Trade (847 | 11.5%), and Accommodation & Food Services (627 | 8.5%).
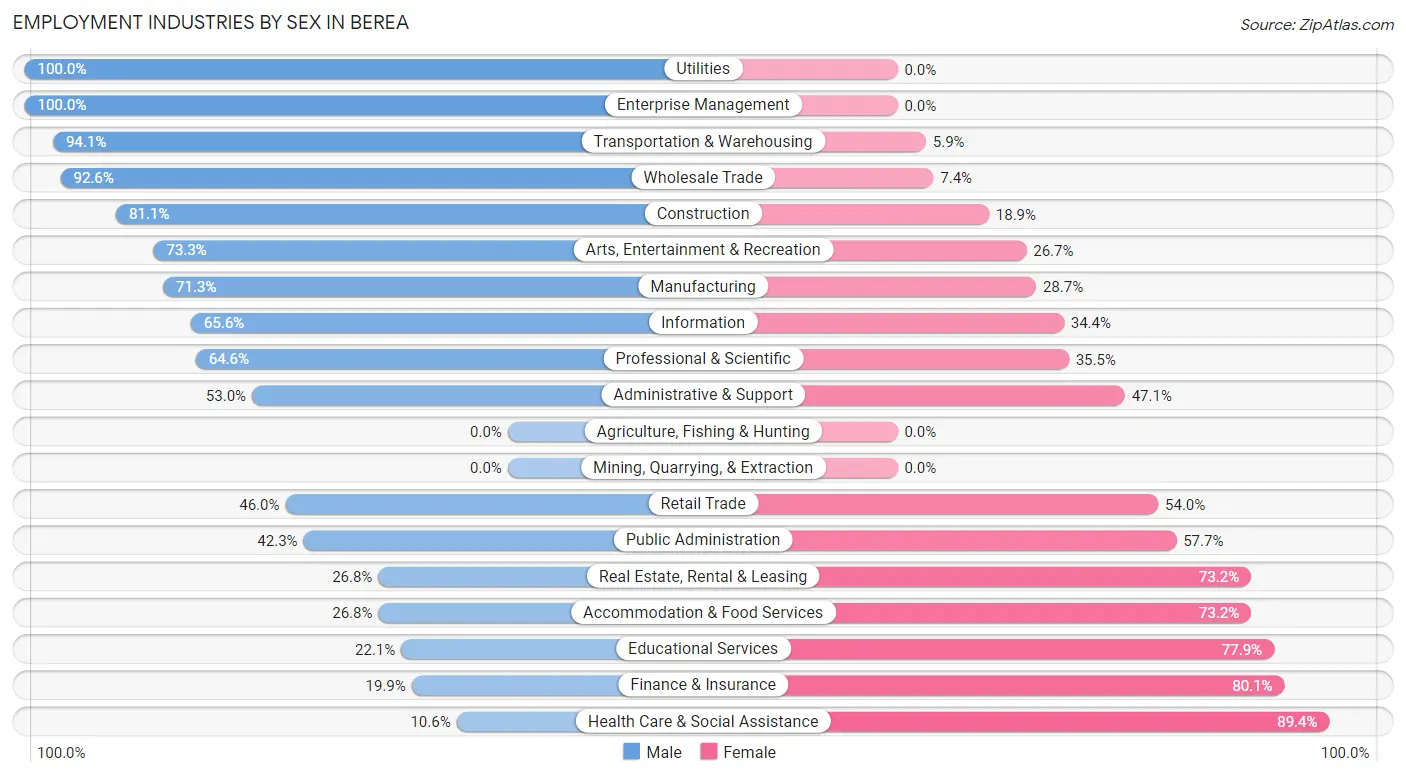
Employment Industries by Sex in Berea
The Berea industries that see more men than women are Utilities (100.0%), Enterprise Management (100.0%), and Transportation & Warehousing (94.1%), whereas the industries that tend to have a higher number of women are Health Care & Social Assistance (89.4%), Finance & Insurance (80.1%), and Educational Services (77.9%).
| Industry | Male | Female |
| Agriculture, Fishing & Hunting | 0 (0.0%) | 0 (0.0%) |
| Mining, Quarrying, & Extraction | 0 (0.0%) | 0 (0.0%) |
| Construction | 1,049 (81.1%) | 245 (18.9%) |
| Manufacturing | 1,002 (71.3%) | 403 (28.7%) |
| Wholesale Trade | 112 (92.6%) | 9 (7.4%) |
| Retail Trade | 390 (46.0%) | 457 (54.0%) |
| Transportation & Warehousing | 160 (94.1%) | 10 (5.9%) |
| Utilities | 22 (100.0%) | 0 (0.0%) |
| Information | 40 (65.6%) | 21 (34.4%) |
| Finance & Insurance | 40 (19.9%) | 161 (80.1%) |
| Real Estate, Rental & Leasing | 37 (26.8%) | 101 (73.2%) |
| Professional & Scientific | 142 (64.5%) | 78 (35.4%) |
| Enterprise Management | 9 (100.0%) | 0 (0.0%) |
| Administrative & Support | 269 (52.9%) | 239 (47.0%) |
| Educational Services | 85 (22.1%) | 300 (77.9%) |
| Health Care & Social Assistance | 94 (10.6%) | 792 (89.4%) |
| Arts, Entertainment & Recreation | 66 (73.3%) | 24 (26.7%) |
| Accommodation & Food Services | 168 (26.8%) | 459 (73.2%) |
| Public Administration | 96 (42.3%) | 131 (57.7%) |
| Total | 3,853 (52.3%) | 3,513 (47.7%) |
Education in Berea
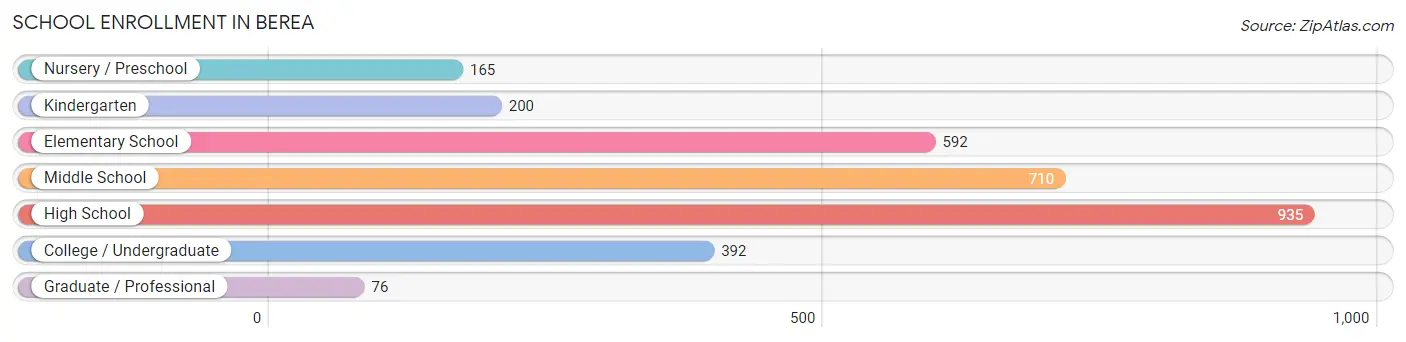
School Enrollment in Berea
The most common levels of schooling among the 3,070 students in Berea are high school (935 | 30.5%), middle school (710 | 23.1%), and elementary school (592 | 19.3%).
| School Level | # Students | % Students |
| Nursery / Preschool | 165 | 5.4% |
| Kindergarten | 200 | 6.5% |
| Elementary School | 592 | 19.3% |
| Middle School | 710 | 23.1% |
| High School | 935 | 30.5% |
| College / Undergraduate | 392 | 12.8% |
| Graduate / Professional | 76 | 2.5% |
| Total | 3,070 | 100.0% |
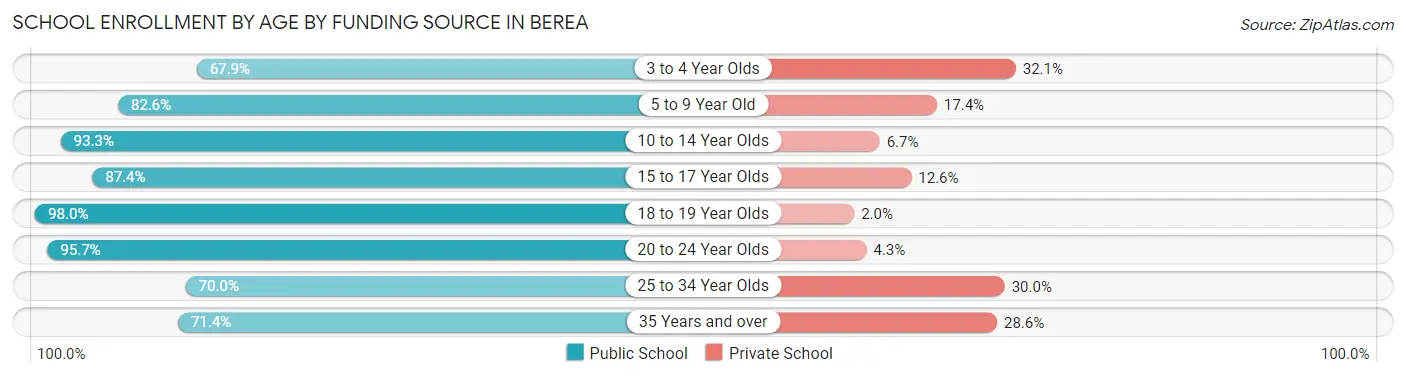
School Enrollment by Age by Funding Source in Berea
Out of a total of 3,070 students who are enrolled in schools in Berea, 393 (12.8%) attend a private institution, while the remaining 2,677 (87.2%) are enrolled in public schools. The age group of 3 to 4 year olds has the highest likelihood of being enrolled in private schools, with 42 (32.1% in the age bracket) enrolled. Conversely, the age group of 18 to 19 year olds has the lowest likelihood of being enrolled in a private school, with 399 (98.0% in the age bracket) attending a public institution.
| Age Bracket | Public School | Private School |
| 3 to 4 Year Olds | 89 (67.9%) | 42 (32.1%) |
| 5 to 9 Year Old | 661 (82.6%) | 139 (17.4%) |
| 10 to 14 Year Olds | 778 (93.3%) | 56 (6.7%) |
| 15 to 17 Year Olds | 409 (87.4%) | 59 (12.6%) |
| 18 to 19 Year Olds | 399 (98.0%) | 8 (2.0%) |
| 20 to 24 Year Olds | 135 (95.7%) | 6 (4.3%) |
| 25 to 34 Year Olds | 70 (70.0%) | 30 (30.0%) |
| 35 Years and over | 135 (71.4%) | 54 (28.6%) |
| Total | 2,677 (87.2%) | 393 (12.8%) |
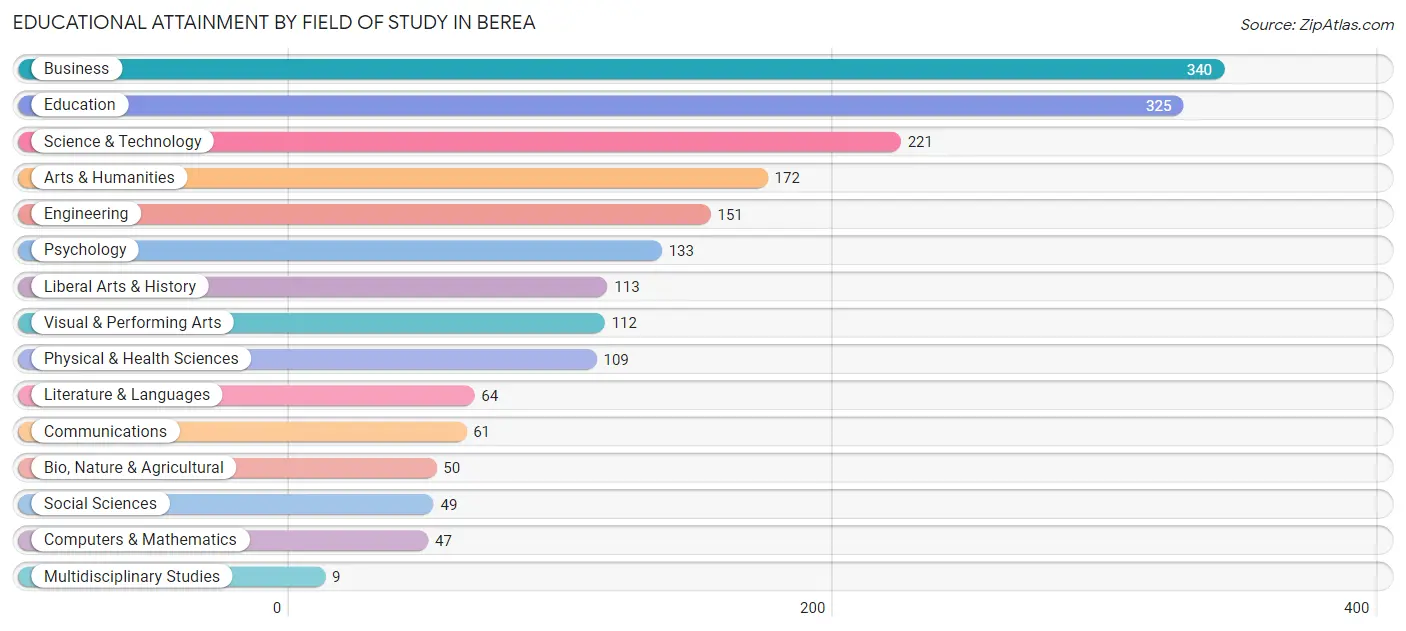
Educational Attainment by Field of Study in Berea
Business (340 | 17.4%), education (325 | 16.6%), science & technology (221 | 11.3%), arts & humanities (172 | 8.8%), and engineering (151 | 7.7%) are the most common fields of study among 1,956 individuals in Berea who have obtained a bachelor's degree or higher.
| Field of Study | # Graduates | % Graduates |
| Computers & Mathematics | 47 | 2.4% |
| Bio, Nature & Agricultural | 50 | 2.6% |
| Physical & Health Sciences | 109 | 5.6% |
| Psychology | 133 | 6.8% |
| Social Sciences | 49 | 2.5% |
| Engineering | 151 | 7.7% |
| Multidisciplinary Studies | 9 | 0.5% |
| Science & Technology | 221 | 11.3% |
| Business | 340 | 17.4% |
| Education | 325 | 16.6% |
| Literature & Languages | 64 | 3.3% |
| Liberal Arts & History | 113 | 5.8% |
| Visual & Performing Arts | 112 | 5.7% |
| Communications | 61 | 3.1% |
| Arts & Humanities | 172 | 8.8% |
| Total | 1,956 | 100.0% |
Transportation & Commute in Berea
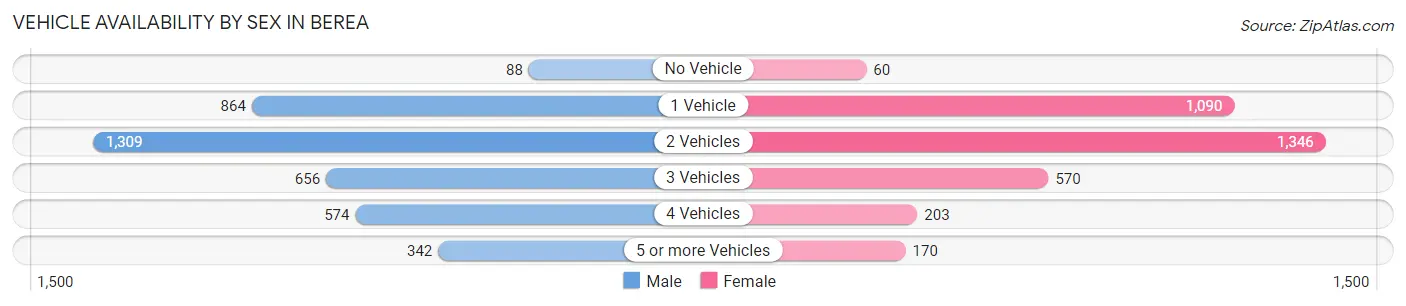
Vehicle Availability by Sex in Berea
The most prevalent vehicle ownership categories in Berea are males with 2 vehicles (1,309, accounting for 34.2%) and females with 2 vehicles (1,346, making up 38.1%).
| Vehicles Available | Male | Female |
| No Vehicle | 88 (2.3%) | 60 (1.7%) |
| 1 Vehicle | 864 (22.5%) | 1,090 (31.7%) |
| 2 Vehicles | 1,309 (34.2%) | 1,346 (39.1%) |
| 3 Vehicles | 656 (17.1%) | 570 (16.6%) |
| 4 Vehicles | 574 (15.0%) | 203 (5.9%) |
| 5 or more Vehicles | 342 (8.9%) | 170 (4.9%) |
| Total | 3,833 (100.0%) | 3,439 (100.0%) |
Commute Time in Berea
The most frequently occuring commute durations in Berea are 30 to 34 minutes (1,504 commuters, 21.4%), 20 to 24 minutes (1,324 commuters, 18.8%), and 15 to 19 minutes (936 commuters, 13.3%).
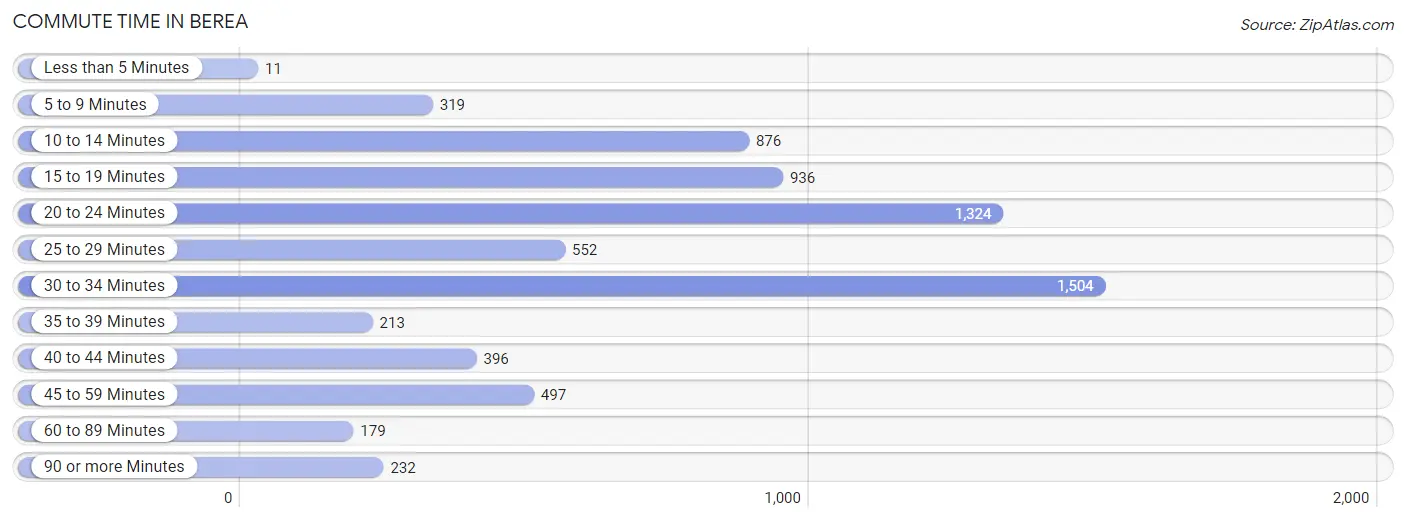
| Commute Time | # Commuters | % Commuters |
| Less than 5 Minutes | 11 | 0.2% |
| 5 to 9 Minutes | 319 | 4.5% |
| 10 to 14 Minutes | 876 | 12.4% |
| 15 to 19 Minutes | 936 | 13.3% |
| 20 to 24 Minutes | 1,324 | 18.8% |
| 25 to 29 Minutes | 552 | 7.8% |
| 30 to 34 Minutes | 1,504 | 21.4% |
| 35 to 39 Minutes | 213 | 3.0% |
| 40 to 44 Minutes | 396 | 5.6% |
| 45 to 59 Minutes | 497 | 7.1% |
| 60 to 89 Minutes | 179 | 2.5% |
| 90 or more Minutes | 232 | 3.3% |
Commute Time by Sex in Berea
The most common commute times in Berea are 30 to 34 minutes (810 commuters, 21.5%) for males and 30 to 34 minutes (694 commuters, 21.2%) for females.
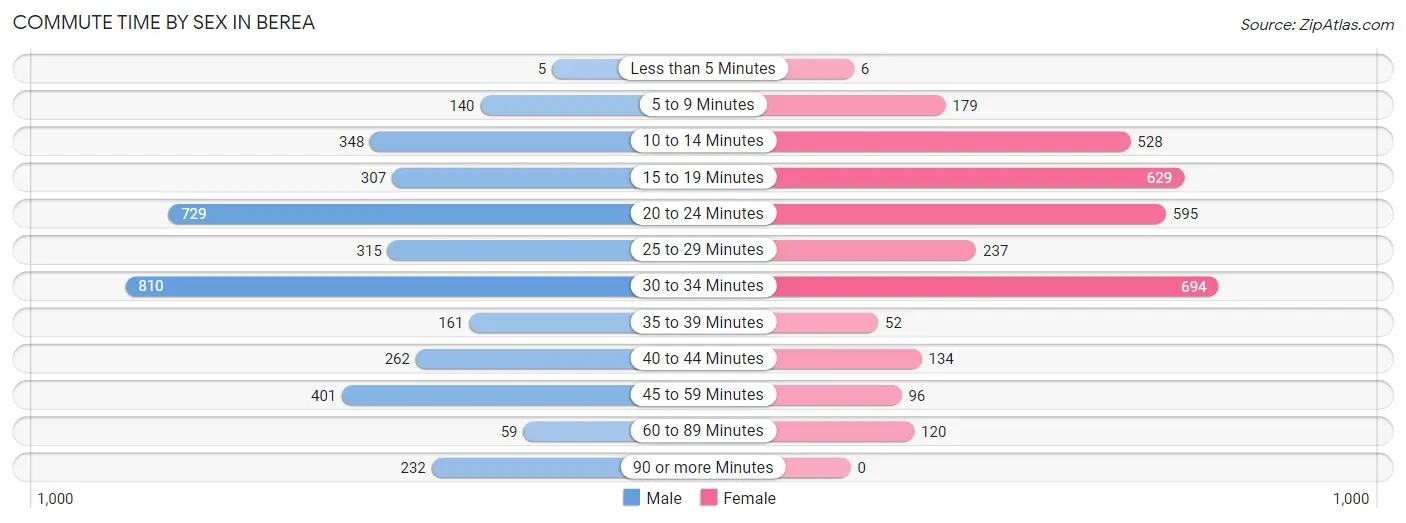
| Commute Time | Male | Female |
| Less than 5 Minutes | 5 (0.1%) | 6 (0.2%) |
| 5 to 9 Minutes | 140 (3.7%) | 179 (5.5%) |
| 10 to 14 Minutes | 348 (9.2%) | 528 (16.2%) |
| 15 to 19 Minutes | 307 (8.2%) | 629 (19.2%) |
| 20 to 24 Minutes | 729 (19.3%) | 595 (18.2%) |
| 25 to 29 Minutes | 315 (8.4%) | 237 (7.2%) |
| 30 to 34 Minutes | 810 (21.5%) | 694 (21.2%) |
| 35 to 39 Minutes | 161 (4.3%) | 52 (1.6%) |
| 40 to 44 Minutes | 262 (7.0%) | 134 (4.1%) |
| 45 to 59 Minutes | 401 (10.6%) | 96 (2.9%) |
| 60 to 89 Minutes | 59 (1.6%) | 120 (3.7%) |
| 90 or more Minutes | 232 (6.2%) | 0 (0.0%) |
Time of Departure to Work by Sex in Berea
The most frequent times of departure to work in Berea are 7:00 AM to 7:29 AM (703, 18.6%) for males and 4:00 PM to 11:59 PM (558, 17.1%) for females.
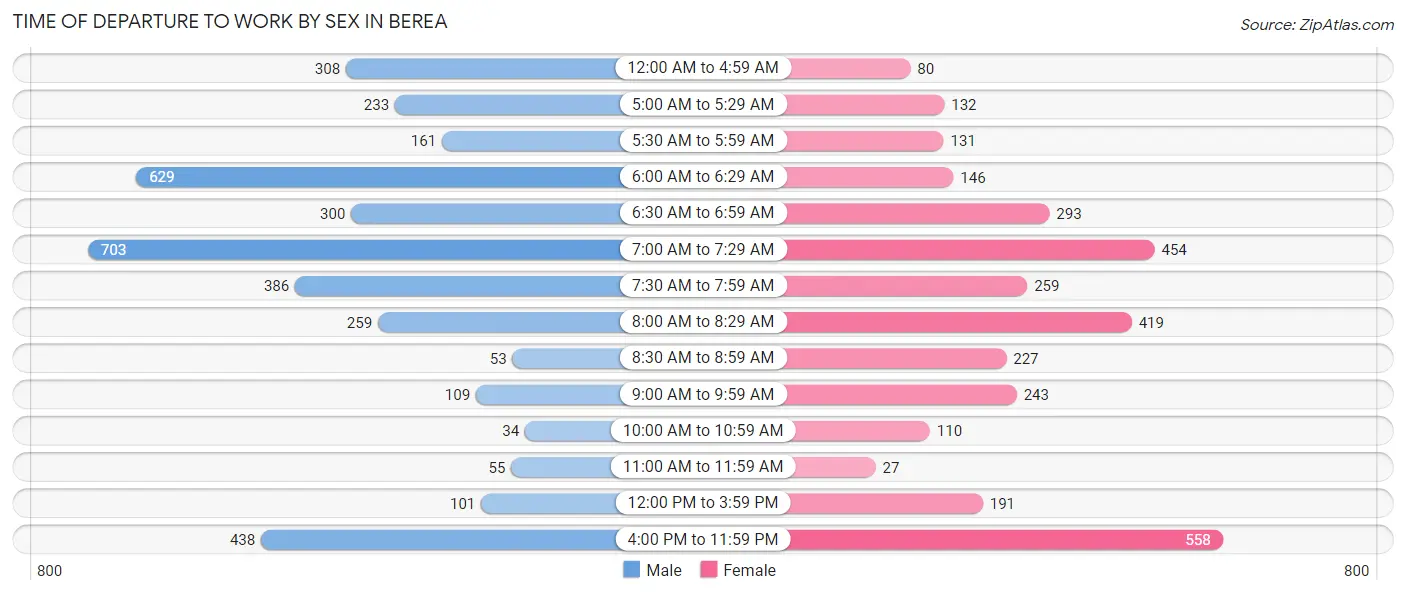
| Time of Departure | Male | Female |
| 12:00 AM to 4:59 AM | 308 (8.2%) | 80 (2.5%) |
| 5:00 AM to 5:29 AM | 233 (6.2%) | 132 (4.0%) |
| 5:30 AM to 5:59 AM | 161 (4.3%) | 131 (4.0%) |
| 6:00 AM to 6:29 AM | 629 (16.7%) | 146 (4.5%) |
| 6:30 AM to 6:59 AM | 300 (8.0%) | 293 (9.0%) |
| 7:00 AM to 7:29 AM | 703 (18.6%) | 454 (13.9%) |
| 7:30 AM to 7:59 AM | 386 (10.2%) | 259 (7.9%) |
| 8:00 AM to 8:29 AM | 259 (6.9%) | 419 (12.8%) |
| 8:30 AM to 8:59 AM | 53 (1.4%) | 227 (6.9%) |
| 9:00 AM to 9:59 AM | 109 (2.9%) | 243 (7.4%) |
| 10:00 AM to 10:59 AM | 34 (0.9%) | 110 (3.4%) |
| 11:00 AM to 11:59 AM | 55 (1.5%) | 27 (0.8%) |
| 12:00 PM to 3:59 PM | 101 (2.7%) | 191 (5.8%) |
| 4:00 PM to 11:59 PM | 438 (11.6%) | 558 (17.1%) |
| Total | 3,769 (100.0%) | 3,270 (100.0%) |
Housing Occupancy in Berea
Occupancy by Ownership in Berea
Of the total 6,048 dwellings in Berea, owner-occupied units account for 3,701 (61.2%), while renter-occupied units make up 2,347 (38.8%).
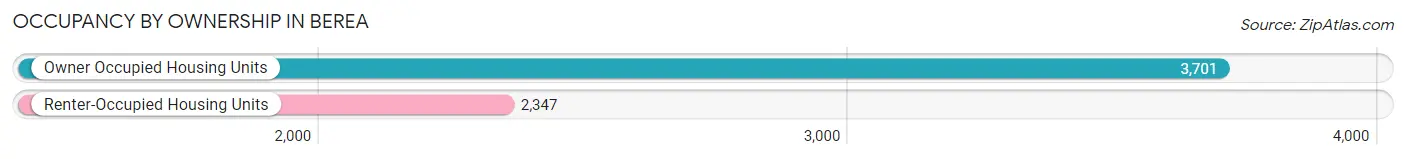
| Occupancy | # Housing Units | % Housing Units |
| Owner Occupied Housing Units | 3,701 | 61.2% |
| Renter-Occupied Housing Units | 2,347 | 38.8% |
| Total Occupied Housing Units | 6,048 | 100.0% |
Occupancy by Household Size in Berea
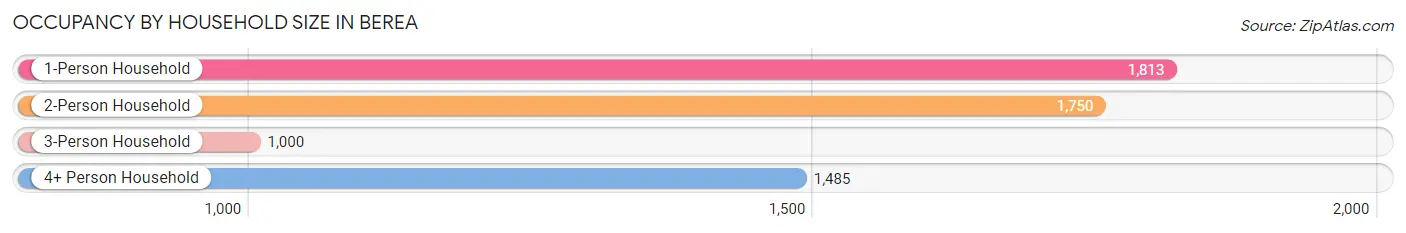
| Household Size | # Housing Units | % Housing Units |
| 1-Person Household | 1,813 | 30.0% |
| 2-Person Household | 1,750 | 28.9% |
| 3-Person Household | 1,000 | 16.5% |
| 4+ Person Household | 1,485 | 24.5% |
| Total Housing Units | 6,048 | 100.0% |
Occupancy by Ownership by Household Size in Berea
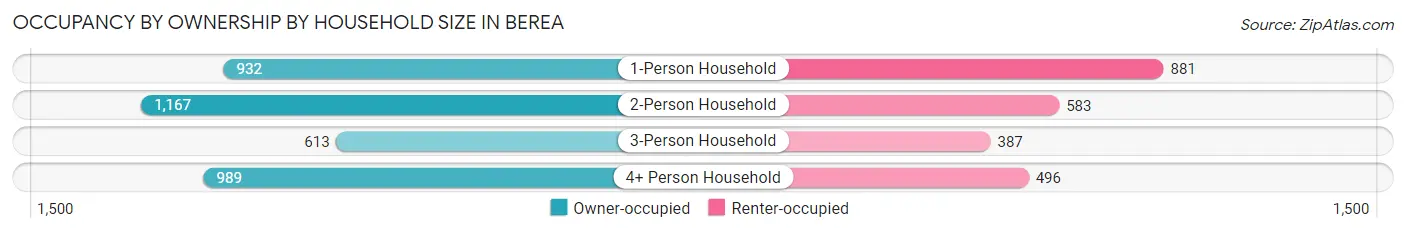
| Household Size | Owner-occupied | Renter-occupied |
| 1-Person Household | 932 (51.4%) | 881 (48.6%) |
| 2-Person Household | 1,167 (66.7%) | 583 (33.3%) |
| 3-Person Household | 613 (61.3%) | 387 (38.7%) |
| 4+ Person Household | 989 (66.6%) | 496 (33.4%) |
| Total Housing Units | 3,701 (61.2%) | 2,347 (38.8%) |
Occupancy by Educational Attainment in Berea
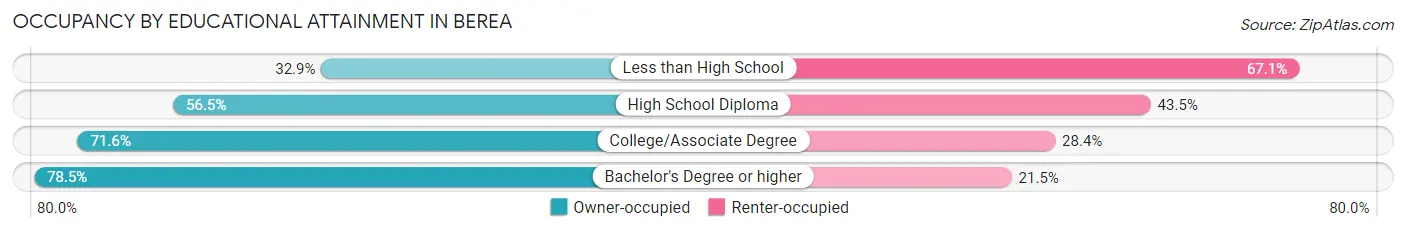
| Household Size | Owner-occupied | Renter-occupied |
| Less than High School | 366 (32.9%) | 745 (67.1%) |
| High School Diploma | 1,032 (56.5%) | 796 (43.5%) |
| College/Associate Degree | 1,430 (71.6%) | 567 (28.4%) |
| Bachelor's Degree or higher | 873 (78.5%) | 239 (21.5%) |
Occupancy by Age of Householder in Berea
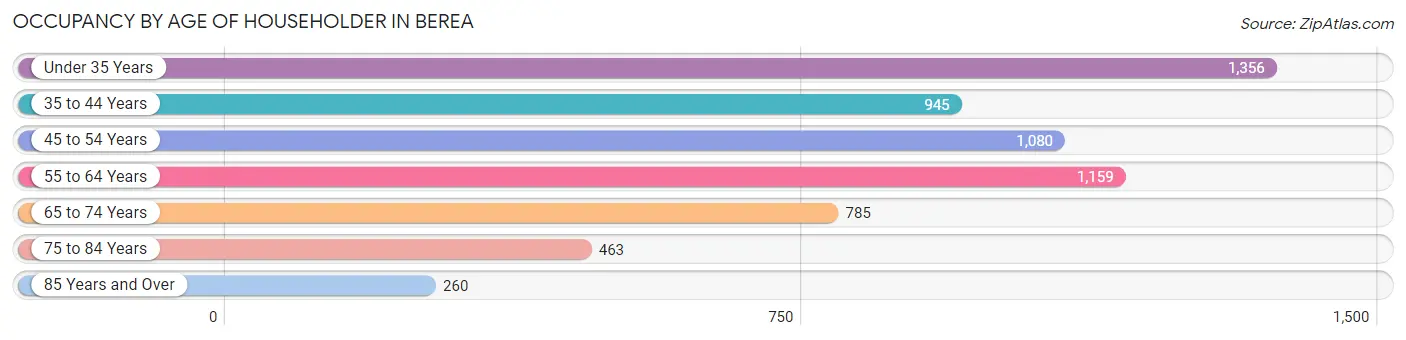
| Age Bracket | # Households | % Households |
| Under 35 Years | 1,356 | 22.4% |
| 35 to 44 Years | 945 | 15.6% |
| 45 to 54 Years | 1,080 | 17.9% |
| 55 to 64 Years | 1,159 | 19.2% |
| 65 to 74 Years | 785 | 13.0% |
| 75 to 84 Years | 463 | 7.7% |
| 85 Years and Over | 260 | 4.3% |
| Total | 6,048 | 100.0% |
Housing Finances in Berea
Median Income by Occupancy in Berea
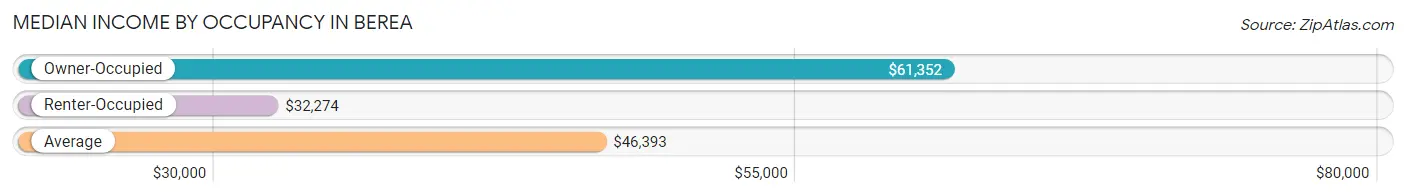
| Occupancy Type | # Households | Median Income |
| Owner-Occupied | 3,701 (61.2%) | $61,352 |
| Renter-Occupied | 2,347 (38.8%) | $32,274 |
| Average | 6,048 (100.0%) | $46,393 |
Occupancy by Householder Income Bracket in Berea
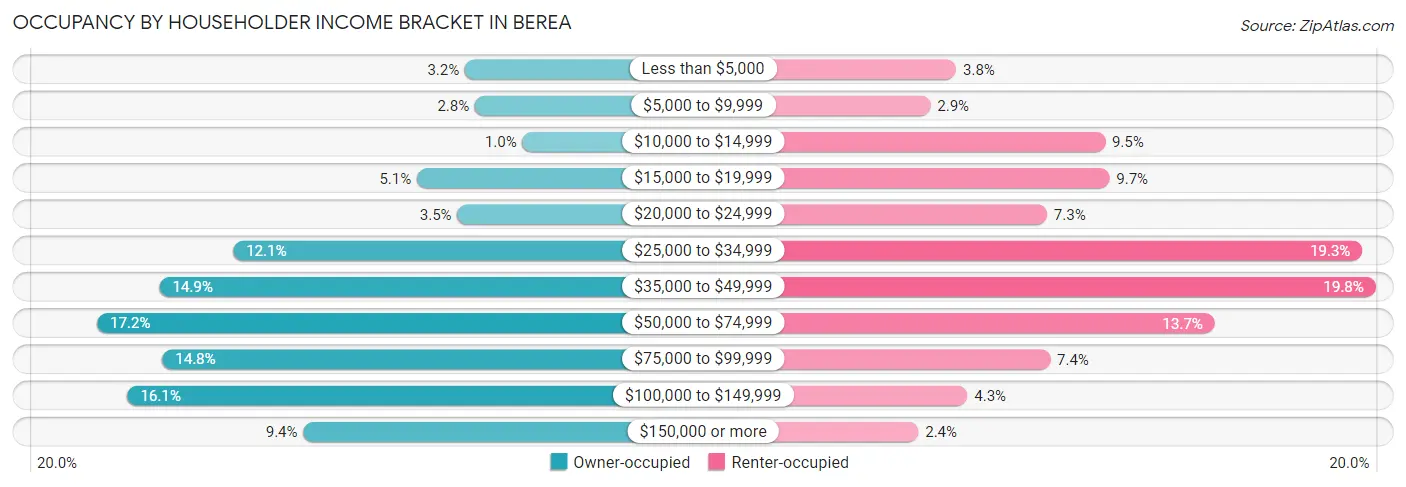
| Income Bracket | Owner-occupied | Renter-occupied |
| Less than $5,000 | 119 (3.2%) | 90 (3.8%) |
| $5,000 to $9,999 | 105 (2.8%) | 67 (2.9%) |
| $10,000 to $14,999 | 38 (1.0%) | 223 (9.5%) |
| $15,000 to $19,999 | 187 (5.1%) | 227 (9.7%) |
| $20,000 to $24,999 | 130 (3.5%) | 171 (7.3%) |
| $25,000 to $34,999 | 446 (12.0%) | 453 (19.3%) |
| $35,000 to $49,999 | 550 (14.9%) | 465 (19.8%) |
| $50,000 to $74,999 | 638 (17.2%) | 321 (13.7%) |
| $75,000 to $99,999 | 546 (14.7%) | 174 (7.4%) |
| $100,000 to $149,999 | 595 (16.1%) | 100 (4.3%) |
| $150,000 or more | 347 (9.4%) | 56 (2.4%) |
| Total | 3,701 (100.0%) | 2,347 (100.0%) |
Monthly Housing Cost Tiers in Berea
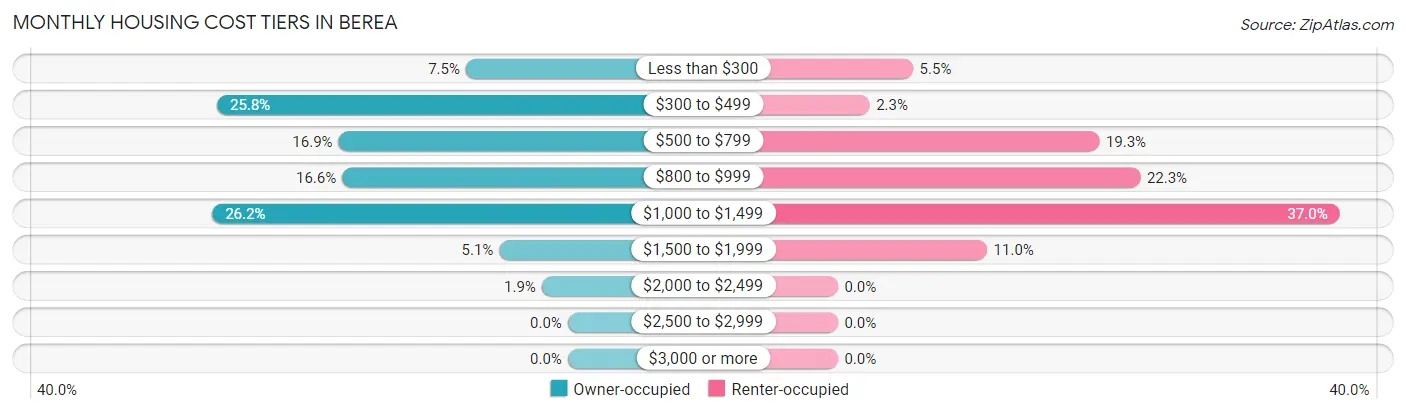
| Monthly Cost | Owner-occupied | Renter-occupied |
| Less than $300 | 278 (7.5%) | 130 (5.5%) |
| $300 to $499 | 956 (25.8%) | 55 (2.3%) |
| $500 to $799 | 625 (16.9%) | 452 (19.3%) |
| $800 to $999 | 615 (16.6%) | 523 (22.3%) |
| $1,000 to $1,499 | 969 (26.2%) | 868 (37.0%) |
| $1,500 to $1,999 | 187 (5.1%) | 258 (11.0%) |
| $2,000 to $2,499 | 71 (1.9%) | 0 (0.0%) |
| $2,500 to $2,999 | 0 (0.0%) | 0 (0.0%) |
| $3,000 or more | 0 (0.0%) | 0 (0.0%) |
| Total | 3,701 (100.0%) | 2,347 (100.0%) |
Physical Housing Characteristics in Berea
Housing Structures in Berea
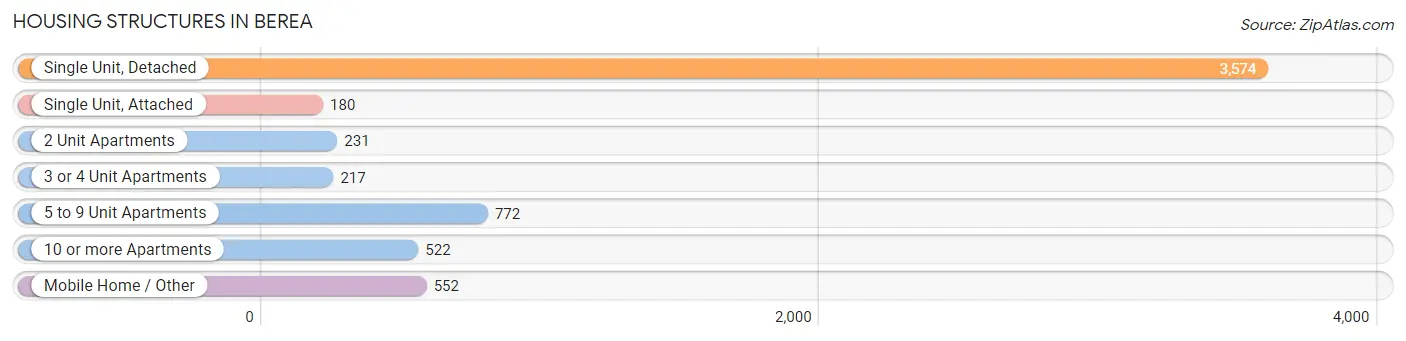
| Structure Type | # Housing Units | % Housing Units |
| Single Unit, Detached | 3,574 | 59.1% |
| Single Unit, Attached | 180 | 3.0% |
| 2 Unit Apartments | 231 | 3.8% |
| 3 or 4 Unit Apartments | 217 | 3.6% |
| 5 to 9 Unit Apartments | 772 | 12.8% |
| 10 or more Apartments | 522 | 8.6% |
| Mobile Home / Other | 552 | 9.1% |
| Total | 6,048 | 100.0% |
Housing Structures by Occupancy in Berea
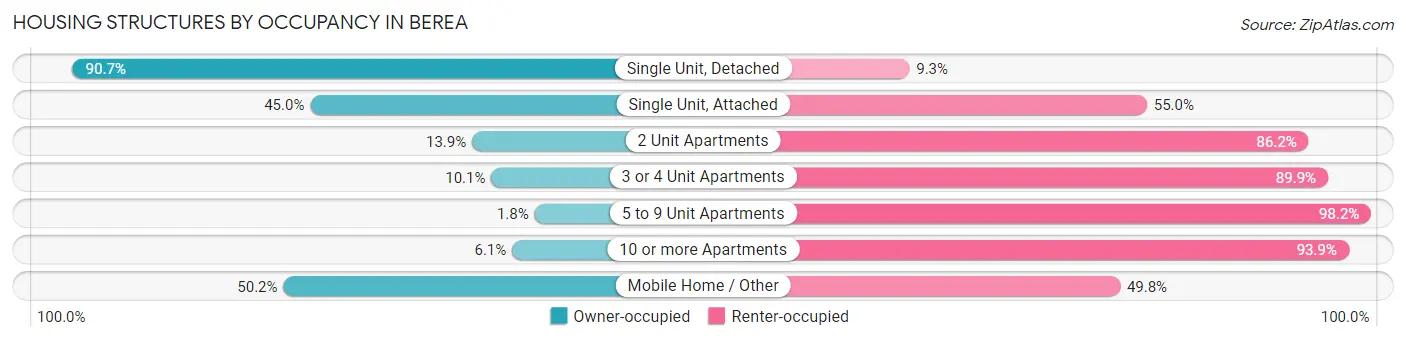
| Structure Type | Owner-occupied | Renter-occupied |
| Single Unit, Detached | 3,243 (90.7%) | 331 (9.3%) |
| Single Unit, Attached | 81 (45.0%) | 99 (55.0%) |
| 2 Unit Apartments | 32 (13.9%) | 199 (86.2%) |
| 3 or 4 Unit Apartments | 22 (10.1%) | 195 (89.9%) |
| 5 to 9 Unit Apartments | 14 (1.8%) | 758 (98.2%) |
| 10 or more Apartments | 32 (6.1%) | 490 (93.9%) |
| Mobile Home / Other | 277 (50.2%) | 275 (49.8%) |
| Total | 3,701 (61.2%) | 2,347 (38.8%) |
Housing Structures by Number of Rooms in Berea
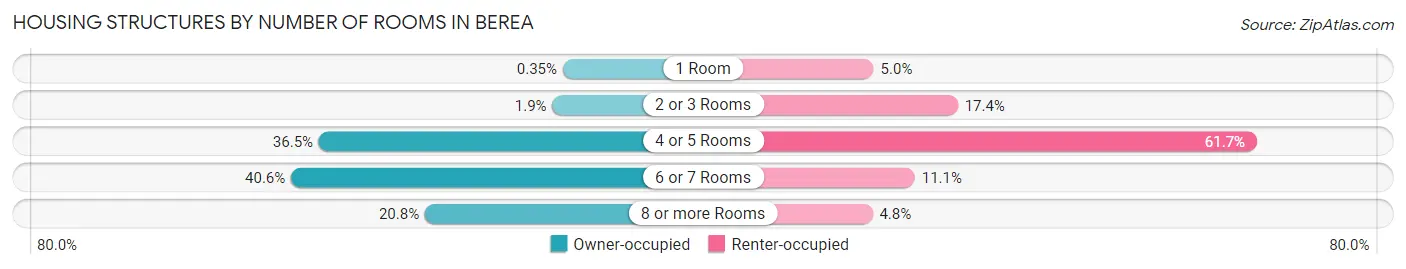
| Number of Rooms | Owner-occupied | Renter-occupied |
| 1 Room | 13 (0.4%) | 117 (5.0%) |
| 2 or 3 Rooms | 70 (1.9%) | 409 (17.4%) |
| 4 or 5 Rooms | 1,349 (36.4%) | 1,448 (61.7%) |
| 6 or 7 Rooms | 1,501 (40.6%) | 260 (11.1%) |
| 8 or more Rooms | 768 (20.7%) | 113 (4.8%) |
| Total | 3,701 (100.0%) | 2,347 (100.0%) |
Housing Structure by Heating Type in Berea
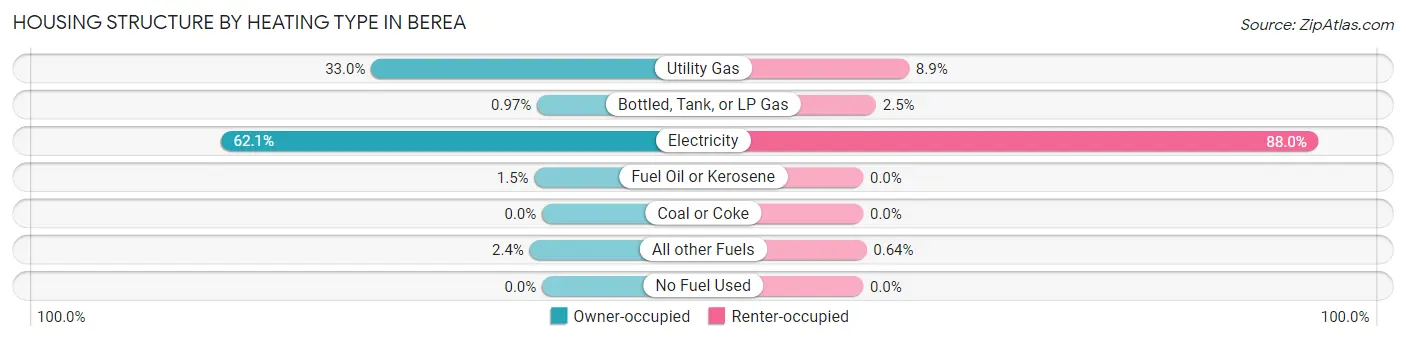
| Heating Type | Owner-occupied | Renter-occupied |
| Utility Gas | 1,222 (33.0%) | 208 (8.9%) |
| Bottled, Tank, or LP Gas | 36 (1.0%) | 58 (2.5%) |
| Electricity | 2,299 (62.1%) | 2,066 (88.0%) |
| Fuel Oil or Kerosene | 55 (1.5%) | 0 (0.0%) |
| Coal or Coke | 0 (0.0%) | 0 (0.0%) |
| All other Fuels | 89 (2.4%) | 15 (0.6%) |
| No Fuel Used | 0 (0.0%) | 0 (0.0%) |
| Total | 3,701 (100.0%) | 2,347 (100.0%) |
Household Vehicle Usage in Berea
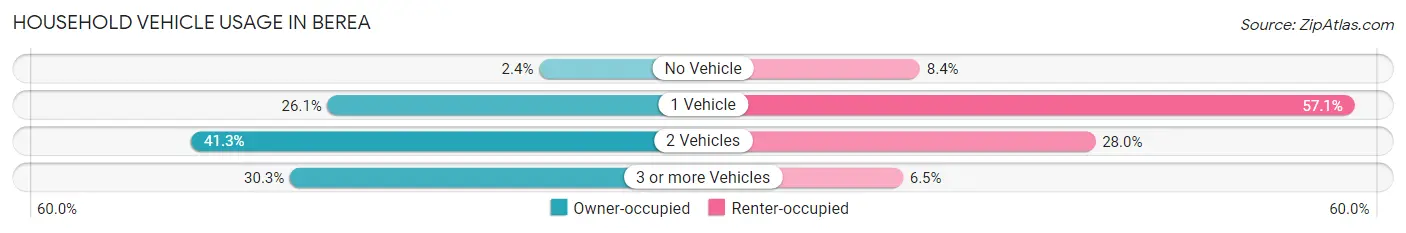
| Vehicles per Household | Owner-occupied | Renter-occupied |
| No Vehicle | 87 (2.4%) | 197 (8.4%) |
| 1 Vehicle | 964 (26.1%) | 1,340 (57.1%) |
| 2 Vehicles | 1,530 (41.3%) | 658 (28.0%) |
| 3 or more Vehicles | 1,120 (30.3%) | 152 (6.5%) |
| Total | 3,701 (100.0%) | 2,347 (100.0%) |
Real Estate & Mortgages in Berea
Real Estate and Mortgage Overview in Berea
| Characteristic | Without Mortgage | With Mortgage |
| Housing Units | 1,567 | 2,134 |
| Median Property Value | $135,600 | $180,600 |
| Median Household Income | $49,113 | $274 |
| Monthly Housing Costs | $383 | $0 |
| Real Estate Taxes | $912 | $62 |
Property Value by Mortgage Status in Berea
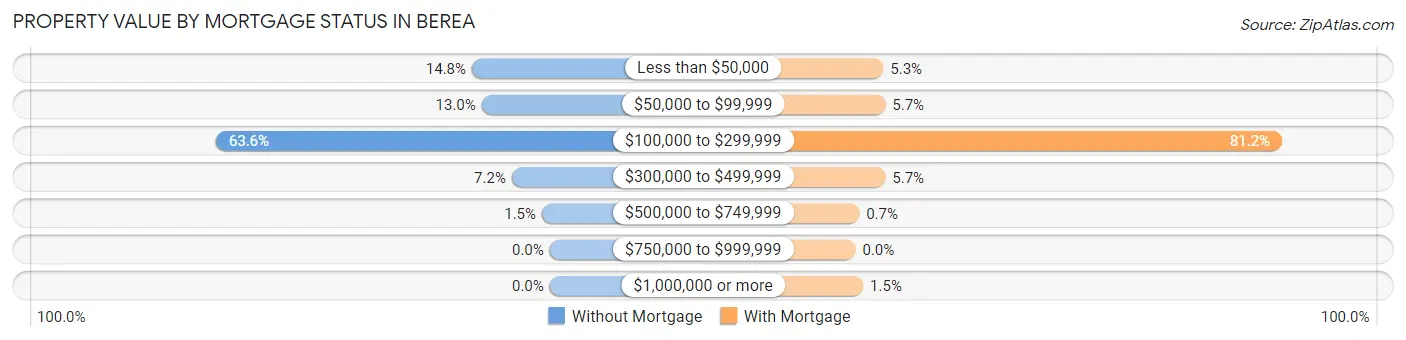
| Property Value | Without Mortgage | With Mortgage |
| Less than $50,000 | 232 (14.8%) | 113 (5.3%) |
| $50,000 to $99,999 | 203 (13.0%) | 121 (5.7%) |
| $100,000 to $299,999 | 996 (63.6%) | 1,733 (81.2%) |
| $300,000 to $499,999 | 113 (7.2%) | 121 (5.7%) |
| $500,000 to $749,999 | 23 (1.5%) | 15 (0.7%) |
| $750,000 to $999,999 | 0 (0.0%) | 0 (0.0%) |
| $1,000,000 or more | 0 (0.0%) | 31 (1.5%) |
| Total | 1,567 (100.0%) | 2,134 (100.0%) |
Household Income by Mortgage Status in Berea
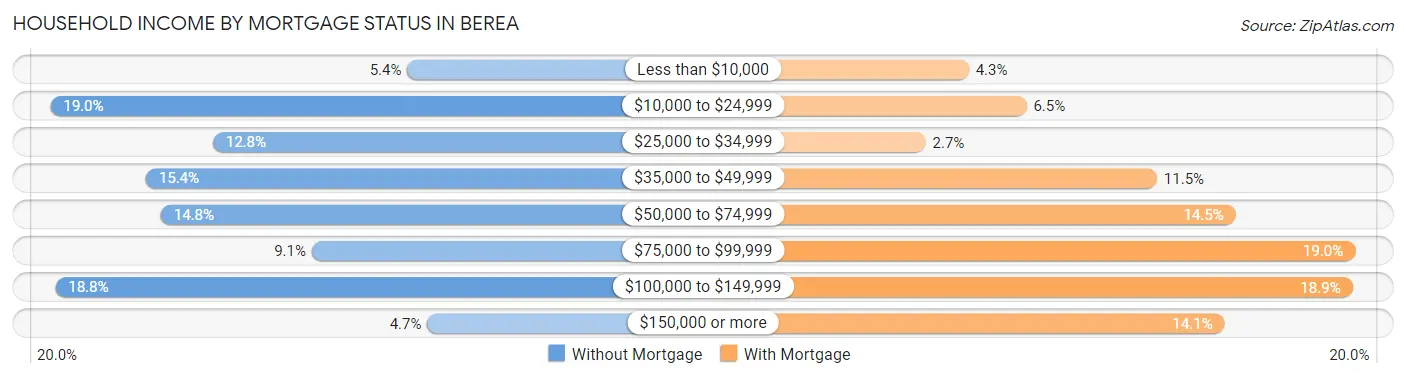
| Household Income | Without Mortgage | With Mortgage |
| Less than $10,000 | 85 (5.4%) | 92 (4.3%) |
| $10,000 to $24,999 | 298 (19.0%) | 139 (6.5%) |
| $25,000 to $34,999 | 201 (12.8%) | 57 (2.7%) |
| $35,000 to $49,999 | 241 (15.4%) | 245 (11.5%) |
| $50,000 to $74,999 | 232 (14.8%) | 309 (14.5%) |
| $75,000 to $99,999 | 142 (9.1%) | 406 (19.0%) |
| $100,000 to $149,999 | 295 (18.8%) | 404 (18.9%) |
| $150,000 or more | 73 (4.7%) | 300 (14.1%) |
| Total | 1,567 (100.0%) | 2,134 (100.0%) |
Property Value to Household Income Ratio in Berea
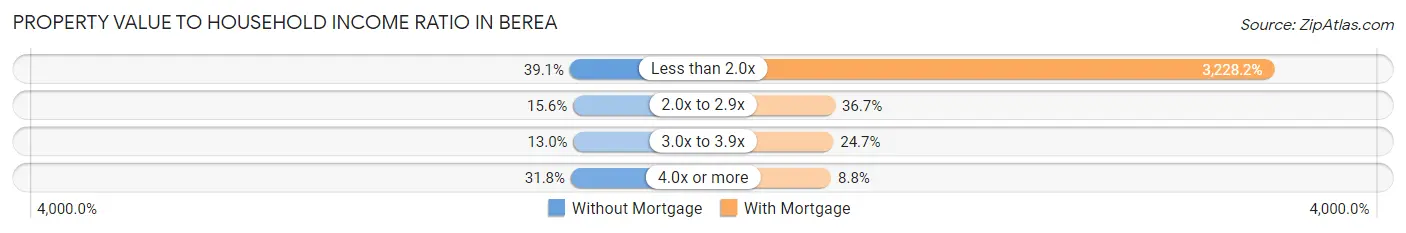
| Value-to-Income Ratio | Without Mortgage | With Mortgage |
| Less than 2.0x | 613 (39.1%) | 68,889 (3,228.2%) |
| 2.0x to 2.9x | 245 (15.6%) | 783 (36.7%) |
| 3.0x to 3.9x | 203 (13.0%) | 526 (24.6%) |
| 4.0x or more | 499 (31.8%) | 187 (8.8%) |
| Total | 1,567 (100.0%) | 2,134 (100.0%) |
Real Estate Taxes by Mortgage Status in Berea
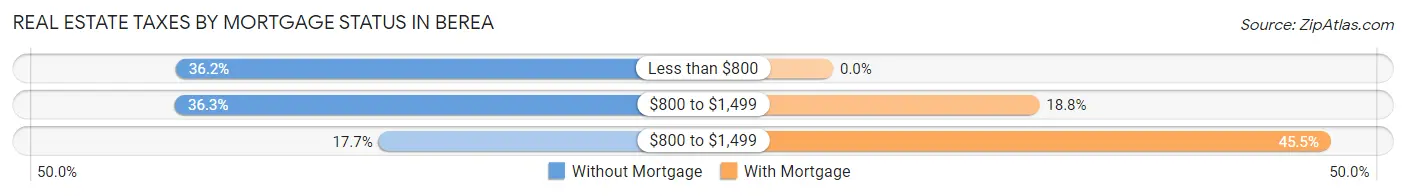
| Property Taxes | Without Mortgage | With Mortgage |
| Less than $800 | 567 (36.2%) | 0 (0.0%) |
| $800 to $1,499 | 568 (36.2%) | 402 (18.8%) |
| $800 to $1,499 | 277 (17.7%) | 970 (45.5%) |
| Total | 1,567 (100.0%) | 2,134 (100.0%) |
Health & Disability in Berea
Health Insurance Coverage by Age in Berea
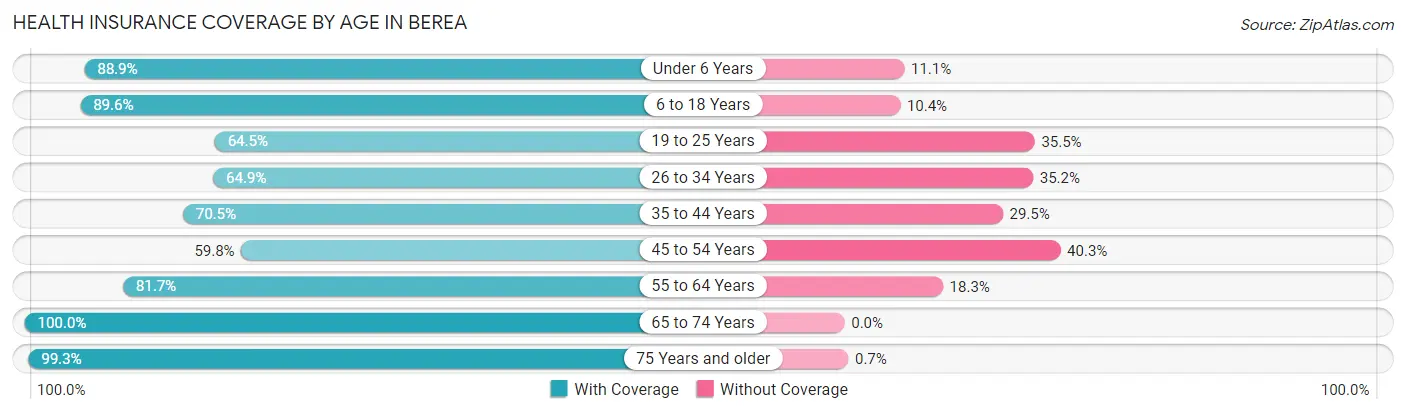
| Age Bracket | With Coverage | Without Coverage |
| Under 6 Years | 1,228 (88.9%) | 154 (11.1%) |
| 6 to 18 Years | 2,279 (89.6%) | 264 (10.4%) |
| 19 to 25 Years | 859 (64.5%) | 472 (35.5%) |
| 26 to 34 Years | 1,330 (64.8%) | 721 (35.1%) |
| 35 to 44 Years | 1,328 (70.5%) | 556 (29.5%) |
| 45 to 54 Years | 1,232 (59.8%) | 830 (40.3%) |
| 55 to 64 Years | 1,585 (81.7%) | 356 (18.3%) |
| 65 to 74 Years | 1,693 (100.0%) | 0 (0.0%) |
| 75 Years and older | 993 (99.3%) | 7 (0.7%) |
| Total | 12,527 (78.8%) | 3,360 (21.1%) |
Health Insurance Coverage by Citizenship Status in Berea
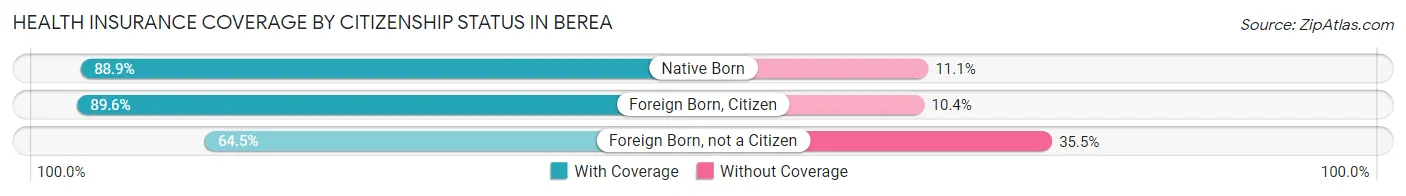
| Citizenship Status | With Coverage | Without Coverage |
| Native Born | 1,228 (88.9%) | 154 (11.1%) |
| Foreign Born, Citizen | 2,279 (89.6%) | 264 (10.4%) |
| Foreign Born, not a Citizen | 859 (64.5%) | 472 (35.5%) |
Health Insurance Coverage by Household Income in Berea
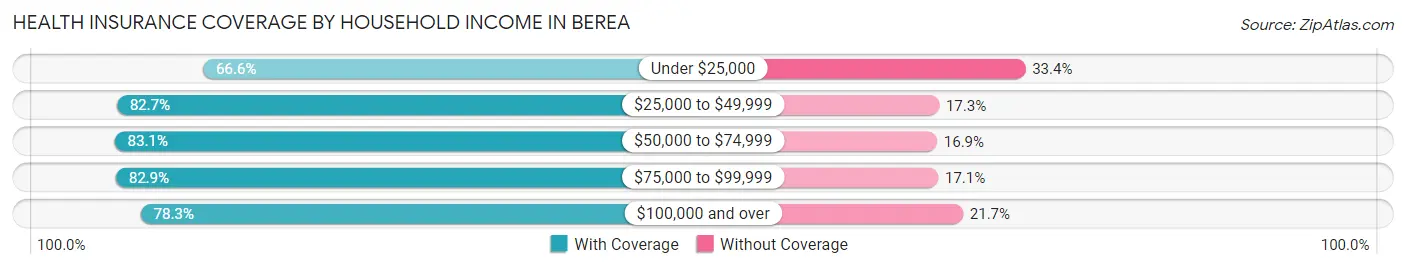
| Household Income | With Coverage | Without Coverage |
| Under $25,000 | 1,834 (66.6%) | 921 (33.4%) |
| $25,000 to $49,999 | 3,282 (82.7%) | 685 (17.3%) |
| $50,000 to $74,999 | 2,143 (83.1%) | 435 (16.9%) |
| $75,000 to $99,999 | 2,008 (82.9%) | 414 (17.1%) |
| $100,000 and over | 3,255 (78.3%) | 904 (21.7%) |
Public vs Private Health Insurance Coverage by Age in Berea
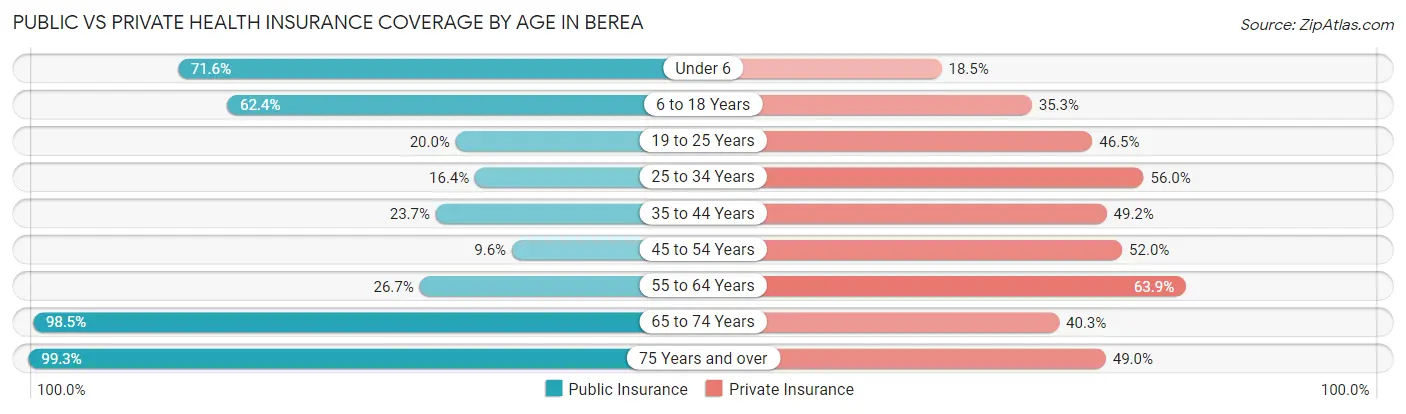
| Age Bracket | Public Insurance | Private Insurance |
| Under 6 | 989 (71.6%) | 256 (18.5%) |
| 6 to 18 Years | 1,587 (62.4%) | 897 (35.3%) |
| 19 to 25 Years | 266 (20.0%) | 619 (46.5%) |
| 25 to 34 Years | 336 (16.4%) | 1,149 (56.0%) |
| 35 to 44 Years | 446 (23.7%) | 926 (49.1%) |
| 45 to 54 Years | 197 (9.6%) | 1,073 (52.0%) |
| 55 to 64 Years | 518 (26.7%) | 1,240 (63.9%) |
| 65 to 74 Years | 1,667 (98.5%) | 683 (40.3%) |
| 75 Years and over | 993 (99.3%) | 490 (49.0%) |
| Total | 6,999 (44.1%) | 7,333 (46.2%) |
Disability Status by Sex by Age in Berea
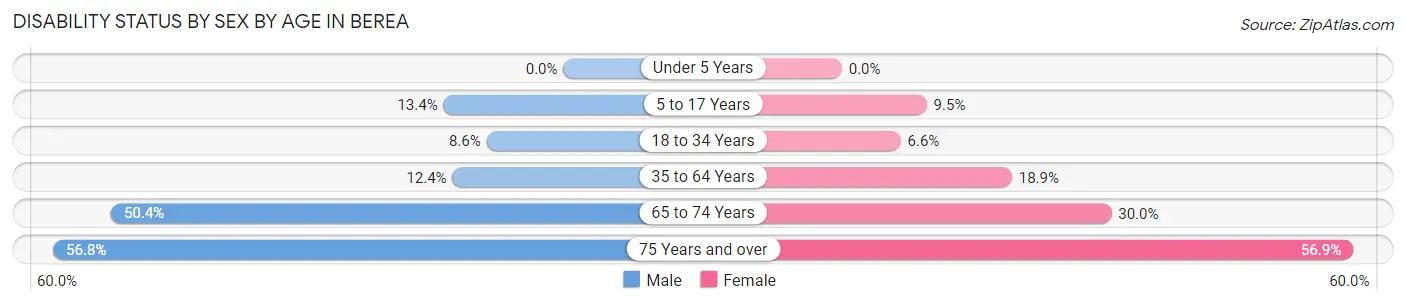
| Age Bracket | Male | Female |
| Under 5 Years | 0 (0.0%) | 0 (0.0%) |
| 5 to 17 Years | 148 (13.4%) | 111 (9.5%) |
| 18 to 34 Years | 168 (8.6%) | 121 (6.6%) |
| 35 to 64 Years | 361 (12.3%) | 561 (18.9%) |
| 65 to 74 Years | 398 (50.4%) | 271 (30.0%) |
| 75 Years and over | 183 (56.8%) | 386 (56.9%) |
Disability Class by Sex by Age in Berea
Disability Class: Hearing Difficulty
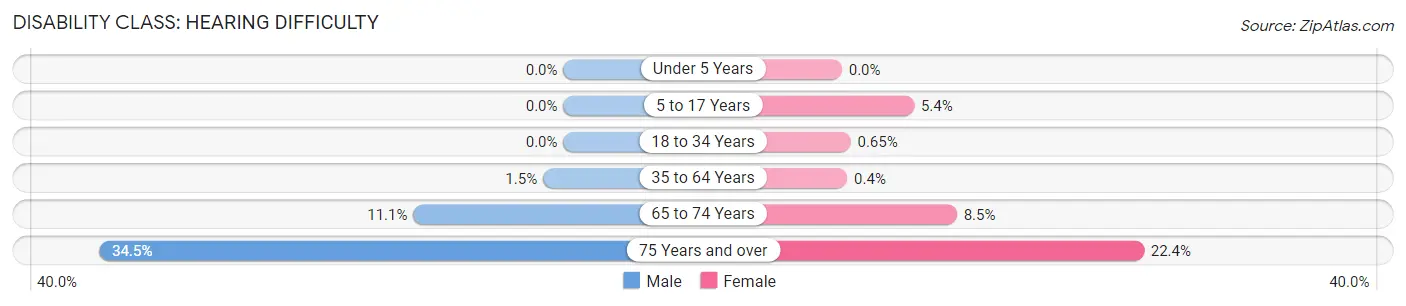
| Age Bracket | Male | Female |
| Under 5 Years | 0 (0.0%) | 0 (0.0%) |
| 5 to 17 Years | 0 (0.0%) | 63 (5.4%) |
| 18 to 34 Years | 0 (0.0%) | 12 (0.6%) |
| 35 to 64 Years | 44 (1.5%) | 12 (0.4%) |
| 65 to 74 Years | 88 (11.1%) | 77 (8.5%) |
| 75 Years and over | 111 (34.5%) | 152 (22.4%) |
Disability Class: Vision Difficulty
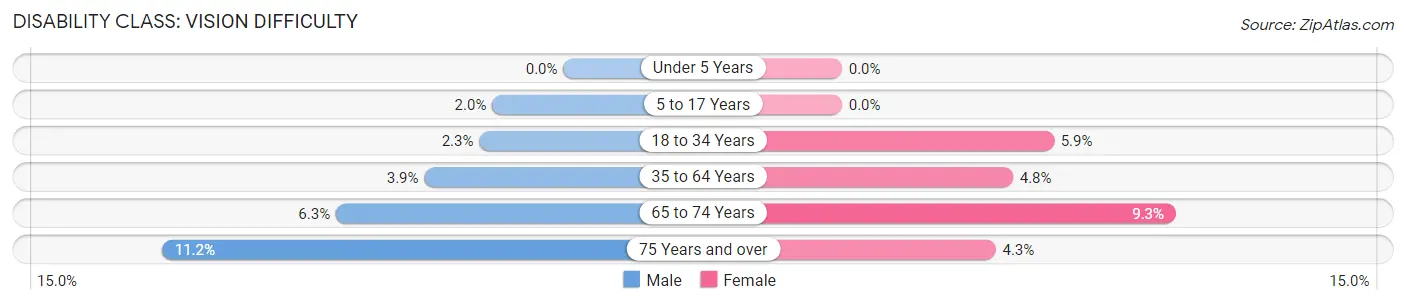
| Age Bracket | Male | Female |
| Under 5 Years | 0 (0.0%) | 0 (0.0%) |
| 5 to 17 Years | 22 (2.0%) | 0 (0.0%) |
| 18 to 34 Years | 46 (2.3%) | 109 (5.9%) |
| 35 to 64 Years | 113 (3.9%) | 141 (4.8%) |
| 65 to 74 Years | 50 (6.3%) | 84 (9.3%) |
| 75 Years and over | 36 (11.2%) | 29 (4.3%) |
Disability Class: Cognitive Difficulty
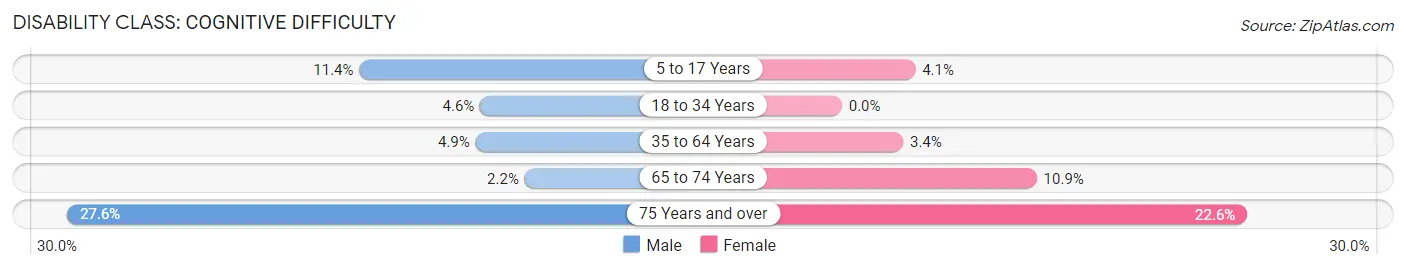
| Age Bracket | Male | Female |
| 5 to 17 Years | 126 (11.4%) | 48 (4.1%) |
| 18 to 34 Years | 91 (4.6%) | 0 (0.0%) |
| 35 to 64 Years | 143 (4.9%) | 101 (3.4%) |
| 65 to 74 Years | 17 (2.1%) | 98 (10.8%) |
| 75 Years and over | 89 (27.6%) | 153 (22.6%) |
Disability Class: Ambulatory Difficulty
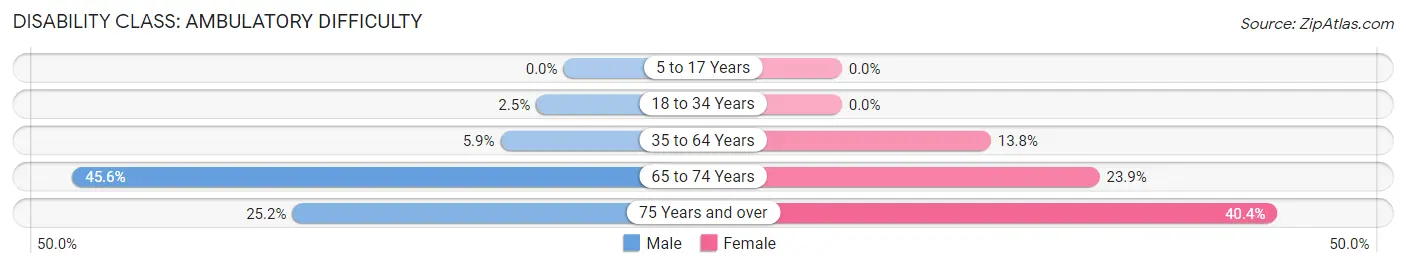
| Age Bracket | Male | Female |
| 5 to 17 Years | 0 (0.0%) | 0 (0.0%) |
| 18 to 34 Years | 50 (2.5%) | 0 (0.0%) |
| 35 to 64 Years | 171 (5.9%) | 410 (13.8%) |
| 65 to 74 Years | 360 (45.6%) | 216 (23.9%) |
| 75 Years and over | 81 (25.2%) | 274 (40.4%) |
Disability Class: Self-Care Difficulty
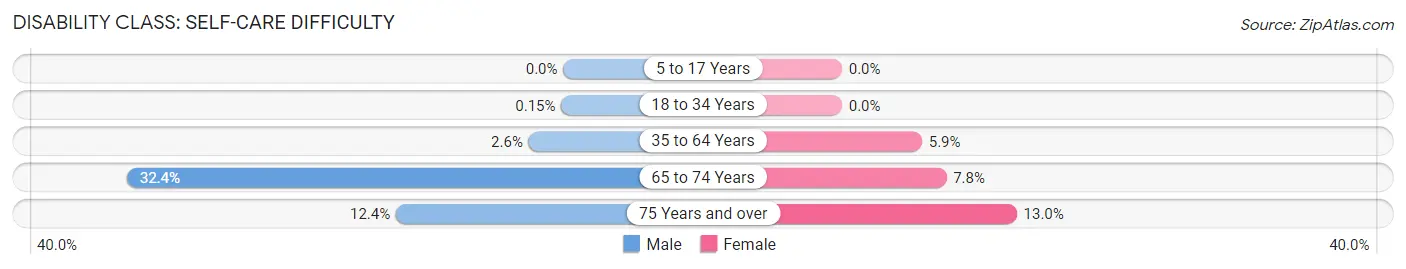
| Age Bracket | Male | Female |
| 5 to 17 Years | 0 (0.0%) | 0 (0.0%) |
| 18 to 34 Years | 3 (0.2%) | 0 (0.0%) |
| 35 to 64 Years | 75 (2.6%) | 176 (5.9%) |
| 65 to 74 Years | 256 (32.4%) | 70 (7.7%) |
| 75 Years and over | 40 (12.4%) | 88 (13.0%) |
Technology Access in Berea
Computing Device Access in Berea
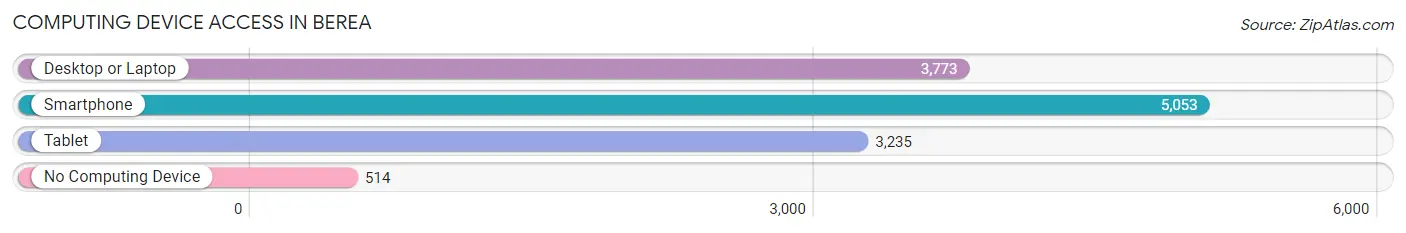
| Device Type | # Households | % Households |
| Desktop or Laptop | 3,773 | 62.4% |
| Smartphone | 5,053 | 83.6% |
| Tablet | 3,235 | 53.5% |
| No Computing Device | 514 | 8.5% |
| Total | 6,048 | 100.0% |
Internet Access in Berea
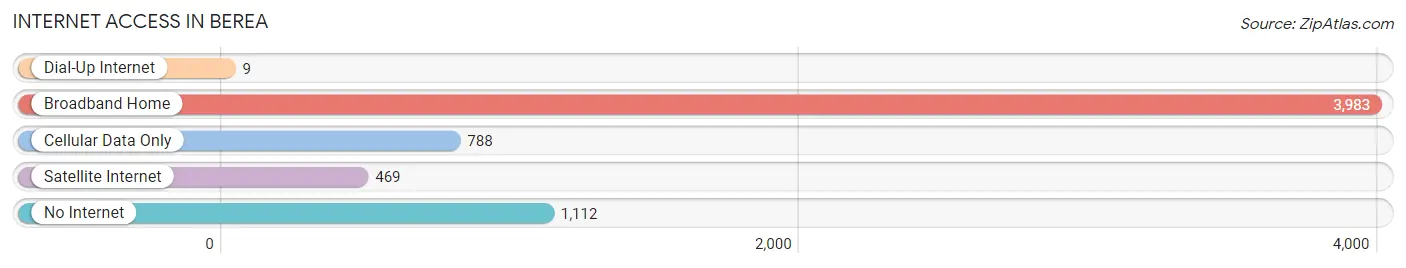
| Internet Type | # Households | % Households |
| Dial-Up Internet | 9 | 0.2% |
| Broadband Home | 3,983 | 65.9% |
| Cellular Data Only | 788 | 13.0% |
| Satellite Internet | 469 | 7.7% |
| No Internet | 1,112 | 18.4% |
| Total | 6,048 | 100.0% |
Berea Summary
Berea is a small unincorporated community located in Greenville County, South Carolina. It is situated in the foothills of the Blue Ridge Mountains, approximately 10 miles northeast of Greenville. The community is home to a diverse population of approximately 4,000 people.
History
The area that is now known as Berea was first settled in the late 1700s by a group of Scots-Irish immigrants. The community was originally known as “Berea”, which is derived from the Hebrew word for “place of refuge”. The first post office in the area was established in 1820, and the town was officially incorporated in 1883.
In the late 1800s, Berea was a thriving agricultural community, with cotton, corn, and tobacco being the primary crops. The town also had a number of small businesses, including a grist mill, a sawmill, and a general store.
In the early 1900s, Berea began to experience a period of growth and development. The town was connected to the outside world by the Southern Railway in 1906, and the first telephone service was established in 1908. The town also had its own newspaper, the Berea News, which was published from 1909 to 1915.
In the 1920s, Berea experienced a period of decline as the local economy shifted away from agriculture and towards manufacturing. The Great Depression of the 1930s further exacerbated the town’s economic woes, and many of the businesses in Berea closed their doors.
In the 1940s, Berea began to experience a period of revitalization. The town was connected to the outside world by the Greenville-Spartanburg Airport in 1945, and the first television station in the area began broadcasting in 1948. The town also had its own newspaper, the Berea News, which was published from 1949 to 1954.
Geography
Berea is located in the foothills of the Blue Ridge Mountains, approximately 10 miles northeast of Greenville. The town is situated at an elevation of 1,000 feet above sea level, and is surrounded by rolling hills and lush forests. The town is located near the headwaters of the Reedy River, which flows through the area.
The climate in Berea is mild and temperate, with warm summers and cool winters. The average annual temperature is around 60 degrees Fahrenheit, and the average annual precipitation is around 45 inches.
Economy
The economy of Berea is largely based on agriculture and manufacturing. The town is home to a number of small businesses, including a grist mill, a sawmill, and a general store. The town also has a number of small manufacturing plants, which produce a variety of products, including furniture, textiles, and automotive parts.
The town is also home to a number of tourist attractions, including the Greenville Zoo, the Greenville County Museum of Art, and the Greenville County Historical Society.
Demographics
As of the 2010 census, the population of Berea was 4,000. The racial makeup of the town was 79.2% White, 15.2% African American, 0.7% Native American, 0.7% Asian, 0.1% Pacific Islander, and 4.1% from other races. The median household income was $37,500, and the median family income was $45,000. The per capita income was $19,000.
Conclusion
Berea is a small unincorporated community located in Greenville County, South Carolina. It is situated in the foothills of the Blue Ridge Mountains, approximately 10 miles northeast of Greenville. The community is home to a diverse population of approximately 4,000 people. The economy of Berea is largely based on agriculture and manufacturing, and the town is home to a number of small businesses and tourist attractions. The racial makeup of the town is 79.2% White, 15.2% African American, 0.7% Native American, 0.7% Asian, 0.1% Pacific Islander, and 4.1% from other races. The median household income was $37,500, and the median family income was $45,000.
Common Questions
What is Per Capita Income in Berea?
Per Capita income in Berea is $25,048.
What is the Median Family Income in Berea?
Median Family Income in Berea is $58,306.
What is the Median Household income in Berea?
Median Household Income in Berea is $46,393.
What is Income or Wage Gap in Berea?
Income or Wage Gap in Berea is 22.3%.
Women in Berea earn 77.7 cents for every dollar earned by a man.
What is Family Income Deficit in Berea?
Family Income Deficit in Berea is $11,452.
Families that are below poverty line in Berea earn $11,452 less on average than the poverty threshold level.
What is Inequality or Gini Index in Berea?
Inequality or Gini Index in Berea is 0.45.
What is the Total Population of Berea?
Total Population of Berea is 16,184.
What is the Total Male Population of Berea?
Total Male Population of Berea is 7,853.
What is the Total Female Population of Berea?
Total Female Population of Berea is 8,331.
What is the Ratio of Males per 100 Females in Berea?
There are 94.26 Males per 100 Females in Berea.
What is the Ratio of Females per 100 Males in Berea?
There are 106.09 Females per 100 Males in Berea.
What is the Median Population Age in Berea?
Median Population Age in Berea is 37.9 Years.
What is the Average Family Size in Berea
Average Family Size in Berea is 3.2 People.
What is the Average Household Size in Berea
Average Household Size in Berea is 2.6 People.
How Large is the Labor Force in Berea?
There are 7,914 People in the Labor Forcein in Berea.
What is the Percentage of People in the Labor Force in Berea?
60.2% of People are in the Labor Force in Berea.
What is the Unemployment Rate in Berea?
Unemployment Rate in Berea is 6.9%.