Folsom, CA Map & Demographics
Folsom Map
Folsom Overview
$56,541
PER CAPITA INCOME
$164,717
AVG FAMILY INCOME
$134,935
AVG HOUSEHOLD INCOME
39.4%
WAGE / INCOME GAP [ % ]
60.6¢/ $1
WAGE / INCOME GAP [ $ ]
$11,141
FAMILY INCOME DEFICIT
0.41
INEQUALITY / GINI INDEX
81,077
TOTAL POPULATION
40,838
MALE POPULATION
40,239
FEMALE POPULATION
101.49
MALES / 100 FEMALES
98.53
FEMALES / 100 MALES
39.9
MEDIAN AGE
3.2
AVG FAMILY SIZE
2.7
AVG HOUSEHOLD SIZE
40,171
LABOR FORCE [ PEOPLE ]
62.4%
PERCENT IN LABOR FORCE
5.0%
UNEMPLOYMENT RATE
Folsom Zip Codes
Folsom Area Codes
Income in Folsom
Income Overview in Folsom
Per Capita Income in Folsom is $56,541, while median incomes of families and households are $164,717 and $134,935 respectively.
| Characteristic | Number | Measure |
| Per Capita Income | 81,077 | $56,541 |
| Median Family Income | 20,403 | $164,717 |
| Mean Family Income | 20,403 | $185,182 |
| Median Household Income | 28,298 | $134,935 |
| Mean Household Income | 28,298 | $159,904 |
| Income Deficit | 20,403 | $11,141 |
| Wage / Income Gap (%) | 81,077 | 39.38% |
| Wage / Income Gap ($) | 81,077 | 60.62¢ per $1 |
| Gini / Inequality Index | 81,077 | 0.41 |
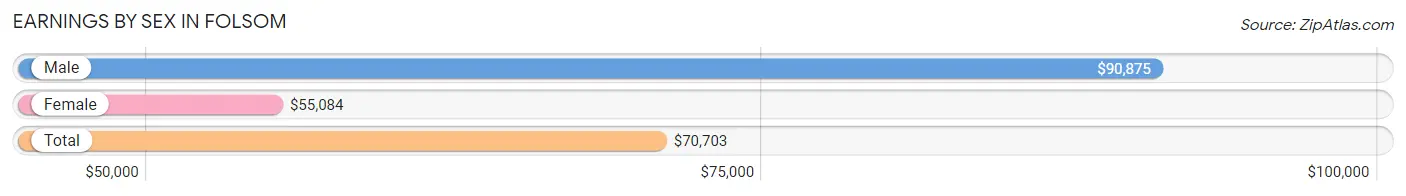
Earnings by Sex in Folsom
Average Earnings in Folsom are $70,703, $90,875 for men and $55,084 for women, a difference of 39.4%.
| Sex | Number | Average Earnings |
| Male | 22,171 (52.8%) | $90,875 |
| Female | 19,834 (47.2%) | $55,084 |
| Total | 42,005 (100.0%) | $70,703 |
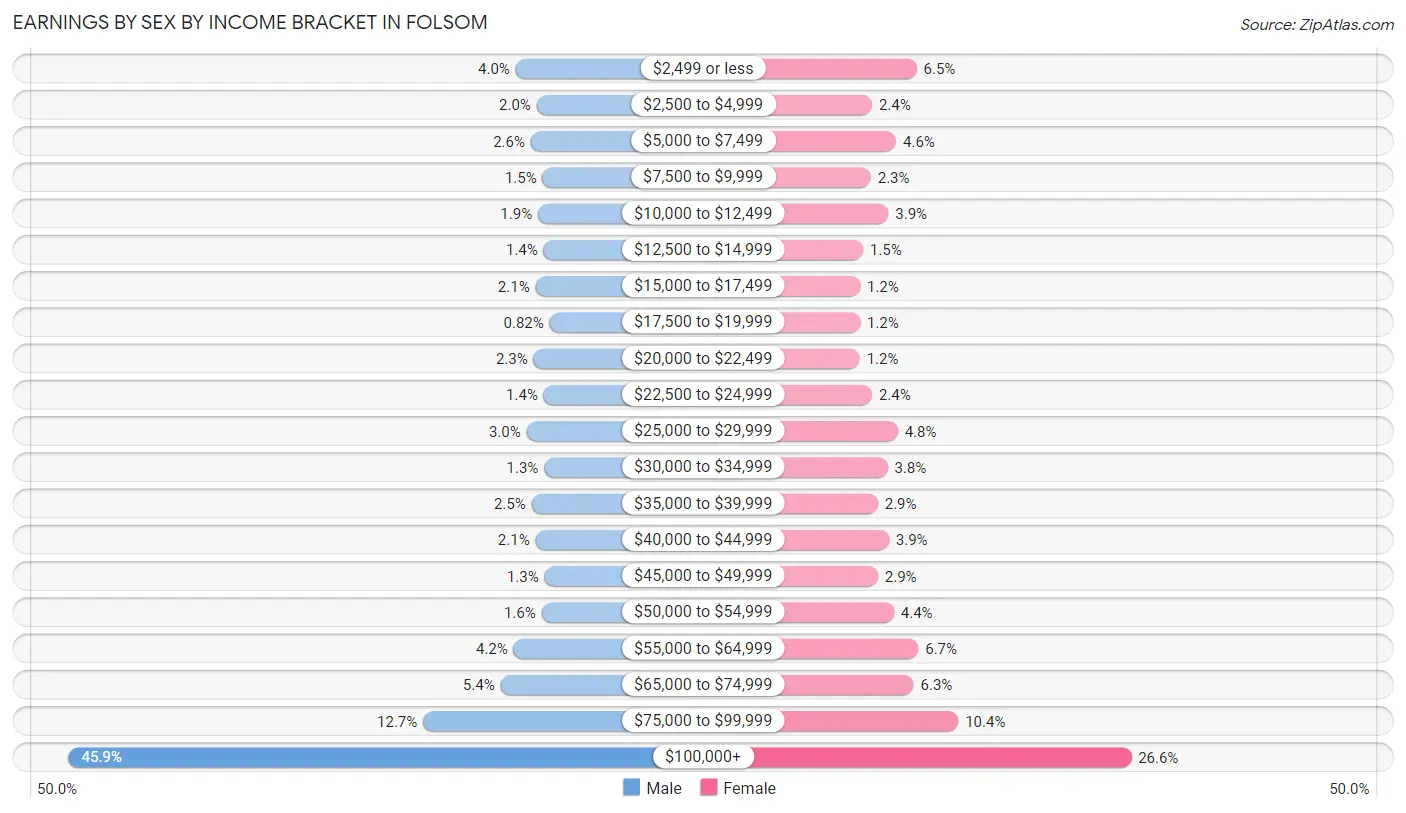
Earnings by Sex by Income Bracket in Folsom
The most common earnings brackets in Folsom are $100,000+ for men (10,171 | 45.9%) and $100,000+ for women (5,283 | 26.6%).
| Income | Male | Female |
| $2,499 or less | 886 (4.0%) | 1,298 (6.5%) |
| $2,500 to $4,999 | 450 (2.0%) | 469 (2.4%) |
| $5,000 to $7,499 | 573 (2.6%) | 916 (4.6%) |
| $7,500 to $9,999 | 328 (1.5%) | 446 (2.2%) |
| $10,000 to $12,499 | 423 (1.9%) | 771 (3.9%) |
| $12,500 to $14,999 | 306 (1.4%) | 302 (1.5%) |
| $15,000 to $17,499 | 474 (2.1%) | 245 (1.2%) |
| $17,500 to $19,999 | 181 (0.8%) | 245 (1.2%) |
| $20,000 to $22,499 | 514 (2.3%) | 239 (1.2%) |
| $22,500 to $24,999 | 303 (1.4%) | 468 (2.4%) |
| $25,000 to $29,999 | 661 (3.0%) | 946 (4.8%) |
| $30,000 to $34,999 | 295 (1.3%) | 755 (3.8%) |
| $35,000 to $39,999 | 556 (2.5%) | 576 (2.9%) |
| $40,000 to $44,999 | 475 (2.1%) | 781 (3.9%) |
| $45,000 to $49,999 | 287 (1.3%) | 578 (2.9%) |
| $50,000 to $54,999 | 349 (1.6%) | 875 (4.4%) |
| $55,000 to $64,999 | 929 (4.2%) | 1,329 (6.7%) |
| $65,000 to $74,999 | 1,202 (5.4%) | 1,241 (6.3%) |
| $75,000 to $99,999 | 2,808 (12.7%) | 2,071 (10.4%) |
| $100,000+ | 10,171 (45.9%) | 5,283 (26.6%) |
| Total | 22,171 (100.0%) | 19,834 (100.0%) |
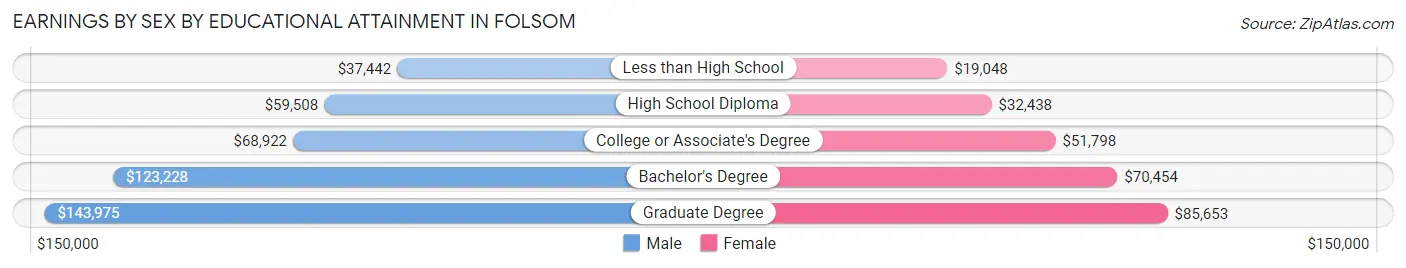
Earnings by Sex by Educational Attainment in Folsom
Average earnings in Folsom are $103,014 for men and $62,733 for women, a difference of 39.1%. Men with an educational attainment of graduate degree enjoy the highest average annual earnings of $143,975, while those with less than high school education earn the least with $37,442. Women with an educational attainment of graduate degree earn the most with the average annual earnings of $85,653, while those with less than high school education have the smallest earnings of $19,048.
| Educational Attainment | Male Income | Female Income |
| Less than High School | $37,442 | $19,048 |
| High School Diploma | $59,508 | $32,438 |
| College or Associate's Degree | $68,922 | $51,798 |
| Bachelor's Degree | $123,228 | $70,454 |
| Graduate Degree | $143,975 | $85,653 |
| Total | $103,014 | $62,733 |
Family Income in Folsom
Family Income Brackets in Folsom
According to the Folsom family income data, there are 7,161 families falling into the $200,000+ income range, which is the most common income bracket and makes up 35.1% of all families. Conversely, the $10,000 to $14,999 income bracket is the least frequent group with only 102 families (0.5%) belonging to this category.
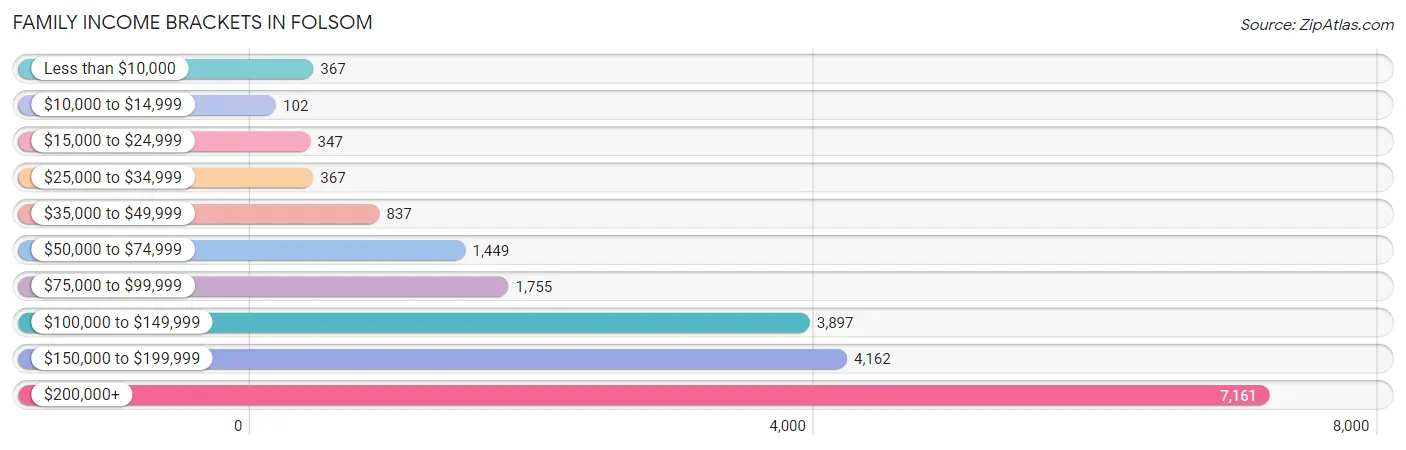
| Income Bracket | # Families | % Families |
| Less than $10,000 | 367 | 1.8% |
| $10,000 to $14,999 | 102 | 0.5% |
| $15,000 to $24,999 | 347 | 1.7% |
| $25,000 to $34,999 | 367 | 1.8% |
| $35,000 to $49,999 | 837 | 4.1% |
| $50,000 to $74,999 | 1,449 | 7.1% |
| $75,000 to $99,999 | 1,755 | 8.6% |
| $100,000 to $149,999 | 3,897 | 19.1% |
| $150,000 to $199,999 | 4,162 | 20.4% |
| $200,000+ | 7,161 | 35.1% |
Family Income by Famaliy Size in Folsom
6-person families (445 | 2.2%) account for the highest median family income in Folsom with $215,380 per family, while 2-person families (8,033 | 39.4%) have the highest median income of $62,544 per family member.
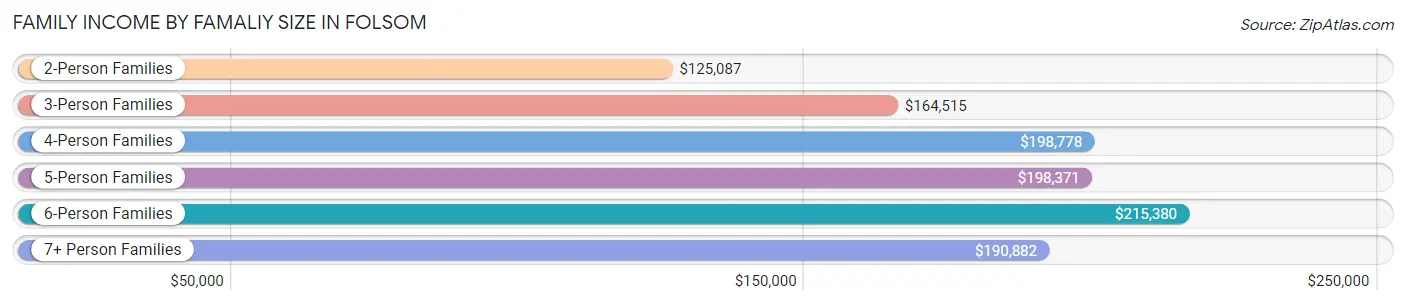
| Income Bracket | # Families | Median Income |
| 2-Person Families | 8,033 (39.4%) | $125,087 |
| 3-Person Families | 5,215 (25.6%) | $164,515 |
| 4-Person Families | 4,719 (23.1%) | $198,778 |
| 5-Person Families | 1,771 (8.7%) | $198,371 |
| 6-Person Families | 445 (2.2%) | $215,380 |
| 7+ Person Families | 220 (1.1%) | $190,882 |
| Total | 20,403 (100.0%) | $164,717 |
Family Income by Number of Earners in Folsom
The median family income in Folsom is $164,717, with families comprising 3+ earners (2,520) having the highest median family income of $234,907, while families with no earners (2,251) have the lowest median family income of $80,403, accounting for 12.3% and 11.0% of families, respectively.
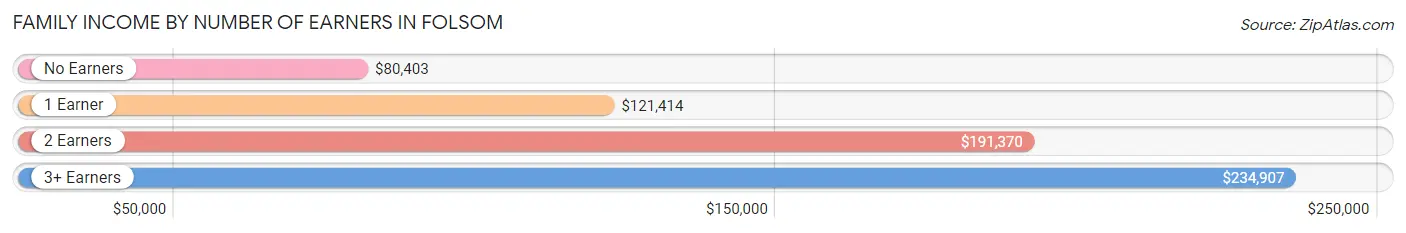
| Number of Earners | # Families | Median Income |
| No Earners | 2,251 (11.0%) | $80,403 |
| 1 Earner | 5,635 (27.6%) | $121,414 |
| 2 Earners | 9,997 (49.0%) | $191,370 |
| 3+ Earners | 2,520 (12.3%) | $234,907 |
| Total | 20,403 (100.0%) | $164,717 |
Household Income in Folsom
Household Income Brackets in Folsom
With 8,065 households falling in the category, the $200,000+ income range is the most frequent in Folsom, accounting for 28.5% of all households. In contrast, only 255 households (0.9%) fall into the $10,000 to $14,999 income bracket, making it the least populous group.
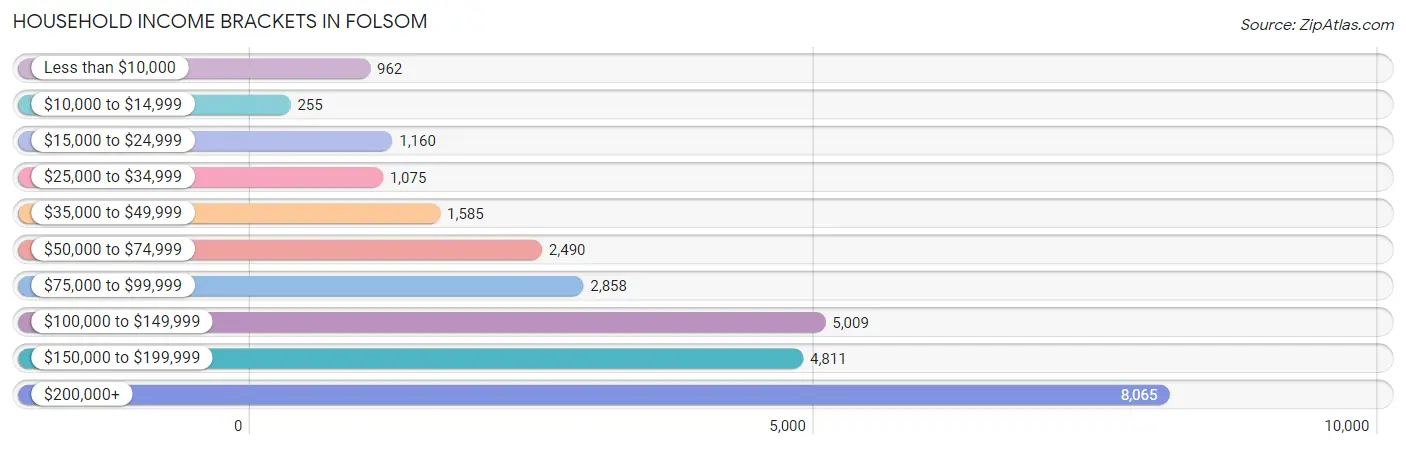
| Income Bracket | # Households | % Households |
| Less than $10,000 | 962 | 3.4% |
| $10,000 to $14,999 | 255 | 0.9% |
| $15,000 to $24,999 | 1,160 | 4.1% |
| $25,000 to $34,999 | 1,075 | 3.8% |
| $35,000 to $49,999 | 1,585 | 5.6% |
| $50,000 to $74,999 | 2,490 | 8.8% |
| $75,000 to $99,999 | 2,858 | 10.1% |
| $100,000 to $149,999 | 5,009 | 17.7% |
| $150,000 to $199,999 | 4,811 | 17.0% |
| $200,000+ | 8,065 | 28.5% |
Household Income by Householder Age in Folsom
The median household income in Folsom is $134,935, with the highest median household income of $164,974 found in the 45 to 64 years age bracket for the primary householder. A total of 12,798 households (45.2%) fall into this category. Meanwhile, the 15 to 24 years age bracket for the primary householder has the lowest median household income of $72,106, with 571 households (2.0%) in this group.
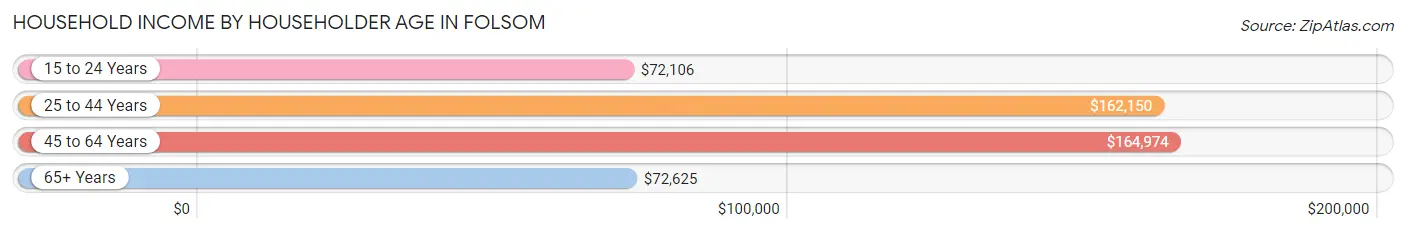
| Income Bracket | # Households | Median Income |
| 15 to 24 Years | 571 (2.0%) | $72,106 |
| 25 to 44 Years | 8,513 (30.1%) | $162,150 |
| 45 to 64 Years | 12,798 (45.2%) | $164,974 |
| 65+ Years | 6,416 (22.7%) | $72,625 |
| Total | 28,298 (100.0%) | $134,935 |
Poverty in Folsom
Income Below Poverty by Sex and Age in Folsom
With 5.4% poverty level for males and 5.2% for females among the residents of Folsom, 18 to 24 year old males and 18 to 24 year old females are the most vulnerable to poverty, with 371 males (12.1%) and 283 females (11.2%) in their respective age groups living below the poverty level.
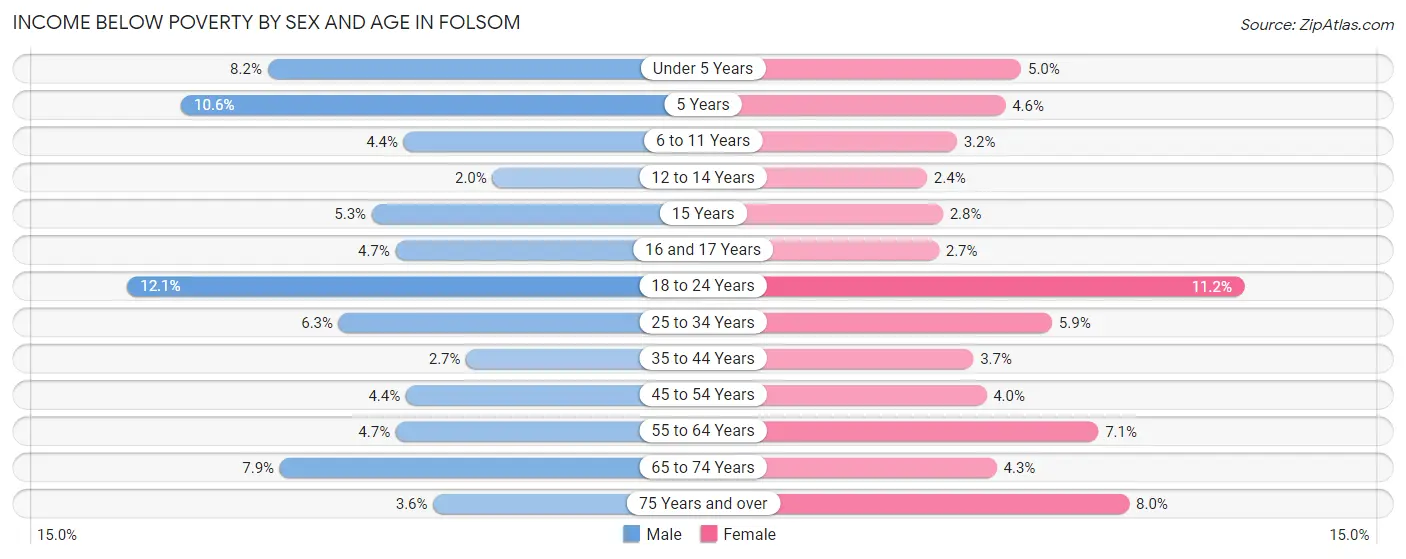
| Age Bracket | Male | Female |
| Under 5 Years | 168 (8.2%) | 117 (5.0%) |
| 5 Years | 38 (10.6%) | 17 (4.5%) |
| 6 to 11 Years | 135 (4.4%) | 106 (3.2%) |
| 12 to 14 Years | 42 (2.0%) | 40 (2.4%) |
| 15 Years | 26 (5.3%) | 19 (2.8%) |
| 16 and 17 Years | 44 (4.7%) | 34 (2.7%) |
| 18 to 24 Years | 371 (12.1%) | 283 (11.2%) |
| 25 to 34 Years | 251 (6.2%) | 244 (5.9%) |
| 35 to 44 Years | 150 (2.7%) | 209 (3.7%) |
| 45 to 54 Years | 272 (4.4%) | 244 (4.0%) |
| 55 to 64 Years | 211 (4.7%) | 370 (7.1%) |
| 65 to 74 Years | 207 (7.9%) | 149 (4.3%) |
| 75 Years and over | 60 (3.6%) | 227 (8.0%) |
| Total | 1,975 (5.4%) | 2,059 (5.2%) |
Income Above Poverty by Sex and Age in Folsom
According to the poverty statistics in Folsom, males aged 12 to 14 years and females aged 12 to 14 years are the age groups that are most secure financially, with 98.0% of males and 97.6% of females in these age groups living above the poverty line.
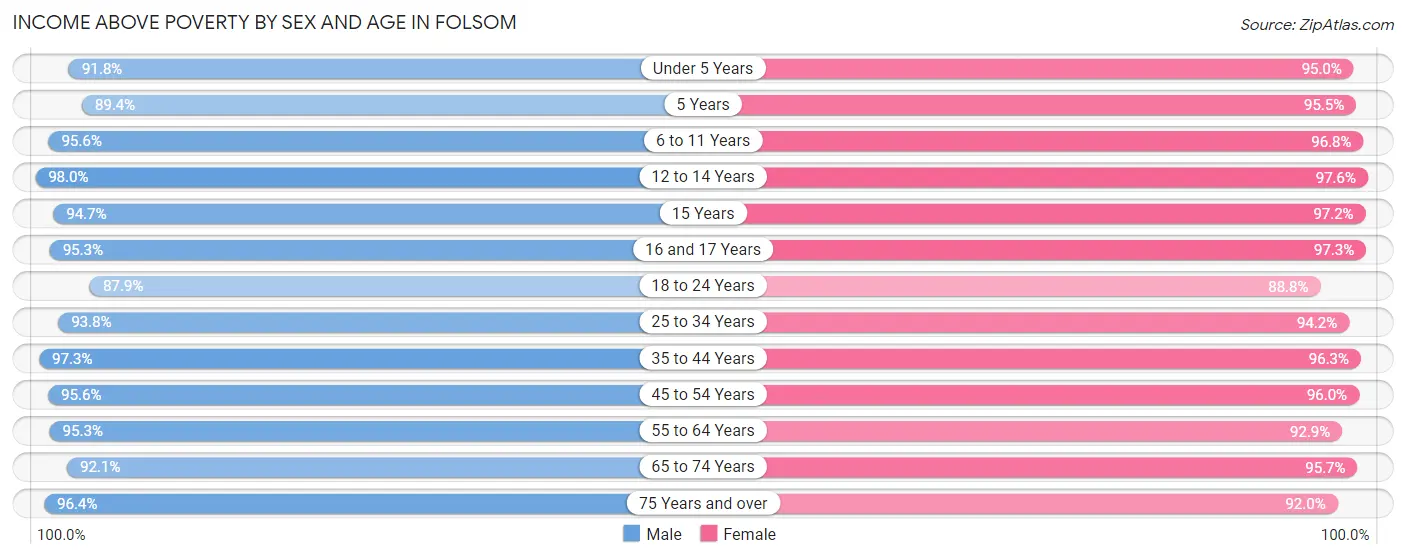
| Age Bracket | Male | Female |
| Under 5 Years | 1,873 (91.8%) | 2,230 (95.0%) |
| 5 Years | 319 (89.4%) | 357 (95.5%) |
| 6 to 11 Years | 2,908 (95.6%) | 3,206 (96.8%) |
| 12 to 14 Years | 2,091 (98.0%) | 1,646 (97.6%) |
| 15 Years | 462 (94.7%) | 656 (97.2%) |
| 16 and 17 Years | 899 (95.3%) | 1,223 (97.3%) |
| 18 to 24 Years | 2,686 (87.9%) | 2,247 (88.8%) |
| 25 to 34 Years | 3,767 (93.8%) | 3,925 (94.2%) |
| 35 to 44 Years | 5,406 (97.3%) | 5,509 (96.3%) |
| 45 to 54 Years | 5,939 (95.6%) | 5,825 (96.0%) |
| 55 to 64 Years | 4,317 (95.3%) | 4,814 (92.9%) |
| 65 to 74 Years | 2,415 (92.1%) | 3,311 (95.7%) |
| 75 Years and over | 1,599 (96.4%) | 2,612 (92.0%) |
| Total | 34,681 (94.6%) | 37,561 (94.8%) |
Income Below Poverty Among Married-Couple Families in Folsom
The poverty statistics for married-couple families in Folsom show that 2.5% or 429 of the total 17,250 families live below the poverty line. Families with no children have the highest poverty rate of 3.0%, comprising of 252 families. On the other hand, families with 5 or more children have the lowest poverty rate of 0.0%, which includes 0 families.
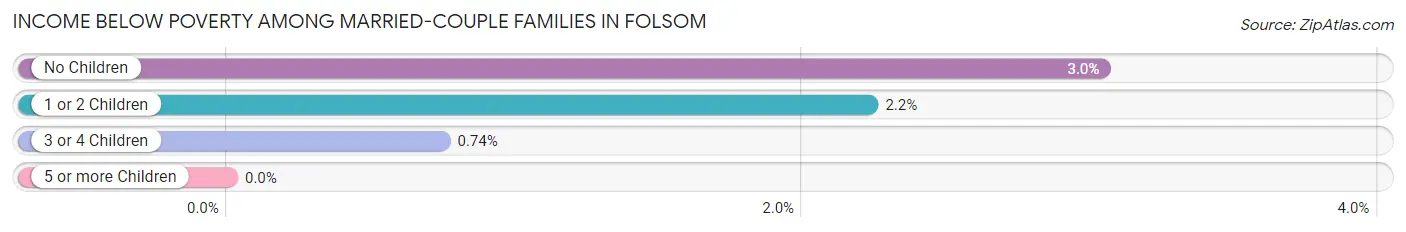
| Children | Above Poverty | Below Poverty |
| No Children | 8,041 (97.0%) | 252 (3.0%) |
| 1 or 2 Children | 7,265 (97.8%) | 166 (2.2%) |
| 3 or 4 Children | 1,466 (99.3%) | 11 (0.7%) |
| 5 or more Children | 49 (100.0%) | 0 (0.0%) |
| Total | 16,821 (97.5%) | 429 (2.5%) |
Income Below Poverty Among Single-Parent Households in Folsom
According to the poverty data in Folsom, 14.8% or 163 single-father households and 6.8% or 140 single-mother households are living below the poverty line. Among single-father households, those with 1 or 2 children have the highest poverty rate, with 138 households (19.9%) experiencing poverty. Likewise, among single-mother households, those with 5 or more children have the highest poverty rate, with 3 households (100.0%) falling below the poverty line.
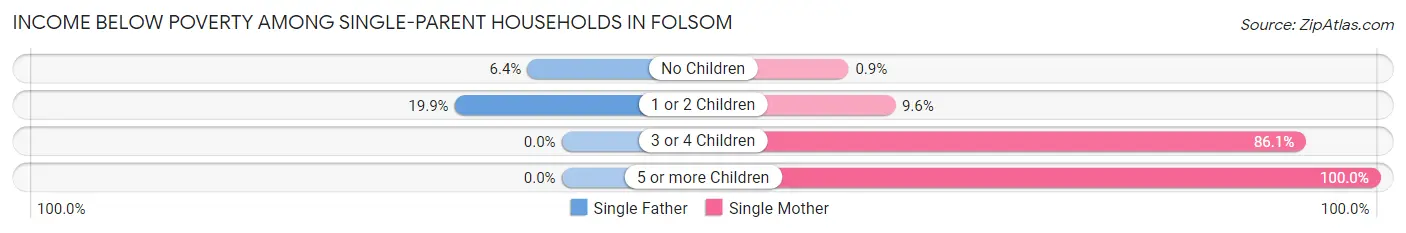
| Children | Single Father | Single Mother |
| No Children | 25 (6.4%) | 9 (0.9%) |
| 1 or 2 Children | 138 (19.9%) | 97 (9.6%) |
| 3 or 4 Children | 0 (0.0%) | 31 (86.1%) |
| 5 or more Children | 0 (0.0%) | 3 (100.0%) |
| Total | 163 (14.8%) | 140 (6.8%) |
Income Below Poverty Among Married-Couple vs Single-Parent Households in Folsom
The poverty data for Folsom shows that 429 of the married-couple family households (2.5%) and 303 of the single-parent households (9.6%) are living below the poverty level. Within the married-couple family households, those with no children have the highest poverty rate, with 252 households (3.0%) falling below the poverty line. Among the single-parent households, those with 5 or more children have the highest poverty rate, with 3 household (100.0%) living below poverty.
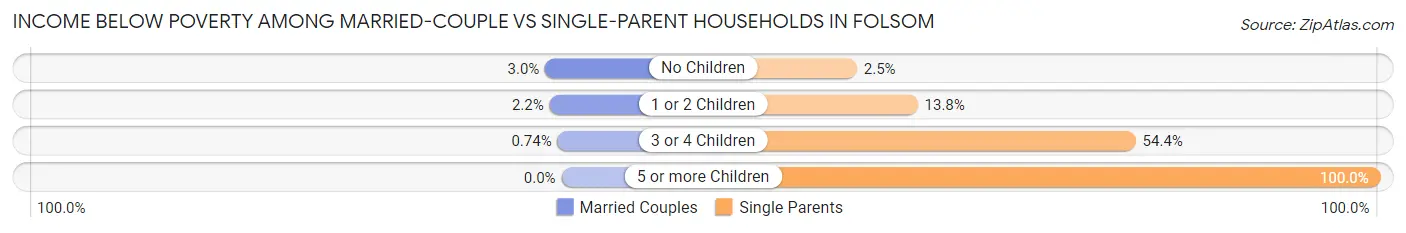
| Children | Married-Couple Families | Single-Parent Households |
| No Children | 252 (3.0%) | 34 (2.5%) |
| 1 or 2 Children | 166 (2.2%) | 235 (13.8%) |
| 3 or 4 Children | 11 (0.7%) | 31 (54.4%) |
| 5 or more Children | 0 (0.0%) | 3 (100.0%) |
| Total | 429 (2.5%) | 303 (9.6%) |
Race in Folsom
The most populous races in Folsom are White / Caucasian (50,675 | 62.5%), Asian (14,986 | 18.5%), and Hispanic or Latino (12,009 | 14.8%).
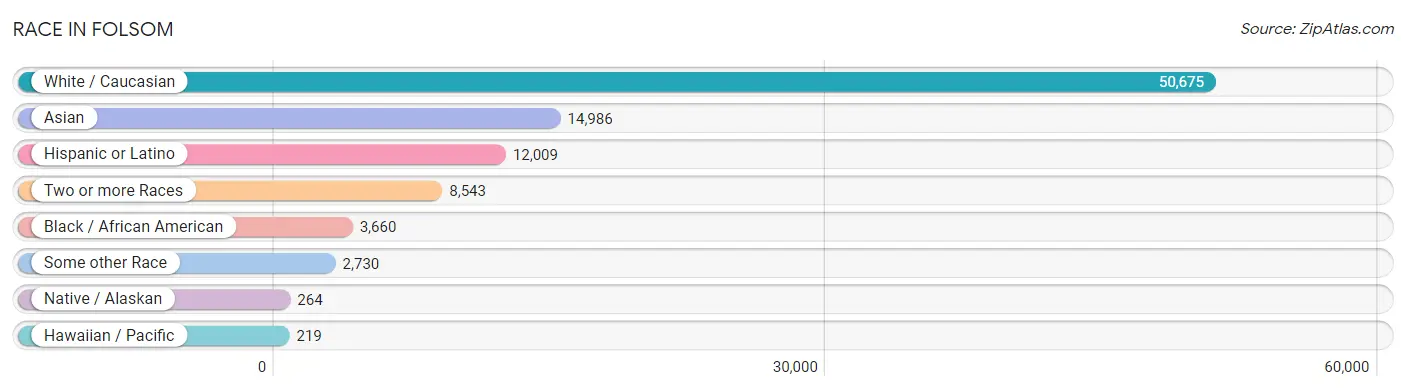
| Race | # Population | % Population |
| Asian | 14,986 | 18.5% |
| Black / African American | 3,660 | 4.5% |
| Hawaiian / Pacific | 219 | 0.3% |
| Hispanic or Latino | 12,009 | 14.8% |
| Native / Alaskan | 264 | 0.3% |
| White / Caucasian | 50,675 | 62.5% |
| Two or more Races | 8,543 | 10.5% |
| Some other Race | 2,730 | 3.4% |
| Total | 81,077 | 100.0% |
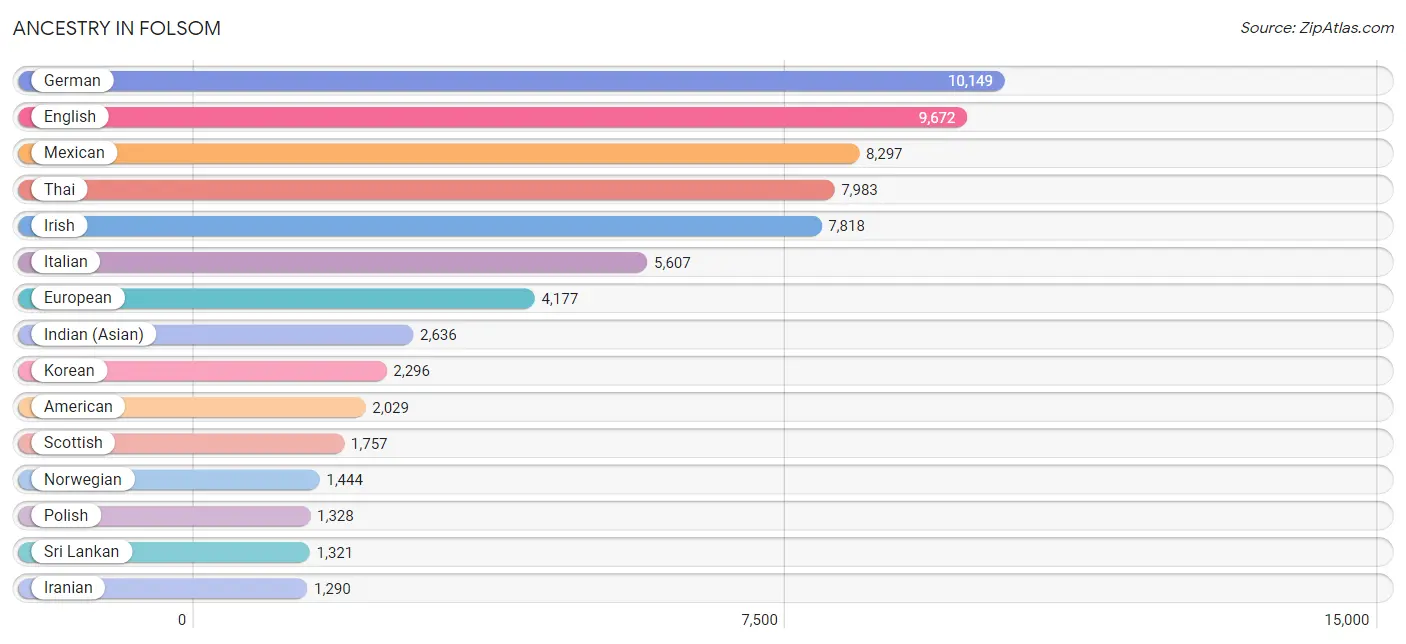
Ancestry in Folsom
The most populous ancestries reported in Folsom are German (10,149 | 12.5%), English (9,672 | 11.9%), Mexican (8,297 | 10.2%), Thai (7,983 | 9.9%), and Irish (7,818 | 9.6%), together accounting for 54.2% of all Folsom residents.
| Ancestry | # Population | % Population |
| Afghan | 77 | 0.1% |
| African | 213 | 0.3% |
| Alaska Native | 17 | 0.0% |
| Albanian | 10 | 0.0% |
| Aleut | 29 | 0.0% |
| American | 2,029 | 2.5% |
| Apache | 9 | 0.0% |
| Arab | 962 | 1.2% |
| Argentinean | 53 | 0.1% |
| Armenian | 157 | 0.2% |
| Assyrian / Chaldean / Syriac | 117 | 0.1% |
| Australian | 17 | 0.0% |
| Austrian | 158 | 0.2% |
| Bahamian | 22 | 0.0% |
| Bangladeshi | 8 | 0.0% |
| Basque | 23 | 0.0% |
| Belgian | 42 | 0.1% |
| Bhutanese | 1,168 | 1.4% |
| Blackfeet | 23 | 0.0% |
| Bolivian | 47 | 0.1% |
| Brazilian | 55 | 0.1% |
| British | 593 | 0.7% |
| Bulgarian | 8 | 0.0% |
| Burmese | 929 | 1.1% |
| Cajun | 48 | 0.1% |
| Canadian | 182 | 0.2% |
| Cape Verdean | 19 | 0.0% |
| Carpatho Rusyn | 4 | 0.0% |
| Celtic | 10 | 0.0% |
| Central American | 660 | 0.8% |
| Central American Indian | 61 | 0.1% |
| Cherokee | 341 | 0.4% |
| Chippewa | 26 | 0.0% |
| Choctaw | 42 | 0.1% |
| Colombian | 190 | 0.2% |
| Costa Rican | 138 | 0.2% |
| Croatian | 114 | 0.1% |
| Cuban | 24 | 0.0% |
| Czech | 122 | 0.2% |
| Czechoslovakian | 24 | 0.0% |
| Danish | 299 | 0.4% |
| Dutch | 601 | 0.7% |
| Dutch West Indian | 39 | 0.1% |
| Eastern European | 73 | 0.1% |
| Ecuadorian | 99 | 0.1% |
| Egyptian | 60 | 0.1% |
| English | 9,672 | 11.9% |
| Ethiopian | 9 | 0.0% |
| European | 4,177 | 5.1% |
| Filipino | 190 | 0.2% |
| Finnish | 71 | 0.1% |
| French | 1,212 | 1.5% |
| French Canadian | 151 | 0.2% |
| German | 10,149 | 12.5% |
| Ghanaian | 24 | 0.0% |
| Greek | 417 | 0.5% |
| Guamanian / Chamorro | 12 | 0.0% |
| Guatemalan | 119 | 0.2% |
| Honduran | 75 | 0.1% |
| Hungarian | 288 | 0.4% |
| Icelander | 3 | 0.0% |
| Indian (Asian) | 2,636 | 3.3% |
| Indonesian | 24 | 0.0% |
| Iranian | 1,290 | 1.6% |
| Irish | 7,818 | 9.6% |
| Iroquois | 6 | 0.0% |
| Italian | 5,607 | 6.9% |
| Jamaican | 58 | 0.1% |
| Japanese | 15 | 0.0% |
| Jordanian | 560 | 0.7% |
| Korean | 2,296 | 2.8% |
| Laotian | 114 | 0.1% |
| Lebanese | 231 | 0.3% |
| Lithuanian | 21 | 0.0% |
| Lumbee | 31 | 0.0% |
| Luxembourger | 8 | 0.0% |
| Macedonian | 17 | 0.0% |
| Malaysian | 70 | 0.1% |
| Maltese | 31 | 0.0% |
| Mexican | 8,297 | 10.2% |
| Mexican American Indian | 72 | 0.1% |
| Mongolian | 2 | 0.0% |
| Native Hawaiian | 83 | 0.1% |
| Navajo | 69 | 0.1% |
| Nicaraguan | 73 | 0.1% |
| Nigerian | 42 | 0.1% |
| Northern European | 279 | 0.3% |
| Norwegian | 1,444 | 1.8% |
| Paiute | 69 | 0.1% |
| Pakistani | 123 | 0.2% |
| Palestinian | 202 | 0.3% |
| Pennsylvania German | 6 | 0.0% |
| Peruvian | 127 | 0.2% |
| Polish | 1,328 | 1.6% |
| Portuguese | 1,070 | 1.3% |
| Pueblo | 37 | 0.1% |
| Puerto Rican | 826 | 1.0% |
| Romanian | 263 | 0.3% |
| Russian | 623 | 0.8% |
| Salvadoran | 255 | 0.3% |
| Samoan | 100 | 0.1% |
| Scandinavian | 381 | 0.5% |
| Scotch-Irish | 758 | 0.9% |
| Scottish | 1,757 | 2.2% |
| Serbian | 26 | 0.0% |
| Sioux | 63 | 0.1% |
| Slavic | 55 | 0.1% |
| Slovak | 44 | 0.1% |
| Slovene | 32 | 0.0% |
| South African | 37 | 0.1% |
| South American | 564 | 0.7% |
| Soviet Union | 51 | 0.1% |
| Spaniard | 591 | 0.7% |
| Spanish | 701 | 0.9% |
| Sri Lankan | 1,321 | 1.6% |
| Subsaharan African | 397 | 0.5% |
| Swedish | 1,143 | 1.4% |
| Swiss | 325 | 0.4% |
| Thai | 7,983 | 9.9% |
| Tlingit-Haida | 2 | 0.0% |
| Trinidadian and Tobagonian | 15 | 0.0% |
| Turkish | 102 | 0.1% |
| Ukrainian | 310 | 0.4% |
| Venezuelan | 48 | 0.1% |
| Vietnamese | 253 | 0.3% |
| Welsh | 442 | 0.5% |
| Yaqui | 33 | 0.0% |
| Yugoslavian | 106 | 0.1% | View All 128 Rows |
Immigrants in Folsom
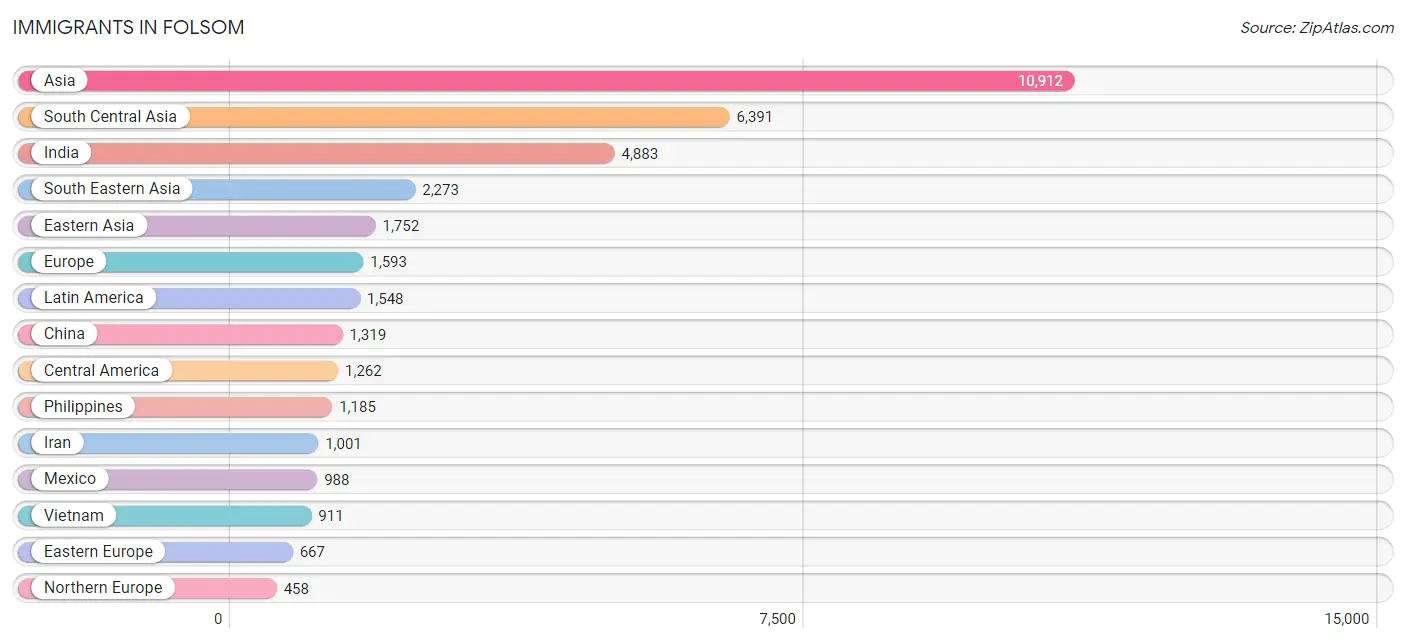
The most numerous immigrant groups reported in Folsom came from Asia (10,912 | 13.5%), South Central Asia (6,391 | 7.9%), India (4,883 | 6.0%), South Eastern Asia (2,273 | 2.8%), and Eastern Asia (1,752 | 2.2%), together accounting for 32.3% of all Folsom residents.
| Immigration Origin | # Population | % Population |
| Afghanistan | 73 | 0.1% |
| Africa | 322 | 0.4% |
| Argentina | 32 | 0.0% |
| Asia | 10,912 | 13.5% |
| Australia | 23 | 0.0% |
| Austria | 19 | 0.0% |
| Azores | 10 | 0.0% |
| Bangladesh | 189 | 0.2% |
| Brazil | 39 | 0.1% |
| Bulgaria | 8 | 0.0% |
| Cambodia | 5 | 0.0% |
| Canada | 415 | 0.5% |
| Caribbean | 88 | 0.1% |
| Central America | 1,262 | 1.6% |
| China | 1,319 | 1.6% |
| Colombia | 78 | 0.1% |
| Costa Rica | 30 | 0.0% |
| Croatia | 15 | 0.0% |
| Cuba | 20 | 0.0% |
| Czechoslovakia | 6 | 0.0% |
| Denmark | 29 | 0.0% |
| Eastern Africa | 161 | 0.2% |
| Eastern Asia | 1,752 | 2.2% |
| Eastern Europe | 667 | 0.8% |
| Egypt | 38 | 0.1% |
| El Salvador | 202 | 0.3% |
| England | 207 | 0.3% |
| Ethiopia | 9 | 0.0% |
| Europe | 1,593 | 2.0% |
| Fiji | 70 | 0.1% |
| France | 115 | 0.1% |
| Germany | 126 | 0.2% |
| Ghana | 24 | 0.0% |
| Guatemala | 15 | 0.0% |
| Hong Kong | 331 | 0.4% |
| Hungary | 18 | 0.0% |
| India | 4,883 | 6.0% |
| Indonesia | 61 | 0.1% |
| Iran | 1,001 | 1.2% |
| Iraq | 43 | 0.1% |
| Ireland | 47 | 0.1% |
| Israel | 8 | 0.0% |
| Italy | 78 | 0.1% |
| Jamaica | 44 | 0.1% |
| Japan | 126 | 0.2% |
| Jordan | 105 | 0.1% |
| Kazakhstan | 14 | 0.0% |
| Korea | 307 | 0.4% |
| Kuwait | 64 | 0.1% |
| Laos | 10 | 0.0% |
| Latin America | 1,548 | 1.9% |
| Lebanon | 83 | 0.1% |
| Lithuania | 2 | 0.0% |
| Malaysia | 48 | 0.1% |
| Mexico | 988 | 1.2% |
| Moldova | 184 | 0.2% |
| Netherlands | 38 | 0.1% |
| Nicaragua | 27 | 0.0% |
| Nigeria | 28 | 0.0% |
| Northern Africa | 38 | 0.1% |
| Northern Europe | 458 | 0.6% |
| Oceania | 101 | 0.1% |
| Pakistan | 53 | 0.1% |
| Peru | 27 | 0.0% |
| Philippines | 1,185 | 1.5% |
| Poland | 95 | 0.1% |
| Portugal | 25 | 0.0% |
| Romania | 43 | 0.1% |
| Russia | 91 | 0.1% |
| Scotland | 41 | 0.1% |
| Singapore | 6 | 0.0% |
| South Africa | 46 | 0.1% |
| South America | 198 | 0.2% |
| South Central Asia | 6,391 | 7.9% |
| South Eastern Asia | 2,273 | 2.8% |
| Southern Europe | 109 | 0.1% |
| Spain | 6 | 0.0% |
| Sri Lanka | 147 | 0.2% |
| Sweden | 39 | 0.1% |
| Switzerland | 61 | 0.1% |
| Taiwan | 285 | 0.4% |
| Thailand | 29 | 0.0% |
| Turkey | 116 | 0.1% |
| Ukraine | 121 | 0.2% |
| Uzbekistan | 31 | 0.0% |
| Venezuela | 22 | 0.0% |
| Vietnam | 911 | 1.1% |
| Western Africa | 77 | 0.1% |
| Western Asia | 423 | 0.5% |
| Western Europe | 359 | 0.4% |
| Zimbabwe | 152 | 0.2% | View All 91 Rows |
Sex and Age in Folsom
Sex and Age in Folsom
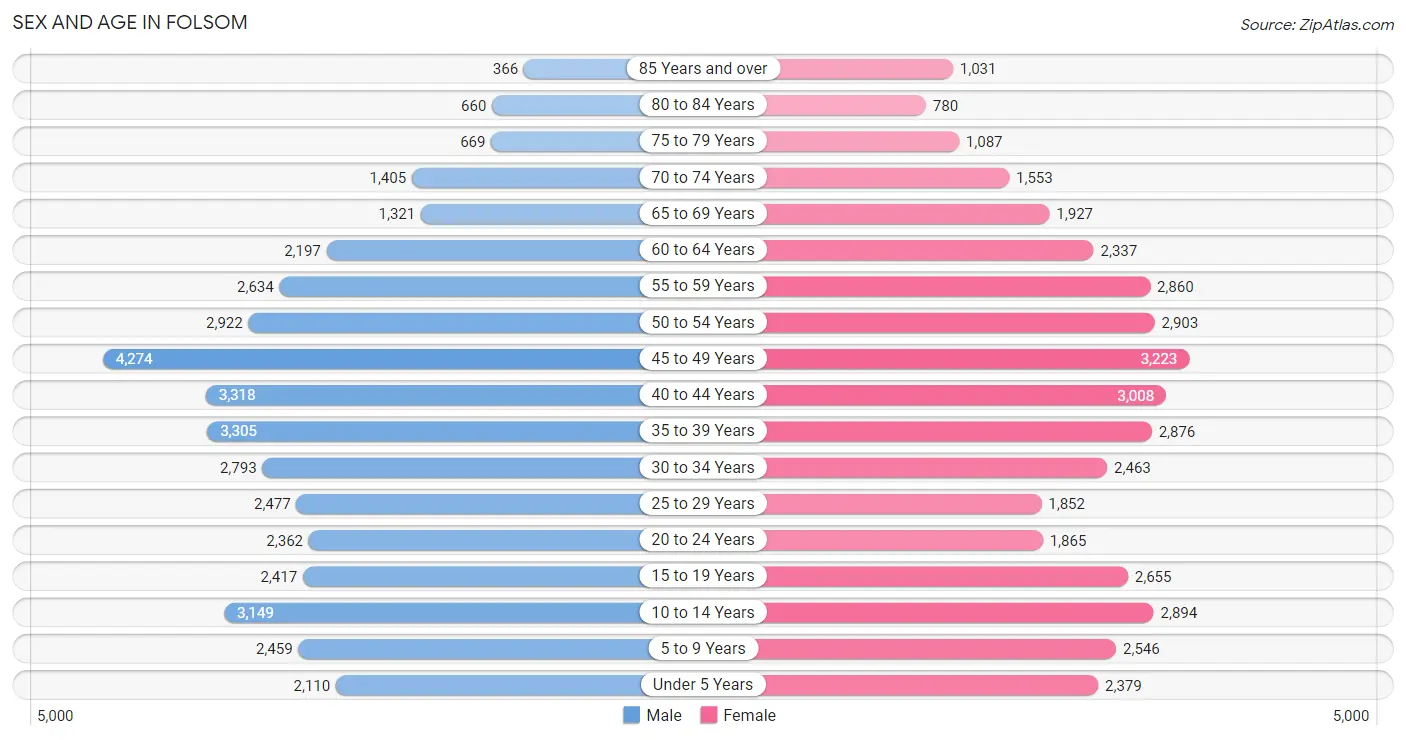
The most populous age groups in Folsom are 45 to 49 Years (4,274 | 10.5%) for men and 45 to 49 Years (3,223 | 8.0%) for women.
| Age Bracket | Male | Female |
| Under 5 Years | 2,110 (5.2%) | 2,379 (5.9%) |
| 5 to 9 Years | 2,459 (6.0%) | 2,546 (6.3%) |
| 10 to 14 Years | 3,149 (7.7%) | 2,894 (7.2%) |
| 15 to 19 Years | 2,417 (5.9%) | 2,655 (6.6%) |
| 20 to 24 Years | 2,362 (5.8%) | 1,865 (4.6%) |
| 25 to 29 Years | 2,477 (6.1%) | 1,852 (4.6%) |
| 30 to 34 Years | 2,793 (6.8%) | 2,463 (6.1%) |
| 35 to 39 Years | 3,305 (8.1%) | 2,876 (7.1%) |
| 40 to 44 Years | 3,318 (8.1%) | 3,008 (7.5%) |
| 45 to 49 Years | 4,274 (10.5%) | 3,223 (8.0%) |
| 50 to 54 Years | 2,922 (7.2%) | 2,903 (7.2%) |
| 55 to 59 Years | 2,634 (6.5%) | 2,860 (7.1%) |
| 60 to 64 Years | 2,197 (5.4%) | 2,337 (5.8%) |
| 65 to 69 Years | 1,321 (3.2%) | 1,927 (4.8%) |
| 70 to 74 Years | 1,405 (3.4%) | 1,553 (3.9%) |
| 75 to 79 Years | 669 (1.6%) | 1,087 (2.7%) |
| 80 to 84 Years | 660 (1.6%) | 780 (1.9%) |
| 85 Years and over | 366 (0.9%) | 1,031 (2.6%) |
| Total | 40,838 (100.0%) | 40,239 (100.0%) |
Families and Households in Folsom
Median Family Size in Folsom
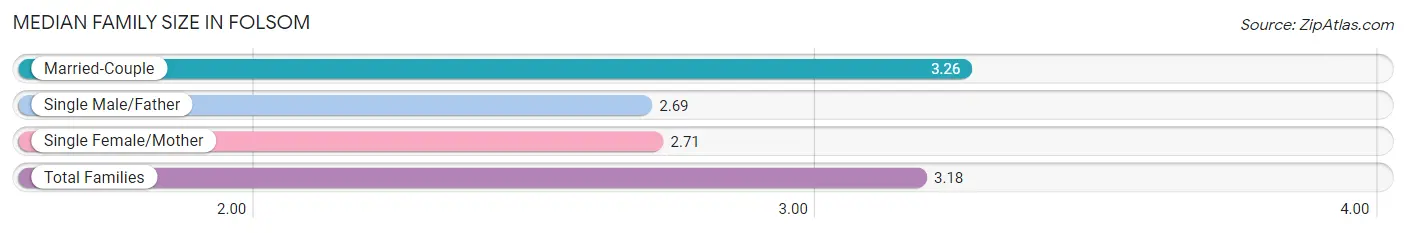
The median family size in Folsom is 3.18 persons per family, with married-couple families (17,250 | 84.6%) accounting for the largest median family size of 3.26 persons per family. On the other hand, single male/father families (1,104 | 5.4%) represent the smallest median family size with 2.69 persons per family.
| Family Type | # Families | Family Size |
| Married-Couple | 17,250 (84.6%) | 3.26 |
| Single Male/Father | 1,104 (5.4%) | 2.69 |
| Single Female/Mother | 2,049 (10.0%) | 2.71 |
| Total Families | 20,403 (100.0%) | 3.18 |
Median Household Size in Folsom
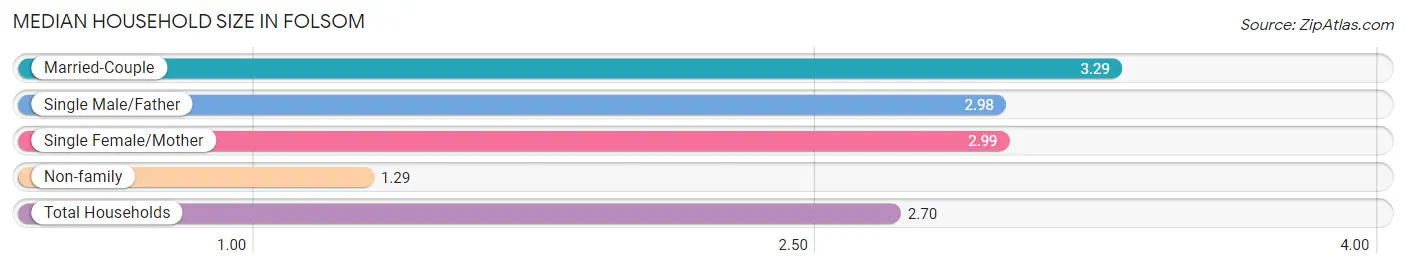
The median household size in Folsom is 2.70 persons per household, with married-couple households (17,250 | 61.0%) accounting for the largest median household size of 3.29 persons per household. non-family households (7,895 | 27.9%) represent the smallest median household size with 1.29 persons per household.
| Household Type | # Households | Household Size |
| Married-Couple | 17,250 (61.0%) | 3.29 |
| Single Male/Father | 1,104 (3.9%) | 2.98 |
| Single Female/Mother | 2,049 (7.2%) | 2.99 |
| Non-family | 7,895 (27.9%) | 1.29 |
| Total Households | 28,298 (100.0%) | 2.70 |
Household Size by Marriage Status in Folsom
Out of a total of 28,298 households in Folsom, 20,403 (72.1%) are family households, while 7,895 (27.9%) are nonfamily households. The most numerous type of family households are 2-person households, comprising 7,505, and the most common type of nonfamily households are 1-person households, comprising 6,299.
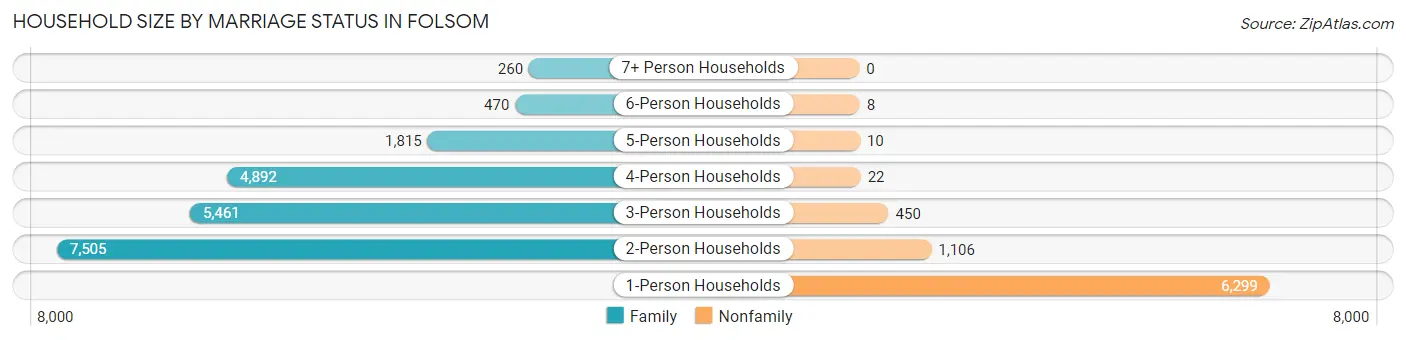
| Household Size | Family Households | Nonfamily Households |
| 1-Person Households | - | 6,299 (22.3%) |
| 2-Person Households | 7,505 (26.5%) | 1,106 (3.9%) |
| 3-Person Households | 5,461 (19.3%) | 450 (1.6%) |
| 4-Person Households | 4,892 (17.3%) | 22 (0.1%) |
| 5-Person Households | 1,815 (6.4%) | 10 (0.0%) |
| 6-Person Households | 470 (1.7%) | 8 (0.0%) |
| 7+ Person Households | 260 (0.9%) | 0 (0.0%) |
| Total | 20,403 (72.1%) | 7,895 (27.9%) |
Female Fertility in Folsom
Fertility by Age in Folsom
Average fertility rate in Folsom is 46.0 births per 1,000 women. Women in the age bracket of 20 to 34 years have the highest fertility rate with 72.0 births per 1,000 women. Women in the age bracket of 20 to 34 years acount for 51.4% of all women with births.
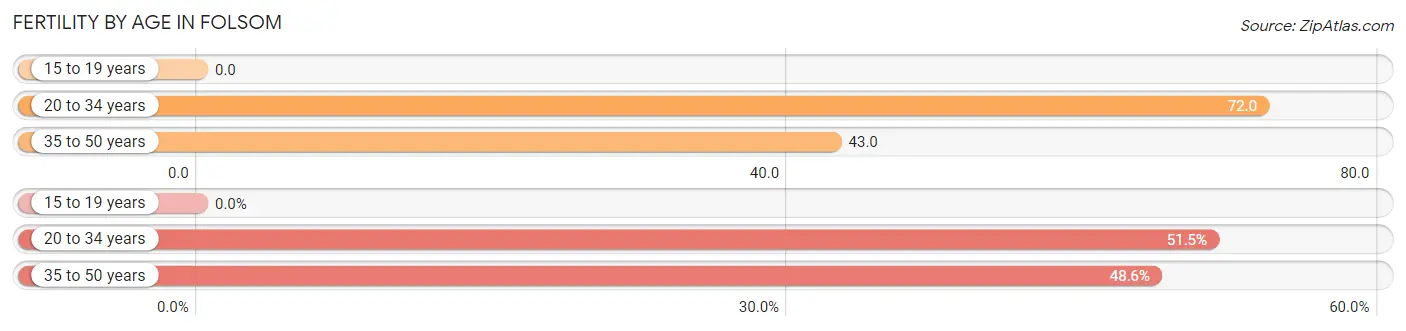
| Age Bracket | Women with Births | Births / 1,000 Women |
| 15 to 19 years | 0 (0.0%) | 0.0 |
| 20 to 34 years | 443 (51.4%) | 72.0 |
| 35 to 50 years | 418 (48.5%) | 43.0 |
| Total | 861 (100.0%) | 46.0 |
Fertility by Age by Marriage Status in Folsom
82.6% of women with births (861) in Folsom are married. The highest percentage of unmarried women with births falls into 20 to 34 years age bracket with 25.5% of them unmarried at the time of birth, while the lowest percentage of unmarried women with births belong to 35 to 50 years age bracket with 8.9% of them unmarried.
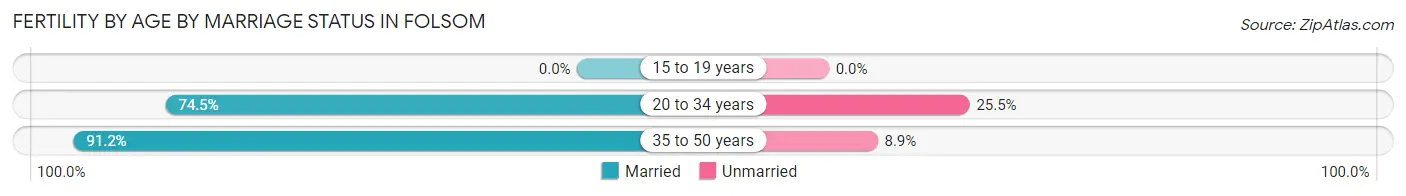
| Age Bracket | Married | Unmarried |
| 15 to 19 years | 0 (0.0%) | 0 (0.0%) |
| 20 to 34 years | 330 (74.5%) | 113 (25.5%) |
| 35 to 50 years | 381 (91.1%) | 37 (8.8%) |
| Total | 711 (82.6%) | 150 (17.4%) |
Fertility by Education in Folsom
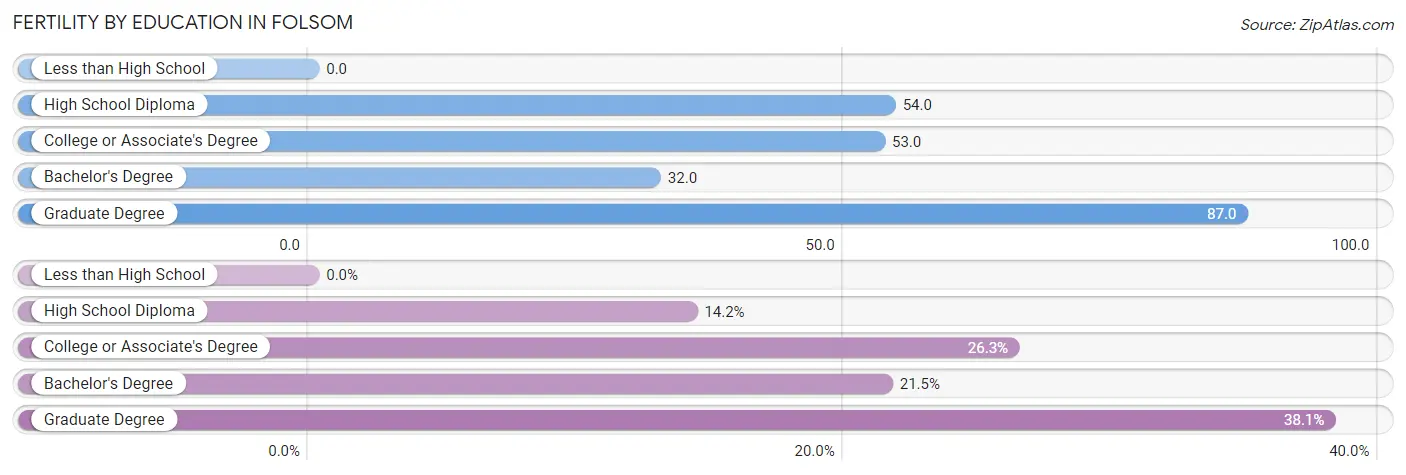
| Educational Attainment | Women with Births | Births / 1,000 Women |
| Less than High School | 0 (0.0%) | 0.0 |
| High School Diploma | 122 (14.2%) | 54.0 |
| College or Associate's Degree | 226 (26.3%) | 53.0 |
| Bachelor's Degree | 185 (21.5%) | 32.0 |
| Graduate Degree | 328 (38.1%) | 87.0 |
| Total | 861 (100.0%) | 46.0 |
Fertility by Education by Marriage Status in Folsom
17.4% of women with births in Folsom are unmarried. Women with the educational attainment of graduate degree are most likely to be married with 100.0% of them married at childbirth, while women with the educational attainment of high school diploma are least likely to be married with 42.6% of them unmarried at childbirth.
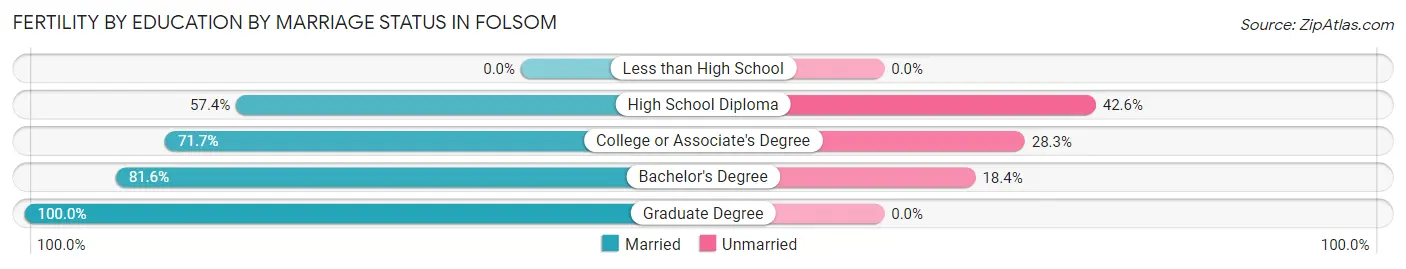
| Educational Attainment | Married | Unmarried |
| Less than High School | 0 (0.0%) | 0 (0.0%) |
| High School Diploma | 70 (57.4%) | 52 (42.6%) |
| College or Associate's Degree | 162 (71.7%) | 64 (28.3%) |
| Bachelor's Degree | 151 (81.6%) | 34 (18.4%) |
| Graduate Degree | 328 (100.0%) | 0 (0.0%) |
| Total | 711 (82.6%) | 150 (17.4%) |
Employment Characteristics in Folsom
Employment by Class of Employer in Folsom
Among the 37,508 employed individuals in Folsom, private company employees (22,486 | 60.0%), state government employees (4,031 | 10.7%), and not-for-profit organizations (3,268 | 8.7%) make up the most common classes of employment.
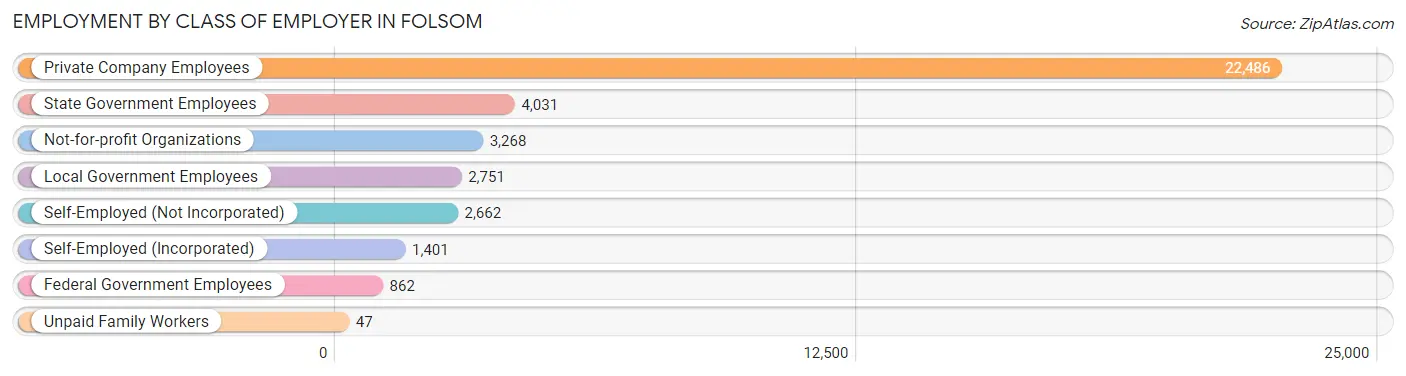
| Employer Class | # Employees | % Employees |
| Private Company Employees | 22,486 | 60.0% |
| Self-Employed (Incorporated) | 1,401 | 3.7% |
| Self-Employed (Not Incorporated) | 2,662 | 7.1% |
| Not-for-profit Organizations | 3,268 | 8.7% |
| Local Government Employees | 2,751 | 7.3% |
| State Government Employees | 4,031 | 10.7% |
| Federal Government Employees | 862 | 2.3% |
| Unpaid Family Workers | 47 | 0.1% |
| Total | 37,508 | 100.0% |
Employment Status by Age in Folsom
According to the labor force statistics for Folsom, out of the total population over 16 years of age (64,377), 62.4% or 40,171 individuals are in the labor force, with 5.0% or 2,009 of them unemployed. The age group with the highest labor force participation rate is 25 to 29 years, with 78.5% or 3,398 individuals in the labor force. Within the labor force, the 20 to 24 years age range has the highest percentage of unemployed individuals, with 9.1% or 257 of them being unemployed.
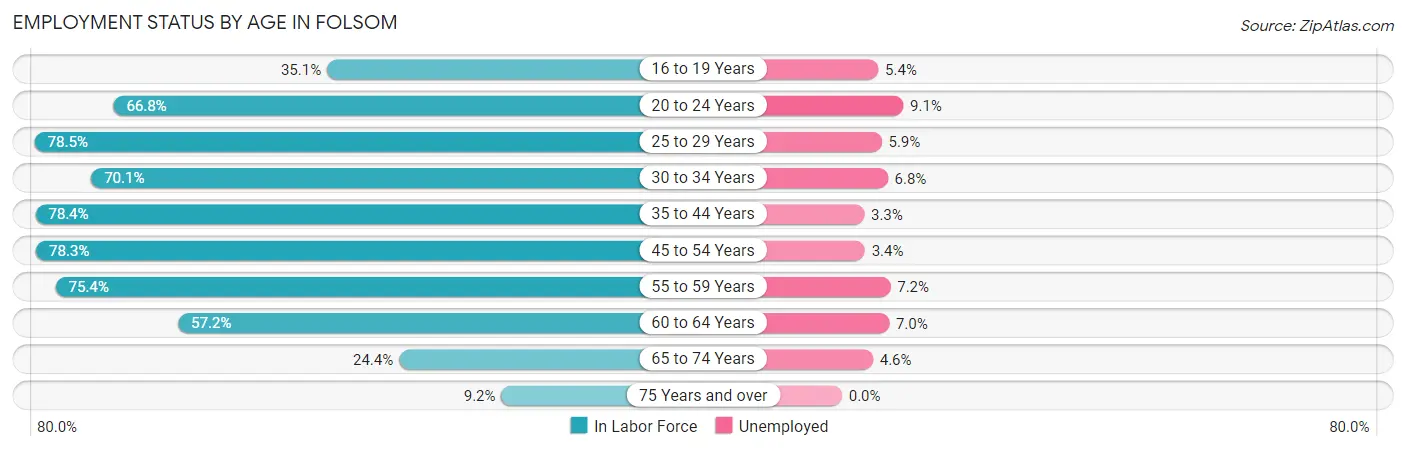
| Age Bracket | In Labor Force | Unemployed |
| 16 to 19 Years | 1,372 (35.1%) | 74 (5.4%) |
| 20 to 24 Years | 2,824 (66.8%) | 257 (9.1%) |
| 25 to 29 Years | 3,398 (78.5%) | 200 (5.9%) |
| 30 to 34 Years | 3,684 (70.1%) | 251 (6.8%) |
| 35 to 44 Years | 9,805 (78.4%) | 324 (3.3%) |
| 45 to 54 Years | 10,431 (78.3%) | 355 (3.4%) |
| 55 to 59 Years | 4,142 (75.4%) | 298 (7.2%) |
| 60 to 64 Years | 2,593 (57.2%) | 182 (7.0%) |
| 65 to 74 Years | 1,514 (24.4%) | 70 (4.6%) |
| 75 Years and over | 423 (9.2%) | 0 (0.0%) |
| Total | 40,171 (62.4%) | 2,009 (5.0%) |
Employment Status by Educational Attainment in Folsom
According to labor force statistics for Folsom, 74.9% of individuals (34,036) out of the total population between 25 and 64 years of age (45,442) are in the labor force, with 4.7% or 1,600 of them being unemployed. The group with the highest labor force participation rate are those with the educational attainment of bachelor's degree or higher, with 85.7% or 22,031 individuals in the labor force. Within the labor force, individuals with less than high school education have the highest percentage of unemployment, with 15.2% or 111 of them being unemployed.
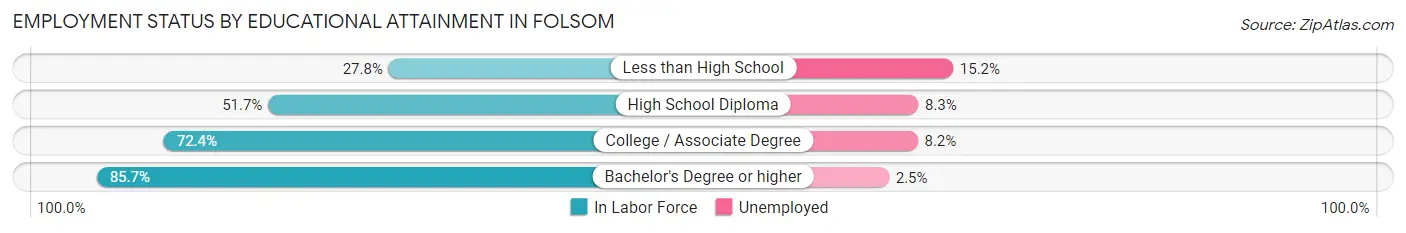
| Educational Attainment | In Labor Force | Unemployed |
| Less than High School | 731 (27.8%) | 400 (15.2%) |
| High School Diploma | 2,731 (51.7%) | 438 (8.3%) |
| College / Associate Degree | 8,558 (72.4%) | 969 (8.2%) |
| Bachelor's Degree or higher | 22,031 (85.7%) | 643 (2.5%) |
| Total | 34,036 (74.9%) | 2,136 (4.7%) |
Employment Occupations by Sex in Folsom
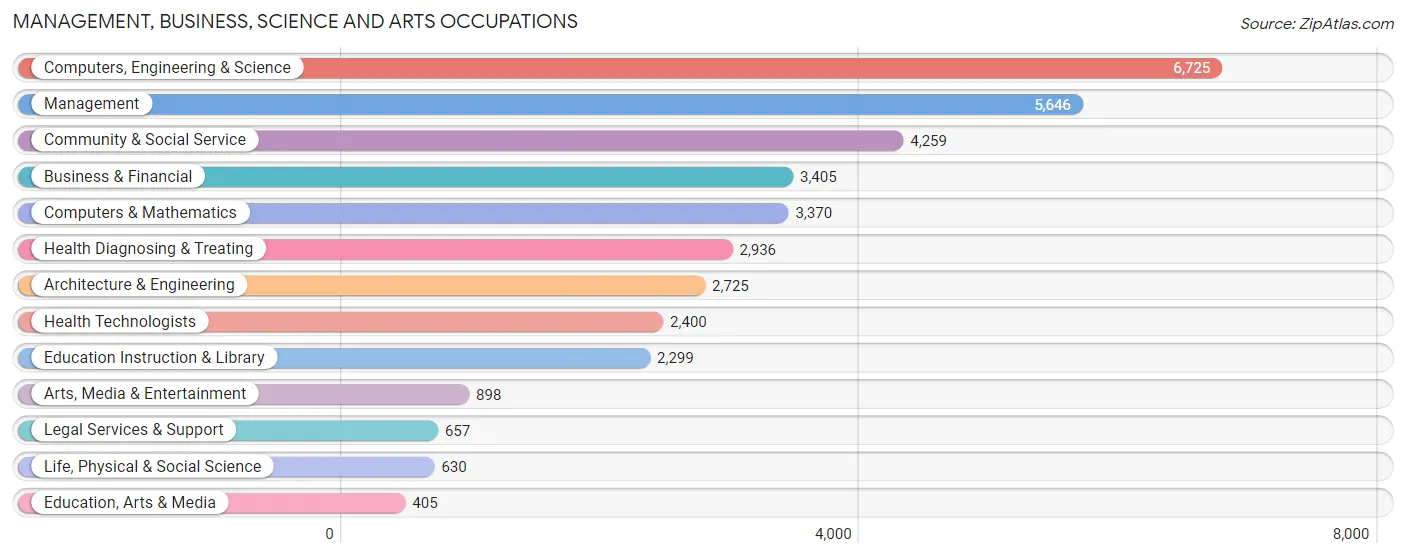
Management, Business, Science and Arts Occupations
The most common Management, Business, Science and Arts occupations in Folsom are Computers, Engineering & Science (6,725 | 17.6%), Management (5,646 | 14.8%), Community & Social Service (4,259 | 11.2%), Business & Financial (3,405 | 8.9%), and Computers & Mathematics (3,370 | 8.8%).
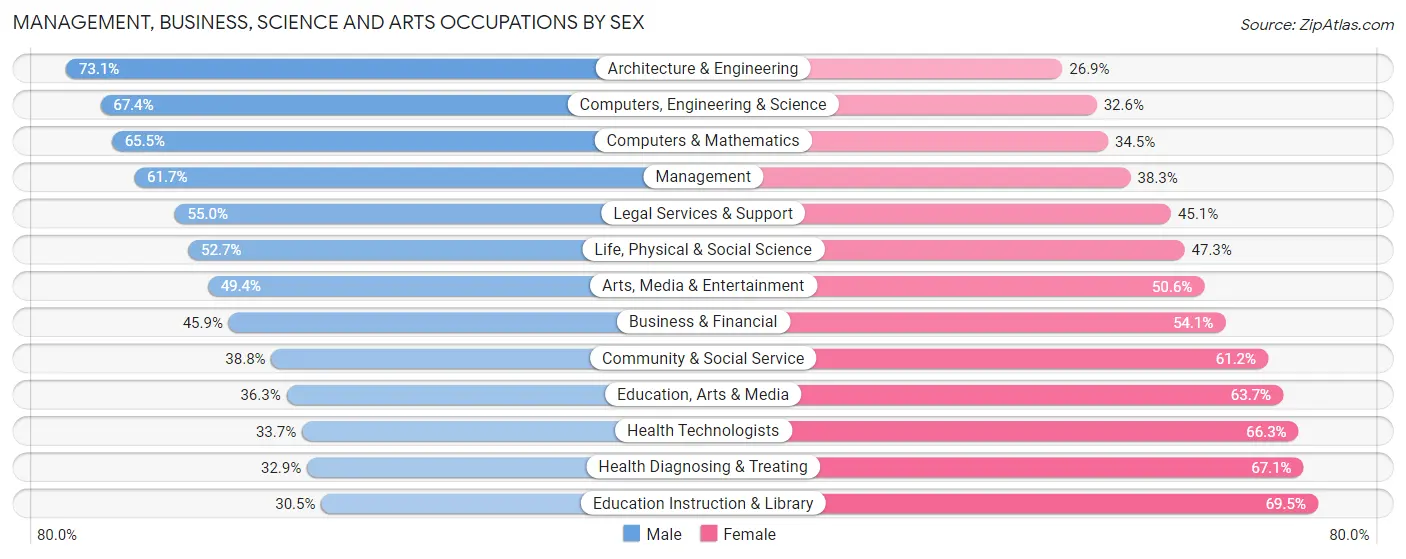
Management, Business, Science and Arts Occupations by Sex
Within the Management, Business, Science and Arts occupations in Folsom, the most male-oriented occupations are Architecture & Engineering (73.1%), Computers, Engineering & Science (67.4%), and Computers & Mathematics (65.5%), while the most female-oriented occupations are Education Instruction & Library (69.5%), Health Diagnosing & Treating (67.1%), and Health Technologists (66.3%).
| Occupation | Male | Female |
| Management | 3,484 (61.7%) | 2,162 (38.3%) |
| Business & Financial | 1,564 (45.9%) | 1,841 (54.1%) |
| Computers, Engineering & Science | 4,530 (67.4%) | 2,195 (32.6%) |
| Computers & Mathematics | 2,206 (65.5%) | 1,164 (34.5%) |
| Architecture & Engineering | 1,992 (73.1%) | 733 (26.9%) |
| Life, Physical & Social Science | 332 (52.7%) | 298 (47.3%) |
| Community & Social Service | 1,653 (38.8%) | 2,606 (61.2%) |
| Education, Arts & Media | 147 (36.3%) | 258 (63.7%) |
| Legal Services & Support | 361 (54.9%) | 296 (45.1%) |
| Education Instruction & Library | 701 (30.5%) | 1,598 (69.5%) |
| Arts, Media & Entertainment | 444 (49.4%) | 454 (50.6%) |
| Health Diagnosing & Treating | 965 (32.9%) | 1,971 (67.1%) |
| Health Technologists | 809 (33.7%) | 1,591 (66.3%) |
| Total (Category) | 12,196 (53.1%) | 10,775 (46.9%) |
| Total (Overall) | 20,526 (53.8%) | 17,642 (46.2%) |
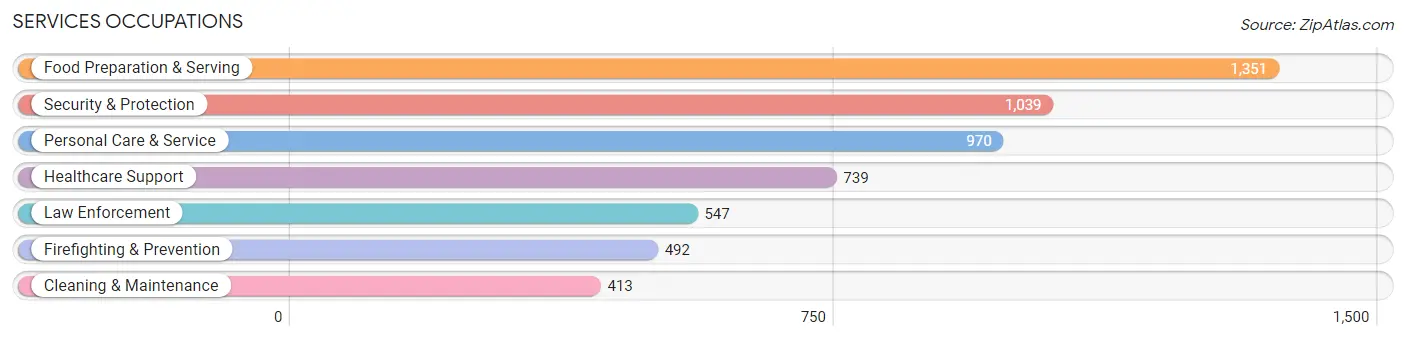
Services Occupations
The most common Services occupations in Folsom are Food Preparation & Serving (1,351 | 3.5%), Security & Protection (1,039 | 2.7%), Personal Care & Service (970 | 2.5%), Healthcare Support (739 | 1.9%), and Law Enforcement (547 | 1.4%).
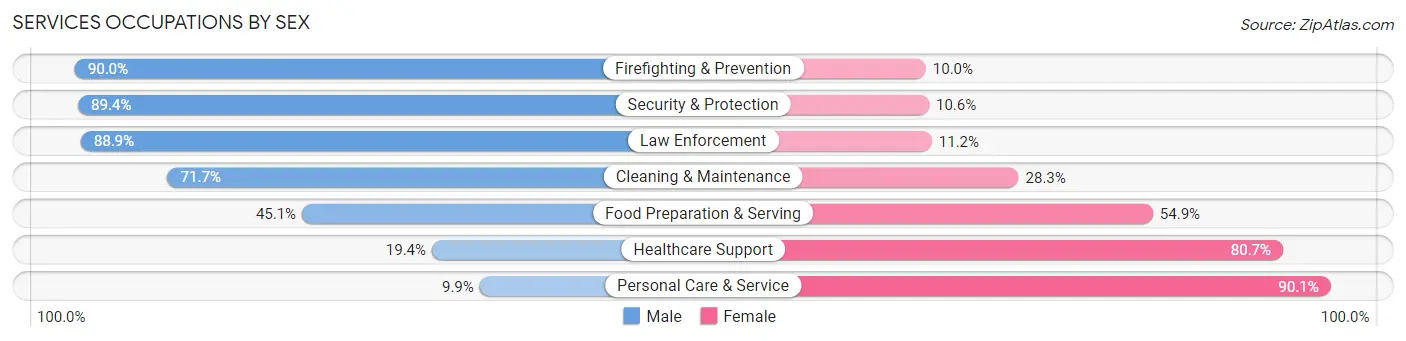
Services Occupations by Sex
Within the Services occupations in Folsom, the most male-oriented occupations are Firefighting & Prevention (90.0%), Security & Protection (89.4%), and Law Enforcement (88.8%), while the most female-oriented occupations are Personal Care & Service (90.1%), Healthcare Support (80.6%), and Food Preparation & Serving (54.9%).
| Occupation | Male | Female |
| Healthcare Support | 143 (19.4%) | 596 (80.6%) |
| Security & Protection | 929 (89.4%) | 110 (10.6%) |
| Firefighting & Prevention | 443 (90.0%) | 49 (10.0%) |
| Law Enforcement | 486 (88.8%) | 61 (11.2%) |
| Food Preparation & Serving | 609 (45.1%) | 742 (54.9%) |
| Cleaning & Maintenance | 296 (71.7%) | 117 (28.3%) |
| Personal Care & Service | 96 (9.9%) | 874 (90.1%) |
| Total (Category) | 2,073 (45.9%) | 2,439 (54.1%) |
| Total (Overall) | 20,526 (53.8%) | 17,642 (46.2%) |
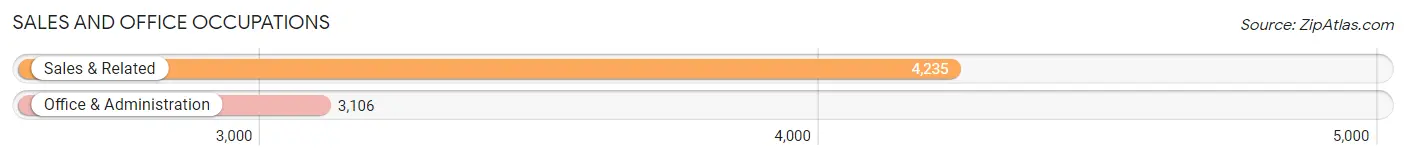
Sales and Office Occupations
The most common Sales and Office occupations in Folsom are Sales & Related (4,235 | 11.1%), and Office & Administration (3,106 | 8.1%).
Sales and Office Occupations by Sex
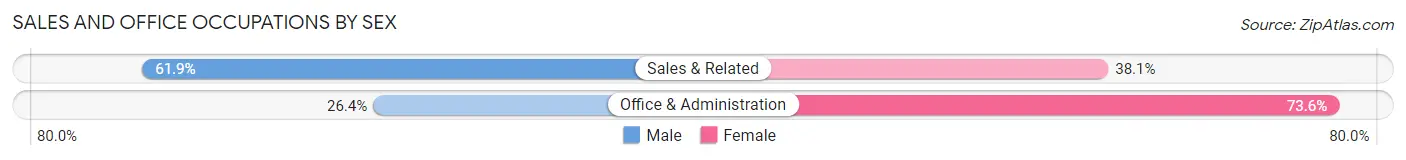
| Occupation | Male | Female |
| Sales & Related | 2,621 (61.9%) | 1,614 (38.1%) |
| Office & Administration | 820 (26.4%) | 2,286 (73.6%) |
| Total (Category) | 3,441 (46.9%) | 3,900 (53.1%) |
| Total (Overall) | 20,526 (53.8%) | 17,642 (46.2%) |
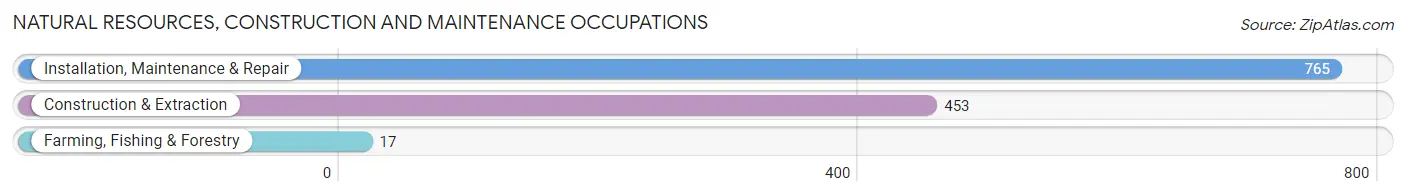
Natural Resources, Construction and Maintenance Occupations
The most common Natural Resources, Construction and Maintenance occupations in Folsom are Installation, Maintenance & Repair (765 | 2.0%), Construction & Extraction (453 | 1.2%), and Farming, Fishing & Forestry (17 | 0.0%).
Natural Resources, Construction and Maintenance Occupations by Sex
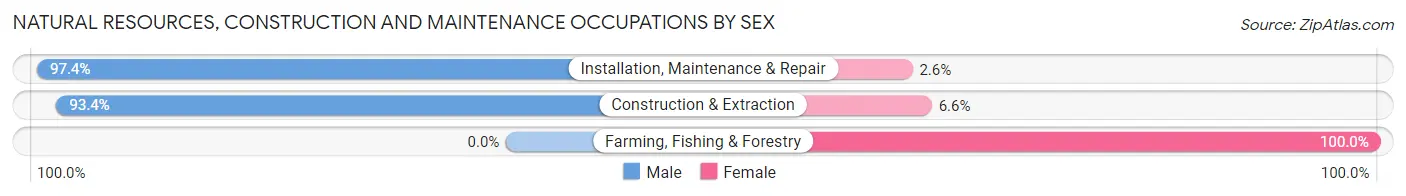
| Occupation | Male | Female |
| Farming, Fishing & Forestry | 0 (0.0%) | 17 (100.0%) |
| Construction & Extraction | 423 (93.4%) | 30 (6.6%) |
| Installation, Maintenance & Repair | 745 (97.4%) | 20 (2.6%) |
| Total (Category) | 1,168 (94.6%) | 67 (5.4%) |
| Total (Overall) | 20,526 (53.8%) | 17,642 (46.2%) |
Production, Transportation and Moving Occupations
The most common Production, Transportation and Moving occupations in Folsom are Material Moving (835 | 2.2%), Production (650 | 1.7%), and Transportation (624 | 1.6%).
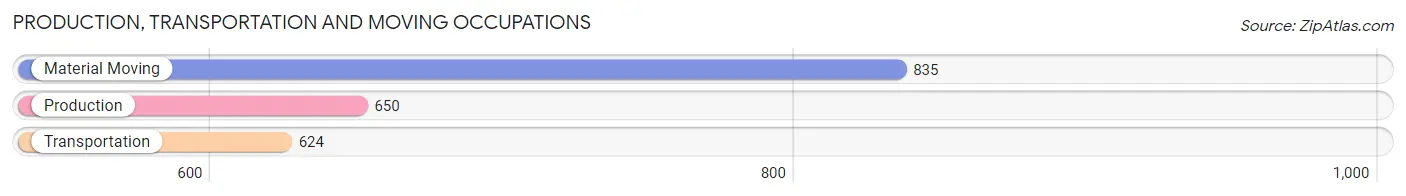
Production, Transportation and Moving Occupations by Sex
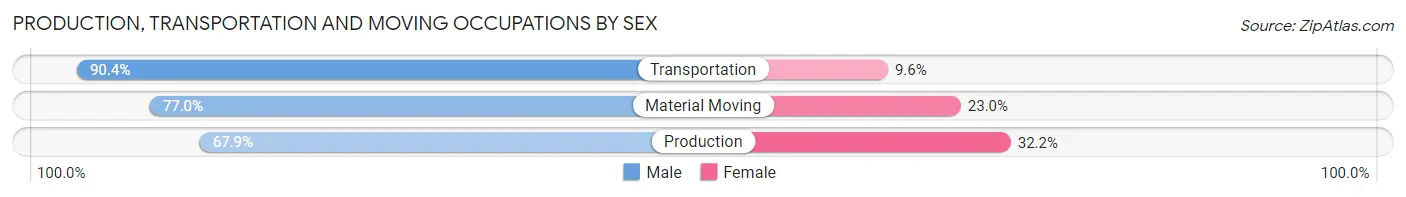
| Occupation | Male | Female |
| Production | 441 (67.8%) | 209 (32.2%) |
| Transportation | 564 (90.4%) | 60 (9.6%) |
| Material Moving | 643 (77.0%) | 192 (23.0%) |
| Total (Category) | 1,648 (78.1%) | 461 (21.9%) |
| Total (Overall) | 20,526 (53.8%) | 17,642 (46.2%) |
Employment Industries by Sex in Folsom
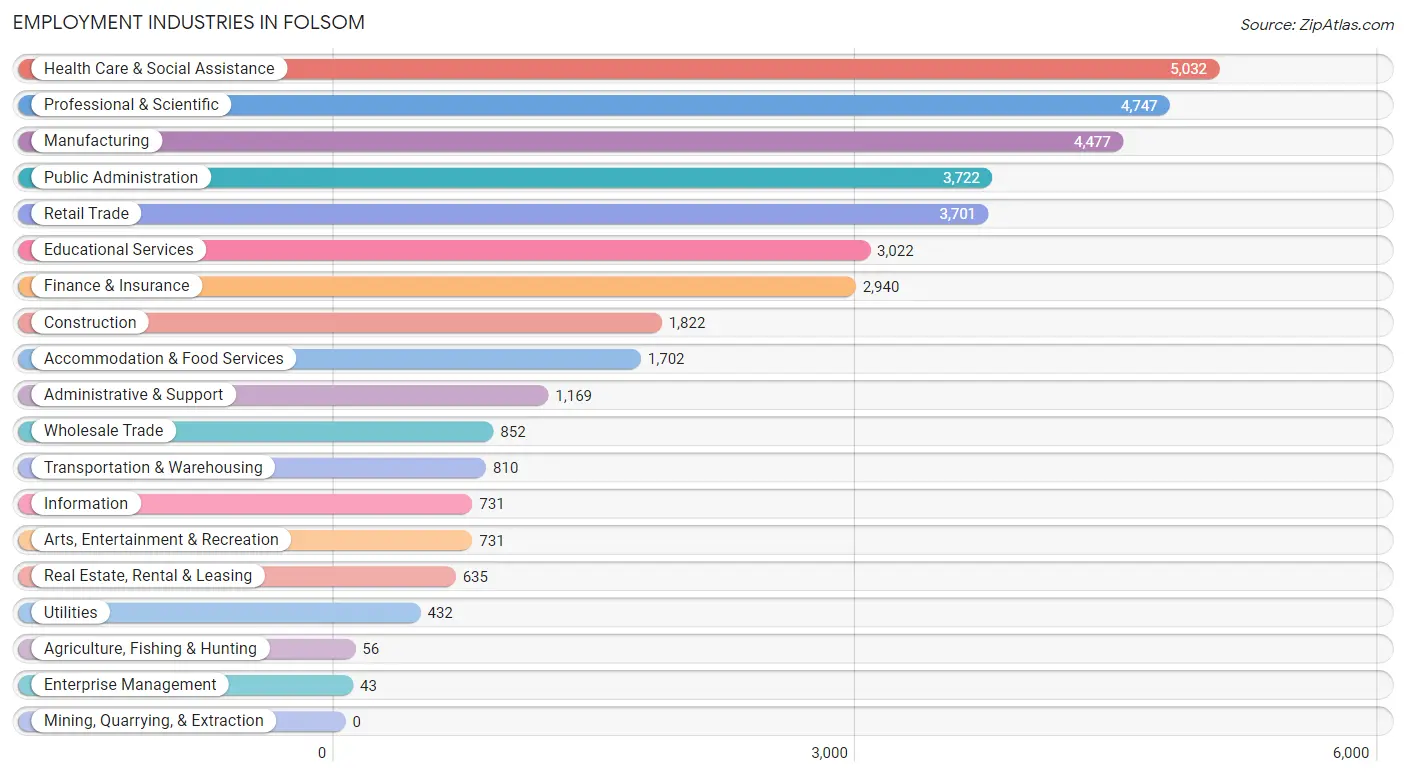
Employment Industries in Folsom
The major employment industries in Folsom include Health Care & Social Assistance (5,032 | 13.2%), Professional & Scientific (4,747 | 12.4%), Manufacturing (4,477 | 11.7%), Public Administration (3,722 | 9.8%), and Retail Trade (3,701 | 9.7%).
Employment Industries by Sex in Folsom
The Folsom industries that see more men than women are Transportation & Warehousing (79.4%), Construction (77.9%), and Manufacturing (71.3%), whereas the industries that tend to have a higher number of women are Enterprise Management (83.7%), Health Care & Social Assistance (71.9%), and Educational Services (65.8%).
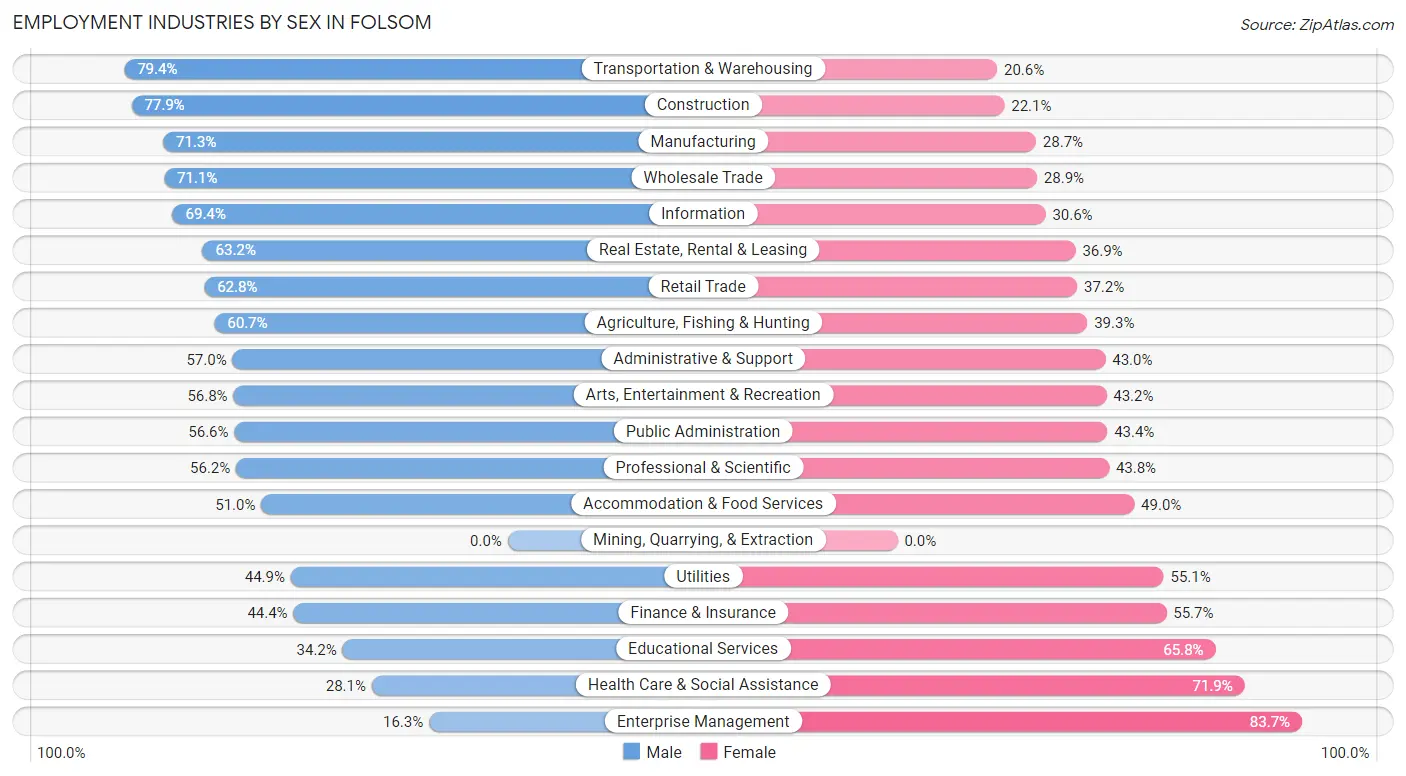
| Industry | Male | Female |
| Agriculture, Fishing & Hunting | 34 (60.7%) | 22 (39.3%) |
| Mining, Quarrying, & Extraction | 0 (0.0%) | 0 (0.0%) |
| Construction | 1,419 (77.9%) | 403 (22.1%) |
| Manufacturing | 3,194 (71.3%) | 1,283 (28.7%) |
| Wholesale Trade | 606 (71.1%) | 246 (28.9%) |
| Retail Trade | 2,325 (62.8%) | 1,376 (37.2%) |
| Transportation & Warehousing | 643 (79.4%) | 167 (20.6%) |
| Utilities | 194 (44.9%) | 238 (55.1%) |
| Information | 507 (69.4%) | 224 (30.6%) |
| Finance & Insurance | 1,304 (44.4%) | 1,636 (55.6%) |
| Real Estate, Rental & Leasing | 401 (63.1%) | 234 (36.8%) |
| Professional & Scientific | 2,669 (56.2%) | 2,078 (43.8%) |
| Enterprise Management | 7 (16.3%) | 36 (83.7%) |
| Administrative & Support | 666 (57.0%) | 503 (43.0%) |
| Educational Services | 1,033 (34.2%) | 1,989 (65.8%) |
| Health Care & Social Assistance | 1,416 (28.1%) | 3,616 (71.9%) |
| Arts, Entertainment & Recreation | 415 (56.8%) | 316 (43.2%) |
| Accommodation & Food Services | 868 (51.0%) | 834 (49.0%) |
| Public Administration | 2,106 (56.6%) | 1,616 (43.4%) |
| Total | 20,526 (53.8%) | 17,642 (46.2%) |
Education in Folsom
School Enrollment in Folsom
The most common levels of schooling among the 21,180 students in Folsom are high school (4,815 | 22.7%), elementary school (4,500 | 21.2%), and middle school (4,388 | 20.7%).
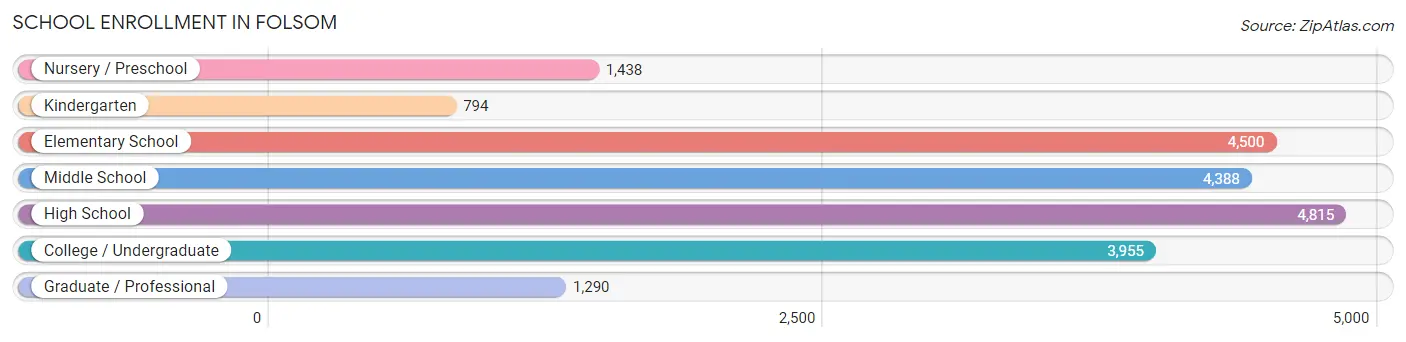
| School Level | # Students | % Students |
| Nursery / Preschool | 1,438 | 6.8% |
| Kindergarten | 794 | 3.7% |
| Elementary School | 4,500 | 21.2% |
| Middle School | 4,388 | 20.7% |
| High School | 4,815 | 22.7% |
| College / Undergraduate | 3,955 | 18.7% |
| Graduate / Professional | 1,290 | 6.1% |
| Total | 21,180 | 100.0% |
School Enrollment by Age by Funding Source in Folsom
Out of a total of 21,180 students who are enrolled in schools in Folsom, 2,753 (13.0%) attend a private institution, while the remaining 18,427 (87.0%) are enrolled in public schools. The age group of 3 to 4 year olds has the highest likelihood of being enrolled in private schools, with 673 (52.5% in the age bracket) enrolled. Conversely, the age group of 15 to 17 year olds has the lowest likelihood of being enrolled in a private school, with 3,194 (96.2% in the age bracket) attending a public institution.
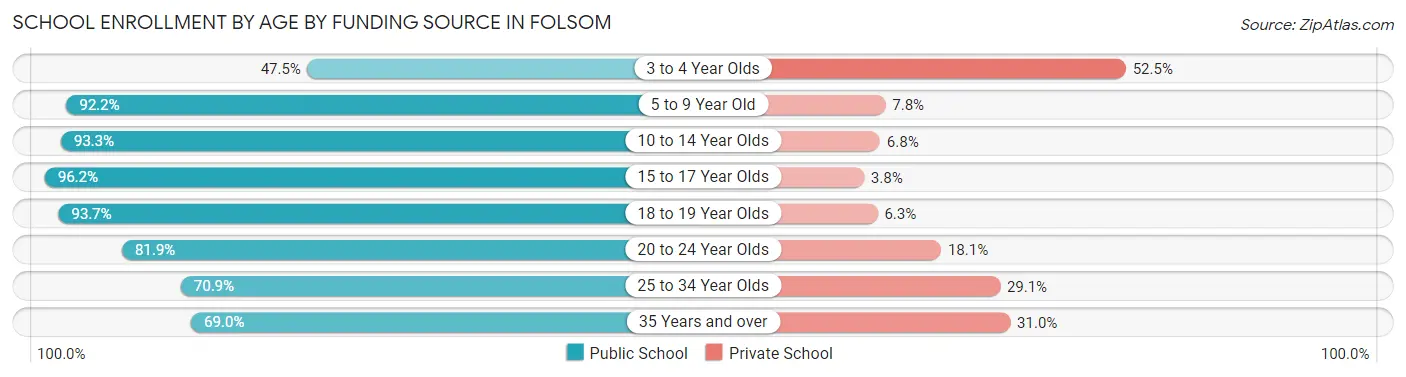
| Age Bracket | Public School | Private School |
| 3 to 4 Year Olds | 608 (47.5%) | 673 (52.5%) |
| 5 to 9 Year Old | 4,475 (92.2%) | 377 (7.8%) |
| 10 to 14 Year Olds | 5,459 (93.2%) | 395 (6.8%) |
| 15 to 17 Year Olds | 3,194 (96.2%) | 125 (3.8%) |
| 18 to 19 Year Olds | 1,412 (93.7%) | 95 (6.3%) |
| 20 to 24 Year Olds | 1,581 (81.9%) | 350 (18.1%) |
| 25 to 34 Year Olds | 728 (70.9%) | 299 (29.1%) |
| 35 Years and over | 972 (69.0%) | 437 (31.0%) |
| Total | 18,427 (87.0%) | 2,753 (13.0%) |
Educational Attainment by Field of Study in Folsom
Engineering (5,573 | 17.2%), business (5,520 | 17.0%), social sciences (2,679 | 8.3%), bio, nature & agricultural (2,552 | 7.9%), and science & technology (2,526 | 7.8%) are the most common fields of study among 32,439 individuals in Folsom who have obtained a bachelor's degree or higher.
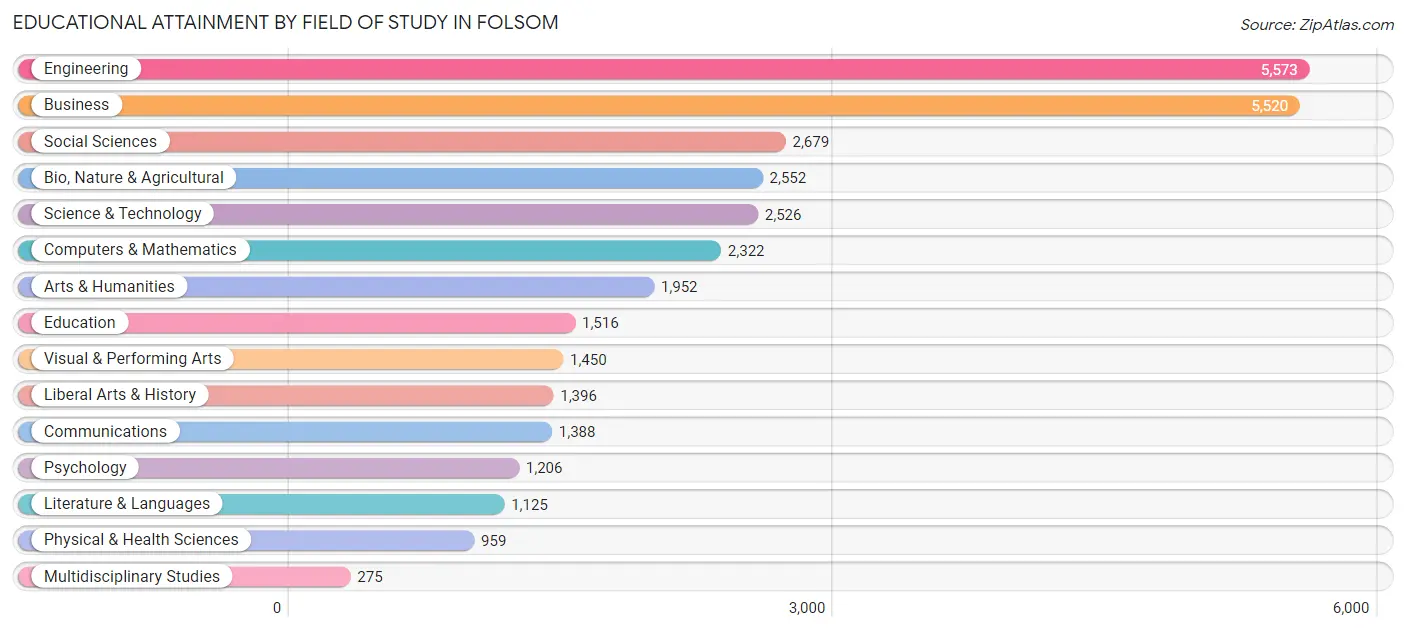
| Field of Study | # Graduates | % Graduates |
| Computers & Mathematics | 2,322 | 7.2% |
| Bio, Nature & Agricultural | 2,552 | 7.9% |
| Physical & Health Sciences | 959 | 3.0% |
| Psychology | 1,206 | 3.7% |
| Social Sciences | 2,679 | 8.3% |
| Engineering | 5,573 | 17.2% |
| Multidisciplinary Studies | 275 | 0.9% |
| Science & Technology | 2,526 | 7.8% |
| Business | 5,520 | 17.0% |
| Education | 1,516 | 4.7% |
| Literature & Languages | 1,125 | 3.5% |
| Liberal Arts & History | 1,396 | 4.3% |
| Visual & Performing Arts | 1,450 | 4.5% |
| Communications | 1,388 | 4.3% |
| Arts & Humanities | 1,952 | 6.0% |
| Total | 32,439 | 100.0% |
Transportation & Commute in Folsom
Vehicle Availability by Sex in Folsom
The most prevalent vehicle ownership categories in Folsom are males with 2 vehicles (9,169, accounting for 45.4%) and females with 2 vehicles (7,616, making up 53.0%).
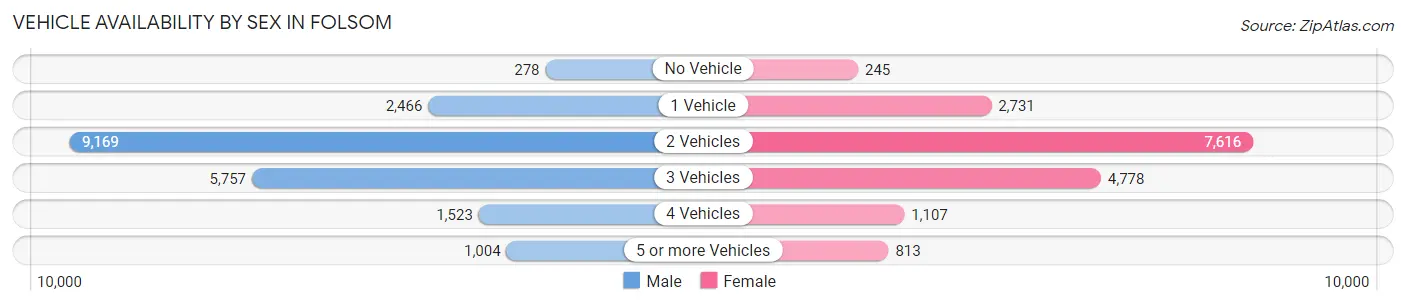
| Vehicles Available | Male | Female |
| No Vehicle | 278 (1.4%) | 245 (1.4%) |
| 1 Vehicle | 2,466 (12.2%) | 2,731 (15.8%) |
| 2 Vehicles | 9,169 (45.4%) | 7,616 (44.1%) |
| 3 Vehicles | 5,757 (28.5%) | 4,778 (27.6%) |
| 4 Vehicles | 1,523 (7.5%) | 1,107 (6.4%) |
| 5 or more Vehicles | 1,004 (5.0%) | 813 (4.7%) |
| Total | 20,197 (100.0%) | 17,290 (100.0%) |
Commute Time in Folsom
The most frequently occuring commute durations in Folsom are 20 to 24 minutes (4,273 commuters, 15.4%), 10 to 14 minutes (4,129 commuters, 14.8%), and 15 to 19 minutes (3,602 commuters, 13.0%).
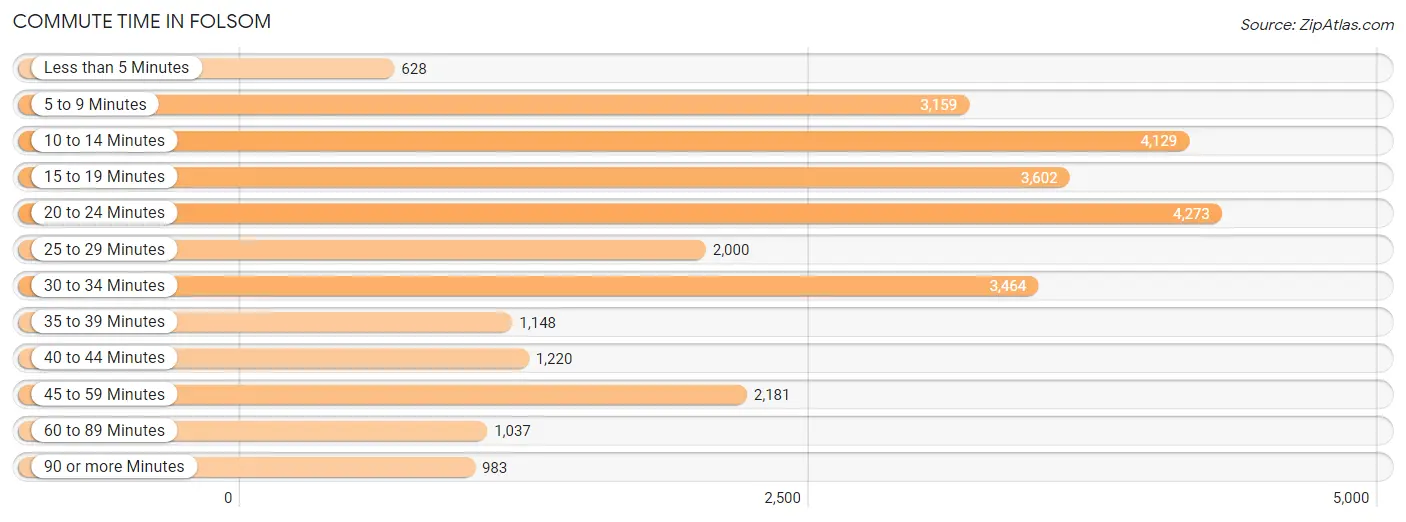
| Commute Time | # Commuters | % Commuters |
| Less than 5 Minutes | 628 | 2.3% |
| 5 to 9 Minutes | 3,159 | 11.4% |
| 10 to 14 Minutes | 4,129 | 14.8% |
| 15 to 19 Minutes | 3,602 | 13.0% |
| 20 to 24 Minutes | 4,273 | 15.4% |
| 25 to 29 Minutes | 2,000 | 7.2% |
| 30 to 34 Minutes | 3,464 | 12.4% |
| 35 to 39 Minutes | 1,148 | 4.1% |
| 40 to 44 Minutes | 1,220 | 4.4% |
| 45 to 59 Minutes | 2,181 | 7.8% |
| 60 to 89 Minutes | 1,037 | 3.7% |
| 90 or more Minutes | 983 | 3.5% |
Commute Time by Sex in Folsom
The most common commute times in Folsom are 20 to 24 minutes (2,526 commuters, 16.6%) for males and 10 to 14 minutes (1,943 commuters, 15.4%) for females.
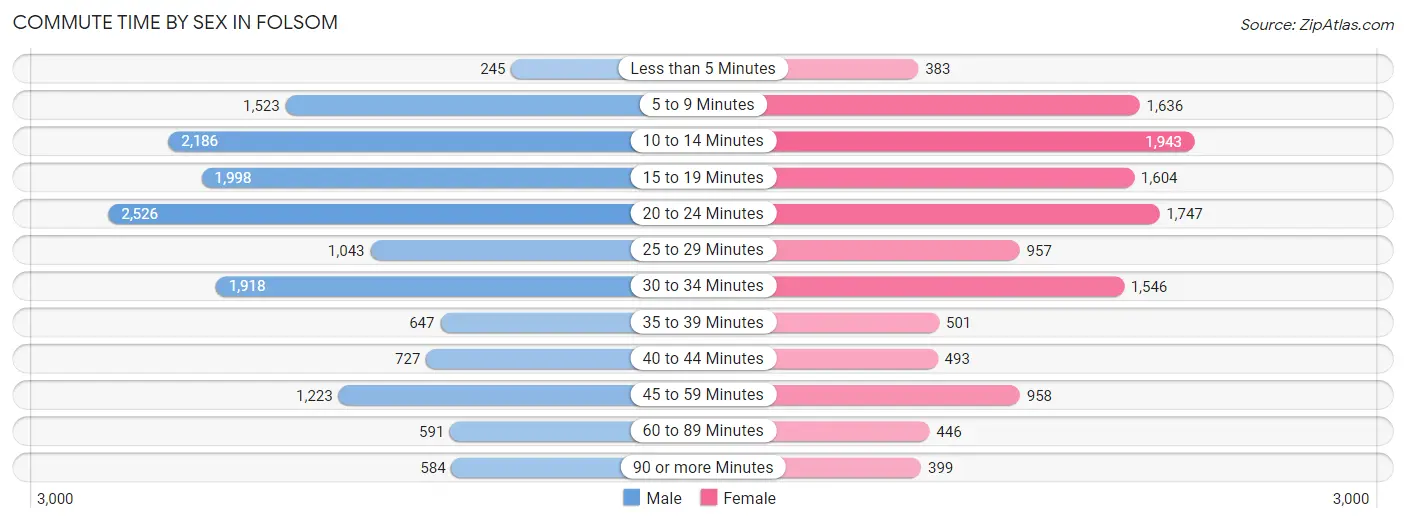
| Commute Time | Male | Female |
| Less than 5 Minutes | 245 (1.6%) | 383 (3.0%) |
| 5 to 9 Minutes | 1,523 (10.0%) | 1,636 (13.0%) |
| 10 to 14 Minutes | 2,186 (14.4%) | 1,943 (15.4%) |
| 15 to 19 Minutes | 1,998 (13.1%) | 1,604 (12.7%) |
| 20 to 24 Minutes | 2,526 (16.6%) | 1,747 (13.9%) |
| 25 to 29 Minutes | 1,043 (6.9%) | 957 (7.6%) |
| 30 to 34 Minutes | 1,918 (12.6%) | 1,546 (12.3%) |
| 35 to 39 Minutes | 647 (4.3%) | 501 (4.0%) |
| 40 to 44 Minutes | 727 (4.8%) | 493 (3.9%) |
| 45 to 59 Minutes | 1,223 (8.0%) | 958 (7.6%) |
| 60 to 89 Minutes | 591 (3.9%) | 446 (3.5%) |
| 90 or more Minutes | 584 (3.8%) | 399 (3.2%) |
Time of Departure to Work by Sex in Folsom
The most frequent times of departure to work in Folsom are 7:00 AM to 7:29 AM (2,095, 13.8%) for males and 8:00 AM to 8:29 AM (2,113, 16.8%) for females.
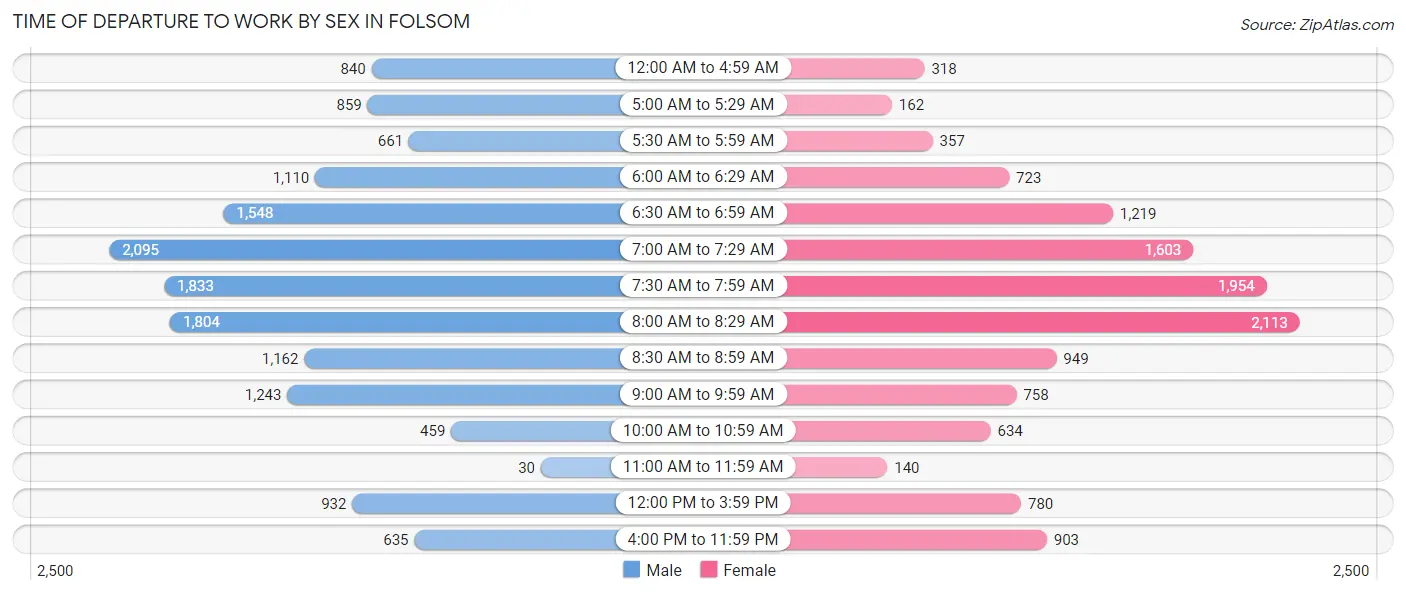
| Time of Departure | Male | Female |
| 12:00 AM to 4:59 AM | 840 (5.5%) | 318 (2.5%) |
| 5:00 AM to 5:29 AM | 859 (5.7%) | 162 (1.3%) |
| 5:30 AM to 5:59 AM | 661 (4.3%) | 357 (2.8%) |
| 6:00 AM to 6:29 AM | 1,110 (7.3%) | 723 (5.7%) |
| 6:30 AM to 6:59 AM | 1,548 (10.2%) | 1,219 (9.7%) |
| 7:00 AM to 7:29 AM | 2,095 (13.8%) | 1,603 (12.7%) |
| 7:30 AM to 7:59 AM | 1,833 (12.0%) | 1,954 (15.5%) |
| 8:00 AM to 8:29 AM | 1,804 (11.9%) | 2,113 (16.8%) |
| 8:30 AM to 8:59 AM | 1,162 (7.6%) | 949 (7.5%) |
| 9:00 AM to 9:59 AM | 1,243 (8.2%) | 758 (6.0%) |
| 10:00 AM to 10:59 AM | 459 (3.0%) | 634 (5.0%) |
| 11:00 AM to 11:59 AM | 30 (0.2%) | 140 (1.1%) |
| 12:00 PM to 3:59 PM | 932 (6.1%) | 780 (6.2%) |
| 4:00 PM to 11:59 PM | 635 (4.2%) | 903 (7.2%) |
| Total | 15,211 (100.0%) | 12,613 (100.0%) |
Housing Occupancy in Folsom
Occupancy by Ownership in Folsom
Of the total 28,298 dwellings in Folsom, owner-occupied units account for 19,579 (69.2%), while renter-occupied units make up 8,719 (30.8%).
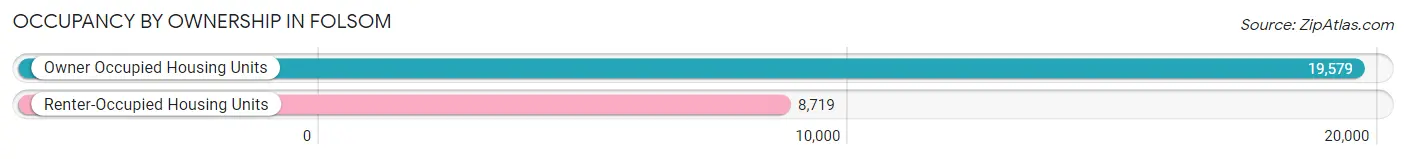
| Occupancy | # Housing Units | % Housing Units |
| Owner Occupied Housing Units | 19,579 | 69.2% |
| Renter-Occupied Housing Units | 8,719 | 30.8% |
| Total Occupied Housing Units | 28,298 | 100.0% |
Occupancy by Household Size in Folsom
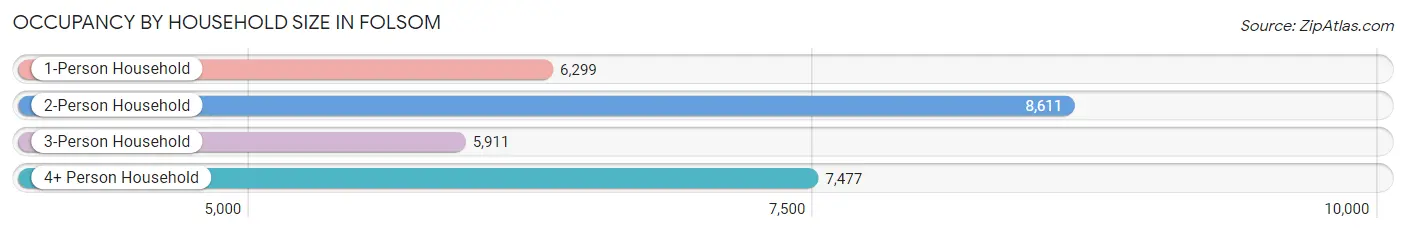
| Household Size | # Housing Units | % Housing Units |
| 1-Person Household | 6,299 | 22.3% |
| 2-Person Household | 8,611 | 30.4% |
| 3-Person Household | 5,911 | 20.9% |
| 4+ Person Household | 7,477 | 26.4% |
| Total Housing Units | 28,298 | 100.0% |
Occupancy by Ownership by Household Size in Folsom
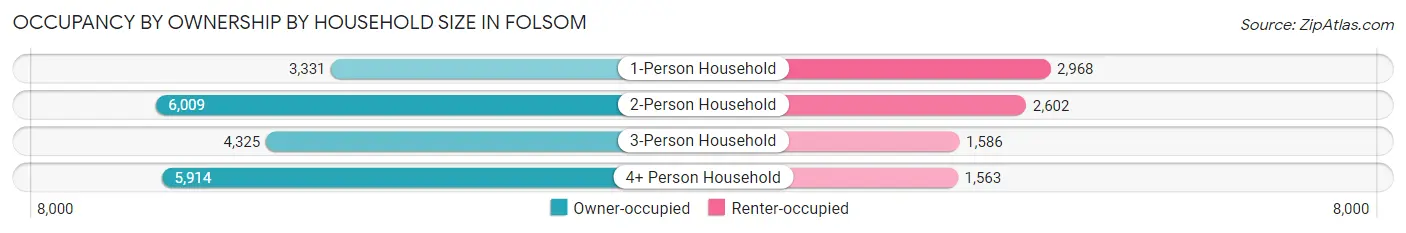
| Household Size | Owner-occupied | Renter-occupied |
| 1-Person Household | 3,331 (52.9%) | 2,968 (47.1%) |
| 2-Person Household | 6,009 (69.8%) | 2,602 (30.2%) |
| 3-Person Household | 4,325 (73.2%) | 1,586 (26.8%) |
| 4+ Person Household | 5,914 (79.1%) | 1,563 (20.9%) |
| Total Housing Units | 19,579 (69.2%) | 8,719 (30.8%) |
Occupancy by Educational Attainment in Folsom
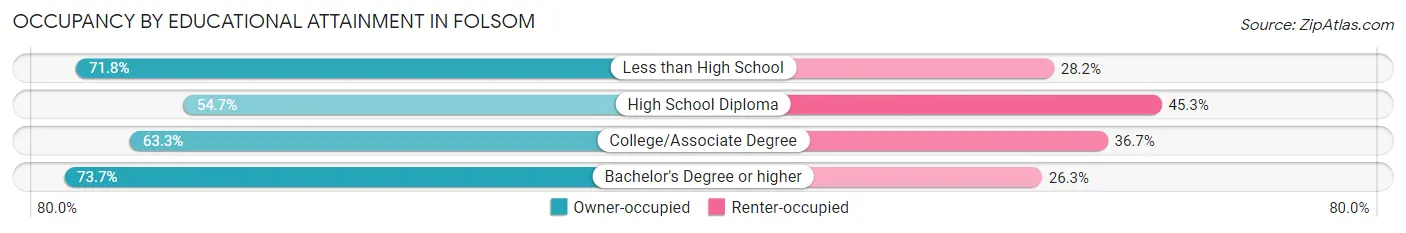
| Household Size | Owner-occupied | Renter-occupied |
| Less than High School | 329 (71.8%) | 129 (28.2%) |
| High School Diploma | 1,373 (54.7%) | 1,135 (45.3%) |
| College/Associate Degree | 4,835 (63.3%) | 2,805 (36.7%) |
| Bachelor's Degree or higher | 13,042 (73.7%) | 4,650 (26.3%) |
Occupancy by Age of Householder in Folsom
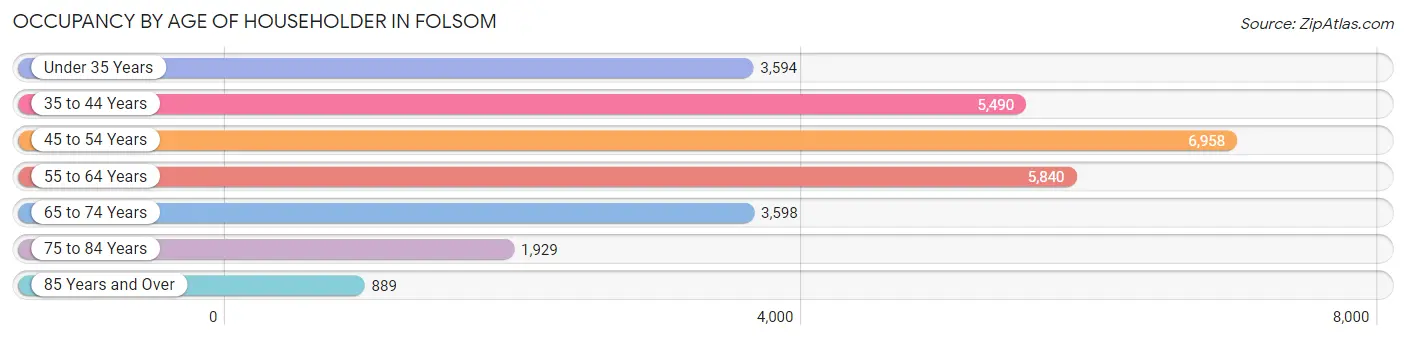
| Age Bracket | # Households | % Households |
| Under 35 Years | 3,594 | 12.7% |
| 35 to 44 Years | 5,490 | 19.4% |
| 45 to 54 Years | 6,958 | 24.6% |
| 55 to 64 Years | 5,840 | 20.6% |
| 65 to 74 Years | 3,598 | 12.7% |
| 75 to 84 Years | 1,929 | 6.8% |
| 85 Years and Over | 889 | 3.1% |
| Total | 28,298 | 100.0% |
Housing Finances in Folsom
Median Income by Occupancy in Folsom
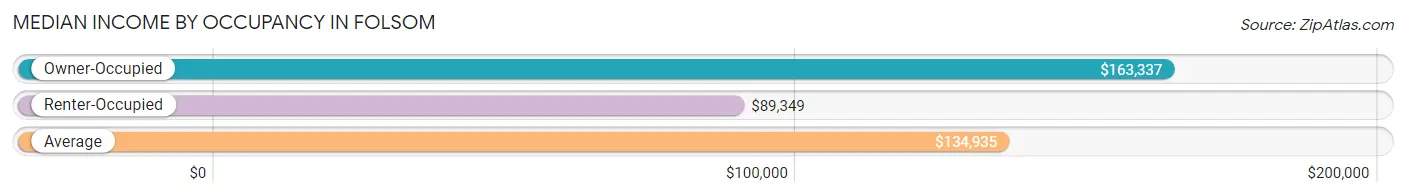
| Occupancy Type | # Households | Median Income |
| Owner-Occupied | 19,579 (69.2%) | $163,337 |
| Renter-Occupied | 8,719 (30.8%) | $89,349 |
| Average | 28,298 (100.0%) | $134,935 |
Occupancy by Householder Income Bracket in Folsom
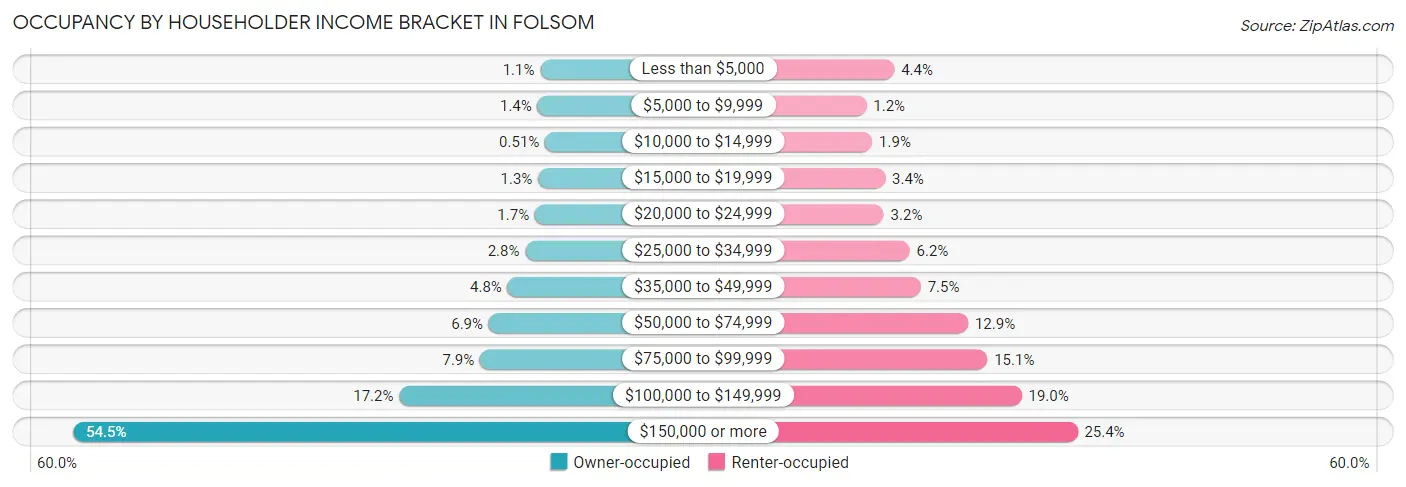
| Income Bracket | Owner-occupied | Renter-occupied |
| Less than $5,000 | 207 (1.1%) | 385 (4.4%) |
| $5,000 to $9,999 | 268 (1.4%) | 107 (1.2%) |
| $10,000 to $14,999 | 100 (0.5%) | 166 (1.9%) |
| $15,000 to $19,999 | 256 (1.3%) | 295 (3.4%) |
| $20,000 to $24,999 | 326 (1.7%) | 280 (3.2%) |
| $25,000 to $34,999 | 545 (2.8%) | 539 (6.2%) |
| $35,000 to $49,999 | 938 (4.8%) | 650 (7.4%) |
| $50,000 to $74,999 | 1,358 (6.9%) | 1,120 (12.9%) |
| $75,000 to $99,999 | 1,555 (7.9%) | 1,312 (15.0%) |
| $100,000 to $149,999 | 3,363 (17.2%) | 1,654 (19.0%) |
| $150,000 or more | 10,663 (54.5%) | 2,211 (25.4%) |
| Total | 19,579 (100.0%) | 8,719 (100.0%) |
Monthly Housing Cost Tiers in Folsom
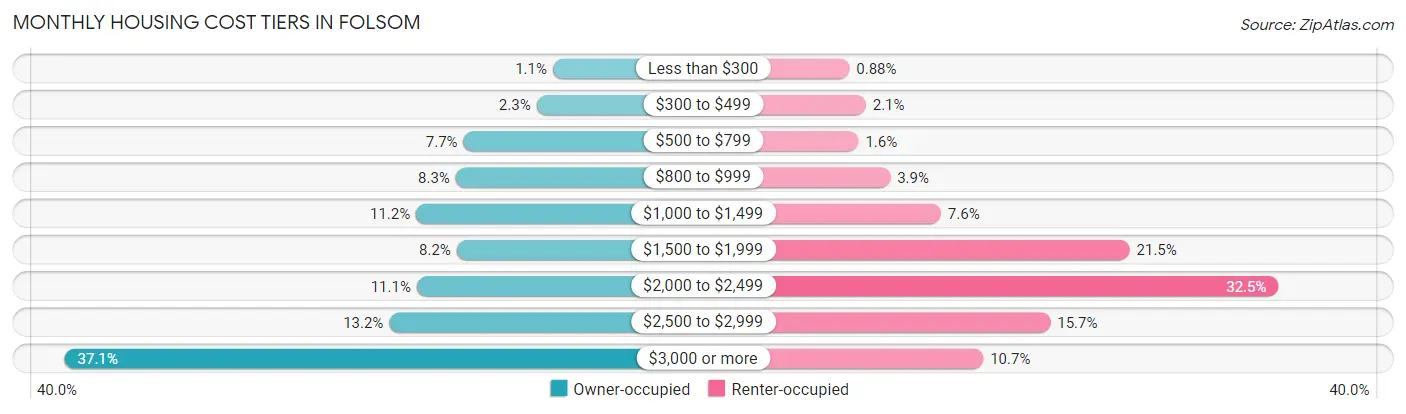
| Monthly Cost | Owner-occupied | Renter-occupied |
| Less than $300 | 216 (1.1%) | 77 (0.9%) |
| $300 to $499 | 450 (2.3%) | 182 (2.1%) |
| $500 to $799 | 1,504 (7.7%) | 135 (1.5%) |
| $800 to $999 | 1,616 (8.3%) | 339 (3.9%) |
| $1,000 to $1,499 | 2,186 (11.2%) | 664 (7.6%) |
| $1,500 to $1,999 | 1,602 (8.2%) | 1,876 (21.5%) |
| $2,000 to $2,499 | 2,177 (11.1%) | 2,831 (32.5%) |
| $2,500 to $2,999 | 2,574 (13.2%) | 1,367 (15.7%) |
| $3,000 or more | 7,254 (37.0%) | 936 (10.7%) |
| Total | 19,579 (100.0%) | 8,719 (100.0%) |
Physical Housing Characteristics in Folsom
Housing Structures in Folsom
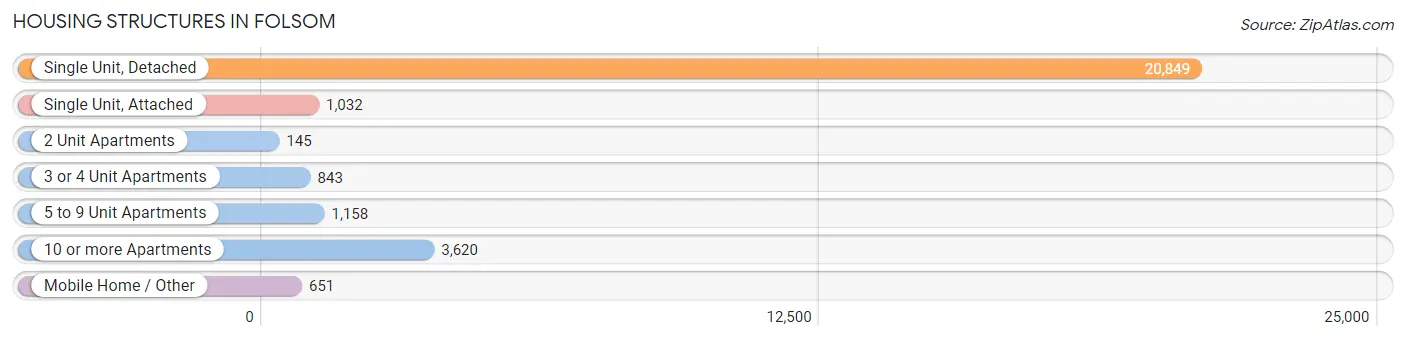
| Structure Type | # Housing Units | % Housing Units |
| Single Unit, Detached | 20,849 | 73.7% |
| Single Unit, Attached | 1,032 | 3.6% |
| 2 Unit Apartments | 145 | 0.5% |
| 3 or 4 Unit Apartments | 843 | 3.0% |
| 5 to 9 Unit Apartments | 1,158 | 4.1% |
| 10 or more Apartments | 3,620 | 12.8% |
| Mobile Home / Other | 651 | 2.3% |
| Total | 28,298 | 100.0% |
Housing Structures by Occupancy in Folsom
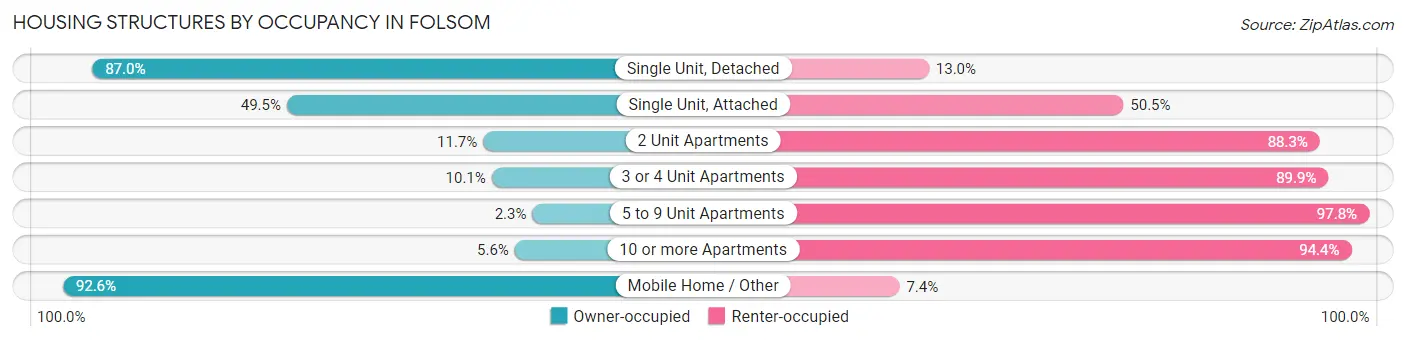
| Structure Type | Owner-occupied | Renter-occupied |
| Single Unit, Detached | 18,133 (87.0%) | 2,716 (13.0%) |
| Single Unit, Attached | 511 (49.5%) | 521 (50.5%) |
| 2 Unit Apartments | 17 (11.7%) | 128 (88.3%) |
| 3 or 4 Unit Apartments | 85 (10.1%) | 758 (89.9%) |
| 5 to 9 Unit Apartments | 26 (2.2%) | 1,132 (97.8%) |
| 10 or more Apartments | 204 (5.6%) | 3,416 (94.4%) |
| Mobile Home / Other | 603 (92.6%) | 48 (7.4%) |
| Total | 19,579 (69.2%) | 8,719 (30.8%) |
Housing Structures by Number of Rooms in Folsom
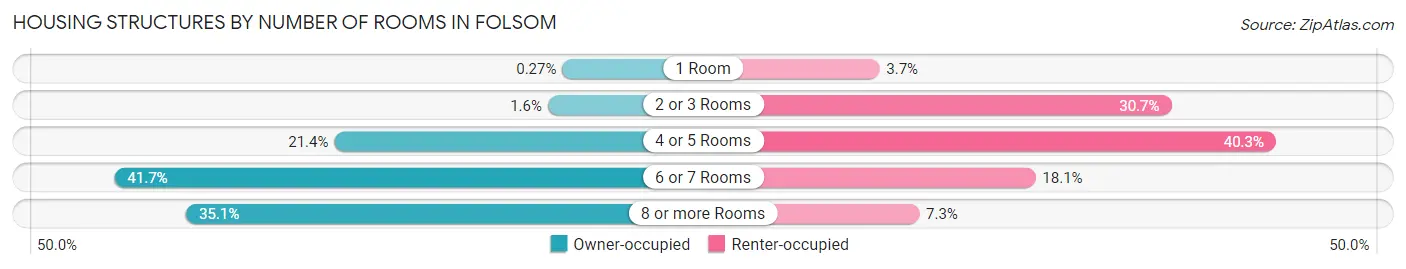
| Number of Rooms | Owner-occupied | Renter-occupied |
| 1 Room | 53 (0.3%) | 318 (3.6%) |
| 2 or 3 Rooms | 315 (1.6%) | 2,672 (30.6%) |
| 4 or 5 Rooms | 4,182 (21.4%) | 3,515 (40.3%) |
| 6 or 7 Rooms | 8,162 (41.7%) | 1,576 (18.1%) |
| 8 or more Rooms | 6,867 (35.1%) | 638 (7.3%) |
| Total | 19,579 (100.0%) | 8,719 (100.0%) |
Housing Structure by Heating Type in Folsom
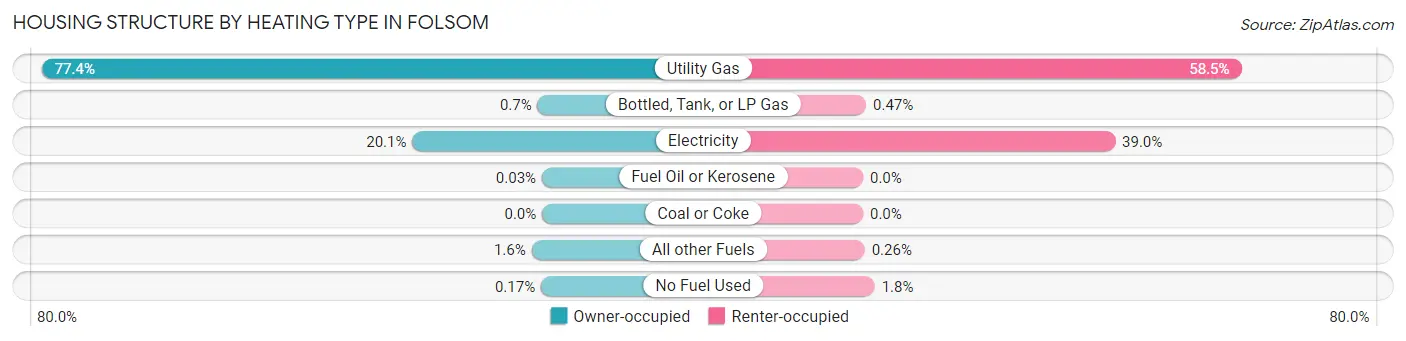
| Heating Type | Owner-occupied | Renter-occupied |
| Utility Gas | 15,151 (77.4%) | 5,099 (58.5%) |
| Bottled, Tank, or LP Gas | 138 (0.7%) | 41 (0.5%) |
| Electricity | 3,930 (20.1%) | 3,398 (39.0%) |
| Fuel Oil or Kerosene | 6 (0.0%) | 0 (0.0%) |
| Coal or Coke | 0 (0.0%) | 0 (0.0%) |
| All other Fuels | 320 (1.6%) | 23 (0.3%) |
| No Fuel Used | 34 (0.2%) | 158 (1.8%) |
| Total | 19,579 (100.0%) | 8,719 (100.0%) |
Household Vehicle Usage in Folsom
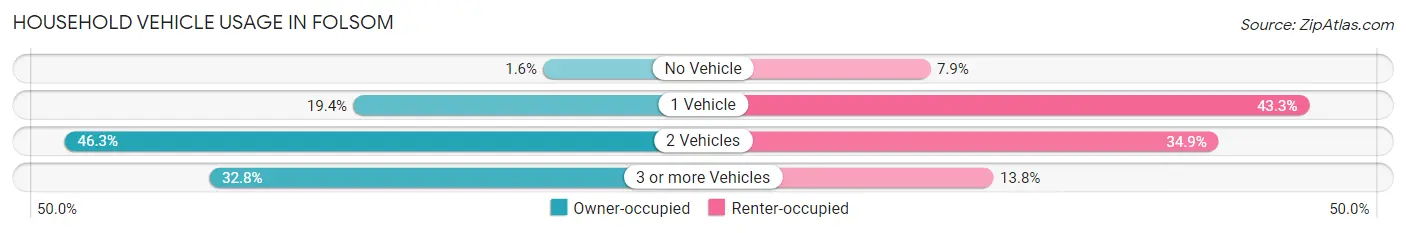
| Vehicles per Household | Owner-occupied | Renter-occupied |
| No Vehicle | 317 (1.6%) | 692 (7.9%) |
| 1 Vehicle | 3,788 (19.4%) | 3,779 (43.3%) |
| 2 Vehicles | 9,057 (46.3%) | 3,041 (34.9%) |
| 3 or more Vehicles | 6,417 (32.8%) | 1,207 (13.8%) |
| Total | 19,579 (100.0%) | 8,719 (100.0%) |
Real Estate & Mortgages in Folsom
Real Estate and Mortgage Overview in Folsom
| Characteristic | Without Mortgage | With Mortgage |
| Housing Units | 5,223 | 14,356 |
| Median Property Value | $608,800 | $695,300 |
| Median Household Income | $105,248 | $8,901 |
| Monthly Housing Costs | $861 | $7,254 |
| Real Estate Taxes | $4,957 | $194 |
Property Value by Mortgage Status in Folsom
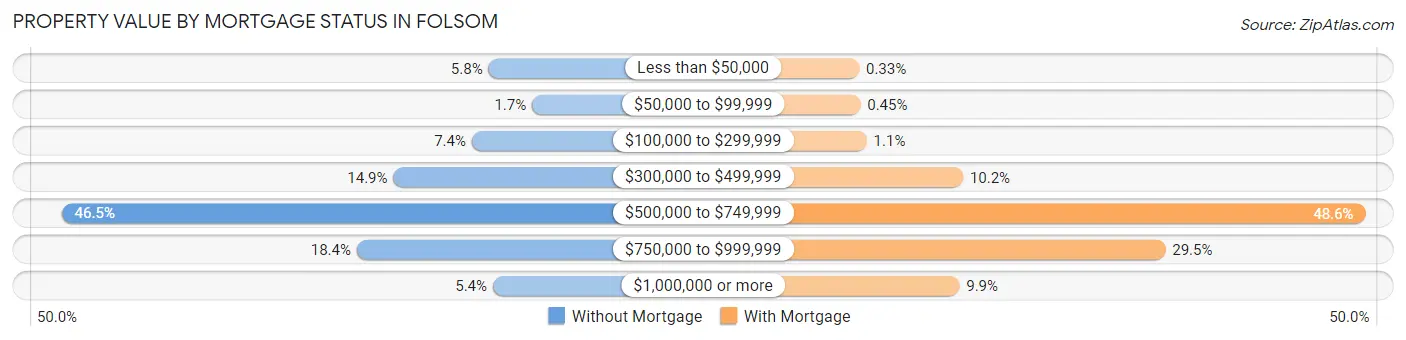
| Property Value | Without Mortgage | With Mortgage |
| Less than $50,000 | 304 (5.8%) | 48 (0.3%) |
| $50,000 to $99,999 | 87 (1.7%) | 64 (0.4%) |
| $100,000 to $299,999 | 387 (7.4%) | 152 (1.1%) |
| $300,000 to $499,999 | 777 (14.9%) | 1,468 (10.2%) |
| $500,000 to $749,999 | 2,427 (46.5%) | 6,971 (48.6%) |
| $750,000 to $999,999 | 959 (18.4%) | 4,235 (29.5%) |
| $1,000,000 or more | 282 (5.4%) | 1,418 (9.9%) |
| Total | 5,223 (100.0%) | 14,356 (100.0%) |
Household Income by Mortgage Status in Folsom
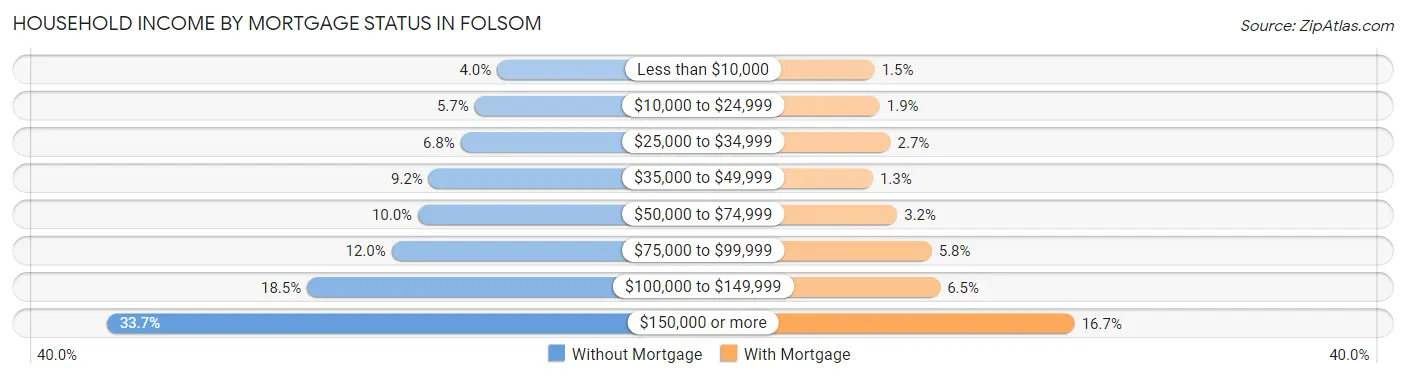
| Household Income | Without Mortgage | With Mortgage |
| Less than $10,000 | 209 (4.0%) | 210 (1.5%) |
| $10,000 to $24,999 | 299 (5.7%) | 266 (1.8%) |
| $25,000 to $34,999 | 354 (6.8%) | 383 (2.7%) |
| $35,000 to $49,999 | 481 (9.2%) | 191 (1.3%) |
| $50,000 to $74,999 | 524 (10.0%) | 457 (3.2%) |
| $75,000 to $99,999 | 629 (12.0%) | 834 (5.8%) |
| $100,000 to $149,999 | 965 (18.5%) | 926 (6.5%) |
| $150,000 or more | 1,762 (33.7%) | 2,398 (16.7%) |
| Total | 5,223 (100.0%) | 14,356 (100.0%) |
Property Value to Household Income Ratio in Folsom
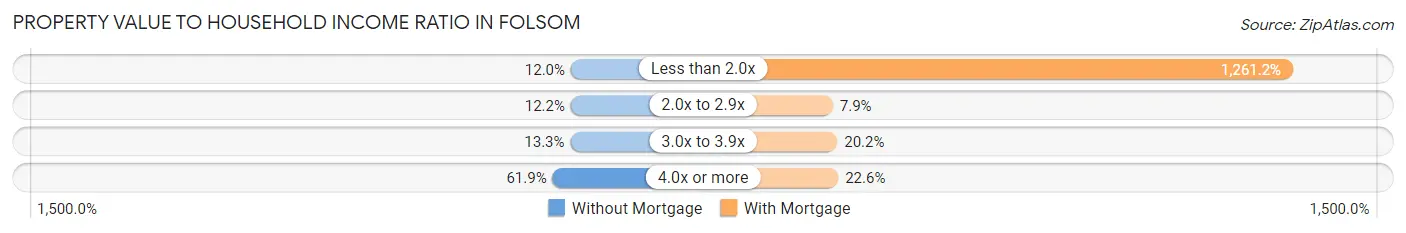
| Value-to-Income Ratio | Without Mortgage | With Mortgage |
| Less than 2.0x | 624 (11.9%) | 181,061 (1,261.2%) |
| 2.0x to 2.9x | 635 (12.2%) | 1,134 (7.9%) |
| 3.0x to 3.9x | 693 (13.3%) | 2,894 (20.2%) |
| 4.0x or more | 3,233 (61.9%) | 3,250 (22.6%) |
| Total | 5,223 (100.0%) | 14,356 (100.0%) |
Real Estate Taxes by Mortgage Status in Folsom
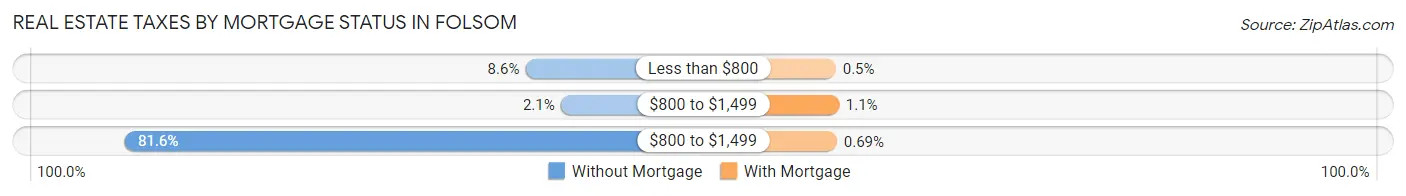
| Property Taxes | Without Mortgage | With Mortgage |
| Less than $800 | 447 (8.6%) | 72 (0.5%) |
| $800 to $1,499 | 110 (2.1%) | 152 (1.1%) |
| $800 to $1,499 | 4,264 (81.6%) | 99 (0.7%) |
| Total | 5,223 (100.0%) | 14,356 (100.0%) |
Health & Disability in Folsom
Health Insurance Coverage by Age in Folsom
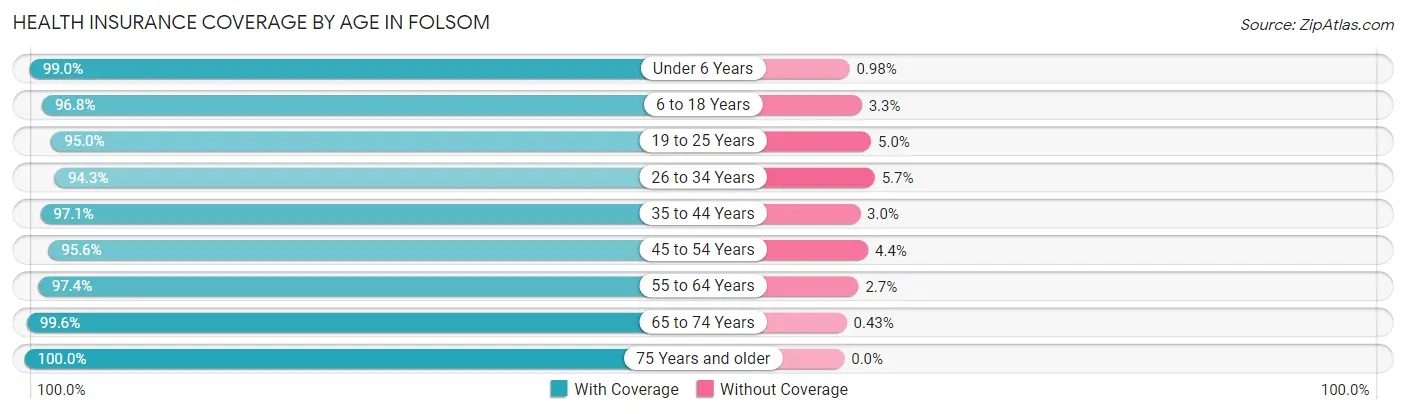
| Age Bracket | With Coverage | Without Coverage |
| Under 6 Years | 5,169 (99.0%) | 51 (1.0%) |
| 6 to 18 Years | 14,160 (96.8%) | 476 (3.3%) |
| 19 to 25 Years | 4,959 (95.0%) | 261 (5.0%) |
| 26 to 34 Years | 7,152 (94.3%) | 430 (5.7%) |
| 35 to 44 Years | 10,941 (97.1%) | 333 (2.9%) |
| 45 to 54 Years | 11,735 (95.6%) | 545 (4.4%) |
| 55 to 64 Years | 9,455 (97.4%) | 257 (2.6%) |
| 65 to 74 Years | 6,056 (99.6%) | 26 (0.4%) |
| 75 Years and older | 4,498 (100.0%) | 0 (0.0%) |
| Total | 74,125 (96.9%) | 2,379 (3.1%) |
Health Insurance Coverage by Citizenship Status in Folsom
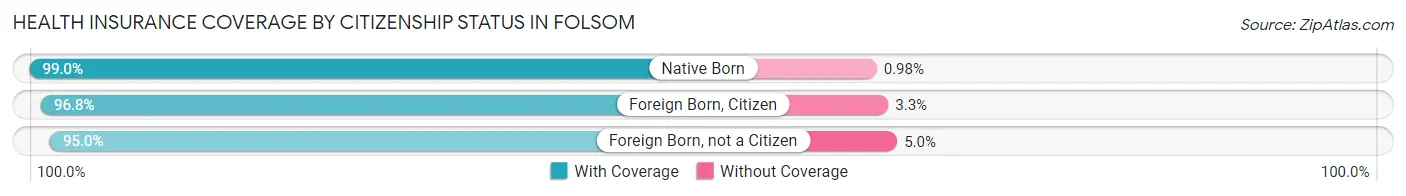
| Citizenship Status | With Coverage | Without Coverage |
| Native Born | 5,169 (99.0%) | 51 (1.0%) |
| Foreign Born, Citizen | 14,160 (96.8%) | 476 (3.3%) |
| Foreign Born, not a Citizen | 4,959 (95.0%) | 261 (5.0%) |
Health Insurance Coverage by Household Income in Folsom
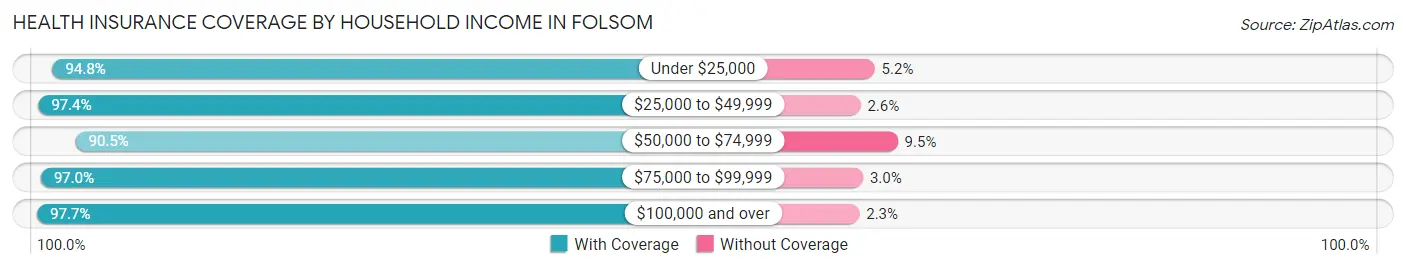
| Household Income | With Coverage | Without Coverage |
| Under $25,000 | 3,883 (94.8%) | 214 (5.2%) |
| $25,000 to $49,999 | 4,574 (97.4%) | 120 (2.6%) |
| $50,000 to $74,999 | 5,279 (90.5%) | 556 (9.5%) |
| $75,000 to $99,999 | 6,121 (97.0%) | 191 (3.0%) |
| $100,000 and over | 54,039 (97.7%) | 1,296 (2.3%) |
Public vs Private Health Insurance Coverage by Age in Folsom
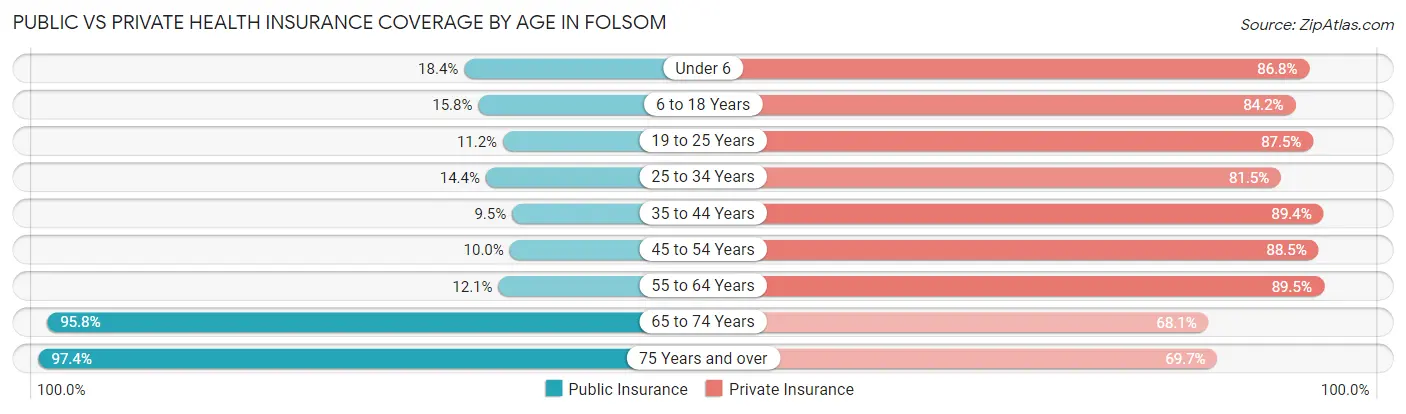
| Age Bracket | Public Insurance | Private Insurance |
| Under 6 | 961 (18.4%) | 4,530 (86.8%) |
| 6 to 18 Years | 2,311 (15.8%) | 12,323 (84.2%) |
| 19 to 25 Years | 585 (11.2%) | 4,567 (87.5%) |
| 25 to 34 Years | 1,092 (14.4%) | 6,182 (81.5%) |
| 35 to 44 Years | 1,074 (9.5%) | 10,080 (89.4%) |
| 45 to 54 Years | 1,225 (10.0%) | 10,866 (88.5%) |
| 55 to 64 Years | 1,171 (12.1%) | 8,687 (89.4%) |
| 65 to 74 Years | 5,826 (95.8%) | 4,141 (68.1%) |
| 75 Years and over | 4,381 (97.4%) | 3,136 (69.7%) |
| Total | 18,626 (24.3%) | 64,512 (84.3%) |
Disability Status by Sex by Age in Folsom
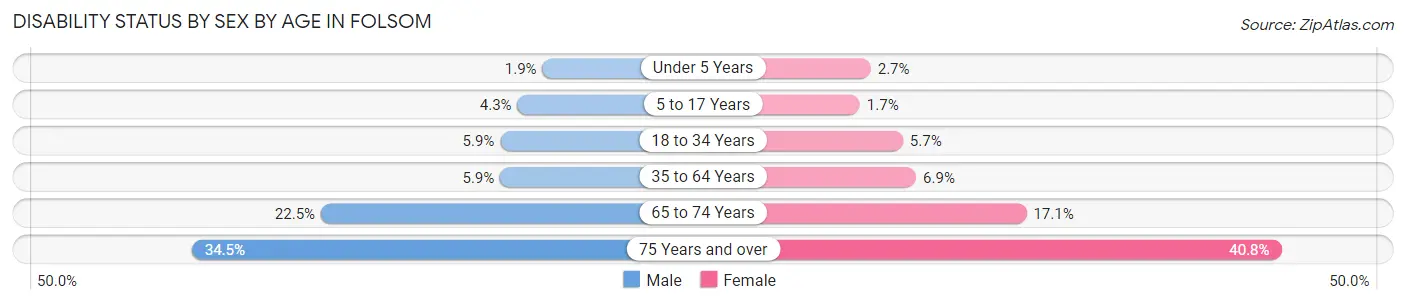
| Age Bracket | Male | Female |
| Under 5 Years | 41 (1.9%) | 64 (2.7%) |
| 5 to 17 Years | 300 (4.3%) | 124 (1.7%) |
| 18 to 34 Years | 414 (5.9%) | 380 (5.7%) |
| 35 to 64 Years | 956 (5.9%) | 1,171 (6.9%) |
| 65 to 74 Years | 590 (22.5%) | 593 (17.1%) |
| 75 Years and over | 572 (34.5%) | 1,158 (40.8%) |
Disability Class by Sex by Age in Folsom
Disability Class: Hearing Difficulty
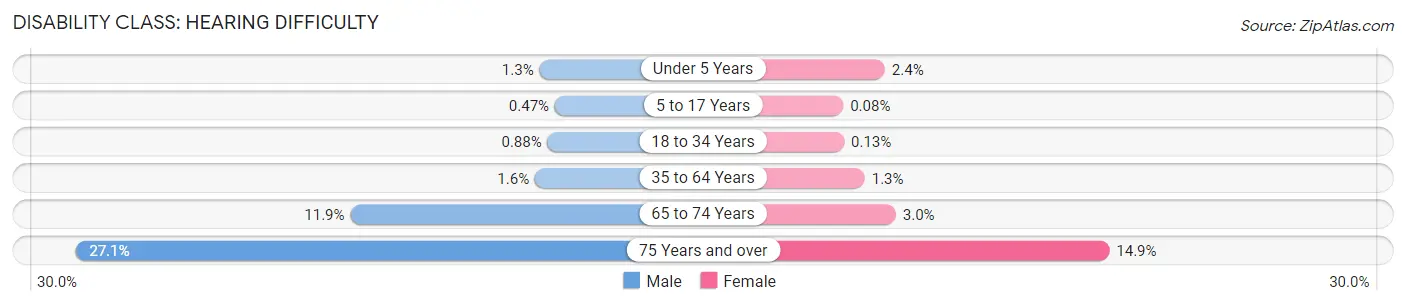
| Age Bracket | Male | Female |
| Under 5 Years | 28 (1.3%) | 57 (2.4%) |
| 5 to 17 Years | 33 (0.5%) | 6 (0.1%) |
| 18 to 34 Years | 62 (0.9%) | 9 (0.1%) |
| 35 to 64 Years | 257 (1.6%) | 217 (1.3%) |
| 65 to 74 Years | 311 (11.9%) | 104 (3.0%) |
| 75 Years and over | 450 (27.1%) | 423 (14.9%) |
Disability Class: Vision Difficulty
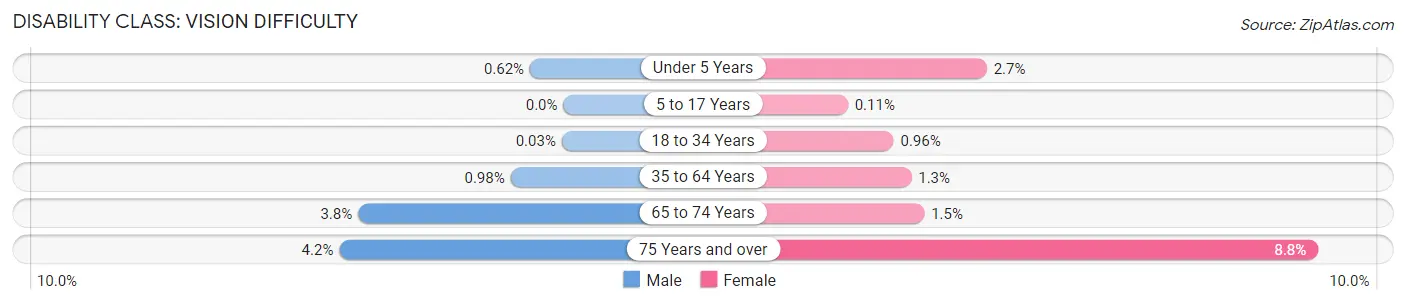
| Age Bracket | Male | Female |
| Under 5 Years | 13 (0.6%) | 64 (2.7%) |
| 5 to 17 Years | 0 (0.0%) | 8 (0.1%) |
| 18 to 34 Years | 2 (0.0%) | 64 (1.0%) |
| 35 to 64 Years | 159 (1.0%) | 219 (1.3%) |
| 65 to 74 Years | 100 (3.8%) | 53 (1.5%) |
| 75 Years and over | 69 (4.2%) | 251 (8.8%) |
Disability Class: Cognitive Difficulty
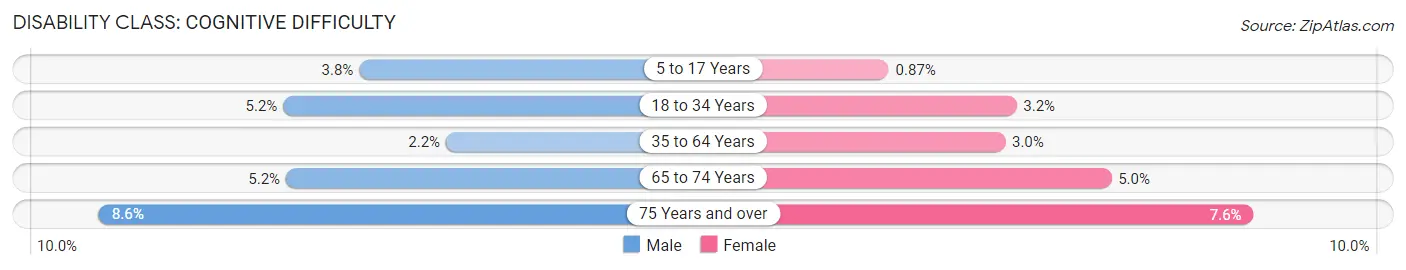
| Age Bracket | Male | Female |
| 5 to 17 Years | 267 (3.8%) | 64 (0.9%) |
| 18 to 34 Years | 367 (5.2%) | 217 (3.2%) |
| 35 to 64 Years | 356 (2.2%) | 515 (3.0%) |
| 65 to 74 Years | 135 (5.1%) | 173 (5.0%) |
| 75 Years and over | 143 (8.6%) | 217 (7.6%) |
Disability Class: Ambulatory Difficulty
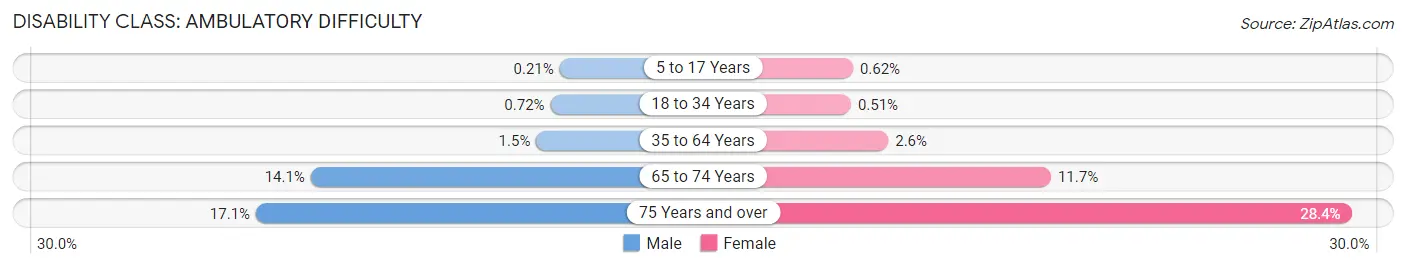
| Age Bracket | Male | Female |
| 5 to 17 Years | 15 (0.2%) | 46 (0.6%) |
| 18 to 34 Years | 51 (0.7%) | 34 (0.5%) |
| 35 to 64 Years | 246 (1.5%) | 440 (2.6%) |
| 65 to 74 Years | 369 (14.1%) | 403 (11.7%) |
| 75 Years and over | 284 (17.1%) | 807 (28.4%) |
Disability Class: Self-Care Difficulty
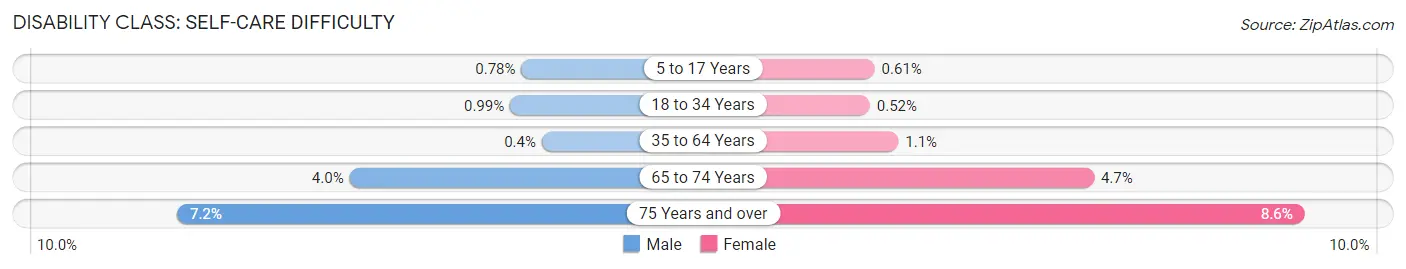
| Age Bracket | Male | Female |
| 5 to 17 Years | 55 (0.8%) | 45 (0.6%) |
| 18 to 34 Years | 70 (1.0%) | 35 (0.5%) |
| 35 to 64 Years | 65 (0.4%) | 179 (1.1%) |
| 65 to 74 Years | 104 (4.0%) | 162 (4.7%) |
| 75 Years and over | 119 (7.2%) | 244 (8.6%) |
Technology Access in Folsom
Computing Device Access in Folsom
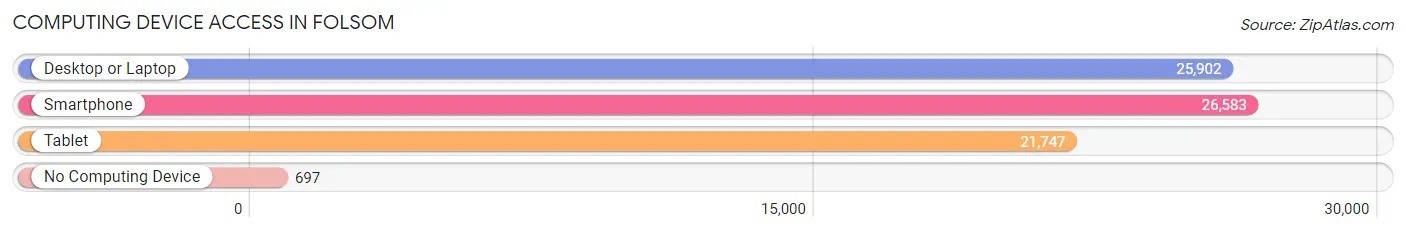
| Device Type | # Households | % Households |
| Desktop or Laptop | 25,902 | 91.5% |
| Smartphone | 26,583 | 93.9% |
| Tablet | 21,747 | 76.8% |
| No Computing Device | 697 | 2.5% |
| Total | 28,298 | 100.0% |
Internet Access in Folsom
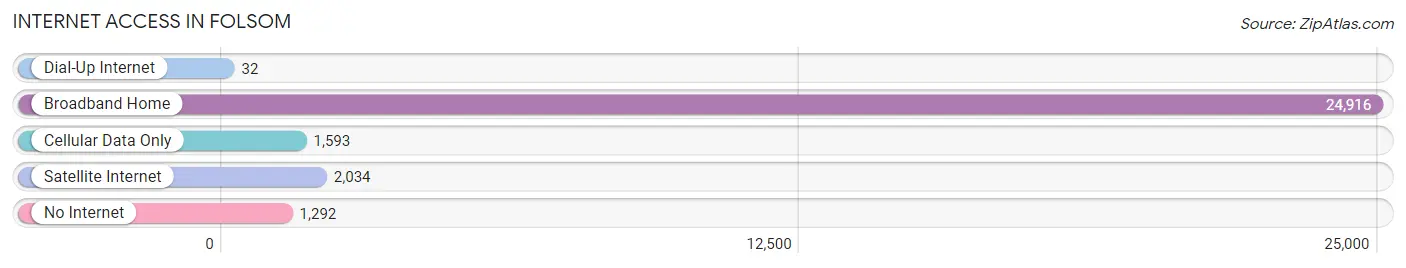
| Internet Type | # Households | % Households |
| Dial-Up Internet | 32 | 0.1% |
| Broadband Home | 24,916 | 88.0% |
| Cellular Data Only | 1,593 | 5.6% |
| Satellite Internet | 2,034 | 7.2% |
| No Internet | 1,292 | 4.6% |
| Total | 28,298 | 100.0% |
Folsom Summary
Folsom, California is a city located in Sacramento County, California, United States. It is situated in the foothills of the Sierra Nevada Mountains, approximately 25 miles east of Sacramento. The city has a population of 72,203 as of the 2010 census, making it the sixth-largest city in Sacramento County.
History
Folsom was founded in 1855 by Joseph Libbey Folsom, a former captain in the California Gold Rush. He purchased Rancho Rio de los Americanos from the heirs of a Spanish land grant and established a cattle ranch. The town was named after him. In the late 1800s, Folsom became a popular destination for tourists, who came to enjoy the area’s natural beauty and recreational opportunities.
In the early 1900s, Folsom began to grow as a residential community. The city was incorporated in 1946 and has since grown to become one of the most desirable places to live in the Sacramento area.
Geography
Folsom is located in the foothills of the Sierra Nevada Mountains, approximately 25 miles east of Sacramento. The city is situated at an elevation of about 500 feet above sea level. The city covers an area of about 24 square miles and is bordered by the cities of Orangevale, Rancho Cordova, and El Dorado Hills.
The city is located in the Central Valley of California, which is known for its mild climate and fertile soil. The city is also located near several major highways, including Interstate 80, Highway 50, and Highway 99.
Economy
Folsom’s economy is largely based on the service industry, with many residents employed in retail, healthcare, and education. The city is also home to several large employers, including Intel, Hewlett Packard, and Oracle.
Folsom is also home to several shopping centers, including the Folsom Premium Outlets, which features over 100 stores. The city is also home to several restaurants, bars, and entertainment venues.
Demographics
As of the 2010 census, Folsom had a population of 72,203. The racial makeup of the city was 75.3% White, 8.2% Asian, 6.2% African American, 0.7% Native American, 0.2% Pacific Islander, and 5.2% from other races. Hispanic or Latino of any race were 16.3% of the population.
The median income for a household in the city was $76,837, and the median income for a family was $90,945. The per capita income for the city was $35,945. About 4.3% of families and 6.2% of the population were below the poverty line, including 8.2% of those under age 18 and 4.2% of those age 65 or over.
Folsom is a diverse and vibrant city with a strong economy and a high quality of life. The city is home to a variety of businesses, recreational opportunities, and cultural attractions. Folsom is a great place to live, work, and play.
Common Questions
What is Per Capita Income in Folsom?
Per Capita income in Folsom is $56,541.
What is the Median Family Income in Folsom?
Median Family Income in Folsom is $164,717.
What is the Median Household income in Folsom?
Median Household Income in Folsom is $134,935.
What is Income or Wage Gap in Folsom?
Income or Wage Gap in Folsom is 39.4%.
Women in Folsom earn 60.6 cents for every dollar earned by a man.
What is Family Income Deficit in Folsom?
Family Income Deficit in Folsom is $11,141.
Families that are below poverty line in Folsom earn $11,141 less on average than the poverty threshold level.
What is Inequality or Gini Index in Folsom?
Inequality or Gini Index in Folsom is 0.41.
What is the Total Population of Folsom?
Total Population of Folsom is 81,077.
What is the Total Male Population of Folsom?
Total Male Population of Folsom is 40,838.
What is the Total Female Population of Folsom?
Total Female Population of Folsom is 40,239.
What is the Ratio of Males per 100 Females in Folsom?
There are 101.49 Males per 100 Females in Folsom.
What is the Ratio of Females per 100 Males in Folsom?
There are 98.53 Females per 100 Males in Folsom.
What is the Median Population Age in Folsom?
Median Population Age in Folsom is 39.9 Years.
What is the Average Family Size in Folsom
Average Family Size in Folsom is 3.2 People.
What is the Average Household Size in Folsom
Average Household Size in Folsom is 2.7 People.
How Large is the Labor Force in Folsom?
There are 40,171 People in the Labor Forcein in Folsom.
What is the Percentage of People in the Labor Force in Folsom?
62.4% of People are in the Labor Force in Folsom.
What is the Unemployment Rate in Folsom?
Unemployment Rate in Folsom is 5.0%.