Medford, MA Map & Demographics
Medford Map
Medford Overview
$58,522
PER CAPITA INCOME
$139,636
AVG FAMILY INCOME
$114,863
AVG HOUSEHOLD INCOME
22.7%
WAGE / INCOME GAP [ % ]
77.3¢/ $1
WAGE / INCOME GAP [ $ ]
0.44
INEQUALITY / GINI INDEX
61,748
TOTAL POPULATION
29,227
MALE POPULATION
32,521
FEMALE POPULATION
89.87
MALES / 100 FEMALES
111.27
FEMALES / 100 MALES
35.4
MEDIAN AGE
2.9
AVG FAMILY SIZE
2.4
AVG HOUSEHOLD SIZE
39,120
LABOR FORCE [ PEOPLE ]
72.1%
PERCENT IN LABOR FORCE
4.2%
UNEMPLOYMENT RATE
Medford Zip Codes
Income in Medford
Income Overview in Medford
Per Capita Income in Medford is $58,522, while median incomes of families and households are $139,636 and $114,863 respectively.
| Characteristic | Number | Measure |
| Per Capita Income | 61,748 | $58,522 |
| Median Family Income | 13,914 | $139,636 |
| Mean Family Income | 13,914 | $167,846 |
| Median Household Income | 25,359 | $114,863 |
| Mean Household Income | 25,359 | $143,240 |
| Income Deficit | 13,914 | $0 |
| Wage / Income Gap (%) | 61,748 | 22.75% |
| Wage / Income Gap ($) | 61,748 | 77.25¢ per $1 |
| Gini / Inequality Index | 61,748 | 0.44 |
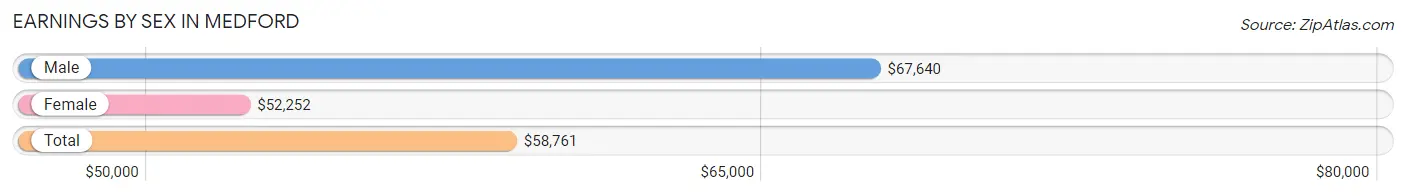
Earnings by Sex in Medford
Average Earnings in Medford are $58,761, $67,640 for men and $52,252 for women, a difference of 22.8%.
| Sex | Number | Average Earnings |
| Male | 19,957 (48.7%) | $67,640 |
| Female | 21,031 (51.3%) | $52,252 |
| Total | 40,988 (100.0%) | $58,761 |
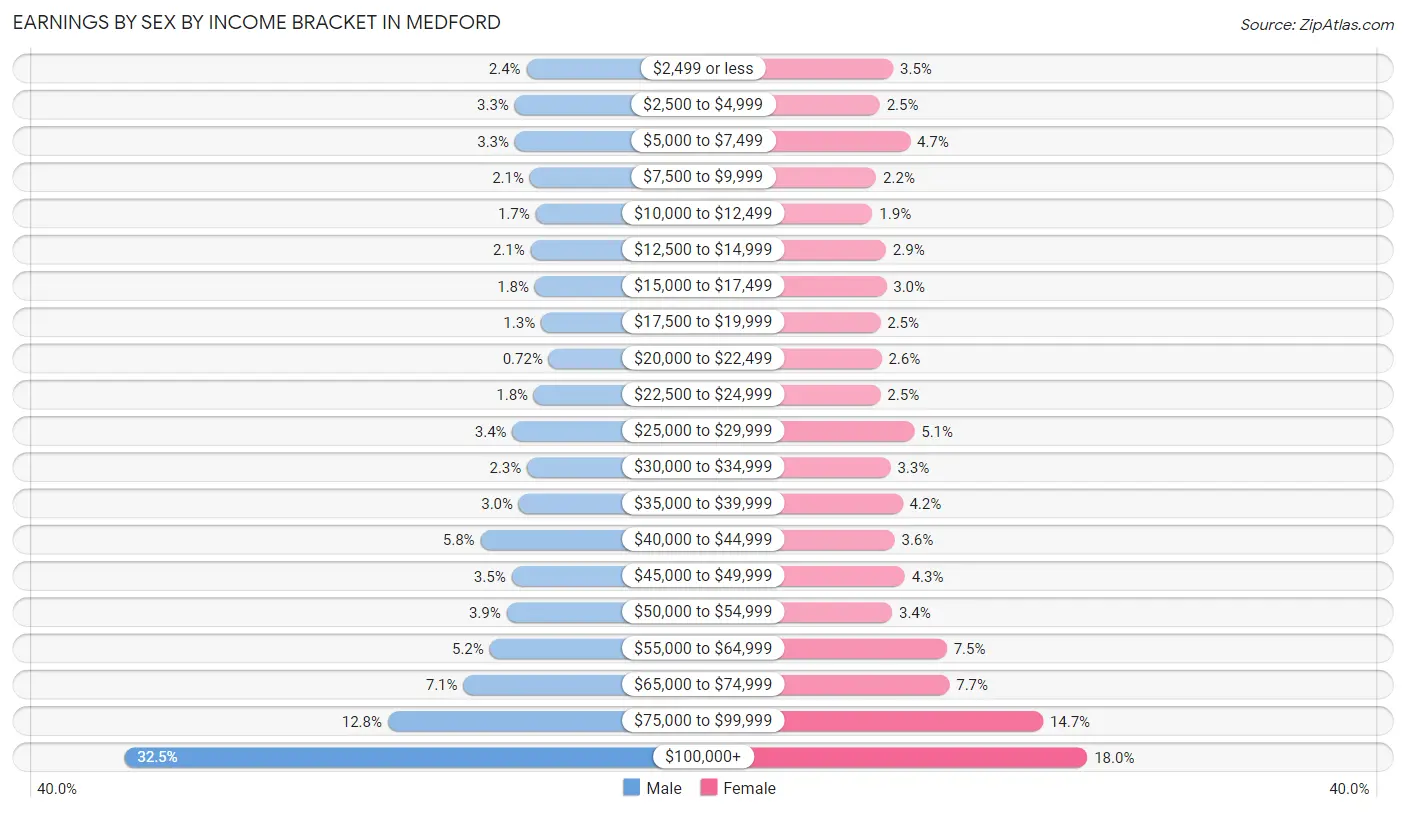
Earnings by Sex by Income Bracket in Medford
The most common earnings brackets in Medford are $100,000+ for men (6,491 | 32.5%) and $100,000+ for women (3,789 | 18.0%).
| Income | Male | Female |
| $2,499 or less | 476 (2.4%) | 729 (3.5%) |
| $2,500 to $4,999 | 652 (3.3%) | 520 (2.5%) |
| $5,000 to $7,499 | 651 (3.3%) | 996 (4.7%) |
| $7,500 to $9,999 | 427 (2.1%) | 463 (2.2%) |
| $10,000 to $12,499 | 342 (1.7%) | 404 (1.9%) |
| $12,500 to $14,999 | 415 (2.1%) | 616 (2.9%) |
| $15,000 to $17,499 | 352 (1.8%) | 623 (3.0%) |
| $17,500 to $19,999 | 260 (1.3%) | 527 (2.5%) |
| $20,000 to $22,499 | 143 (0.7%) | 546 (2.6%) |
| $22,500 to $24,999 | 365 (1.8%) | 529 (2.5%) |
| $25,000 to $29,999 | 687 (3.4%) | 1,064 (5.1%) |
| $30,000 to $34,999 | 467 (2.3%) | 687 (3.3%) |
| $35,000 to $39,999 | 591 (3.0%) | 878 (4.2%) |
| $40,000 to $44,999 | 1,166 (5.8%) | 753 (3.6%) |
| $45,000 to $49,999 | 701 (3.5%) | 913 (4.3%) |
| $50,000 to $54,999 | 774 (3.9%) | 712 (3.4%) |
| $55,000 to $64,999 | 1,027 (5.1%) | 1,575 (7.5%) |
| $65,000 to $74,999 | 1,420 (7.1%) | 1,615 (7.7%) |
| $75,000 to $99,999 | 2,550 (12.8%) | 3,092 (14.7%) |
| $100,000+ | 6,491 (32.5%) | 3,789 (18.0%) |
| Total | 19,957 (100.0%) | 21,031 (100.0%) |
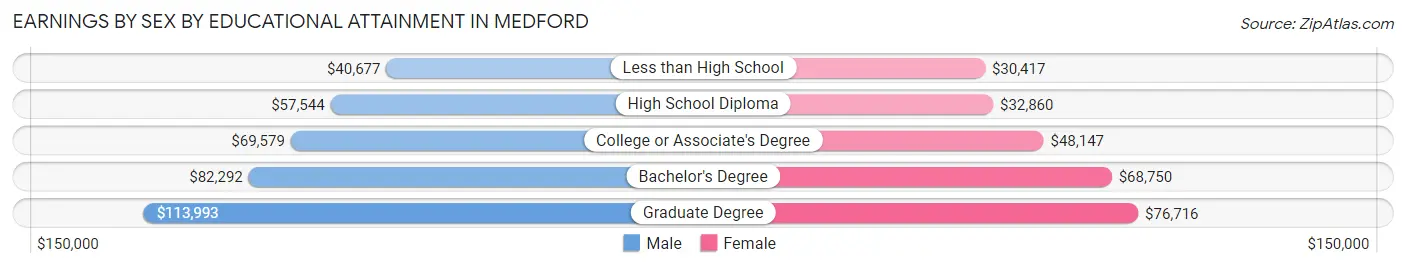
Earnings by Sex by Educational Attainment in Medford
Average earnings in Medford are $76,244 for men and $61,478 for women, a difference of 19.4%. Men with an educational attainment of graduate degree enjoy the highest average annual earnings of $113,993, while those with less than high school education earn the least with $40,677. Women with an educational attainment of graduate degree earn the most with the average annual earnings of $76,716, while those with less than high school education have the smallest earnings of $30,417.
| Educational Attainment | Male Income | Female Income |
| Less than High School | $40,677 | $30,417 |
| High School Diploma | $57,544 | $32,860 |
| College or Associate's Degree | $69,579 | $48,147 |
| Bachelor's Degree | $82,292 | $68,750 |
| Graduate Degree | $113,993 | $76,716 |
| Total | $76,244 | $61,478 |
Family Income in Medford
Family Income Brackets in Medford
According to the Medford family income data, there are 3,896 families falling into the $200,000+ income range, which is the most common income bracket and makes up 28.0% of all families. Conversely, the $10,000 to $14,999 income bracket is the least frequent group with only 28 families (0.2%) belonging to this category.
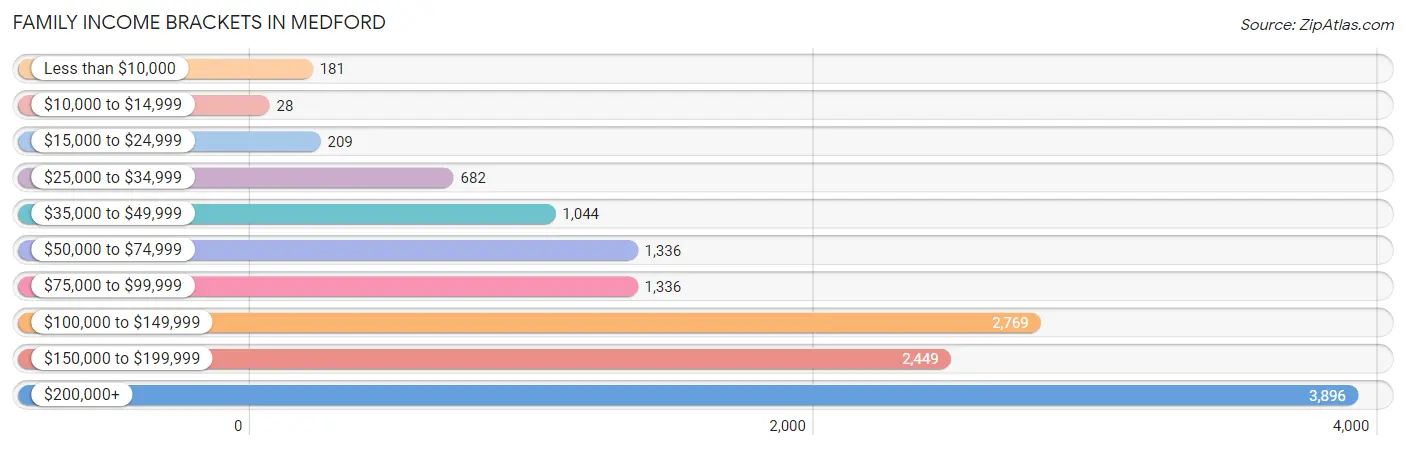
| Income Bracket | # Families | % Families |
| Less than $10,000 | 181 | 1.3% |
| $10,000 to $14,999 | 28 | 0.2% |
| $15,000 to $24,999 | 209 | 1.5% |
| $25,000 to $34,999 | 682 | 4.9% |
| $35,000 to $49,999 | 1,044 | 7.5% |
| $50,000 to $74,999 | 1,336 | 9.6% |
| $75,000 to $99,999 | 1,336 | 9.6% |
| $100,000 to $149,999 | 2,769 | 19.9% |
| $150,000 to $199,999 | 2,449 | 17.6% |
| $200,000+ | 3,896 | 28.0% |
Family Income by Famaliy Size in Medford
7+ person families (69 | 0.5%) account for the highest median family income in Medford with $250,001 per family, while 2-person families (6,991 | 50.2%) have the highest median income of $56,958 per family member.
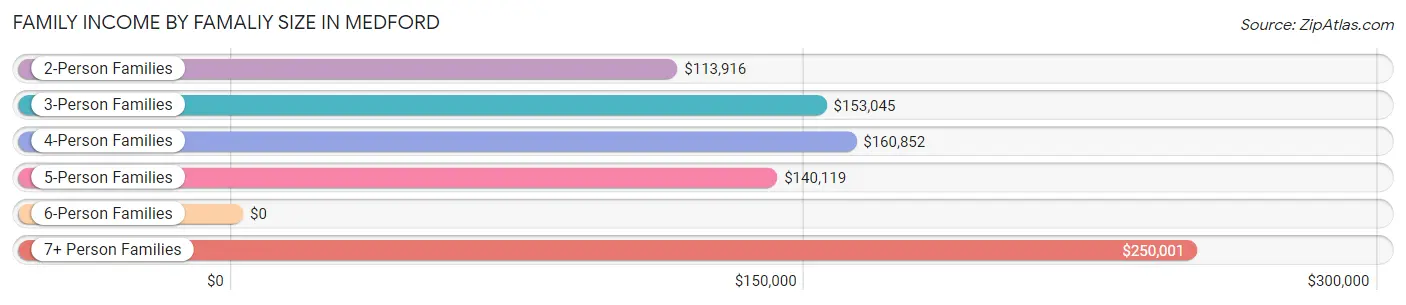
| Income Bracket | # Families | Median Income |
| 2-Person Families | 6,991 (50.2%) | $113,916 |
| 3-Person Families | 3,099 (22.3%) | $153,045 |
| 4-Person Families | 2,403 (17.3%) | $160,852 |
| 5-Person Families | 1,218 (8.7%) | $140,119 |
| 6-Person Families | 134 (1.0%) | $0 |
| 7+ Person Families | 69 (0.5%) | $250,001 |
| Total | 13,914 (100.0%) | $139,636 |
Family Income by Number of Earners in Medford
The median family income in Medford is $139,636, with families comprising 3+ earners (2,092) having the highest median family income of $205,410, while families with no earners (1,246) have the lowest median family income of $57,700, accounting for 15.0% and 9.0% of families, respectively.
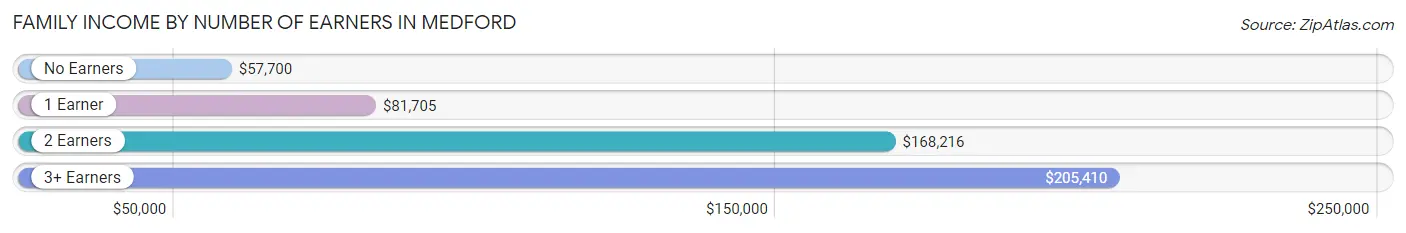
| Number of Earners | # Families | Median Income |
| No Earners | 1,246 (9.0%) | $57,700 |
| 1 Earner | 3,507 (25.2%) | $81,705 |
| 2 Earners | 7,069 (50.8%) | $168,216 |
| 3+ Earners | 2,092 (15.0%) | $205,410 |
| Total | 13,914 (100.0%) | $139,636 |
Household Income in Medford
Household Income Brackets in Medford
With 6,061 households falling in the category, the $200,000+ income range is the most frequent in Medford, accounting for 23.9% of all households. In contrast, only 710 households (2.8%) fall into the $10,000 to $14,999 income bracket, making it the least populous group.
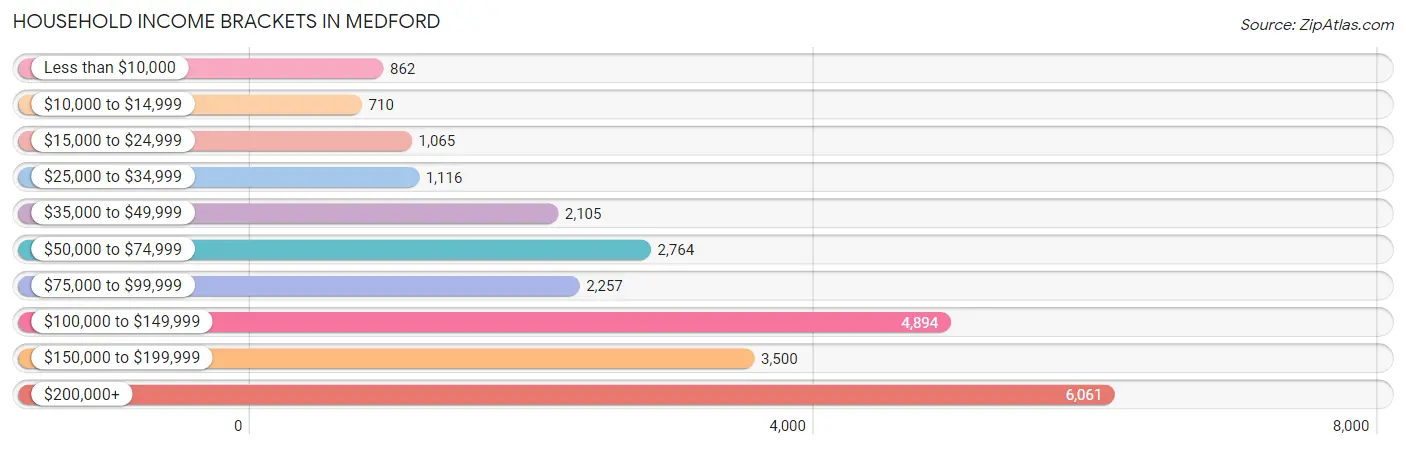
| Income Bracket | # Households | % Households |
| Less than $10,000 | 862 | 3.4% |
| $10,000 to $14,999 | 710 | 2.8% |
| $15,000 to $24,999 | 1,065 | 4.2% |
| $25,000 to $34,999 | 1,116 | 4.4% |
| $35,000 to $49,999 | 2,105 | 8.3% |
| $50,000 to $74,999 | 2,764 | 10.9% |
| $75,000 to $99,999 | 2,257 | 8.9% |
| $100,000 to $149,999 | 4,894 | 19.3% |
| $150,000 to $199,999 | 3,500 | 13.8% |
| $200,000+ | 6,061 | 23.9% |
Household Income by Householder Age in Medford
The median household income in Medford is $114,863, with the highest median household income of $142,617 found in the 25 to 44 years age bracket for the primary householder. A total of 9,860 households (38.9%) fall into this category. Meanwhile, the 65+ years age bracket for the primary householder has the lowest median household income of $60,971, with 5,952 households (23.5%) in this group.
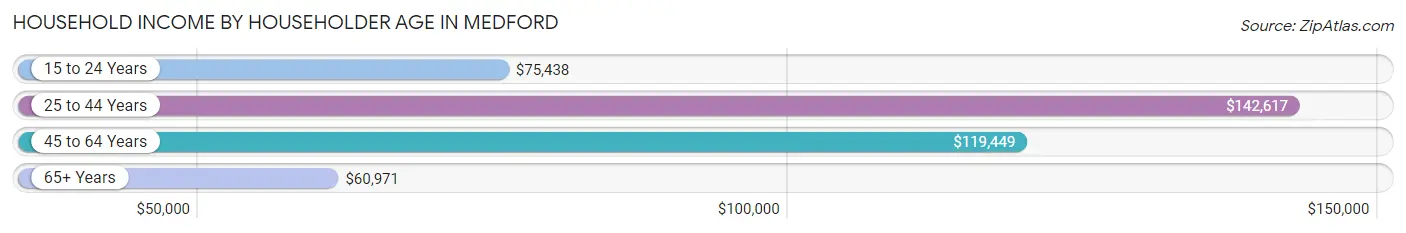
| Income Bracket | # Households | Median Income |
| 15 to 24 Years | 1,433 (5.7%) | $75,438 |
| 25 to 44 Years | 9,860 (38.9%) | $142,617 |
| 45 to 64 Years | 8,114 (32.0%) | $119,449 |
| 65+ Years | 5,952 (23.5%) | $60,971 |
| Total | 25,359 (100.0%) | $114,863 |
Poverty in Medford
Income Below Poverty by Sex and Age in Medford
With 7.7% poverty level for males and 7.2% for females among the residents of Medford, 18 to 24 year old males and 18 to 24 year old females are the most vulnerable to poverty, with 687 males (27.7%) and 606 females (15.8%) in their respective age groups living below the poverty level.
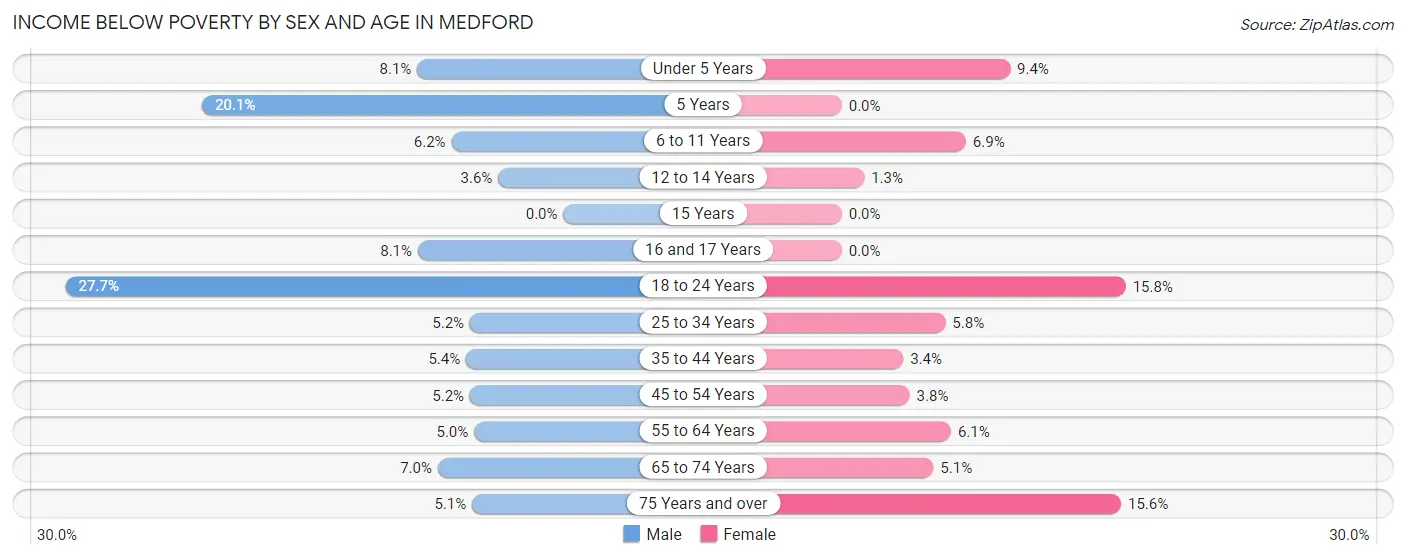
| Age Bracket | Male | Female |
| Under 5 Years | 103 (8.1%) | 133 (9.4%) |
| 5 Years | 66 (20.1%) | 0 (0.0%) |
| 6 to 11 Years | 78 (6.2%) | 82 (6.9%) |
| 12 to 14 Years | 27 (3.6%) | 9 (1.3%) |
| 15 Years | 0 (0.0%) | 0 (0.0%) |
| 16 and 17 Years | 47 (8.1%) | 0 (0.0%) |
| 18 to 24 Years | 687 (27.7%) | 606 (15.8%) |
| 25 to 34 Years | 368 (5.2%) | 406 (5.8%) |
| 35 to 44 Years | 199 (5.4%) | 131 (3.4%) |
| 45 to 54 Years | 179 (5.2%) | 126 (3.8%) |
| 55 to 64 Years | 177 (5.0%) | 230 (6.1%) |
| 65 to 74 Years | 178 (7.0%) | 154 (5.1%) |
| 75 Years and over | 60 (5.1%) | 379 (15.5%) |
| Total | 2,169 (7.7%) | 2,256 (7.2%) |
Income Above Poverty by Sex and Age in Medford
According to the poverty statistics in Medford, males aged 15 years and females aged 5 years are the age groups that are most secure financially, with 100.0% of males and 100.0% of females in these age groups living above the poverty line.
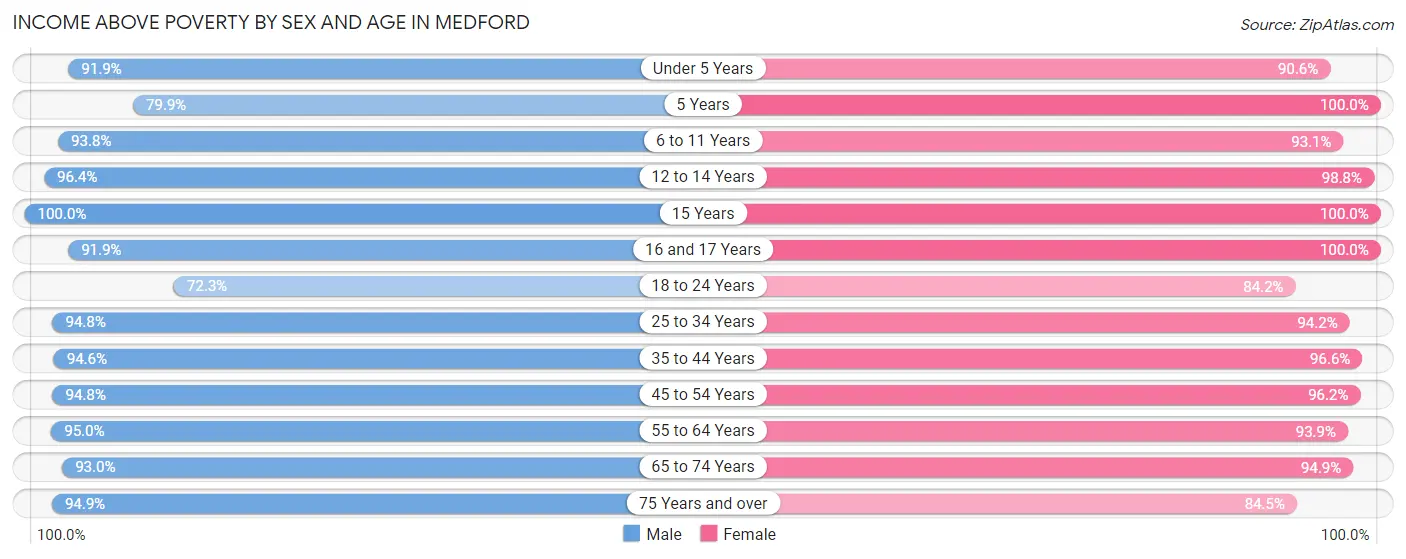
| Age Bracket | Male | Female |
| Under 5 Years | 1,163 (91.9%) | 1,286 (90.6%) |
| 5 Years | 262 (79.9%) | 129 (100.0%) |
| 6 to 11 Years | 1,175 (93.8%) | 1,105 (93.1%) |
| 12 to 14 Years | 716 (96.4%) | 712 (98.8%) |
| 15 Years | 152 (100.0%) | 234 (100.0%) |
| 16 and 17 Years | 533 (91.9%) | 369 (100.0%) |
| 18 to 24 Years | 1,791 (72.3%) | 3,228 (84.2%) |
| 25 to 34 Years | 6,706 (94.8%) | 6,626 (94.2%) |
| 35 to 44 Years | 3,475 (94.6%) | 3,703 (96.6%) |
| 45 to 54 Years | 3,266 (94.8%) | 3,206 (96.2%) |
| 55 to 64 Years | 3,383 (95.0%) | 3,551 (93.9%) |
| 65 to 74 Years | 2,369 (93.0%) | 2,867 (94.9%) |
| 75 Years and over | 1,121 (94.9%) | 2,059 (84.5%) |
| Total | 26,112 (92.3%) | 29,075 (92.8%) |
Income Below Poverty Among Married-Couple Families in Medford
The poverty statistics for married-couple families in Medford show that 1.8% or 179 of the total 10,211 families live below the poverty line. Families with no children have the highest poverty rate of 2.1%, comprising of 131 families. On the other hand, families with 3 or 4 children have the lowest poverty rate of 0.0%, which includes 0 families.
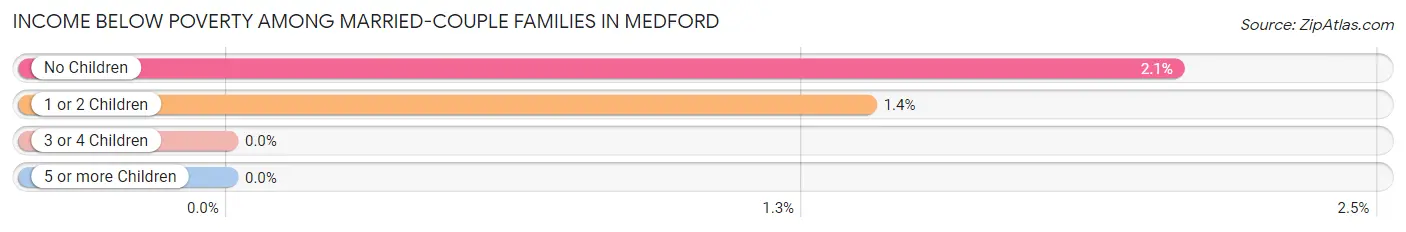
| Children | Above Poverty | Below Poverty |
| No Children | 6,226 (97.9%) | 131 (2.1%) |
| 1 or 2 Children | 3,402 (98.6%) | 48 (1.4%) |
| 3 or 4 Children | 392 (100.0%) | 0 (0.0%) |
| 5 or more Children | 12 (100.0%) | 0 (0.0%) |
| Total | 10,032 (98.3%) | 179 (1.8%) |
Income Below Poverty Among Single-Parent Households in Medford
According to the poverty data in Medford, 4.0% or 37 single-father households and 4.6% or 129 single-mother households are living below the poverty line. Among single-father households, those with 1 or 2 children have the highest poverty rate, with 37 households (17.8%) experiencing poverty. Likewise, among single-mother households, those with 3 or 4 children have the highest poverty rate, with 61 households (56.0%) falling below the poverty line.
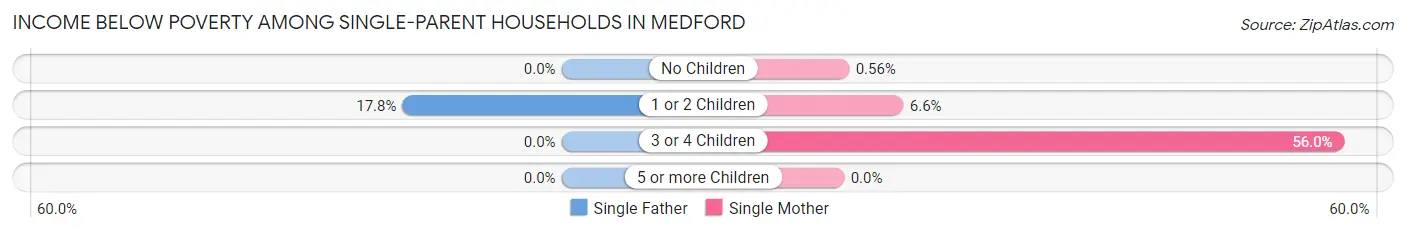
| Children | Single Father | Single Mother |
| No Children | 0 (0.0%) | 10 (0.6%) |
| 1 or 2 Children | 37 (17.8%) | 58 (6.6%) |
| 3 or 4 Children | 0 (0.0%) | 61 (56.0%) |
| 5 or more Children | 0 (0.0%) | 0 (0.0%) |
| Total | 37 (4.0%) | 129 (4.6%) |
Income Below Poverty Among Married-Couple vs Single-Parent Households in Medford
The poverty data for Medford shows that 179 of the married-couple family households (1.8%) and 166 of the single-parent households (4.5%) are living below the poverty level. Within the married-couple family households, those with no children have the highest poverty rate, with 131 households (2.1%) falling below the poverty line. Among the single-parent households, those with 3 or 4 children have the highest poverty rate, with 61 household (29.9%) living below poverty.
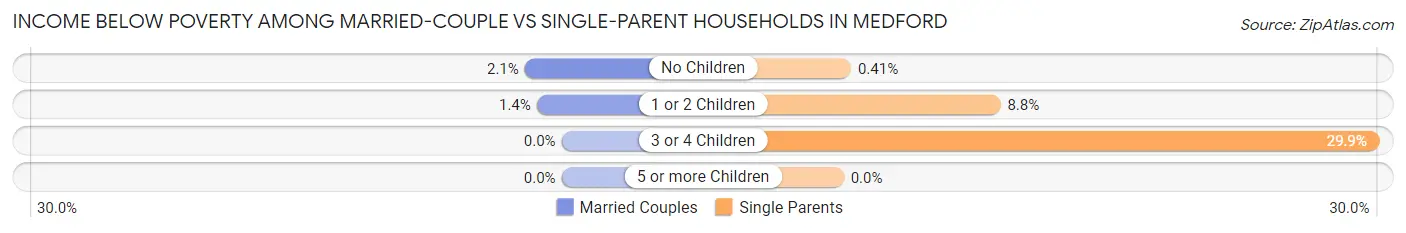
| Children | Married-Couple Families | Single-Parent Households |
| No Children | 131 (2.1%) | 10 (0.4%) |
| 1 or 2 Children | 48 (1.4%) | 95 (8.8%) |
| 3 or 4 Children | 0 (0.0%) | 61 (29.9%) |
| 5 or more Children | 0 (0.0%) | 0 (0.0%) |
| Total | 179 (1.8%) | 166 (4.5%) |
Race in Medford
The most populous races in Medford are White / Caucasian (43,098 | 69.8%), Asian (6,982 | 11.3%), and Hispanic or Latino (5,163 | 8.4%).
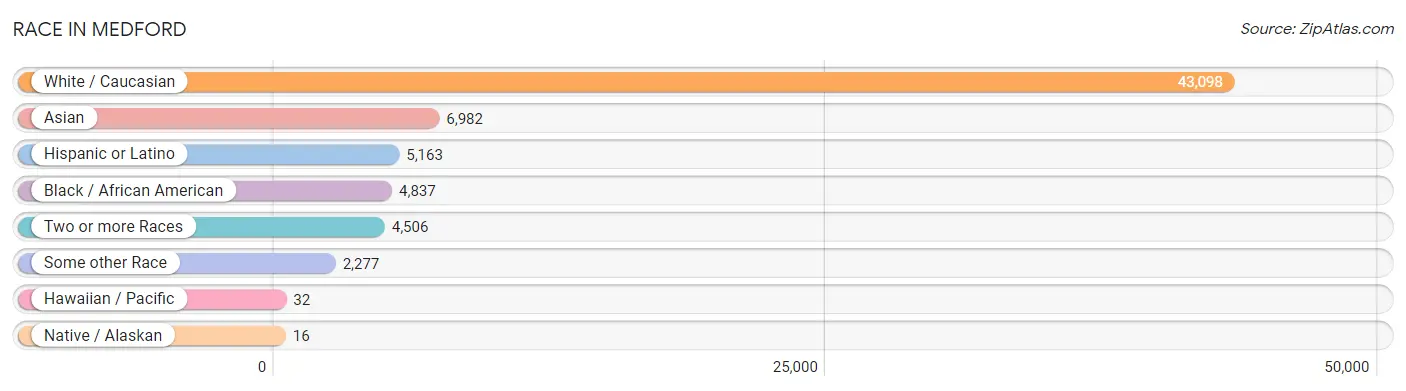
| Race | # Population | % Population |
| Asian | 6,982 | 11.3% |
| Black / African American | 4,837 | 7.8% |
| Hawaiian / Pacific | 32 | 0.1% |
| Hispanic or Latino | 5,163 | 8.4% |
| Native / Alaskan | 16 | 0.0% |
| White / Caucasian | 43,098 | 69.8% |
| Two or more Races | 4,506 | 7.3% |
| Some other Race | 2,277 | 3.7% |
| Total | 61,748 | 100.0% |
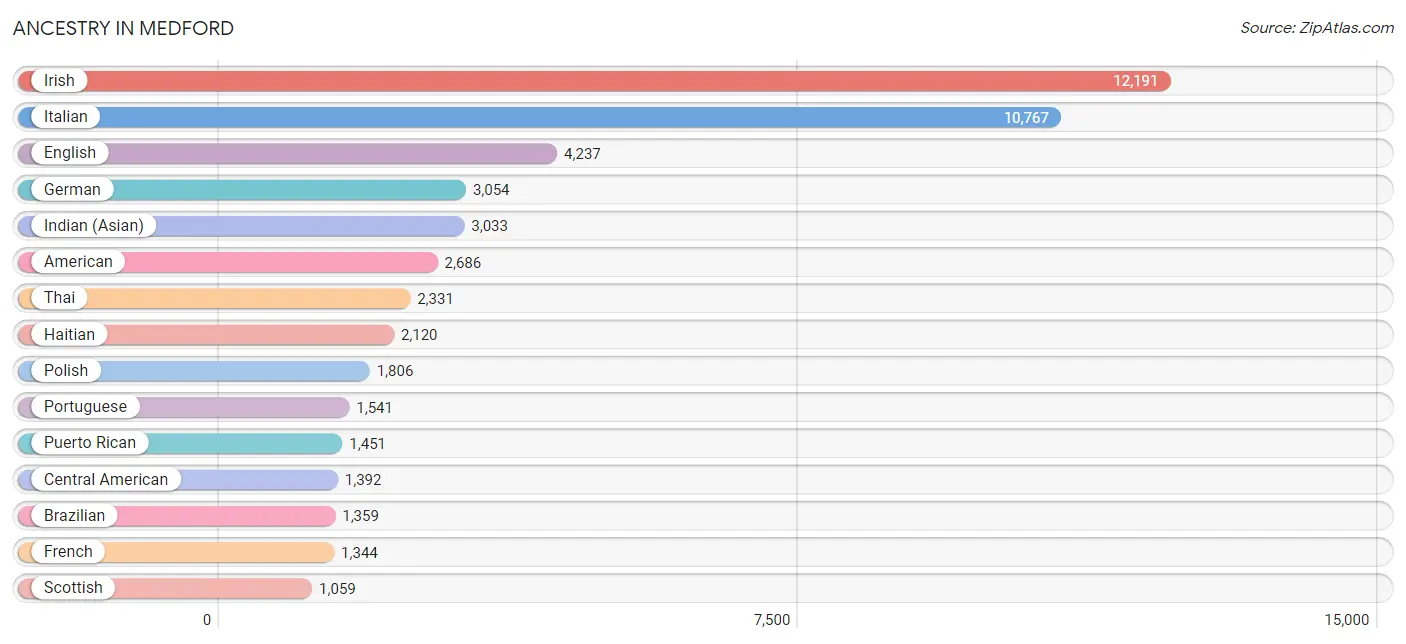
Ancestry in Medford
The most populous ancestries reported in Medford are Irish (12,191 | 19.7%), Italian (10,767 | 17.4%), English (4,237 | 6.9%), German (3,054 | 5.0%), and Indian (Asian) (3,033 | 4.9%), together accounting for 53.9% of all Medford residents.
| Ancestry | # Population | % Population |
| African | 103 | 0.2% |
| Albanian | 88 | 0.1% |
| American | 2,686 | 4.3% |
| Arab | 414 | 0.7% |
| Argentinean | 15 | 0.0% |
| Armenian | 178 | 0.3% |
| Austrian | 154 | 0.3% |
| Bangladeshi | 20 | 0.0% |
| Barbadian | 162 | 0.3% |
| Basque | 20 | 0.0% |
| Bhutanese | 247 | 0.4% |
| Bolivian | 80 | 0.1% |
| Brazilian | 1,359 | 2.2% |
| British | 219 | 0.4% |
| British West Indian | 45 | 0.1% |
| Bulgarian | 151 | 0.2% |
| Burmese | 292 | 0.5% |
| Canadian | 516 | 0.8% |
| Cape Verdean | 54 | 0.1% |
| Central American | 1,392 | 2.2% |
| Central American Indian | 160 | 0.3% |
| Cherokee | 14 | 0.0% |
| Chilean | 17 | 0.0% |
| Colombian | 394 | 0.6% |
| Croatian | 36 | 0.1% |
| Cuban | 106 | 0.2% |
| Czech | 45 | 0.1% |
| Czechoslovakian | 19 | 0.0% |
| Danish | 81 | 0.1% |
| Dominican | 168 | 0.3% |
| Dutch | 231 | 0.4% |
| Eastern European | 679 | 1.1% |
| Ecuadorian | 138 | 0.2% |
| Egyptian | 27 | 0.0% |
| English | 4,237 | 6.9% |
| Ethiopian | 102 | 0.2% |
| European | 1,017 | 1.7% |
| Filipino | 102 | 0.2% |
| Finnish | 206 | 0.3% |
| French | 1,344 | 2.2% |
| French American Indian | 5 | 0.0% |
| French Canadian | 1,016 | 1.7% |
| German | 3,054 | 5.0% |
| Ghanaian | 8 | 0.0% |
| Greek | 608 | 1.0% |
| Guamanian / Chamorro | 22 | 0.0% |
| Guatemalan | 291 | 0.5% |
| Haitian | 2,120 | 3.4% |
| Honduran | 218 | 0.4% |
| Hungarian | 134 | 0.2% |
| Icelander | 11 | 0.0% |
| Indian (Asian) | 3,033 | 4.9% |
| Iranian | 189 | 0.3% |
| Iraqi | 5 | 0.0% |
| Irish | 12,191 | 19.7% |
| Iroquois | 22 | 0.0% |
| Israeli | 5 | 0.0% |
| Italian | 10,767 | 17.4% |
| Jamaican | 100 | 0.2% |
| Japanese | 86 | 0.1% |
| Kenyan | 202 | 0.3% |
| Korean | 311 | 0.5% |
| Laotian | 107 | 0.2% |
| Latvian | 9 | 0.0% |
| Lebanese | 161 | 0.3% |
| Lithuanian | 176 | 0.3% |
| Malaysian | 34 | 0.1% |
| Maltese | 6 | 0.0% |
| Mexican | 417 | 0.7% |
| Mexican American Indian | 4 | 0.0% |
| Mongolian | 4 | 0.0% |
| Moroccan | 61 | 0.1% |
| Native Hawaiian | 10 | 0.0% |
| New Zealander | 1 | 0.0% |
| Nigerian | 150 | 0.2% |
| Northern European | 60 | 0.1% |
| Norwegian | 190 | 0.3% |
| Okinawan | 10 | 0.0% |
| Pakistani | 26 | 0.0% |
| Palestinian | 28 | 0.1% |
| Peruvian | 89 | 0.1% |
| Polish | 1,806 | 2.9% |
| Portuguese | 1,541 | 2.5% |
| Puerto Rican | 1,451 | 2.4% |
| Romanian | 173 | 0.3% |
| Russian | 905 | 1.5% |
| Salvadoran | 883 | 1.4% |
| Scandinavian | 64 | 0.1% |
| Scotch-Irish | 270 | 0.4% |
| Scottish | 1,059 | 1.7% |
| Slavic | 54 | 0.1% |
| Slovak | 22 | 0.0% |
| South American | 784 | 1.3% |
| South American Indian | 11 | 0.0% |
| Spaniard | 320 | 0.5% |
| Spanish | 88 | 0.1% |
| Sri Lankan | 554 | 0.9% |
| Subsaharan African | 619 | 1.0% |
| Swedish | 532 | 0.9% |
| Swiss | 21 | 0.0% |
| Syrian | 83 | 0.1% |
| Thai | 2,331 | 3.8% |
| Trinidadian and Tobagonian | 61 | 0.1% |
| Turkish | 119 | 0.2% |
| Ukrainian | 160 | 0.3% |
| Venezuelan | 51 | 0.1% |
| Vietnamese | 132 | 0.2% |
| Welsh | 149 | 0.2% |
| West Indian | 113 | 0.2% |
| Yugoslavian | 60 | 0.1% | View All 110 Rows |
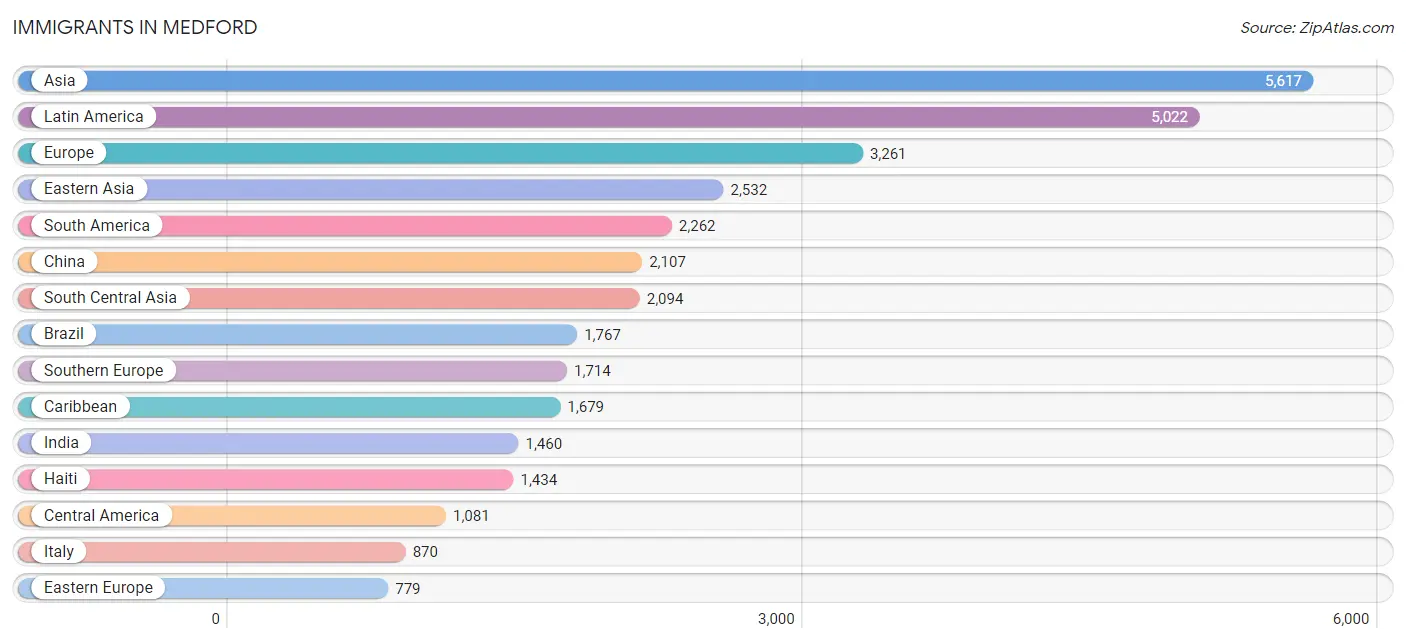
Immigrants in Medford
The most numerous immigrant groups reported in Medford came from Asia (5,617 | 9.1%), Latin America (5,022 | 8.1%), Europe (3,261 | 5.3%), Eastern Asia (2,532 | 4.1%), and South America (2,262 | 3.7%), together accounting for 30.3% of all Medford residents.
| Immigration Origin | # Population | % Population |
| Africa | 390 | 0.6% |
| Albania | 77 | 0.1% |
| Argentina | 69 | 0.1% |
| Asia | 5,617 | 9.1% |
| Australia | 27 | 0.0% |
| Azores | 85 | 0.1% |
| Bangladesh | 138 | 0.2% |
| Barbados | 40 | 0.1% |
| Belgium | 8 | 0.0% |
| Bolivia | 31 | 0.1% |
| Bosnia and Herzegovina | 46 | 0.1% |
| Brazil | 1,767 | 2.9% |
| Bulgaria | 72 | 0.1% |
| Cabo Verde | 12 | 0.0% |
| Canada | 267 | 0.4% |
| Caribbean | 1,679 | 2.7% |
| Central America | 1,081 | 1.8% |
| Chile | 17 | 0.0% |
| China | 2,107 | 3.4% |
| Colombia | 138 | 0.2% |
| Costa Rica | 21 | 0.0% |
| Czechoslovakia | 25 | 0.0% |
| Dominica | 18 | 0.0% |
| Dominican Republic | 68 | 0.1% |
| Eastern Africa | 260 | 0.4% |
| Eastern Asia | 2,532 | 4.1% |
| Eastern Europe | 779 | 1.3% |
| Ecuador | 142 | 0.2% |
| El Salvador | 641 | 1.0% |
| England | 106 | 0.2% |
| Ethiopia | 58 | 0.1% |
| Europe | 3,261 | 5.3% |
| France | 142 | 0.2% |
| Germany | 151 | 0.2% |
| Greece | 284 | 0.5% |
| Guatemala | 133 | 0.2% |
| Haiti | 1,434 | 2.3% |
| Honduras | 160 | 0.3% |
| Hong Kong | 38 | 0.1% |
| Hungary | 20 | 0.0% |
| India | 1,460 | 2.4% |
| Indonesia | 70 | 0.1% |
| Iran | 226 | 0.4% |
| Ireland | 167 | 0.3% |
| Israel | 4 | 0.0% |
| Italy | 870 | 1.4% |
| Jamaica | 50 | 0.1% |
| Japan | 100 | 0.2% |
| Kazakhstan | 21 | 0.0% |
| Kenya | 202 | 0.3% |
| Korea | 325 | 0.5% |
| Latin America | 5,022 | 8.1% |
| Lebanon | 31 | 0.1% |
| Lithuania | 20 | 0.0% |
| Mexico | 122 | 0.2% |
| Moldova | 127 | 0.2% |
| Morocco | 53 | 0.1% |
| Nepal | 210 | 0.3% |
| Netherlands | 25 | 0.0% |
| Nigeria | 4 | 0.0% |
| Northern Africa | 109 | 0.2% |
| Northern Europe | 414 | 0.7% |
| Norway | 16 | 0.0% |
| Oceania | 28 | 0.1% |
| Pakistan | 19 | 0.0% |
| Peru | 55 | 0.1% |
| Philippines | 101 | 0.2% |
| Poland | 38 | 0.1% |
| Portugal | 403 | 0.6% |
| Romania | 44 | 0.1% |
| Russia | 257 | 0.4% |
| Singapore | 24 | 0.0% |
| South America | 2,262 | 3.7% |
| South Central Asia | 2,094 | 3.4% |
| South Eastern Asia | 709 | 1.1% |
| Southern Europe | 1,714 | 2.8% |
| Spain | 151 | 0.2% |
| Sri Lanka | 4 | 0.0% |
| Switzerland | 28 | 0.1% |
| Taiwan | 141 | 0.2% |
| Thailand | 5 | 0.0% |
| Trinidad and Tobago | 40 | 0.1% |
| Turkey | 98 | 0.2% |
| Ukraine | 53 | 0.1% |
| Uzbekistan | 16 | 0.0% |
| Venezuela | 43 | 0.1% |
| Vietnam | 509 | 0.8% |
| Western Africa | 21 | 0.0% |
| Western Asia | 282 | 0.5% |
| Western Europe | 354 | 0.6% | View All 90 Rows |
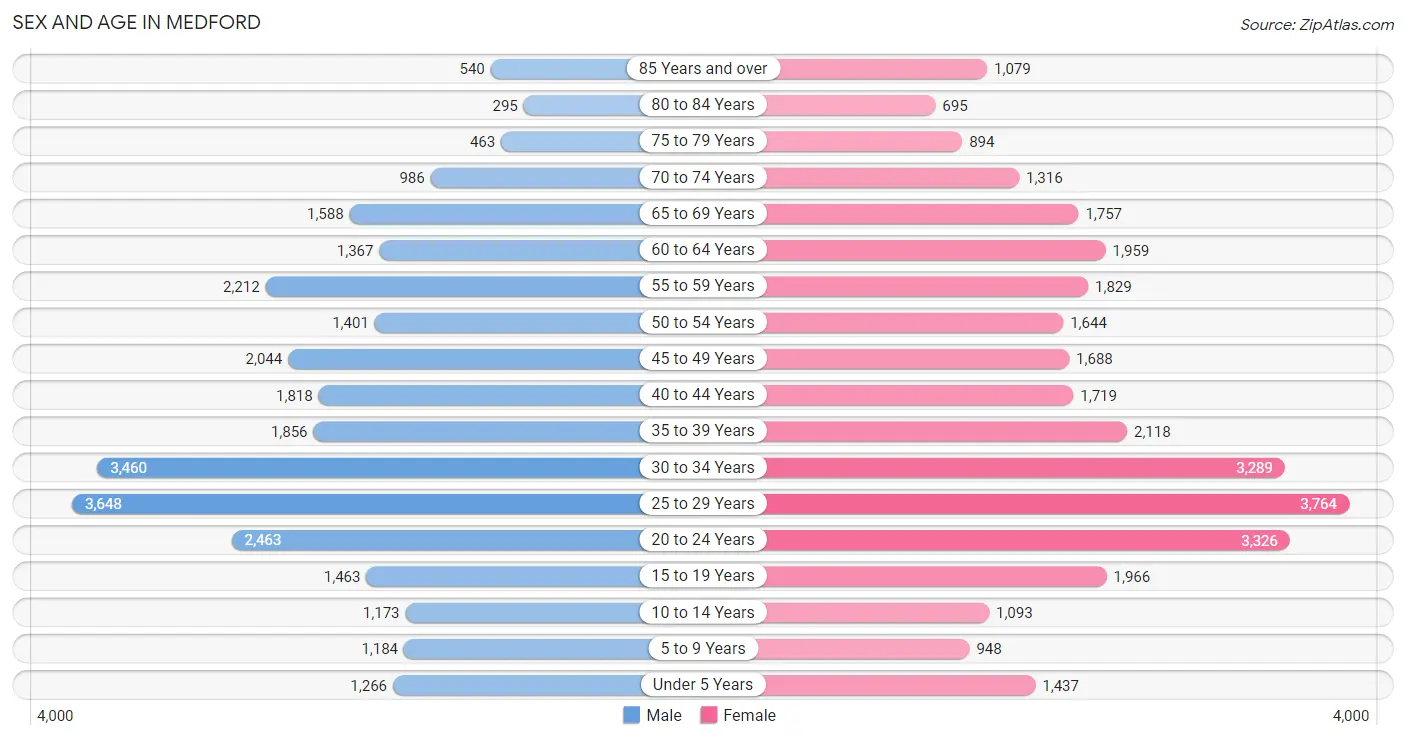
Sex and Age in Medford
Sex and Age in Medford
The most populous age groups in Medford are 25 to 29 Years (3,648 | 12.5%) for men and 25 to 29 Years (3,764 | 11.6%) for women.
| Age Bracket | Male | Female |
| Under 5 Years | 1,266 (4.3%) | 1,437 (4.4%) |
| 5 to 9 Years | 1,184 (4.1%) | 948 (2.9%) |
| 10 to 14 Years | 1,173 (4.0%) | 1,093 (3.4%) |
| 15 to 19 Years | 1,463 (5.0%) | 1,966 (6.0%) |
| 20 to 24 Years | 2,463 (8.4%) | 3,326 (10.2%) |
| 25 to 29 Years | 3,648 (12.5%) | 3,764 (11.6%) |
| 30 to 34 Years | 3,460 (11.8%) | 3,289 (10.1%) |
| 35 to 39 Years | 1,856 (6.4%) | 2,118 (6.5%) |
| 40 to 44 Years | 1,818 (6.2%) | 1,719 (5.3%) |
| 45 to 49 Years | 2,044 (7.0%) | 1,688 (5.2%) |
| 50 to 54 Years | 1,401 (4.8%) | 1,644 (5.1%) |
| 55 to 59 Years | 2,212 (7.6%) | 1,829 (5.6%) |
| 60 to 64 Years | 1,367 (4.7%) | 1,959 (6.0%) |
| 65 to 69 Years | 1,588 (5.4%) | 1,757 (5.4%) |
| 70 to 74 Years | 986 (3.4%) | 1,316 (4.1%) |
| 75 to 79 Years | 463 (1.6%) | 894 (2.8%) |
| 80 to 84 Years | 295 (1.0%) | 695 (2.1%) |
| 85 Years and over | 540 (1.8%) | 1,079 (3.3%) |
| Total | 29,227 (100.0%) | 32,521 (100.0%) |
Families and Households in Medford
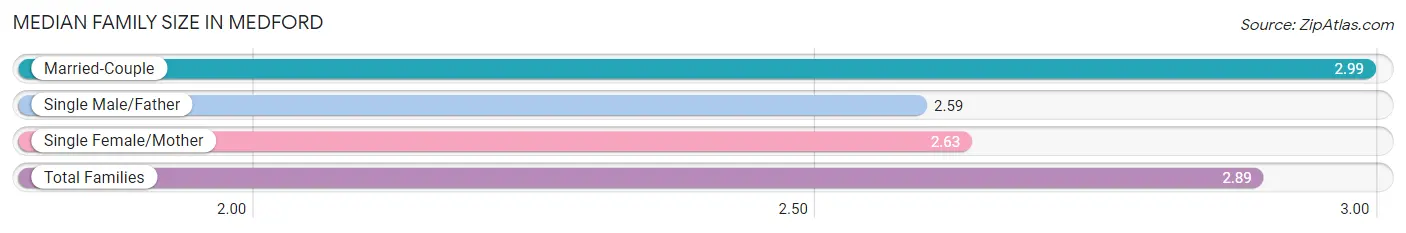
Median Family Size in Medford
The median family size in Medford is 2.89 persons per family, with married-couple families (10,211 | 73.4%) accounting for the largest median family size of 2.99 persons per family. On the other hand, single male/father families (918 | 6.6%) represent the smallest median family size with 2.59 persons per family.
| Family Type | # Families | Family Size |
| Married-Couple | 10,211 (73.4%) | 2.99 |
| Single Male/Father | 918 (6.6%) | 2.59 |
| Single Female/Mother | 2,785 (20.0%) | 2.63 |
| Total Families | 13,914 (100.0%) | 2.89 |
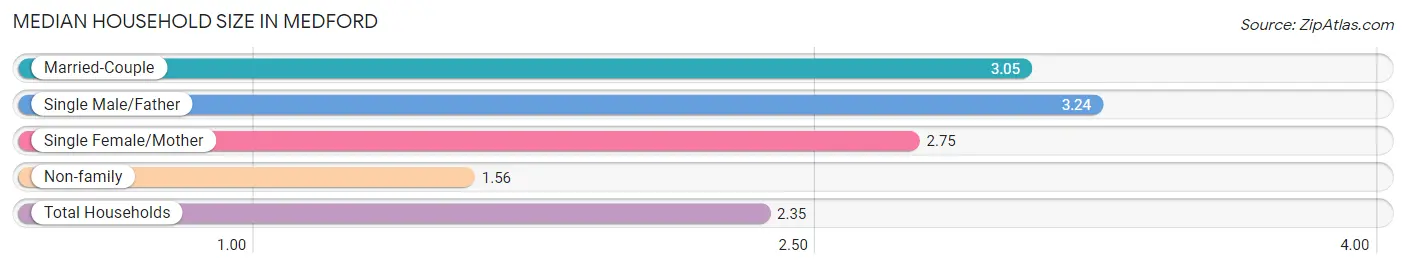
Median Household Size in Medford
The median household size in Medford is 2.35 persons per household, with single male/father households (918 | 3.6%) accounting for the largest median household size of 3.24 persons per household. non-family households (11,445 | 45.1%) represent the smallest median household size with 1.56 persons per household.
| Household Type | # Households | Household Size |
| Married-Couple | 10,211 (40.3%) | 3.05 |
| Single Male/Father | 918 (3.6%) | 3.24 |
| Single Female/Mother | 2,785 (11.0%) | 2.75 |
| Non-family | 11,445 (45.1%) | 1.56 |
| Total Households | 25,359 (100.0%) | 2.35 |
Household Size by Marriage Status in Medford
Out of a total of 25,359 households in Medford, 13,914 (54.9%) are family households, while 11,445 (45.1%) are nonfamily households. The most numerous type of family households are 2-person households, comprising 6,538, and the most common type of nonfamily households are 1-person households, comprising 7,138.
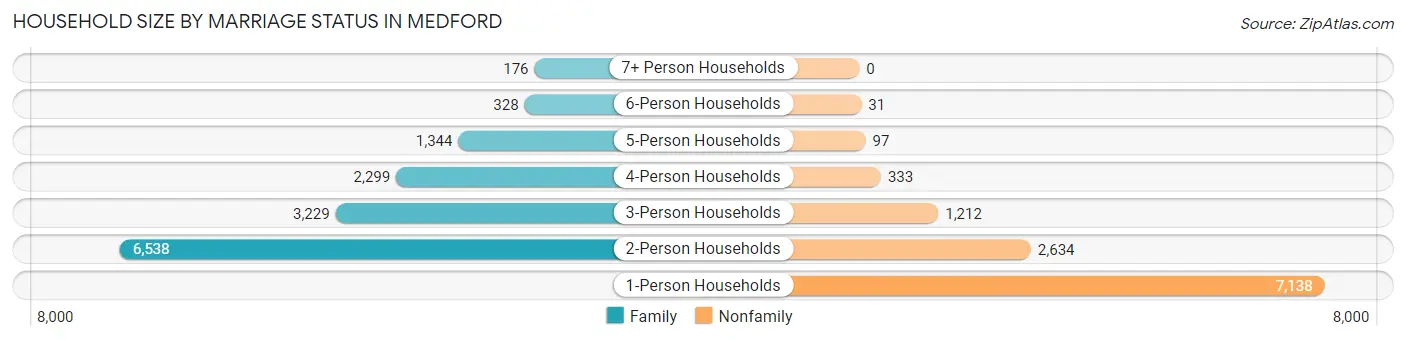
| Household Size | Family Households | Nonfamily Households |
| 1-Person Households | - | 7,138 (28.1%) |
| 2-Person Households | 6,538 (25.8%) | 2,634 (10.4%) |
| 3-Person Households | 3,229 (12.7%) | 1,212 (4.8%) |
| 4-Person Households | 2,299 (9.1%) | 333 (1.3%) |
| 5-Person Households | 1,344 (5.3%) | 97 (0.4%) |
| 6-Person Households | 328 (1.3%) | 31 (0.1%) |
| 7+ Person Households | 176 (0.7%) | 0 (0.0%) |
| Total | 13,914 (54.9%) | 11,445 (45.1%) |
Female Fertility in Medford
Fertility by Age in Medford
Average fertility rate in Medford is 38.0 births per 1,000 women. Women in the age bracket of 20 to 34 years have the highest fertility rate with 46.0 births per 1,000 women. Women in the age bracket of 20 to 34 years acount for 69.3% of all women with births.
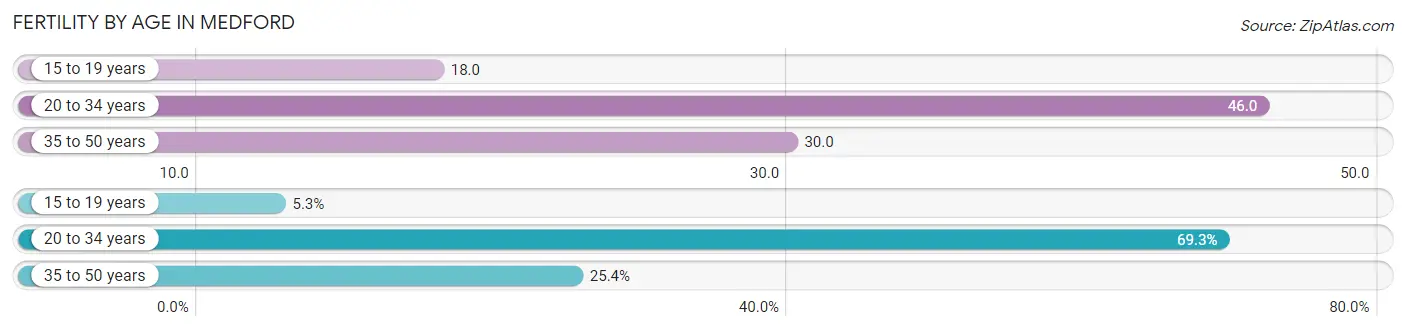
| Age Bracket | Women with Births | Births / 1,000 Women |
| 15 to 19 years | 36 (5.3%) | 18.0 |
| 20 to 34 years | 474 (69.3%) | 46.0 |
| 35 to 50 years | 174 (25.4%) | 30.0 |
| Total | 684 (100.0%) | 38.0 |
Fertility by Age by Marriage Status in Medford
92.3% of women with births (684) in Medford are married. The highest percentage of unmarried women with births falls into 15 to 19 years age bracket with 100.0% of them unmarried at the time of birth, while the lowest percentage of unmarried women with births belong to 20 to 34 years age bracket with 1.7% of them unmarried.
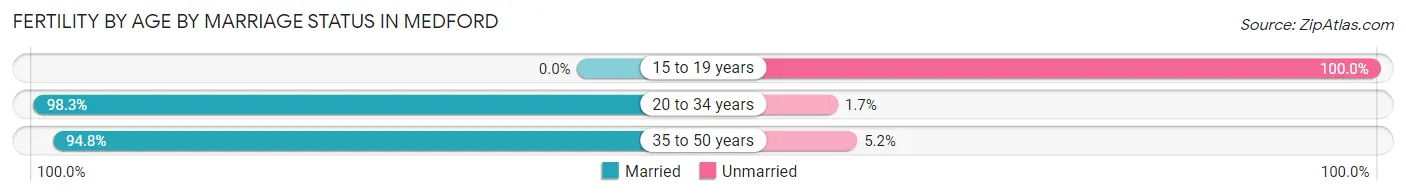
| Age Bracket | Married | Unmarried |
| 15 to 19 years | 0 (0.0%) | 36 (100.0%) |
| 20 to 34 years | 466 (98.3%) | 8 (1.7%) |
| 35 to 50 years | 165 (94.8%) | 9 (5.2%) |
| Total | 631 (92.2%) | 53 (7.7%) |
Fertility by Education in Medford
Average fertility rate in Medford is 38.0 births per 1,000 women. Women with the education attainment of graduate degree have the highest fertility rate of 87.0 births per 1,000 women, while women with the education attainment of college or associate's degree have the lowest fertility at 3.0 births per 1,000 women. Women with the education attainment of graduate degree represent 59.8% of all women with births.
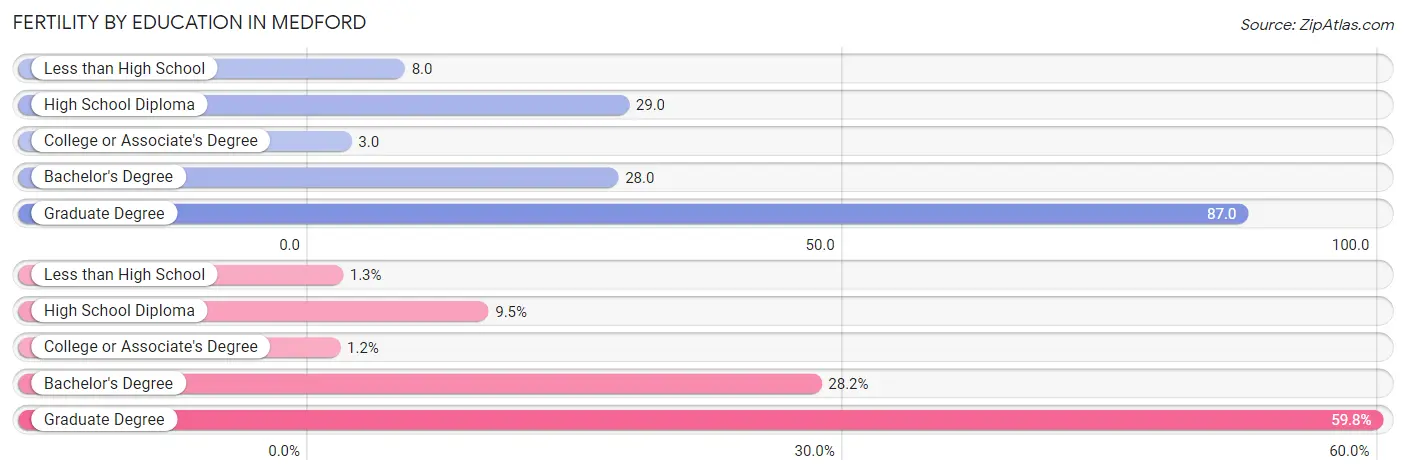
| Educational Attainment | Women with Births | Births / 1,000 Women |
| Less than High School | 9 (1.3%) | 8.0 |
| High School Diploma | 65 (9.5%) | 29.0 |
| College or Associate's Degree | 8 (1.2%) | 3.0 |
| Bachelor's Degree | 193 (28.2%) | 28.0 |
| Graduate Degree | 409 (59.8%) | 87.0 |
| Total | 684 (100.0%) | 38.0 |
Fertility by Education by Marriage Status in Medford
7.7% of women with births in Medford are unmarried. Women with the educational attainment of bachelor's degree are most likely to be married with 100.0% of them married at childbirth, while women with the educational attainment of less than high school are least likely to be married with 100.0% of them unmarried at childbirth.
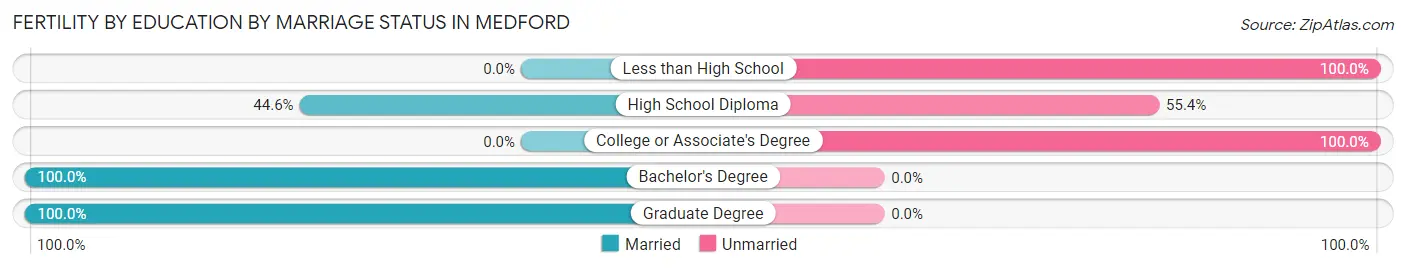
| Educational Attainment | Married | Unmarried |
| Less than High School | 0 (0.0%) | 9 (100.0%) |
| High School Diploma | 29 (44.6%) | 36 (55.4%) |
| College or Associate's Degree | 0 (0.0%) | 8 (100.0%) |
| Bachelor's Degree | 193 (100.0%) | 0 (0.0%) |
| Graduate Degree | 409 (100.0%) | 0 (0.0%) |
| Total | 631 (92.2%) | 53 (7.7%) |
Employment Characteristics in Medford
Employment by Class of Employer in Medford
Among the 36,245 employed individuals in Medford, private company employees (24,281 | 67.0%), not-for-profit organizations (5,555 | 15.3%), and local government employees (2,103 | 5.8%) make up the most common classes of employment.
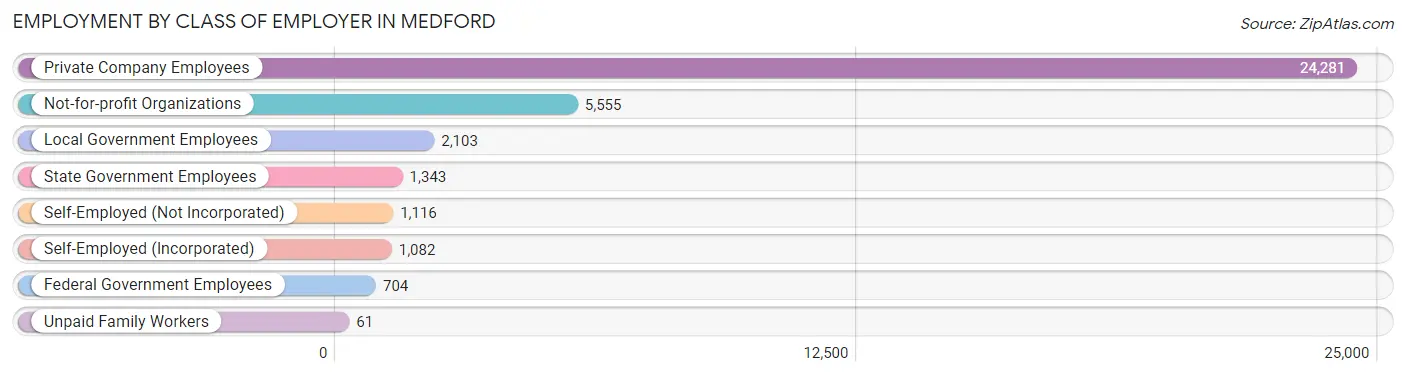
| Employer Class | # Employees | % Employees |
| Private Company Employees | 24,281 | 67.0% |
| Self-Employed (Incorporated) | 1,082 | 3.0% |
| Self-Employed (Not Incorporated) | 1,116 | 3.1% |
| Not-for-profit Organizations | 5,555 | 15.3% |
| Local Government Employees | 2,103 | 5.8% |
| State Government Employees | 1,343 | 3.7% |
| Federal Government Employees | 704 | 1.9% |
| Unpaid Family Workers | 61 | 0.2% |
| Total | 36,245 | 100.0% |
Employment Status by Age in Medford
According to the labor force statistics for Medford, out of the total population over 16 years of age (54,258), 72.1% or 39,120 individuals are in the labor force, with 4.2% or 1,643 of them unemployed. The age group with the highest labor force participation rate is 30 to 34 years, with 91.8% or 6,196 individuals in the labor force. Within the labor force, the 75 years and over age range has the highest percentage of unemployed individuals, with 12.5% or 39 of them being unemployed.
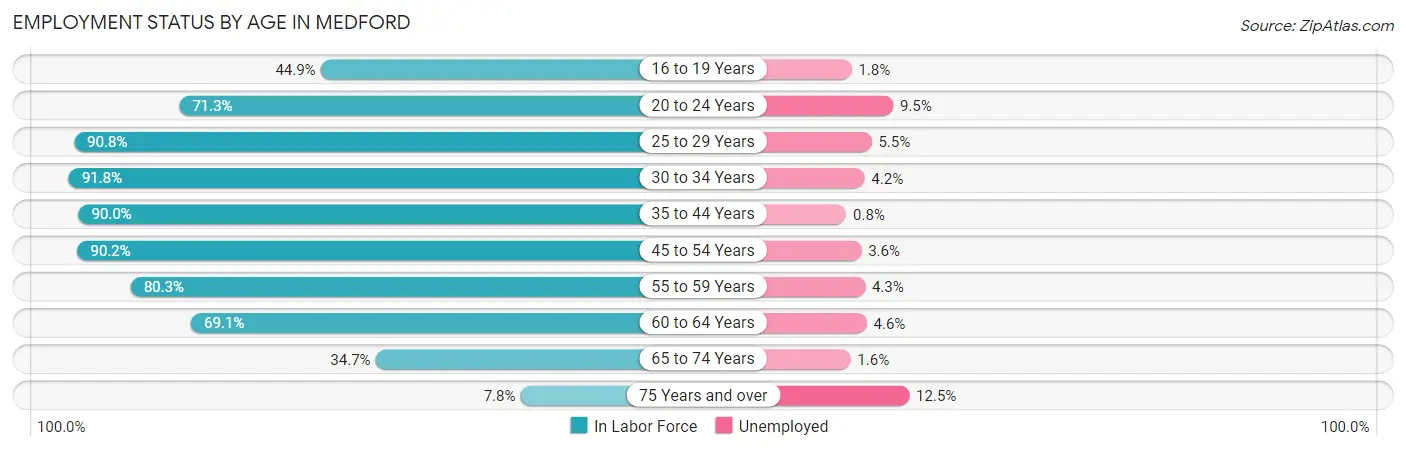
| Age Bracket | In Labor Force | Unemployed |
| 16 to 19 Years | 1,365 (44.9%) | 25 (1.8%) |
| 20 to 24 Years | 4,128 (71.3%) | 392 (9.5%) |
| 25 to 29 Years | 6,730 (90.8%) | 370 (5.5%) |
| 30 to 34 Years | 6,196 (91.8%) | 260 (4.2%) |
| 35 to 44 Years | 6,760 (90.0%) | 54 (0.8%) |
| 45 to 54 Years | 6,113 (90.2%) | 220 (3.6%) |
| 55 to 59 Years | 3,245 (80.3%) | 140 (4.3%) |
| 60 to 64 Years | 2,298 (69.1%) | 106 (4.6%) |
| 65 to 74 Years | 1,960 (34.7%) | 31 (1.6%) |
| 75 Years and over | 309 (7.8%) | 39 (12.5%) |
| Total | 39,120 (72.1%) | 1,643 (4.2%) |
Employment Status by Educational Attainment in Medford
According to labor force statistics for Medford, 87.5% of individuals (31,339) out of the total population between 25 and 64 years of age (35,816) are in the labor force, with 3.7% or 1,160 of them being unemployed. The group with the highest labor force participation rate are those with the educational attainment of bachelor's degree or higher, with 91.7% or 20,995 individuals in the labor force. Within the labor force, individuals with less than high school education have the highest percentage of unemployment, with 8.8% or 120 of them being unemployed.
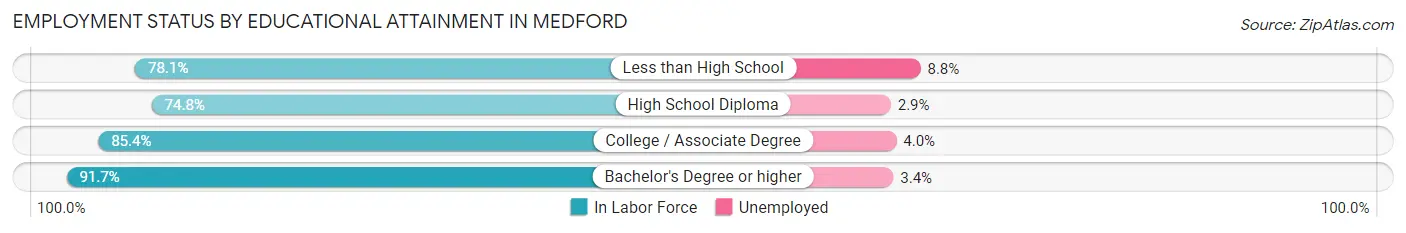
| Educational Attainment | In Labor Force | Unemployed |
| Less than High School | 1,361 (78.1%) | 153 (8.8%) |
| High School Diploma | 4,068 (74.8%) | 158 (2.9%) |
| College / Associate Degree | 4,901 (85.4%) | 230 (4.0%) |
| Bachelor's Degree or higher | 20,995 (91.7%) | 778 (3.4%) |
| Total | 31,339 (87.5%) | 1,325 (3.7%) |
Employment Occupations by Sex in Medford
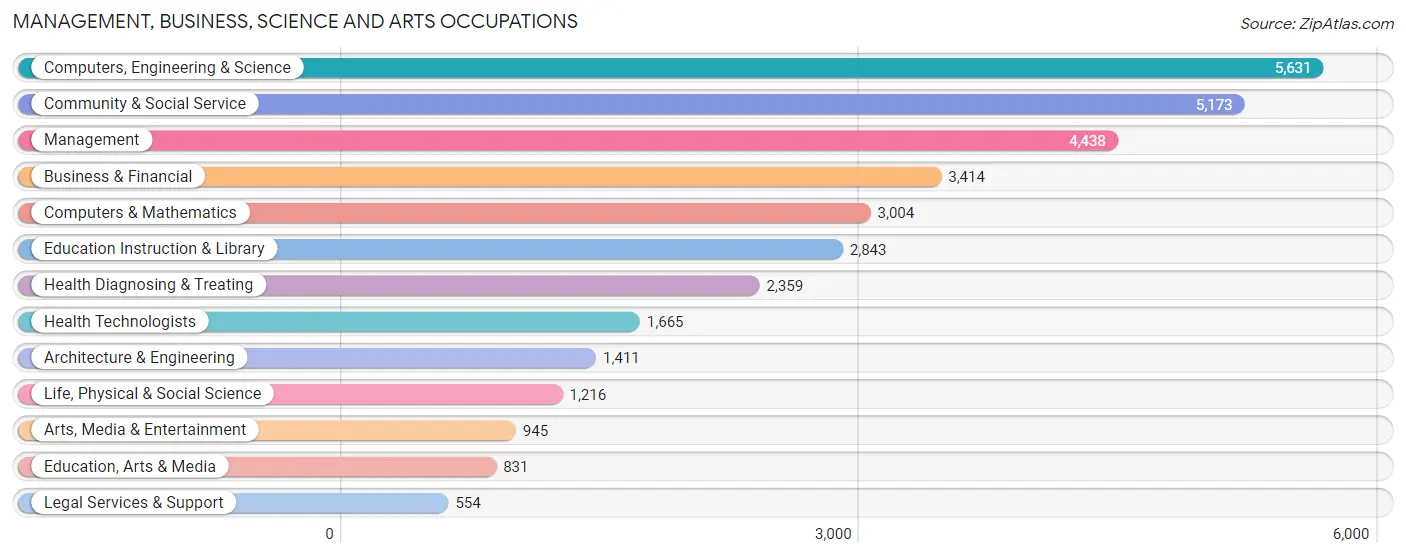
Management, Business, Science and Arts Occupations
The most common Management, Business, Science and Arts occupations in Medford are Computers, Engineering & Science (5,631 | 15.1%), Community & Social Service (5,173 | 13.9%), Management (4,438 | 11.9%), Business & Financial (3,414 | 9.1%), and Computers & Mathematics (3,004 | 8.0%).
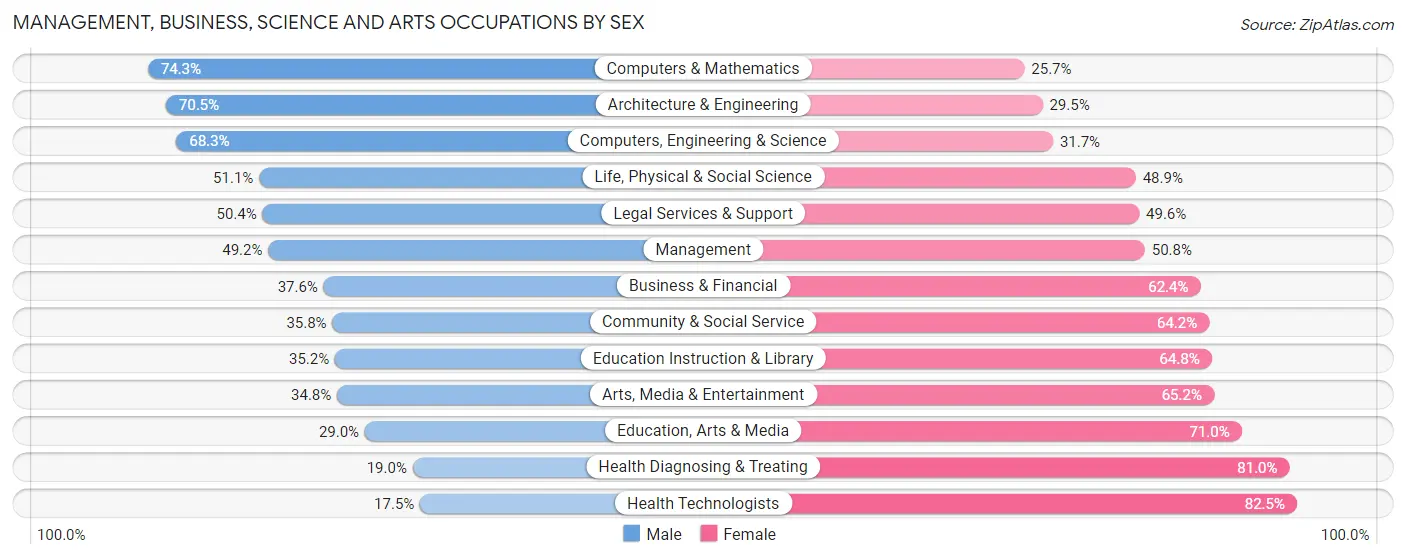
Management, Business, Science and Arts Occupations by Sex
Within the Management, Business, Science and Arts occupations in Medford, the most male-oriented occupations are Computers & Mathematics (74.3%), Architecture & Engineering (70.5%), and Computers, Engineering & Science (68.3%), while the most female-oriented occupations are Health Technologists (82.5%), Health Diagnosing & Treating (81.0%), and Education, Arts & Media (71.0%).
| Occupation | Male | Female |
| Management | 2,182 (49.2%) | 2,256 (50.8%) |
| Business & Financial | 1,284 (37.6%) | 2,130 (62.4%) |
| Computers, Engineering & Science | 3,848 (68.3%) | 1,783 (31.7%) |
| Computers & Mathematics | 2,232 (74.3%) | 772 (25.7%) |
| Architecture & Engineering | 995 (70.5%) | 416 (29.5%) |
| Life, Physical & Social Science | 621 (51.1%) | 595 (48.9%) |
| Community & Social Service | 1,851 (35.8%) | 3,322 (64.2%) |
| Education, Arts & Media | 241 (29.0%) | 590 (71.0%) |
| Legal Services & Support | 279 (50.4%) | 275 (49.6%) |
| Education Instruction & Library | 1,002 (35.2%) | 1,841 (64.8%) |
| Arts, Media & Entertainment | 329 (34.8%) | 616 (65.2%) |
| Health Diagnosing & Treating | 449 (19.0%) | 1,910 (81.0%) |
| Health Technologists | 291 (17.5%) | 1,374 (82.5%) |
| Total (Category) | 9,614 (45.8%) | 11,401 (54.2%) |
| Total (Overall) | 17,873 (47.9%) | 19,474 (52.1%) |
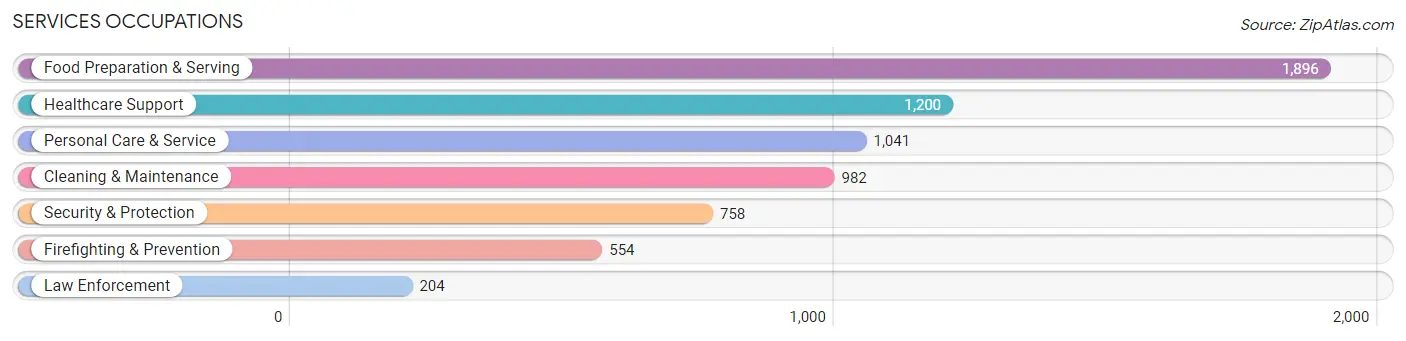
Services Occupations
The most common Services occupations in Medford are Food Preparation & Serving (1,896 | 5.1%), Healthcare Support (1,200 | 3.2%), Personal Care & Service (1,041 | 2.8%), Cleaning & Maintenance (982 | 2.6%), and Security & Protection (758 | 2.0%).
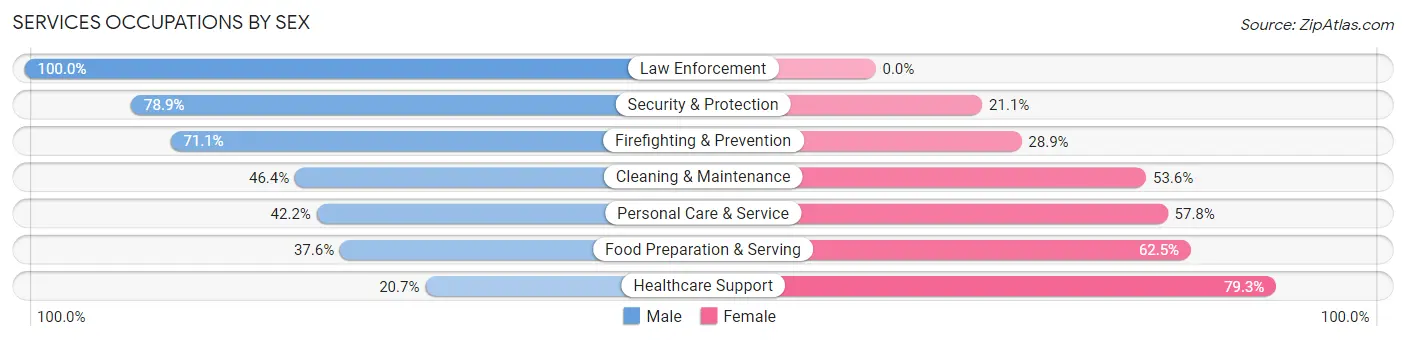
Services Occupations by Sex
Within the Services occupations in Medford, the most male-oriented occupations are Law Enforcement (100.0%), Security & Protection (78.9%), and Firefighting & Prevention (71.1%), while the most female-oriented occupations are Healthcare Support (79.3%), Food Preparation & Serving (62.5%), and Personal Care & Service (57.8%).
| Occupation | Male | Female |
| Healthcare Support | 248 (20.7%) | 952 (79.3%) |
| Security & Protection | 598 (78.9%) | 160 (21.1%) |
| Firefighting & Prevention | 394 (71.1%) | 160 (28.9%) |
| Law Enforcement | 204 (100.0%) | 0 (0.0%) |
| Food Preparation & Serving | 712 (37.6%) | 1,184 (62.5%) |
| Cleaning & Maintenance | 456 (46.4%) | 526 (53.6%) |
| Personal Care & Service | 439 (42.2%) | 602 (57.8%) |
| Total (Category) | 2,453 (41.7%) | 3,424 (58.3%) |
| Total (Overall) | 17,873 (47.9%) | 19,474 (52.1%) |
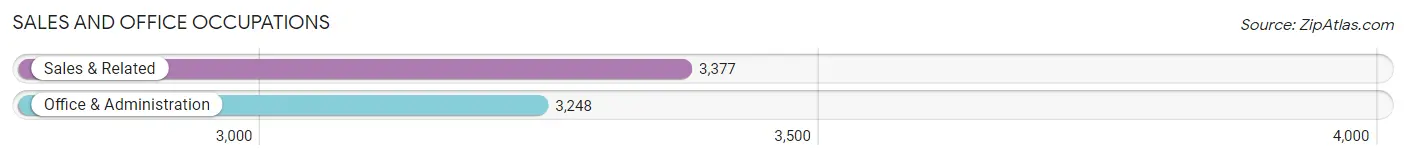
Sales and Office Occupations
The most common Sales and Office occupations in Medford are Sales & Related (3,377 | 9.0%), and Office & Administration (3,248 | 8.7%).
Sales and Office Occupations by Sex
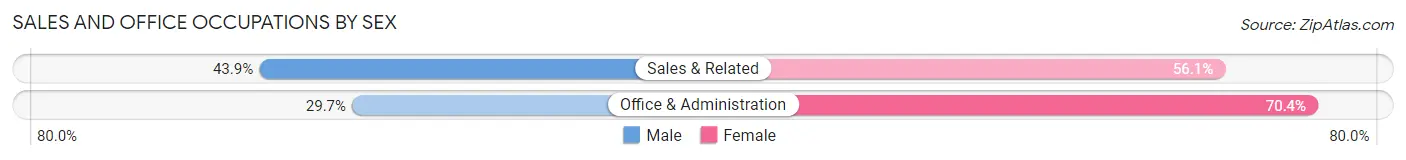
| Occupation | Male | Female |
| Sales & Related | 1,484 (43.9%) | 1,893 (56.1%) |
| Office & Administration | 963 (29.6%) | 2,285 (70.4%) |
| Total (Category) | 2,447 (36.9%) | 4,178 (63.1%) |
| Total (Overall) | 17,873 (47.9%) | 19,474 (52.1%) |
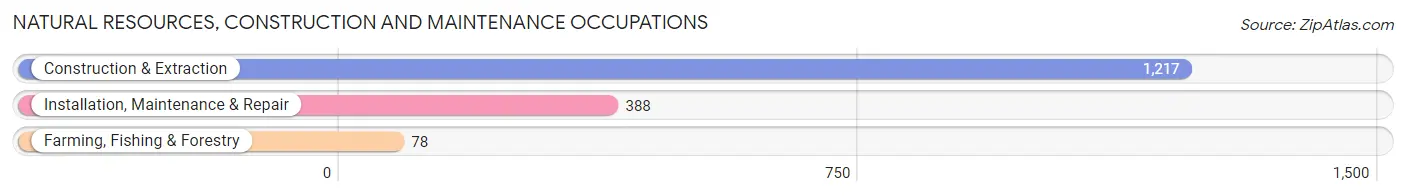
Natural Resources, Construction and Maintenance Occupations
The most common Natural Resources, Construction and Maintenance occupations in Medford are Construction & Extraction (1,217 | 3.3%), Installation, Maintenance & Repair (388 | 1.0%), and Farming, Fishing & Forestry (78 | 0.2%).
Natural Resources, Construction and Maintenance Occupations by Sex
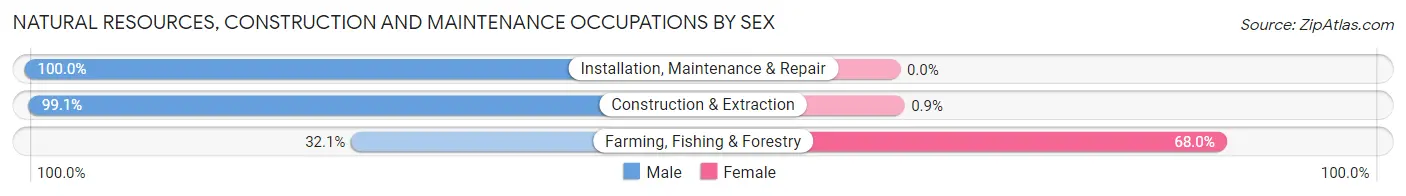
| Occupation | Male | Female |
| Farming, Fishing & Forestry | 25 (32.1%) | 53 (67.9%) |
| Construction & Extraction | 1,206 (99.1%) | 11 (0.9%) |
| Installation, Maintenance & Repair | 388 (100.0%) | 0 (0.0%) |
| Total (Category) | 1,619 (96.2%) | 64 (3.8%) |
| Total (Overall) | 17,873 (47.9%) | 19,474 (52.1%) |
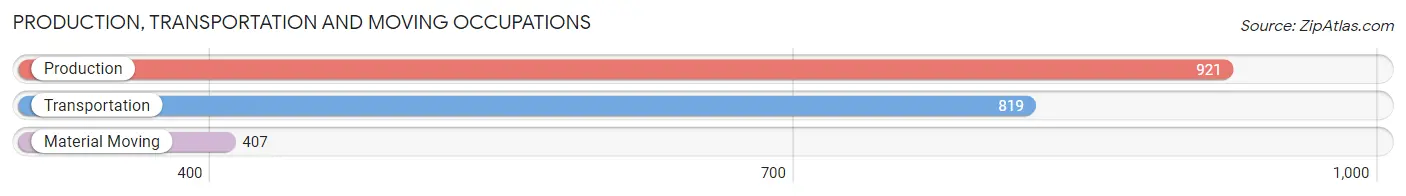
Production, Transportation and Moving Occupations
The most common Production, Transportation and Moving occupations in Medford are Production (921 | 2.5%), Transportation (819 | 2.2%), and Material Moving (407 | 1.1%).
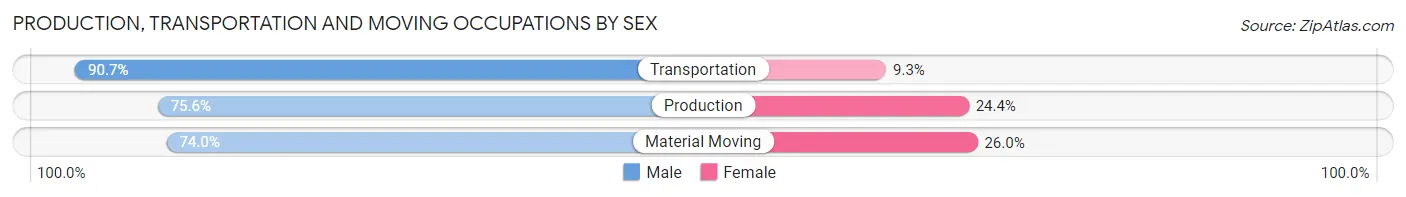
Production, Transportation and Moving Occupations by Sex
| Occupation | Male | Female |
| Production | 696 (75.6%) | 225 (24.4%) |
| Transportation | 743 (90.7%) | 76 (9.3%) |
| Material Moving | 301 (74.0%) | 106 (26.0%) |
| Total (Category) | 1,740 (81.0%) | 407 (19.0%) |
| Total (Overall) | 17,873 (47.9%) | 19,474 (52.1%) |
Employment Industries by Sex in Medford
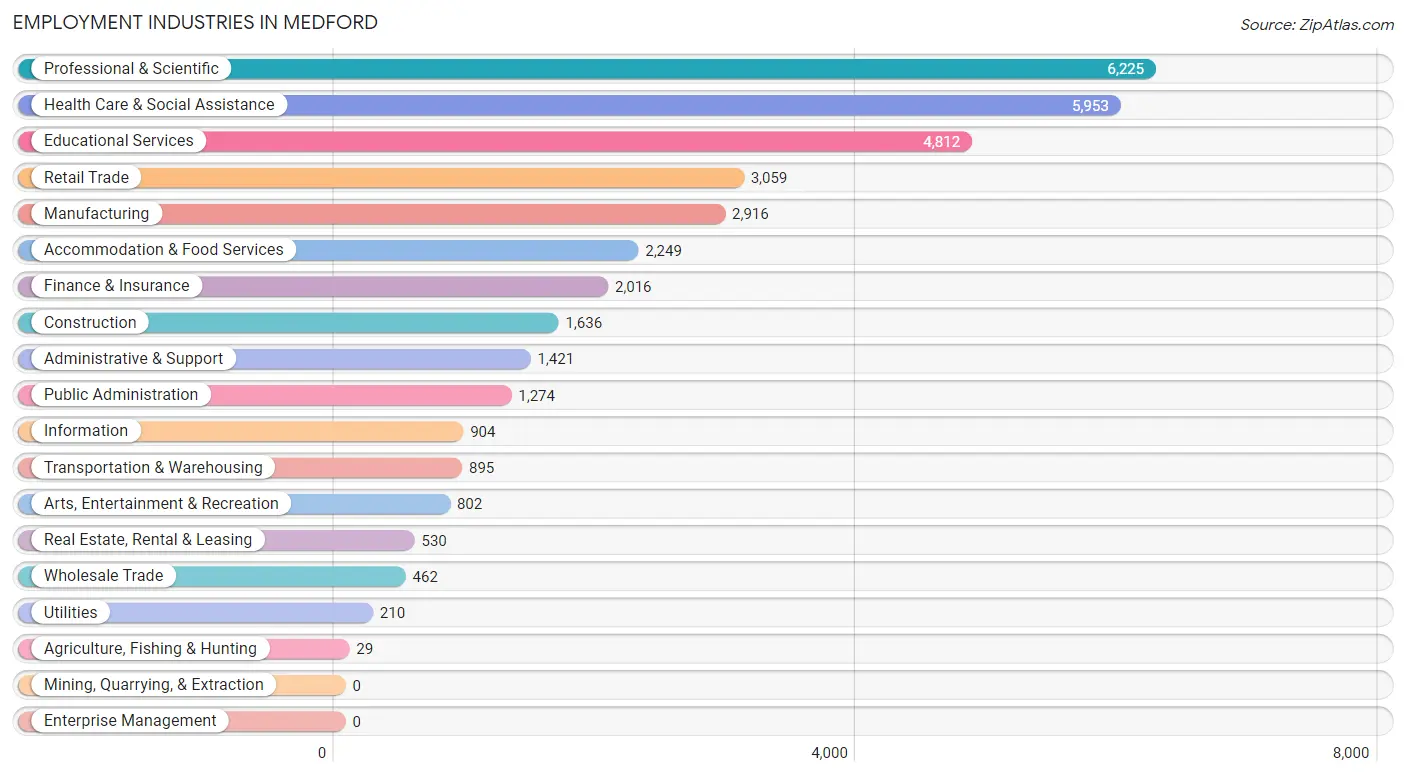
Employment Industries in Medford
The major employment industries in Medford include Professional & Scientific (6,225 | 16.7%), Health Care & Social Assistance (5,953 | 15.9%), Educational Services (4,812 | 12.9%), Retail Trade (3,059 | 8.2%), and Manufacturing (2,916 | 7.8%).
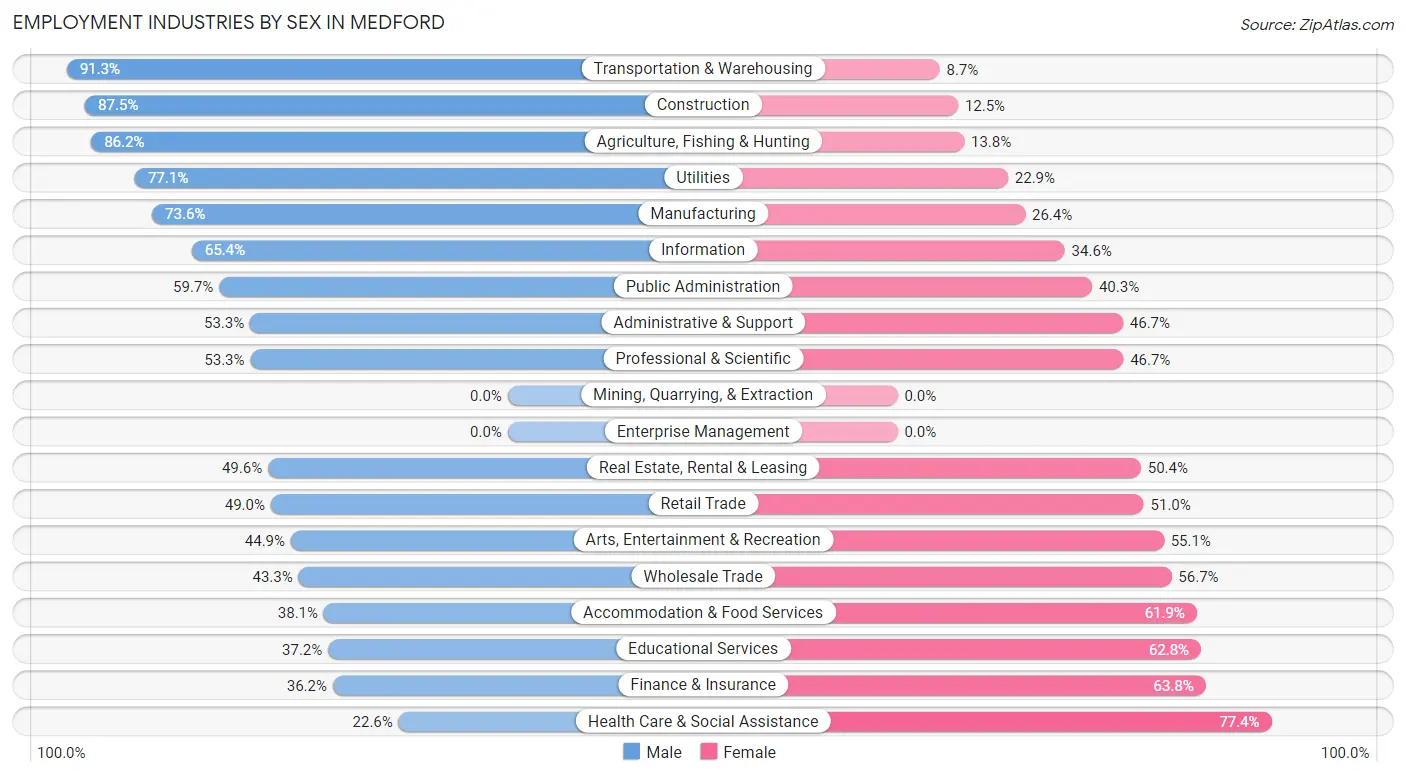
Employment Industries by Sex in Medford
The Medford industries that see more men than women are Transportation & Warehousing (91.3%), Construction (87.5%), and Agriculture, Fishing & Hunting (86.2%), whereas the industries that tend to have a higher number of women are Health Care & Social Assistance (77.4%), Finance & Insurance (63.8%), and Educational Services (62.8%).
| Industry | Male | Female |
| Agriculture, Fishing & Hunting | 25 (86.2%) | 4 (13.8%) |
| Mining, Quarrying, & Extraction | 0 (0.0%) | 0 (0.0%) |
| Construction | 1,431 (87.5%) | 205 (12.5%) |
| Manufacturing | 2,146 (73.6%) | 770 (26.4%) |
| Wholesale Trade | 200 (43.3%) | 262 (56.7%) |
| Retail Trade | 1,500 (49.0%) | 1,559 (51.0%) |
| Transportation & Warehousing | 817 (91.3%) | 78 (8.7%) |
| Utilities | 162 (77.1%) | 48 (22.9%) |
| Information | 591 (65.4%) | 313 (34.6%) |
| Finance & Insurance | 730 (36.2%) | 1,286 (63.8%) |
| Real Estate, Rental & Leasing | 263 (49.6%) | 267 (50.4%) |
| Professional & Scientific | 3,316 (53.3%) | 2,909 (46.7%) |
| Enterprise Management | 0 (0.0%) | 0 (0.0%) |
| Administrative & Support | 758 (53.3%) | 663 (46.7%) |
| Educational Services | 1,789 (37.2%) | 3,023 (62.8%) |
| Health Care & Social Assistance | 1,345 (22.6%) | 4,608 (77.4%) |
| Arts, Entertainment & Recreation | 360 (44.9%) | 442 (55.1%) |
| Accommodation & Food Services | 856 (38.1%) | 1,393 (61.9%) |
| Public Administration | 761 (59.7%) | 513 (40.3%) |
| Total | 17,873 (47.9%) | 19,474 (52.1%) |
Education in Medford
School Enrollment in Medford
The most common levels of schooling among the 13,677 students in Medford are college / undergraduate (4,598 | 33.6%), graduate / professional (2,500 | 18.3%), and high school (1,827 | 13.4%).
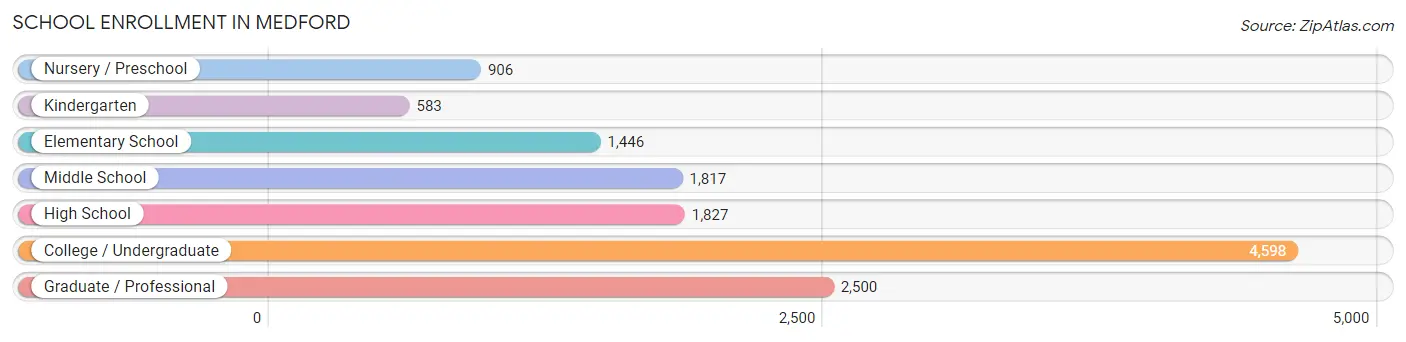
| School Level | # Students | % Students |
| Nursery / Preschool | 906 | 6.6% |
| Kindergarten | 583 | 4.3% |
| Elementary School | 1,446 | 10.6% |
| Middle School | 1,817 | 13.3% |
| High School | 1,827 | 13.4% |
| College / Undergraduate | 4,598 | 33.6% |
| Graduate / Professional | 2,500 | 18.3% |
| Total | 13,677 | 100.0% |
School Enrollment by Age by Funding Source in Medford
Out of a total of 13,677 students who are enrolled in schools in Medford, 6,428 (47.0%) attend a private institution, while the remaining 7,249 (53.0%) are enrolled in public schools. The age group of 18 to 19 year olds has the highest likelihood of being enrolled in private schools, with 1,263 (71.8% in the age bracket) enrolled. Conversely, the age group of 15 to 17 year olds has the lowest likelihood of being enrolled in a private school, with 1,156 (87.3% in the age bracket) attending a public institution.
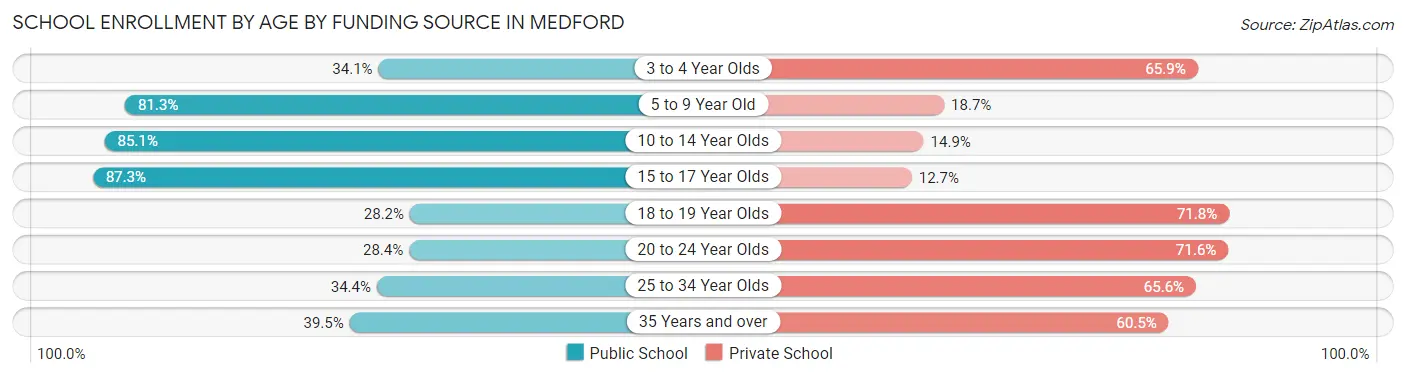
| Age Bracket | Public School | Private School |
| 3 to 4 Year Olds | 222 (34.1%) | 429 (65.9%) |
| 5 to 9 Year Old | 1,689 (81.3%) | 389 (18.7%) |
| 10 to 14 Year Olds | 1,890 (85.1%) | 331 (14.9%) |
| 15 to 17 Year Olds | 1,156 (87.3%) | 168 (12.7%) |
| 18 to 19 Year Olds | 497 (28.2%) | 1,263 (71.8%) |
| 20 to 24 Year Olds | 835 (28.4%) | 2,106 (71.6%) |
| 25 to 34 Year Olds | 696 (34.4%) | 1,327 (65.6%) |
| 35 Years and over | 268 (39.5%) | 411 (60.5%) |
| Total | 7,249 (53.0%) | 6,428 (47.0%) |
Educational Attainment by Field of Study in Medford
Engineering (3,971 | 14.3%), business (3,790 | 13.7%), social sciences (3,072 | 11.1%), bio, nature & agricultural (2,468 | 8.9%), and education (1,955 | 7.1%) are the most common fields of study among 27,671 individuals in Medford who have obtained a bachelor's degree or higher.
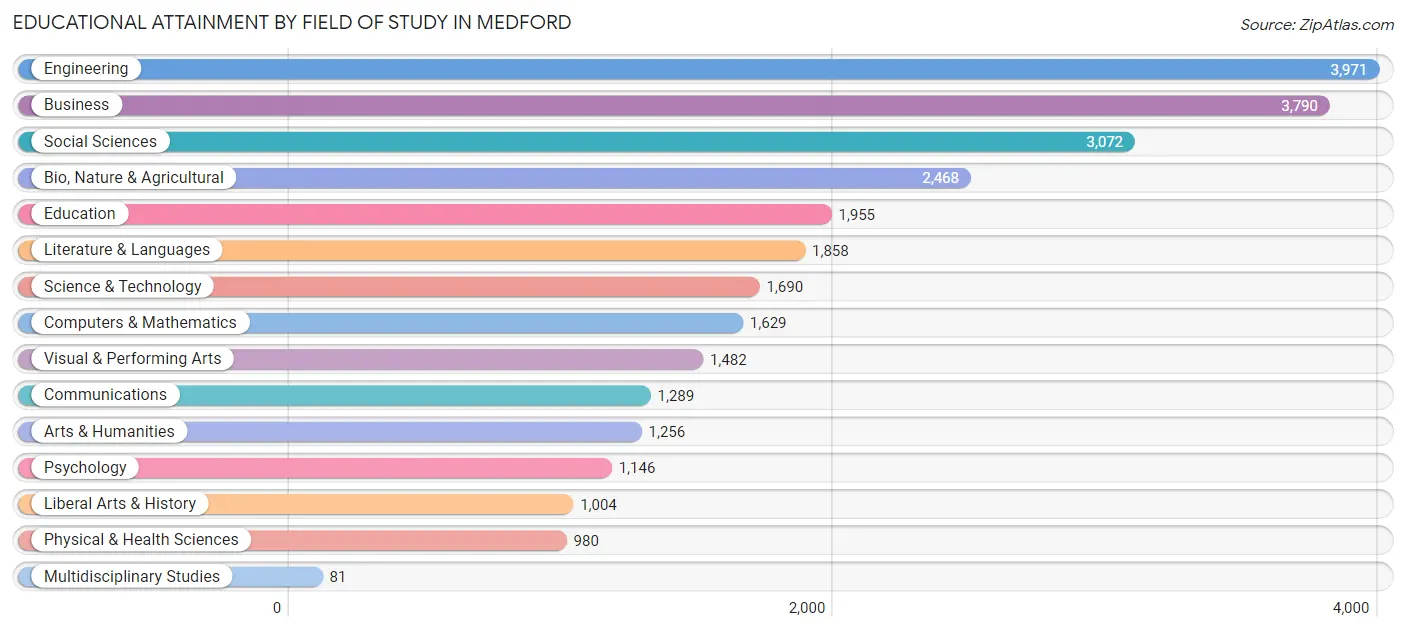
| Field of Study | # Graduates | % Graduates |
| Computers & Mathematics | 1,629 | 5.9% |
| Bio, Nature & Agricultural | 2,468 | 8.9% |
| Physical & Health Sciences | 980 | 3.5% |
| Psychology | 1,146 | 4.1% |
| Social Sciences | 3,072 | 11.1% |
| Engineering | 3,971 | 14.3% |
| Multidisciplinary Studies | 81 | 0.3% |
| Science & Technology | 1,690 | 6.1% |
| Business | 3,790 | 13.7% |
| Education | 1,955 | 7.1% |
| Literature & Languages | 1,858 | 6.7% |
| Liberal Arts & History | 1,004 | 3.6% |
| Visual & Performing Arts | 1,482 | 5.4% |
| Communications | 1,289 | 4.7% |
| Arts & Humanities | 1,256 | 4.5% |
| Total | 27,671 | 100.0% |
Transportation & Commute in Medford
Vehicle Availability by Sex in Medford
The most prevalent vehicle ownership categories in Medford are males with 2 vehicles (6,782, accounting for 39.6%) and females with 2 vehicles (6,814, making up 36.5%).
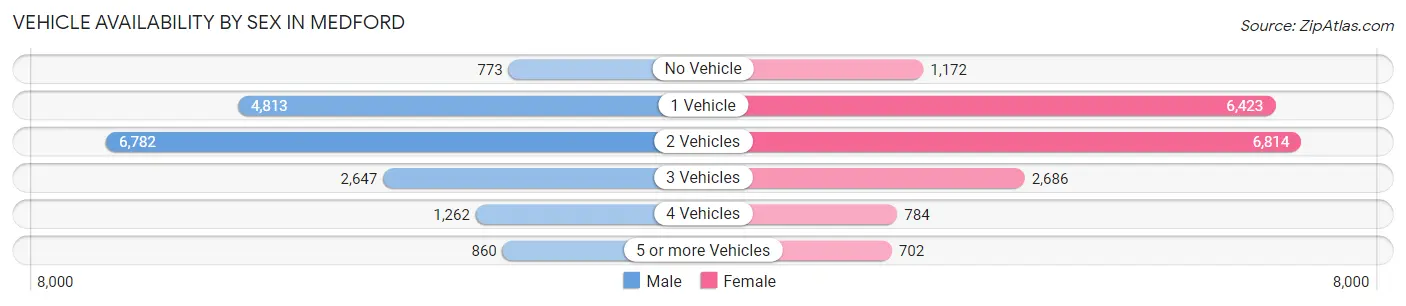
| Vehicles Available | Male | Female |
| No Vehicle | 773 (4.5%) | 1,172 (6.3%) |
| 1 Vehicle | 4,813 (28.1%) | 6,423 (34.6%) |
| 2 Vehicles | 6,782 (39.6%) | 6,814 (36.7%) |
| 3 Vehicles | 2,647 (15.4%) | 2,686 (14.5%) |
| 4 Vehicles | 1,262 (7.4%) | 784 (4.2%) |
| 5 or more Vehicles | 860 (5.0%) | 702 (3.8%) |
| Total | 17,137 (100.0%) | 18,581 (100.0%) |
Commute Time in Medford
The most frequently occuring commute durations in Medford are 20 to 24 minutes (5,083 commuters, 17.2%), 30 to 34 minutes (5,075 commuters, 17.2%), and 45 to 59 minutes (4,129 commuters, 14.0%).
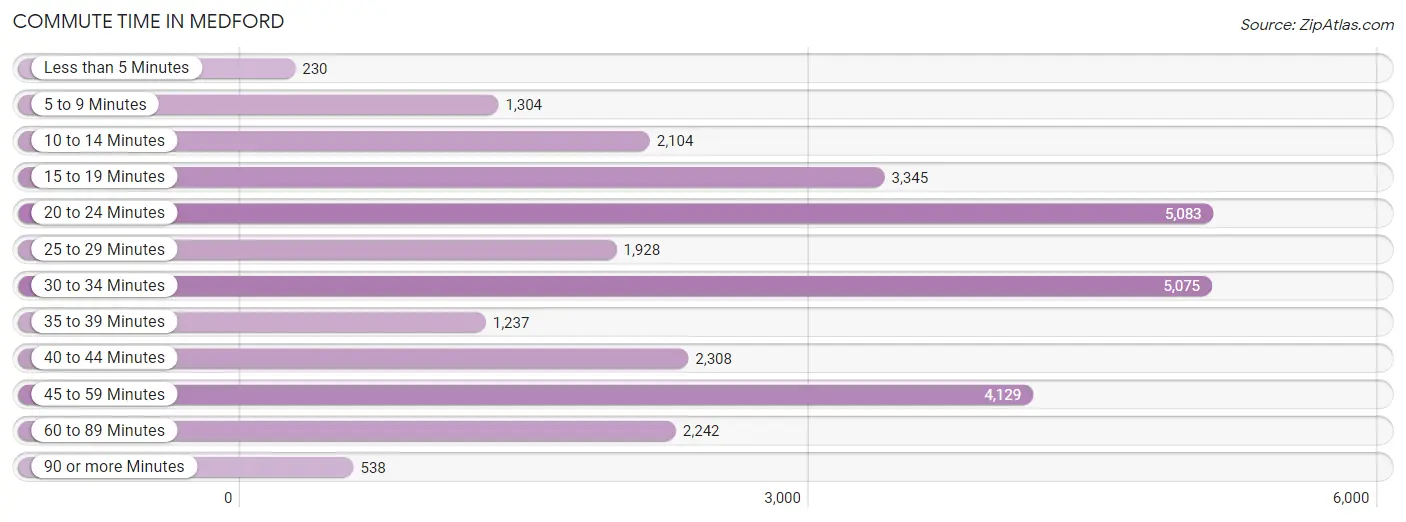
| Commute Time | # Commuters | % Commuters |
| Less than 5 Minutes | 230 | 0.8% |
| 5 to 9 Minutes | 1,304 | 4.4% |
| 10 to 14 Minutes | 2,104 | 7.1% |
| 15 to 19 Minutes | 3,345 | 11.3% |
| 20 to 24 Minutes | 5,083 | 17.2% |
| 25 to 29 Minutes | 1,928 | 6.5% |
| 30 to 34 Minutes | 5,075 | 17.2% |
| 35 to 39 Minutes | 1,237 | 4.2% |
| 40 to 44 Minutes | 2,308 | 7.8% |
| 45 to 59 Minutes | 4,129 | 14.0% |
| 60 to 89 Minutes | 2,242 | 7.6% |
| 90 or more Minutes | 538 | 1.8% |
Commute Time by Sex in Medford
The most common commute times in Medford are 30 to 34 minutes (2,738 commuters, 19.5%) for males and 45 to 59 minutes (2,426 commuters, 15.6%) for females.
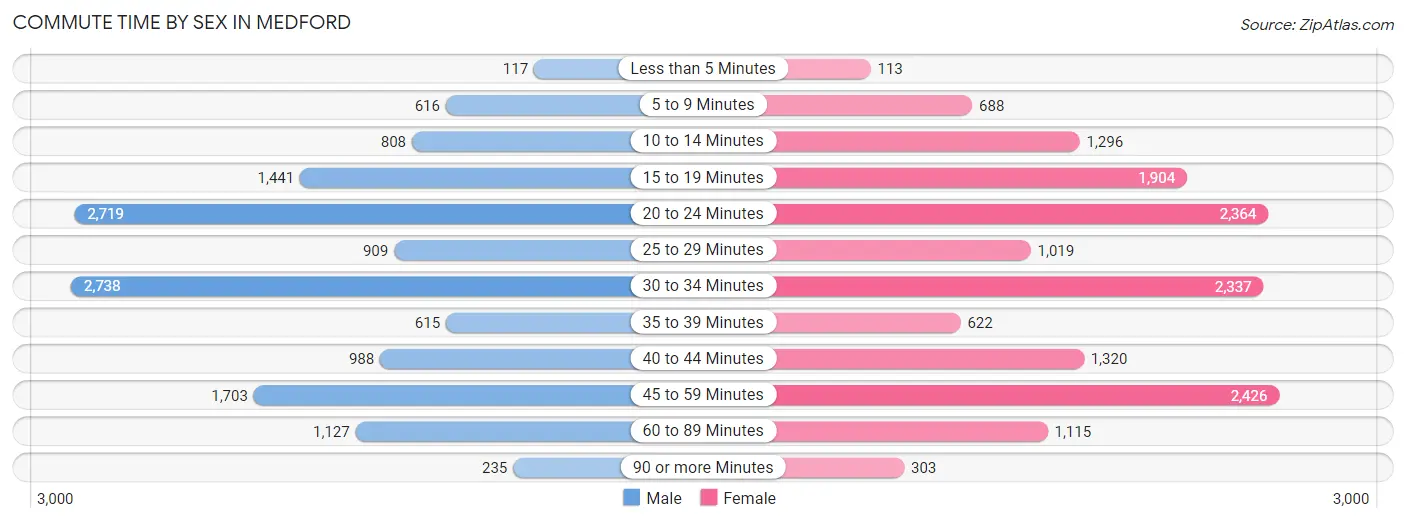
| Commute Time | Male | Female |
| Less than 5 Minutes | 117 (0.8%) | 113 (0.7%) |
| 5 to 9 Minutes | 616 (4.4%) | 688 (4.4%) |
| 10 to 14 Minutes | 808 (5.8%) | 1,296 (8.4%) |
| 15 to 19 Minutes | 1,441 (10.3%) | 1,904 (12.3%) |
| 20 to 24 Minutes | 2,719 (19.4%) | 2,364 (15.2%) |
| 25 to 29 Minutes | 909 (6.5%) | 1,019 (6.6%) |
| 30 to 34 Minutes | 2,738 (19.5%) | 2,337 (15.1%) |
| 35 to 39 Minutes | 615 (4.4%) | 622 (4.0%) |
| 40 to 44 Minutes | 988 (7.0%) | 1,320 (8.5%) |
| 45 to 59 Minutes | 1,703 (12.1%) | 2,426 (15.6%) |
| 60 to 89 Minutes | 1,127 (8.0%) | 1,115 (7.2%) |
| 90 or more Minutes | 235 (1.7%) | 303 (1.9%) |
Time of Departure to Work by Sex in Medford
The most frequent times of departure to work in Medford are 8:00 AM to 8:29 AM (2,142, 15.3%) for males and 7:00 AM to 7:29 AM (2,585, 16.7%) for females.
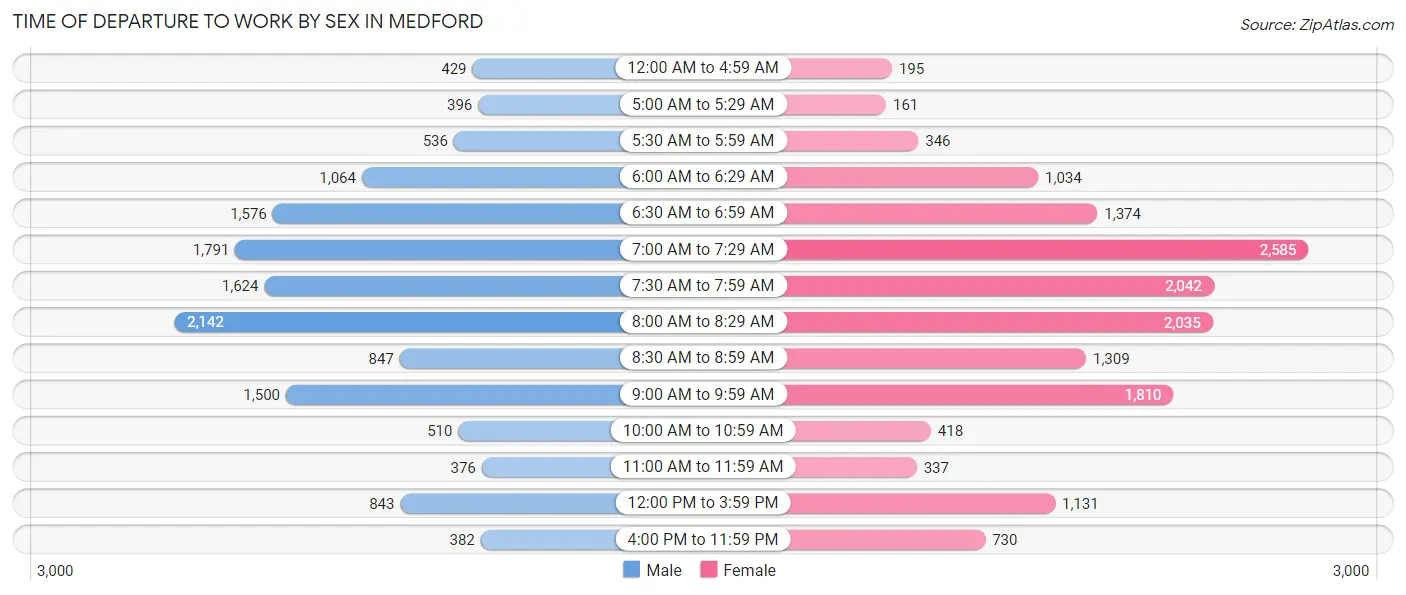
| Time of Departure | Male | Female |
| 12:00 AM to 4:59 AM | 429 (3.1%) | 195 (1.3%) |
| 5:00 AM to 5:29 AM | 396 (2.8%) | 161 (1.0%) |
| 5:30 AM to 5:59 AM | 536 (3.8%) | 346 (2.2%) |
| 6:00 AM to 6:29 AM | 1,064 (7.6%) | 1,034 (6.7%) |
| 6:30 AM to 6:59 AM | 1,576 (11.2%) | 1,374 (8.9%) |
| 7:00 AM to 7:29 AM | 1,791 (12.8%) | 2,585 (16.7%) |
| 7:30 AM to 7:59 AM | 1,624 (11.6%) | 2,042 (13.2%) |
| 8:00 AM to 8:29 AM | 2,142 (15.3%) | 2,035 (13.1%) |
| 8:30 AM to 8:59 AM | 847 (6.0%) | 1,309 (8.4%) |
| 9:00 AM to 9:59 AM | 1,500 (10.7%) | 1,810 (11.7%) |
| 10:00 AM to 10:59 AM | 510 (3.6%) | 418 (2.7%) |
| 11:00 AM to 11:59 AM | 376 (2.7%) | 337 (2.2%) |
| 12:00 PM to 3:59 PM | 843 (6.0%) | 1,131 (7.3%) |
| 4:00 PM to 11:59 PM | 382 (2.7%) | 730 (4.7%) |
| Total | 14,016 (100.0%) | 15,507 (100.0%) |
Housing Occupancy in Medford
Occupancy by Ownership in Medford
Of the total 25,359 dwellings in Medford, owner-occupied units account for 13,520 (53.3%), while renter-occupied units make up 11,839 (46.7%).
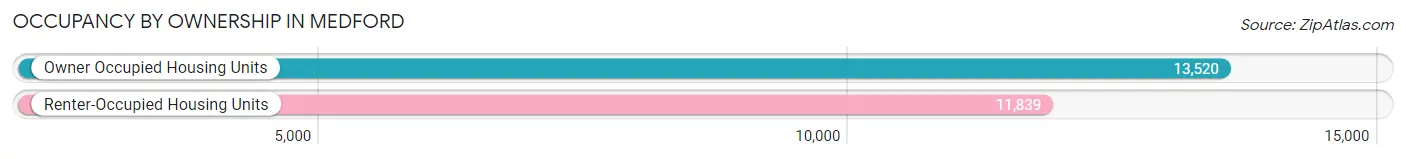
| Occupancy | # Housing Units | % Housing Units |
| Owner Occupied Housing Units | 13,520 | 53.3% |
| Renter-Occupied Housing Units | 11,839 | 46.7% |
| Total Occupied Housing Units | 25,359 | 100.0% |
Occupancy by Household Size in Medford
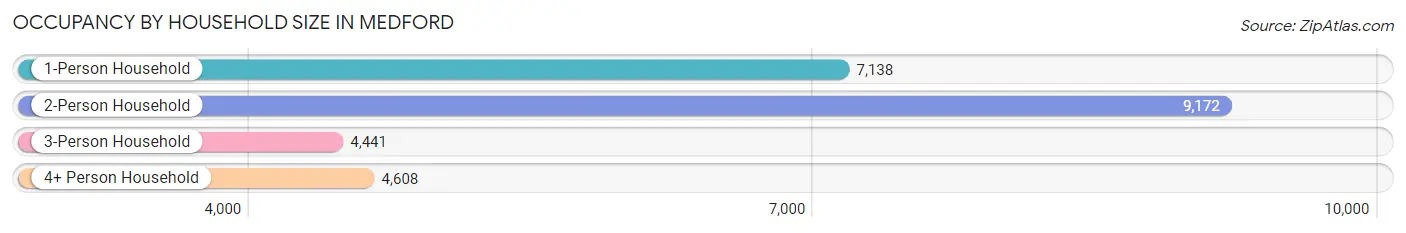
| Household Size | # Housing Units | % Housing Units |
| 1-Person Household | 7,138 | 28.1% |
| 2-Person Household | 9,172 | 36.2% |
| 3-Person Household | 4,441 | 17.5% |
| 4+ Person Household | 4,608 | 18.2% |
| Total Housing Units | 25,359 | 100.0% |
Occupancy by Ownership by Household Size in Medford
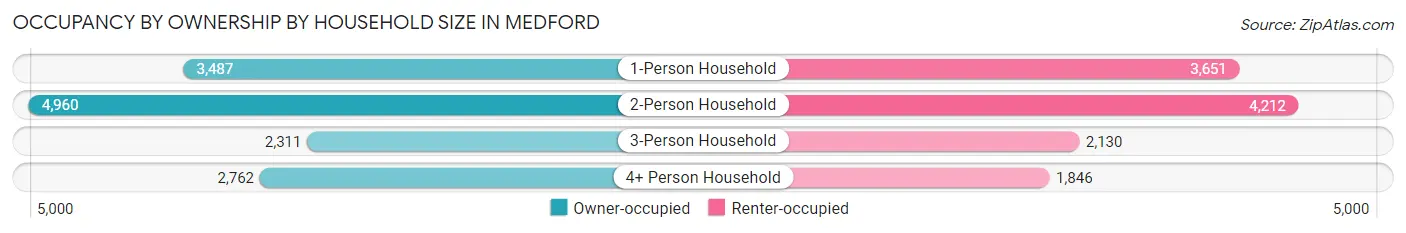
| Household Size | Owner-occupied | Renter-occupied |
| 1-Person Household | 3,487 (48.8%) | 3,651 (51.1%) |
| 2-Person Household | 4,960 (54.1%) | 4,212 (45.9%) |
| 3-Person Household | 2,311 (52.0%) | 2,130 (48.0%) |
| 4+ Person Household | 2,762 (59.9%) | 1,846 (40.1%) |
| Total Housing Units | 13,520 (53.3%) | 11,839 (46.7%) |
Occupancy by Educational Attainment in Medford
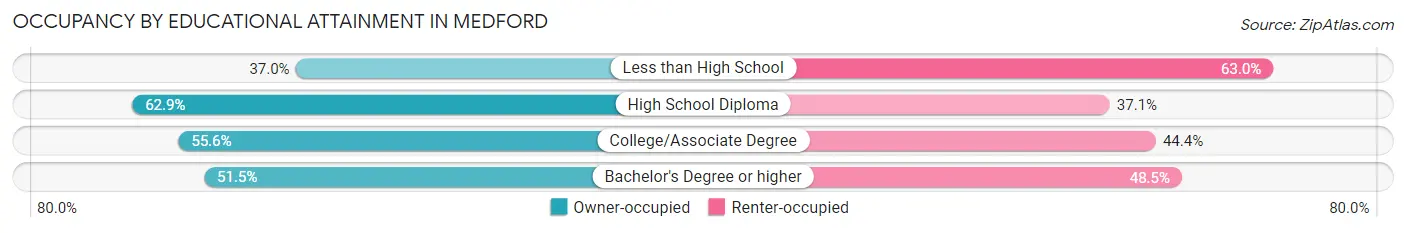
| Household Size | Owner-occupied | Renter-occupied |
| Less than High School | 666 (37.0%) | 1,132 (63.0%) |
| High School Diploma | 2,808 (62.9%) | 1,654 (37.1%) |
| College/Associate Degree | 2,780 (55.6%) | 2,218 (44.4%) |
| Bachelor's Degree or higher | 7,266 (51.5%) | 6,835 (48.5%) |
Occupancy by Age of Householder in Medford
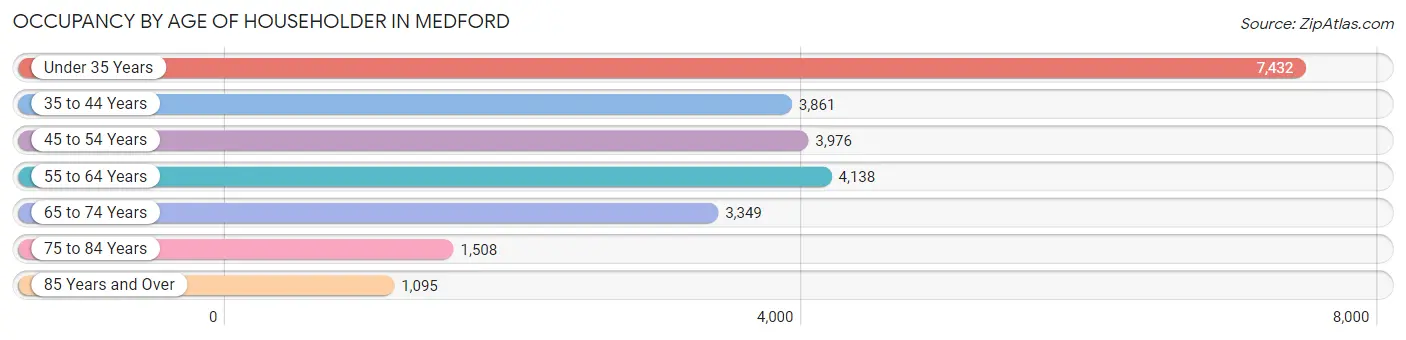
| Age Bracket | # Households | % Households |
| Under 35 Years | 7,432 | 29.3% |
| 35 to 44 Years | 3,861 | 15.2% |
| 45 to 54 Years | 3,976 | 15.7% |
| 55 to 64 Years | 4,138 | 16.3% |
| 65 to 74 Years | 3,349 | 13.2% |
| 75 to 84 Years | 1,508 | 5.9% |
| 85 Years and Over | 1,095 | 4.3% |
| Total | 25,359 | 100.0% |
Housing Finances in Medford
Median Income by Occupancy in Medford
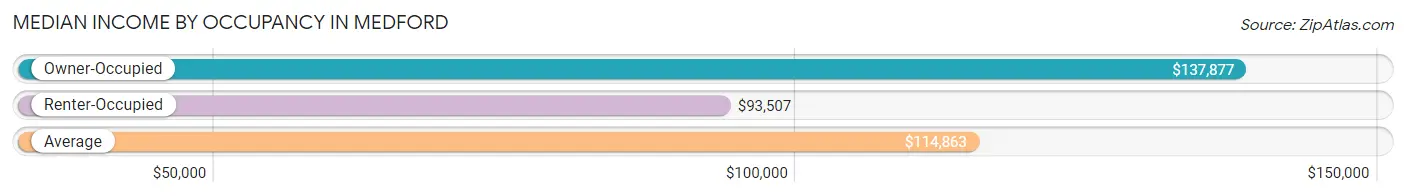
| Occupancy Type | # Households | Median Income |
| Owner-Occupied | 13,520 (53.3%) | $137,877 |
| Renter-Occupied | 11,839 (46.7%) | $93,507 |
| Average | 25,359 (100.0%) | $114,863 |
Occupancy by Householder Income Bracket in Medford
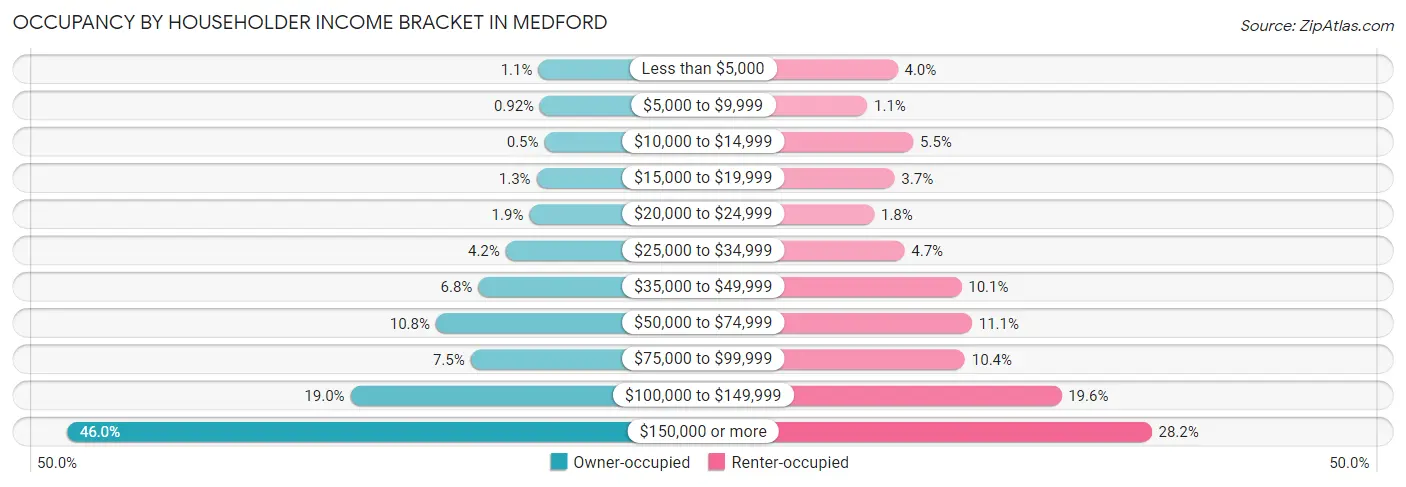
| Income Bracket | Owner-occupied | Renter-occupied |
| Less than $5,000 | 146 (1.1%) | 473 (4.0%) |
| $5,000 to $9,999 | 124 (0.9%) | 130 (1.1%) |
| $10,000 to $14,999 | 67 (0.5%) | 649 (5.5%) |
| $15,000 to $19,999 | 169 (1.3%) | 438 (3.7%) |
| $20,000 to $24,999 | 262 (1.9%) | 208 (1.8%) |
| $25,000 to $34,999 | 567 (4.2%) | 551 (4.6%) |
| $35,000 to $49,999 | 920 (6.8%) | 1,192 (10.1%) |
| $50,000 to $74,999 | 1,466 (10.8%) | 1,310 (11.1%) |
| $75,000 to $99,999 | 1,018 (7.5%) | 1,232 (10.4%) |
| $100,000 to $149,999 | 2,565 (19.0%) | 2,319 (19.6%) |
| $150,000 or more | 6,216 (46.0%) | 3,337 (28.2%) |
| Total | 13,520 (100.0%) | 11,839 (100.0%) |
Monthly Housing Cost Tiers in Medford
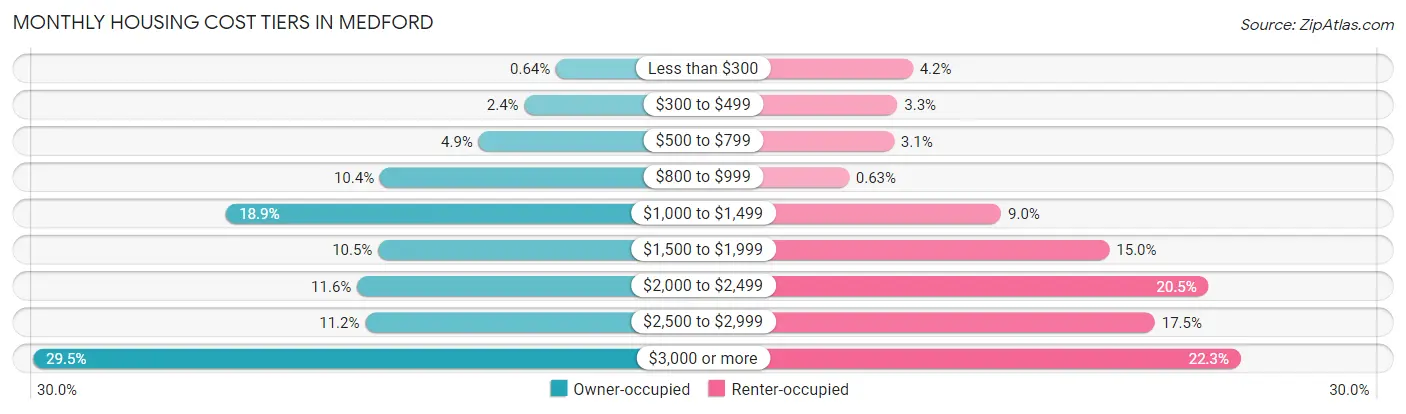
| Monthly Cost | Owner-occupied | Renter-occupied |
| Less than $300 | 87 (0.6%) | 493 (4.2%) |
| $300 to $499 | 323 (2.4%) | 392 (3.3%) |
| $500 to $799 | 665 (4.9%) | 369 (3.1%) |
| $800 to $999 | 1,402 (10.4%) | 74 (0.6%) |
| $1,000 to $1,499 | 2,550 (18.9%) | 1,070 (9.0%) |
| $1,500 to $1,999 | 1,415 (10.5%) | 1,778 (15.0%) |
| $2,000 to $2,499 | 1,573 (11.6%) | 2,427 (20.5%) |
| $2,500 to $2,999 | 1,512 (11.2%) | 2,075 (17.5%) |
| $3,000 or more | 3,993 (29.5%) | 2,638 (22.3%) |
| Total | 13,520 (100.0%) | 11,839 (100.0%) |
Physical Housing Characteristics in Medford
Housing Structures in Medford
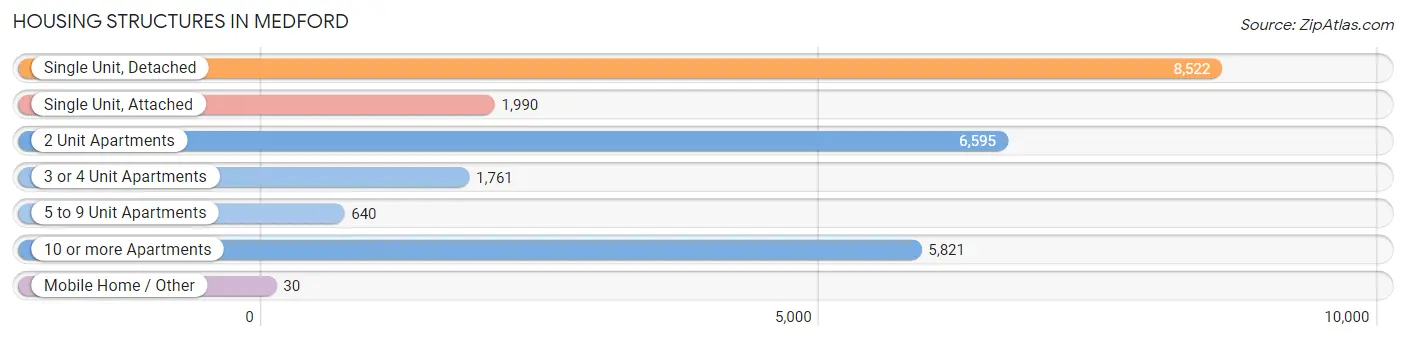
| Structure Type | # Housing Units | % Housing Units |
| Single Unit, Detached | 8,522 | 33.6% |
| Single Unit, Attached | 1,990 | 7.9% |
| 2 Unit Apartments | 6,595 | 26.0% |
| 3 or 4 Unit Apartments | 1,761 | 6.9% |
| 5 to 9 Unit Apartments | 640 | 2.5% |
| 10 or more Apartments | 5,821 | 23.0% |
| Mobile Home / Other | 30 | 0.1% |
| Total | 25,359 | 100.0% |
Housing Structures by Occupancy in Medford
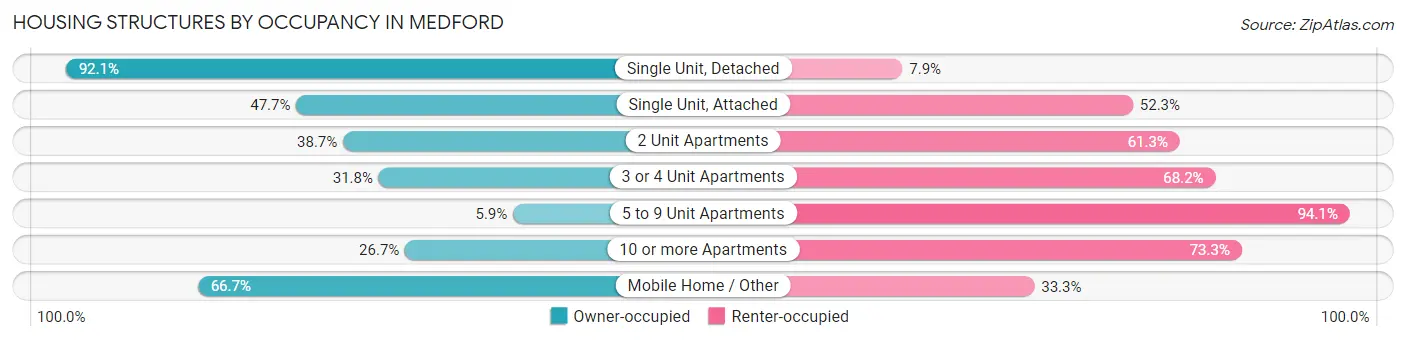
| Structure Type | Owner-occupied | Renter-occupied |
| Single Unit, Detached | 7,847 (92.1%) | 675 (7.9%) |
| Single Unit, Attached | 949 (47.7%) | 1,041 (52.3%) |
| 2 Unit Apartments | 2,550 (38.7%) | 4,045 (61.3%) |
| 3 or 4 Unit Apartments | 560 (31.8%) | 1,201 (68.2%) |
| 5 to 9 Unit Apartments | 38 (5.9%) | 602 (94.1%) |
| 10 or more Apartments | 1,556 (26.7%) | 4,265 (73.3%) |
| Mobile Home / Other | 20 (66.7%) | 10 (33.3%) |
| Total | 13,520 (53.3%) | 11,839 (46.7%) |
Housing Structures by Number of Rooms in Medford
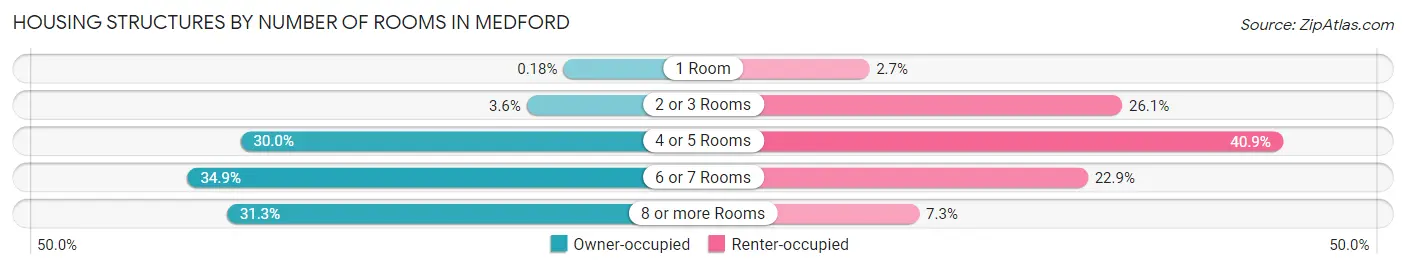
| Number of Rooms | Owner-occupied | Renter-occupied |
| 1 Room | 25 (0.2%) | 321 (2.7%) |
| 2 or 3 Rooms | 482 (3.6%) | 3,089 (26.1%) |
| 4 or 5 Rooms | 4,060 (30.0%) | 4,847 (40.9%) |
| 6 or 7 Rooms | 4,723 (34.9%) | 2,714 (22.9%) |
| 8 or more Rooms | 4,230 (31.3%) | 868 (7.3%) |
| Total | 13,520 (100.0%) | 11,839 (100.0%) |
Housing Structure by Heating Type in Medford
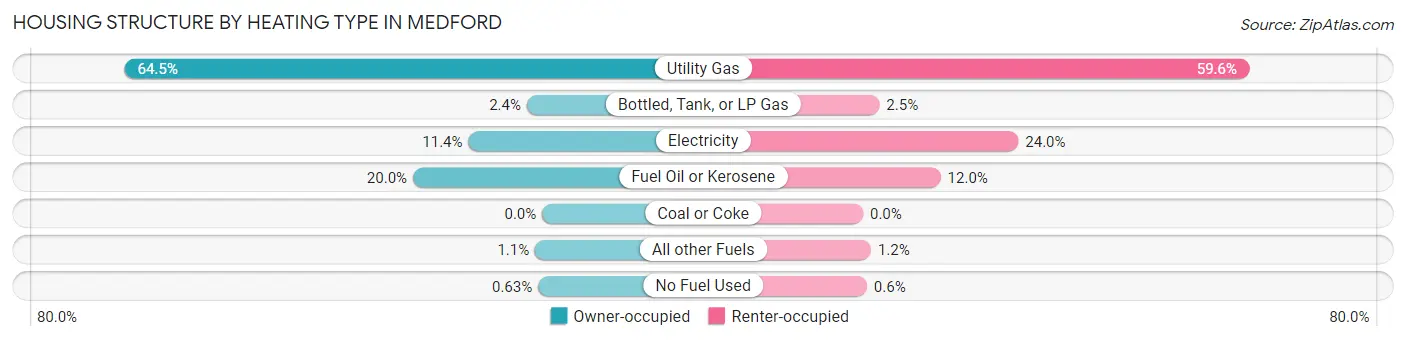
| Heating Type | Owner-occupied | Renter-occupied |
| Utility Gas | 8,726 (64.5%) | 7,060 (59.6%) |
| Bottled, Tank, or LP Gas | 321 (2.4%) | 299 (2.5%) |
| Electricity | 1,541 (11.4%) | 2,843 (24.0%) |
| Fuel Oil or Kerosene | 2,700 (20.0%) | 1,421 (12.0%) |
| Coal or Coke | 0 (0.0%) | 0 (0.0%) |
| All other Fuels | 147 (1.1%) | 145 (1.2%) |
| No Fuel Used | 85 (0.6%) | 71 (0.6%) |
| Total | 13,520 (100.0%) | 11,839 (100.0%) |
Household Vehicle Usage in Medford
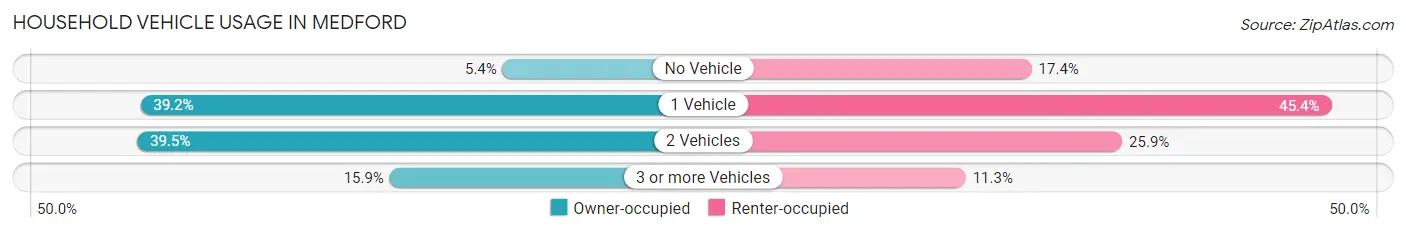
| Vehicles per Household | Owner-occupied | Renter-occupied |
| No Vehicle | 728 (5.4%) | 2,063 (17.4%) |
| 1 Vehicle | 5,300 (39.2%) | 5,376 (45.4%) |
| 2 Vehicles | 5,340 (39.5%) | 3,064 (25.9%) |
| 3 or more Vehicles | 2,152 (15.9%) | 1,336 (11.3%) |
| Total | 13,520 (100.0%) | 11,839 (100.0%) |
Real Estate & Mortgages in Medford
Real Estate and Mortgage Overview in Medford
| Characteristic | Without Mortgage | With Mortgage |
| Housing Units | 5,236 | 8,284 |
| Median Property Value | $647,400 | $684,700 |
| Median Household Income | $95,833 | $4,570 |
| Monthly Housing Costs | $1,033 | $3,981 |
| Real Estate Taxes | $5,999 | $131 |
Property Value by Mortgage Status in Medford
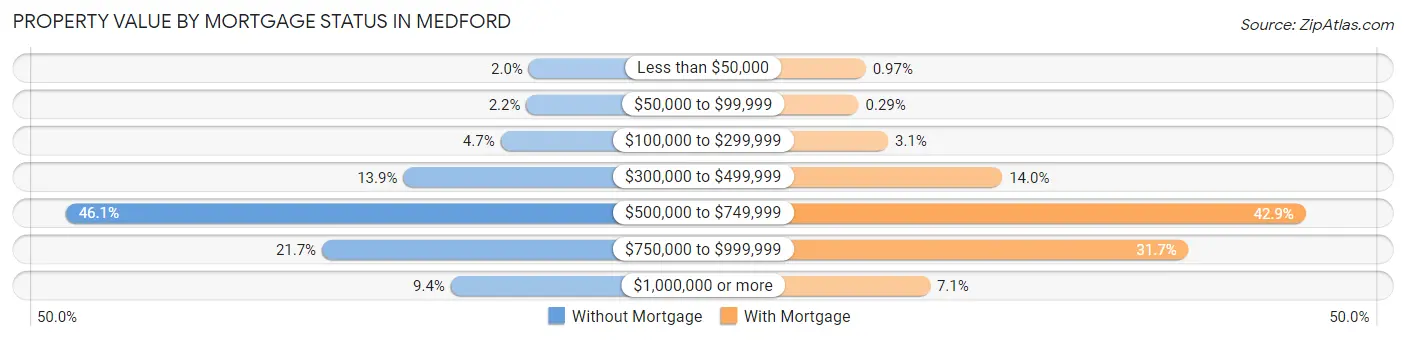
| Property Value | Without Mortgage | With Mortgage |
| Less than $50,000 | 104 (2.0%) | 80 (1.0%) |
| $50,000 to $99,999 | 116 (2.2%) | 24 (0.3%) |
| $100,000 to $299,999 | 245 (4.7%) | 257 (3.1%) |
| $300,000 to $499,999 | 730 (13.9%) | 1,157 (14.0%) |
| $500,000 to $749,999 | 2,413 (46.1%) | 3,551 (42.9%) |
| $750,000 to $999,999 | 1,135 (21.7%) | 2,628 (31.7%) |
| $1,000,000 or more | 493 (9.4%) | 587 (7.1%) |
| Total | 5,236 (100.0%) | 8,284 (100.0%) |
Household Income by Mortgage Status in Medford
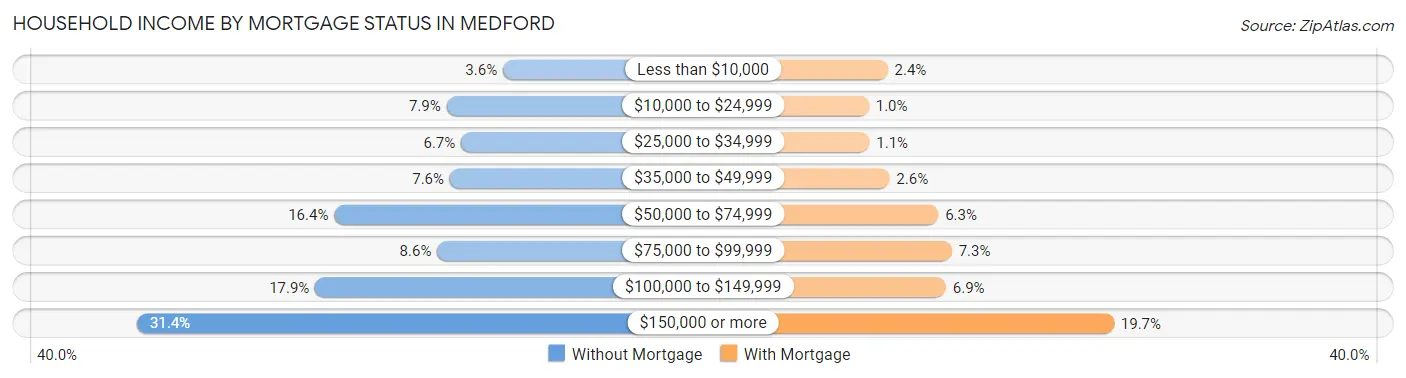
| Household Income | Without Mortgage | With Mortgage |
| Less than $10,000 | 186 (3.5%) | 202 (2.4%) |
| $10,000 to $24,999 | 411 (7.9%) | 84 (1.0%) |
| $25,000 to $34,999 | 353 (6.7%) | 87 (1.1%) |
| $35,000 to $49,999 | 398 (7.6%) | 214 (2.6%) |
| $50,000 to $74,999 | 859 (16.4%) | 522 (6.3%) |
| $75,000 to $99,999 | 448 (8.6%) | 607 (7.3%) |
| $100,000 to $149,999 | 935 (17.9%) | 570 (6.9%) |
| $150,000 or more | 1,646 (31.4%) | 1,630 (19.7%) |
| Total | 5,236 (100.0%) | 8,284 (100.0%) |
Property Value to Household Income Ratio in Medford
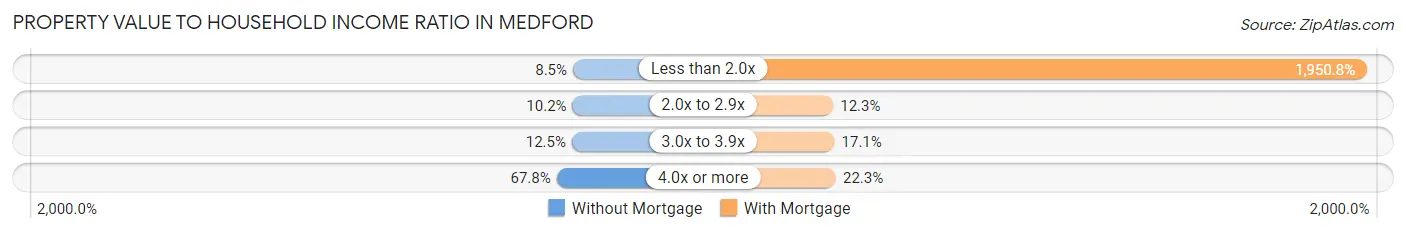
| Value-to-Income Ratio | Without Mortgage | With Mortgage |
| Less than 2.0x | 444 (8.5%) | 161,607 (1,950.8%) |
| 2.0x to 2.9x | 532 (10.2%) | 1,016 (12.3%) |
| 3.0x to 3.9x | 653 (12.5%) | 1,415 (17.1%) |
| 4.0x or more | 3,550 (67.8%) | 1,850 (22.3%) |
| Total | 5,236 (100.0%) | 8,284 (100.0%) |
Real Estate Taxes by Mortgage Status in Medford
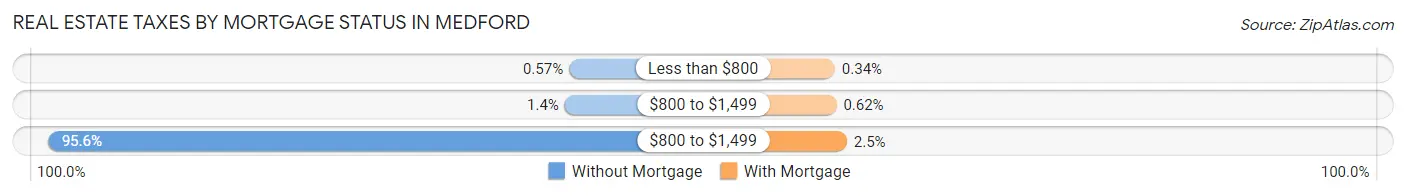
| Property Taxes | Without Mortgage | With Mortgage |
| Less than $800 | 30 (0.6%) | 28 (0.3%) |
| $800 to $1,499 | 71 (1.4%) | 51 (0.6%) |
| $800 to $1,499 | 5,005 (95.6%) | 209 (2.5%) |
| Total | 5,236 (100.0%) | 8,284 (100.0%) |
Health & Disability in Medford
Health Insurance Coverage by Age in Medford
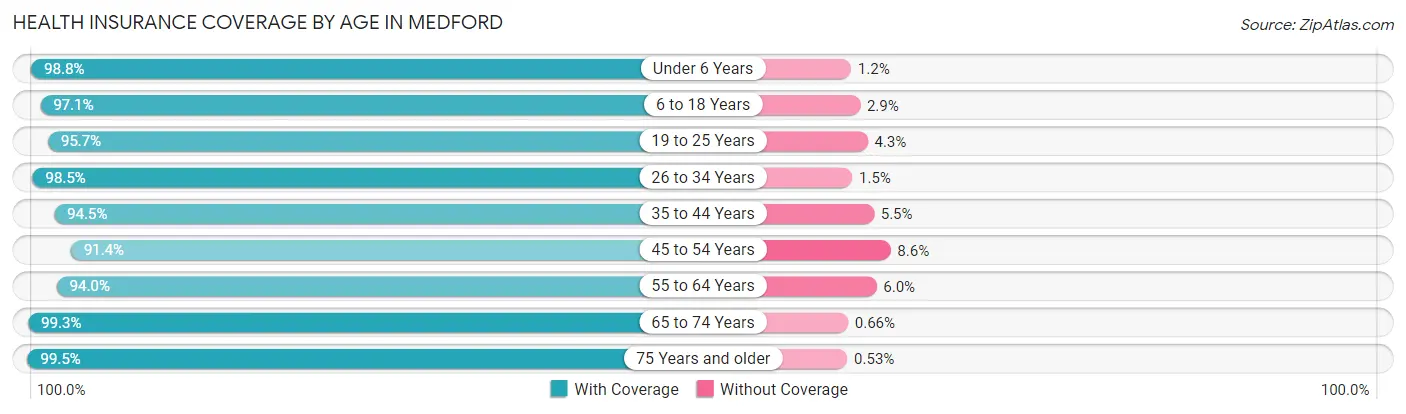
| Age Bracket | With Coverage | Without Coverage |
| Under 6 Years | 3,121 (98.8%) | 39 (1.2%) |
| 6 to 18 Years | 5,947 (97.1%) | 179 (2.9%) |
| 19 to 25 Years | 8,147 (95.7%) | 369 (4.3%) |
| 26 to 34 Years | 12,371 (98.5%) | 183 (1.5%) |
| 35 to 44 Years | 7,085 (94.5%) | 412 (5.5%) |
| 45 to 54 Years | 6,194 (91.4%) | 583 (8.6%) |
| 55 to 64 Years | 6,902 (94.0%) | 439 (6.0%) |
| 65 to 74 Years | 5,531 (99.3%) | 37 (0.7%) |
| 75 Years and older | 3,600 (99.5%) | 19 (0.5%) |
| Total | 58,898 (96.3%) | 2,260 (3.7%) |
Health Insurance Coverage by Citizenship Status in Medford
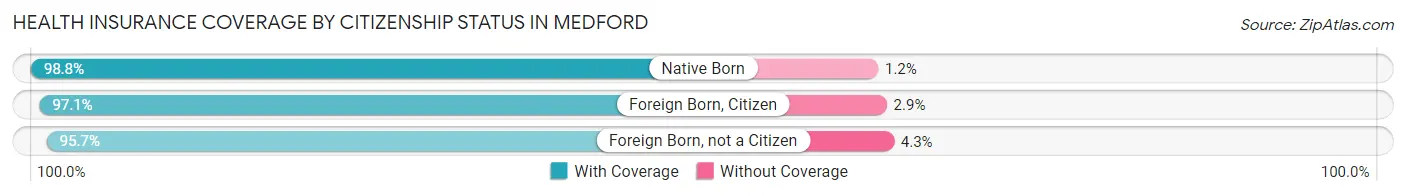
| Citizenship Status | With Coverage | Without Coverage |
| Native Born | 3,121 (98.8%) | 39 (1.2%) |
| Foreign Born, Citizen | 5,947 (97.1%) | 179 (2.9%) |
| Foreign Born, not a Citizen | 8,147 (95.7%) | 369 (4.3%) |
Health Insurance Coverage by Household Income in Medford
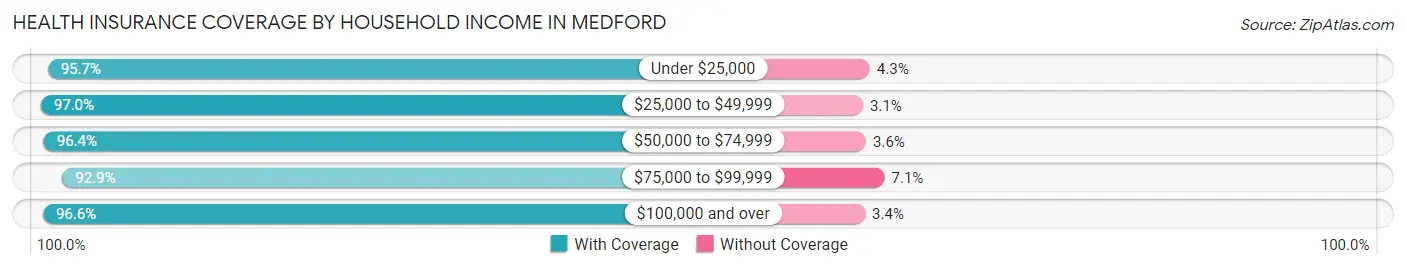
| Household Income | With Coverage | Without Coverage |
| Under $25,000 | 3,313 (95.7%) | 150 (4.3%) |
| $25,000 to $49,999 | 6,443 (97.0%) | 203 (3.0%) |
| $50,000 to $74,999 | 5,423 (96.4%) | 203 (3.6%) |
| $75,000 to $99,999 | 4,531 (92.9%) | 345 (7.1%) |
| $100,000 and over | 37,518 (96.6%) | 1,336 (3.4%) |
Public vs Private Health Insurance Coverage by Age in Medford
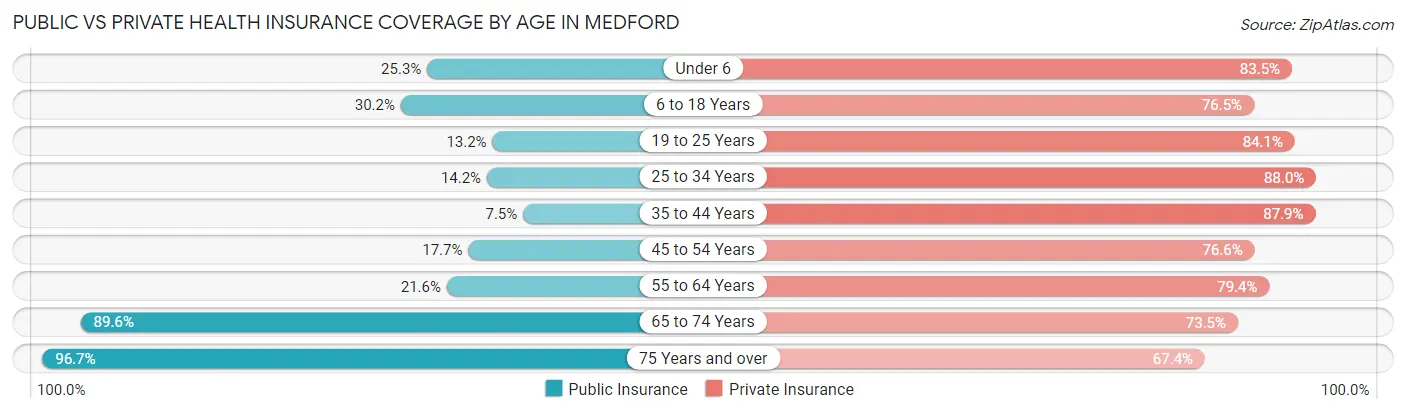
| Age Bracket | Public Insurance | Private Insurance |
| Under 6 | 799 (25.3%) | 2,640 (83.5%) |
| 6 to 18 Years | 1,848 (30.2%) | 4,686 (76.5%) |
| 19 to 25 Years | 1,121 (13.2%) | 7,160 (84.1%) |
| 25 to 34 Years | 1,780 (14.2%) | 11,053 (88.0%) |
| 35 to 44 Years | 560 (7.5%) | 6,589 (87.9%) |
| 45 to 54 Years | 1,196 (17.6%) | 5,191 (76.6%) |
| 55 to 64 Years | 1,588 (21.6%) | 5,825 (79.3%) |
| 65 to 74 Years | 4,989 (89.6%) | 4,093 (73.5%) |
| 75 Years and over | 3,500 (96.7%) | 2,439 (67.4%) |
| Total | 17,381 (28.4%) | 49,676 (81.2%) |
Disability Status by Sex by Age in Medford
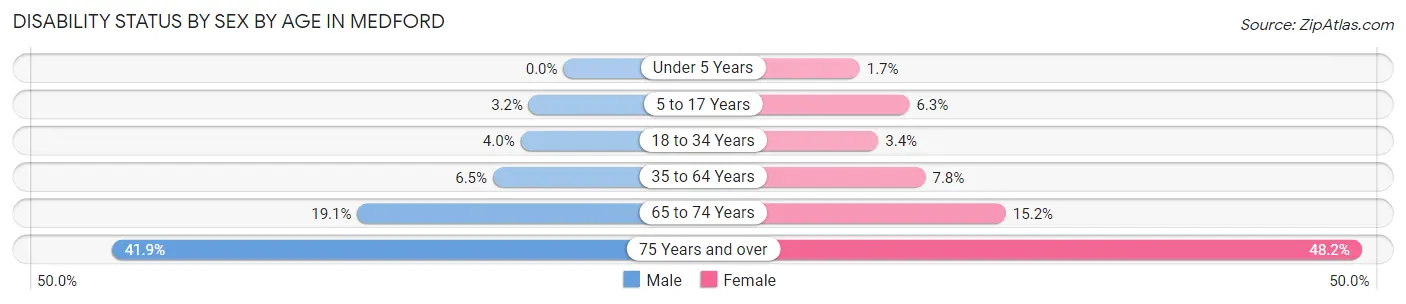
| Age Bracket | Male | Female |
| Under 5 Years | 0 (0.0%) | 24 (1.7%) |
| 5 to 17 Years | 99 (3.2%) | 166 (6.3%) |
| 18 to 34 Years | 406 (4.0%) | 397 (3.4%) |
| 35 to 64 Years | 698 (6.5%) | 851 (7.8%) |
| 65 to 74 Years | 487 (19.1%) | 460 (15.2%) |
| 75 Years and over | 495 (41.9%) | 1,176 (48.2%) |
Disability Class by Sex by Age in Medford
Disability Class: Hearing Difficulty
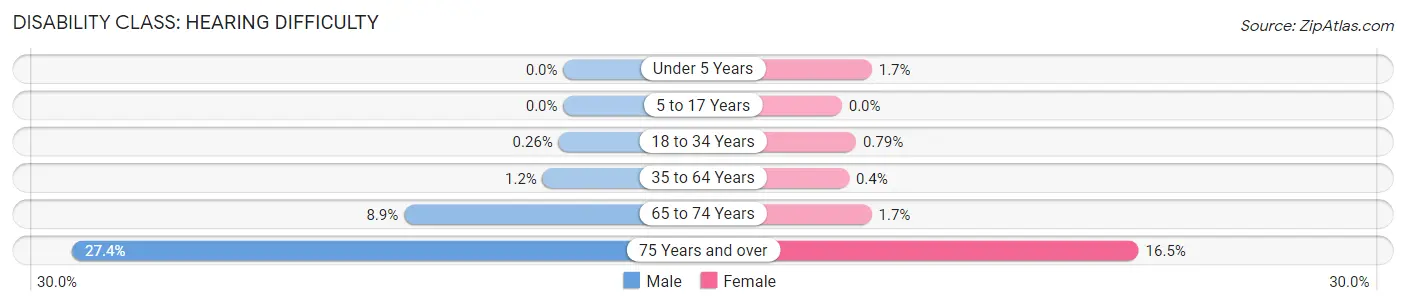
| Age Bracket | Male | Female |
| Under 5 Years | 0 (0.0%) | 24 (1.7%) |
| 5 to 17 Years | 0 (0.0%) | 0 (0.0%) |
| 18 to 34 Years | 27 (0.3%) | 92 (0.8%) |
| 35 to 64 Years | 123 (1.1%) | 44 (0.4%) |
| 65 to 74 Years | 226 (8.9%) | 50 (1.7%) |
| 75 Years and over | 323 (27.4%) | 403 (16.5%) |
Disability Class: Vision Difficulty
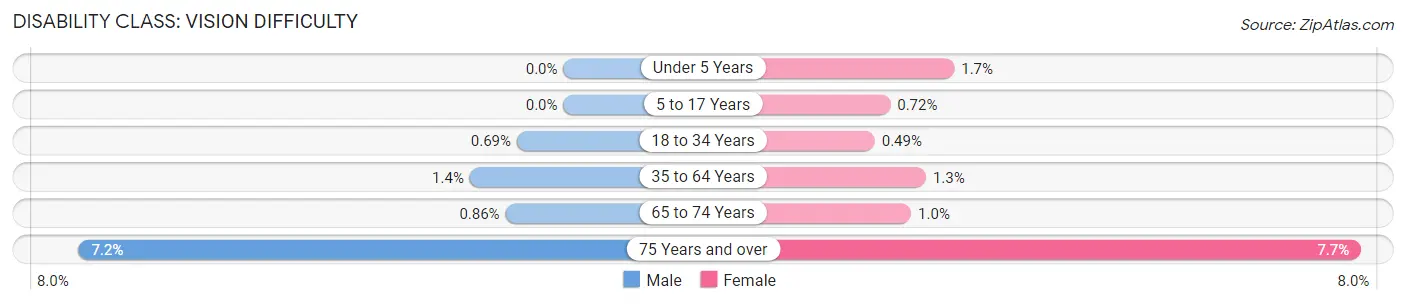
| Age Bracket | Male | Female |
| Under 5 Years | 0 (0.0%) | 24 (1.7%) |
| 5 to 17 Years | 0 (0.0%) | 19 (0.7%) |
| 18 to 34 Years | 70 (0.7%) | 57 (0.5%) |
| 35 to 64 Years | 148 (1.4%) | 137 (1.3%) |
| 65 to 74 Years | 22 (0.9%) | 31 (1.0%) |
| 75 Years and over | 85 (7.2%) | 188 (7.7%) |
Disability Class: Cognitive Difficulty
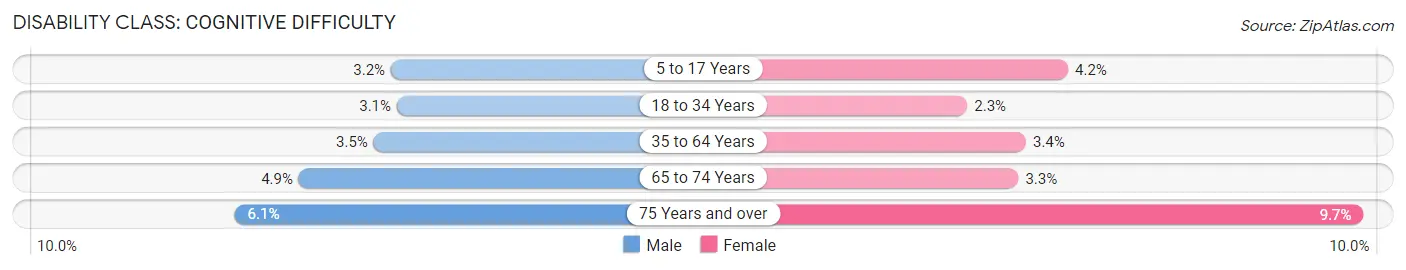
| Age Bracket | Male | Female |
| 5 to 17 Years | 99 (3.2%) | 111 (4.2%) |
| 18 to 34 Years | 316 (3.1%) | 273 (2.3%) |
| 35 to 64 Years | 375 (3.5%) | 374 (3.4%) |
| 65 to 74 Years | 125 (4.9%) | 99 (3.3%) |
| 75 Years and over | 72 (6.1%) | 236 (9.7%) |
Disability Class: Ambulatory Difficulty
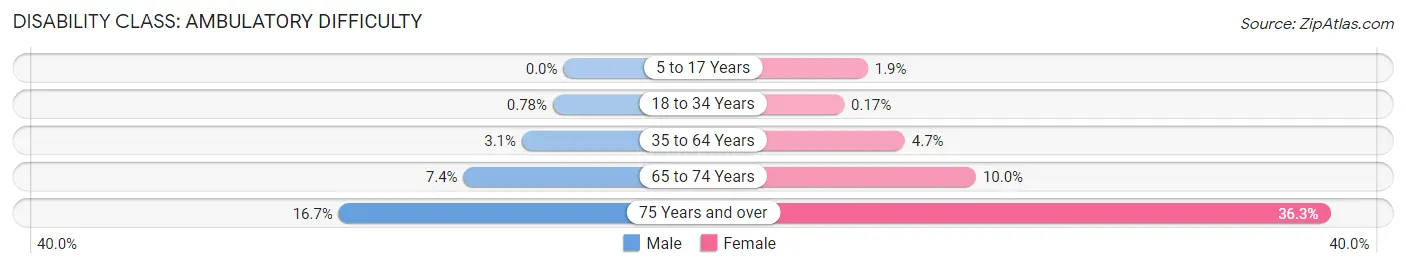
| Age Bracket | Male | Female |
| 5 to 17 Years | 0 (0.0%) | 51 (1.9%) |
| 18 to 34 Years | 80 (0.8%) | 20 (0.2%) |
| 35 to 64 Years | 328 (3.1%) | 513 (4.7%) |
| 65 to 74 Years | 189 (7.4%) | 301 (10.0%) |
| 75 Years and over | 197 (16.7%) | 884 (36.3%) |
Disability Class: Self-Care Difficulty
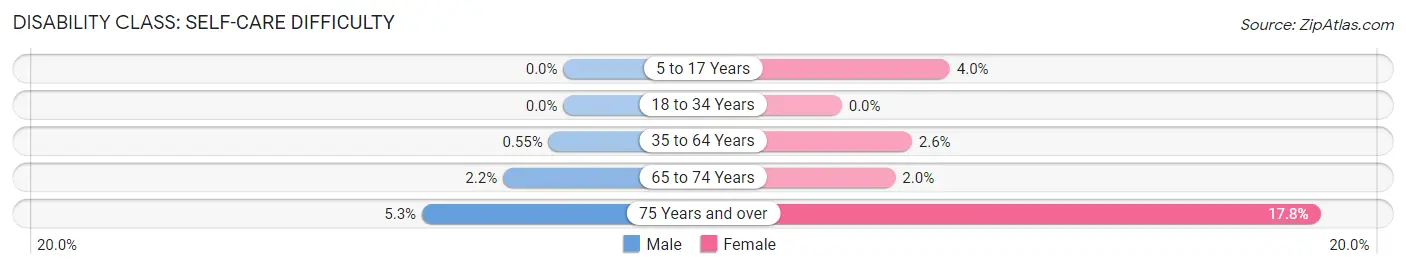
| Age Bracket | Male | Female |
| 5 to 17 Years | 0 (0.0%) | 106 (4.0%) |
| 18 to 34 Years | 0 (0.0%) | 0 (0.0%) |
| 35 to 64 Years | 59 (0.5%) | 285 (2.6%) |
| 65 to 74 Years | 57 (2.2%) | 60 (2.0%) |
| 75 Years and over | 62 (5.2%) | 433 (17.8%) |
Technology Access in Medford
Computing Device Access in Medford
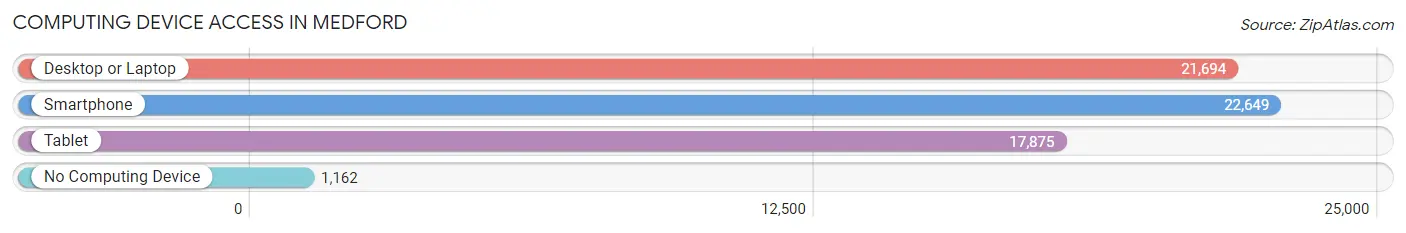
| Device Type | # Households | % Households |
| Desktop or Laptop | 21,694 | 85.6% |
| Smartphone | 22,649 | 89.3% |
| Tablet | 17,875 | 70.5% |
| No Computing Device | 1,162 | 4.6% |
| Total | 25,359 | 100.0% |
Internet Access in Medford
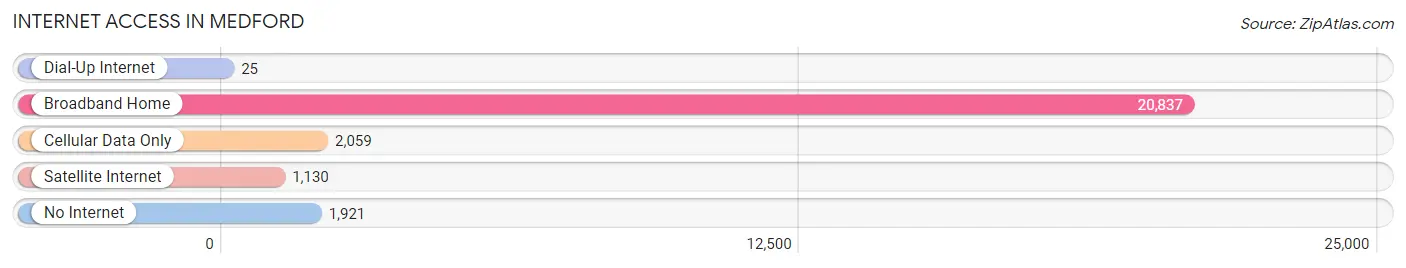
| Internet Type | # Households | % Households |
| Dial-Up Internet | 25 | 0.1% |
| Broadband Home | 20,837 | 82.2% |
| Cellular Data Only | 2,059 | 8.1% |
| Satellite Internet | 1,130 | 4.5% |
| No Internet | 1,921 | 7.6% |
| Total | 25,359 | 100.0% |
Medford Summary
Medford, Massachusetts is a city located in Middlesex County, just north of Boston. It is a part of the Greater Boston metropolitan area and is home to a population of approximately 57,000 people. The city is known for its rich history, diverse geography, vibrant economy, and diverse demographics.
History
Medford was first settled in 1630 by Puritan settlers from England. The city was originally part of Charlestown, but was incorporated as a separate town in 1650. During the American Revolution, Medford was a major center of activity, with the Battle of Medford taking place in 1775. The city was also home to the first public school in the United States, the Medford Latin School, which was founded in 1639.
In the 19th century, Medford became a major industrial center, with factories producing textiles, shoes, and leather goods. The city was also home to the first public library in the United States, the Medford Public Library, which was founded in 1852.
Geography
Medford is located in Middlesex County, just north of Boston. The city is bordered by Somerville to the north, Malden to the east, Everett to the south, and Winchester to the west. The Mystic River runs through the city, and there are several parks and open spaces, including the Middlesex Fells Reservation and the Mystic River Reservation.
The city has a total area of 5.6 square miles, with a population density of 10,000 people per square mile. The city is mostly flat, with some hills in the western part of the city.
Economy
Medford has a vibrant economy, with a variety of industries and businesses. The city is home to several large employers, including Tufts University, the Medford Public Schools, and the City of Medford. The city is also home to a number of small businesses, including restaurants, retail stores, and professional services.
The city has a median household income of $68,000, and the median home value is $521,000. The unemployment rate is 3.7%, which is lower than the national average.
Demographics
Medford has a diverse population, with a variety of ethnic and racial backgrounds. The city is approximately 60% white, 20% Hispanic, 10% Asian, and 10% African American. The median age is 38.7 years, and the median household income is $68,000.
The city is home to a large number of immigrants, with approximately 20% of the population being foreign-born. The largest immigrant groups are from El Salvador, the Dominican Republic, and China.
Conclusion
Medford, Massachusetts is a city with a rich history, diverse geography, vibrant economy, and diverse demographics. The city is home to a variety of industries and businesses, and has a median household income of $68,000. The city is also home to a large number of immigrants, with approximately 20% of the population being foreign-born. Medford is a great place to live, work, and visit, and is a great example of the diversity and vibrancy of the Greater Boston area.
Common Questions
What is Per Capita Income in Medford?
Per Capita income in Medford is $58,522.
What is the Median Family Income in Medford?
Median Family Income in Medford is $139,636.
What is the Median Household income in Medford?
Median Household Income in Medford is $114,863.
What is Income or Wage Gap in Medford?
Income or Wage Gap in Medford is 22.7%.
Women in Medford earn 77.3 cents for every dollar earned by a man.
What is Inequality or Gini Index in Medford?
Inequality or Gini Index in Medford is 0.44.
What is the Total Population of Medford?
Total Population of Medford is 61,748.
What is the Total Male Population of Medford?
Total Male Population of Medford is 29,227.
What is the Total Female Population of Medford?
Total Female Population of Medford is 32,521.
What is the Ratio of Males per 100 Females in Medford?
There are 89.87 Males per 100 Females in Medford.
What is the Ratio of Females per 100 Males in Medford?
There are 111.27 Females per 100 Males in Medford.
What is the Median Population Age in Medford?
Median Population Age in Medford is 35.4 Years.
What is the Average Family Size in Medford
Average Family Size in Medford is 2.9 People.
What is the Average Household Size in Medford
Average Household Size in Medford is 2.4 People.
How Large is the Labor Force in Medford?
There are 39,120 People in the Labor Forcein in Medford.
What is the Percentage of People in the Labor Force in Medford?
72.1% of People are in the Labor Force in Medford.
What is the Unemployment Rate in Medford?
Unemployment Rate in Medford is 4.2%.