Mooresville, NC Map & Demographics
Mooresville Map
Mooresville Overview
$40,275
PER CAPITA INCOME
$93,922
AVG FAMILY INCOME
$82,622
AVG HOUSEHOLD INCOME
43.6%
WAGE / INCOME GAP [ % ]
56.4¢/ $1
WAGE / INCOME GAP [ $ ]
$8,535
FAMILY INCOME DEFICIT
0.40
INEQUALITY / GINI INDEX
50,025
TOTAL POPULATION
24,507
MALE POPULATION
25,518
FEMALE POPULATION
96.04
MALES / 100 FEMALES
104.13
FEMALES / 100 MALES
36.5
MEDIAN AGE
3.1
AVG FAMILY SIZE
2.6
AVG HOUSEHOLD SIZE
26,966
LABOR FORCE [ PEOPLE ]
68.8%
PERCENT IN LABOR FORCE
3.9%
UNEMPLOYMENT RATE
Income in Mooresville
Income Overview in Mooresville
Per Capita Income in Mooresville is $40,275, while median incomes of families and households are $93,922 and $82,622 respectively.
| Characteristic | Number | Measure |
| Per Capita Income | 50,025 | $40,275 |
| Median Family Income | 13,478 | $93,922 |
| Mean Family Income | 13,478 | $113,596 |
| Median Household Income | 19,365 | $82,622 |
| Mean Household Income | 19,365 | $101,643 |
| Income Deficit | 13,478 | $8,535 |
| Wage / Income Gap (%) | 50,025 | 43.63% |
| Wage / Income Gap ($) | 50,025 | 56.37¢ per $1 |
| Gini / Inequality Index | 50,025 | 0.40 |
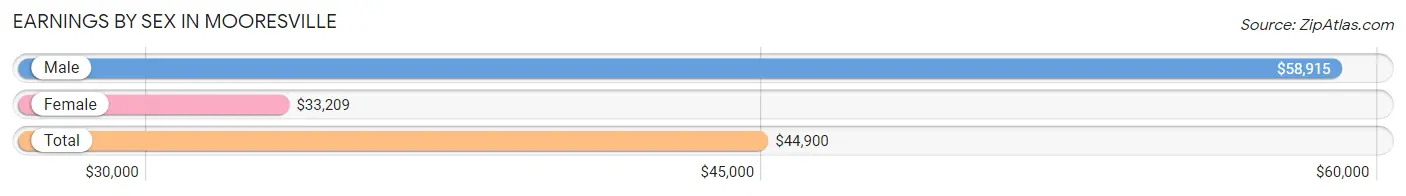
Earnings by Sex in Mooresville
Average Earnings in Mooresville are $44,900, $58,915 for men and $33,209 for women, a difference of 43.6%.
| Sex | Number | Average Earnings |
| Male | 15,422 (54.4%) | $58,915 |
| Female | 12,932 (45.6%) | $33,209 |
| Total | 28,354 (100.0%) | $44,900 |
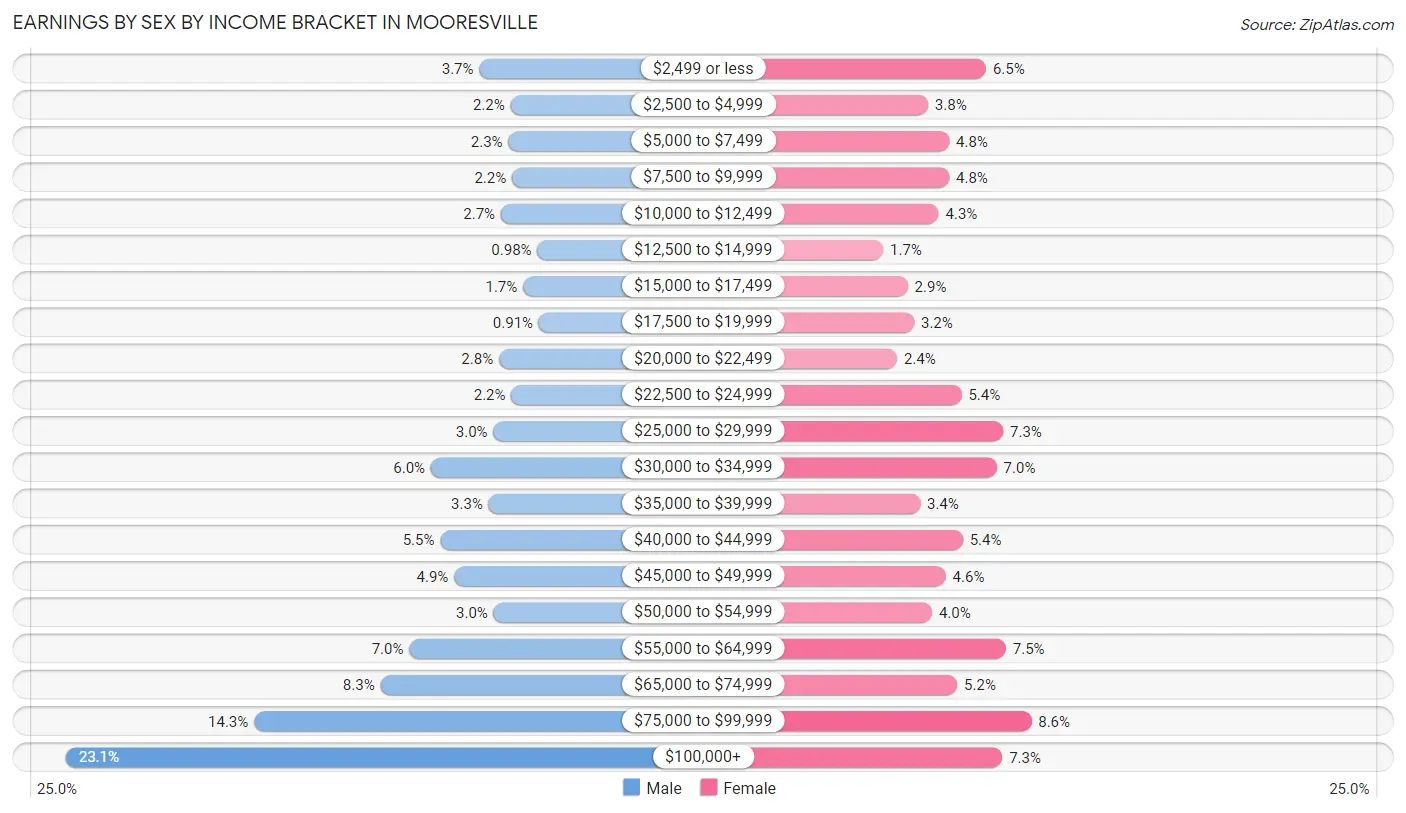
Earnings by Sex by Income Bracket in Mooresville
The most common earnings brackets in Mooresville are $100,000+ for men (3,558 | 23.1%) and $75,000 to $99,999 for women (1,117 | 8.6%).
| Income | Male | Female |
| $2,499 or less | 571 (3.7%) | 843 (6.5%) |
| $2,500 to $4,999 | 346 (2.2%) | 491 (3.8%) |
| $5,000 to $7,499 | 361 (2.3%) | 620 (4.8%) |
| $7,500 to $9,999 | 334 (2.2%) | 619 (4.8%) |
| $10,000 to $12,499 | 415 (2.7%) | 556 (4.3%) |
| $12,500 to $14,999 | 151 (1.0%) | 220 (1.7%) |
| $15,000 to $17,499 | 255 (1.7%) | 369 (2.9%) |
| $17,500 to $19,999 | 140 (0.9%) | 408 (3.2%) |
| $20,000 to $22,499 | 428 (2.8%) | 304 (2.4%) |
| $22,500 to $24,999 | 340 (2.2%) | 695 (5.4%) |
| $25,000 to $29,999 | 469 (3.0%) | 946 (7.3%) |
| $30,000 to $34,999 | 921 (6.0%) | 908 (7.0%) |
| $35,000 to $39,999 | 502 (3.3%) | 444 (3.4%) |
| $40,000 to $44,999 | 853 (5.5%) | 702 (5.4%) |
| $45,000 to $49,999 | 753 (4.9%) | 599 (4.6%) |
| $50,000 to $54,999 | 467 (3.0%) | 516 (4.0%) |
| $55,000 to $64,999 | 1,076 (7.0%) | 964 (7.4%) |
| $65,000 to $74,999 | 1,285 (8.3%) | 669 (5.2%) |
| $75,000 to $99,999 | 2,197 (14.2%) | 1,117 (8.6%) |
| $100,000+ | 3,558 (23.1%) | 942 (7.3%) |
| Total | 15,422 (100.0%) | 12,932 (100.0%) |
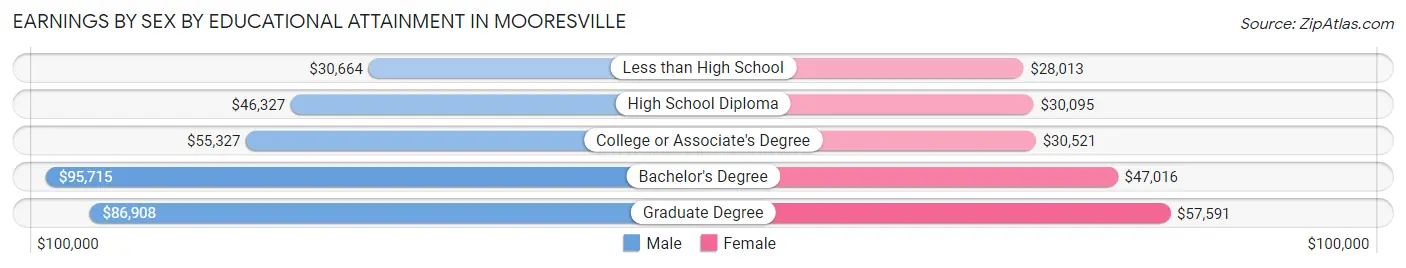
Earnings by Sex by Educational Attainment in Mooresville
Average earnings in Mooresville are $68,268 for men and $39,297 for women, a difference of 42.4%. Men with an educational attainment of bachelor's degree enjoy the highest average annual earnings of $95,715, while those with less than high school education earn the least with $30,664. Women with an educational attainment of graduate degree earn the most with the average annual earnings of $57,591, while those with less than high school education have the smallest earnings of $28,013.
| Educational Attainment | Male Income | Female Income |
| Less than High School | $30,664 | $28,013 |
| High School Diploma | $46,327 | $30,095 |
| College or Associate's Degree | $55,327 | $30,521 |
| Bachelor's Degree | $95,715 | $47,016 |
| Graduate Degree | $86,908 | $57,591 |
| Total | $68,268 | $39,297 |
Family Income in Mooresville
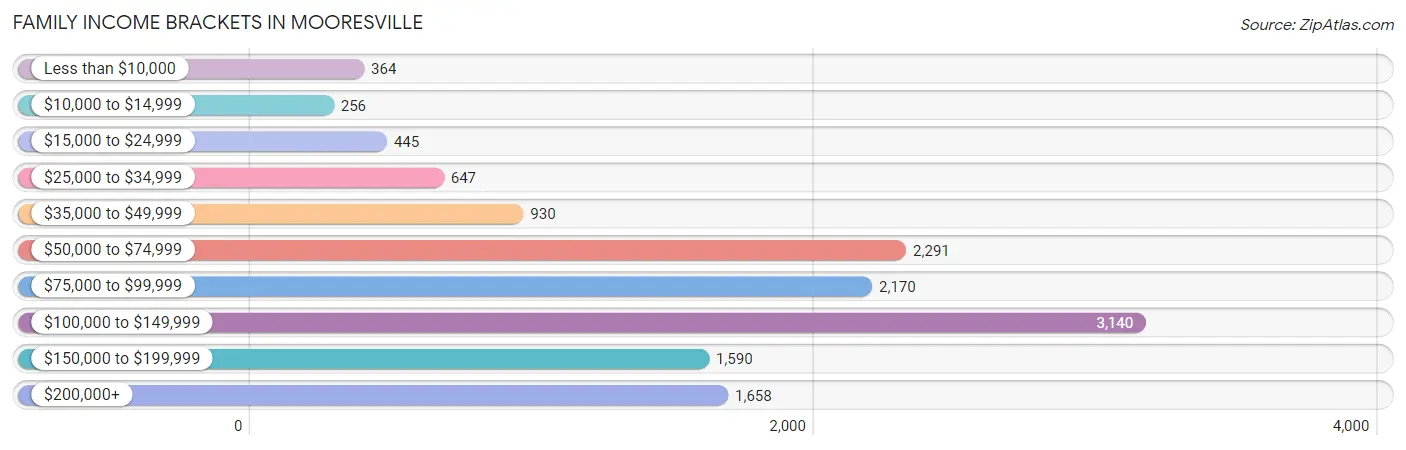
Family Income Brackets in Mooresville
According to the Mooresville family income data, there are 3,140 families falling into the $100,000 to $149,999 income range, which is the most common income bracket and makes up 23.3% of all families. Conversely, the $10,000 to $14,999 income bracket is the least frequent group with only 256 families (1.9%) belonging to this category.
| Income Bracket | # Families | % Families |
| Less than $10,000 | 364 | 2.7% |
| $10,000 to $14,999 | 256 | 1.9% |
| $15,000 to $24,999 | 445 | 3.3% |
| $25,000 to $34,999 | 647 | 4.8% |
| $35,000 to $49,999 | 930 | 6.9% |
| $50,000 to $74,999 | 2,291 | 17.0% |
| $75,000 to $99,999 | 2,170 | 16.1% |
| $100,000 to $149,999 | 3,140 | 23.3% |
| $150,000 to $199,999 | 1,590 | 11.8% |
| $200,000+ | 1,658 | 12.3% |
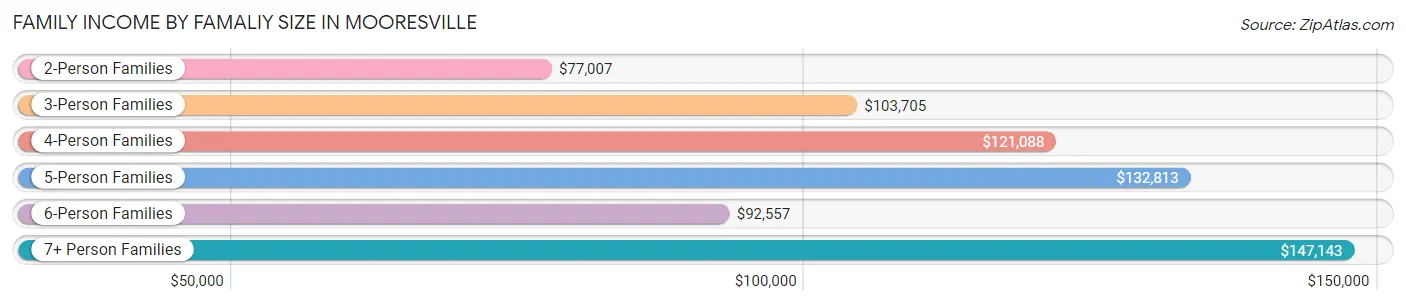
Family Income by Famaliy Size in Mooresville
7+ person families (130 | 1.0%) account for the highest median family income in Mooresville with $147,143 per family, while 2-person families (6,028 | 44.7%) have the highest median income of $38,504 per family member.
| Income Bracket | # Families | Median Income |
| 2-Person Families | 6,028 (44.7%) | $77,007 |
| 3-Person Families | 3,041 (22.6%) | $103,705 |
| 4-Person Families | 2,978 (22.1%) | $121,088 |
| 5-Person Families | 966 (7.2%) | $132,813 |
| 6-Person Families | 335 (2.5%) | $92,557 |
| 7+ Person Families | 130 (1.0%) | $147,143 |
| Total | 13,478 (100.0%) | $93,922 |
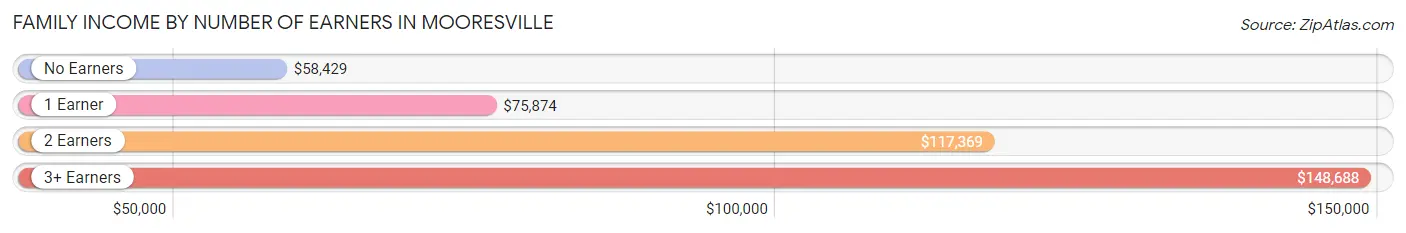
Family Income by Number of Earners in Mooresville
The median family income in Mooresville is $93,922, with families comprising 3+ earners (1,455) having the highest median family income of $148,688, while families with no earners (1,379) have the lowest median family income of $58,429, accounting for 10.8% and 10.2% of families, respectively.
| Number of Earners | # Families | Median Income |
| No Earners | 1,379 (10.2%) | $58,429 |
| 1 Earner | 4,761 (35.3%) | $75,874 |
| 2 Earners | 5,883 (43.6%) | $117,369 |
| 3+ Earners | 1,455 (10.8%) | $148,688 |
| Total | 13,478 (100.0%) | $93,922 |
Household Income in Mooresville
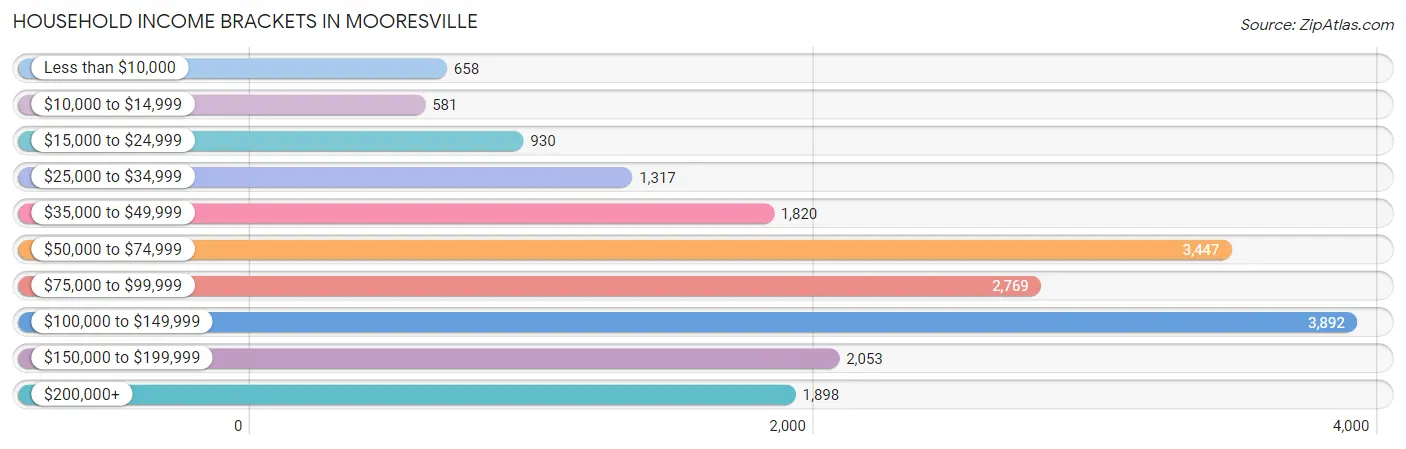
Household Income Brackets in Mooresville
With 3,892 households falling in the category, the $100,000 to $149,999 income range is the most frequent in Mooresville, accounting for 20.1% of all households. In contrast, only 581 households (3.0%) fall into the $10,000 to $14,999 income bracket, making it the least populous group.
| Income Bracket | # Households | % Households |
| Less than $10,000 | 658 | 3.4% |
| $10,000 to $14,999 | 581 | 3.0% |
| $15,000 to $24,999 | 930 | 4.8% |
| $25,000 to $34,999 | 1,317 | 6.8% |
| $35,000 to $49,999 | 1,820 | 9.4% |
| $50,000 to $74,999 | 3,447 | 17.8% |
| $75,000 to $99,999 | 2,769 | 14.3% |
| $100,000 to $149,999 | 3,892 | 20.1% |
| $150,000 to $199,999 | 2,053 | 10.6% |
| $200,000+ | 1,898 | 9.8% |
Household Income by Householder Age in Mooresville
The median household income in Mooresville is $82,622, with the highest median household income of $93,122 found in the 45 to 64 years age bracket for the primary householder. A total of 7,859 households (40.6%) fall into this category. Meanwhile, the 15 to 24 years age bracket for the primary householder has the lowest median household income of $39,565, with 820 households (4.2%) in this group.
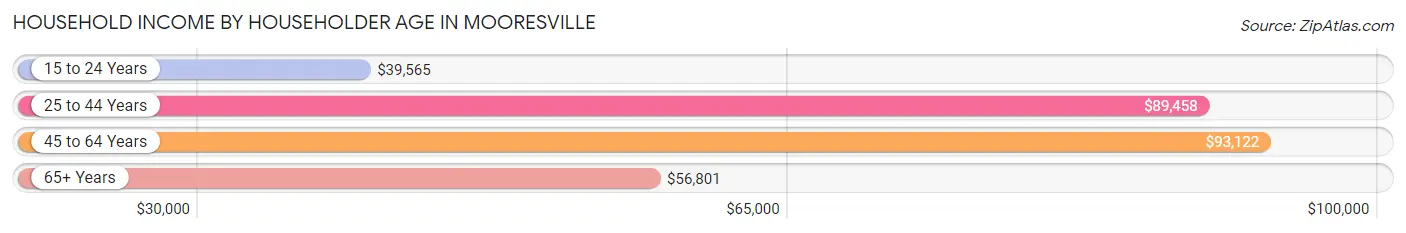
| Income Bracket | # Households | Median Income |
| 15 to 24 Years | 820 (4.2%) | $39,565 |
| 25 to 44 Years | 7,077 (36.5%) | $89,458 |
| 45 to 64 Years | 7,859 (40.6%) | $93,122 |
| 65+ Years | 3,609 (18.6%) | $56,801 |
| Total | 19,365 (100.0%) | $82,622 |
Poverty in Mooresville
Income Below Poverty by Sex and Age in Mooresville
With 6.6% poverty level for males and 8.6% for females among the residents of Mooresville, 18 to 24 year old males and 25 to 34 year old females are the most vulnerable to poverty, with 425 males (16.4%) and 484 females (14.3%) in their respective age groups living below the poverty level.
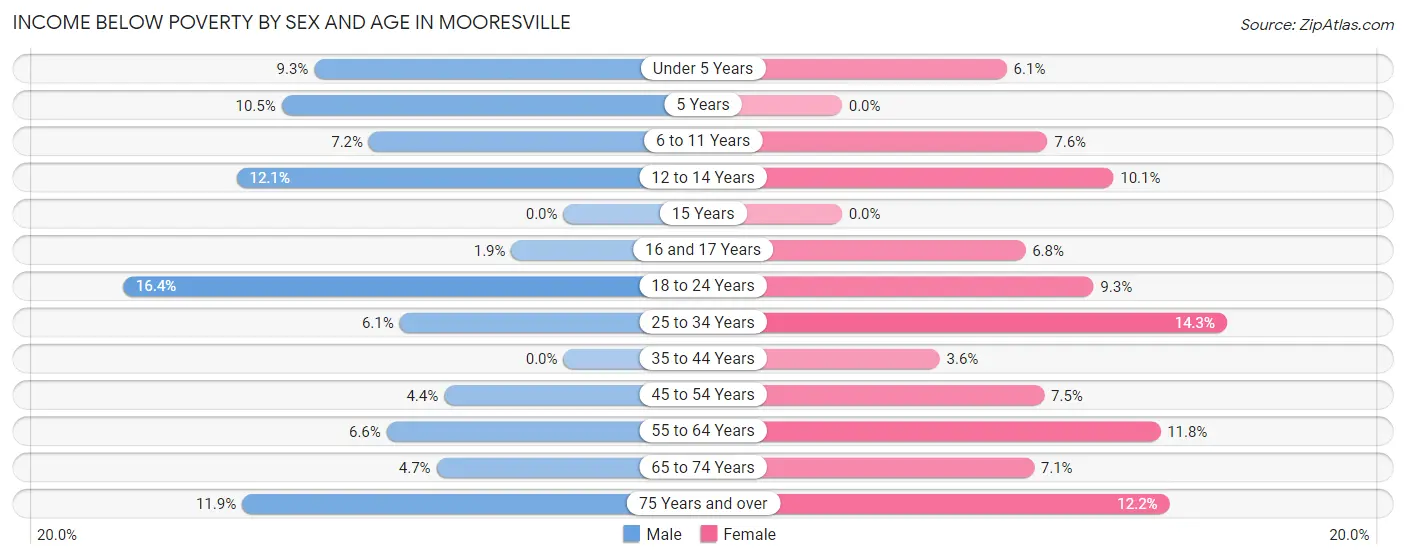
| Age Bracket | Male | Female |
| Under 5 Years | 119 (9.2%) | 91 (6.1%) |
| 5 Years | 34 (10.5%) | 0 (0.0%) |
| 6 to 11 Years | 171 (7.2%) | 156 (7.6%) |
| 12 to 14 Years | 124 (12.1%) | 122 (10.1%) |
| 15 Years | 0 (0.0%) | 0 (0.0%) |
| 16 and 17 Years | 13 (1.9%) | 51 (6.8%) |
| 18 to 24 Years | 425 (16.4%) | 194 (9.3%) |
| 25 to 34 Years | 217 (6.1%) | 484 (14.3%) |
| 35 to 44 Years | 0 (0.0%) | 130 (3.6%) |
| 45 to 54 Years | 162 (4.4%) | 277 (7.5%) |
| 55 to 64 Years | 162 (6.6%) | 356 (11.8%) |
| 65 to 74 Years | 75 (4.7%) | 145 (7.1%) |
| 75 Years and over | 108 (11.9%) | 173 (12.2%) |
| Total | 1,610 (6.6%) | 2,179 (8.6%) |
Income Above Poverty by Sex and Age in Mooresville
According to the poverty statistics in Mooresville, males aged 15 years and females aged 5 years are the age groups that are most secure financially, with 100.0% of males and 100.0% of females in these age groups living above the poverty line.
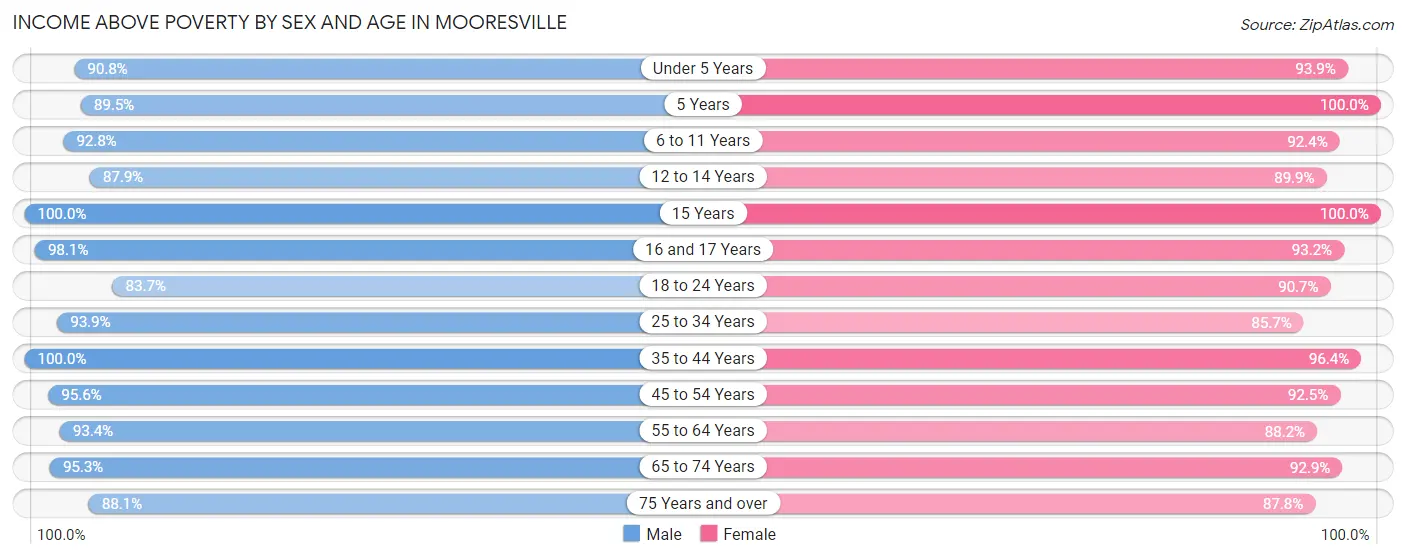
| Age Bracket | Male | Female |
| Under 5 Years | 1,167 (90.7%) | 1,395 (93.9%) |
| 5 Years | 291 (89.5%) | 170 (100.0%) |
| 6 to 11 Years | 2,198 (92.8%) | 1,889 (92.4%) |
| 12 to 14 Years | 898 (87.9%) | 1,088 (89.9%) |
| 15 Years | 272 (100.0%) | 452 (100.0%) |
| 16 and 17 Years | 661 (98.1%) | 698 (93.2%) |
| 18 to 24 Years | 2,174 (83.7%) | 1,883 (90.7%) |
| 25 to 34 Years | 3,351 (93.9%) | 2,903 (85.7%) |
| 35 to 44 Years | 3,544 (100.0%) | 3,456 (96.4%) |
| 45 to 54 Years | 3,495 (95.6%) | 3,409 (92.5%) |
| 55 to 64 Years | 2,306 (93.4%) | 2,655 (88.2%) |
| 65 to 74 Years | 1,517 (95.3%) | 1,888 (92.9%) |
| 75 Years and over | 797 (88.1%) | 1,250 (87.8%) |
| Total | 22,671 (93.4%) | 23,136 (91.4%) |
Income Below Poverty Among Married-Couple Families in Mooresville
The poverty statistics for married-couple families in Mooresville show that 3.8% or 386 of the total 10,163 families live below the poverty line. Families with no children have the highest poverty rate of 6.0%, comprising of 307 families. On the other hand, families with 5 or more children have the lowest poverty rate of 0.0%, which includes 0 families.
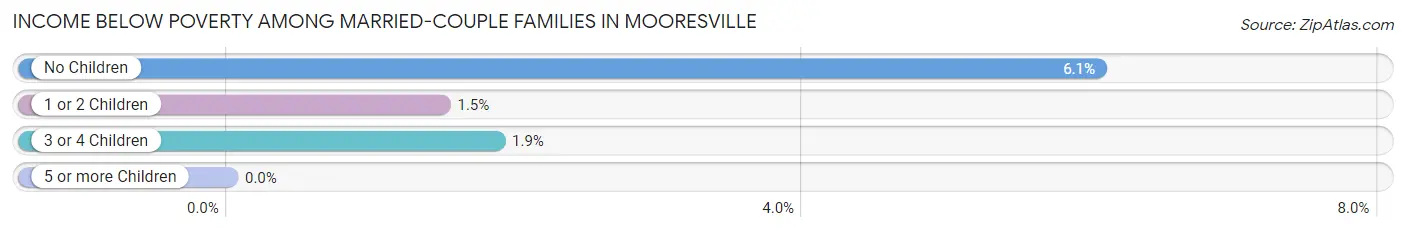
| Children | Above Poverty | Below Poverty |
| No Children | 4,768 (94.0%) | 307 (6.0%) |
| 1 or 2 Children | 4,059 (98.5%) | 61 (1.5%) |
| 3 or 4 Children | 948 (98.1%) | 18 (1.9%) |
| 5 or more Children | 2 (100.0%) | 0 (0.0%) |
| Total | 9,777 (96.2%) | 386 (3.8%) |
Income Below Poverty Among Single-Parent Households in Mooresville
According to the poverty data in Mooresville, 8.0% or 69 single-father households and 21.6% or 530 single-mother households are living below the poverty line. Among single-father households, those with no children have the highest poverty rate, with 50 households (13.1%) experiencing poverty. Likewise, among single-mother households, those with 5 or more children have the highest poverty rate, with 7 households (100.0%) falling below the poverty line.
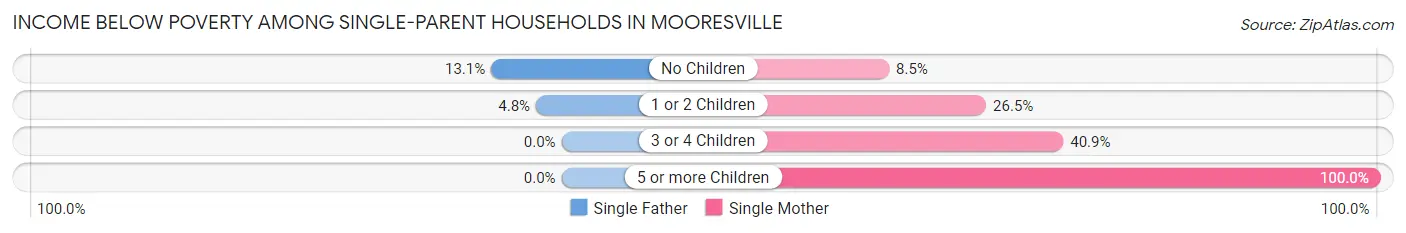
| Children | Single Father | Single Mother |
| No Children | 50 (13.1%) | 68 (8.5%) |
| 1 or 2 Children | 19 (4.8%) | 401 (26.5%) |
| 3 or 4 Children | 0 (0.0%) | 54 (40.9%) |
| 5 or more Children | 0 (0.0%) | 7 (100.0%) |
| Total | 69 (8.0%) | 530 (21.6%) |
Income Below Poverty Among Married-Couple vs Single-Parent Households in Mooresville
The poverty data for Mooresville shows that 386 of the married-couple family households (3.8%) and 599 of the single-parent households (18.1%) are living below the poverty level. Within the married-couple family households, those with no children have the highest poverty rate, with 307 households (6.0%) falling below the poverty line. Among the single-parent households, those with 5 or more children have the highest poverty rate, with 7 household (100.0%) living below poverty.
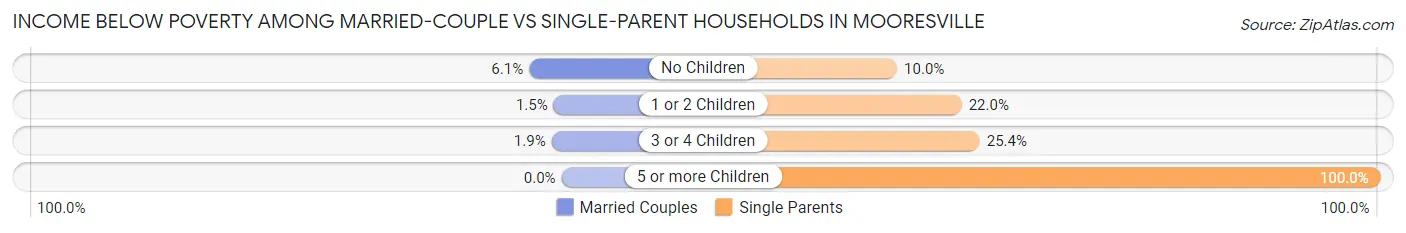
| Children | Married-Couple Families | Single-Parent Households |
| No Children | 307 (6.0%) | 118 (10.0%) |
| 1 or 2 Children | 61 (1.5%) | 420 (22.0%) |
| 3 or 4 Children | 18 (1.9%) | 54 (25.4%) |
| 5 or more Children | 0 (0.0%) | 7 (100.0%) |
| Total | 386 (3.8%) | 599 (18.1%) |
Race in Mooresville
The most populous races in Mooresville are White / Caucasian (38,775 | 77.5%), Black / African American (5,179 | 10.3%), and Hispanic or Latino (3,258 | 6.5%).
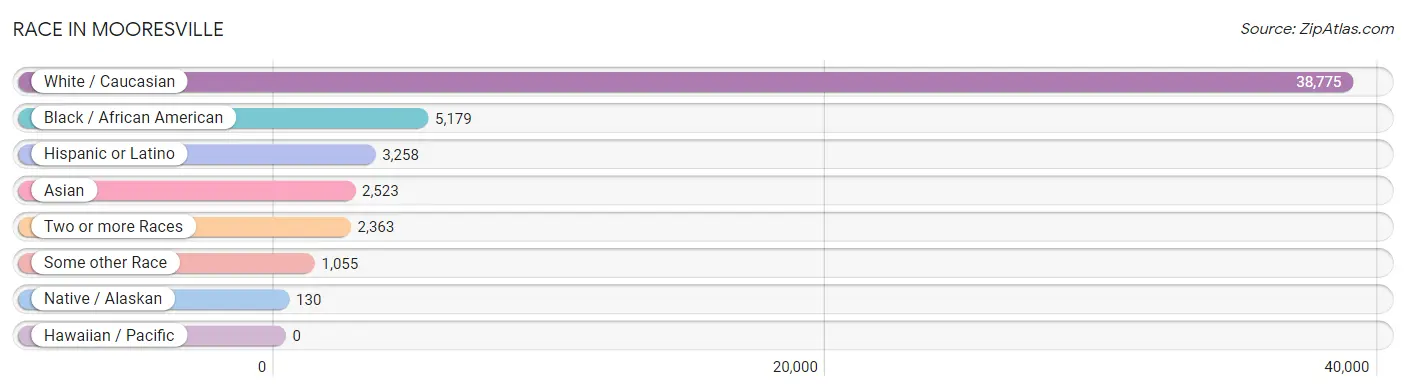
| Race | # Population | % Population |
| Asian | 2,523 | 5.0% |
| Black / African American | 5,179 | 10.3% |
| Hawaiian / Pacific | 0 | 0.0% |
| Hispanic or Latino | 3,258 | 6.5% |
| Native / Alaskan | 130 | 0.3% |
| White / Caucasian | 38,775 | 77.5% |
| Two or more Races | 2,363 | 4.7% |
| Some other Race | 1,055 | 2.1% |
| Total | 50,025 | 100.0% |
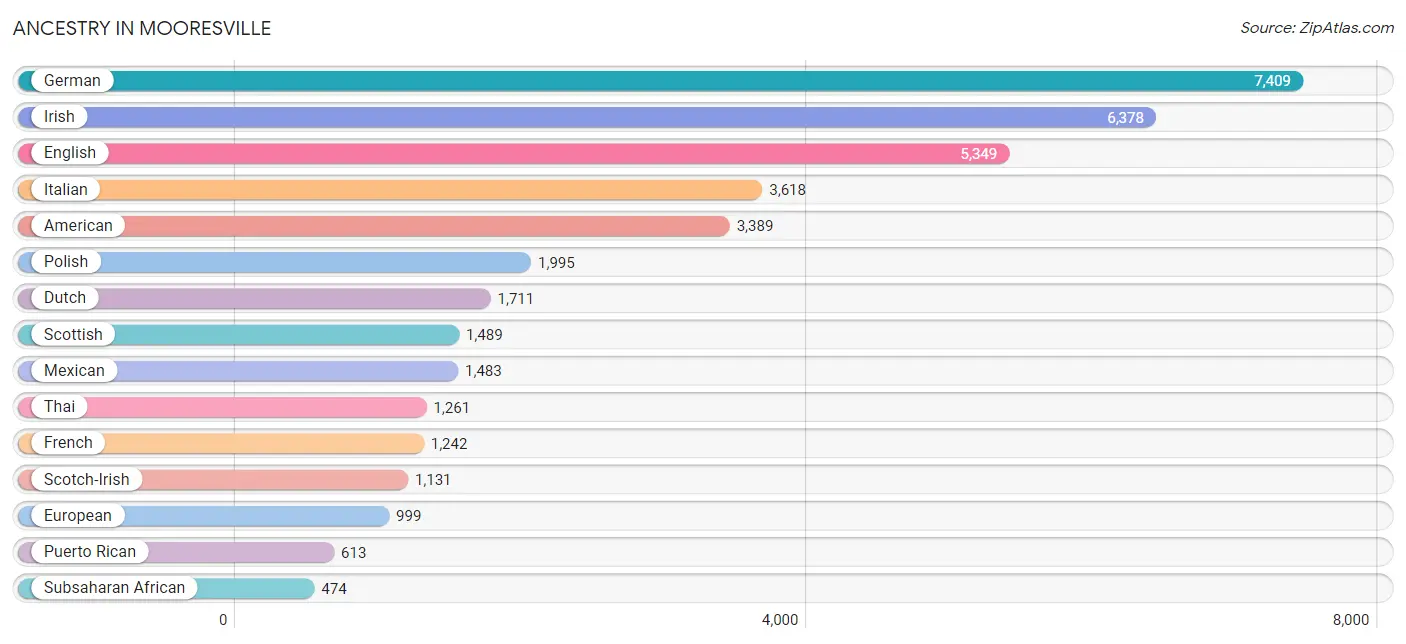
Ancestry in Mooresville
The most populous ancestries reported in Mooresville are German (7,409 | 14.8%), Irish (6,378 | 12.8%), English (5,349 | 10.7%), Italian (3,618 | 7.2%), and American (3,389 | 6.8%), together accounting for 52.2% of all Mooresville residents.
| Ancestry | # Population | % Population |
| African | 229 | 0.5% |
| American | 3,389 | 6.8% |
| Arab | 101 | 0.2% |
| Armenian | 63 | 0.1% |
| Austrian | 31 | 0.1% |
| Bhutanese | 427 | 0.9% |
| British | 192 | 0.4% |
| Burmese | 323 | 0.6% |
| Canadian | 195 | 0.4% |
| Central American | 276 | 0.5% |
| Central American Indian | 6 | 0.0% |
| Cherokee | 146 | 0.3% |
| Colombian | 167 | 0.3% |
| Costa Rican | 47 | 0.1% |
| Croatian | 29 | 0.1% |
| Cuban | 108 | 0.2% |
| Czech | 113 | 0.2% |
| Czechoslovakian | 72 | 0.1% |
| Danish | 101 | 0.2% |
| Delaware | 4 | 0.0% |
| Dominican | 67 | 0.1% |
| Dutch | 1,711 | 3.4% |
| Eastern European | 190 | 0.4% |
| Ecuadorian | 214 | 0.4% |
| English | 5,349 | 10.7% |
| Estonian | 14 | 0.0% |
| European | 999 | 2.0% |
| Finnish | 162 | 0.3% |
| French | 1,242 | 2.5% |
| French Canadian | 175 | 0.4% |
| German | 7,409 | 14.8% |
| Greek | 448 | 0.9% |
| Haitian | 61 | 0.1% |
| Honduran | 35 | 0.1% |
| Hungarian | 264 | 0.5% |
| Indian (Asian) | 107 | 0.2% |
| Iranian | 138 | 0.3% |
| Irish | 6,378 | 12.8% |
| Israeli | 17 | 0.0% |
| Italian | 3,618 | 7.2% |
| Jamaican | 230 | 0.5% |
| Korean | 295 | 0.6% |
| Latvian | 69 | 0.1% |
| Lebanese | 46 | 0.1% |
| Lithuanian | 104 | 0.2% |
| Lumbee | 9 | 0.0% |
| Macedonian | 8 | 0.0% |
| Malaysian | 81 | 0.2% |
| Mexican | 1,483 | 3.0% |
| Mexican American Indian | 235 | 0.5% |
| Native Hawaiian | 12 | 0.0% |
| Navajo | 27 | 0.1% |
| Nicaraguan | 23 | 0.1% |
| Nigerian | 58 | 0.1% |
| Norwegian | 243 | 0.5% |
| Pakistani | 12 | 0.0% |
| Palestinian | 13 | 0.0% |
| Panamanian | 26 | 0.1% |
| Paraguayan | 15 | 0.0% |
| Pennsylvania German | 9 | 0.0% |
| Peruvian | 15 | 0.0% |
| Polish | 1,995 | 4.0% |
| Portuguese | 143 | 0.3% |
| Puerto Rican | 613 | 1.2% |
| Romanian | 106 | 0.2% |
| Russian | 112 | 0.2% |
| Salvadoran | 145 | 0.3% |
| Scandinavian | 73 | 0.2% |
| Scotch-Irish | 1,131 | 2.3% |
| Scottish | 1,489 | 3.0% |
| Slovak | 39 | 0.1% |
| Slovene | 10 | 0.0% |
| South American | 468 | 0.9% |
| South American Indian | 5 | 0.0% |
| Spaniard | 90 | 0.2% |
| Spanish | 96 | 0.2% |
| Sri Lankan | 383 | 0.8% |
| Subsaharan African | 474 | 0.9% |
| Swedish | 365 | 0.7% |
| Swiss | 88 | 0.2% |
| Thai | 1,261 | 2.5% |
| Trinidadian and Tobagonian | 12 | 0.0% |
| Turkish | 325 | 0.6% |
| Ugandan | 24 | 0.1% |
| Ukrainian | 51 | 0.1% |
| Uruguayan | 14 | 0.0% |
| Venezuelan | 27 | 0.1% |
| Welsh | 220 | 0.4% |
| Yugoslavian | 4 | 0.0% |
| Yuman | 30 | 0.1% | View All 90 Rows |
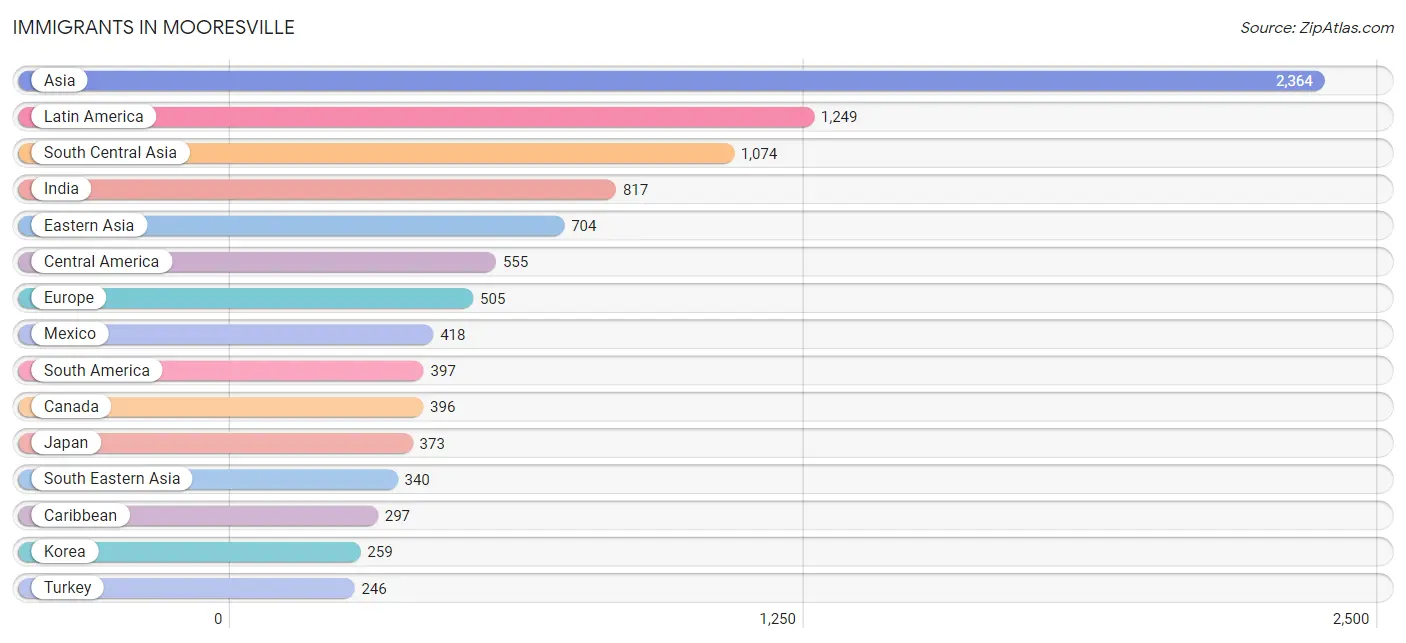
Immigrants in Mooresville
The most numerous immigrant groups reported in Mooresville came from Asia (2,364 | 4.7%), Latin America (1,249 | 2.5%), South Central Asia (1,074 | 2.1%), India (817 | 1.6%), and Eastern Asia (704 | 1.4%), together accounting for 12.4% of all Mooresville residents.
| Immigration Origin | # Population | % Population |
| Africa | 222 | 0.4% |
| Asia | 2,364 | 4.7% |
| Belize | 19 | 0.0% |
| Brazil | 72 | 0.1% |
| Cambodia | 22 | 0.0% |
| Canada | 396 | 0.8% |
| Caribbean | 297 | 0.6% |
| Central America | 555 | 1.1% |
| China | 72 | 0.1% |
| Colombia | 85 | 0.2% |
| Costa Rica | 36 | 0.1% |
| Cuba | 43 | 0.1% |
| Dominican Republic | 27 | 0.1% |
| Eastern Africa | 65 | 0.1% |
| Eastern Asia | 704 | 1.4% |
| Eastern Europe | 220 | 0.4% |
| Ecuador | 205 | 0.4% |
| El Salvador | 51 | 0.1% |
| England | 55 | 0.1% |
| Europe | 505 | 1.0% |
| France | 6 | 0.0% |
| Germany | 93 | 0.2% |
| Haiti | 61 | 0.1% |
| Honduras | 8 | 0.0% |
| Hungary | 19 | 0.0% |
| India | 817 | 1.6% |
| Iran | 138 | 0.3% |
| Ireland | 20 | 0.0% |
| Italy | 29 | 0.1% |
| Jamaica | 166 | 0.3% |
| Japan | 373 | 0.7% |
| Kenya | 41 | 0.1% |
| Korea | 259 | 0.5% |
| Laos | 25 | 0.1% |
| Latin America | 1,249 | 2.5% |
| Mexico | 418 | 0.8% |
| Moldova | 97 | 0.2% |
| Netherlands | 13 | 0.0% |
| Nicaragua | 23 | 0.1% |
| Nigeria | 58 | 0.1% |
| Northern Europe | 98 | 0.2% |
| Pakistan | 19 | 0.0% |
| Philippines | 40 | 0.1% |
| Poland | 13 | 0.0% |
| Portugal | 28 | 0.1% |
| Romania | 17 | 0.0% |
| Russia | 56 | 0.1% |
| South Africa | 33 | 0.1% |
| South America | 397 | 0.8% |
| South Central Asia | 1,074 | 2.1% |
| South Eastern Asia | 340 | 0.7% |
| Southern Europe | 75 | 0.2% |
| Spain | 18 | 0.0% |
| Sri Lanka | 51 | 0.1% |
| Sweden | 14 | 0.0% |
| Thailand | 21 | 0.0% |
| Turkey | 246 | 0.5% |
| Uganda | 24 | 0.1% |
| Ukraine | 18 | 0.0% |
| Uruguay | 8 | 0.0% |
| Uzbekistan | 49 | 0.1% |
| Venezuela | 27 | 0.1% |
| Vietnam | 232 | 0.5% |
| Western Africa | 124 | 0.3% |
| Western Asia | 246 | 0.5% |
| Western Europe | 112 | 0.2% | View All 66 Rows |
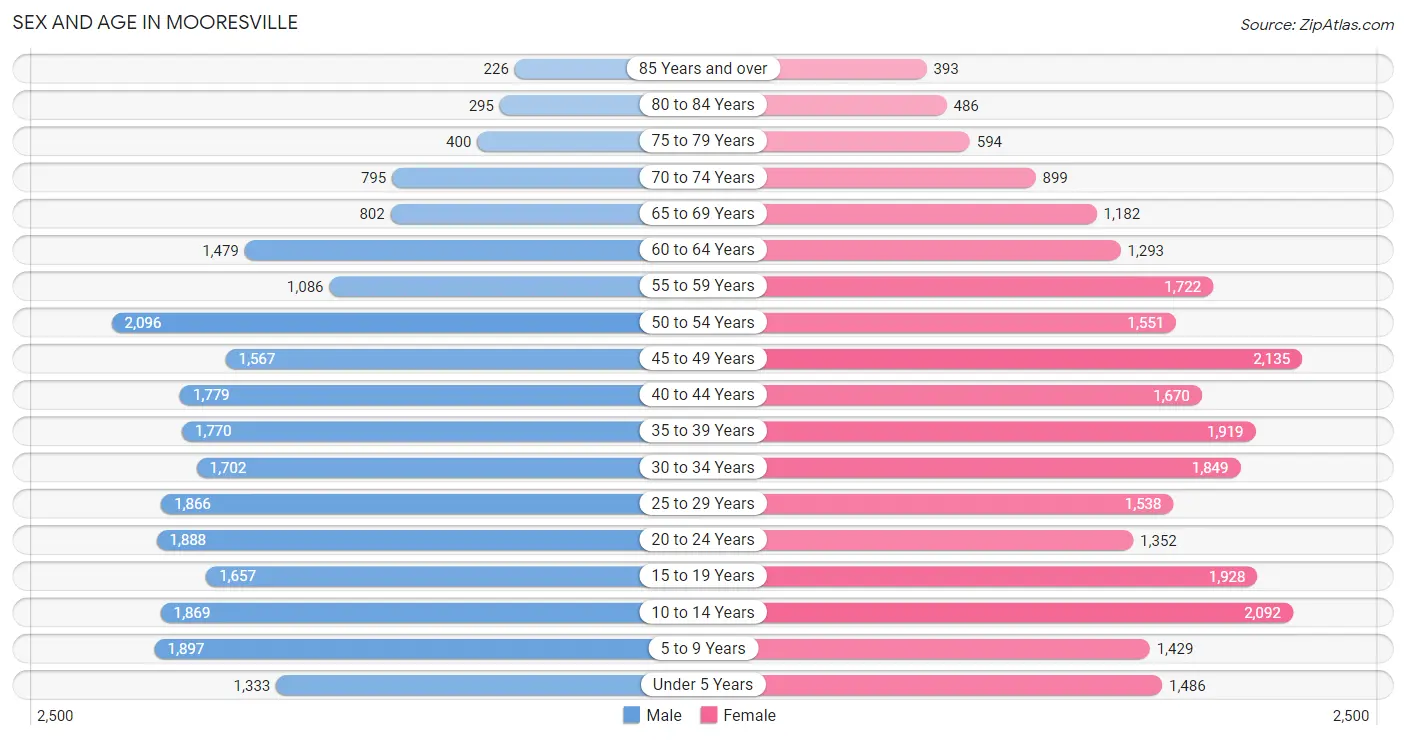
Sex and Age in Mooresville
Sex and Age in Mooresville
The most populous age groups in Mooresville are 50 to 54 Years (2,096 | 8.6%) for men and 45 to 49 Years (2,135 | 8.4%) for women.
| Age Bracket | Male | Female |
| Under 5 Years | 1,333 (5.4%) | 1,486 (5.8%) |
| 5 to 9 Years | 1,897 (7.7%) | 1,429 (5.6%) |
| 10 to 14 Years | 1,869 (7.6%) | 2,092 (8.2%) |
| 15 to 19 Years | 1,657 (6.8%) | 1,928 (7.6%) |
| 20 to 24 Years | 1,888 (7.7%) | 1,352 (5.3%) |
| 25 to 29 Years | 1,866 (7.6%) | 1,538 (6.0%) |
| 30 to 34 Years | 1,702 (6.9%) | 1,849 (7.2%) |
| 35 to 39 Years | 1,770 (7.2%) | 1,919 (7.5%) |
| 40 to 44 Years | 1,779 (7.3%) | 1,670 (6.5%) |
| 45 to 49 Years | 1,567 (6.4%) | 2,135 (8.4%) |
| 50 to 54 Years | 2,096 (8.6%) | 1,551 (6.1%) |
| 55 to 59 Years | 1,086 (4.4%) | 1,722 (6.8%) |
| 60 to 64 Years | 1,479 (6.0%) | 1,293 (5.1%) |
| 65 to 69 Years | 802 (3.3%) | 1,182 (4.6%) |
| 70 to 74 Years | 795 (3.2%) | 899 (3.5%) |
| 75 to 79 Years | 400 (1.6%) | 594 (2.3%) |
| 80 to 84 Years | 295 (1.2%) | 486 (1.9%) |
| 85 Years and over | 226 (0.9%) | 393 (1.5%) |
| Total | 24,507 (100.0%) | 25,518 (100.0%) |
Families and Households in Mooresville
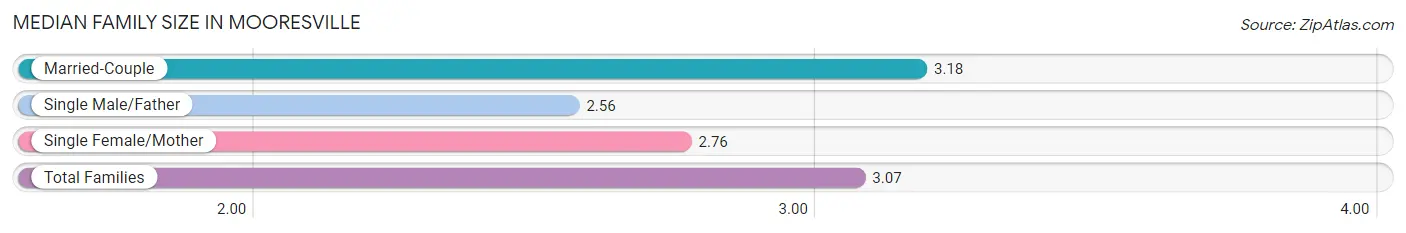
Median Family Size in Mooresville
The median family size in Mooresville is 3.07 persons per family, with married-couple families (10,163 | 75.4%) accounting for the largest median family size of 3.18 persons per family. On the other hand, single male/father families (861 | 6.4%) represent the smallest median family size with 2.56 persons per family.
| Family Type | # Families | Family Size |
| Married-Couple | 10,163 (75.4%) | 3.18 |
| Single Male/Father | 861 (6.4%) | 2.56 |
| Single Female/Mother | 2,454 (18.2%) | 2.76 |
| Total Families | 13,478 (100.0%) | 3.07 |
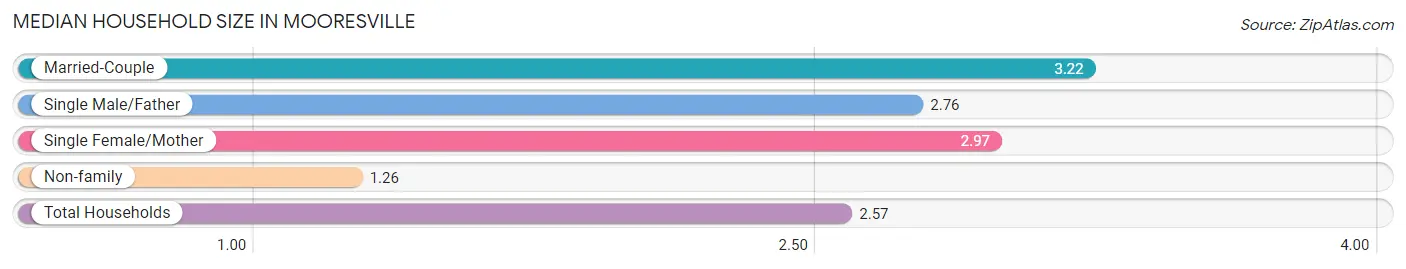
Median Household Size in Mooresville
The median household size in Mooresville is 2.57 persons per household, with married-couple households (10,163 | 52.5%) accounting for the largest median household size of 3.22 persons per household. non-family households (5,887 | 30.4%) represent the smallest median household size with 1.26 persons per household.
| Household Type | # Households | Household Size |
| Married-Couple | 10,163 (52.5%) | 3.22 |
| Single Male/Father | 861 (4.4%) | 2.76 |
| Single Female/Mother | 2,454 (12.7%) | 2.97 |
| Non-family | 5,887 (30.4%) | 1.26 |
| Total Households | 19,365 (100.0%) | 2.57 |
Household Size by Marriage Status in Mooresville
Out of a total of 19,365 households in Mooresville, 13,478 (69.6%) are family households, while 5,887 (30.4%) are nonfamily households. The most numerous type of family households are 2-person households, comprising 5,537, and the most common type of nonfamily households are 1-person households, comprising 4,760.
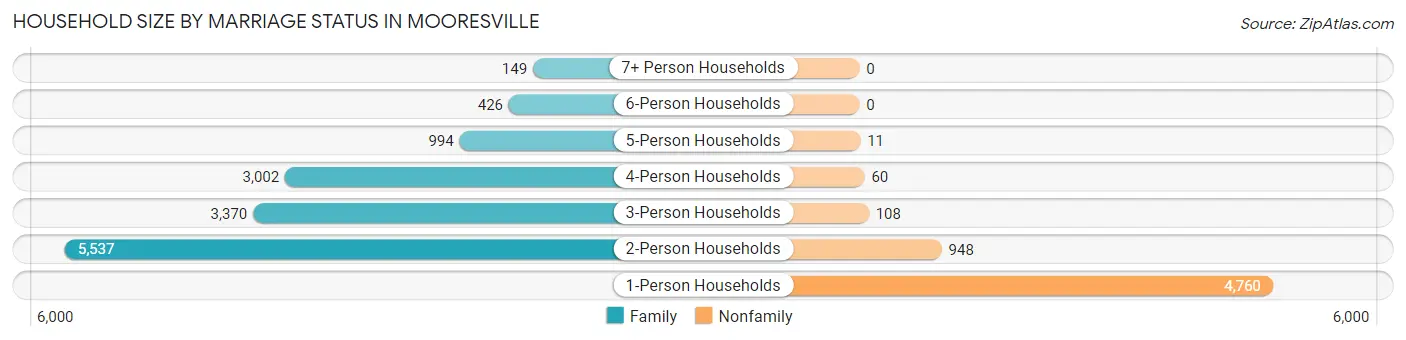
| Household Size | Family Households | Nonfamily Households |
| 1-Person Households | - | 4,760 (24.6%) |
| 2-Person Households | 5,537 (28.6%) | 948 (4.9%) |
| 3-Person Households | 3,370 (17.4%) | 108 (0.6%) |
| 4-Person Households | 3,002 (15.5%) | 60 (0.3%) |
| 5-Person Households | 994 (5.1%) | 11 (0.1%) |
| 6-Person Households | 426 (2.2%) | 0 (0.0%) |
| 7+ Person Households | 149 (0.8%) | 0 (0.0%) |
| Total | 13,478 (69.6%) | 5,887 (30.4%) |
Female Fertility in Mooresville
Fertility by Age in Mooresville
Average fertility rate in Mooresville is 70.0 births per 1,000 women. Women in the age bracket of 20 to 34 years have the highest fertility rate with 124.0 births per 1,000 women. Women in the age bracket of 20 to 34 years acount for 66.4% of all women with births.
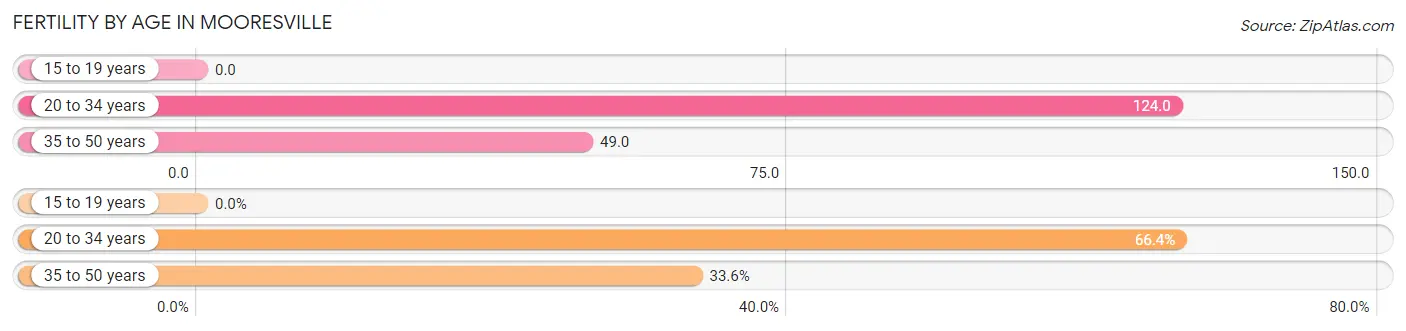
| Age Bracket | Women with Births | Births / 1,000 Women |
| 15 to 19 years | 0 (0.0%) | 0.0 |
| 20 to 34 years | 586 (66.4%) | 124.0 |
| 35 to 50 years | 296 (33.6%) | 49.0 |
| Total | 882 (100.0%) | 70.0 |
Fertility by Age by Marriage Status in Mooresville
81.5% of women with births (882) in Mooresville are married. The highest percentage of unmarried women with births falls into 20 to 34 years age bracket with 27.8% of them unmarried at the time of birth, while the lowest percentage of unmarried women with births belong to 35 to 50 years age bracket with 0.0% of them unmarried.
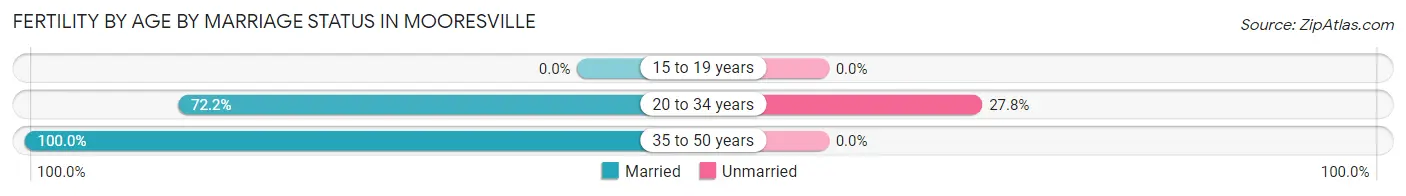
| Age Bracket | Married | Unmarried |
| 15 to 19 years | 0 (0.0%) | 0 (0.0%) |
| 20 to 34 years | 423 (72.2%) | 163 (27.8%) |
| 35 to 50 years | 296 (100.0%) | 0 (0.0%) |
| Total | 719 (81.5%) | 163 (18.5%) |
Fertility by Education in Mooresville
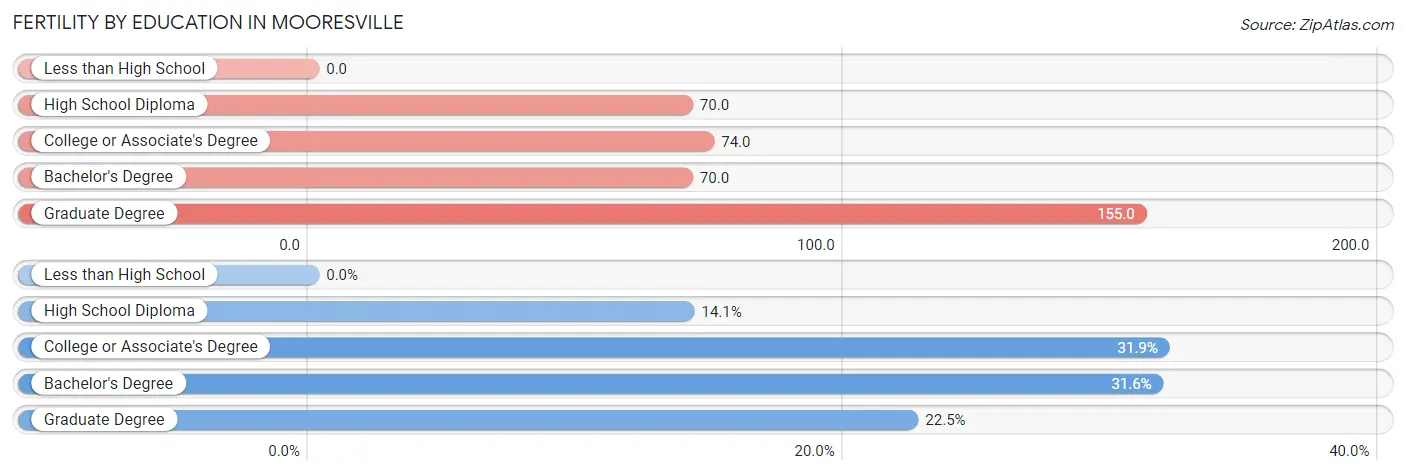
| Educational Attainment | Women with Births | Births / 1,000 Women |
| Less than High School | 0 (0.0%) | 0.0 |
| High School Diploma | 124 (14.1%) | 70.0 |
| College or Associate's Degree | 281 (31.9%) | 74.0 |
| Bachelor's Degree | 279 (31.6%) | 70.0 |
| Graduate Degree | 198 (22.5%) | 155.0 |
| Total | 882 (100.0%) | 70.0 |
Fertility by Education by Marriage Status in Mooresville
18.5% of women with births in Mooresville are unmarried. Women with the educational attainment of bachelor's degree are most likely to be married with 96.1% of them married at childbirth, while women with the educational attainment of high school diploma are least likely to be married with 78.2% of them unmarried at childbirth.
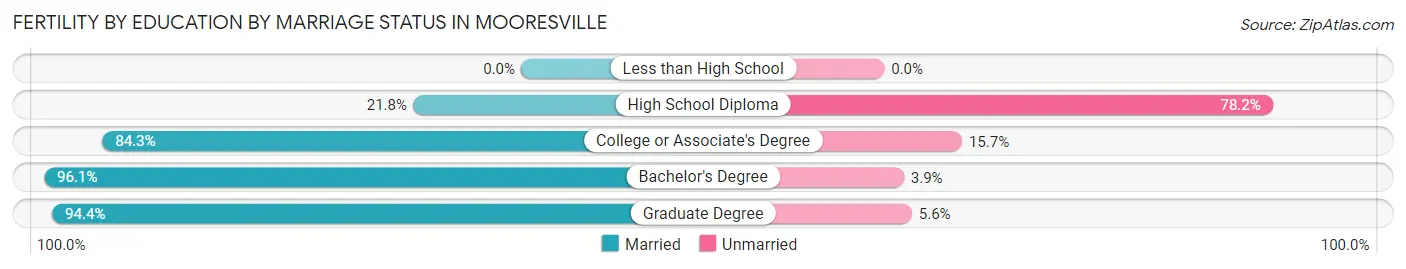
| Educational Attainment | Married | Unmarried |
| Less than High School | 0 (0.0%) | 0 (0.0%) |
| High School Diploma | 27 (21.8%) | 97 (78.2%) |
| College or Associate's Degree | 237 (84.3%) | 44 (15.7%) |
| Bachelor's Degree | 268 (96.1%) | 11 (3.9%) |
| Graduate Degree | 187 (94.4%) | 11 (5.6%) |
| Total | 719 (81.5%) | 163 (18.5%) |
Employment Characteristics in Mooresville
Employment by Class of Employer in Mooresville
Among the 25,402 employed individuals in Mooresville, private company employees (19,402 | 76.4%), self-employed (not incorporated) (1,479 | 5.8%), and not-for-profit organizations (1,403 | 5.5%) make up the most common classes of employment.
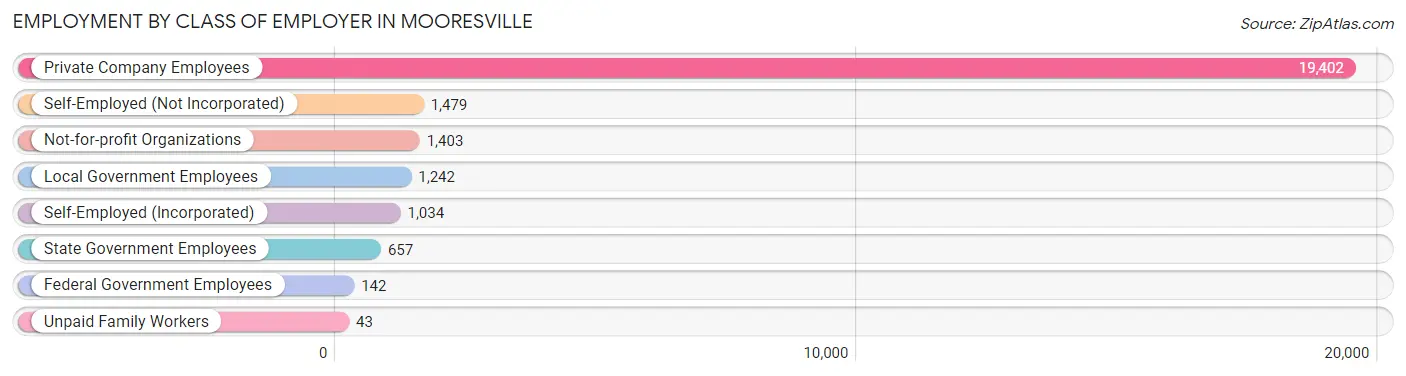
| Employer Class | # Employees | % Employees |
| Private Company Employees | 19,402 | 76.4% |
| Self-Employed (Incorporated) | 1,034 | 4.1% |
| Self-Employed (Not Incorporated) | 1,479 | 5.8% |
| Not-for-profit Organizations | 1,403 | 5.5% |
| Local Government Employees | 1,242 | 4.9% |
| State Government Employees | 657 | 2.6% |
| Federal Government Employees | 142 | 0.6% |
| Unpaid Family Workers | 43 | 0.2% |
| Total | 25,402 | 100.0% |
Employment Status by Age in Mooresville
According to the labor force statistics for Mooresville, out of the total population over 16 years of age (39,195), 68.8% or 26,966 individuals are in the labor force, with 3.9% or 1,052 of them unemployed. The age group with the highest labor force participation rate is 25 to 29 years, with 86.6% or 2,948 individuals in the labor force. Within the labor force, the 16 to 19 years age range has the highest percentage of unemployed individuals, with 15.9% or 248 of them being unemployed.
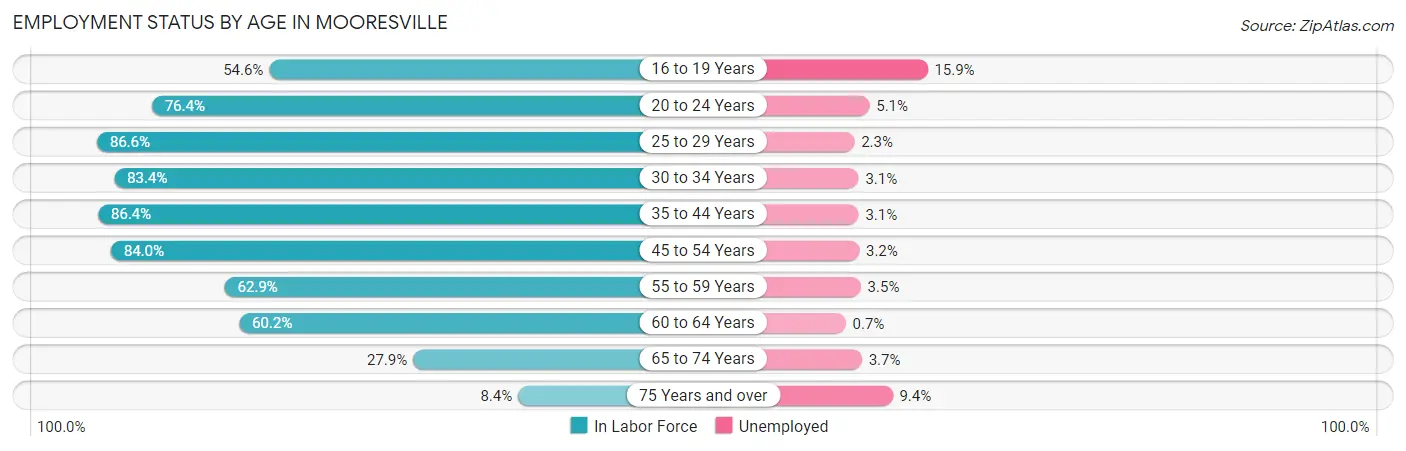
| Age Bracket | In Labor Force | Unemployed |
| 16 to 19 Years | 1,562 (54.6%) | 248 (15.9%) |
| 20 to 24 Years | 2,475 (76.4%) | 126 (5.1%) |
| 25 to 29 Years | 2,948 (86.6%) | 68 (2.3%) |
| 30 to 34 Years | 2,962 (83.4%) | 92 (3.1%) |
| 35 to 44 Years | 6,167 (86.4%) | 191 (3.1%) |
| 45 to 54 Years | 6,173 (84.0%) | 198 (3.2%) |
| 55 to 59 Years | 1,766 (62.9%) | 62 (3.5%) |
| 60 to 64 Years | 1,669 (60.2%) | 12 (0.7%) |
| 65 to 74 Years | 1,026 (27.9%) | 38 (3.7%) |
| 75 Years and over | 201 (8.4%) | 19 (9.4%) |
| Total | 26,966 (68.8%) | 1,052 (3.9%) |
Employment Status by Educational Attainment in Mooresville
According to labor force statistics for Mooresville, 80.3% of individuals (21,699) out of the total population between 25 and 64 years of age (27,022) are in the labor force, with 2.9% or 629 of them being unemployed. The group with the highest labor force participation rate are those with the educational attainment of bachelor's degree or higher, with 85.4% or 10,922 individuals in the labor force. Within the labor force, individuals with high school diploma education have the highest percentage of unemployment, with 6.5% or 209 of them being unemployed.
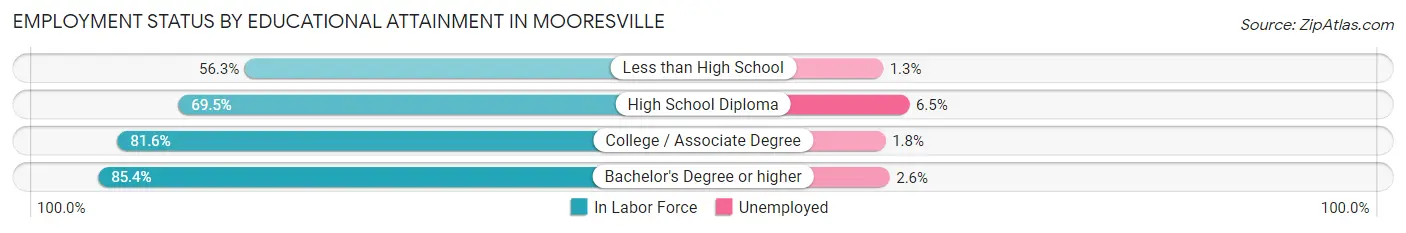
| Educational Attainment | In Labor Force | Unemployed |
| Less than High School | 631 (56.3%) | 15 (1.3%) |
| High School Diploma | 3,208 (69.5%) | 300 (6.5%) |
| College / Associate Degree | 6,934 (81.6%) | 153 (1.8%) |
| Bachelor's Degree or higher | 10,922 (85.4%) | 333 (2.6%) |
| Total | 21,699 (80.3%) | 784 (2.9%) |
Employment Occupations by Sex in Mooresville
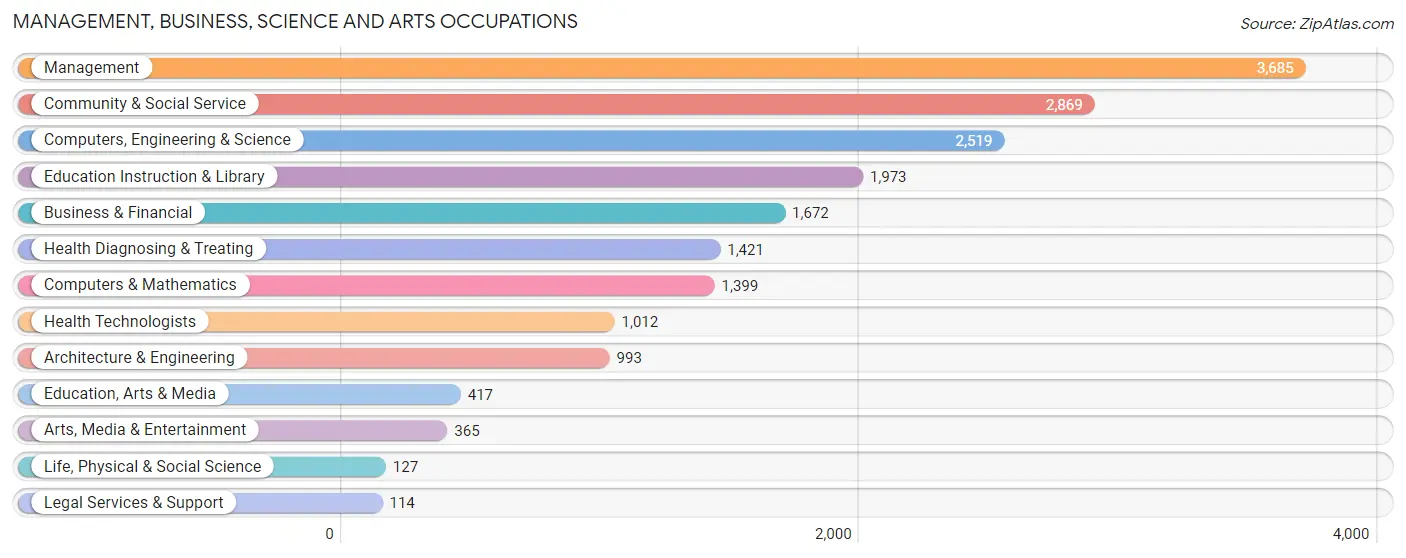
Management, Business, Science and Arts Occupations
The most common Management, Business, Science and Arts occupations in Mooresville are Management (3,685 | 14.2%), Community & Social Service (2,869 | 11.1%), Computers, Engineering & Science (2,519 | 9.7%), Education Instruction & Library (1,973 | 7.6%), and Business & Financial (1,672 | 6.5%).
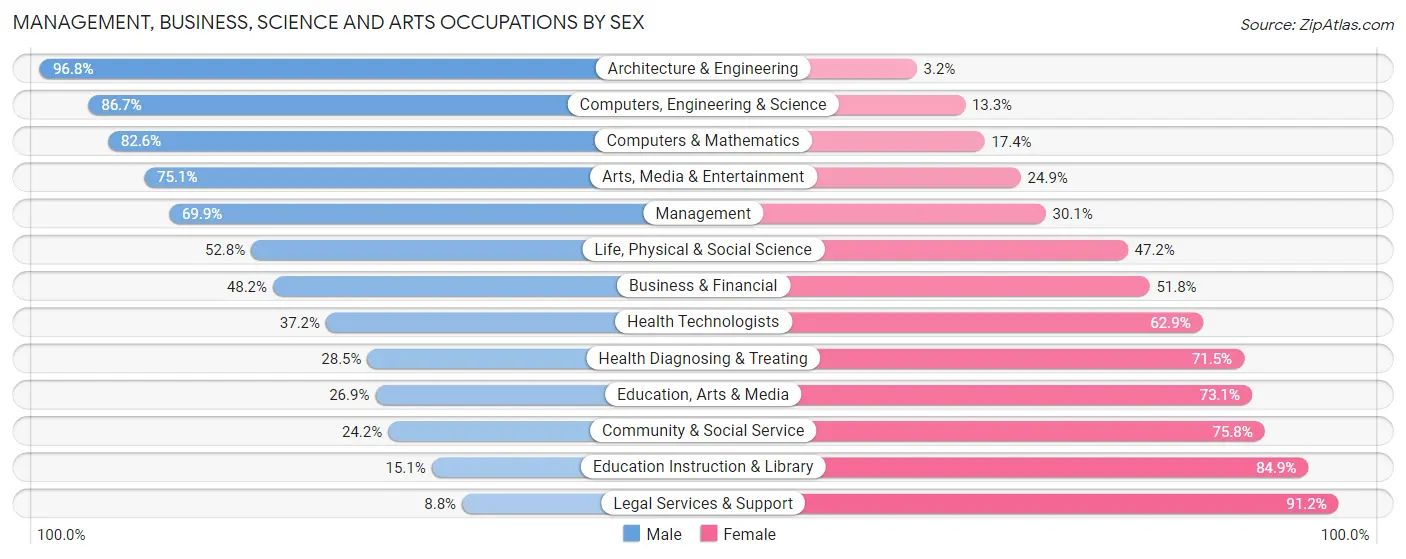
Management, Business, Science and Arts Occupations by Sex
Within the Management, Business, Science and Arts occupations in Mooresville, the most male-oriented occupations are Architecture & Engineering (96.8%), Computers, Engineering & Science (86.7%), and Computers & Mathematics (82.6%), while the most female-oriented occupations are Legal Services & Support (91.2%), Education Instruction & Library (84.9%), and Community & Social Service (75.8%).
| Occupation | Male | Female |
| Management | 2,575 (69.9%) | 1,110 (30.1%) |
| Business & Financial | 806 (48.2%) | 866 (51.8%) |
| Computers, Engineering & Science | 2,184 (86.7%) | 335 (13.3%) |
| Computers & Mathematics | 1,156 (82.6%) | 243 (17.4%) |
| Architecture & Engineering | 961 (96.8%) | 32 (3.2%) |
| Life, Physical & Social Science | 67 (52.8%) | 60 (47.2%) |
| Community & Social Service | 694 (24.2%) | 2,175 (75.8%) |
| Education, Arts & Media | 112 (26.9%) | 305 (73.1%) |
| Legal Services & Support | 10 (8.8%) | 104 (91.2%) |
| Education Instruction & Library | 298 (15.1%) | 1,675 (84.9%) |
| Arts, Media & Entertainment | 274 (75.1%) | 91 (24.9%) |
| Health Diagnosing & Treating | 405 (28.5%) | 1,016 (71.5%) |
| Health Technologists | 376 (37.1%) | 636 (62.8%) |
| Total (Category) | 6,664 (54.8%) | 5,502 (45.2%) |
| Total (Overall) | 14,412 (55.7%) | 11,452 (44.3%) |
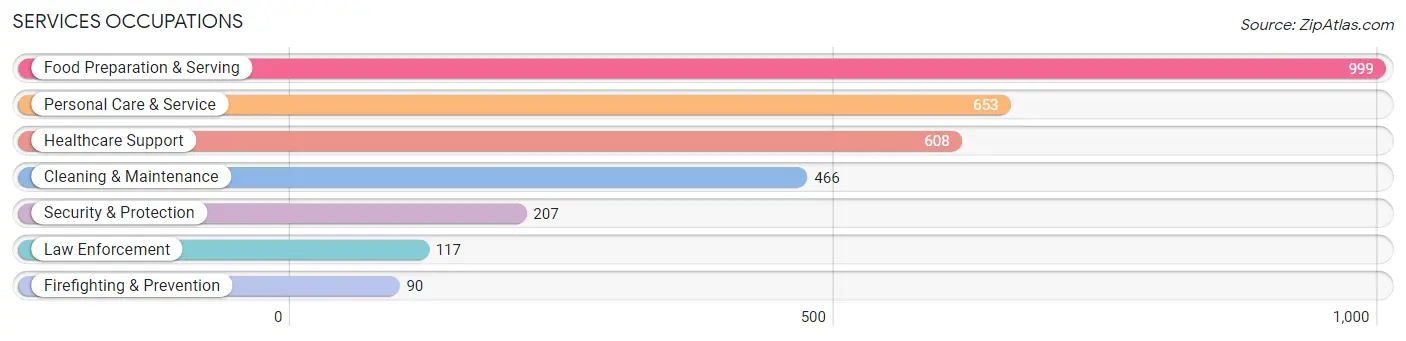
Services Occupations
The most common Services occupations in Mooresville are Food Preparation & Serving (999 | 3.9%), Personal Care & Service (653 | 2.5%), Healthcare Support (608 | 2.4%), Cleaning & Maintenance (466 | 1.8%), and Security & Protection (207 | 0.8%).
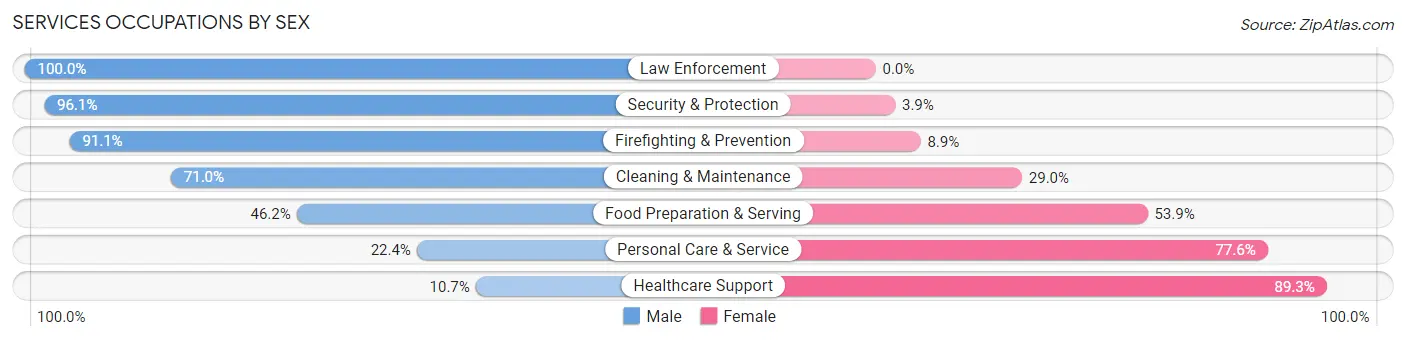
Services Occupations by Sex
Within the Services occupations in Mooresville, the most male-oriented occupations are Law Enforcement (100.0%), Security & Protection (96.1%), and Firefighting & Prevention (91.1%), while the most female-oriented occupations are Healthcare Support (89.3%), Personal Care & Service (77.6%), and Food Preparation & Serving (53.8%).
| Occupation | Male | Female |
| Healthcare Support | 65 (10.7%) | 543 (89.3%) |
| Security & Protection | 199 (96.1%) | 8 (3.9%) |
| Firefighting & Prevention | 82 (91.1%) | 8 (8.9%) |
| Law Enforcement | 117 (100.0%) | 0 (0.0%) |
| Food Preparation & Serving | 461 (46.2%) | 538 (53.8%) |
| Cleaning & Maintenance | 331 (71.0%) | 135 (29.0%) |
| Personal Care & Service | 146 (22.4%) | 507 (77.6%) |
| Total (Category) | 1,202 (41.0%) | 1,731 (59.0%) |
| Total (Overall) | 14,412 (55.7%) | 11,452 (44.3%) |
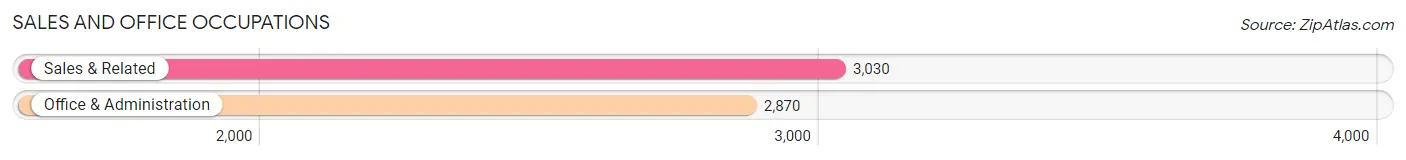
Sales and Office Occupations
The most common Sales and Office occupations in Mooresville are Sales & Related (3,030 | 11.7%), and Office & Administration (2,870 | 11.1%).
Sales and Office Occupations by Sex
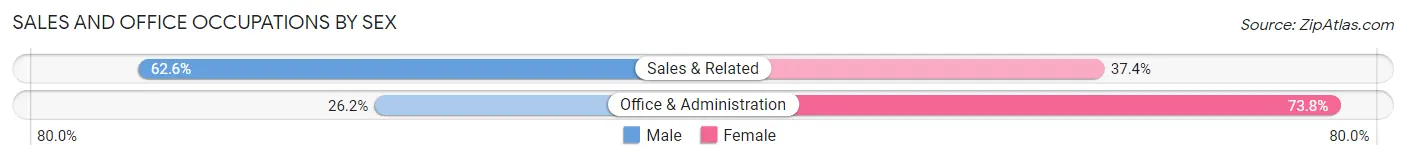
| Occupation | Male | Female |
| Sales & Related | 1,896 (62.6%) | 1,134 (37.4%) |
| Office & Administration | 753 (26.2%) | 2,117 (73.8%) |
| Total (Category) | 2,649 (44.9%) | 3,251 (55.1%) |
| Total (Overall) | 14,412 (55.7%) | 11,452 (44.3%) |
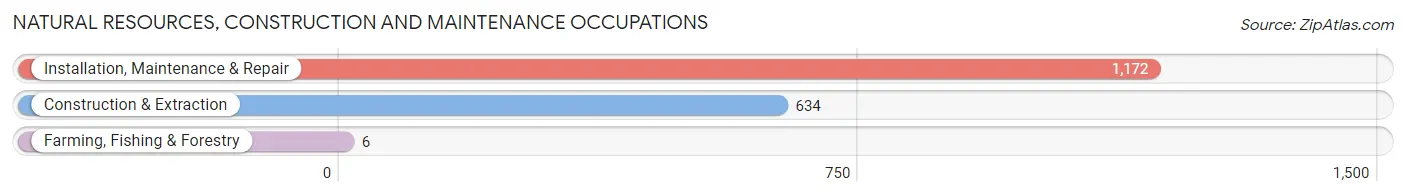
Natural Resources, Construction and Maintenance Occupations
The most common Natural Resources, Construction and Maintenance occupations in Mooresville are Installation, Maintenance & Repair (1,172 | 4.5%), Construction & Extraction (634 | 2.5%), and Farming, Fishing & Forestry (6 | 0.0%).
Natural Resources, Construction and Maintenance Occupations by Sex
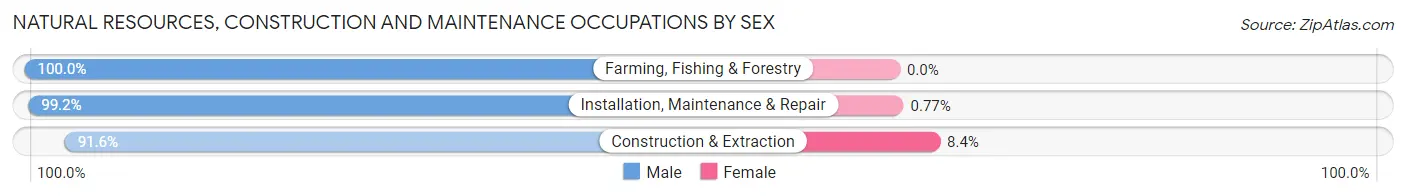
| Occupation | Male | Female |
| Farming, Fishing & Forestry | 6 (100.0%) | 0 (0.0%) |
| Construction & Extraction | 581 (91.6%) | 53 (8.4%) |
| Installation, Maintenance & Repair | 1,163 (99.2%) | 9 (0.8%) |
| Total (Category) | 1,750 (96.6%) | 62 (3.4%) |
| Total (Overall) | 14,412 (55.7%) | 11,452 (44.3%) |
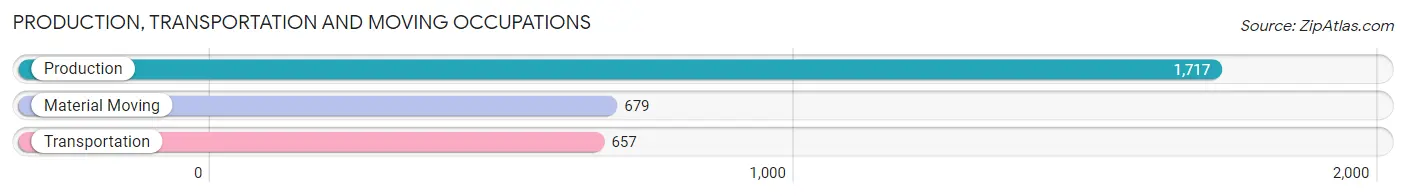
Production, Transportation and Moving Occupations
The most common Production, Transportation and Moving occupations in Mooresville are Production (1,717 | 6.6%), Material Moving (679 | 2.6%), and Transportation (657 | 2.5%).
Production, Transportation and Moving Occupations by Sex
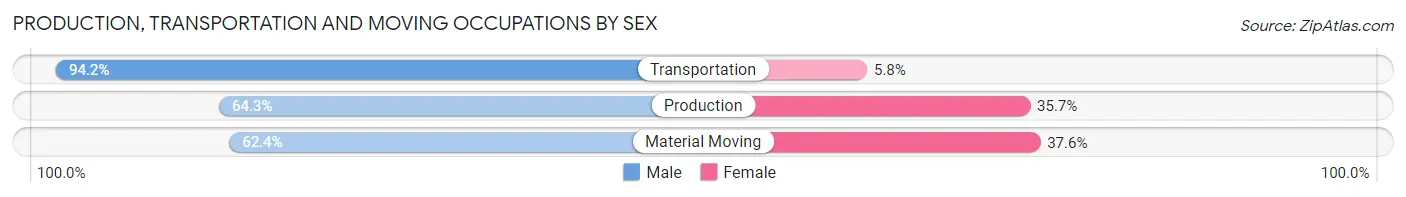
| Occupation | Male | Female |
| Production | 1,104 (64.3%) | 613 (35.7%) |
| Transportation | 619 (94.2%) | 38 (5.8%) |
| Material Moving | 424 (62.4%) | 255 (37.6%) |
| Total (Category) | 2,147 (70.3%) | 906 (29.7%) |
| Total (Overall) | 14,412 (55.7%) | 11,452 (44.3%) |
Employment Industries by Sex in Mooresville
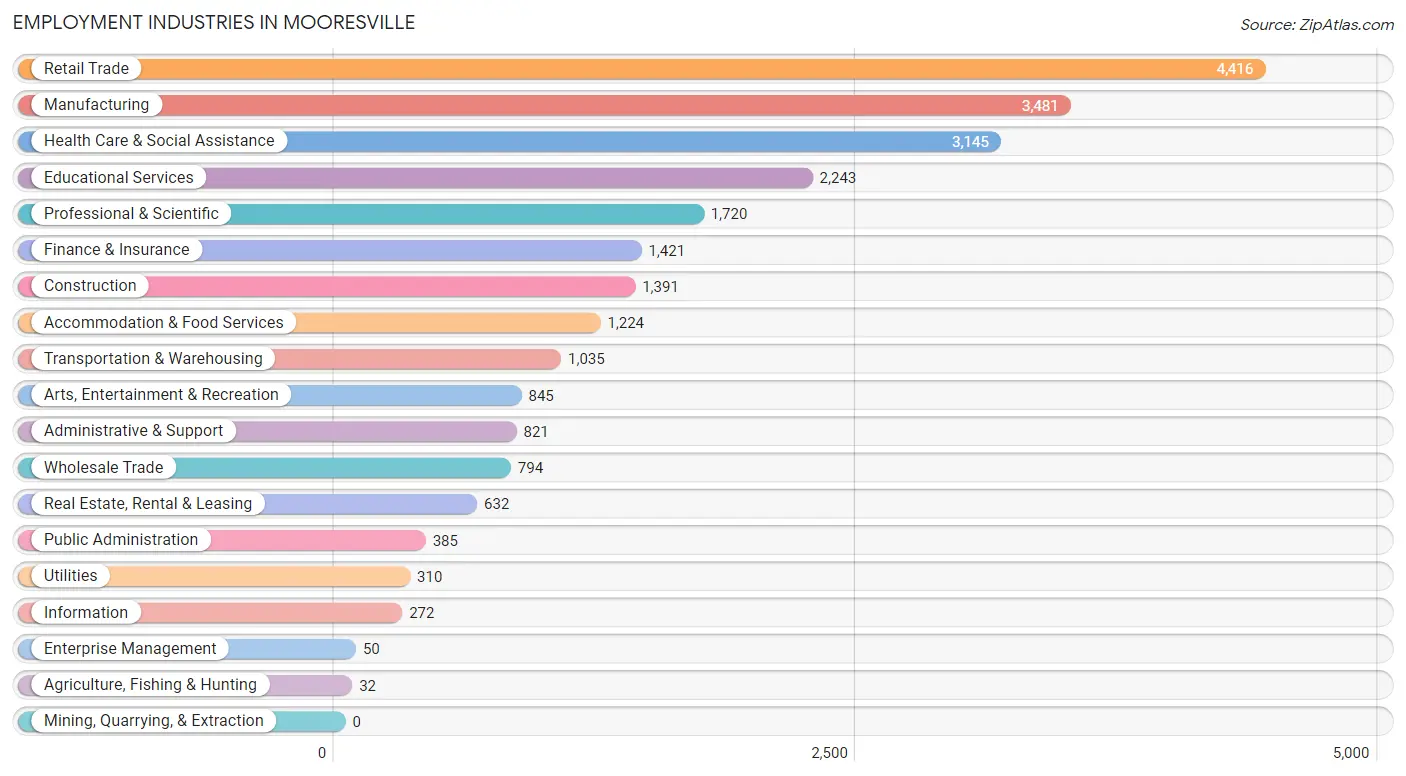
Employment Industries in Mooresville
The major employment industries in Mooresville include Retail Trade (4,416 | 17.1%), Manufacturing (3,481 | 13.5%), Health Care & Social Assistance (3,145 | 12.2%), Educational Services (2,243 | 8.7%), and Professional & Scientific (1,720 | 6.7%).
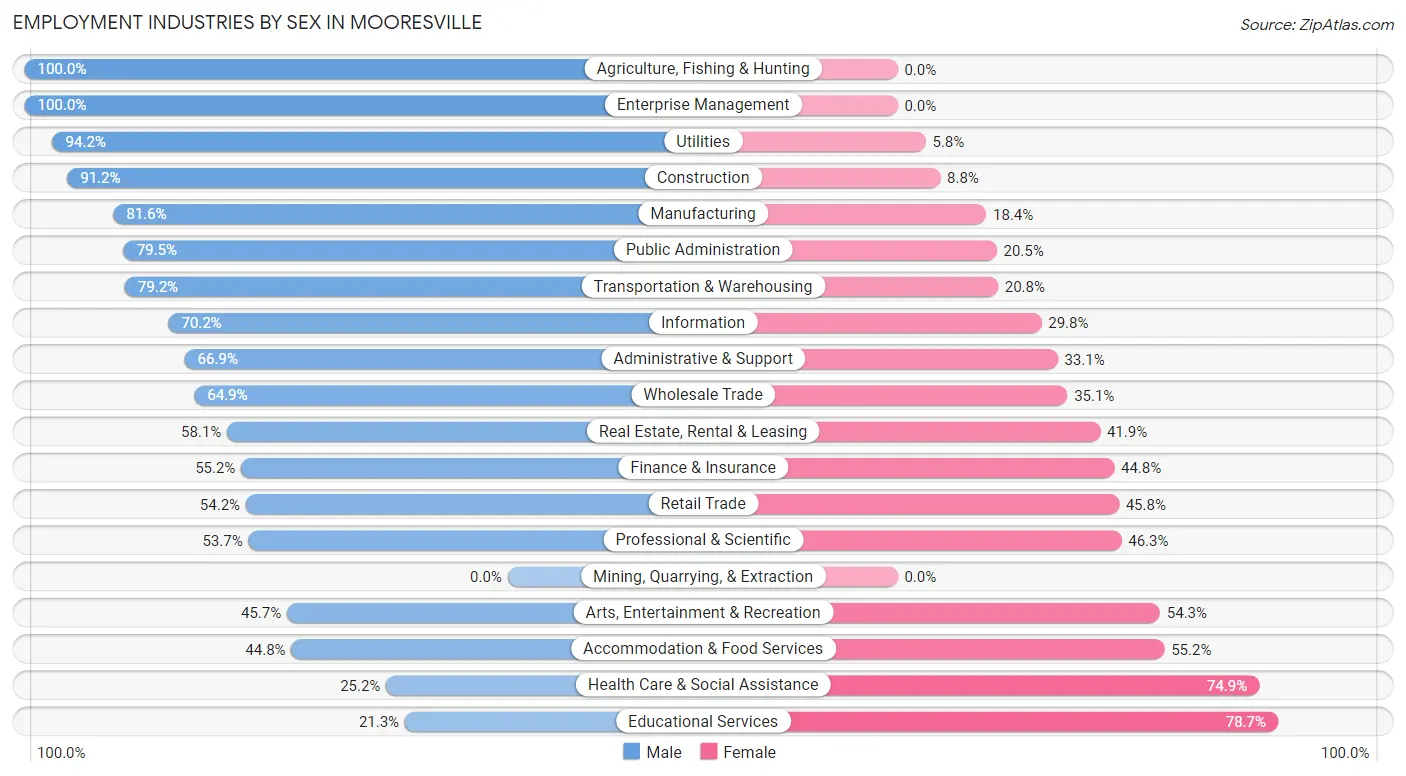
Employment Industries by Sex in Mooresville
The Mooresville industries that see more men than women are Agriculture, Fishing & Hunting (100.0%), Enterprise Management (100.0%), and Utilities (94.2%), whereas the industries that tend to have a higher number of women are Educational Services (78.7%), Health Care & Social Assistance (74.9%), and Accommodation & Food Services (55.2%).
| Industry | Male | Female |
| Agriculture, Fishing & Hunting | 32 (100.0%) | 0 (0.0%) |
| Mining, Quarrying, & Extraction | 0 (0.0%) | 0 (0.0%) |
| Construction | 1,268 (91.2%) | 123 (8.8%) |
| Manufacturing | 2,842 (81.6%) | 639 (18.4%) |
| Wholesale Trade | 515 (64.9%) | 279 (35.1%) |
| Retail Trade | 2,393 (54.2%) | 2,023 (45.8%) |
| Transportation & Warehousing | 820 (79.2%) | 215 (20.8%) |
| Utilities | 292 (94.2%) | 18 (5.8%) |
| Information | 191 (70.2%) | 81 (29.8%) |
| Finance & Insurance | 784 (55.2%) | 637 (44.8%) |
| Real Estate, Rental & Leasing | 367 (58.1%) | 265 (41.9%) |
| Professional & Scientific | 923 (53.7%) | 797 (46.3%) |
| Enterprise Management | 50 (100.0%) | 0 (0.0%) |
| Administrative & Support | 549 (66.9%) | 272 (33.1%) |
| Educational Services | 477 (21.3%) | 1,766 (78.7%) |
| Health Care & Social Assistance | 791 (25.2%) | 2,354 (74.9%) |
| Arts, Entertainment & Recreation | 386 (45.7%) | 459 (54.3%) |
| Accommodation & Food Services | 548 (44.8%) | 676 (55.2%) |
| Public Administration | 306 (79.5%) | 79 (20.5%) |
| Total | 14,412 (55.7%) | 11,452 (44.3%) |
Education in Mooresville
School Enrollment in Mooresville
The most common levels of schooling among the 12,455 students in Mooresville are high school (2,974 | 23.9%), elementary school (2,813 | 22.6%), and middle school (2,801 | 22.5%).
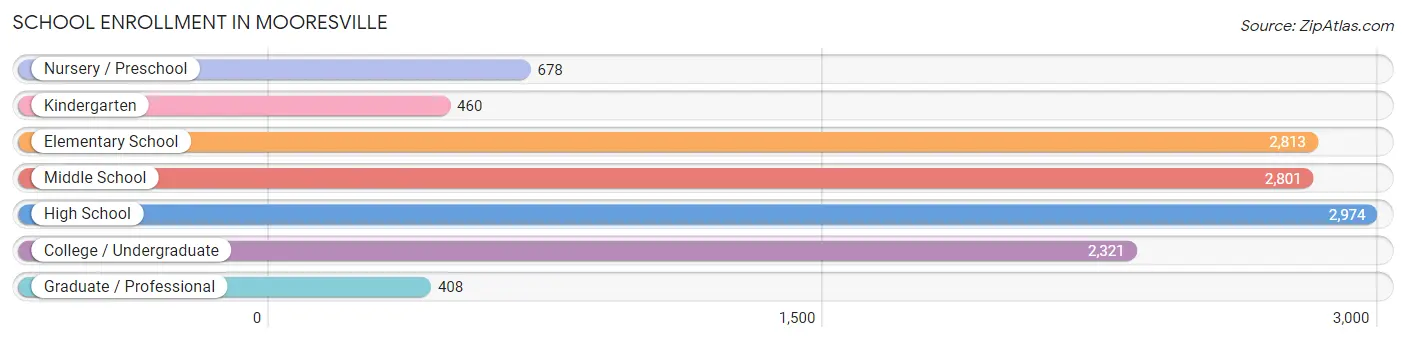
| School Level | # Students | % Students |
| Nursery / Preschool | 678 | 5.4% |
| Kindergarten | 460 | 3.7% |
| Elementary School | 2,813 | 22.6% |
| Middle School | 2,801 | 22.5% |
| High School | 2,974 | 23.9% |
| College / Undergraduate | 2,321 | 18.6% |
| Graduate / Professional | 408 | 3.3% |
| Total | 12,455 | 100.0% |
School Enrollment by Age by Funding Source in Mooresville
Out of a total of 12,455 students who are enrolled in schools in Mooresville, 1,818 (14.6%) attend a private institution, while the remaining 10,637 (85.4%) are enrolled in public schools. The age group of 3 to 4 year olds has the highest likelihood of being enrolled in private schools, with 308 (63.6% in the age bracket) enrolled. Conversely, the age group of 5 to 9 year old has the lowest likelihood of being enrolled in a private school, with 2,706 (92.3% in the age bracket) attending a public institution.
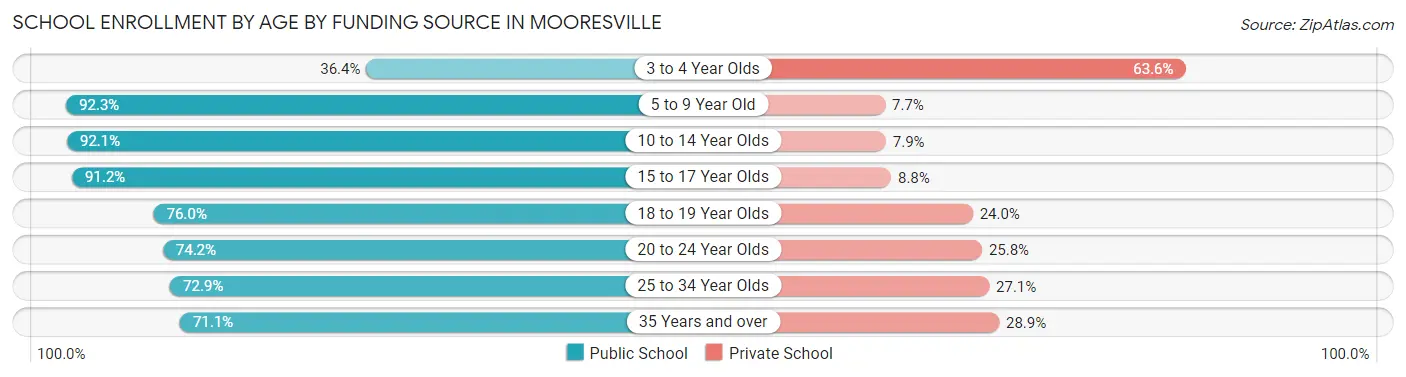
| Age Bracket | Public School | Private School |
| 3 to 4 Year Olds | 176 (36.4%) | 308 (63.6%) |
| 5 to 9 Year Old | 2,706 (92.3%) | 226 (7.7%) |
| 10 to 14 Year Olds | 3,598 (92.1%) | 307 (7.9%) |
| 15 to 17 Year Olds | 1,903 (91.2%) | 184 (8.8%) |
| 18 to 19 Year Olds | 683 (76.0%) | 216 (24.0%) |
| 20 to 24 Year Olds | 879 (74.2%) | 305 (25.8%) |
| 25 to 34 Year Olds | 393 (72.9%) | 146 (27.1%) |
| 35 Years and over | 302 (71.1%) | 123 (28.9%) |
| Total | 10,637 (85.4%) | 1,818 (14.6%) |
Educational Attainment by Field of Study in Mooresville
Business (4,061 | 25.0%), science & technology (1,694 | 10.4%), engineering (1,608 | 9.9%), education (1,513 | 9.3%), and arts & humanities (1,172 | 7.2%) are the most common fields of study among 16,218 individuals in Mooresville who have obtained a bachelor's degree or higher.
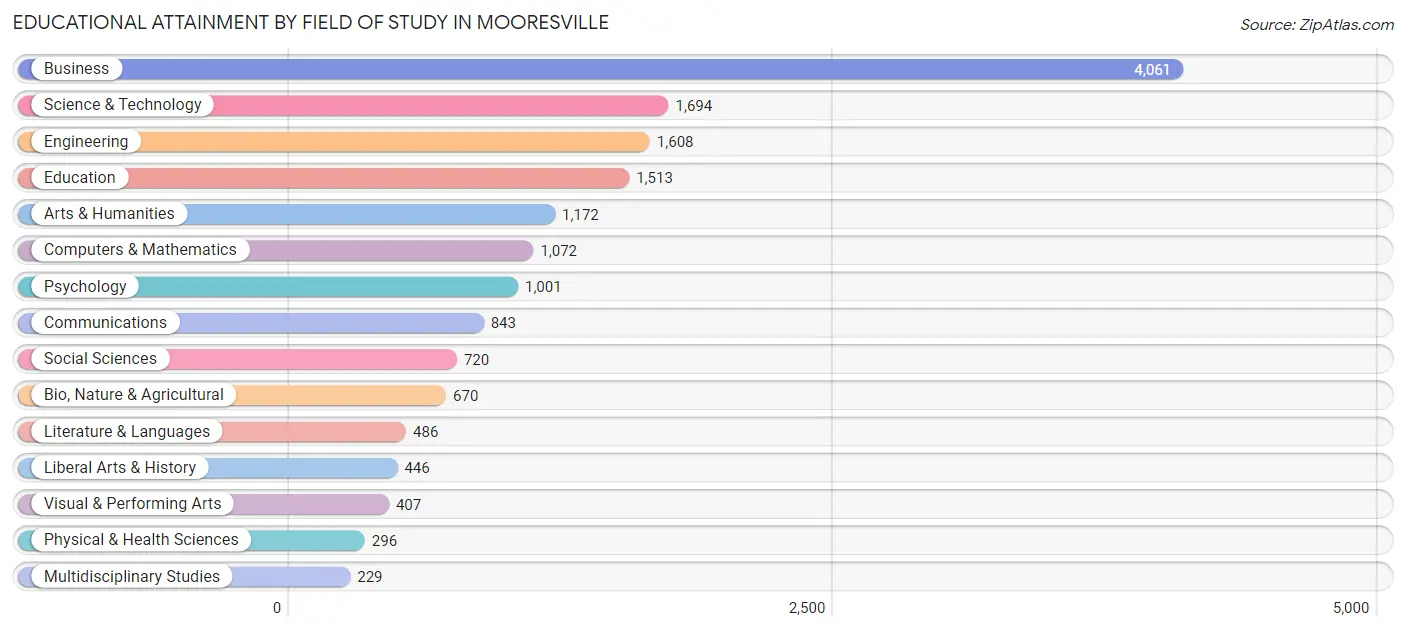
| Field of Study | # Graduates | % Graduates |
| Computers & Mathematics | 1,072 | 6.6% |
| Bio, Nature & Agricultural | 670 | 4.1% |
| Physical & Health Sciences | 296 | 1.8% |
| Psychology | 1,001 | 6.2% |
| Social Sciences | 720 | 4.4% |
| Engineering | 1,608 | 9.9% |
| Multidisciplinary Studies | 229 | 1.4% |
| Science & Technology | 1,694 | 10.4% |
| Business | 4,061 | 25.0% |
| Education | 1,513 | 9.3% |
| Literature & Languages | 486 | 3.0% |
| Liberal Arts & History | 446 | 2.8% |
| Visual & Performing Arts | 407 | 2.5% |
| Communications | 843 | 5.2% |
| Arts & Humanities | 1,172 | 7.2% |
| Total | 16,218 | 100.0% |
Transportation & Commute in Mooresville
Vehicle Availability by Sex in Mooresville
The most prevalent vehicle ownership categories in Mooresville are males with 2 vehicles (6,757, accounting for 47.6%) and females with 2 vehicles (5,144, making up 60.4%).
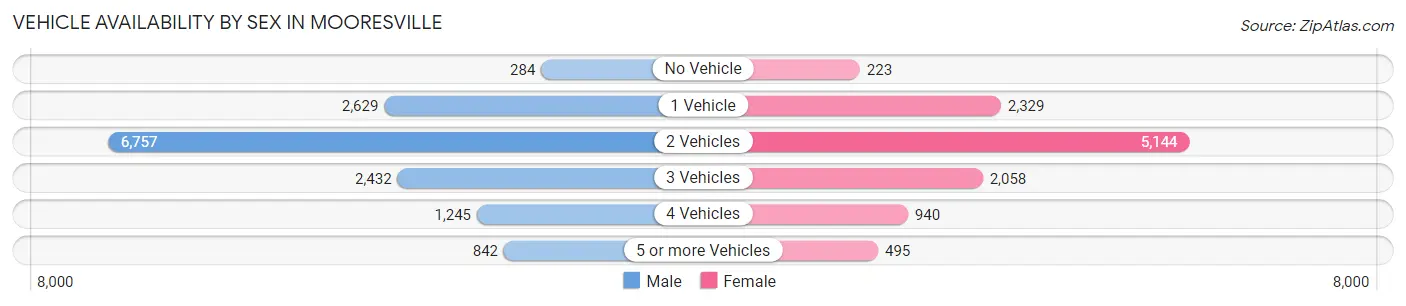
| Vehicles Available | Male | Female |
| No Vehicle | 284 (2.0%) | 223 (2.0%) |
| 1 Vehicle | 2,629 (18.5%) | 2,329 (20.8%) |
| 2 Vehicles | 6,757 (47.6%) | 5,144 (46.0%) |
| 3 Vehicles | 2,432 (17.1%) | 2,058 (18.4%) |
| 4 Vehicles | 1,245 (8.8%) | 940 (8.4%) |
| 5 or more Vehicles | 842 (5.9%) | 495 (4.4%) |
| Total | 14,189 (100.0%) | 11,189 (100.0%) |
Commute Time in Mooresville
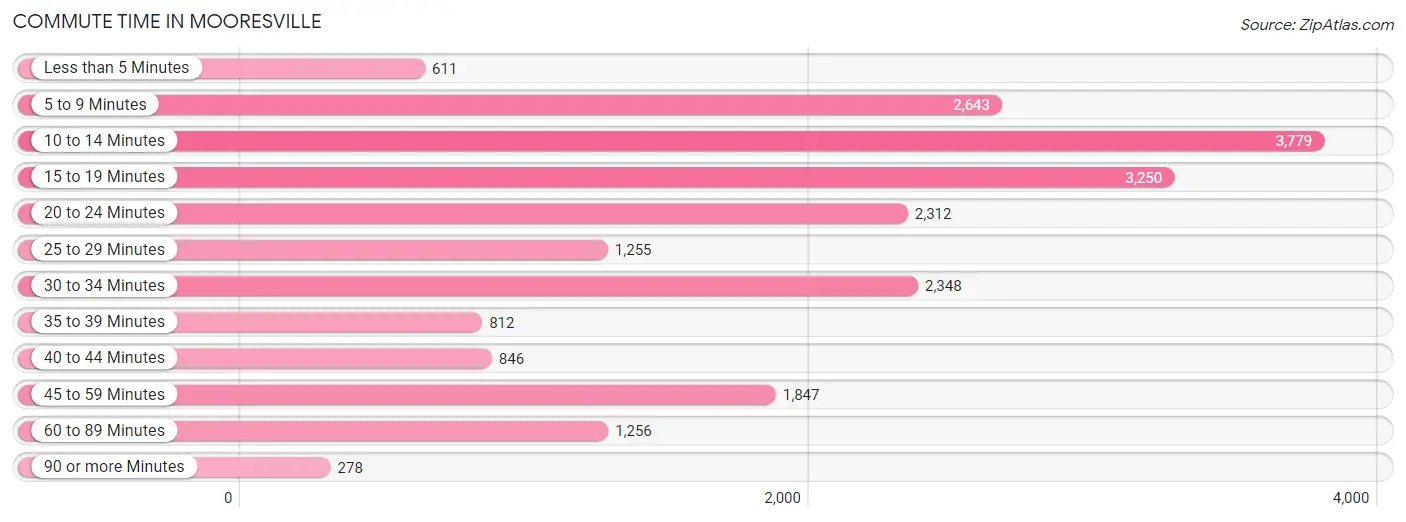
The most frequently occuring commute durations in Mooresville are 10 to 14 minutes (3,779 commuters, 17.8%), 15 to 19 minutes (3,250 commuters, 15.3%), and 5 to 9 minutes (2,643 commuters, 12.4%).
| Commute Time | # Commuters | % Commuters |
| Less than 5 Minutes | 611 | 2.9% |
| 5 to 9 Minutes | 2,643 | 12.4% |
| 10 to 14 Minutes | 3,779 | 17.8% |
| 15 to 19 Minutes | 3,250 | 15.3% |
| 20 to 24 Minutes | 2,312 | 10.9% |
| 25 to 29 Minutes | 1,255 | 5.9% |
| 30 to 34 Minutes | 2,348 | 11.1% |
| 35 to 39 Minutes | 812 | 3.8% |
| 40 to 44 Minutes | 846 | 4.0% |
| 45 to 59 Minutes | 1,847 | 8.7% |
| 60 to 89 Minutes | 1,256 | 5.9% |
| 90 or more Minutes | 278 | 1.3% |
Commute Time by Sex in Mooresville
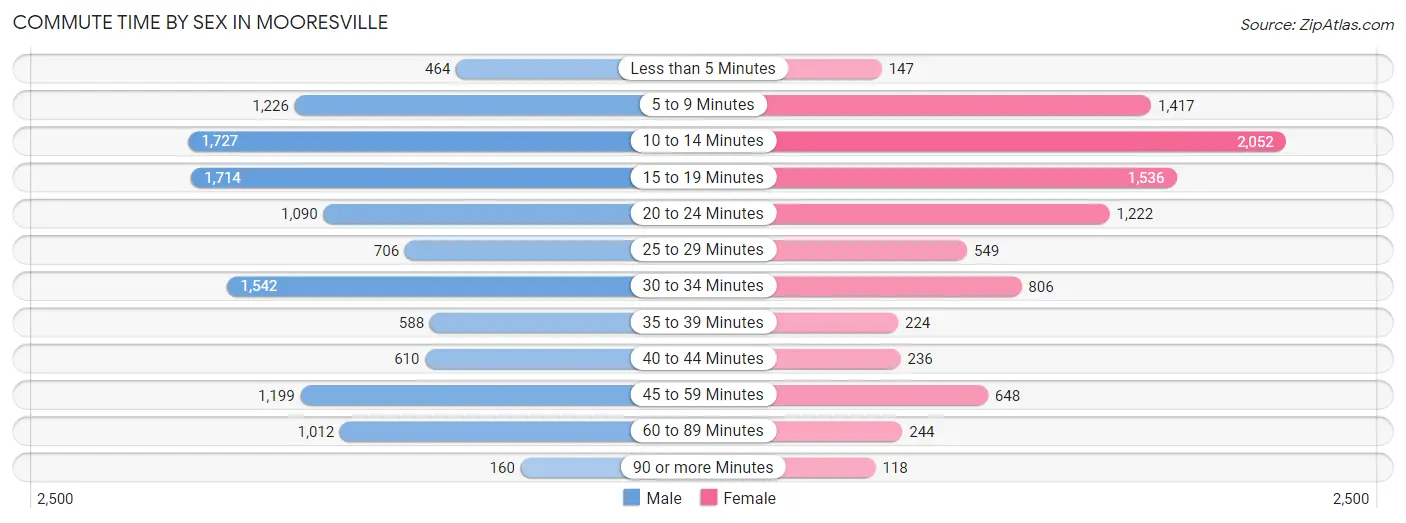
The most common commute times in Mooresville are 10 to 14 minutes (1,727 commuters, 14.3%) for males and 10 to 14 minutes (2,052 commuters, 22.3%) for females.
| Commute Time | Male | Female |
| Less than 5 Minutes | 464 (3.8%) | 147 (1.6%) |
| 5 to 9 Minutes | 1,226 (10.2%) | 1,417 (15.4%) |
| 10 to 14 Minutes | 1,727 (14.3%) | 2,052 (22.3%) |
| 15 to 19 Minutes | 1,714 (14.2%) | 1,536 (16.7%) |
| 20 to 24 Minutes | 1,090 (9.0%) | 1,222 (13.3%) |
| 25 to 29 Minutes | 706 (5.9%) | 549 (6.0%) |
| 30 to 34 Minutes | 1,542 (12.8%) | 806 (8.8%) |
| 35 to 39 Minutes | 588 (4.9%) | 224 (2.4%) |
| 40 to 44 Minutes | 610 (5.1%) | 236 (2.6%) |
| 45 to 59 Minutes | 1,199 (10.0%) | 648 (7.0%) |
| 60 to 89 Minutes | 1,012 (8.4%) | 244 (2.6%) |
| 90 or more Minutes | 160 (1.3%) | 118 (1.3%) |
Time of Departure to Work by Sex in Mooresville
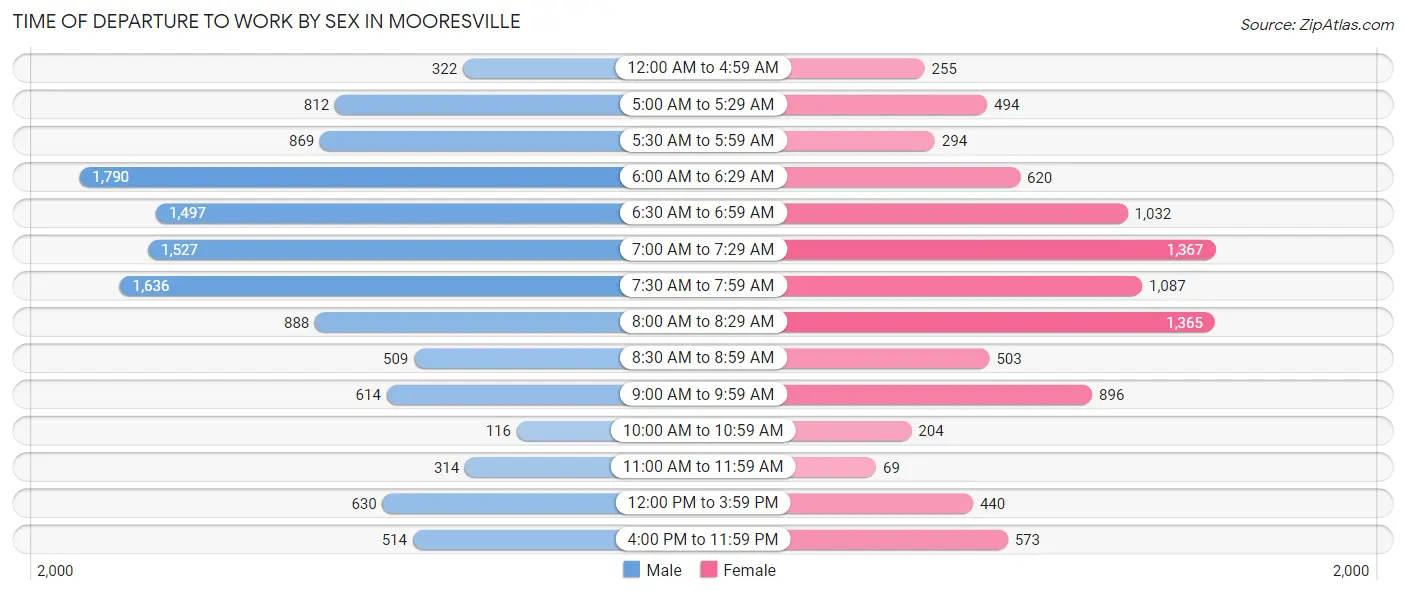
The most frequent times of departure to work in Mooresville are 6:00 AM to 6:29 AM (1,790, 14.9%) for males and 7:00 AM to 7:29 AM (1,367, 14.9%) for females.
| Time of Departure | Male | Female |
| 12:00 AM to 4:59 AM | 322 (2.7%) | 255 (2.8%) |
| 5:00 AM to 5:29 AM | 812 (6.8%) | 494 (5.4%) |
| 5:30 AM to 5:59 AM | 869 (7.2%) | 294 (3.2%) |
| 6:00 AM to 6:29 AM | 1,790 (14.9%) | 620 (6.7%) |
| 6:30 AM to 6:59 AM | 1,497 (12.4%) | 1,032 (11.2%) |
| 7:00 AM to 7:29 AM | 1,527 (12.7%) | 1,367 (14.9%) |
| 7:30 AM to 7:59 AM | 1,636 (13.6%) | 1,087 (11.8%) |
| 8:00 AM to 8:29 AM | 888 (7.4%) | 1,365 (14.8%) |
| 8:30 AM to 8:59 AM | 509 (4.2%) | 503 (5.5%) |
| 9:00 AM to 9:59 AM | 614 (5.1%) | 896 (9.7%) |
| 10:00 AM to 10:59 AM | 116 (1.0%) | 204 (2.2%) |
| 11:00 AM to 11:59 AM | 314 (2.6%) | 69 (0.7%) |
| 12:00 PM to 3:59 PM | 630 (5.2%) | 440 (4.8%) |
| 4:00 PM to 11:59 PM | 514 (4.3%) | 573 (6.2%) |
| Total | 12,038 (100.0%) | 9,199 (100.0%) |
Housing Occupancy in Mooresville
Occupancy by Ownership in Mooresville
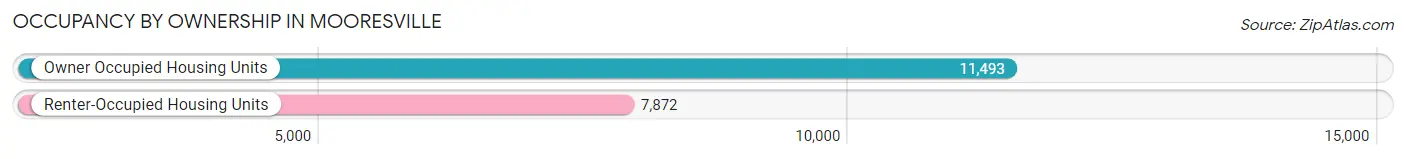
Of the total 19,365 dwellings in Mooresville, owner-occupied units account for 11,493 (59.4%), while renter-occupied units make up 7,872 (40.6%).
| Occupancy | # Housing Units | % Housing Units |
| Owner Occupied Housing Units | 11,493 | 59.4% |
| Renter-Occupied Housing Units | 7,872 | 40.6% |
| Total Occupied Housing Units | 19,365 | 100.0% |
Occupancy by Household Size in Mooresville
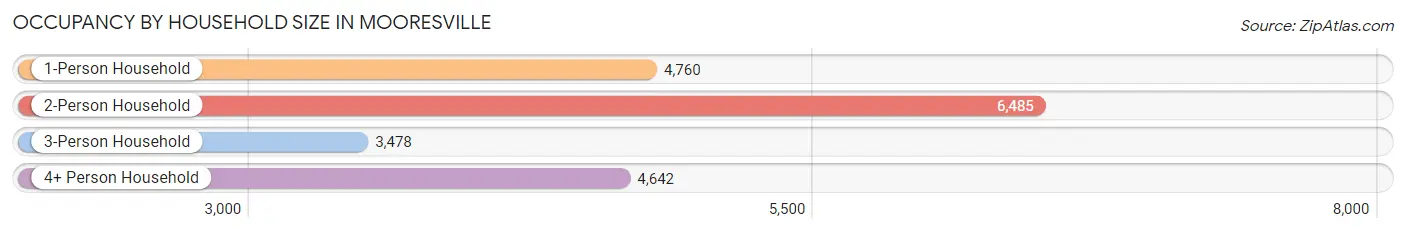
| Household Size | # Housing Units | % Housing Units |
| 1-Person Household | 4,760 | 24.6% |
| 2-Person Household | 6,485 | 33.5% |
| 3-Person Household | 3,478 | 18.0% |
| 4+ Person Household | 4,642 | 24.0% |
| Total Housing Units | 19,365 | 100.0% |
Occupancy by Ownership by Household Size in Mooresville
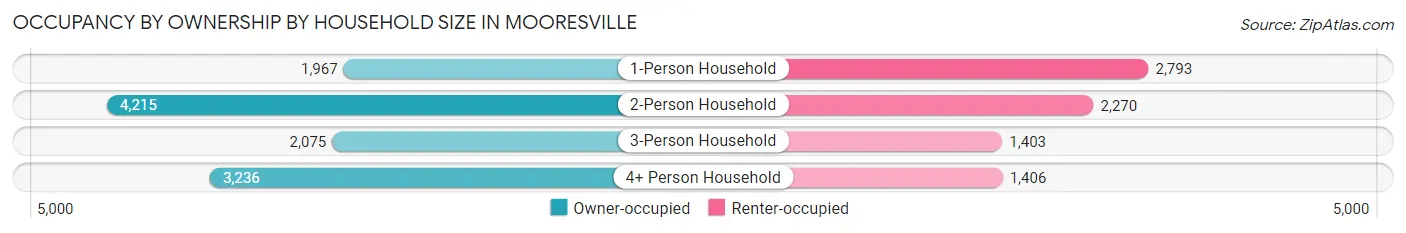
| Household Size | Owner-occupied | Renter-occupied |
| 1-Person Household | 1,967 (41.3%) | 2,793 (58.7%) |
| 2-Person Household | 4,215 (65.0%) | 2,270 (35.0%) |
| 3-Person Household | 2,075 (59.7%) | 1,403 (40.3%) |
| 4+ Person Household | 3,236 (69.7%) | 1,406 (30.3%) |
| Total Housing Units | 11,493 (59.4%) | 7,872 (40.6%) |
Occupancy by Educational Attainment in Mooresville
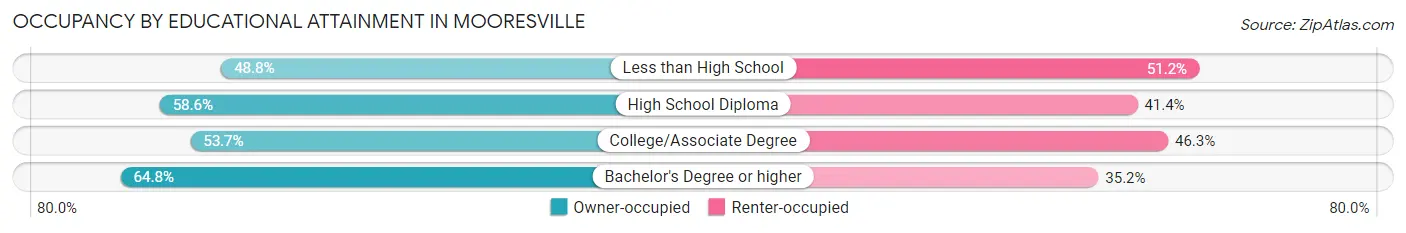
| Household Size | Owner-occupied | Renter-occupied |
| Less than High School | 472 (48.8%) | 495 (51.2%) |
| High School Diploma | 1,836 (58.6%) | 1,299 (41.4%) |
| College/Associate Degree | 3,401 (53.7%) | 2,931 (46.3%) |
| Bachelor's Degree or higher | 5,784 (64.8%) | 3,147 (35.2%) |
Occupancy by Age of Householder in Mooresville
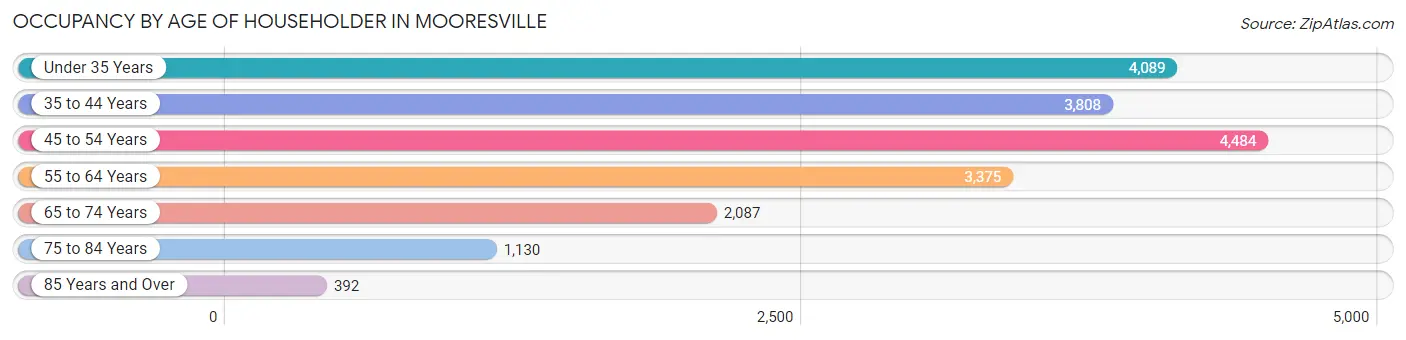
| Age Bracket | # Households | % Households |
| Under 35 Years | 4,089 | 21.1% |
| 35 to 44 Years | 3,808 | 19.7% |
| 45 to 54 Years | 4,484 | 23.2% |
| 55 to 64 Years | 3,375 | 17.4% |
| 65 to 74 Years | 2,087 | 10.8% |
| 75 to 84 Years | 1,130 | 5.8% |
| 85 Years and Over | 392 | 2.0% |
| Total | 19,365 | 100.0% |
Housing Finances in Mooresville
Median Income by Occupancy in Mooresville
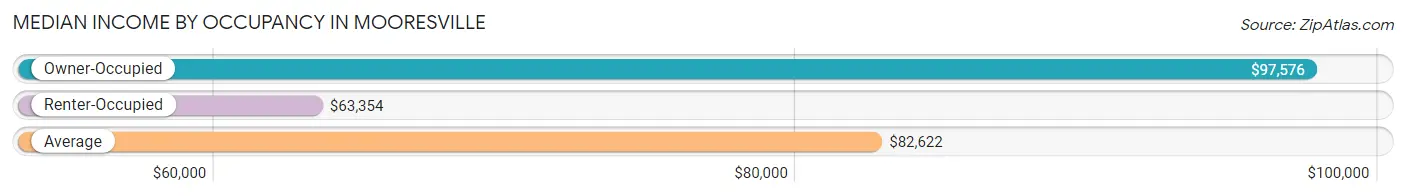
| Occupancy Type | # Households | Median Income |
| Owner-Occupied | 11,493 (59.4%) | $97,576 |
| Renter-Occupied | 7,872 (40.6%) | $63,354 |
| Average | 19,365 (100.0%) | $82,622 |
Occupancy by Householder Income Bracket in Mooresville
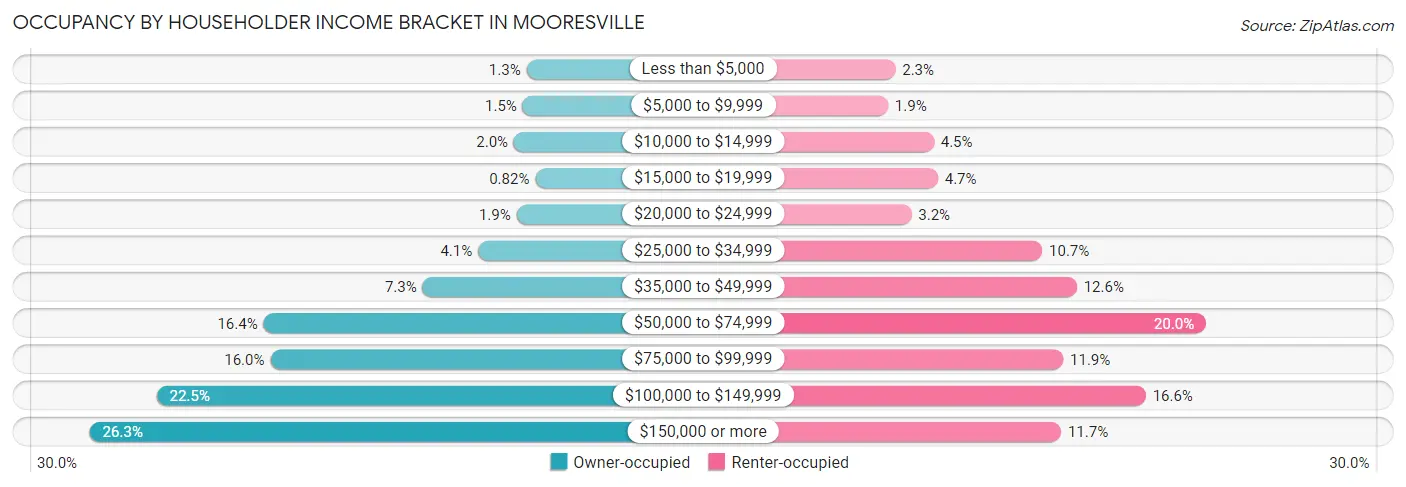
| Income Bracket | Owner-occupied | Renter-occupied |
| Less than $5,000 | 152 (1.3%) | 179 (2.3%) |
| $5,000 to $9,999 | 177 (1.5%) | 146 (1.8%) |
| $10,000 to $14,999 | 234 (2.0%) | 352 (4.5%) |
| $15,000 to $19,999 | 94 (0.8%) | 370 (4.7%) |
| $20,000 to $24,999 | 217 (1.9%) | 251 (3.2%) |
| $25,000 to $34,999 | 470 (4.1%) | 839 (10.7%) |
| $35,000 to $49,999 | 834 (7.3%) | 995 (12.6%) |
| $50,000 to $74,999 | 1,879 (16.4%) | 1,577 (20.0%) |
| $75,000 to $99,999 | 1,834 (16.0%) | 934 (11.9%) |
| $100,000 to $149,999 | 2,581 (22.5%) | 1,305 (16.6%) |
| $150,000 or more | 3,021 (26.3%) | 924 (11.7%) |
| Total | 11,493 (100.0%) | 7,872 (100.0%) |
Monthly Housing Cost Tiers in Mooresville
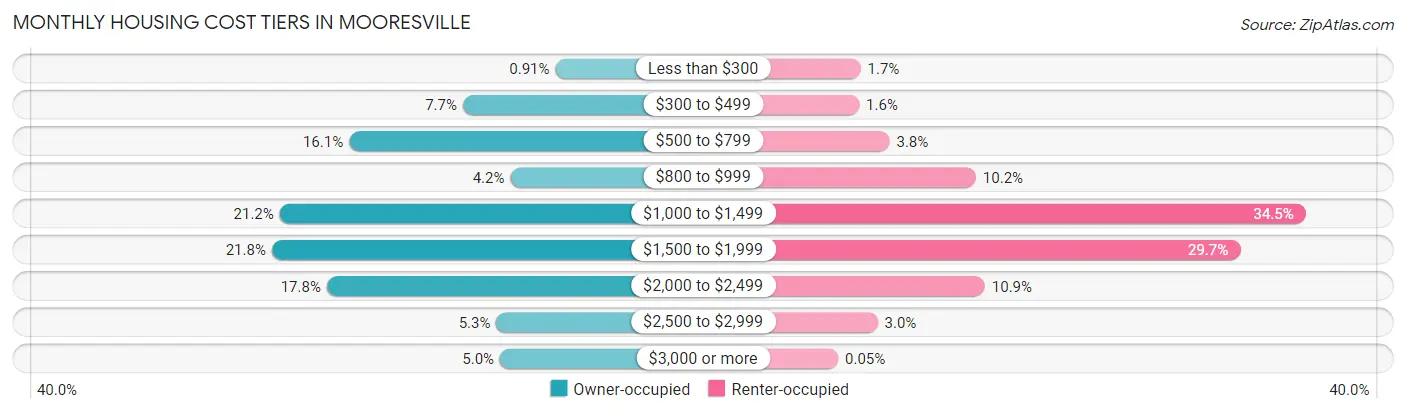
| Monthly Cost | Owner-occupied | Renter-occupied |
| Less than $300 | 105 (0.9%) | 135 (1.7%) |
| $300 to $499 | 888 (7.7%) | 126 (1.6%) |
| $500 to $799 | 1,851 (16.1%) | 302 (3.8%) |
| $800 to $999 | 486 (4.2%) | 803 (10.2%) |
| $1,000 to $1,499 | 2,439 (21.2%) | 2,714 (34.5%) |
| $1,500 to $1,999 | 2,506 (21.8%) | 2,334 (29.6%) |
| $2,000 to $2,499 | 2,040 (17.7%) | 855 (10.9%) |
| $2,500 to $2,999 | 604 (5.3%) | 233 (3.0%) |
| $3,000 or more | 574 (5.0%) | 4 (0.1%) |
| Total | 11,493 (100.0%) | 7,872 (100.0%) |
Physical Housing Characteristics in Mooresville
Housing Structures in Mooresville
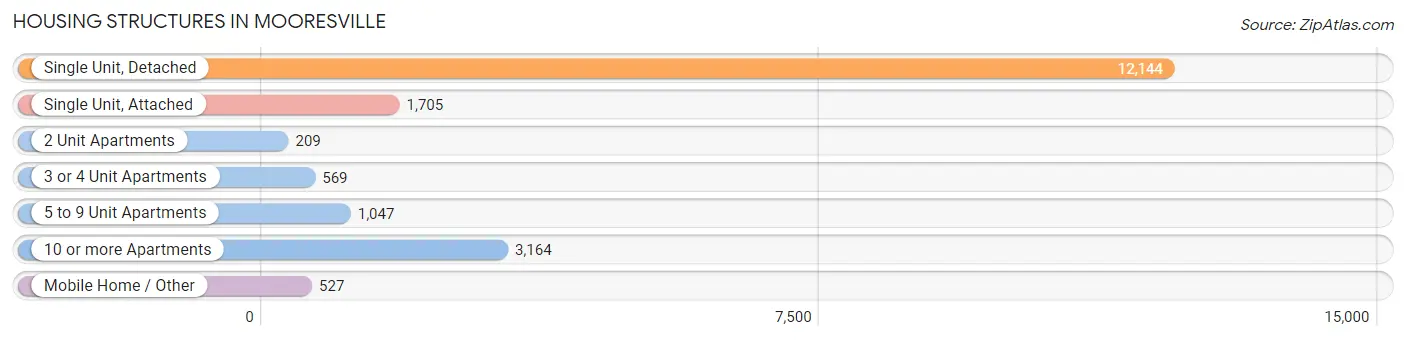
| Structure Type | # Housing Units | % Housing Units |
| Single Unit, Detached | 12,144 | 62.7% |
| Single Unit, Attached | 1,705 | 8.8% |
| 2 Unit Apartments | 209 | 1.1% |
| 3 or 4 Unit Apartments | 569 | 2.9% |
| 5 to 9 Unit Apartments | 1,047 | 5.4% |
| 10 or more Apartments | 3,164 | 16.3% |
| Mobile Home / Other | 527 | 2.7% |
| Total | 19,365 | 100.0% |
Housing Structures by Occupancy in Mooresville
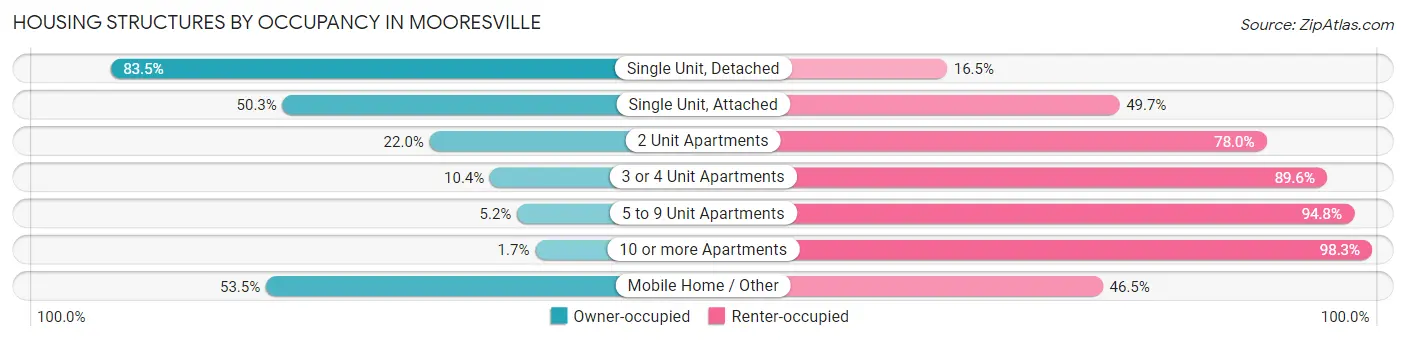
| Structure Type | Owner-occupied | Renter-occupied |
| Single Unit, Detached | 10,141 (83.5%) | 2,003 (16.5%) |
| Single Unit, Attached | 858 (50.3%) | 847 (49.7%) |
| 2 Unit Apartments | 46 (22.0%) | 163 (78.0%) |
| 3 or 4 Unit Apartments | 59 (10.4%) | 510 (89.6%) |
| 5 to 9 Unit Apartments | 54 (5.2%) | 993 (94.8%) |
| 10 or more Apartments | 53 (1.7%) | 3,111 (98.3%) |
| Mobile Home / Other | 282 (53.5%) | 245 (46.5%) |
| Total | 11,493 (59.4%) | 7,872 (40.6%) |
Housing Structures by Number of Rooms in Mooresville
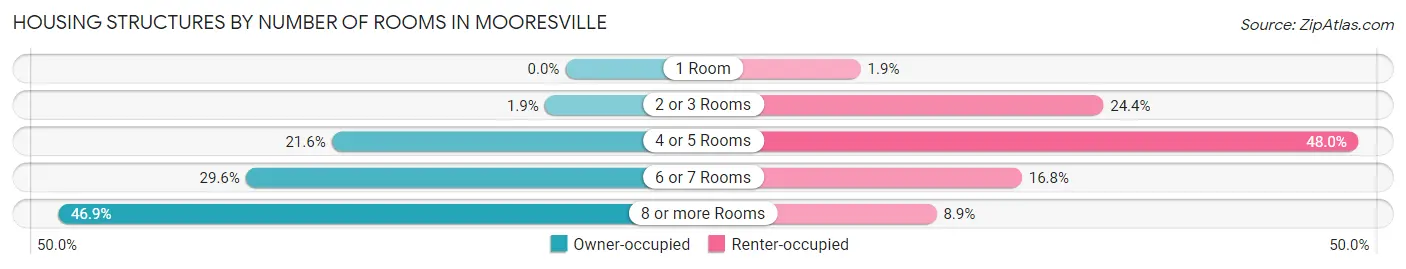
| Number of Rooms | Owner-occupied | Renter-occupied |
| 1 Room | 0 (0.0%) | 151 (1.9%) |
| 2 or 3 Rooms | 220 (1.9%) | 1,918 (24.4%) |
| 4 or 5 Rooms | 2,485 (21.6%) | 3,776 (48.0%) |
| 6 or 7 Rooms | 3,397 (29.6%) | 1,324 (16.8%) |
| 8 or more Rooms | 5,391 (46.9%) | 703 (8.9%) |
| Total | 11,493 (100.0%) | 7,872 (100.0%) |
Housing Structure by Heating Type in Mooresville
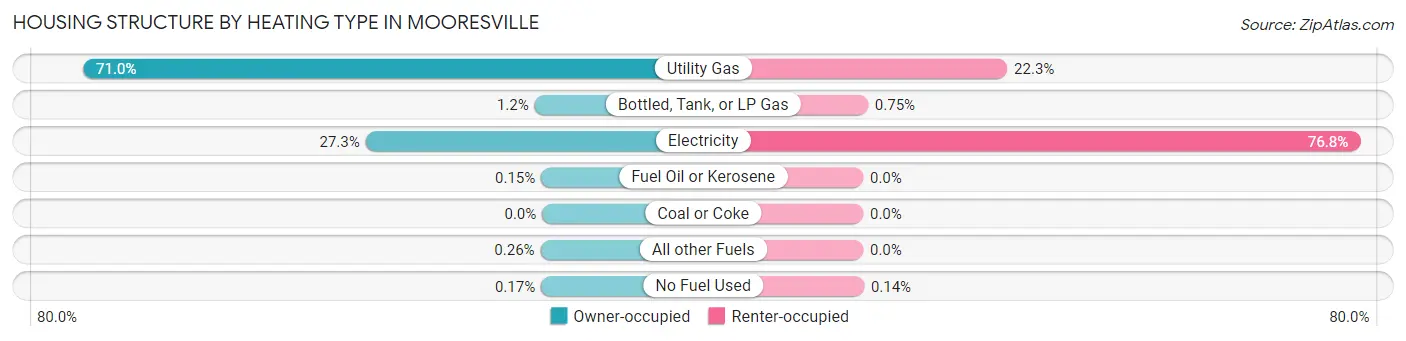
| Heating Type | Owner-occupied | Renter-occupied |
| Utility Gas | 8,154 (71.0%) | 1,754 (22.3%) |
| Bottled, Tank, or LP Gas | 135 (1.2%) | 59 (0.7%) |
| Electricity | 3,138 (27.3%) | 6,048 (76.8%) |
| Fuel Oil or Kerosene | 17 (0.2%) | 0 (0.0%) |
| Coal or Coke | 0 (0.0%) | 0 (0.0%) |
| All other Fuels | 30 (0.3%) | 0 (0.0%) |
| No Fuel Used | 19 (0.2%) | 11 (0.1%) |
| Total | 11,493 (100.0%) | 7,872 (100.0%) |
Household Vehicle Usage in Mooresville
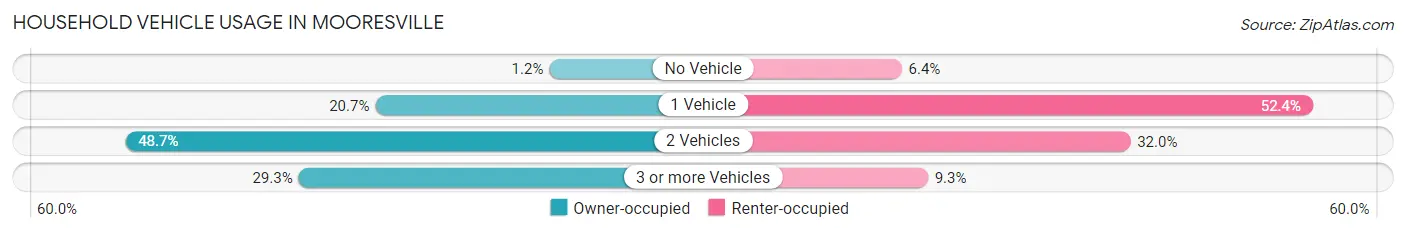
| Vehicles per Household | Owner-occupied | Renter-occupied |
| No Vehicle | 141 (1.2%) | 500 (6.4%) |
| 1 Vehicle | 2,381 (20.7%) | 4,126 (52.4%) |
| 2 Vehicles | 5,601 (48.7%) | 2,516 (32.0%) |
| 3 or more Vehicles | 3,370 (29.3%) | 730 (9.3%) |
| Total | 11,493 (100.0%) | 7,872 (100.0%) |
Real Estate & Mortgages in Mooresville
Real Estate and Mortgage Overview in Mooresville
| Characteristic | Without Mortgage | With Mortgage |
| Housing Units | 2,701 | 8,792 |
| Median Property Value | $299,500 | $315,300 |
| Median Household Income | $64,046 | $2,729 |
| Monthly Housing Costs | $550 | $565 |
| Real Estate Taxes | $2,833 | $31 |
Property Value by Mortgage Status in Mooresville
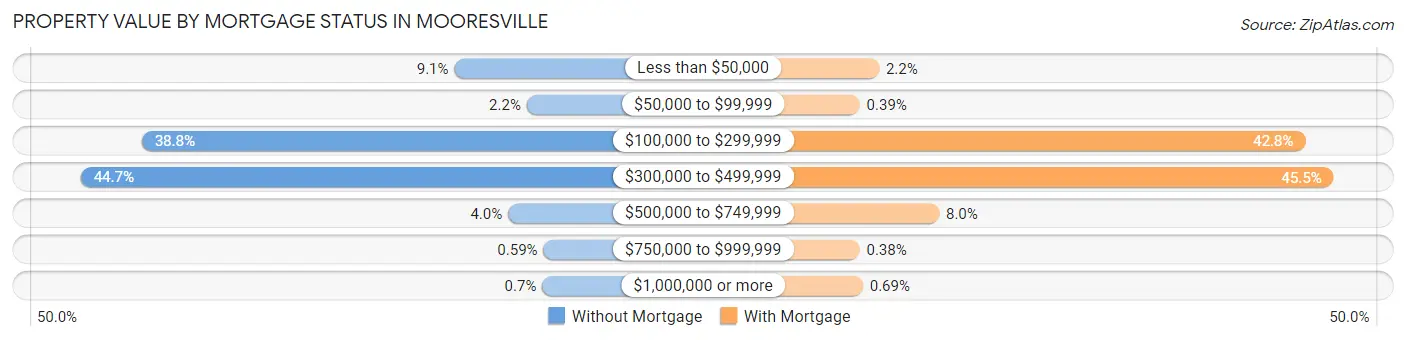
| Property Value | Without Mortgage | With Mortgage |
| Less than $50,000 | 245 (9.1%) | 196 (2.2%) |
| $50,000 to $99,999 | 59 (2.2%) | 34 (0.4%) |
| $100,000 to $299,999 | 1,049 (38.8%) | 3,766 (42.8%) |
| $300,000 to $499,999 | 1,206 (44.7%) | 4,003 (45.5%) |
| $500,000 to $749,999 | 107 (4.0%) | 699 (8.0%) |
| $750,000 to $999,999 | 16 (0.6%) | 33 (0.4%) |
| $1,000,000 or more | 19 (0.7%) | 61 (0.7%) |
| Total | 2,701 (100.0%) | 8,792 (100.0%) |
Household Income by Mortgage Status in Mooresville
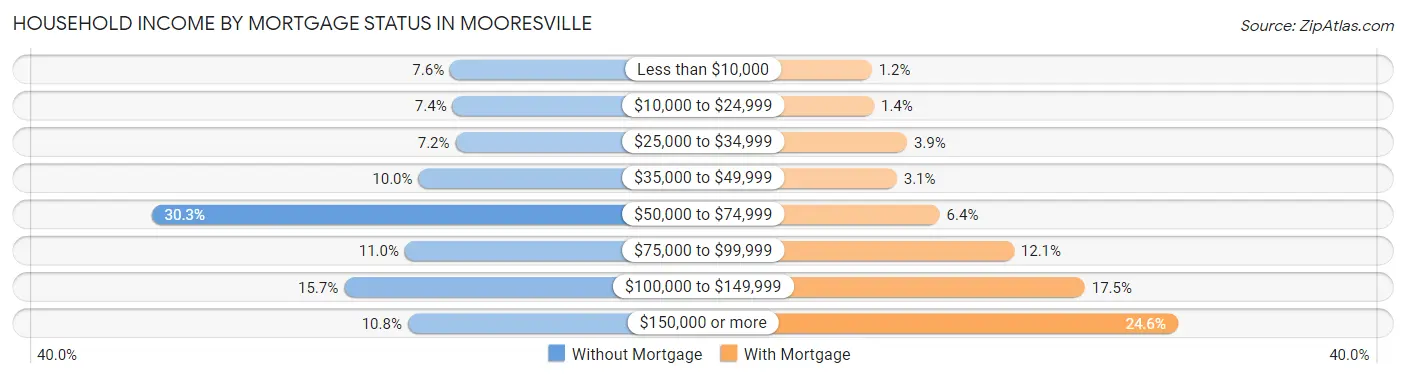
| Household Income | Without Mortgage | With Mortgage |
| Less than $10,000 | 205 (7.6%) | 108 (1.2%) |
| $10,000 to $24,999 | 200 (7.4%) | 124 (1.4%) |
| $25,000 to $34,999 | 194 (7.2%) | 345 (3.9%) |
| $35,000 to $49,999 | 270 (10.0%) | 276 (3.1%) |
| $50,000 to $74,999 | 819 (30.3%) | 564 (6.4%) |
| $75,000 to $99,999 | 298 (11.0%) | 1,060 (12.1%) |
| $100,000 to $149,999 | 423 (15.7%) | 1,536 (17.5%) |
| $150,000 or more | 292 (10.8%) | 2,158 (24.5%) |
| Total | 2,701 (100.0%) | 8,792 (100.0%) |
Property Value to Household Income Ratio in Mooresville
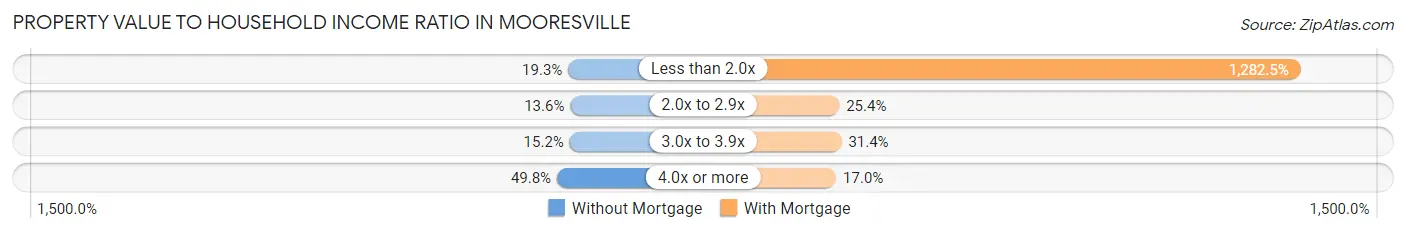
| Value-to-Income Ratio | Without Mortgage | With Mortgage |
| Less than 2.0x | 521 (19.3%) | 112,759 (1,282.5%) |
| 2.0x to 2.9x | 367 (13.6%) | 2,231 (25.4%) |
| 3.0x to 3.9x | 410 (15.2%) | 2,757 (31.4%) |
| 4.0x or more | 1,344 (49.8%) | 1,490 (17.0%) |
| Total | 2,701 (100.0%) | 8,792 (100.0%) |
Real Estate Taxes by Mortgage Status in Mooresville
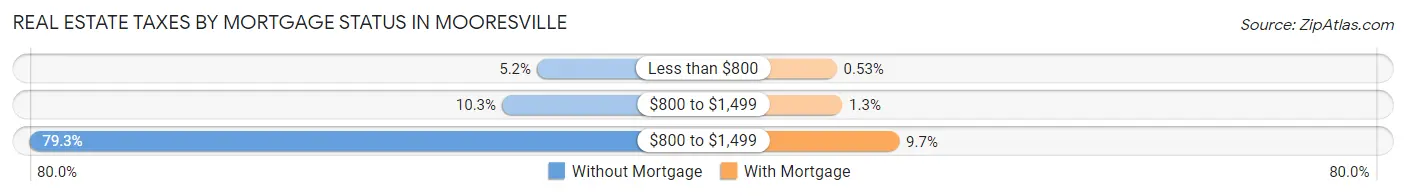
| Property Taxes | Without Mortgage | With Mortgage |
| Less than $800 | 139 (5.1%) | 47 (0.5%) |
| $800 to $1,499 | 277 (10.3%) | 117 (1.3%) |
| $800 to $1,499 | 2,142 (79.3%) | 849 (9.7%) |
| Total | 2,701 (100.0%) | 8,792 (100.0%) |
Health & Disability in Mooresville
Health Insurance Coverage by Age in Mooresville
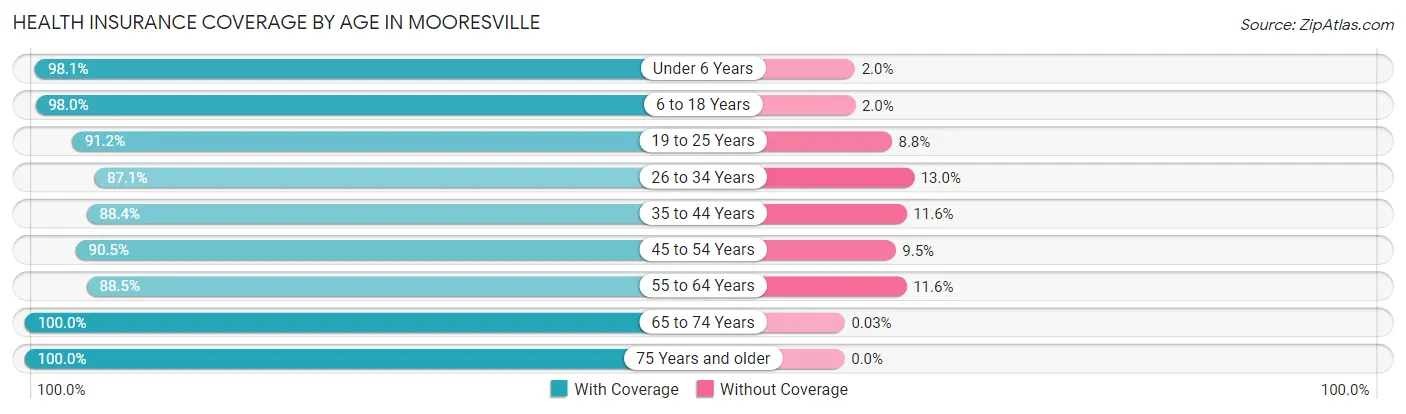
| Age Bracket | With Coverage | Without Coverage |
| Under 6 Years | 3,273 (98.1%) | 65 (1.9%) |
| 6 to 18 Years | 9,260 (98.0%) | 188 (2.0%) |
| 19 to 25 Years | 4,234 (91.2%) | 409 (8.8%) |
| 26 to 34 Years | 5,595 (87.1%) | 832 (13.0%) |
| 35 to 44 Years | 6,304 (88.4%) | 826 (11.6%) |
| 45 to 54 Years | 6,644 (90.5%) | 699 (9.5%) |
| 55 to 64 Years | 4,846 (88.4%) | 633 (11.6%) |
| 65 to 74 Years | 3,624 (100.0%) | 1 (0.0%) |
| 75 Years and older | 2,328 (100.0%) | 0 (0.0%) |
| Total | 46,108 (92.7%) | 3,653 (7.3%) |
Health Insurance Coverage by Citizenship Status in Mooresville
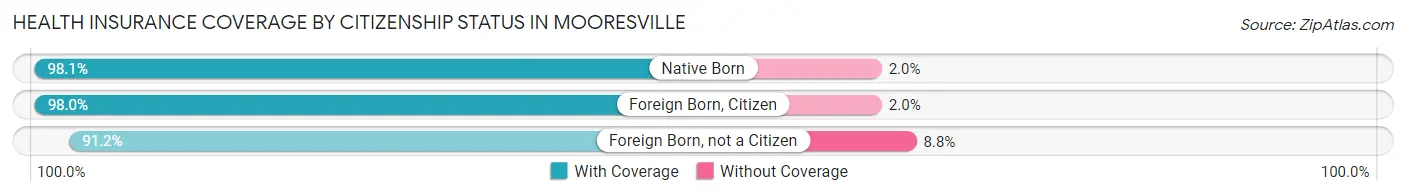
| Citizenship Status | With Coverage | Without Coverage |
| Native Born | 3,273 (98.1%) | 65 (1.9%) |
| Foreign Born, Citizen | 9,260 (98.0%) | 188 (2.0%) |
| Foreign Born, not a Citizen | 4,234 (91.2%) | 409 (8.8%) |
Health Insurance Coverage by Household Income in Mooresville
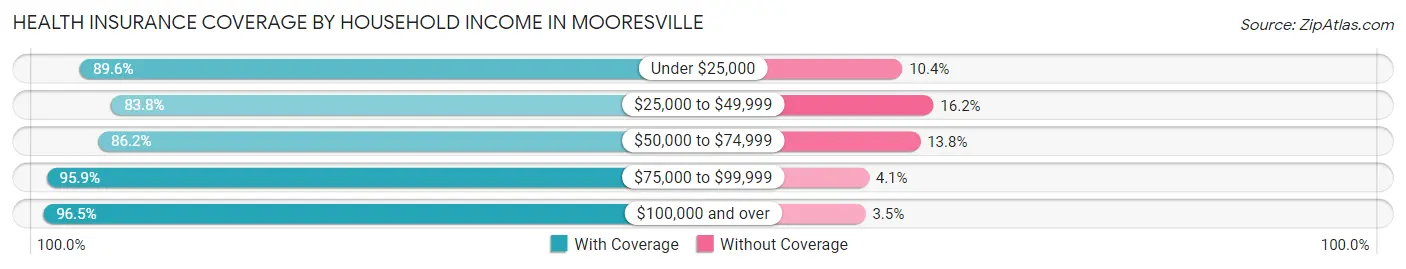
| Household Income | With Coverage | Without Coverage |
| Under $25,000 | 3,176 (89.6%) | 368 (10.4%) |
| $25,000 to $49,999 | 5,199 (83.8%) | 1,007 (16.2%) |
| $50,000 to $74,999 | 6,996 (86.2%) | 1,116 (13.8%) |
| $75,000 to $99,999 | 7,478 (95.9%) | 321 (4.1%) |
| $100,000 and over | 23,208 (96.5%) | 841 (3.5%) |
Public vs Private Health Insurance Coverage by Age in Mooresville
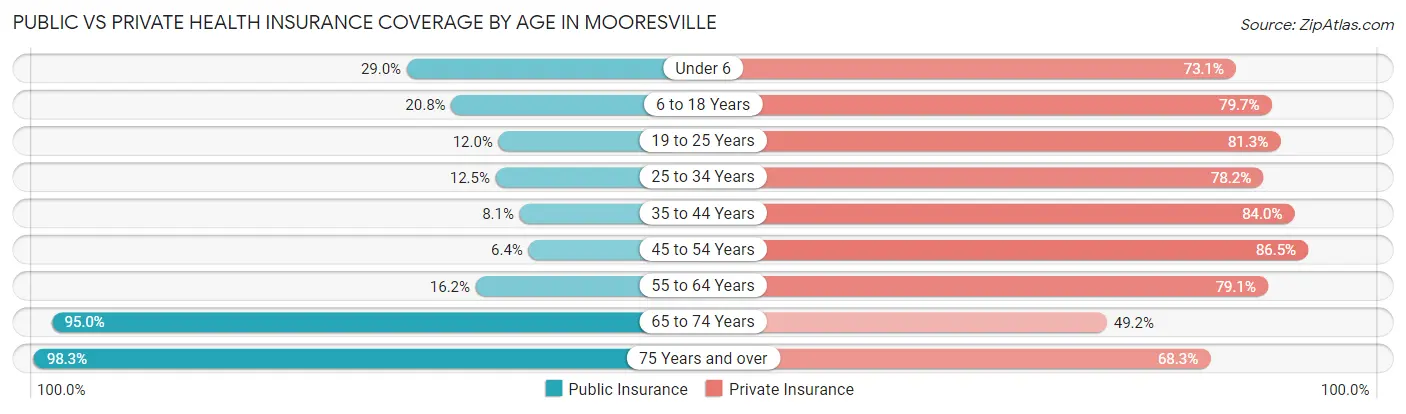
| Age Bracket | Public Insurance | Private Insurance |
| Under 6 | 969 (29.0%) | 2,441 (73.1%) |
| 6 to 18 Years | 1,963 (20.8%) | 7,532 (79.7%) |
| 19 to 25 Years | 557 (12.0%) | 3,776 (81.3%) |
| 25 to 34 Years | 806 (12.5%) | 5,025 (78.2%) |
| 35 to 44 Years | 576 (8.1%) | 5,987 (84.0%) |
| 45 to 54 Years | 473 (6.4%) | 6,353 (86.5%) |
| 55 to 64 Years | 890 (16.2%) | 4,331 (79.0%) |
| 65 to 74 Years | 3,444 (95.0%) | 1,783 (49.2%) |
| 75 Years and over | 2,288 (98.3%) | 1,591 (68.3%) |
| Total | 11,966 (24.0%) | 38,819 (78.0%) |
Disability Status by Sex by Age in Mooresville
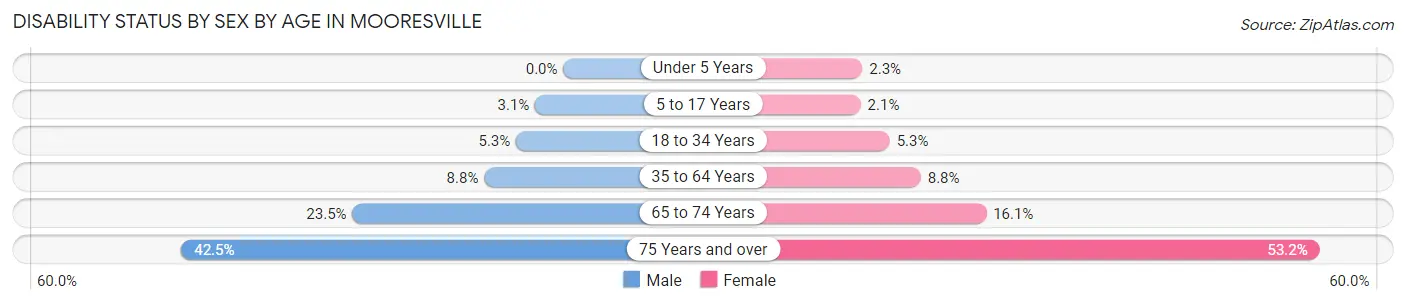
| Age Bracket | Male | Female |
| Under 5 Years | 0 (0.0%) | 34 (2.3%) |
| 5 to 17 Years | 148 (3.1%) | 99 (2.1%) |
| 18 to 34 Years | 323 (5.3%) | 292 (5.3%) |
| 35 to 64 Years | 852 (8.8%) | 905 (8.8%) |
| 65 to 74 Years | 374 (23.5%) | 327 (16.1%) |
| 75 Years and over | 385 (42.5%) | 757 (53.2%) |
Disability Class by Sex by Age in Mooresville
Disability Class: Hearing Difficulty
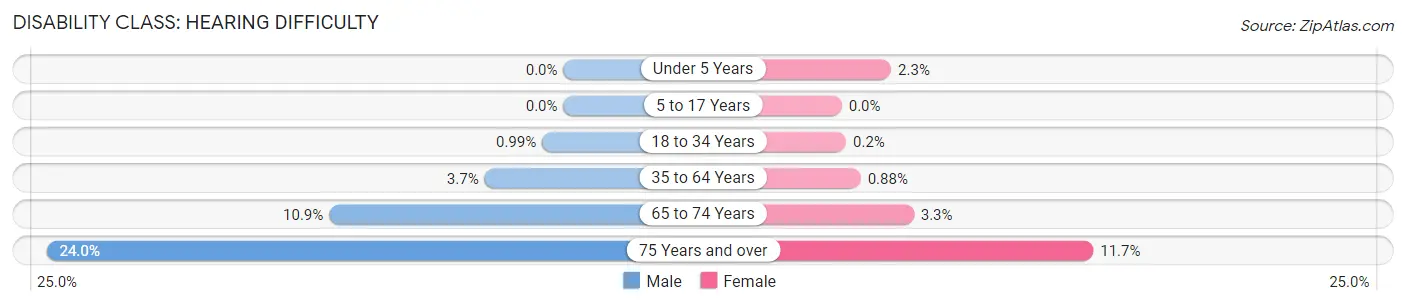
| Age Bracket | Male | Female |
| Under 5 Years | 0 (0.0%) | 34 (2.3%) |
| 5 to 17 Years | 0 (0.0%) | 0 (0.0%) |
| 18 to 34 Years | 61 (1.0%) | 11 (0.2%) |
| 35 to 64 Years | 354 (3.7%) | 90 (0.9%) |
| 65 to 74 Years | 173 (10.9%) | 68 (3.3%) |
| 75 Years and over | 217 (24.0%) | 166 (11.7%) |
Disability Class: Vision Difficulty
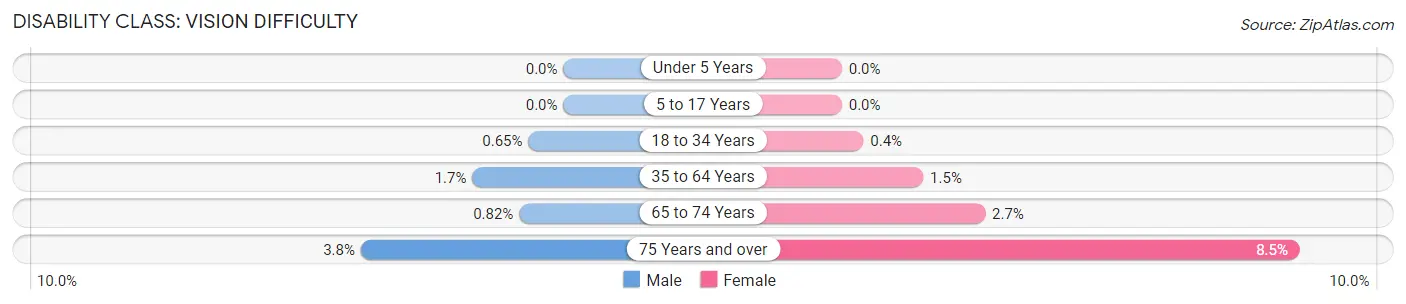
| Age Bracket | Male | Female |
| Under 5 Years | 0 (0.0%) | 0 (0.0%) |
| 5 to 17 Years | 0 (0.0%) | 0 (0.0%) |
| 18 to 34 Years | 40 (0.6%) | 22 (0.4%) |
| 35 to 64 Years | 163 (1.7%) | 155 (1.5%) |
| 65 to 74 Years | 13 (0.8%) | 54 (2.7%) |
| 75 Years and over | 34 (3.8%) | 121 (8.5%) |
Disability Class: Cognitive Difficulty
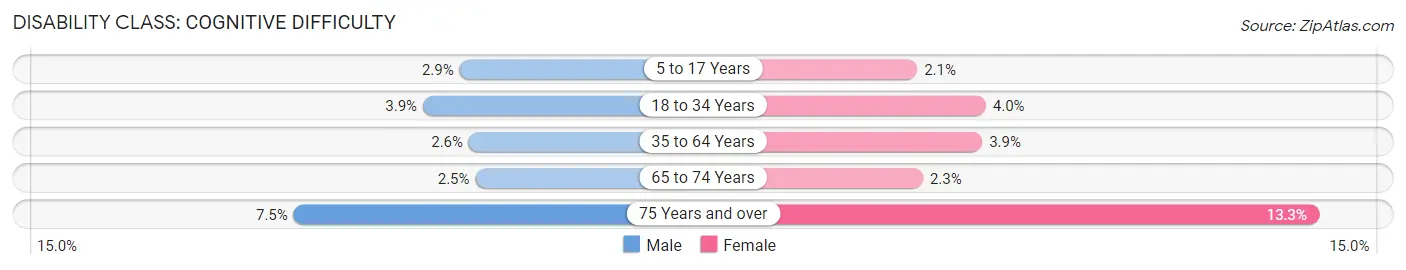
| Age Bracket | Male | Female |
| 5 to 17 Years | 136 (2.9%) | 99 (2.1%) |
| 18 to 34 Years | 240 (3.9%) | 219 (4.0%) |
| 35 to 64 Years | 254 (2.6%) | 402 (3.9%) |
| 65 to 74 Years | 39 (2.5%) | 46 (2.3%) |
| 75 Years and over | 68 (7.5%) | 189 (13.3%) |
Disability Class: Ambulatory Difficulty
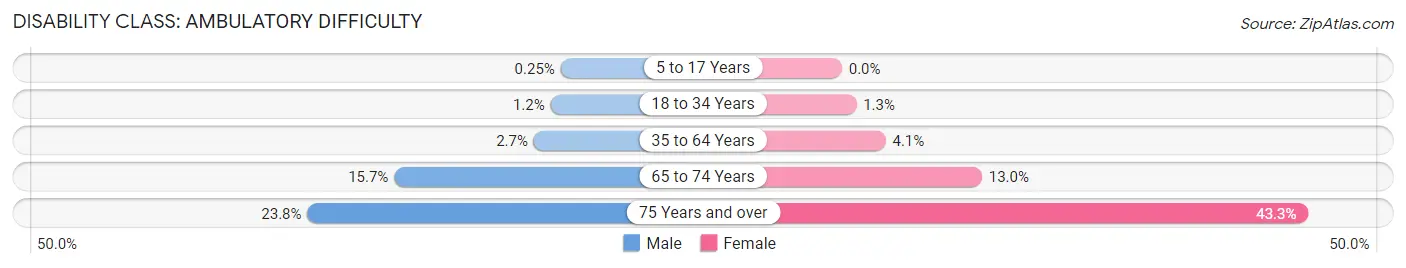
| Age Bracket | Male | Female |
| 5 to 17 Years | 12 (0.3%) | 0 (0.0%) |
| 18 to 34 Years | 73 (1.2%) | 73 (1.3%) |
| 35 to 64 Years | 265 (2.7%) | 418 (4.1%) |
| 65 to 74 Years | 250 (15.7%) | 264 (13.0%) |
| 75 Years and over | 215 (23.8%) | 616 (43.3%) |
Disability Class: Self-Care Difficulty
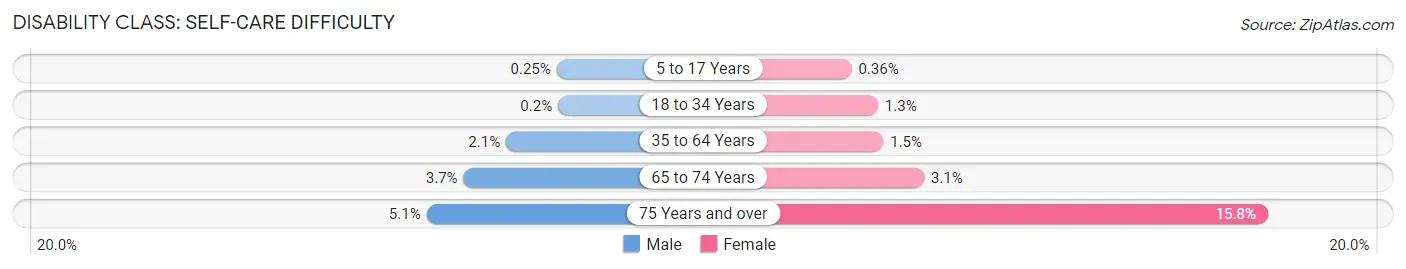
| Age Bracket | Male | Female |
| 5 to 17 Years | 12 (0.3%) | 17 (0.4%) |
| 18 to 34 Years | 12 (0.2%) | 73 (1.3%) |
| 35 to 64 Years | 206 (2.1%) | 158 (1.5%) |
| 65 to 74 Years | 59 (3.7%) | 62 (3.0%) |
| 75 Years and over | 46 (5.1%) | 225 (15.8%) |
Technology Access in Mooresville
Computing Device Access in Mooresville
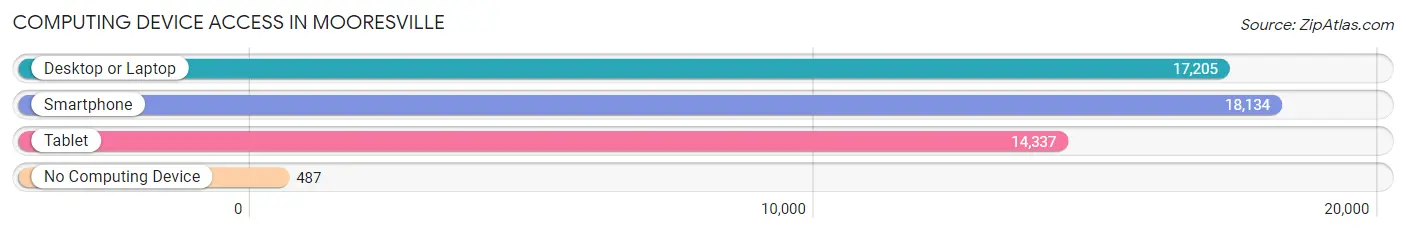
| Device Type | # Households | % Households |
| Desktop or Laptop | 17,205 | 88.8% |
| Smartphone | 18,134 | 93.6% |
| Tablet | 14,337 | 74.0% |
| No Computing Device | 487 | 2.5% |
| Total | 19,365 | 100.0% |
Internet Access in Mooresville
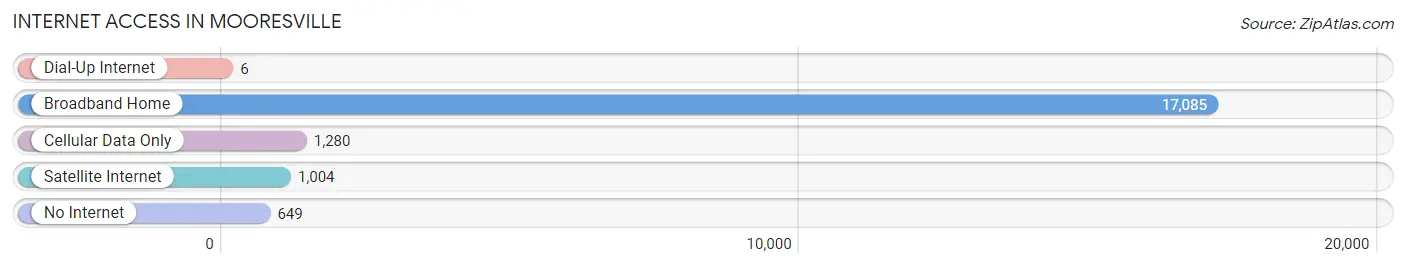
| Internet Type | # Households | % Households |
| Dial-Up Internet | 6 | 0.0% |
| Broadband Home | 17,085 | 88.2% |
| Cellular Data Only | 1,280 | 6.6% |
| Satellite Internet | 1,004 | 5.2% |
| No Internet | 649 | 3.4% |
| Total | 19,365 | 100.0% |
Mooresville Summary
Mooresville, NC is a small town located in the southern part of the state, about 25 miles north of Charlotte. It is part of the Charlotte metropolitan area and is the county seat of Iredell County. The town has a population of approximately 36,000 people and is known for its historic downtown area, which is home to many shops and restaurants.
History
Mooresville was founded in 1856 by John Franklin Moore, a local farmer and businessman. He named the town after himself and it quickly grew into a thriving community. The town was incorporated in 1873 and soon became a center for the textile industry. By the early 1900s, Mooresville was home to several cotton mills and other businesses.
In the 1950s, Mooresville began to experience a period of growth and development. The town was home to several new businesses, including a furniture factory and a paper mill. The town also became a popular destination for tourists, who were drawn to the area’s natural beauty and historic downtown.
In the late 1990s, Mooresville began to experience a period of rapid growth. The town was home to several new businesses, including a Lowe’s Home Improvement store and a NASCAR race shop. The town also became a popular destination for NASCAR fans, who were drawn to the area’s racing heritage.
Geography
Mooresville is located in the southern part of the state, about 25 miles north of Charlotte. The town is situated in the Piedmont region of North Carolina and is part of the Charlotte metropolitan area. The town is located on the banks of Lake Norman, a large man-made lake that was created in the 1960s.
The town is surrounded by several small towns and rural areas, including Davidson, Cornelius, and Troutman. The town is also close to several larger cities, including Charlotte, Winston-Salem, and Greensboro.
Economy
Mooresville’s economy is largely based on the service industry. The town is home to several large companies, including Lowe’s Home Improvement, which is headquartered in the town. The town is also home to several NASCAR race shops, which employ hundreds of people.
The town is also home to several small businesses, including restaurants, shops, and other businesses. The town is also home to several educational institutions, including Mitchell Community College and the University of North Carolina at Charlotte.
Demographics
As of the 2010 census, Mooresville had a population of 32,711 people. The town has a median household income of $50,945 and a median age of 37. The town is predominantly white, with approximately 79% of the population identifying as white. The town is also home to a large Hispanic population, with approximately 11% of the population identifying as Hispanic or Latino.
Mooresville is a small town with a rich history and a vibrant economy. The town is home to several large companies, including Lowe’s Home Improvement, and is a popular destination for NASCAR fans. The town is also home to several small businesses, educational institutions, and a diverse population.
Common Questions
What is Per Capita Income in Mooresville?
Per Capita income in Mooresville is $40,275.
What is the Median Family Income in Mooresville?
Median Family Income in Mooresville is $93,922.
What is the Median Household income in Mooresville?
Median Household Income in Mooresville is $82,622.
What is Income or Wage Gap in Mooresville?
Income or Wage Gap in Mooresville is 43.6%.
Women in Mooresville earn 56.4 cents for every dollar earned by a man.
What is Family Income Deficit in Mooresville?
Family Income Deficit in Mooresville is $8,535.
Families that are below poverty line in Mooresville earn $8,535 less on average than the poverty threshold level.
What is Inequality or Gini Index in Mooresville?
Inequality or Gini Index in Mooresville is 0.40.
What is the Total Population of Mooresville?
Total Population of Mooresville is 50,025.
What is the Total Male Population of Mooresville?
Total Male Population of Mooresville is 24,507.
What is the Total Female Population of Mooresville?
Total Female Population of Mooresville is 25,518.
What is the Ratio of Males per 100 Females in Mooresville?
There are 96.04 Males per 100 Females in Mooresville.
What is the Ratio of Females per 100 Males in Mooresville?
There are 104.13 Females per 100 Males in Mooresville.
What is the Median Population Age in Mooresville?
Median Population Age in Mooresville is 36.5 Years.
What is the Average Family Size in Mooresville
Average Family Size in Mooresville is 3.1 People.
What is the Average Household Size in Mooresville
Average Household Size in Mooresville is 2.6 People.
How Large is the Labor Force in Mooresville?
There are 26,966 People in the Labor Forcein in Mooresville.
What is the Percentage of People in the Labor Force in Mooresville?
68.8% of People are in the Labor Force in Mooresville.
What is the Unemployment Rate in Mooresville?
Unemployment Rate in Mooresville is 3.9%.