Metairie, LA Map & Demographics
Metairie Map
Metairie Overview
$43,170
PER CAPITA INCOME
$93,170
AVG FAMILY INCOME
$72,070
AVG HOUSEHOLD INCOME
18.4%
WAGE / INCOME GAP [ % ]
81.6¢/ $1
WAGE / INCOME GAP [ $ ]
$9,112
FAMILY INCOME DEFICIT
0.47
INEQUALITY / GINI INDEX
140,046
TOTAL POPULATION
68,903
MALE POPULATION
71,143
FEMALE POPULATION
96.85
MALES / 100 FEMALES
103.25
FEMALES / 100 MALES
42.4
MEDIAN AGE
3.0
AVG FAMILY SIZE
2.3
AVG HOUSEHOLD SIZE
73,990
LABOR FORCE [ PEOPLE ]
64.0%
PERCENT IN LABOR FORCE
4.3%
UNEMPLOYMENT RATE
Metairie Area Codes
Income in Metairie
Income Overview in Metairie
Per Capita Income in Metairie is $43,170, while median incomes of families and households are $93,170 and $72,070 respectively.
| Characteristic | Number | Measure |
| Per Capita Income | 140,046 | $43,170 |
| Median Family Income | 35,526 | $93,170 |
| Mean Family Income | 35,526 | $122,014 |
| Median Household Income | 60,634 | $72,070 |
| Mean Household Income | 60,634 | $98,397 |
| Income Deficit | 35,526 | $9,112 |
| Wage / Income Gap (%) | 140,046 | 18.44% |
| Wage / Income Gap ($) | 140,046 | 81.56¢ per $1 |
| Gini / Inequality Index | 140,046 | 0.47 |
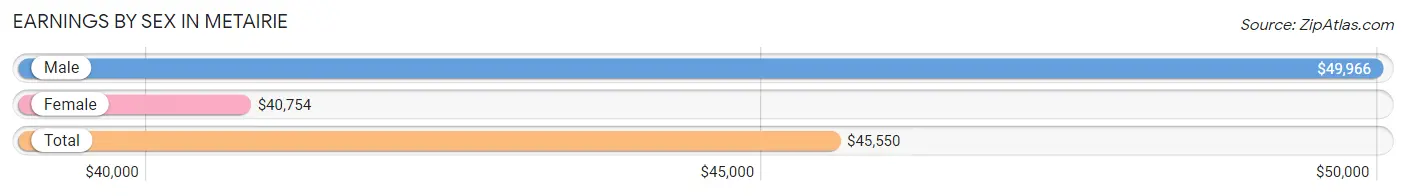
Earnings by Sex in Metairie
Average Earnings in Metairie are $45,550, $49,966 for men and $40,754 for women, a difference of 18.4%.
| Sex | Number | Average Earnings |
| Male | 40,270 (52.2%) | $49,966 |
| Female | 36,837 (47.8%) | $40,754 |
| Total | 77,107 (100.0%) | $45,550 |
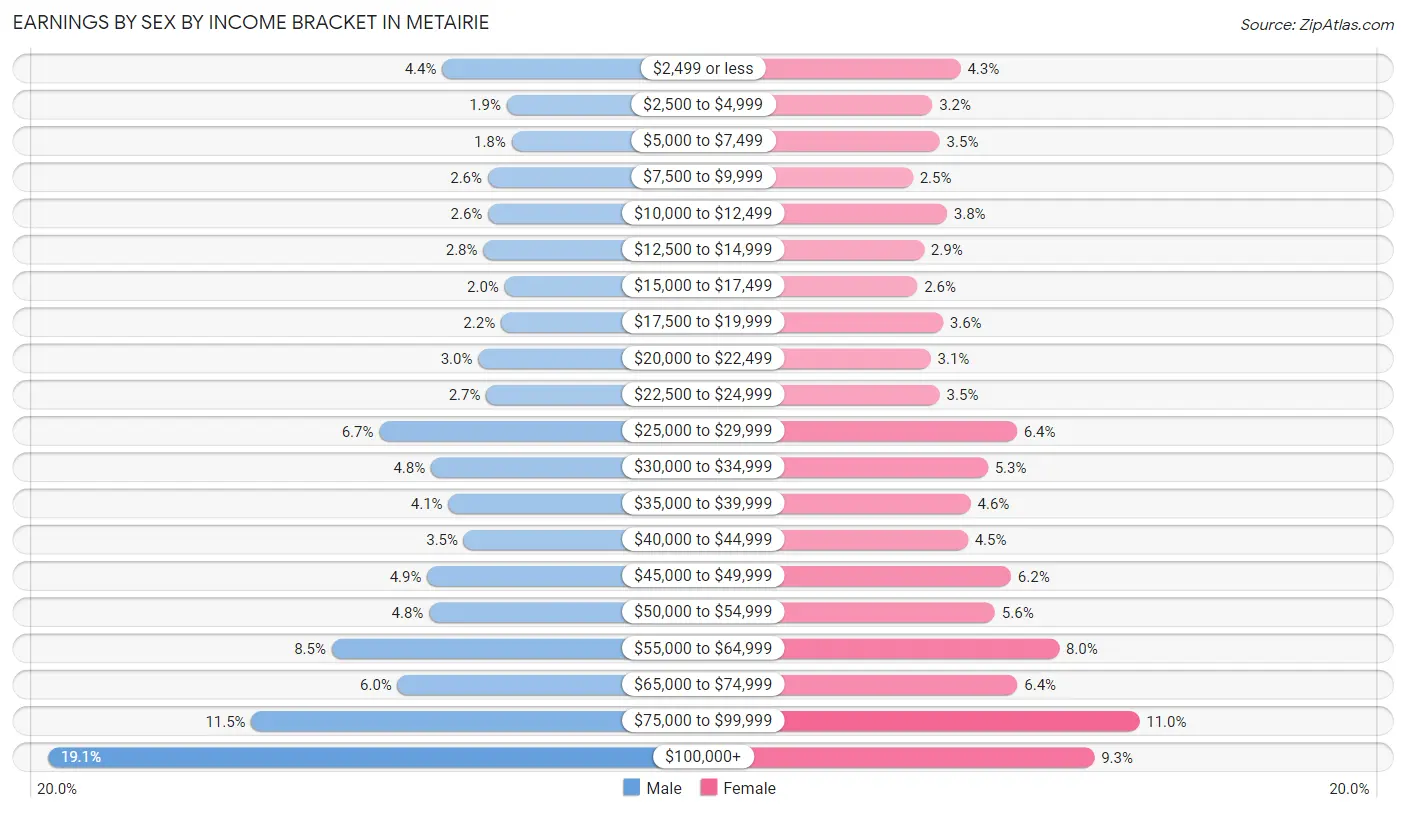
Earnings by Sex by Income Bracket in Metairie
The most common earnings brackets in Metairie are $100,000+ for men (7,703 | 19.1%) and $75,000 to $99,999 for women (4,038 | 11.0%).
| Income | Male | Female |
| $2,499 or less | 1,752 (4.3%) | 1,569 (4.3%) |
| $2,500 to $4,999 | 776 (1.9%) | 1,177 (3.2%) |
| $5,000 to $7,499 | 706 (1.8%) | 1,283 (3.5%) |
| $7,500 to $9,999 | 1,063 (2.6%) | 910 (2.5%) |
| $10,000 to $12,499 | 1,059 (2.6%) | 1,381 (3.7%) |
| $12,500 to $14,999 | 1,132 (2.8%) | 1,064 (2.9%) |
| $15,000 to $17,499 | 810 (2.0%) | 971 (2.6%) |
| $17,500 to $19,999 | 864 (2.1%) | 1,327 (3.6%) |
| $20,000 to $22,499 | 1,208 (3.0%) | 1,157 (3.1%) |
| $22,500 to $24,999 | 1,086 (2.7%) | 1,283 (3.5%) |
| $25,000 to $29,999 | 2,703 (6.7%) | 2,348 (6.4%) |
| $30,000 to $34,999 | 1,922 (4.8%) | 1,946 (5.3%) |
| $35,000 to $39,999 | 1,660 (4.1%) | 1,708 (4.6%) |
| $40,000 to $44,999 | 1,426 (3.5%) | 1,670 (4.5%) |
| $45,000 to $49,999 | 1,976 (4.9%) | 2,264 (6.1%) |
| $50,000 to $54,999 | 1,948 (4.8%) | 2,044 (5.6%) |
| $55,000 to $64,999 | 3,419 (8.5%) | 2,928 (8.0%) |
| $65,000 to $74,999 | 2,424 (6.0%) | 2,354 (6.4%) |
| $75,000 to $99,999 | 4,633 (11.5%) | 4,038 (11.0%) |
| $100,000+ | 7,703 (19.1%) | 3,415 (9.3%) |
| Total | 40,270 (100.0%) | 36,837 (100.0%) |
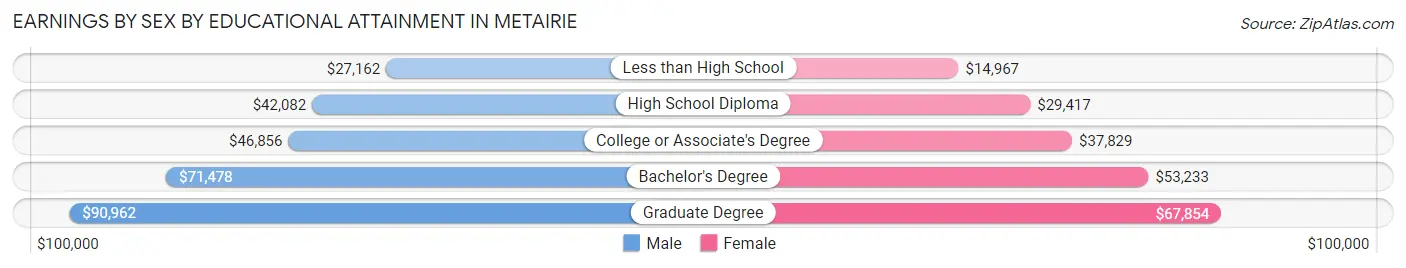
Earnings by Sex by Educational Attainment in Metairie
Average earnings in Metairie are $54,414 for men and $45,340 for women, a difference of 16.7%. Men with an educational attainment of graduate degree enjoy the highest average annual earnings of $90,962, while those with less than high school education earn the least with $27,162. Women with an educational attainment of graduate degree earn the most with the average annual earnings of $67,854, while those with less than high school education have the smallest earnings of $14,967.
| Educational Attainment | Male Income | Female Income |
| Less than High School | $27,162 | $14,967 |
| High School Diploma | $42,082 | $29,417 |
| College or Associate's Degree | $46,856 | $37,829 |
| Bachelor's Degree | $71,478 | $53,233 |
| Graduate Degree | $90,962 | $67,854 |
| Total | $54,414 | $45,340 |
Family Income in Metairie
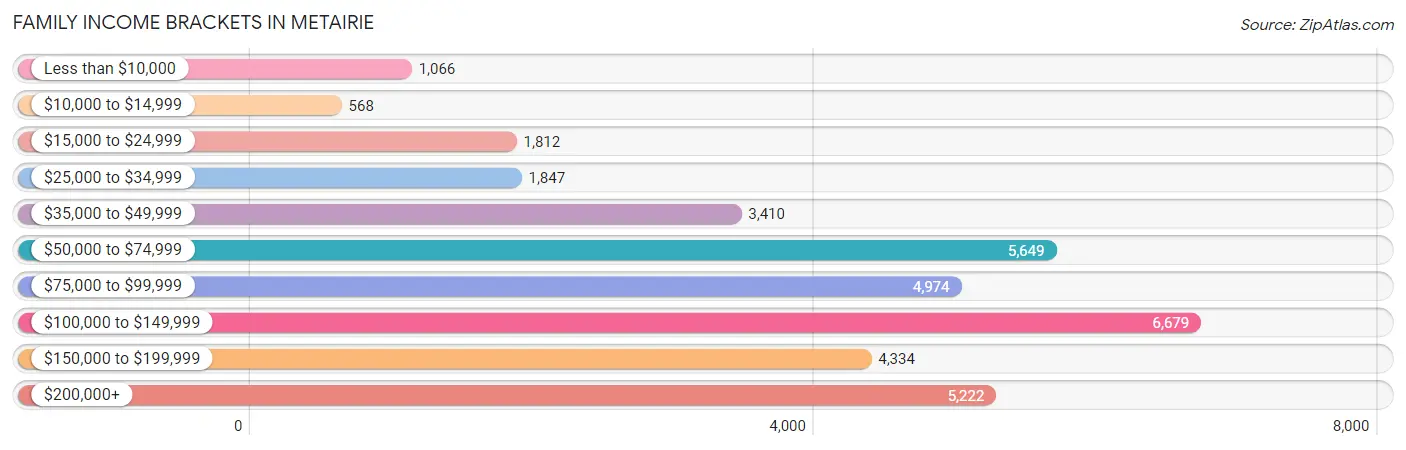
Family Income Brackets in Metairie
According to the Metairie family income data, there are 6,679 families falling into the $100,000 to $149,999 income range, which is the most common income bracket and makes up 18.8% of all families. Conversely, the $10,000 to $14,999 income bracket is the least frequent group with only 568 families (1.6%) belonging to this category.
| Income Bracket | # Families | % Families |
| Less than $10,000 | 1,066 | 3.0% |
| $10,000 to $14,999 | 568 | 1.6% |
| $15,000 to $24,999 | 1,812 | 5.1% |
| $25,000 to $34,999 | 1,847 | 5.2% |
| $35,000 to $49,999 | 3,410 | 9.6% |
| $50,000 to $74,999 | 5,649 | 15.9% |
| $75,000 to $99,999 | 4,974 | 14.0% |
| $100,000 to $149,999 | 6,679 | 18.8% |
| $150,000 to $199,999 | 4,334 | 12.2% |
| $200,000+ | 5,222 | 14.7% |
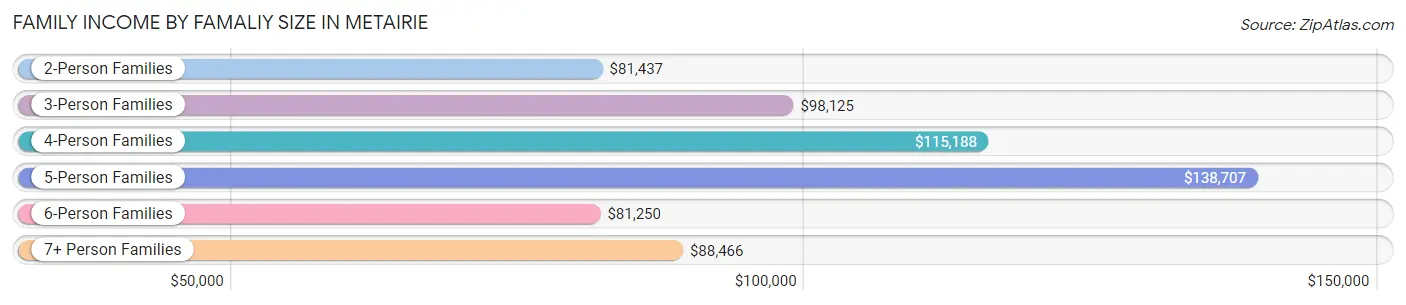
Family Income by Famaliy Size in Metairie
5-person families (1,658 | 4.7%) account for the highest median family income in Metairie with $138,707 per family, while 2-person families (18,289 | 51.5%) have the highest median income of $40,718 per family member.
| Income Bracket | # Families | Median Income |
| 2-Person Families | 18,289 (51.5%) | $81,437 |
| 3-Person Families | 8,577 (24.1%) | $98,125 |
| 4-Person Families | 6,138 (17.3%) | $115,188 |
| 5-Person Families | 1,658 (4.7%) | $138,707 |
| 6-Person Families | 709 (2.0%) | $81,250 |
| 7+ Person Families | 155 (0.4%) | $88,466 |
| Total | 35,526 (100.0%) | $93,170 |
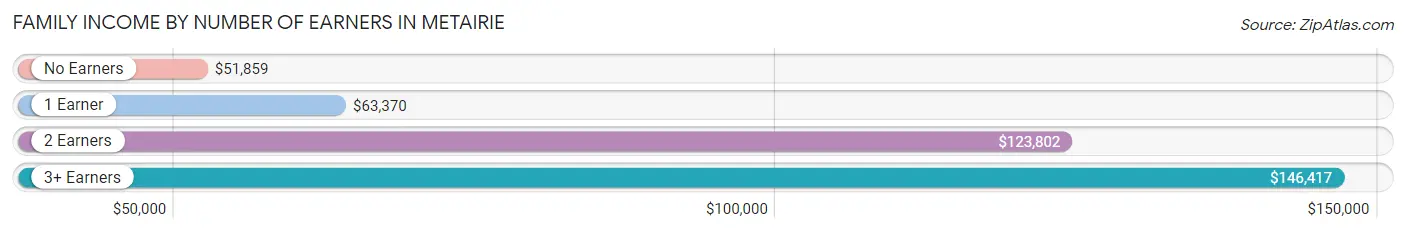
Family Income by Number of Earners in Metairie
The median family income in Metairie is $93,170, with families comprising 3+ earners (3,173) having the highest median family income of $146,417, while families with no earners (5,170) have the lowest median family income of $51,859, accounting for 8.9% and 14.5% of families, respectively.
| Number of Earners | # Families | Median Income |
| No Earners | 5,170 (14.5%) | $51,859 |
| 1 Earner | 11,610 (32.7%) | $63,370 |
| 2 Earners | 15,573 (43.8%) | $123,802 |
| 3+ Earners | 3,173 (8.9%) | $146,417 |
| Total | 35,526 (100.0%) | $93,170 |
Household Income in Metairie
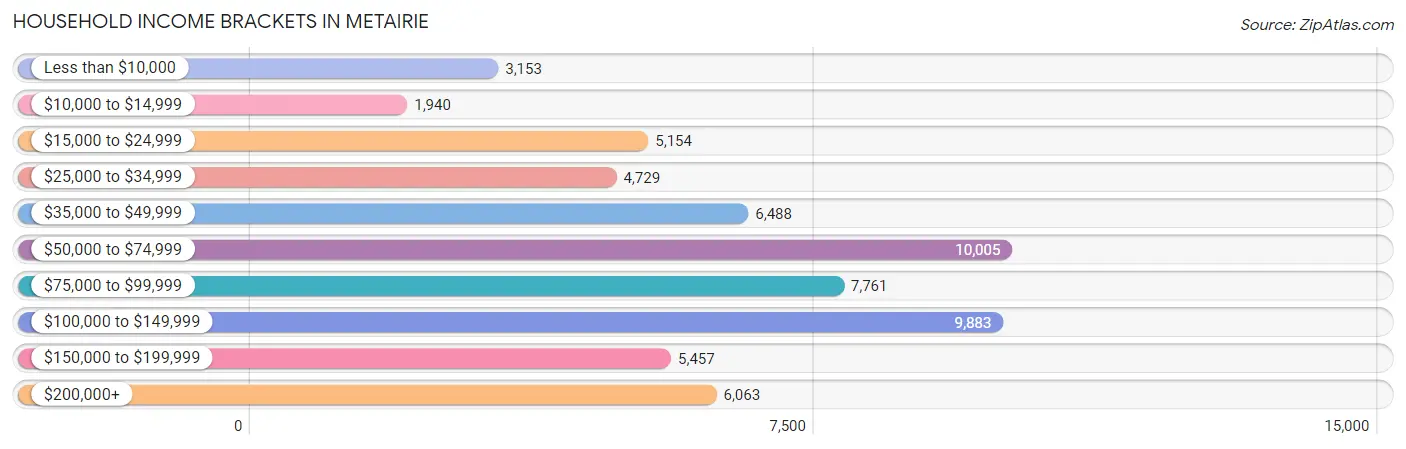
Household Income Brackets in Metairie
With 10,005 households falling in the category, the $50,000 to $74,999 income range is the most frequent in Metairie, accounting for 16.5% of all households. In contrast, only 1,940 households (3.2%) fall into the $10,000 to $14,999 income bracket, making it the least populous group.
| Income Bracket | # Households | % Households |
| Less than $10,000 | 3,153 | 5.2% |
| $10,000 to $14,999 | 1,940 | 3.2% |
| $15,000 to $24,999 | 5,154 | 8.5% |
| $25,000 to $34,999 | 4,729 | 7.8% |
| $35,000 to $49,999 | 6,488 | 10.7% |
| $50,000 to $74,999 | 10,005 | 16.5% |
| $75,000 to $99,999 | 7,761 | 12.8% |
| $100,000 to $149,999 | 9,883 | 16.3% |
| $150,000 to $199,999 | 5,457 | 9.0% |
| $200,000+ | 6,063 | 10.0% |
Household Income by Householder Age in Metairie
The median household income in Metairie is $72,070, with the highest median household income of $84,521 found in the 45 to 64 years age bracket for the primary householder. A total of 20,402 households (33.7%) fall into this category. Meanwhile, the 15 to 24 years age bracket for the primary householder has the lowest median household income of $37,616, with 1,397 households (2.3%) in this group.
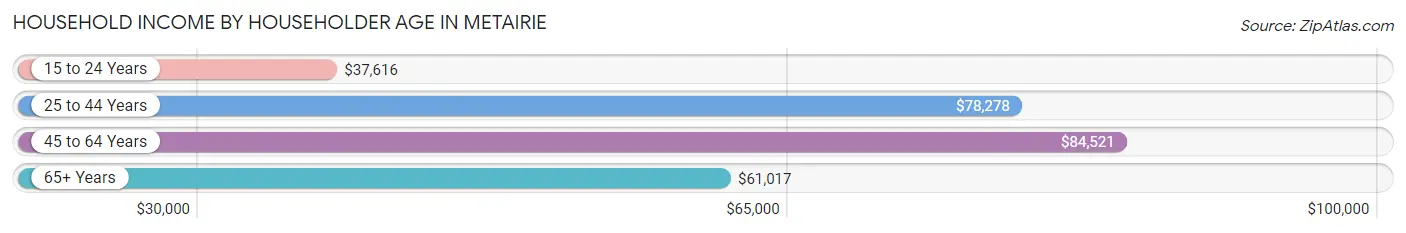
| Income Bracket | # Households | Median Income |
| 15 to 24 Years | 1,397 (2.3%) | $37,616 |
| 25 to 44 Years | 19,040 (31.4%) | $78,278 |
| 45 to 64 Years | 20,402 (33.7%) | $84,521 |
| 65+ Years | 19,795 (32.7%) | $61,017 |
| Total | 60,634 (100.0%) | $72,070 |
Poverty in Metairie
Income Below Poverty by Sex and Age in Metairie
With 12.0% poverty level for males and 11.4% for females among the residents of Metairie, under 5 year old males and 18 to 24 year old females are the most vulnerable to poverty, with 1,012 males (23.8%) and 778 females (17.9%) in their respective age groups living below the poverty level.
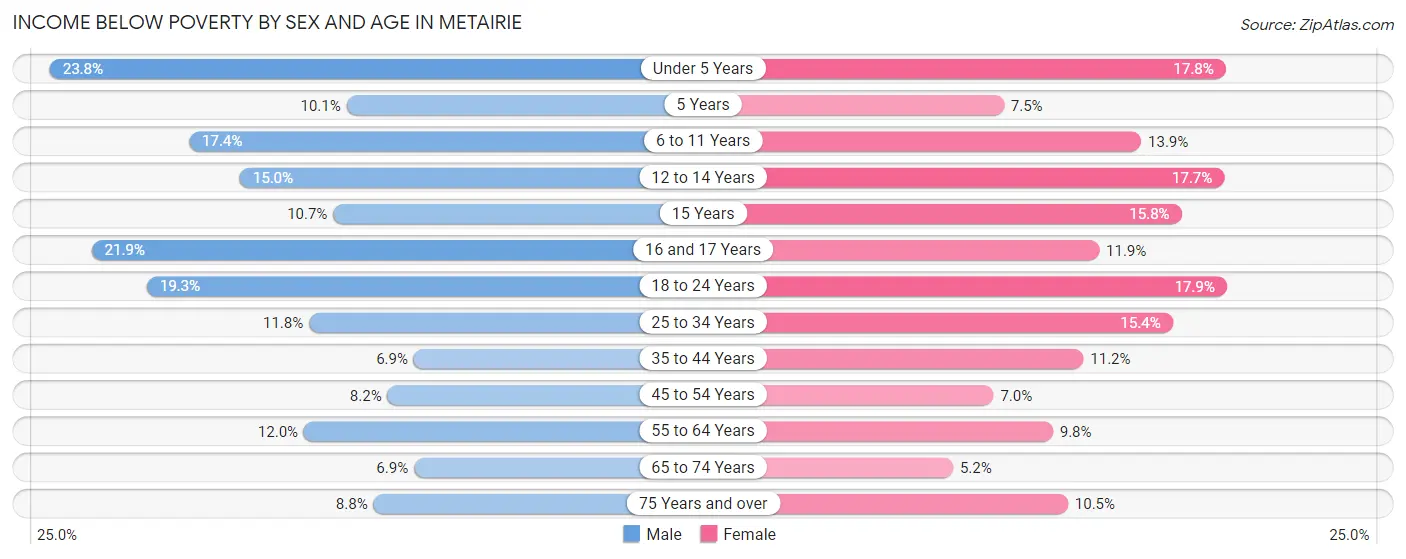
| Age Bracket | Male | Female |
| Under 5 Years | 1,012 (23.8%) | 641 (17.8%) |
| 5 Years | 73 (10.1%) | 47 (7.5%) |
| 6 to 11 Years | 846 (17.4%) | 557 (13.9%) |
| 12 to 14 Years | 381 (15.0%) | 386 (17.7%) |
| 15 Years | 52 (10.7%) | 134 (15.8%) |
| 16 and 17 Years | 343 (21.9%) | 165 (11.9%) |
| 18 to 24 Years | 993 (19.3%) | 778 (17.9%) |
| 25 to 34 Years | 1,143 (11.8%) | 1,463 (15.3%) |
| 35 to 44 Years | 666 (6.9%) | 983 (11.2%) |
| 45 to 54 Years | 579 (8.2%) | 588 (7.0%) |
| 55 to 64 Years | 1,156 (12.0%) | 1,014 (9.8%) |
| 65 to 74 Years | 571 (6.9%) | 436 (5.2%) |
| 75 Years and over | 423 (8.8%) | 878 (10.5%) |
| Total | 8,238 (12.0%) | 8,070 (11.4%) |
Income Above Poverty by Sex and Age in Metairie
According to the poverty statistics in Metairie, males aged 65 to 74 years and females aged 65 to 74 years are the age groups that are most secure financially, with 93.1% of males and 94.8% of females in these age groups living above the poverty line.
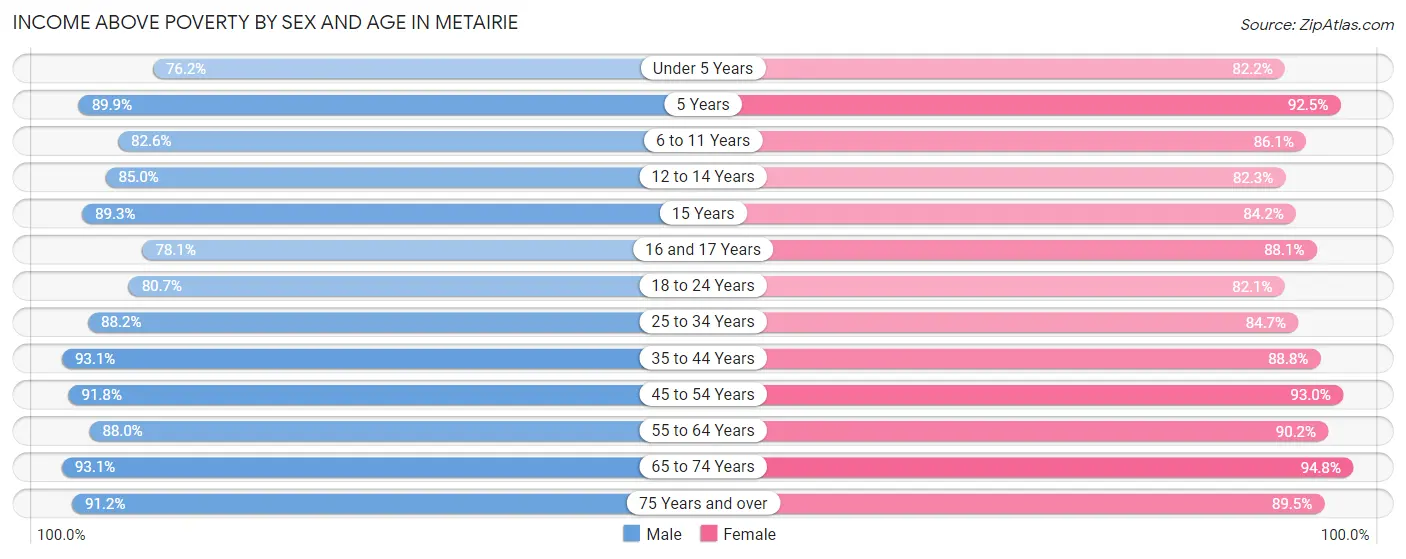
| Age Bracket | Male | Female |
| Under 5 Years | 3,234 (76.2%) | 2,959 (82.2%) |
| 5 Years | 653 (89.9%) | 578 (92.5%) |
| 6 to 11 Years | 4,024 (82.6%) | 3,454 (86.1%) |
| 12 to 14 Years | 2,157 (85.0%) | 1,790 (82.3%) |
| 15 Years | 435 (89.3%) | 716 (84.2%) |
| 16 and 17 Years | 1,224 (78.1%) | 1,217 (88.1%) |
| 18 to 24 Years | 4,145 (80.7%) | 3,579 (82.1%) |
| 25 to 34 Years | 8,546 (88.2%) | 8,066 (84.7%) |
| 35 to 44 Years | 8,935 (93.1%) | 7,788 (88.8%) |
| 45 to 54 Years | 6,513 (91.8%) | 7,768 (93.0%) |
| 55 to 64 Years | 8,449 (88.0%) | 9,343 (90.2%) |
| 65 to 74 Years | 7,670 (93.1%) | 8,017 (94.8%) |
| 75 Years and over | 4,379 (91.2%) | 7,494 (89.5%) |
| Total | 60,364 (88.0%) | 62,769 (88.6%) |
Income Below Poverty Among Married-Couple Families in Metairie
The poverty statistics for married-couple families in Metairie show that 4.2% or 1,073 of the total 25,703 families live below the poverty line. Families with 5 or more children have the highest poverty rate of 39.7%, comprising of 23 families. On the other hand, families with no children have the lowest poverty rate of 3.2%, which includes 500 families.
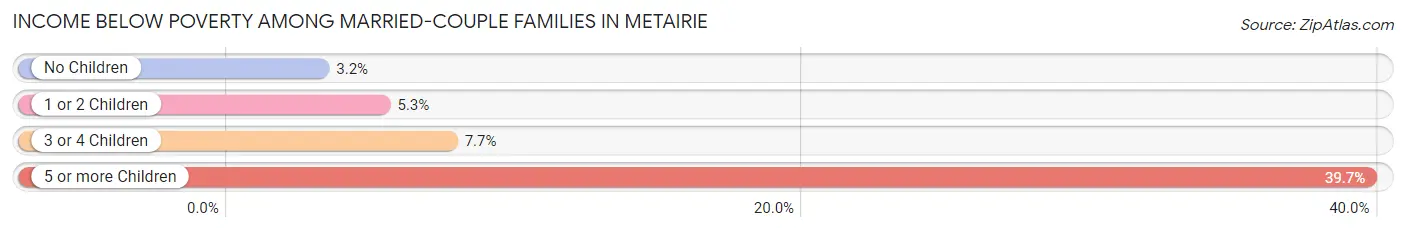
| Children | Above Poverty | Below Poverty |
| No Children | 15,219 (96.8%) | 500 (3.2%) |
| 1 or 2 Children | 8,459 (94.7%) | 474 (5.3%) |
| 3 or 4 Children | 917 (92.3%) | 76 (7.6%) |
| 5 or more Children | 35 (60.3%) | 23 (39.7%) |
| Total | 24,630 (95.8%) | 1,073 (4.2%) |
Income Below Poverty Among Single-Parent Households in Metairie
According to the poverty data in Metairie, 17.7% or 518 single-father households and 21.7% or 1,496 single-mother households are living below the poverty line. Among single-father households, those with 3 or 4 children have the highest poverty rate, with 51 households (35.7%) experiencing poverty. Likewise, among single-mother households, those with 3 or 4 children have the highest poverty rate, with 154 households (36.8%) falling below the poverty line.
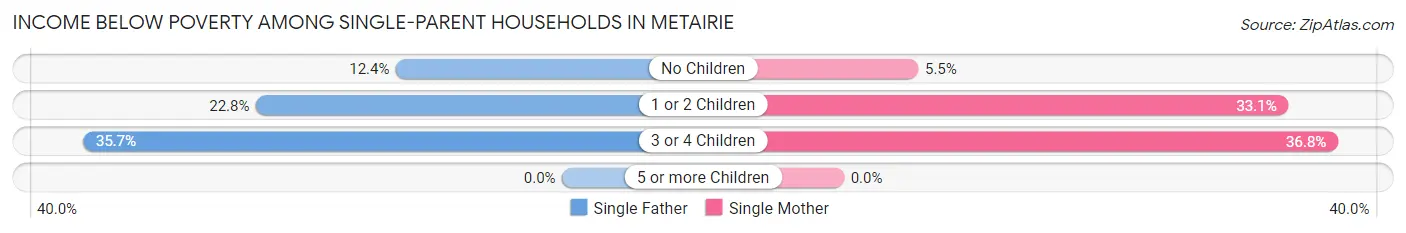
| Children | Single Father | Single Mother |
| No Children | 199 (12.4%) | 160 (5.5%) |
| 1 or 2 Children | 268 (22.8%) | 1,182 (33.1%) |
| 3 or 4 Children | 51 (35.7%) | 154 (36.8%) |
| 5 or more Children | 0 (0.0%) | 0 (0.0%) |
| Total | 518 (17.7%) | 1,496 (21.7%) |
Income Below Poverty Among Married-Couple vs Single-Parent Households in Metairie
The poverty data for Metairie shows that 1,073 of the married-couple family households (4.2%) and 2,014 of the single-parent households (20.5%) are living below the poverty level. Within the married-couple family households, those with 5 or more children have the highest poverty rate, with 23 households (39.7%) falling below the poverty line. Among the single-parent households, those with 3 or 4 children have the highest poverty rate, with 205 household (36.5%) living below poverty.
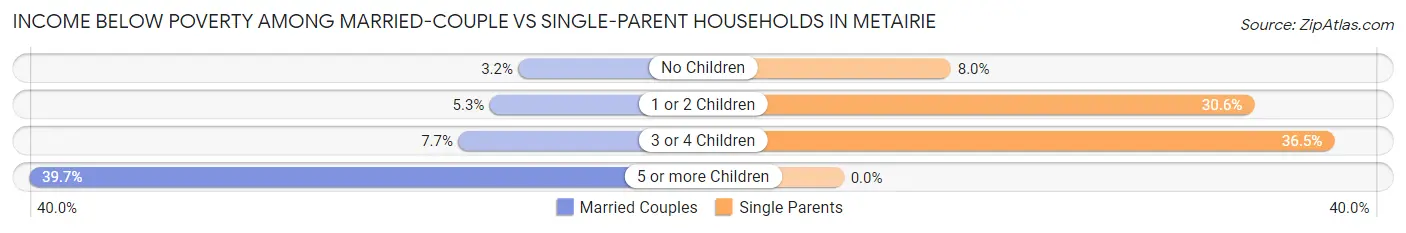
| Children | Married-Couple Families | Single-Parent Households |
| No Children | 500 (3.2%) | 359 (8.0%) |
| 1 or 2 Children | 474 (5.3%) | 1,450 (30.6%) |
| 3 or 4 Children | 76 (7.6%) | 205 (36.5%) |
| 5 or more Children | 23 (39.7%) | 0 (0.0%) |
| Total | 1,073 (4.2%) | 2,014 (20.5%) |
Race in Metairie
The most populous races in Metairie are White / Caucasian (103,164 | 73.7%), Hispanic or Latino (19,471 | 13.9%), and Black / African American (15,223 | 10.9%).
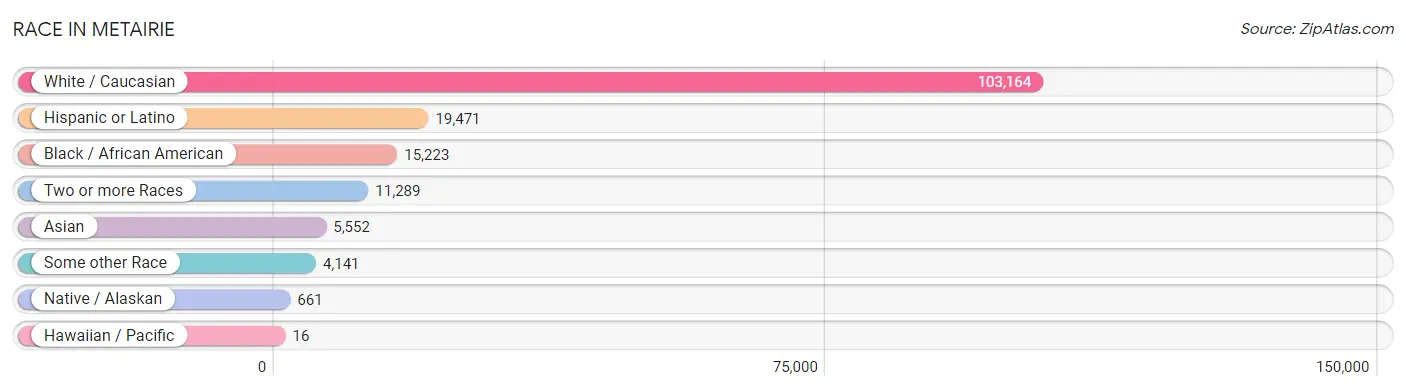
| Race | # Population | % Population |
| Asian | 5,552 | 4.0% |
| Black / African American | 15,223 | 10.9% |
| Hawaiian / Pacific | 16 | 0.0% |
| Hispanic or Latino | 19,471 | 13.9% |
| Native / Alaskan | 661 | 0.5% |
| White / Caucasian | 103,164 | 73.7% |
| Two or more Races | 11,289 | 8.1% |
| Some other Race | 4,141 | 3.0% |
| Total | 140,046 | 100.0% |
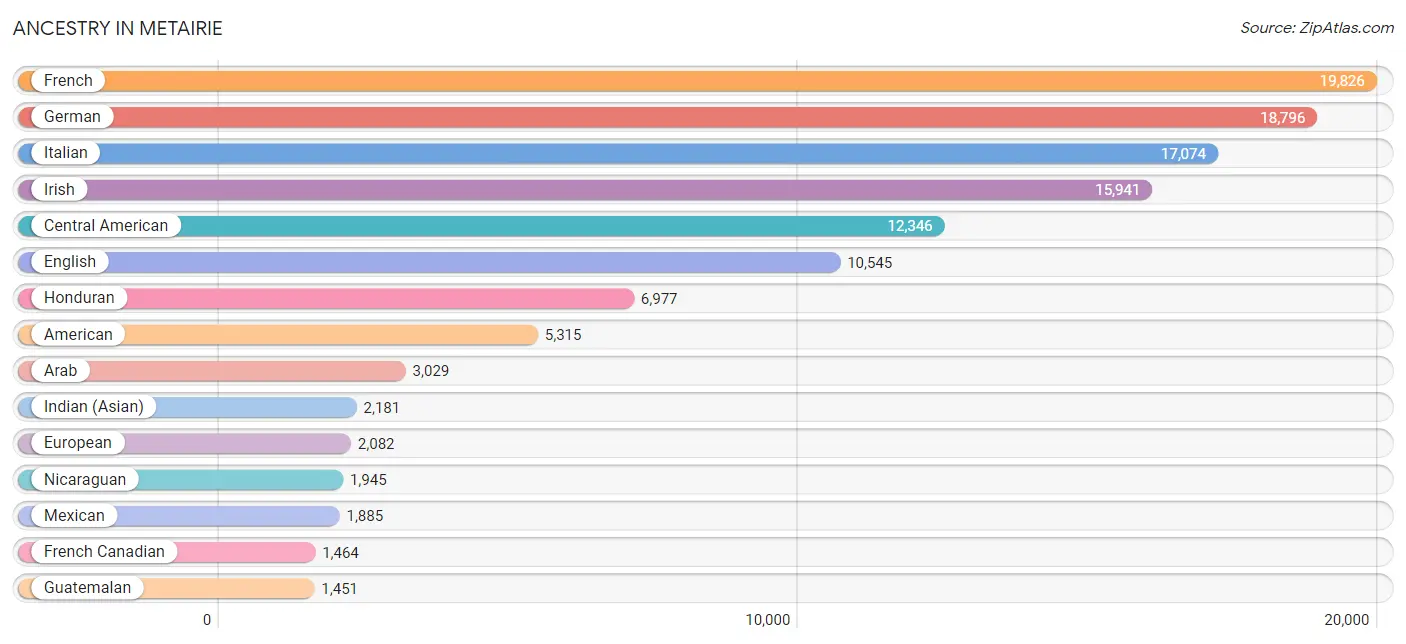
Ancestry in Metairie
The most populous ancestries reported in Metairie are French (19,826 | 14.2%), German (18,796 | 13.4%), Italian (17,074 | 12.2%), Irish (15,941 | 11.4%), and Central American (12,346 | 8.8%), together accounting for 60.0% of all Metairie residents.
| Ancestry | # Population | % Population |
| African | 660 | 0.5% |
| Alaska Native | 19 | 0.0% |
| Albanian | 8 | 0.0% |
| Aleut | 10 | 0.0% |
| Alsatian | 10 | 0.0% |
| American | 5,315 | 3.8% |
| Apache | 5 | 0.0% |
| Arab | 3,029 | 2.2% |
| Armenian | 9 | 0.0% |
| Australian | 25 | 0.0% |
| Austrian | 221 | 0.2% |
| Bahamian | 102 | 0.1% |
| Basque | 45 | 0.0% |
| Belgian | 264 | 0.2% |
| Belizean | 84 | 0.1% |
| Bhutanese | 137 | 0.1% |
| Blackfeet | 18 | 0.0% |
| Bolivian | 34 | 0.0% |
| Brazilian | 445 | 0.3% |
| British | 636 | 0.4% |
| Burmese | 378 | 0.3% |
| Cajun | 1,106 | 0.8% |
| Canadian | 75 | 0.1% |
| Cape Verdean | 25 | 0.0% |
| Central American | 12,346 | 8.8% |
| Central American Indian | 569 | 0.4% |
| Cherokee | 67 | 0.1% |
| Chickasaw | 12 | 0.0% |
| Chilean | 9 | 0.0% |
| Choctaw | 83 | 0.1% |
| Colombian | 221 | 0.2% |
| Costa Rican | 123 | 0.1% |
| Creek | 12 | 0.0% |
| Croatian | 559 | 0.4% |
| Cuban | 1,393 | 1.0% |
| Czech | 266 | 0.2% |
| Czechoslovakian | 73 | 0.1% |
| Danish | 195 | 0.1% |
| Dominican | 166 | 0.1% |
| Dutch | 531 | 0.4% |
| Eastern European | 326 | 0.2% |
| Ecuadorian | 105 | 0.1% |
| Egyptian | 718 | 0.5% |
| English | 10,545 | 7.5% |
| Ethiopian | 184 | 0.1% |
| European | 2,082 | 1.5% |
| Fijian | 51 | 0.0% |
| Filipino | 68 | 0.1% |
| French | 19,826 | 14.2% |
| French American Indian | 31 | 0.0% |
| French Canadian | 1,464 | 1.1% |
| German | 18,796 | 13.4% |
| Greek | 632 | 0.4% |
| Guatemalan | 1,451 | 1.0% |
| Guyanese | 11 | 0.0% |
| Haitian | 311 | 0.2% |
| Honduran | 6,977 | 5.0% |
| Houma | 57 | 0.0% |
| Hungarian | 257 | 0.2% |
| Indian (Asian) | 2,181 | 1.6% |
| Indonesian | 173 | 0.1% |
| Iranian | 13 | 0.0% |
| Iraqi | 107 | 0.1% |
| Irish | 15,941 | 11.4% |
| Iroquois | 11 | 0.0% |
| Israeli | 44 | 0.0% |
| Italian | 17,074 | 12.2% |
| Japanese | 87 | 0.1% |
| Jordanian | 707 | 0.5% |
| Kenyan | 17 | 0.0% |
| Korean | 1,181 | 0.8% |
| Laotian | 233 | 0.2% |
| Lebanese | 419 | 0.3% |
| Lithuanian | 316 | 0.2% |
| Malaysian | 9 | 0.0% |
| Mexican | 1,885 | 1.3% |
| Mexican American Indian | 18 | 0.0% |
| Mongolian | 11 | 0.0% |
| Moroccan | 13 | 0.0% |
| Native Hawaiian | 69 | 0.1% |
| Nicaraguan | 1,945 | 1.4% |
| Nigerian | 195 | 0.1% |
| Northern European | 165 | 0.1% |
| Norwegian | 580 | 0.4% |
| Pakistani | 99 | 0.1% |
| Palestinian | 154 | 0.1% |
| Panamanian | 55 | 0.0% |
| Paraguayan | 48 | 0.0% |
| Pennsylvania German | 20 | 0.0% |
| Peruvian | 157 | 0.1% |
| Polish | 1,017 | 0.7% |
| Portuguese | 114 | 0.1% |
| Potawatomi | 13 | 0.0% |
| Puerto Rican | 467 | 0.3% |
| Romanian | 327 | 0.2% |
| Russian | 899 | 0.6% |
| Salvadoran | 778 | 0.6% |
| Samoan | 7 | 0.0% |
| Scandinavian | 237 | 0.2% |
| Scotch-Irish | 782 | 0.6% |
| Scottish | 1,377 | 1.0% |
| Serbian | 9 | 0.0% |
| Sioux | 6 | 0.0% |
| Slavic | 56 | 0.0% |
| Slovak | 39 | 0.0% |
| Slovene | 49 | 0.0% |
| South African | 16 | 0.0% |
| South American | 671 | 0.5% |
| South American Indian | 60 | 0.0% |
| Spaniard | 486 | 0.4% |
| Spanish | 1,326 | 0.9% |
| Spanish American Indian | 6 | 0.0% |
| Sri Lankan | 1,070 | 0.8% |
| Subsaharan African | 1,151 | 0.8% |
| Sudanese | 31 | 0.0% |
| Swedish | 550 | 0.4% |
| Swiss | 69 | 0.1% |
| Syrian | 45 | 0.0% |
| Thai | 834 | 0.6% |
| Trinidadian and Tobagonian | 29 | 0.0% |
| Turkish | 115 | 0.1% |
| Ukrainian | 79 | 0.1% |
| Uruguayan | 9 | 0.0% |
| Venezuelan | 52 | 0.0% |
| Vietnamese | 88 | 0.1% |
| Welsh | 374 | 0.3% |
| West Indian | 18 | 0.0% |
| Yugoslavian | 86 | 0.1% | View All 128 Rows |
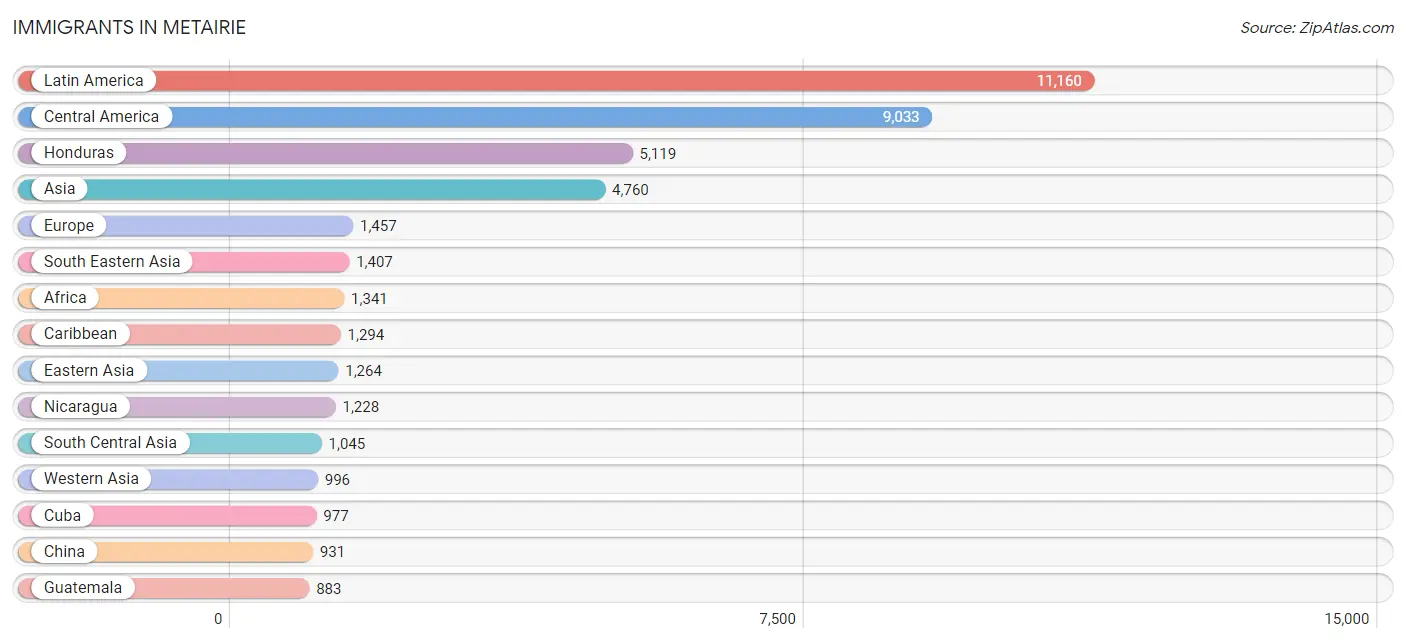
Immigrants in Metairie
The most numerous immigrant groups reported in Metairie came from Latin America (11,160 | 8.0%), Central America (9,033 | 6.5%), Honduras (5,119 | 3.7%), Asia (4,760 | 3.4%), and Europe (1,457 | 1.0%), together accounting for 22.5% of all Metairie residents.
| Immigration Origin | # Population | % Population |
| Africa | 1,341 | 1.0% |
| Albania | 17 | 0.0% |
| Asia | 4,760 | 3.4% |
| Austria | 9 | 0.0% |
| Bahamas | 28 | 0.0% |
| Bangladesh | 72 | 0.1% |
| Belarus | 9 | 0.0% |
| Belgium | 19 | 0.0% |
| Belize | 146 | 0.1% |
| Bolivia | 34 | 0.0% |
| Bosnia and Herzegovina | 155 | 0.1% |
| Brazil | 396 | 0.3% |
| Bulgaria | 8 | 0.0% |
| Cambodia | 16 | 0.0% |
| Canada | 156 | 0.1% |
| Caribbean | 1,294 | 0.9% |
| Central America | 9,033 | 6.5% |
| Chile | 5 | 0.0% |
| China | 931 | 0.7% |
| Colombia | 142 | 0.1% |
| Congo | 19 | 0.0% |
| Costa Rica | 117 | 0.1% |
| Croatia | 4 | 0.0% |
| Cuba | 977 | 0.7% |
| Dominican Republic | 36 | 0.0% |
| Eastern Africa | 184 | 0.1% |
| Eastern Asia | 1,264 | 0.9% |
| Eastern Europe | 787 | 0.6% |
| Ecuador | 86 | 0.1% |
| Egypt | 587 | 0.4% |
| El Salvador | 327 | 0.2% |
| England | 101 | 0.1% |
| Ethiopia | 184 | 0.1% |
| Europe | 1,457 | 1.0% |
| France | 91 | 0.1% |
| Germany | 84 | 0.1% |
| Greece | 96 | 0.1% |
| Guatemala | 883 | 0.6% |
| Haiti | 216 | 0.2% |
| Honduras | 5,119 | 3.7% |
| Hong Kong | 20 | 0.0% |
| Hungary | 28 | 0.0% |
| India | 429 | 0.3% |
| Indonesia | 122 | 0.1% |
| Iran | 13 | 0.0% |
| Iraq | 74 | 0.1% |
| Ireland | 21 | 0.0% |
| Israel | 64 | 0.1% |
| Italy | 129 | 0.1% |
| Japan | 138 | 0.1% |
| Jordan | 355 | 0.3% |
| Korea | 195 | 0.1% |
| Kuwait | 219 | 0.2% |
| Latin America | 11,160 | 8.0% |
| Lebanon | 104 | 0.1% |
| Lithuania | 11 | 0.0% |
| Malaysia | 16 | 0.0% |
| Mexico | 682 | 0.5% |
| Middle Africa | 19 | 0.0% |
| Moldova | 157 | 0.1% |
| Morocco | 76 | 0.1% |
| Nepal | 97 | 0.1% |
| Netherlands | 39 | 0.0% |
| Nicaragua | 1,228 | 0.9% |
| Nigeria | 103 | 0.1% |
| Northern Africa | 832 | 0.6% |
| Northern Europe | 187 | 0.1% |
| Norway | 16 | 0.0% |
| Oceania | 5 | 0.0% |
| Pakistan | 389 | 0.3% |
| Panama | 44 | 0.0% |
| Peru | 68 | 0.1% |
| Philippines | 371 | 0.3% |
| Poland | 42 | 0.0% |
| Romania | 25 | 0.0% |
| Russia | 257 | 0.2% |
| Saudi Arabia | 11 | 0.0% |
| South Africa | 5 | 0.0% |
| South America | 833 | 0.6% |
| South Central Asia | 1,045 | 0.7% |
| South Eastern Asia | 1,407 | 1.0% |
| Southern Europe | 241 | 0.2% |
| Spain | 16 | 0.0% |
| Sri Lanka | 10 | 0.0% |
| Syria | 35 | 0.0% |
| Taiwan | 68 | 0.1% |
| Thailand | 16 | 0.0% |
| Trinidad and Tobago | 37 | 0.0% |
| Turkey | 94 | 0.1% |
| Ukraine | 74 | 0.1% |
| Uruguay | 9 | 0.0% |
| Venezuela | 45 | 0.0% |
| Vietnam | 635 | 0.4% |
| Western Africa | 301 | 0.2% |
| Western Asia | 996 | 0.7% |
| Western Europe | 242 | 0.2% | View All 96 Rows |
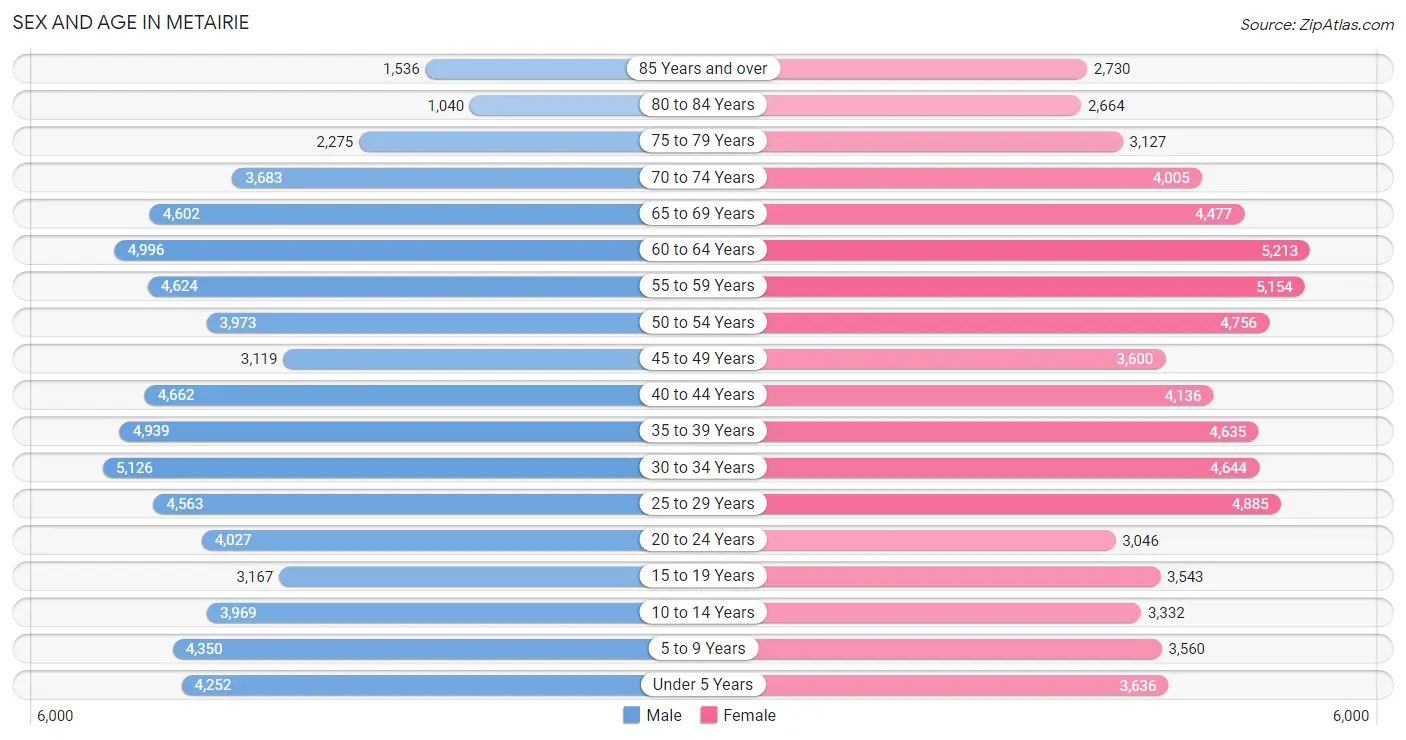
Sex and Age in Metairie
Sex and Age in Metairie
The most populous age groups in Metairie are 30 to 34 Years (5,126 | 7.4%) for men and 60 to 64 Years (5,213 | 7.3%) for women.
| Age Bracket | Male | Female |
| Under 5 Years | 4,252 (6.2%) | 3,636 (5.1%) |
| 5 to 9 Years | 4,350 (6.3%) | 3,560 (5.0%) |
| 10 to 14 Years | 3,969 (5.8%) | 3,332 (4.7%) |
| 15 to 19 Years | 3,167 (4.6%) | 3,543 (5.0%) |
| 20 to 24 Years | 4,027 (5.8%) | 3,046 (4.3%) |
| 25 to 29 Years | 4,563 (6.6%) | 4,885 (6.9%) |
| 30 to 34 Years | 5,126 (7.4%) | 4,644 (6.5%) |
| 35 to 39 Years | 4,939 (7.2%) | 4,635 (6.5%) |
| 40 to 44 Years | 4,662 (6.8%) | 4,136 (5.8%) |
| 45 to 49 Years | 3,119 (4.5%) | 3,600 (5.1%) |
| 50 to 54 Years | 3,973 (5.8%) | 4,756 (6.7%) |
| 55 to 59 Years | 4,624 (6.7%) | 5,154 (7.2%) |
| 60 to 64 Years | 4,996 (7.2%) | 5,213 (7.3%) |
| 65 to 69 Years | 4,602 (6.7%) | 4,477 (6.3%) |
| 70 to 74 Years | 3,683 (5.3%) | 4,005 (5.6%) |
| 75 to 79 Years | 2,275 (3.3%) | 3,127 (4.4%) |
| 80 to 84 Years | 1,040 (1.5%) | 2,664 (3.7%) |
| 85 Years and over | 1,536 (2.2%) | 2,730 (3.8%) |
| Total | 68,903 (100.0%) | 71,143 (100.0%) |
Families and Households in Metairie
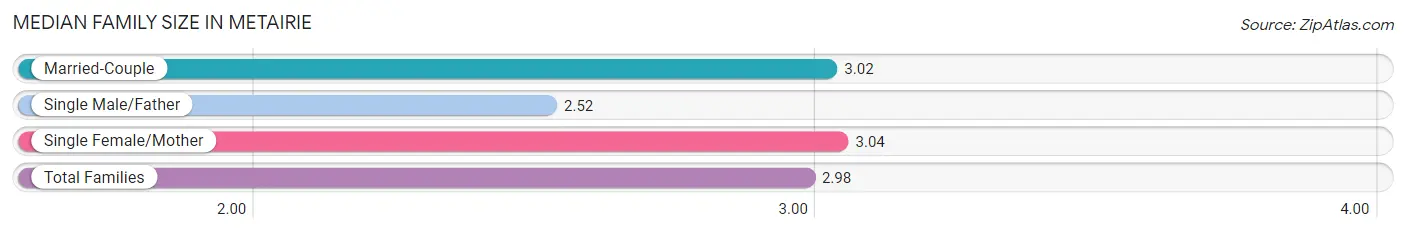
Median Family Size in Metairie
The median family size in Metairie is 2.98 persons per family, with single female/mother families (6,898 | 19.4%) accounting for the largest median family size of 3.04 persons per family. On the other hand, single male/father families (2,925 | 8.2%) represent the smallest median family size with 2.52 persons per family.
| Family Type | # Families | Family Size |
| Married-Couple | 25,703 (72.4%) | 3.02 |
| Single Male/Father | 2,925 (8.2%) | 2.52 |
| Single Female/Mother | 6,898 (19.4%) | 3.04 |
| Total Families | 35,526 (100.0%) | 2.98 |
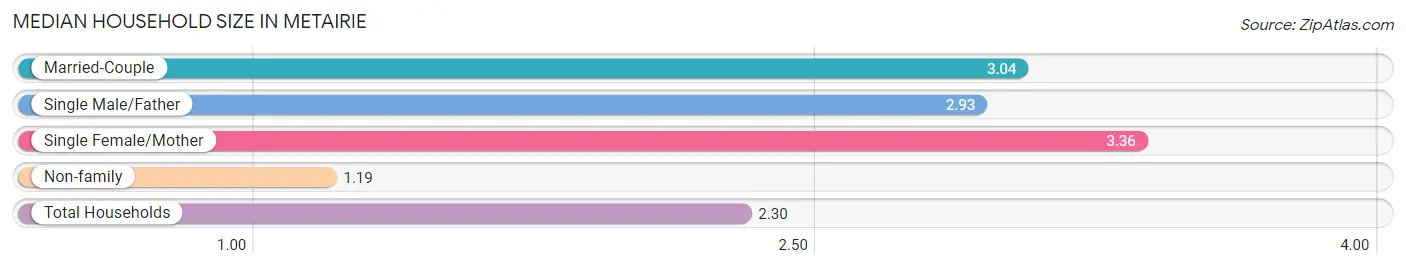
Median Household Size in Metairie
The median household size in Metairie is 2.30 persons per household, with single female/mother households (6,898 | 11.4%) accounting for the largest median household size of 3.36 persons per household. non-family households (25,108 | 41.4%) represent the smallest median household size with 1.19 persons per household.
| Household Type | # Households | Household Size |
| Married-Couple | 25,703 (42.4%) | 3.04 |
| Single Male/Father | 2,925 (4.8%) | 2.93 |
| Single Female/Mother | 6,898 (11.4%) | 3.36 |
| Non-family | 25,108 (41.4%) | 1.19 |
| Total Households | 60,634 (100.0%) | 2.30 |
Household Size by Marriage Status in Metairie
Out of a total of 60,634 households in Metairie, 35,526 (58.6%) are family households, while 25,108 (41.4%) are nonfamily households. The most numerous type of family households are 2-person households, comprising 16,667, and the most common type of nonfamily households are 1-person households, comprising 21,703.
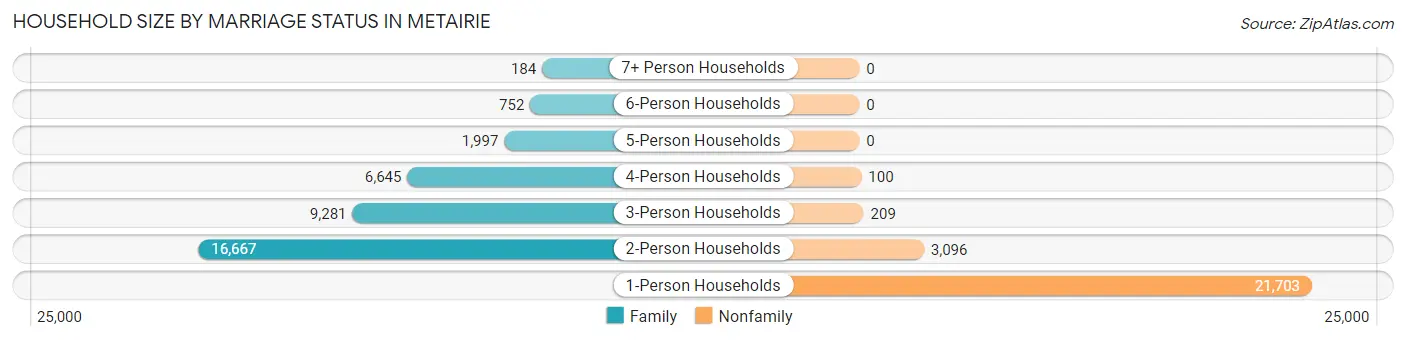
| Household Size | Family Households | Nonfamily Households |
| 1-Person Households | - | 21,703 (35.8%) |
| 2-Person Households | 16,667 (27.5%) | 3,096 (5.1%) |
| 3-Person Households | 9,281 (15.3%) | 209 (0.3%) |
| 4-Person Households | 6,645 (11.0%) | 100 (0.2%) |
| 5-Person Households | 1,997 (3.3%) | 0 (0.0%) |
| 6-Person Households | 752 (1.2%) | 0 (0.0%) |
| 7+ Person Households | 184 (0.3%) | 0 (0.0%) |
| Total | 35,526 (58.6%) | 25,108 (41.4%) |
Female Fertility in Metairie
Fertility by Age in Metairie
Average fertility rate in Metairie is 60.0 births per 1,000 women. Women in the age bracket of 20 to 34 years have the highest fertility rate with 90.0 births per 1,000 women. Women in the age bracket of 20 to 34 years acount for 64.7% of all women with births.
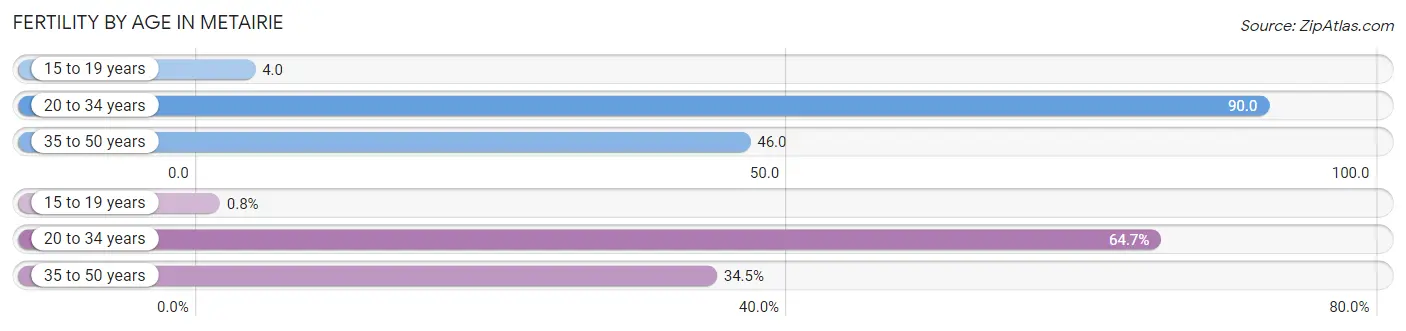
| Age Bracket | Women with Births | Births / 1,000 Women |
| 15 to 19 years | 14 (0.8%) | 4.0 |
| 20 to 34 years | 1,137 (64.7%) | 90.0 |
| 35 to 50 years | 607 (34.5%) | 46.0 |
| Total | 1,758 (100.0%) | 60.0 |
Fertility by Age by Marriage Status in Metairie
67.3% of women with births (1,758) in Metairie are married. The highest percentage of unmarried women with births falls into 15 to 19 years age bracket with 100.0% of them unmarried at the time of birth, while the lowest percentage of unmarried women with births belong to 20 to 34 years age bracket with 25.2% of them unmarried.
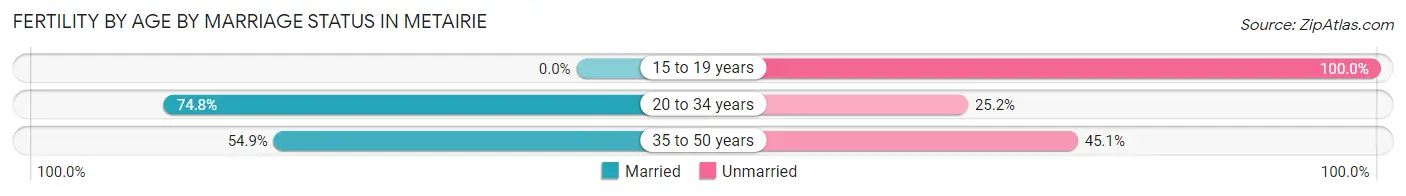
| Age Bracket | Married | Unmarried |
| 15 to 19 years | 0 (0.0%) | 14 (100.0%) |
| 20 to 34 years | 850 (74.8%) | 287 (25.2%) |
| 35 to 50 years | 333 (54.9%) | 274 (45.1%) |
| Total | 1,183 (67.3%) | 575 (32.7%) |
Fertility by Education in Metairie
Average fertility rate in Metairie is 60.0 births per 1,000 women. Women with the education attainment of graduate degree have the highest fertility rate of 106.0 births per 1,000 women, while women with the education attainment of bachelor's degree have the lowest fertility at 37.0 births per 1,000 women. Women with the education attainment of college or associate's degree represent 25.0% of all women with births.
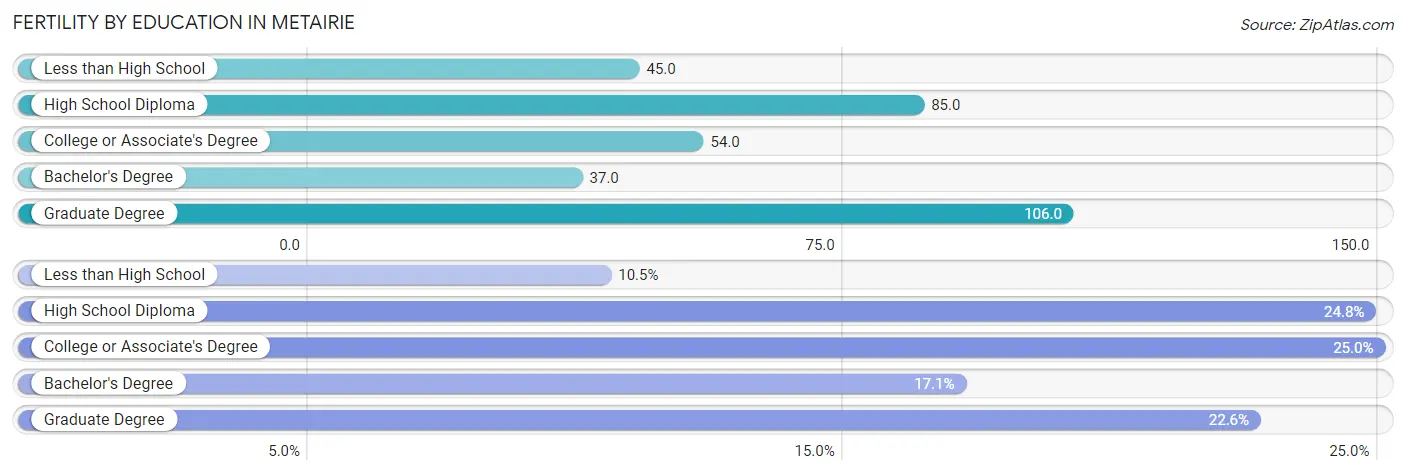
| Educational Attainment | Women with Births | Births / 1,000 Women |
| Less than High School | 184 (10.5%) | 45.0 |
| High School Diploma | 436 (24.8%) | 85.0 |
| College or Associate's Degree | 439 (25.0%) | 54.0 |
| Bachelor's Degree | 301 (17.1%) | 37.0 |
| Graduate Degree | 398 (22.6%) | 106.0 |
| Total | 1,758 (100.0%) | 60.0 |
Fertility by Education by Marriage Status in Metairie
32.7% of women with births in Metairie are unmarried. Women with the educational attainment of bachelor's degree are most likely to be married with 88.7% of them married at childbirth, while women with the educational attainment of high school diploma are least likely to be married with 41.3% of them unmarried at childbirth.
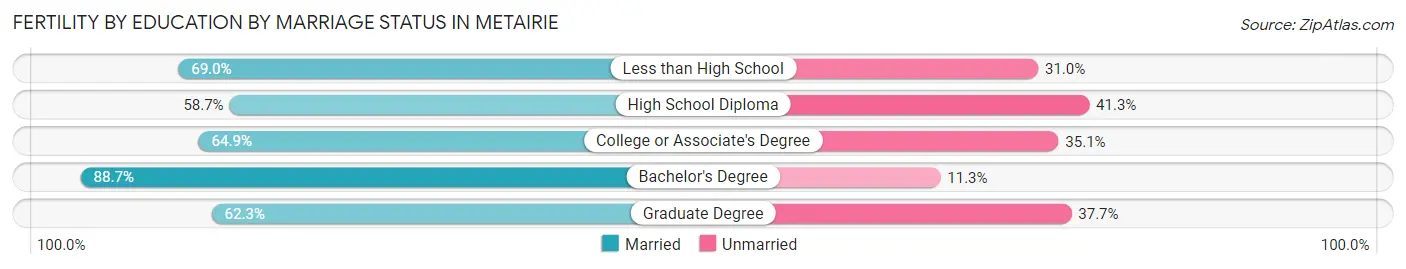
| Educational Attainment | Married | Unmarried |
| Less than High School | 127 (69.0%) | 57 (31.0%) |
| High School Diploma | 256 (58.7%) | 180 (41.3%) |
| College or Associate's Degree | 285 (64.9%) | 154 (35.1%) |
| Bachelor's Degree | 267 (88.7%) | 34 (11.3%) |
| Graduate Degree | 248 (62.3%) | 150 (37.7%) |
| Total | 1,183 (67.3%) | 575 (32.7%) |
Employment Characteristics in Metairie
Employment by Class of Employer in Metairie
Among the 69,173 employed individuals in Metairie, private company employees (46,263 | 66.9%), not-for-profit organizations (6,189 | 8.9%), and self-employed (not incorporated) (5,799 | 8.4%) make up the most common classes of employment.
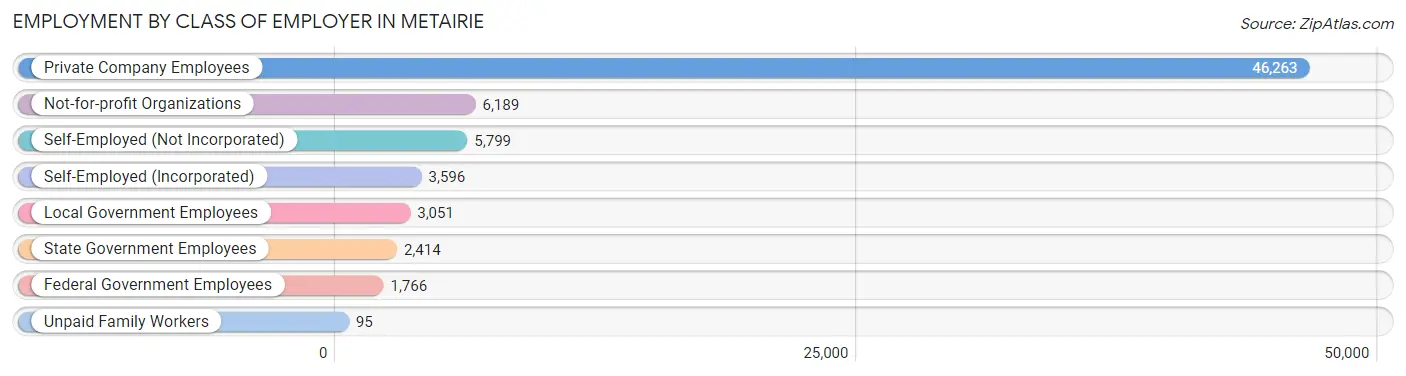
| Employer Class | # Employees | % Employees |
| Private Company Employees | 46,263 | 66.9% |
| Self-Employed (Incorporated) | 3,596 | 5.2% |
| Self-Employed (Not Incorporated) | 5,799 | 8.4% |
| Not-for-profit Organizations | 6,189 | 8.9% |
| Local Government Employees | 3,051 | 4.4% |
| State Government Employees | 2,414 | 3.5% |
| Federal Government Employees | 1,766 | 2.5% |
| Unpaid Family Workers | 95 | 0.1% |
| Total | 69,173 | 100.0% |
Employment Status by Age in Metairie
According to the labor force statistics for Metairie, out of the total population over 16 years of age (115,610), 64.0% or 73,990 individuals are in the labor force, with 4.3% or 3,182 of them unemployed. The age group with the highest labor force participation rate is 35 to 44 years, with 89.4% or 16,425 individuals in the labor force. Within the labor force, the 16 to 19 years age range has the highest percentage of unemployed individuals, with 16.5% or 287 of them being unemployed.
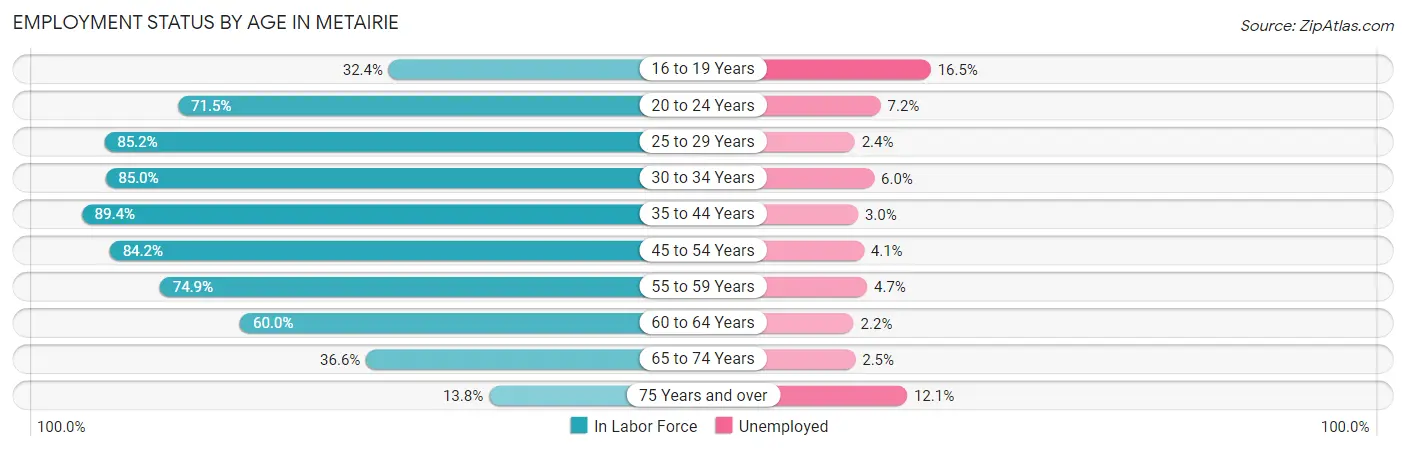
| Age Bracket | In Labor Force | Unemployed |
| 16 to 19 Years | 1,741 (32.4%) | 287 (16.5%) |
| 20 to 24 Years | 5,057 (71.5%) | 364 (7.2%) |
| 25 to 29 Years | 8,050 (85.2%) | 193 (2.4%) |
| 30 to 34 Years | 8,304 (85.0%) | 498 (6.0%) |
| 35 to 44 Years | 16,425 (89.4%) | 493 (3.0%) |
| 45 to 54 Years | 13,007 (84.2%) | 533 (4.1%) |
| 55 to 59 Years | 7,324 (74.9%) | 344 (4.7%) |
| 60 to 64 Years | 6,125 (60.0%) | 135 (2.2%) |
| 65 to 74 Years | 6,137 (36.6%) | 153 (2.5%) |
| 75 Years and over | 1,845 (13.8%) | 223 (12.1%) |
| Total | 73,990 (64.0%) | 3,182 (4.3%) |
Employment Status by Educational Attainment in Metairie
According to labor force statistics for Metairie, 81.1% of individuals (59,223) out of the total population between 25 and 64 years of age (73,025) are in the labor force, with 3.7% or 2,191 of them being unemployed. The group with the highest labor force participation rate are those with the educational attainment of bachelor's degree or higher, with 88.6% or 26,270 individuals in the labor force. Within the labor force, individuals with less than high school education have the highest percentage of unemployment, with 5.6% or 191 of them being unemployed.
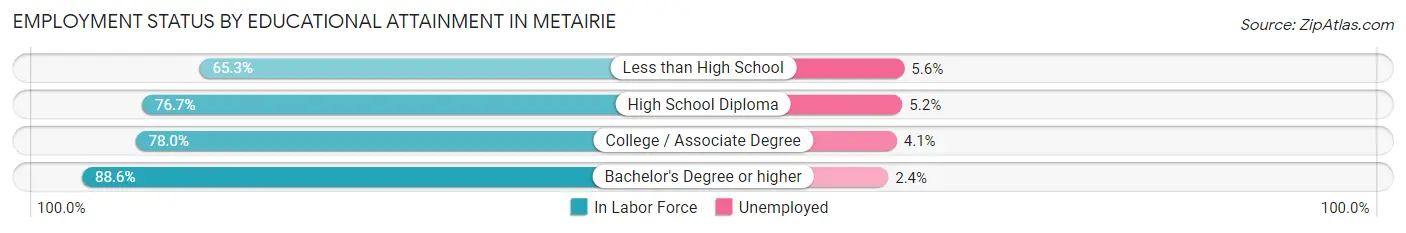
| Educational Attainment | In Labor Force | Unemployed |
| Less than High School | 3,416 (65.3%) | 293 (5.6%) |
| High School Diploma | 13,189 (76.7%) | 894 (5.2%) |
| College / Associate Degree | 16,339 (78.0%) | 859 (4.1%) |
| Bachelor's Degree or higher | 26,270 (88.6%) | 712 (2.4%) |
| Total | 59,223 (81.1%) | 2,702 (3.7%) |
Employment Occupations by Sex in Metairie
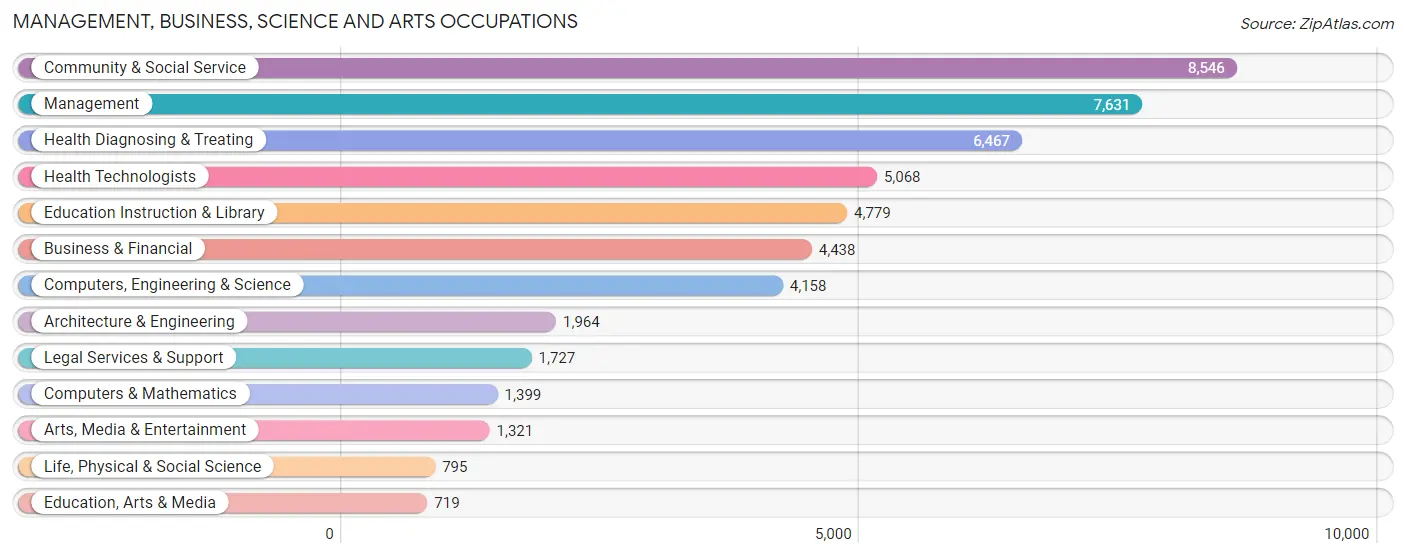
Management, Business, Science and Arts Occupations
The most common Management, Business, Science and Arts occupations in Metairie are Community & Social Service (8,546 | 12.1%), Management (7,631 | 10.8%), Health Diagnosing & Treating (6,467 | 9.2%), Health Technologists (5,068 | 7.2%), and Education Instruction & Library (4,779 | 6.8%).
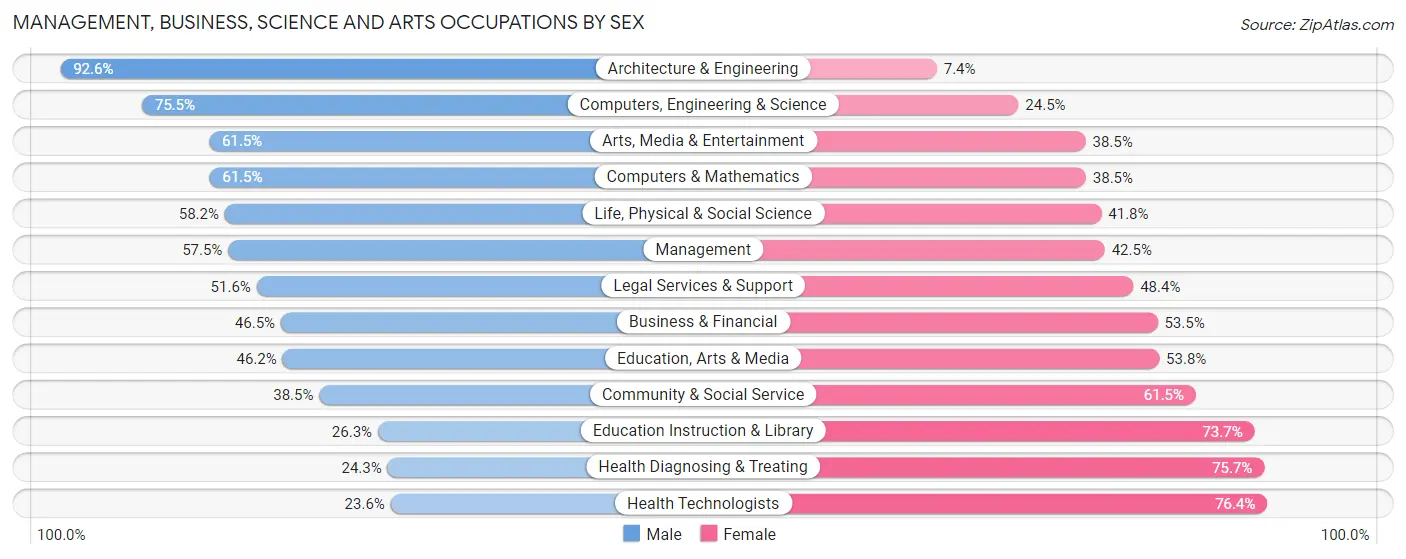
Management, Business, Science and Arts Occupations by Sex
Within the Management, Business, Science and Arts occupations in Metairie, the most male-oriented occupations are Architecture & Engineering (92.6%), Computers, Engineering & Science (75.5%), and Arts, Media & Entertainment (61.5%), while the most female-oriented occupations are Health Technologists (76.4%), Health Diagnosing & Treating (75.7%), and Education Instruction & Library (73.7%).
| Occupation | Male | Female |
| Management | 4,390 (57.5%) | 3,241 (42.5%) |
| Business & Financial | 2,065 (46.5%) | 2,373 (53.5%) |
| Computers, Engineering & Science | 3,141 (75.5%) | 1,017 (24.5%) |
| Computers & Mathematics | 860 (61.5%) | 539 (38.5%) |
| Architecture & Engineering | 1,818 (92.6%) | 146 (7.4%) |
| Life, Physical & Social Science | 463 (58.2%) | 332 (41.8%) |
| Community & Social Service | 3,293 (38.5%) | 5,253 (61.5%) |
| Education, Arts & Media | 332 (46.2%) | 387 (53.8%) |
| Legal Services & Support | 891 (51.6%) | 836 (48.4%) |
| Education Instruction & Library | 1,257 (26.3%) | 3,522 (73.7%) |
| Arts, Media & Entertainment | 813 (61.5%) | 508 (38.5%) |
| Health Diagnosing & Treating | 1,570 (24.3%) | 4,897 (75.7%) |
| Health Technologists | 1,198 (23.6%) | 3,870 (76.4%) |
| Total (Category) | 14,459 (46.3%) | 16,781 (53.7%) |
| Total (Overall) | 36,574 (51.8%) | 33,984 (48.2%) |
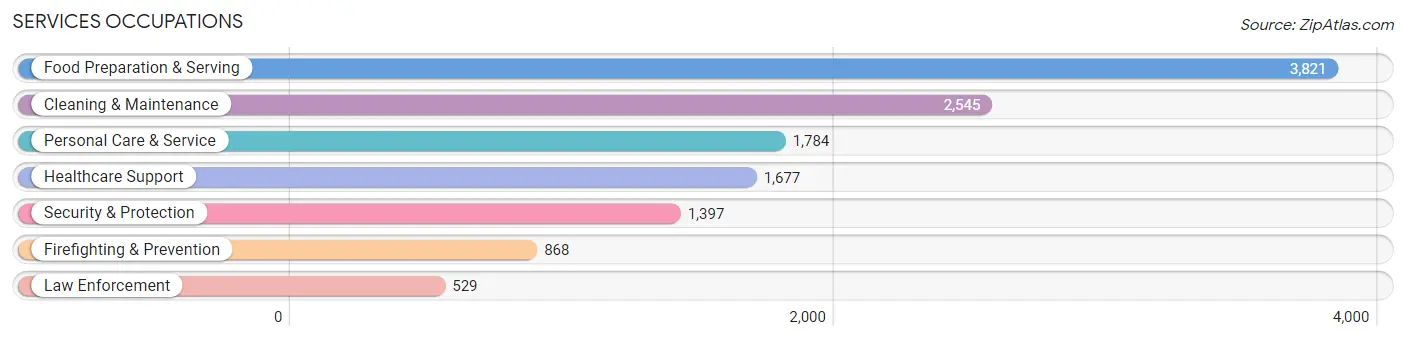
Services Occupations
The most common Services occupations in Metairie are Food Preparation & Serving (3,821 | 5.4%), Cleaning & Maintenance (2,545 | 3.6%), Personal Care & Service (1,784 | 2.5%), Healthcare Support (1,677 | 2.4%), and Security & Protection (1,397 | 2.0%).
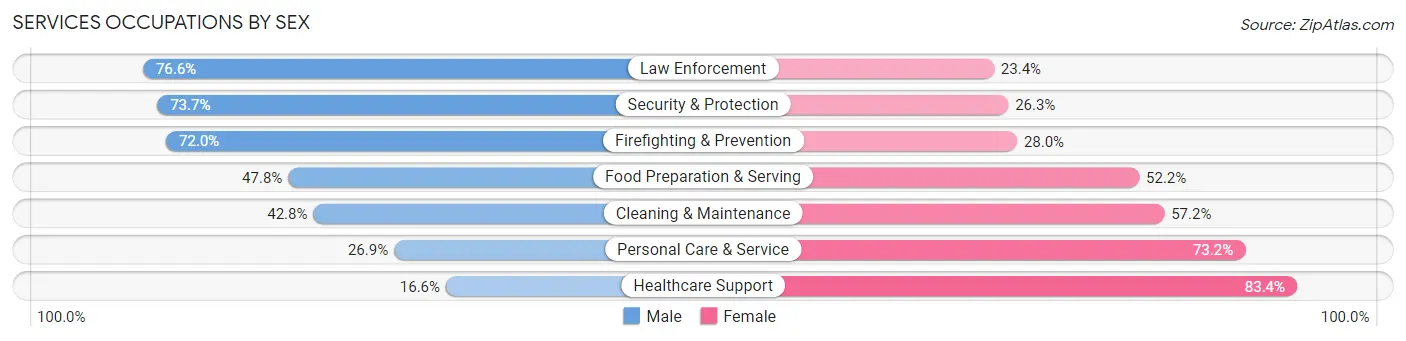
Services Occupations by Sex
Within the Services occupations in Metairie, the most male-oriented occupations are Law Enforcement (76.6%), Security & Protection (73.7%), and Firefighting & Prevention (72.0%), while the most female-oriented occupations are Healthcare Support (83.4%), Personal Care & Service (73.2%), and Cleaning & Maintenance (57.2%).
| Occupation | Male | Female |
| Healthcare Support | 278 (16.6%) | 1,399 (83.4%) |
| Security & Protection | 1,030 (73.7%) | 367 (26.3%) |
| Firefighting & Prevention | 625 (72.0%) | 243 (28.0%) |
| Law Enforcement | 405 (76.6%) | 124 (23.4%) |
| Food Preparation & Serving | 1,827 (47.8%) | 1,994 (52.2%) |
| Cleaning & Maintenance | 1,090 (42.8%) | 1,455 (57.2%) |
| Personal Care & Service | 479 (26.9%) | 1,305 (73.2%) |
| Total (Category) | 4,704 (41.9%) | 6,520 (58.1%) |
| Total (Overall) | 36,574 (51.8%) | 33,984 (48.2%) |
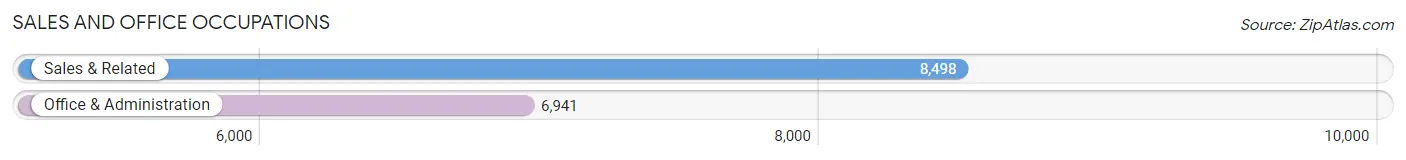
Sales and Office Occupations
The most common Sales and Office occupations in Metairie are Sales & Related (8,498 | 12.0%), and Office & Administration (6,941 | 9.8%).
Sales and Office Occupations by Sex
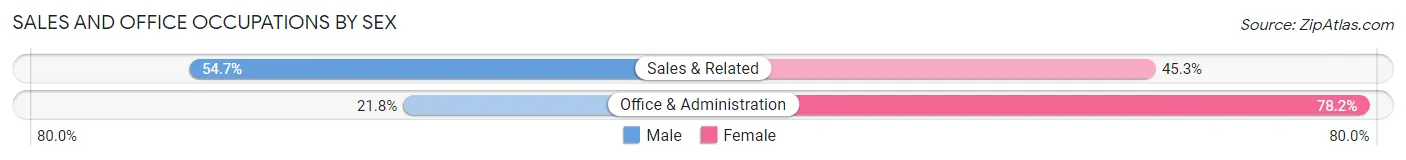
| Occupation | Male | Female |
| Sales & Related | 4,649 (54.7%) | 3,849 (45.3%) |
| Office & Administration | 1,512 (21.8%) | 5,429 (78.2%) |
| Total (Category) | 6,161 (39.9%) | 9,278 (60.1%) |
| Total (Overall) | 36,574 (51.8%) | 33,984 (48.2%) |
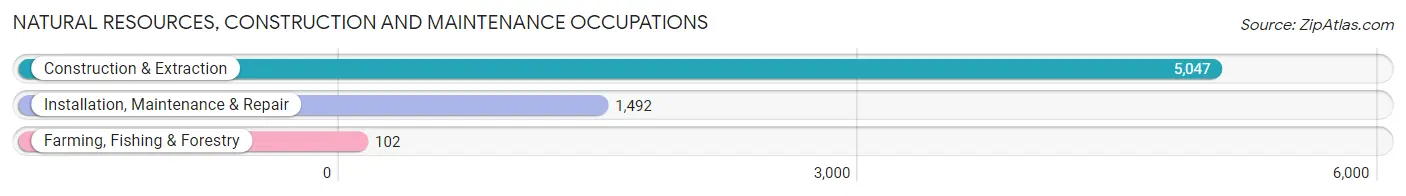
Natural Resources, Construction and Maintenance Occupations
The most common Natural Resources, Construction and Maintenance occupations in Metairie are Construction & Extraction (5,047 | 7.1%), Installation, Maintenance & Repair (1,492 | 2.1%), and Farming, Fishing & Forestry (102 | 0.1%).
Natural Resources, Construction and Maintenance Occupations by Sex
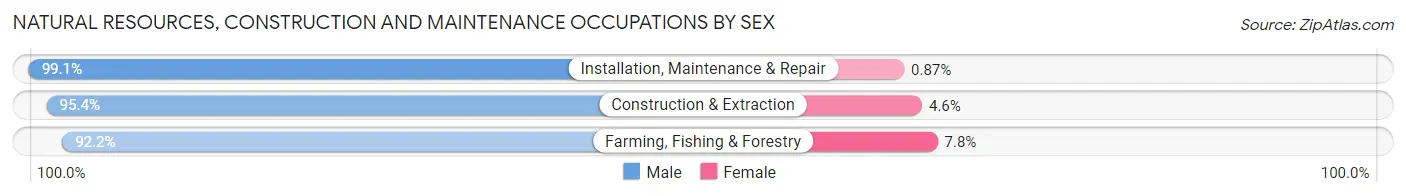
| Occupation | Male | Female |
| Farming, Fishing & Forestry | 94 (92.2%) | 8 (7.8%) |
| Construction & Extraction | 4,815 (95.4%) | 232 (4.6%) |
| Installation, Maintenance & Repair | 1,479 (99.1%) | 13 (0.9%) |
| Total (Category) | 6,388 (96.2%) | 253 (3.8%) |
| Total (Overall) | 36,574 (51.8%) | 33,984 (48.2%) |
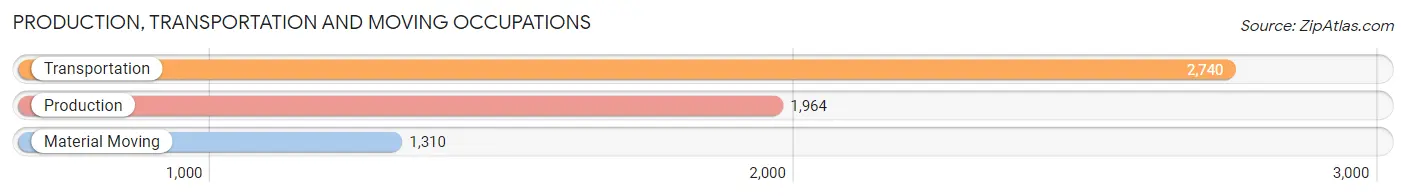
Production, Transportation and Moving Occupations
The most common Production, Transportation and Moving occupations in Metairie are Transportation (2,740 | 3.9%), Production (1,964 | 2.8%), and Material Moving (1,310 | 1.9%).
Production, Transportation and Moving Occupations by Sex
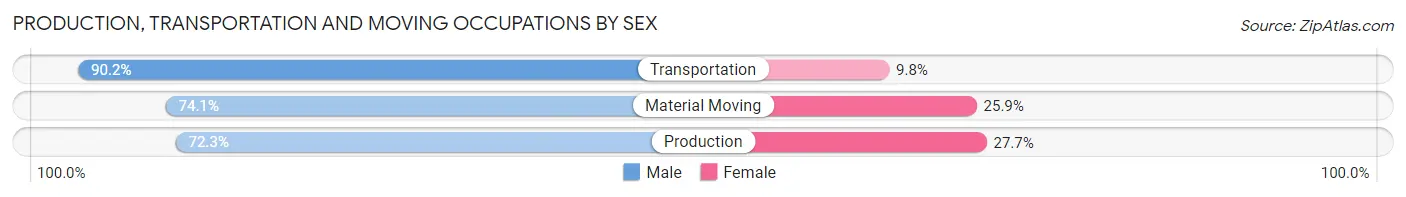
| Occupation | Male | Female |
| Production | 1,420 (72.3%) | 544 (27.7%) |
| Transportation | 2,471 (90.2%) | 269 (9.8%) |
| Material Moving | 971 (74.1%) | 339 (25.9%) |
| Total (Category) | 4,862 (80.8%) | 1,152 (19.2%) |
| Total (Overall) | 36,574 (51.8%) | 33,984 (48.2%) |
Employment Industries by Sex in Metairie
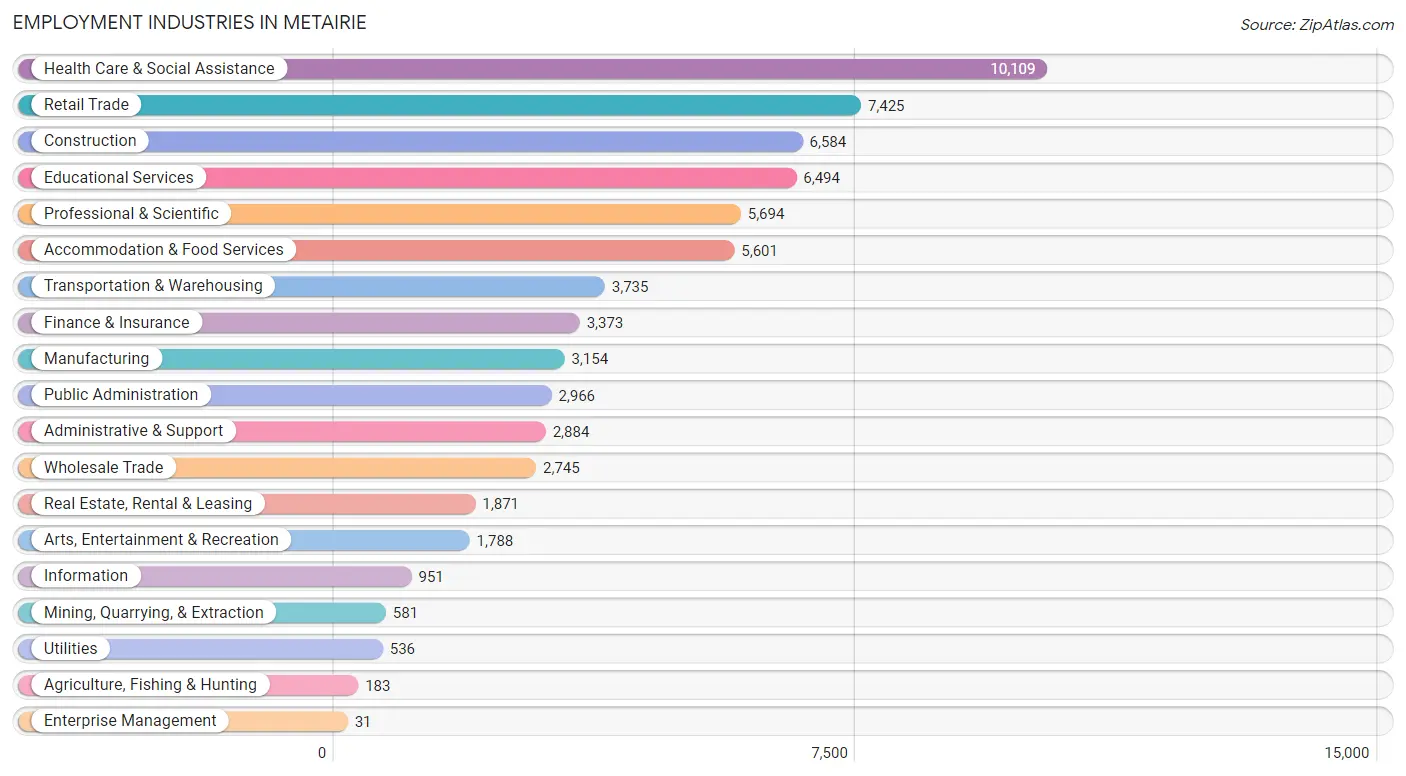
Employment Industries in Metairie
The major employment industries in Metairie include Health Care & Social Assistance (10,109 | 14.3%), Retail Trade (7,425 | 10.5%), Construction (6,584 | 9.3%), Educational Services (6,494 | 9.2%), and Professional & Scientific (5,694 | 8.1%).
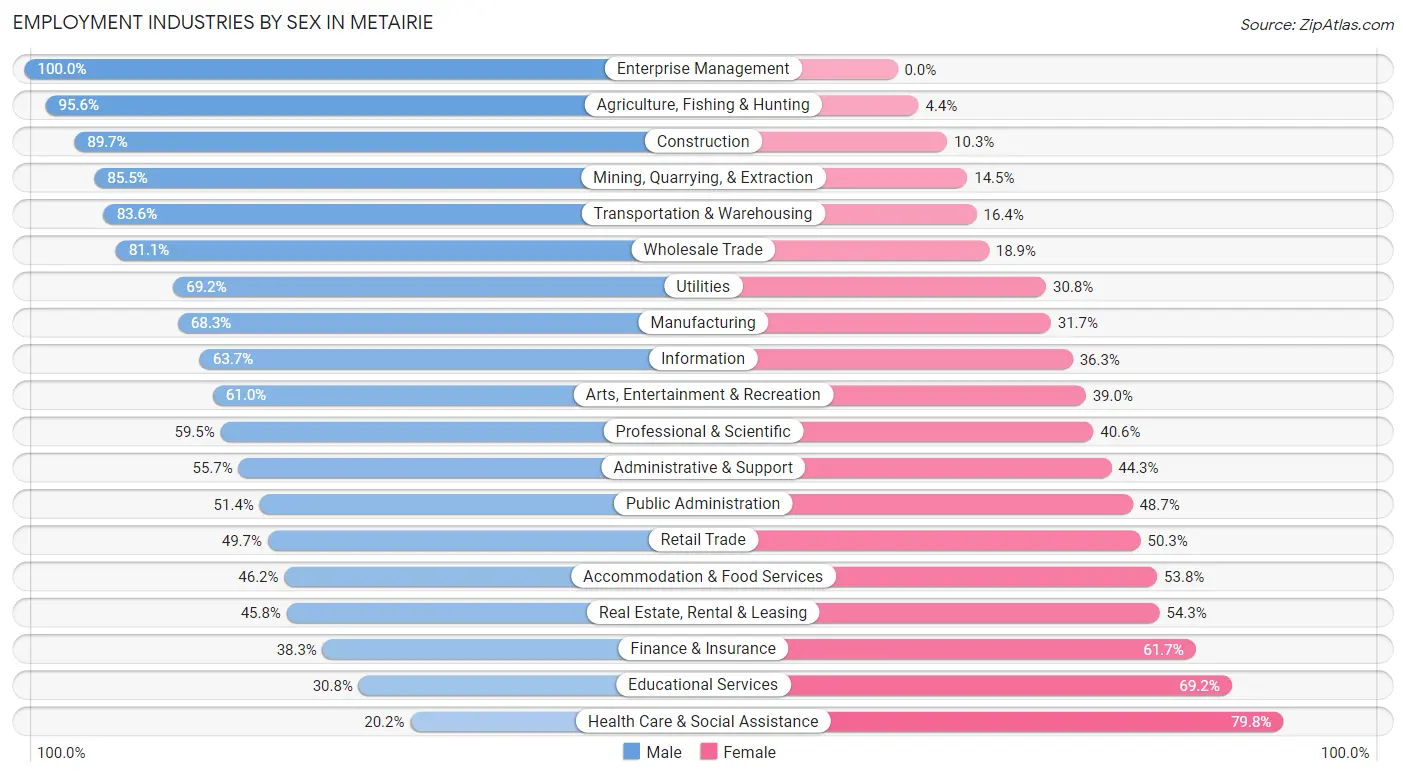
Employment Industries by Sex in Metairie
The Metairie industries that see more men than women are Enterprise Management (100.0%), Agriculture, Fishing & Hunting (95.6%), and Construction (89.7%), whereas the industries that tend to have a higher number of women are Health Care & Social Assistance (79.8%), Educational Services (69.2%), and Finance & Insurance (61.7%).
| Industry | Male | Female |
| Agriculture, Fishing & Hunting | 175 (95.6%) | 8 (4.4%) |
| Mining, Quarrying, & Extraction | 497 (85.5%) | 84 (14.5%) |
| Construction | 5,906 (89.7%) | 678 (10.3%) |
| Manufacturing | 2,153 (68.3%) | 1,001 (31.7%) |
| Wholesale Trade | 2,226 (81.1%) | 519 (18.9%) |
| Retail Trade | 3,687 (49.7%) | 3,738 (50.3%) |
| Transportation & Warehousing | 3,123 (83.6%) | 612 (16.4%) |
| Utilities | 371 (69.2%) | 165 (30.8%) |
| Information | 606 (63.7%) | 345 (36.3%) |
| Finance & Insurance | 1,292 (38.3%) | 2,081 (61.7%) |
| Real Estate, Rental & Leasing | 856 (45.8%) | 1,015 (54.2%) |
| Professional & Scientific | 3,385 (59.5%) | 2,309 (40.6%) |
| Enterprise Management | 31 (100.0%) | 0 (0.0%) |
| Administrative & Support | 1,607 (55.7%) | 1,277 (44.3%) |
| Educational Services | 2,003 (30.8%) | 4,491 (69.2%) |
| Health Care & Social Assistance | 2,038 (20.2%) | 8,071 (79.8%) |
| Arts, Entertainment & Recreation | 1,091 (61.0%) | 697 (39.0%) |
| Accommodation & Food Services | 2,590 (46.2%) | 3,011 (53.8%) |
| Public Administration | 1,523 (51.3%) | 1,443 (48.6%) |
| Total | 36,574 (51.8%) | 33,984 (48.2%) |
Education in Metairie
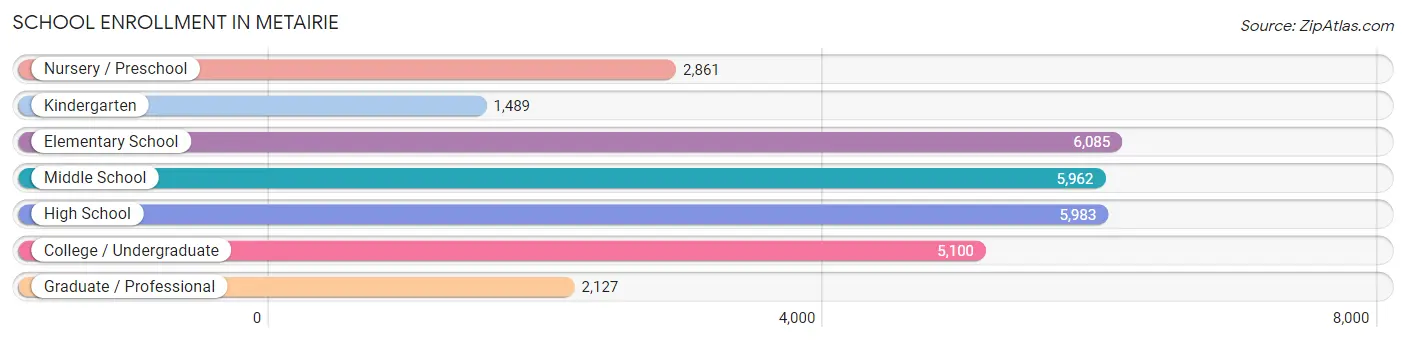
School Enrollment in Metairie
The most common levels of schooling among the 29,607 students in Metairie are elementary school (6,085 | 20.5%), high school (5,983 | 20.2%), and middle school (5,962 | 20.1%).
| School Level | # Students | % Students |
| Nursery / Preschool | 2,861 | 9.7% |
| Kindergarten | 1,489 | 5.0% |
| Elementary School | 6,085 | 20.5% |
| Middle School | 5,962 | 20.1% |
| High School | 5,983 | 20.2% |
| College / Undergraduate | 5,100 | 17.2% |
| Graduate / Professional | 2,127 | 7.2% |
| Total | 29,607 | 100.0% |
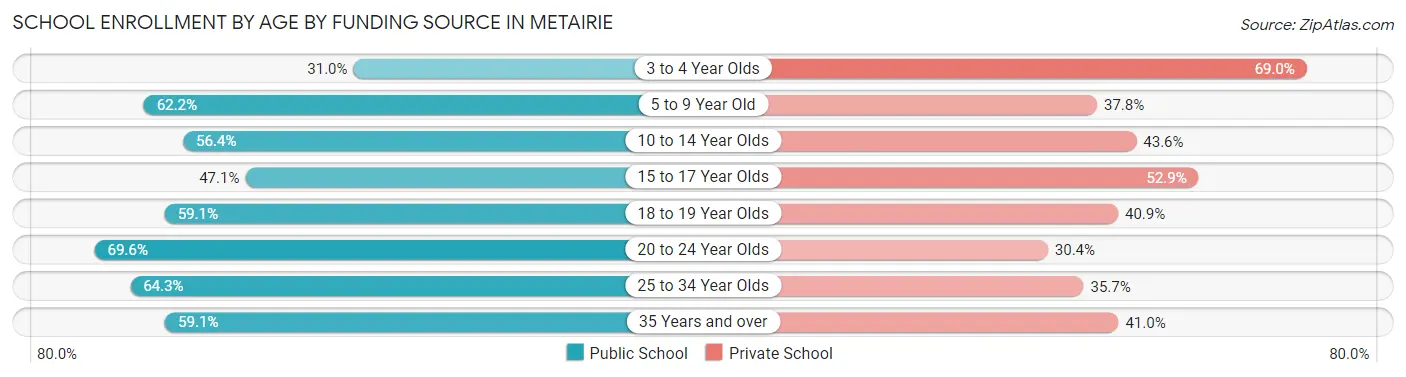
School Enrollment by Age by Funding Source in Metairie
Out of a total of 29,607 students who are enrolled in schools in Metairie, 12,761 (43.1%) attend a private institution, while the remaining 16,846 (56.9%) are enrolled in public schools. The age group of 3 to 4 year olds has the highest likelihood of being enrolled in private schools, with 1,484 (69.0% in the age bracket) enrolled. Conversely, the age group of 20 to 24 year olds has the lowest likelihood of being enrolled in a private school, with 1,859 (69.6% in the age bracket) attending a public institution.
| Age Bracket | Public School | Private School |
| 3 to 4 Year Olds | 667 (31.0%) | 1,484 (69.0%) |
| 5 to 9 Year Old | 4,782 (62.2%) | 2,901 (37.8%) |
| 10 to 14 Year Olds | 4,094 (56.4%) | 3,166 (43.6%) |
| 15 to 17 Year Olds | 1,964 (47.1%) | 2,204 (52.9%) |
| 18 to 19 Year Olds | 1,048 (59.1%) | 725 (40.9%) |
| 20 to 24 Year Olds | 1,859 (69.6%) | 813 (30.4%) |
| 25 to 34 Year Olds | 1,519 (64.3%) | 845 (35.7%) |
| 35 Years and over | 907 (59.1%) | 629 (40.9%) |
| Total | 16,846 (56.9%) | 12,761 (43.1%) |
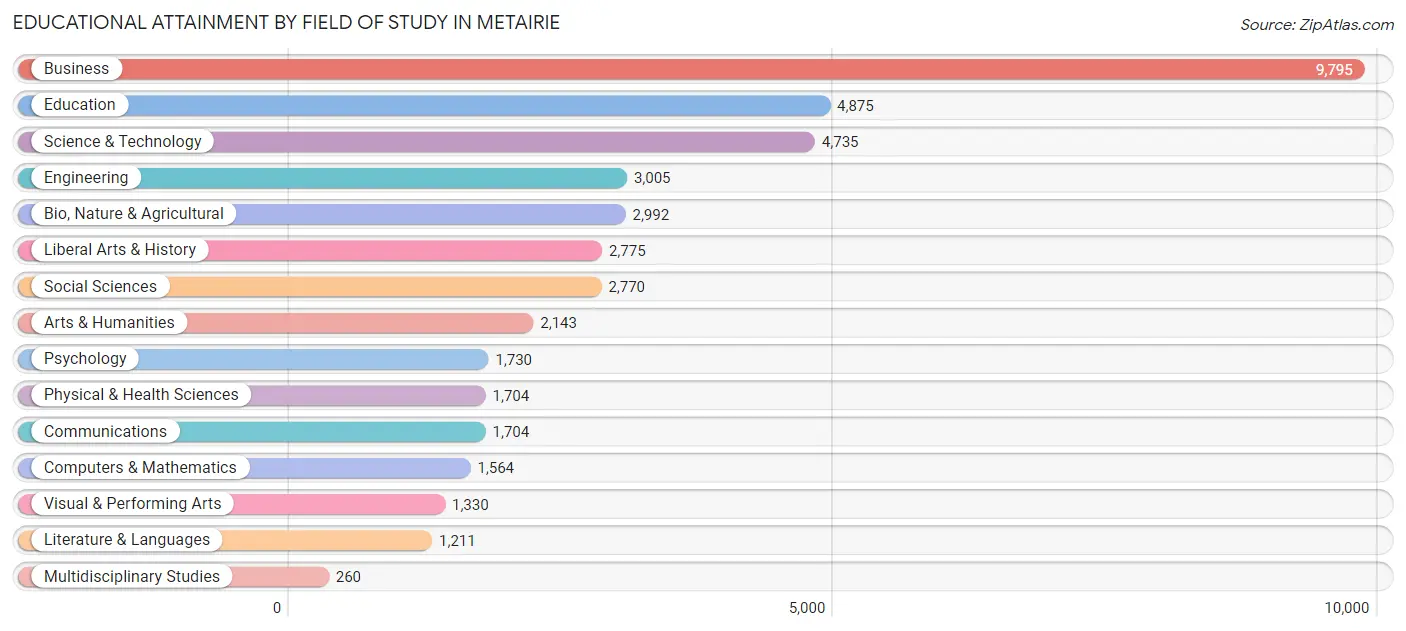
Educational Attainment by Field of Study in Metairie
Business (9,795 | 23.0%), education (4,875 | 11.5%), science & technology (4,735 | 11.1%), engineering (3,005 | 7.1%), and bio, nature & agricultural (2,992 | 7.0%) are the most common fields of study among 42,593 individuals in Metairie who have obtained a bachelor's degree or higher.
| Field of Study | # Graduates | % Graduates |
| Computers & Mathematics | 1,564 | 3.7% |
| Bio, Nature & Agricultural | 2,992 | 7.0% |
| Physical & Health Sciences | 1,704 | 4.0% |
| Psychology | 1,730 | 4.1% |
| Social Sciences | 2,770 | 6.5% |
| Engineering | 3,005 | 7.1% |
| Multidisciplinary Studies | 260 | 0.6% |
| Science & Technology | 4,735 | 11.1% |
| Business | 9,795 | 23.0% |
| Education | 4,875 | 11.5% |
| Literature & Languages | 1,211 | 2.8% |
| Liberal Arts & History | 2,775 | 6.5% |
| Visual & Performing Arts | 1,330 | 3.1% |
| Communications | 1,704 | 4.0% |
| Arts & Humanities | 2,143 | 5.0% |
| Total | 42,593 | 100.0% |
Transportation & Commute in Metairie
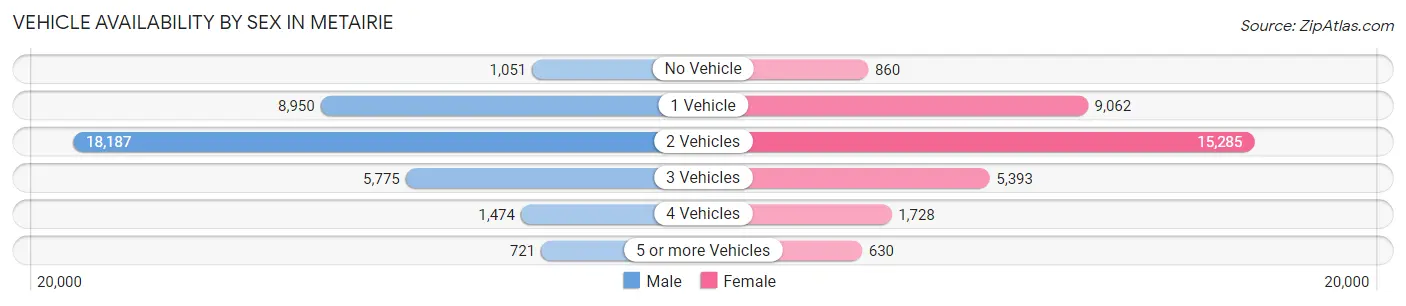
Vehicle Availability by Sex in Metairie
The most prevalent vehicle ownership categories in Metairie are males with 2 vehicles (18,187, accounting for 50.3%) and females with 2 vehicles (15,285, making up 55.2%).
| Vehicles Available | Male | Female |
| No Vehicle | 1,051 (2.9%) | 860 (2.6%) |
| 1 Vehicle | 8,950 (24.7%) | 9,062 (27.5%) |
| 2 Vehicles | 18,187 (50.3%) | 15,285 (46.4%) |
| 3 Vehicles | 5,775 (16.0%) | 5,393 (16.4%) |
| 4 Vehicles | 1,474 (4.1%) | 1,728 (5.2%) |
| 5 or more Vehicles | 721 (2.0%) | 630 (1.9%) |
| Total | 36,158 (100.0%) | 32,958 (100.0%) |
Commute Time in Metairie
The most frequently occuring commute durations in Metairie are 15 to 19 minutes (14,710 commuters, 23.2%), 20 to 24 minutes (11,301 commuters, 17.8%), and 10 to 14 minutes (10,541 commuters, 16.6%).
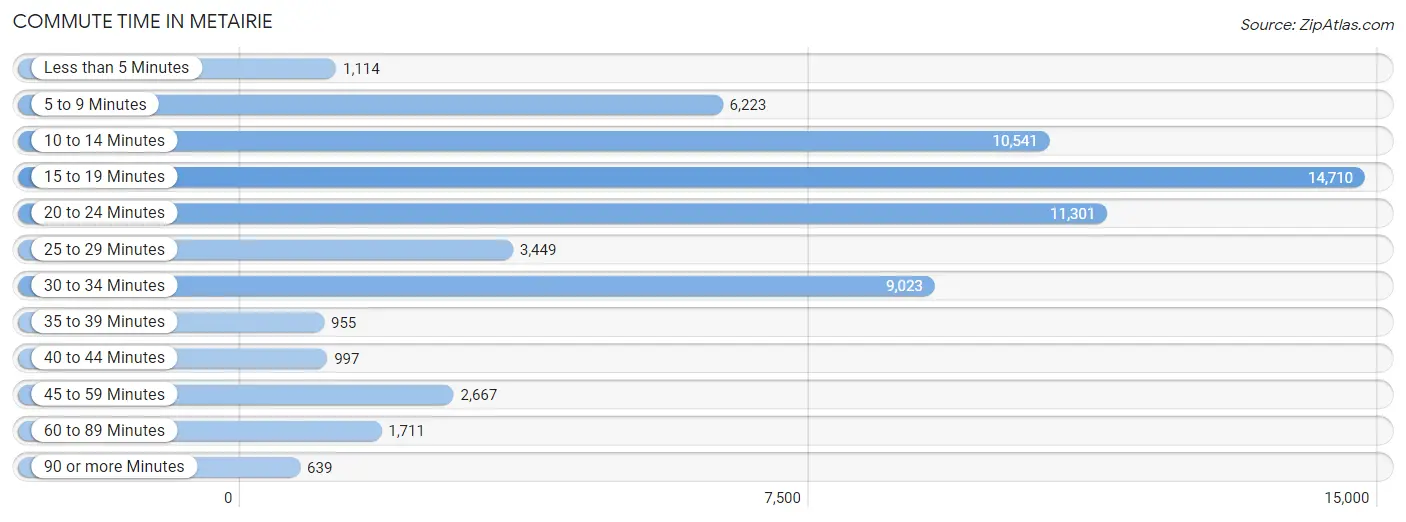
| Commute Time | # Commuters | % Commuters |
| Less than 5 Minutes | 1,114 | 1.8% |
| 5 to 9 Minutes | 6,223 | 9.8% |
| 10 to 14 Minutes | 10,541 | 16.6% |
| 15 to 19 Minutes | 14,710 | 23.2% |
| 20 to 24 Minutes | 11,301 | 17.8% |
| 25 to 29 Minutes | 3,449 | 5.4% |
| 30 to 34 Minutes | 9,023 | 14.2% |
| 35 to 39 Minutes | 955 | 1.5% |
| 40 to 44 Minutes | 997 | 1.6% |
| 45 to 59 Minutes | 2,667 | 4.2% |
| 60 to 89 Minutes | 1,711 | 2.7% |
| 90 or more Minutes | 639 | 1.0% |
Commute Time by Sex in Metairie
The most common commute times in Metairie are 15 to 19 minutes (7,495 commuters, 22.2%) for males and 15 to 19 minutes (7,215 commuters, 24.4%) for females.
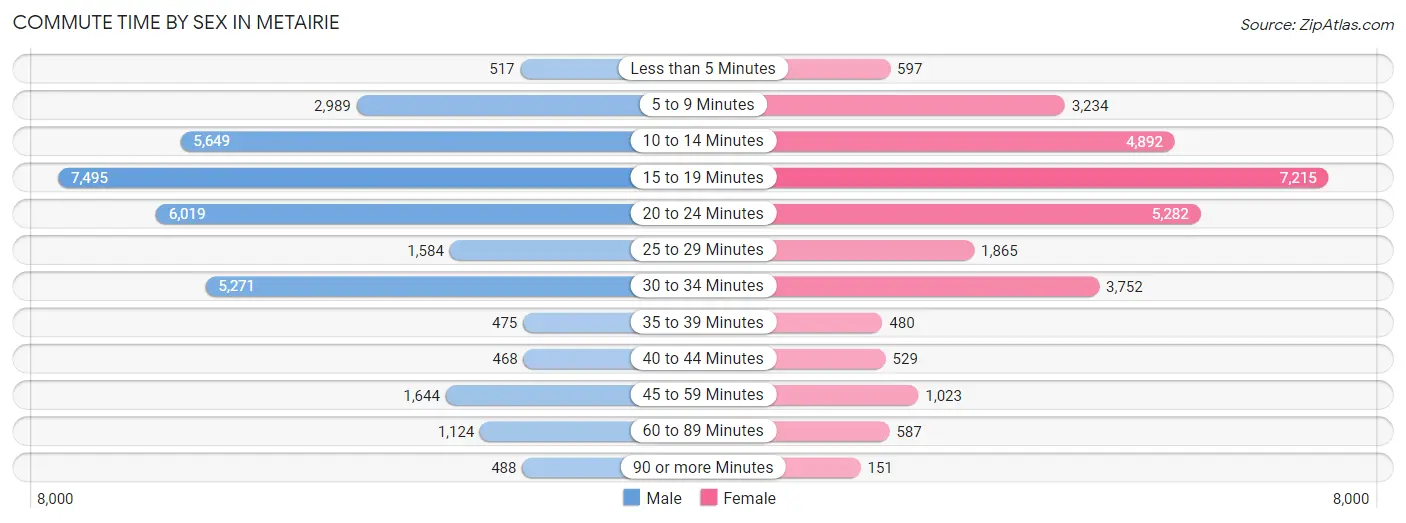
| Commute Time | Male | Female |
| Less than 5 Minutes | 517 (1.5%) | 597 (2.0%) |
| 5 to 9 Minutes | 2,989 (8.9%) | 3,234 (10.9%) |
| 10 to 14 Minutes | 5,649 (16.8%) | 4,892 (16.5%) |
| 15 to 19 Minutes | 7,495 (22.2%) | 7,215 (24.4%) |
| 20 to 24 Minutes | 6,019 (17.8%) | 5,282 (17.8%) |
| 25 to 29 Minutes | 1,584 (4.7%) | 1,865 (6.3%) |
| 30 to 34 Minutes | 5,271 (15.6%) | 3,752 (12.7%) |
| 35 to 39 Minutes | 475 (1.4%) | 480 (1.6%) |
| 40 to 44 Minutes | 468 (1.4%) | 529 (1.8%) |
| 45 to 59 Minutes | 1,644 (4.9%) | 1,023 (3.5%) |
| 60 to 89 Minutes | 1,124 (3.3%) | 587 (2.0%) |
| 90 or more Minutes | 488 (1.5%) | 151 (0.5%) |
Time of Departure to Work by Sex in Metairie
The most frequent times of departure to work in Metairie are 6:30 AM to 6:59 AM (4,980, 14.8%) for males and 7:30 AM to 7:59 AM (5,163, 17.4%) for females.
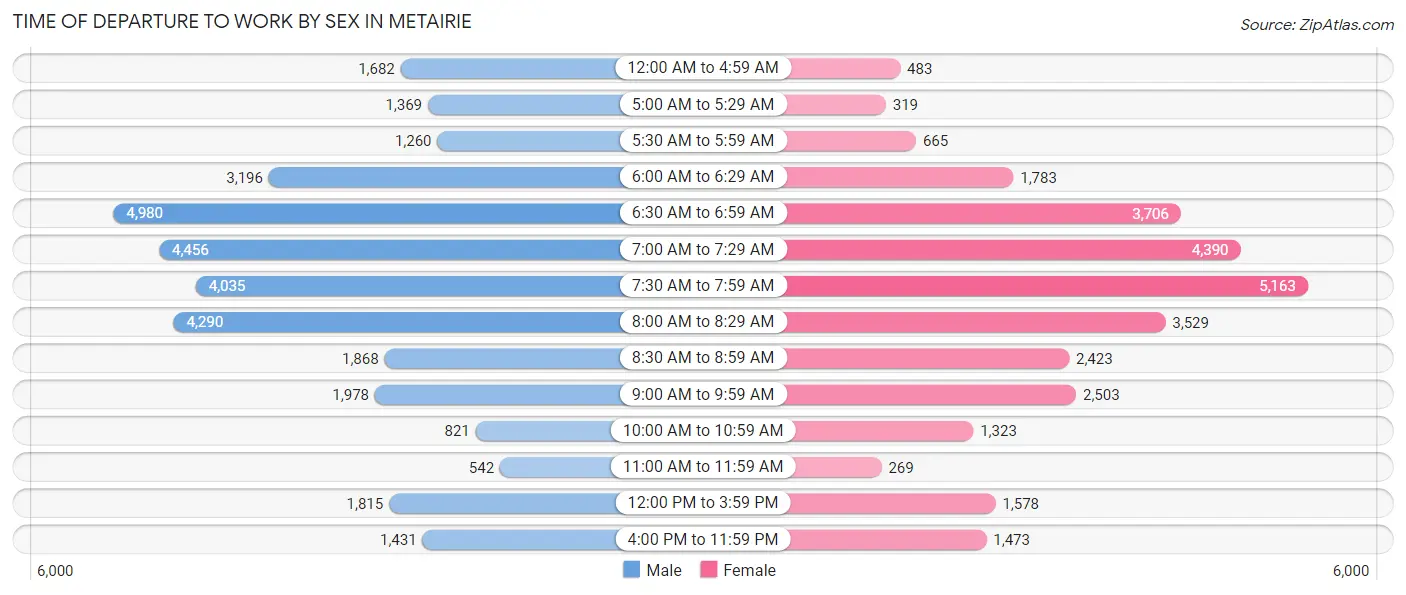
| Time of Departure | Male | Female |
| 12:00 AM to 4:59 AM | 1,682 (5.0%) | 483 (1.6%) |
| 5:00 AM to 5:29 AM | 1,369 (4.1%) | 319 (1.1%) |
| 5:30 AM to 5:59 AM | 1,260 (3.7%) | 665 (2.2%) |
| 6:00 AM to 6:29 AM | 3,196 (9.5%) | 1,783 (6.0%) |
| 6:30 AM to 6:59 AM | 4,980 (14.8%) | 3,706 (12.5%) |
| 7:00 AM to 7:29 AM | 4,456 (13.2%) | 4,390 (14.8%) |
| 7:30 AM to 7:59 AM | 4,035 (12.0%) | 5,163 (17.4%) |
| 8:00 AM to 8:29 AM | 4,290 (12.7%) | 3,529 (11.9%) |
| 8:30 AM to 8:59 AM | 1,868 (5.5%) | 2,423 (8.2%) |
| 9:00 AM to 9:59 AM | 1,978 (5.9%) | 2,503 (8.5%) |
| 10:00 AM to 10:59 AM | 821 (2.4%) | 1,323 (4.5%) |
| 11:00 AM to 11:59 AM | 542 (1.6%) | 269 (0.9%) |
| 12:00 PM to 3:59 PM | 1,815 (5.4%) | 1,578 (5.3%) |
| 4:00 PM to 11:59 PM | 1,431 (4.2%) | 1,473 (5.0%) |
| Total | 33,723 (100.0%) | 29,607 (100.0%) |
Housing Occupancy in Metairie
Occupancy by Ownership in Metairie
Of the total 60,634 dwellings in Metairie, owner-occupied units account for 38,079 (62.8%), while renter-occupied units make up 22,555 (37.2%).
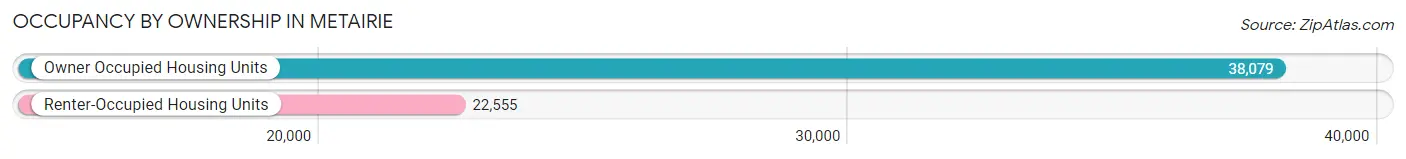
| Occupancy | # Housing Units | % Housing Units |
| Owner Occupied Housing Units | 38,079 | 62.8% |
| Renter-Occupied Housing Units | 22,555 | 37.2% |
| Total Occupied Housing Units | 60,634 | 100.0% |
Occupancy by Household Size in Metairie
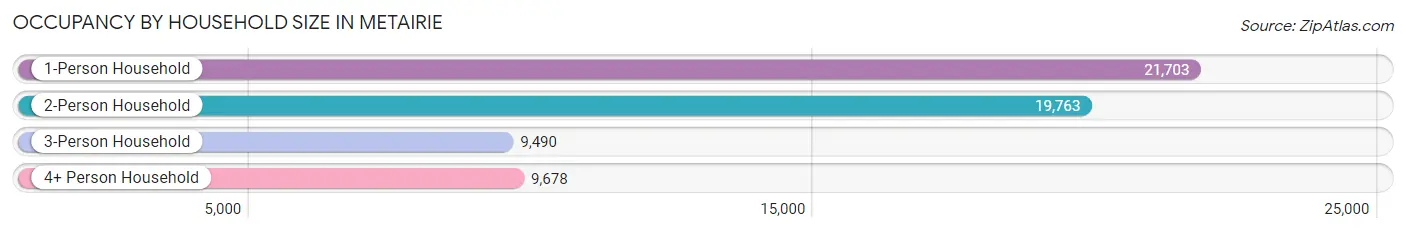
| Household Size | # Housing Units | % Housing Units |
| 1-Person Household | 21,703 | 35.8% |
| 2-Person Household | 19,763 | 32.6% |
| 3-Person Household | 9,490 | 15.7% |
| 4+ Person Household | 9,678 | 16.0% |
| Total Housing Units | 60,634 | 100.0% |
Occupancy by Ownership by Household Size in Metairie
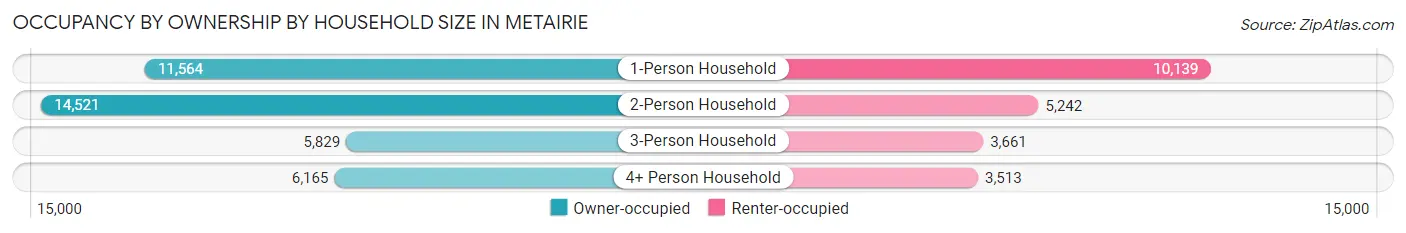
| Household Size | Owner-occupied | Renter-occupied |
| 1-Person Household | 11,564 (53.3%) | 10,139 (46.7%) |
| 2-Person Household | 14,521 (73.5%) | 5,242 (26.5%) |
| 3-Person Household | 5,829 (61.4%) | 3,661 (38.6%) |
| 4+ Person Household | 6,165 (63.7%) | 3,513 (36.3%) |
| Total Housing Units | 38,079 (62.8%) | 22,555 (37.2%) |
Occupancy by Educational Attainment in Metairie
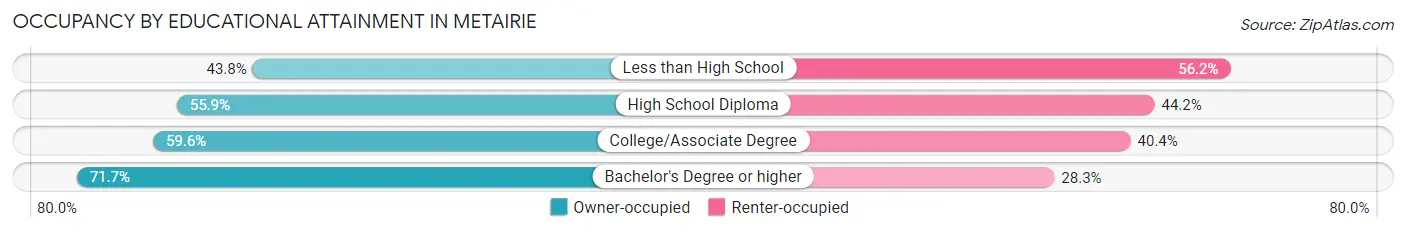
| Household Size | Owner-occupied | Renter-occupied |
| Less than High School | 1,599 (43.8%) | 2,048 (56.2%) |
| High School Diploma | 7,897 (55.8%) | 6,243 (44.2%) |
| College/Associate Degree | 10,611 (59.6%) | 7,182 (40.4%) |
| Bachelor's Degree or higher | 17,972 (71.7%) | 7,082 (28.3%) |
Occupancy by Age of Householder in Metairie
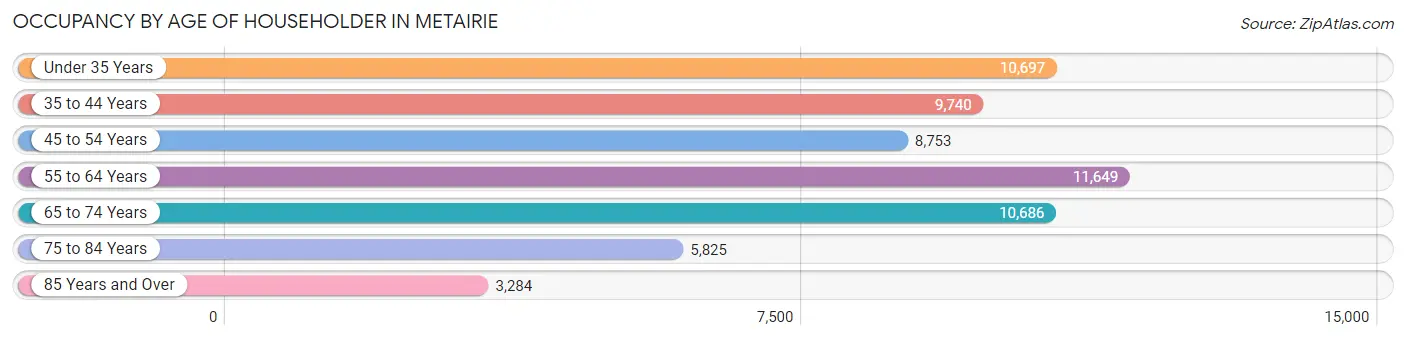
| Age Bracket | # Households | % Households |
| Under 35 Years | 10,697 | 17.6% |
| 35 to 44 Years | 9,740 | 16.1% |
| 45 to 54 Years | 8,753 | 14.4% |
| 55 to 64 Years | 11,649 | 19.2% |
| 65 to 74 Years | 10,686 | 17.6% |
| 75 to 84 Years | 5,825 | 9.6% |
| 85 Years and Over | 3,284 | 5.4% |
| Total | 60,634 | 100.0% |
Housing Finances in Metairie
Median Income by Occupancy in Metairie
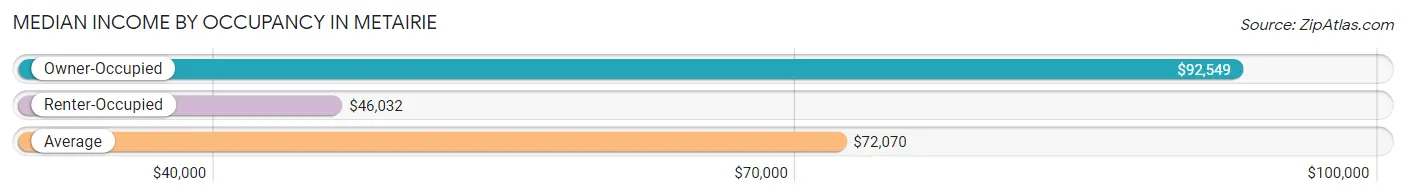
| Occupancy Type | # Households | Median Income |
| Owner-Occupied | 38,079 (62.8%) | $92,549 |
| Renter-Occupied | 22,555 (37.2%) | $46,032 |
| Average | 60,634 (100.0%) | $72,070 |
Occupancy by Householder Income Bracket in Metairie
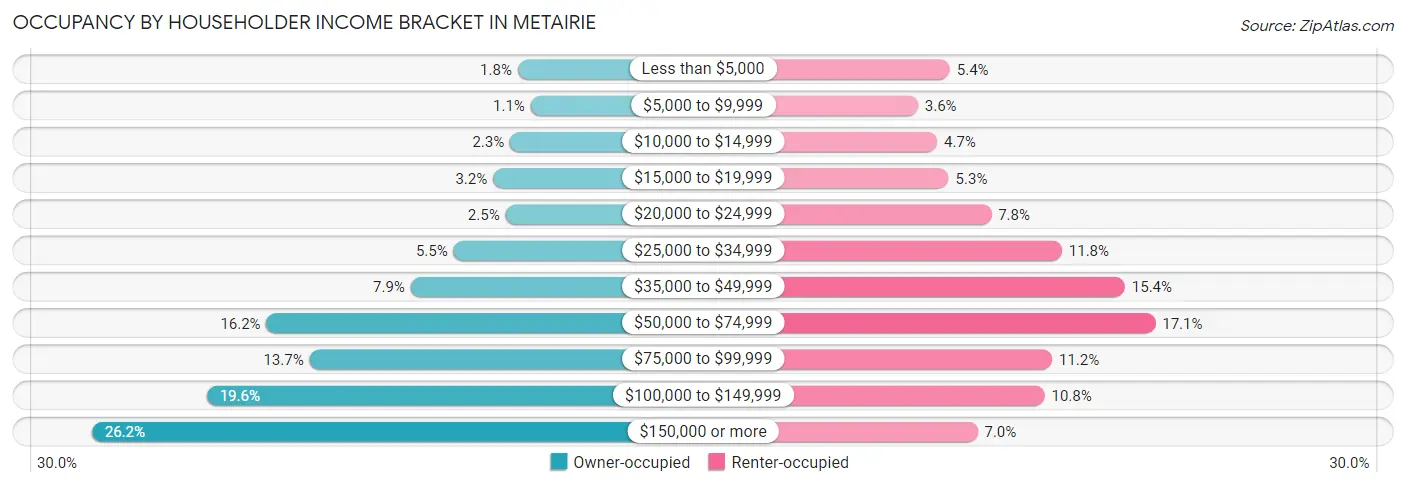
| Income Bracket | Owner-occupied | Renter-occupied |
| Less than $5,000 | 694 (1.8%) | 1,216 (5.4%) |
| $5,000 to $9,999 | 411 (1.1%) | 804 (3.6%) |
| $10,000 to $14,999 | 859 (2.3%) | 1,052 (4.7%) |
| $15,000 to $19,999 | 1,229 (3.2%) | 1,199 (5.3%) |
| $20,000 to $24,999 | 961 (2.5%) | 1,748 (7.7%) |
| $25,000 to $34,999 | 2,092 (5.5%) | 2,660 (11.8%) |
| $35,000 to $49,999 | 3,022 (7.9%) | 3,472 (15.4%) |
| $50,000 to $74,999 | 6,163 (16.2%) | 3,864 (17.1%) |
| $75,000 to $99,999 | 5,225 (13.7%) | 2,533 (11.2%) |
| $100,000 to $149,999 | 7,461 (19.6%) | 2,436 (10.8%) |
| $150,000 or more | 9,962 (26.2%) | 1,571 (7.0%) |
| Total | 38,079 (100.0%) | 22,555 (100.0%) |
Monthly Housing Cost Tiers in Metairie
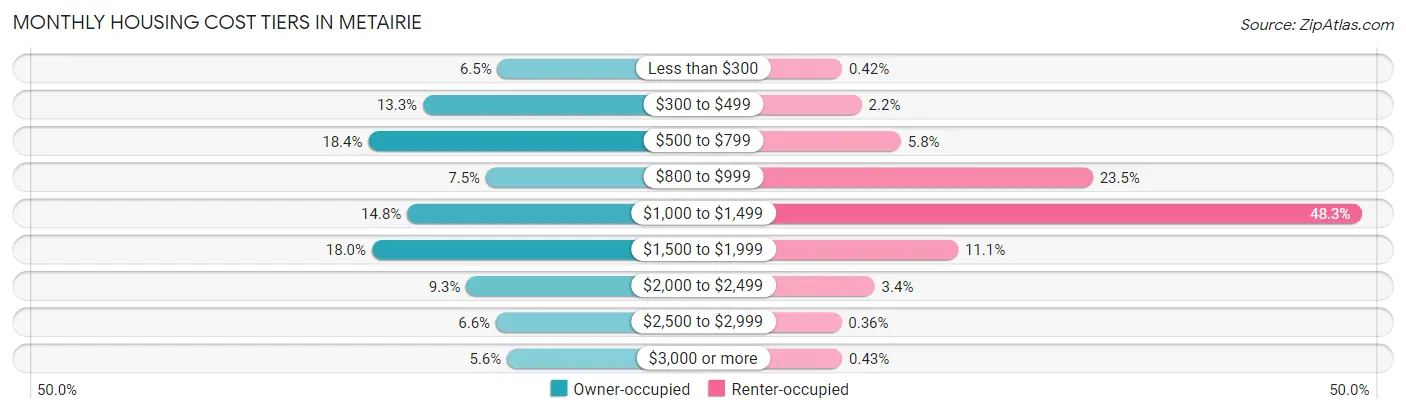
| Monthly Cost | Owner-occupied | Renter-occupied |
| Less than $300 | 2,461 (6.5%) | 94 (0.4%) |
| $300 to $499 | 5,077 (13.3%) | 502 (2.2%) |
| $500 to $799 | 6,990 (18.4%) | 1,317 (5.8%) |
| $800 to $999 | 2,867 (7.5%) | 5,300 (23.5%) |
| $1,000 to $1,499 | 5,629 (14.8%) | 10,898 (48.3%) |
| $1,500 to $1,999 | 6,864 (18.0%) | 2,503 (11.1%) |
| $2,000 to $2,499 | 3,551 (9.3%) | 773 (3.4%) |
| $2,500 to $2,999 | 2,516 (6.6%) | 82 (0.4%) |
| $3,000 or more | 2,124 (5.6%) | 96 (0.4%) |
| Total | 38,079 (100.0%) | 22,555 (100.0%) |
Physical Housing Characteristics in Metairie
Housing Structures in Metairie
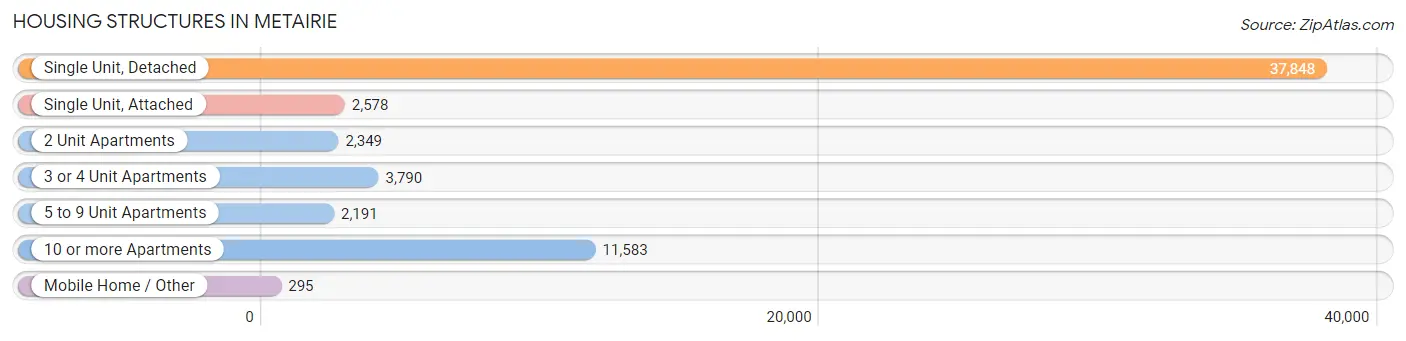
| Structure Type | # Housing Units | % Housing Units |
| Single Unit, Detached | 37,848 | 62.4% |
| Single Unit, Attached | 2,578 | 4.3% |
| 2 Unit Apartments | 2,349 | 3.9% |
| 3 or 4 Unit Apartments | 3,790 | 6.2% |
| 5 to 9 Unit Apartments | 2,191 | 3.6% |
| 10 or more Apartments | 11,583 | 19.1% |
| Mobile Home / Other | 295 | 0.5% |
| Total | 60,634 | 100.0% |
Housing Structures by Occupancy in Metairie
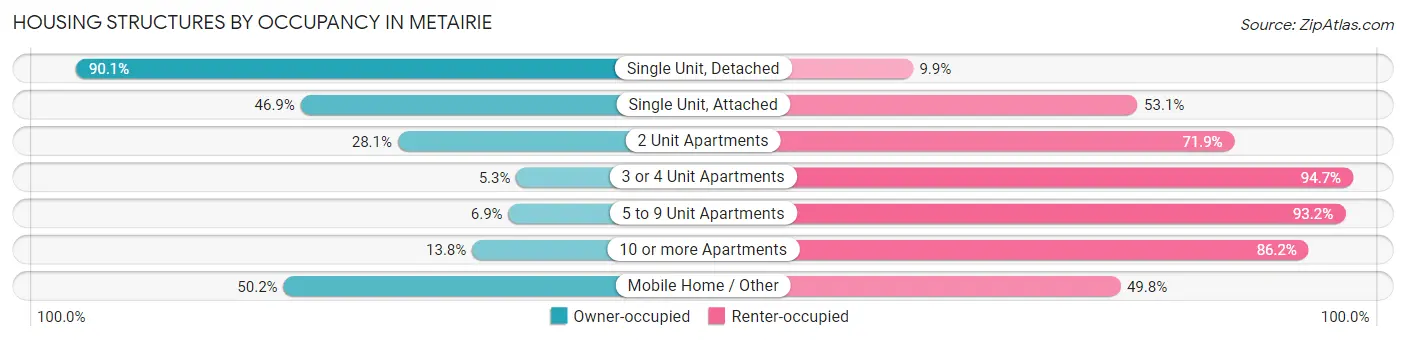
| Structure Type | Owner-occupied | Renter-occupied |
| Single Unit, Detached | 34,107 (90.1%) | 3,741 (9.9%) |
| Single Unit, Attached | 1,208 (46.9%) | 1,370 (53.1%) |
| 2 Unit Apartments | 661 (28.1%) | 1,688 (71.9%) |
| 3 or 4 Unit Apartments | 202 (5.3%) | 3,588 (94.7%) |
| 5 to 9 Unit Apartments | 150 (6.9%) | 2,041 (93.1%) |
| 10 or more Apartments | 1,603 (13.8%) | 9,980 (86.2%) |
| Mobile Home / Other | 148 (50.2%) | 147 (49.8%) |
| Total | 38,079 (62.8%) | 22,555 (37.2%) |
Housing Structures by Number of Rooms in Metairie
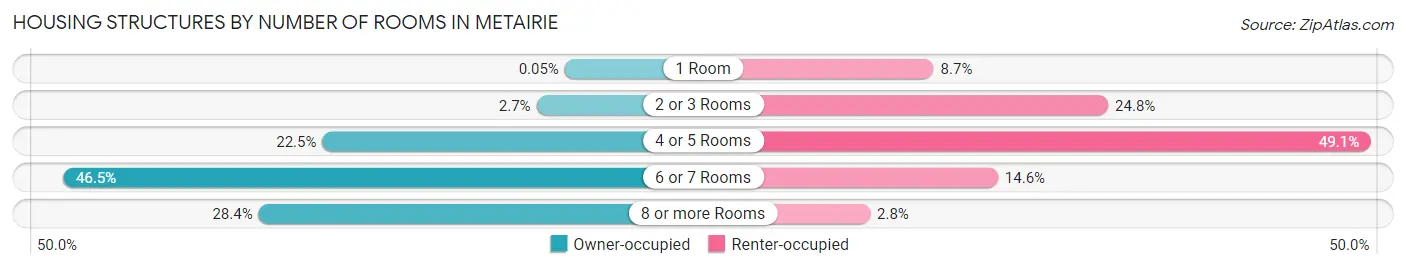
| Number of Rooms | Owner-occupied | Renter-occupied |
| 1 Room | 20 (0.1%) | 1,956 (8.7%) |
| 2 or 3 Rooms | 1,012 (2.7%) | 5,596 (24.8%) |
| 4 or 5 Rooms | 8,557 (22.5%) | 11,078 (49.1%) |
| 6 or 7 Rooms | 17,688 (46.5%) | 3,295 (14.6%) |
| 8 or more Rooms | 10,802 (28.4%) | 630 (2.8%) |
| Total | 38,079 (100.0%) | 22,555 (100.0%) |
Housing Structure by Heating Type in Metairie
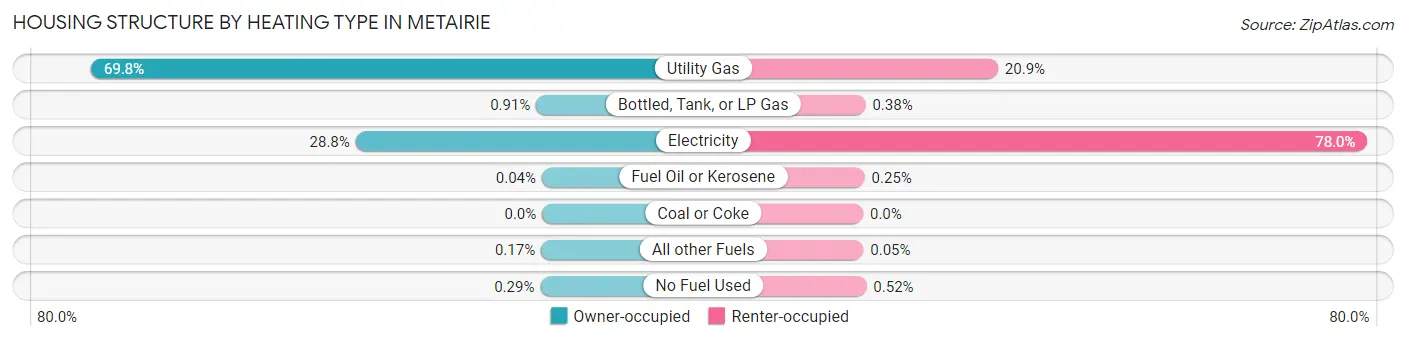
| Heating Type | Owner-occupied | Renter-occupied |
| Utility Gas | 26,560 (69.8%) | 4,702 (20.8%) |
| Bottled, Tank, or LP Gas | 348 (0.9%) | 86 (0.4%) |
| Electricity | 10,980 (28.8%) | 17,582 (77.9%) |
| Fuel Oil or Kerosene | 16 (0.0%) | 56 (0.3%) |
| Coal or Coke | 0 (0.0%) | 0 (0.0%) |
| All other Fuels | 65 (0.2%) | 12 (0.1%) |
| No Fuel Used | 110 (0.3%) | 117 (0.5%) |
| Total | 38,079 (100.0%) | 22,555 (100.0%) |
Household Vehicle Usage in Metairie
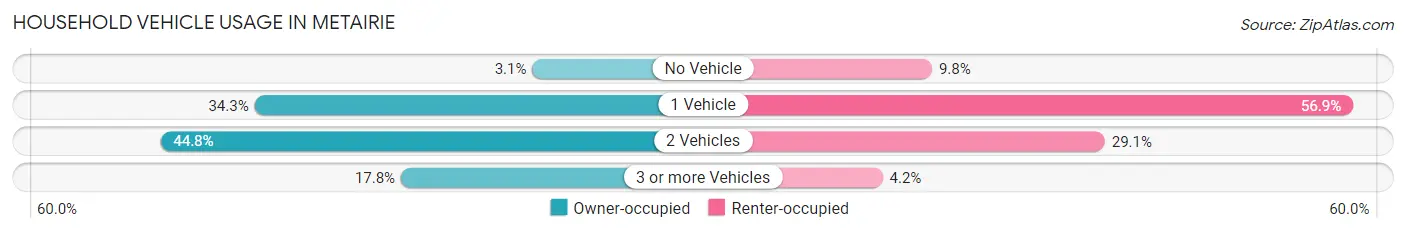
| Vehicles per Household | Owner-occupied | Renter-occupied |
| No Vehicle | 1,191 (3.1%) | 2,198 (9.8%) |
| 1 Vehicle | 13,041 (34.3%) | 12,839 (56.9%) |
| 2 Vehicles | 17,054 (44.8%) | 6,566 (29.1%) |
| 3 or more Vehicles | 6,793 (17.8%) | 952 (4.2%) |
| Total | 38,079 (100.0%) | 22,555 (100.0%) |
Real Estate & Mortgages in Metairie
Real Estate and Mortgage Overview in Metairie
| Characteristic | Without Mortgage | With Mortgage |
| Housing Units | 18,314 | 19,765 |
| Median Property Value | $273,900 | $302,300 |
| Median Household Income | $71,342 | $6,361 |
| Monthly Housing Costs | $575 | $2,084 |
| Real Estate Taxes | $1,244 | $703 |
Property Value by Mortgage Status in Metairie
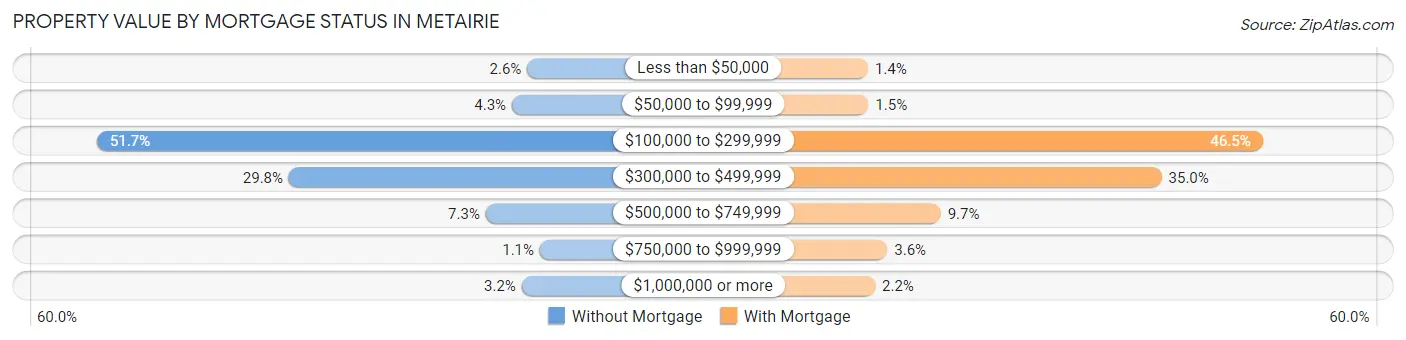
| Property Value | Without Mortgage | With Mortgage |
| Less than $50,000 | 468 (2.6%) | 283 (1.4%) |
| $50,000 to $99,999 | 789 (4.3%) | 291 (1.5%) |
| $100,000 to $299,999 | 9,475 (51.7%) | 9,194 (46.5%) |
| $300,000 to $499,999 | 5,458 (29.8%) | 6,914 (35.0%) |
| $500,000 to $749,999 | 1,337 (7.3%) | 1,924 (9.7%) |
| $750,000 to $999,999 | 203 (1.1%) | 718 (3.6%) |
| $1,000,000 or more | 584 (3.2%) | 441 (2.2%) |
| Total | 18,314 (100.0%) | 19,765 (100.0%) |
Household Income by Mortgage Status in Metairie
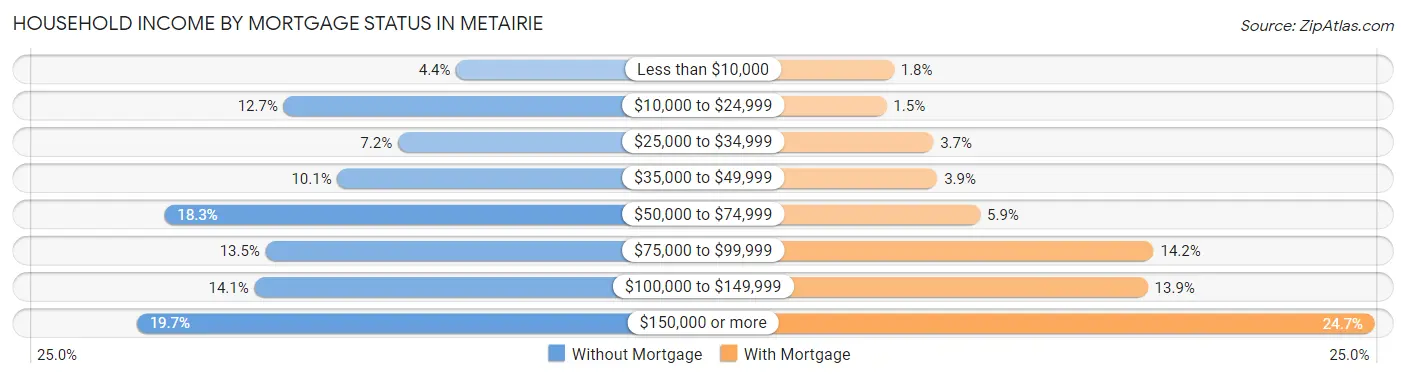
| Household Income | Without Mortgage | With Mortgage |
| Less than $10,000 | 814 (4.4%) | 359 (1.8%) |
| $10,000 to $24,999 | 2,318 (12.7%) | 291 (1.5%) |
| $25,000 to $34,999 | 1,323 (7.2%) | 731 (3.7%) |
| $35,000 to $49,999 | 1,850 (10.1%) | 769 (3.9%) |
| $50,000 to $74,999 | 3,358 (18.3%) | 1,172 (5.9%) |
| $75,000 to $99,999 | 2,476 (13.5%) | 2,805 (14.2%) |
| $100,000 to $149,999 | 2,574 (14.1%) | 2,749 (13.9%) |
| $150,000 or more | 3,601 (19.7%) | 4,887 (24.7%) |
| Total | 18,314 (100.0%) | 19,765 (100.0%) |
Property Value to Household Income Ratio in Metairie
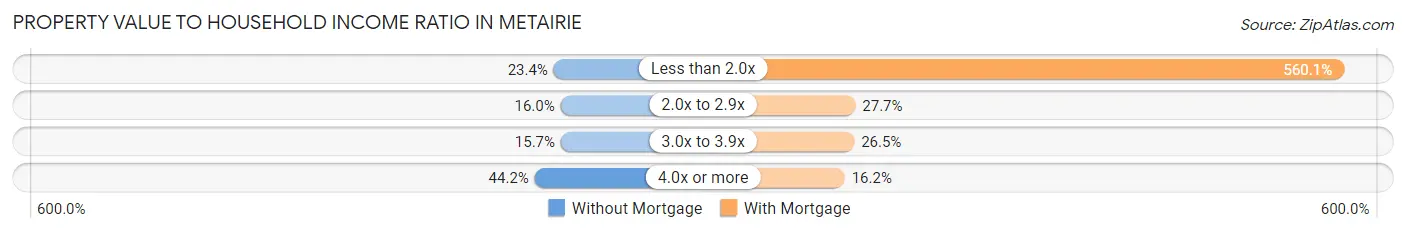
| Value-to-Income Ratio | Without Mortgage | With Mortgage |
| Less than 2.0x | 4,292 (23.4%) | 110,709 (560.1%) |
| 2.0x to 2.9x | 2,936 (16.0%) | 5,482 (27.7%) |
| 3.0x to 3.9x | 2,868 (15.7%) | 5,230 (26.5%) |
| 4.0x or more | 8,094 (44.2%) | 3,193 (16.2%) |
| Total | 18,314 (100.0%) | 19,765 (100.0%) |
Real Estate Taxes by Mortgage Status in Metairie
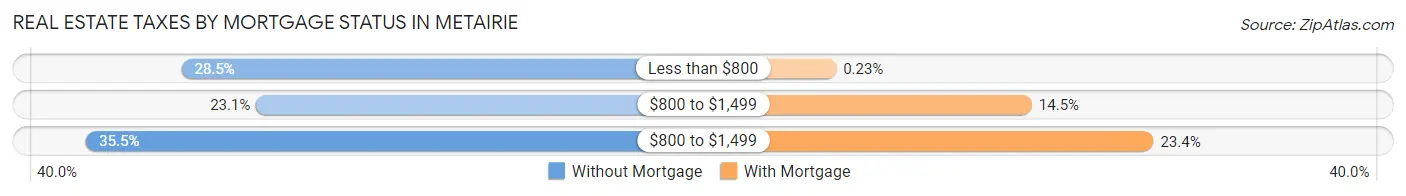
| Property Taxes | Without Mortgage | With Mortgage |
| Less than $800 | 5,226 (28.5%) | 46 (0.2%) |
| $800 to $1,499 | 4,226 (23.1%) | 2,871 (14.5%) |
| $800 to $1,499 | 6,501 (35.5%) | 4,627 (23.4%) |
| Total | 18,314 (100.0%) | 19,765 (100.0%) |
Health & Disability in Metairie
Health Insurance Coverage by Age in Metairie
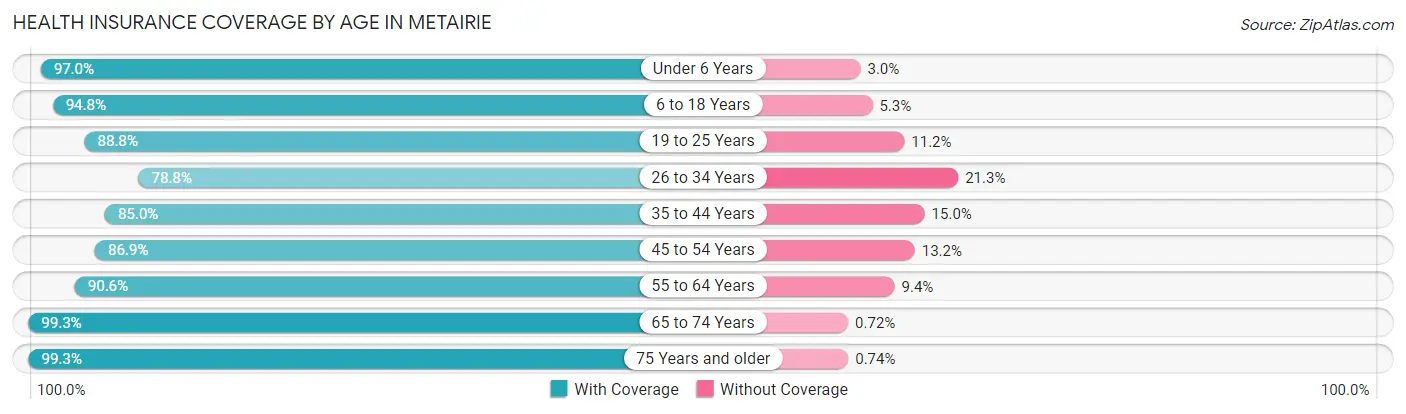
| Age Bracket | With Coverage | Without Coverage |
| Under 6 Years | 9,040 (97.0%) | 282 (3.0%) |
| 6 to 18 Years | 18,442 (94.8%) | 1,021 (5.2%) |
| 19 to 25 Years | 8,212 (88.8%) | 1,036 (11.2%) |
| 26 to 34 Years | 14,136 (78.7%) | 3,815 (21.2%) |
| 35 to 44 Years | 15,509 (85.0%) | 2,735 (15.0%) |
| 45 to 54 Years | 13,417 (86.9%) | 2,031 (13.2%) |
| 55 to 64 Years | 18,090 (90.6%) | 1,872 (9.4%) |
| 65 to 74 Years | 16,573 (99.3%) | 121 (0.7%) |
| 75 Years and older | 13,076 (99.3%) | 98 (0.7%) |
| Total | 126,495 (90.7%) | 13,011 (9.3%) |
Health Insurance Coverage by Citizenship Status in Metairie
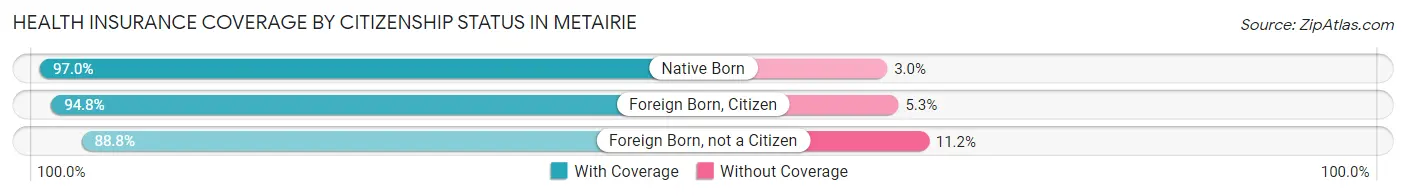
| Citizenship Status | With Coverage | Without Coverage |
| Native Born | 9,040 (97.0%) | 282 (3.0%) |
| Foreign Born, Citizen | 18,442 (94.8%) | 1,021 (5.2%) |
| Foreign Born, not a Citizen | 8,212 (88.8%) | 1,036 (11.2%) |
Health Insurance Coverage by Household Income in Metairie
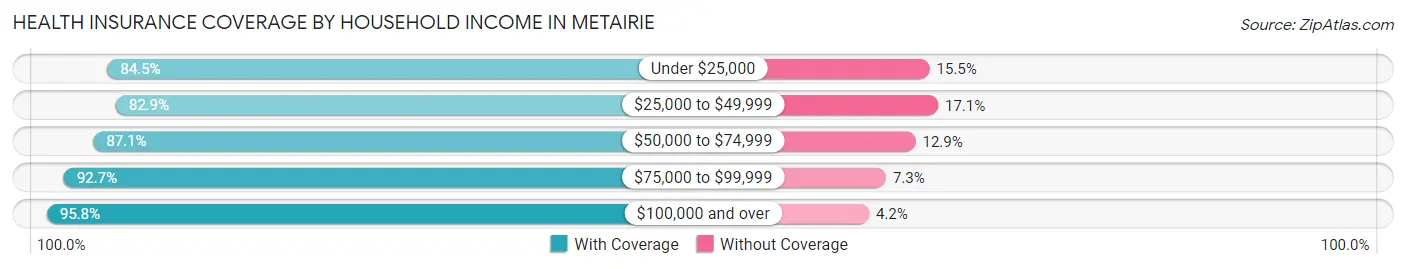
| Household Income | With Coverage | Without Coverage |
| Under $25,000 | 13,674 (84.5%) | 2,508 (15.5%) |
| $25,000 to $49,999 | 18,034 (82.9%) | 3,717 (17.1%) |
| $50,000 to $74,999 | 19,888 (87.1%) | 2,939 (12.9%) |
| $75,000 to $99,999 | 16,368 (92.7%) | 1,297 (7.3%) |
| $100,000 and over | 58,366 (95.8%) | 2,537 (4.2%) |
Public vs Private Health Insurance Coverage by Age in Metairie
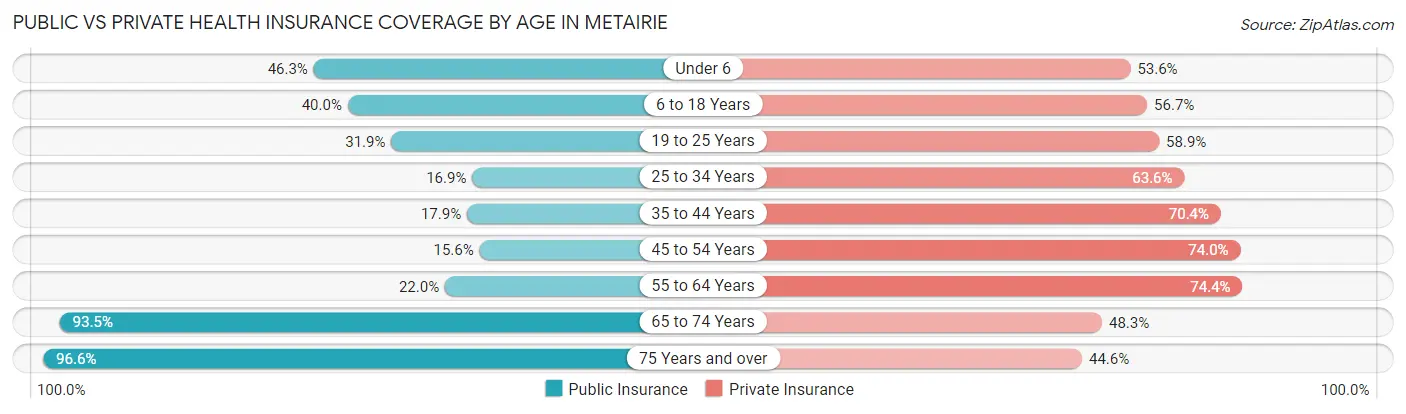
| Age Bracket | Public Insurance | Private Insurance |
| Under 6 | 4,320 (46.3%) | 4,995 (53.6%) |
| 6 to 18 Years | 7,789 (40.0%) | 11,031 (56.7%) |
| 19 to 25 Years | 2,953 (31.9%) | 5,448 (58.9%) |
| 25 to 34 Years | 3,036 (16.9%) | 11,414 (63.6%) |
| 35 to 44 Years | 3,263 (17.9%) | 12,835 (70.4%) |
| 45 to 54 Years | 2,404 (15.6%) | 11,429 (74.0%) |
| 55 to 64 Years | 4,385 (22.0%) | 14,841 (74.4%) |
| 65 to 74 Years | 15,608 (93.5%) | 8,063 (48.3%) |
| 75 Years and over | 12,720 (96.6%) | 5,876 (44.6%) |
| Total | 56,478 (40.5%) | 85,932 (61.6%) |
Disability Status by Sex by Age in Metairie
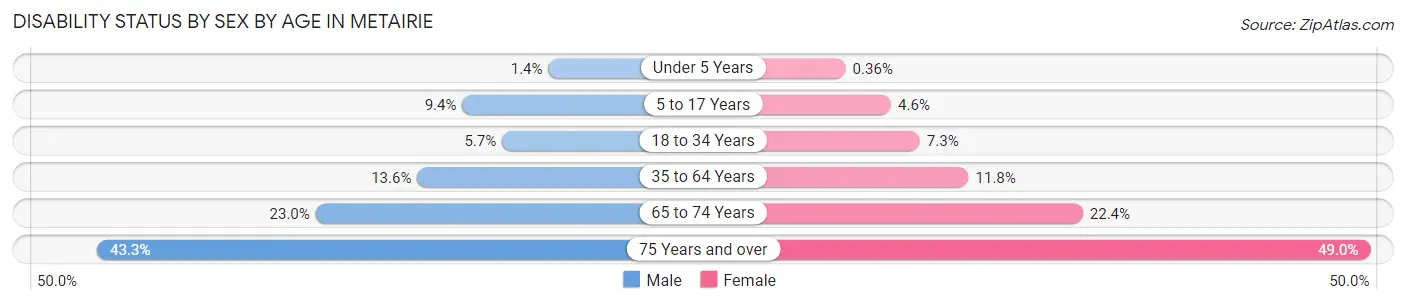
| Age Bracket | Male | Female |
| Under 5 Years | 59 (1.4%) | 13 (0.4%) |
| 5 to 17 Years | 973 (9.4%) | 418 (4.6%) |
| 18 to 34 Years | 838 (5.7%) | 1,006 (7.2%) |
| 35 to 64 Years | 3,550 (13.6%) | 3,234 (11.8%) |
| 65 to 74 Years | 1,895 (23.0%) | 1,891 (22.4%) |
| 75 Years and over | 2,078 (43.3%) | 4,106 (49.0%) |
Disability Class by Sex by Age in Metairie
Disability Class: Hearing Difficulty
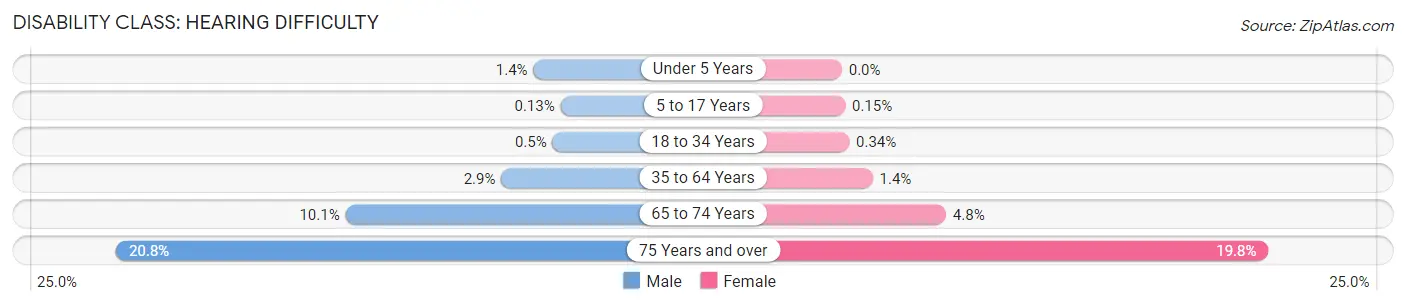
| Age Bracket | Male | Female |
| Under 5 Years | 59 (1.4%) | 0 (0.0%) |
| 5 to 17 Years | 13 (0.1%) | 14 (0.2%) |
| 18 to 34 Years | 74 (0.5%) | 47 (0.3%) |
| 35 to 64 Years | 754 (2.9%) | 394 (1.4%) |
| 65 to 74 Years | 833 (10.1%) | 408 (4.8%) |
| 75 Years and over | 997 (20.8%) | 1,657 (19.8%) |
Disability Class: Vision Difficulty
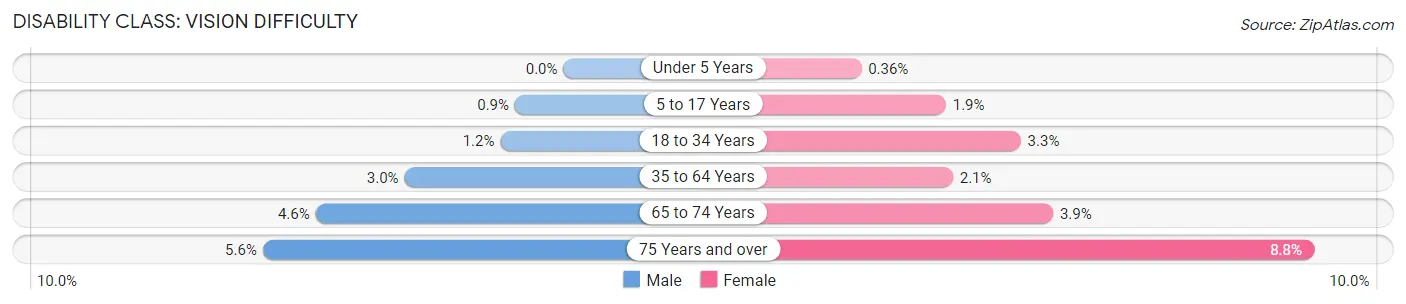
| Age Bracket | Male | Female |
| Under 5 Years | 0 (0.0%) | 13 (0.4%) |
| 5 to 17 Years | 93 (0.9%) | 176 (1.9%) |
| 18 to 34 Years | 172 (1.2%) | 461 (3.3%) |
| 35 to 64 Years | 773 (2.9%) | 566 (2.1%) |
| 65 to 74 Years | 379 (4.6%) | 331 (3.9%) |
| 75 Years and over | 268 (5.6%) | 733 (8.8%) |
Disability Class: Cognitive Difficulty
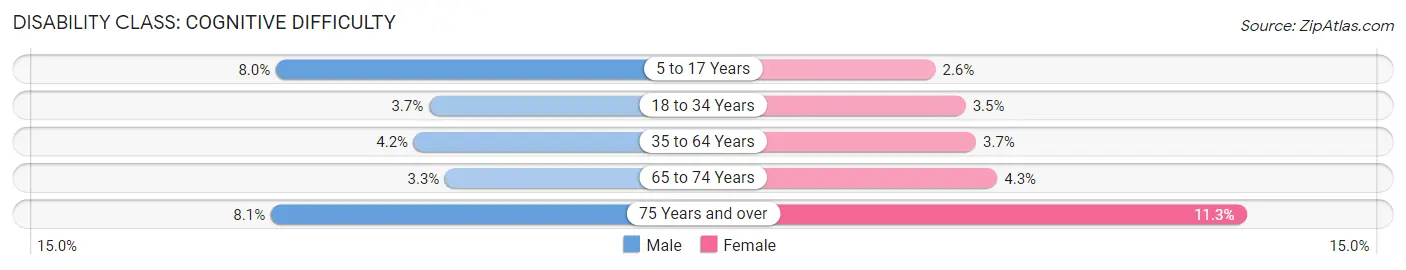
| Age Bracket | Male | Female |
| 5 to 17 Years | 830 (8.0%) | 238 (2.6%) |
| 18 to 34 Years | 550 (3.7%) | 479 (3.5%) |
| 35 to 64 Years | 1,090 (4.2%) | 1,028 (3.7%) |
| 65 to 74 Years | 271 (3.3%) | 366 (4.3%) |
| 75 Years and over | 391 (8.1%) | 943 (11.3%) |
Disability Class: Ambulatory Difficulty
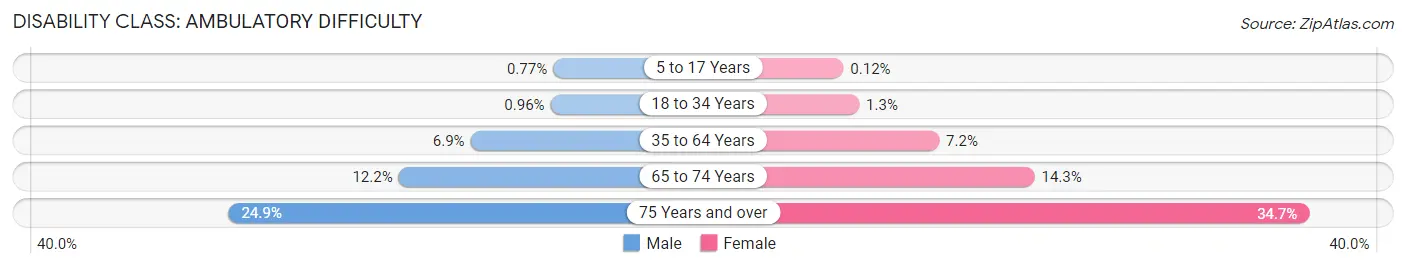
| Age Bracket | Male | Female |
| 5 to 17 Years | 80 (0.8%) | 11 (0.1%) |
| 18 to 34 Years | 141 (1.0%) | 179 (1.3%) |
| 35 to 64 Years | 1,807 (6.9%) | 1,987 (7.2%) |
| 65 to 74 Years | 1,009 (12.2%) | 1,210 (14.3%) |
| 75 Years and over | 1,194 (24.9%) | 2,905 (34.7%) |
Disability Class: Self-Care Difficulty
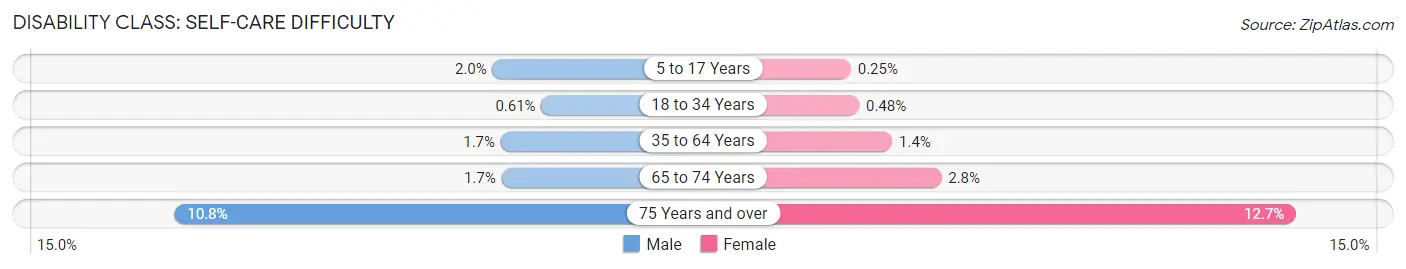
| Age Bracket | Male | Female |
| 5 to 17 Years | 204 (2.0%) | 23 (0.3%) |
| 18 to 34 Years | 90 (0.6%) | 66 (0.5%) |
| 35 to 64 Years | 455 (1.7%) | 385 (1.4%) |
| 65 to 74 Years | 142 (1.7%) | 234 (2.8%) |
| 75 Years and over | 520 (10.8%) | 1,059 (12.7%) |
Technology Access in Metairie
Computing Device Access in Metairie
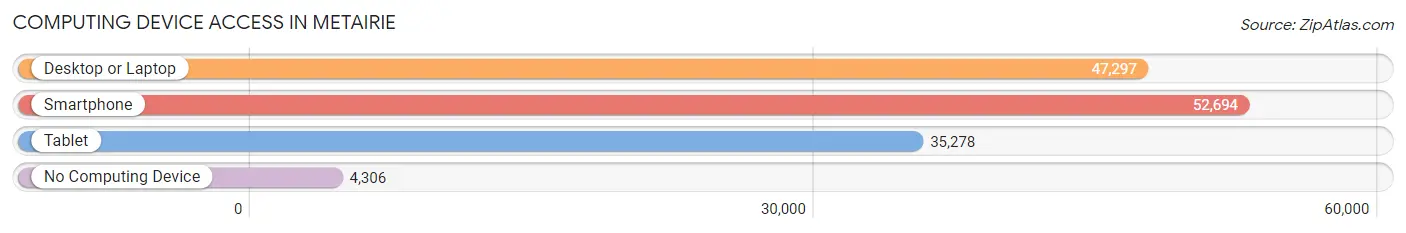
| Device Type | # Households | % Households |
| Desktop or Laptop | 47,297 | 78.0% |
| Smartphone | 52,694 | 86.9% |
| Tablet | 35,278 | 58.2% |
| No Computing Device | 4,306 | 7.1% |
| Total | 60,634 | 100.0% |
Internet Access in Metairie
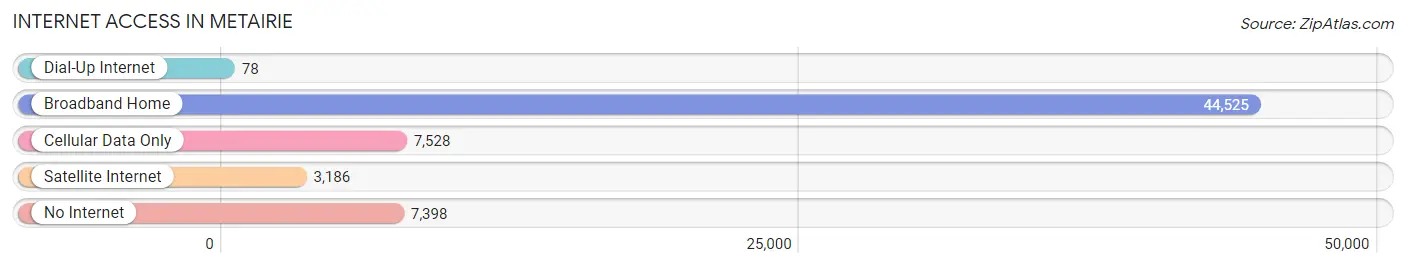
| Internet Type | # Households | % Households |
| Dial-Up Internet | 78 | 0.1% |
| Broadband Home | 44,525 | 73.4% |
| Cellular Data Only | 7,528 | 12.4% |
| Satellite Internet | 3,186 | 5.2% |
| No Internet | 7,398 | 12.2% |
| Total | 60,634 | 100.0% |
Metairie Summary
Metairie, Louisiana is a suburb of New Orleans located in Jefferson Parish. It is the largest unincorporated community in the state and is home to over 138,000 people. Metairie is known for its vibrant culture, diverse population, and unique history.
Geography
Metairie is located in the southeastern corner of Louisiana, just north of New Orleans. It is bordered by Lake Pontchartrain to the north, the Mississippi River to the east, and the Gulf of Mexico to the south. The city is situated on a low-lying coastal plain, with an average elevation of just 6 feet above sea level. The climate is humid subtropical, with hot, humid summers and mild winters.
Economy
Metairie’s economy is largely based on tourism, retail, and services. The city is home to several large shopping malls, including Lakeside Shopping Center and Clearview Mall. It is also home to several large employers, including Ochsner Health System, Entergy, and the Louisiana State University Health Sciences Center.
Demographics
Metairie is a diverse city, with a population that is roughly 60% white, 30% African American, and 10% Hispanic. The median household income is $50,000, and the median age is 37. The city is home to a large number of immigrants, with the largest groups coming from Mexico, Vietnam, and India.
History
Metairie was founded in 1855 by a group of French-speaking settlers from New Orleans. The city was originally known as Metairie Ridge, and was named after the French word for “ridge”. The city grew rapidly in the late 19th and early 20th centuries, and by the 1920s it had become a popular suburb of New Orleans.
In the 1950s, Metairie experienced a period of rapid growth and development, as the city’s population nearly doubled. This growth was largely due to the construction of the Lake Pontchartrain Causeway, which connected Metairie to New Orleans. The city continued to grow throughout the 20th century, and today it is one of the largest cities in Louisiana.
Metairie is a vibrant and diverse city with a rich history and culture. It is home to a large and diverse population, and its economy is largely based on tourism, retail, and services. The city is also home to several large employers, and its population continues to grow. Metairie is a great place to live, work, and play, and it is sure to remain a popular destination for years to come.
Common Questions
What is Per Capita Income in Metairie?
Per Capita income in Metairie is $43,170.
What is the Median Family Income in Metairie?
Median Family Income in Metairie is $93,170.
What is the Median Household income in Metairie?
Median Household Income in Metairie is $72,070.
What is Income or Wage Gap in Metairie?
Income or Wage Gap in Metairie is 18.4%.
Women in Metairie earn 81.6 cents for every dollar earned by a man.
What is Family Income Deficit in Metairie?
Family Income Deficit in Metairie is $9,112.
Families that are below poverty line in Metairie earn $9,112 less on average than the poverty threshold level.
What is Inequality or Gini Index in Metairie?
Inequality or Gini Index in Metairie is 0.47.
What is the Total Population of Metairie?
Total Population of Metairie is 140,046.
What is the Total Male Population of Metairie?
Total Male Population of Metairie is 68,903.
What is the Total Female Population of Metairie?
Total Female Population of Metairie is 71,143.
What is the Ratio of Males per 100 Females in Metairie?
There are 96.85 Males per 100 Females in Metairie.
What is the Ratio of Females per 100 Males in Metairie?
There are 103.25 Females per 100 Males in Metairie.
What is the Median Population Age in Metairie?
Median Population Age in Metairie is 42.4 Years.
What is the Average Family Size in Metairie
Average Family Size in Metairie is 3.0 People.
What is the Average Household Size in Metairie
Average Household Size in Metairie is 2.3 People.
How Large is the Labor Force in Metairie?
There are 73,990 People in the Labor Forcein in Metairie.
What is the Percentage of People in the Labor Force in Metairie?
64.0% of People are in the Labor Force in Metairie.
What is the Unemployment Rate in Metairie?
Unemployment Rate in Metairie is 4.3%.