Dacula, GA Map & Demographics
Dacula Map
Dacula Overview
$27,774
PER CAPITA INCOME
$82,067
AVG FAMILY INCOME
$81,322
AVG HOUSEHOLD INCOME
26.7%
WAGE / INCOME GAP [ % ]
73.3¢/ $1
WAGE / INCOME GAP [ $ ]
$17,143
FAMILY INCOME DEFICIT
0.33
INEQUALITY / GINI INDEX
6,906
TOTAL POPULATION
3,658
MALE POPULATION
3,248
FEMALE POPULATION
112.62
MALES / 100 FEMALES
88.79
FEMALES / 100 MALES
35.0
MEDIAN AGE
3.5
AVG FAMILY SIZE
3.1
AVG HOUSEHOLD SIZE
3,087
LABOR FORCE [ PEOPLE ]
63.2%
PERCENT IN LABOR FORCE
5.1%
UNEMPLOYMENT RATE
Dacula Zip Codes
Dacula Area Codes
Income in Dacula
Income Overview in Dacula
Per Capita Income in Dacula is $27,774, while median incomes of families and households are $82,067 and $81,322 respectively.
| Characteristic | Number | Measure |
| Per Capita Income | 6,906 | $27,774 |
| Median Family Income | 1,668 | $82,067 |
| Mean Family Income | 1,668 | $97,156 |
| Median Household Income | 2,230 | $81,322 |
| Mean Household Income | 2,230 | $85,485 |
| Income Deficit | 1,668 | $17,143 |
| Wage / Income Gap (%) | 6,906 | 26.66% |
| Wage / Income Gap ($) | 6,906 | 73.34¢ per $1 |
| Gini / Inequality Index | 6,906 | 0.33 |
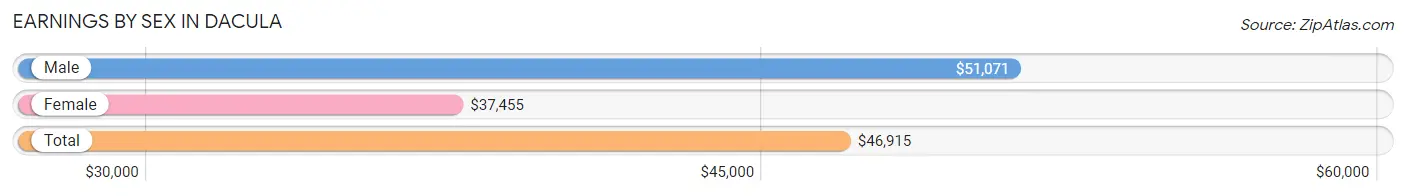
Earnings by Sex in Dacula
Average Earnings in Dacula are $46,915, $51,071 for men and $37,455 for women, a difference of 26.7%.
| Sex | Number | Average Earnings |
| Male | 1,724 (50.3%) | $51,071 |
| Female | 1,706 (49.7%) | $37,455 |
| Total | 3,430 (100.0%) | $46,915 |
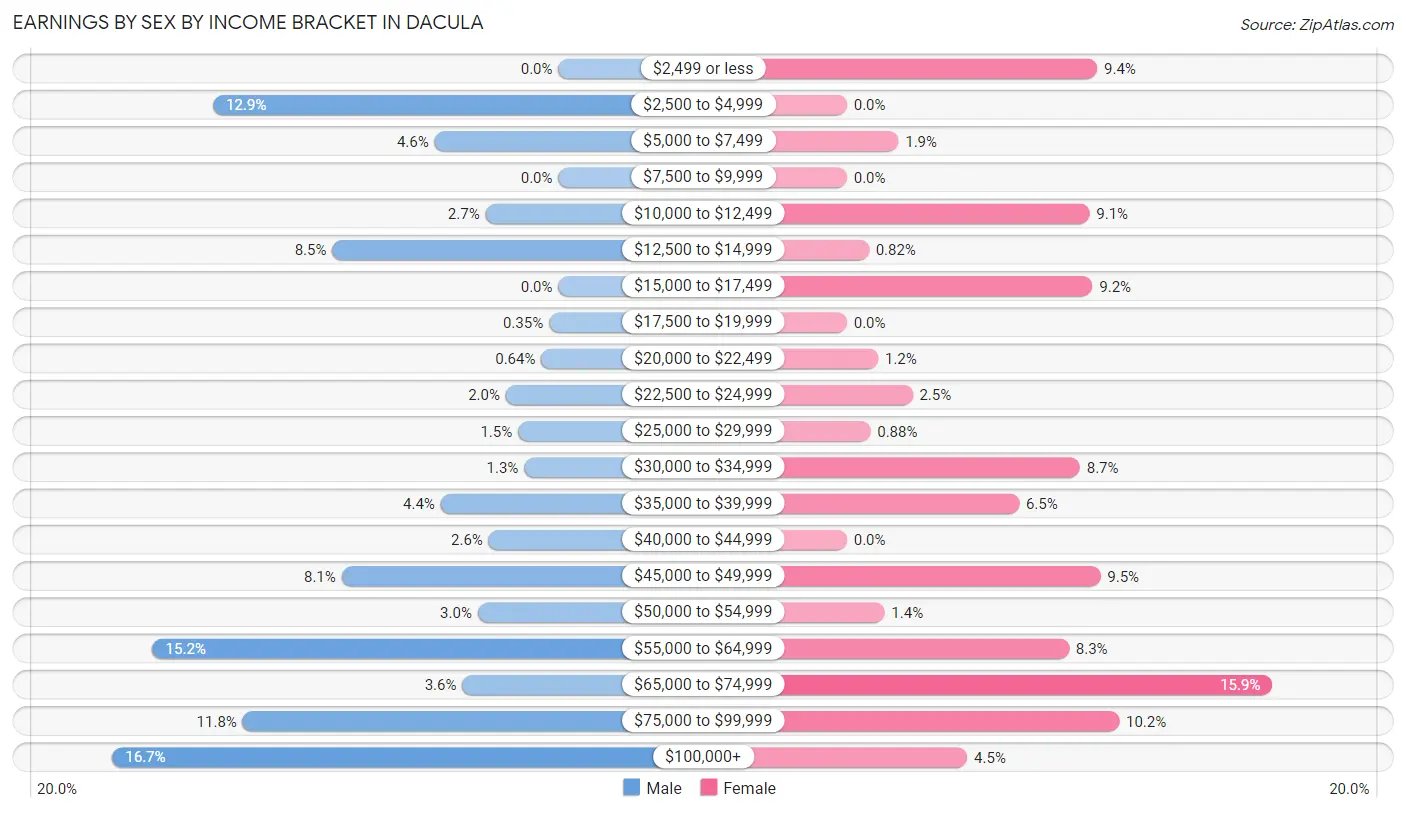
Earnings by Sex by Income Bracket in Dacula
The most common earnings brackets in Dacula are $100,000+ for men (288 | 16.7%) and $65,000 to $74,999 for women (272 | 15.9%).
| Income | Male | Female |
| $2,499 or less | 0 (0.0%) | 160 (9.4%) |
| $2,500 to $4,999 | 223 (12.9%) | 0 (0.0%) |
| $5,000 to $7,499 | 80 (4.6%) | 33 (1.9%) |
| $7,500 to $9,999 | 0 (0.0%) | 0 (0.0%) |
| $10,000 to $12,499 | 47 (2.7%) | 155 (9.1%) |
| $12,500 to $14,999 | 146 (8.5%) | 14 (0.8%) |
| $15,000 to $17,499 | 0 (0.0%) | 157 (9.2%) |
| $17,500 to $19,999 | 6 (0.4%) | 0 (0.0%) |
| $20,000 to $22,499 | 11 (0.6%) | 20 (1.2%) |
| $22,500 to $24,999 | 34 (2.0%) | 42 (2.5%) |
| $25,000 to $29,999 | 26 (1.5%) | 15 (0.9%) |
| $30,000 to $34,999 | 22 (1.3%) | 149 (8.7%) |
| $35,000 to $39,999 | 76 (4.4%) | 110 (6.5%) |
| $40,000 to $44,999 | 45 (2.6%) | 0 (0.0%) |
| $45,000 to $49,999 | 140 (8.1%) | 162 (9.5%) |
| $50,000 to $54,999 | 52 (3.0%) | 24 (1.4%) |
| $55,000 to $64,999 | 262 (15.2%) | 142 (8.3%) |
| $65,000 to $74,999 | 62 (3.6%) | 272 (15.9%) |
| $75,000 to $99,999 | 204 (11.8%) | 174 (10.2%) |
| $100,000+ | 288 (16.7%) | 77 (4.5%) |
| Total | 1,724 (100.0%) | 1,706 (100.0%) |
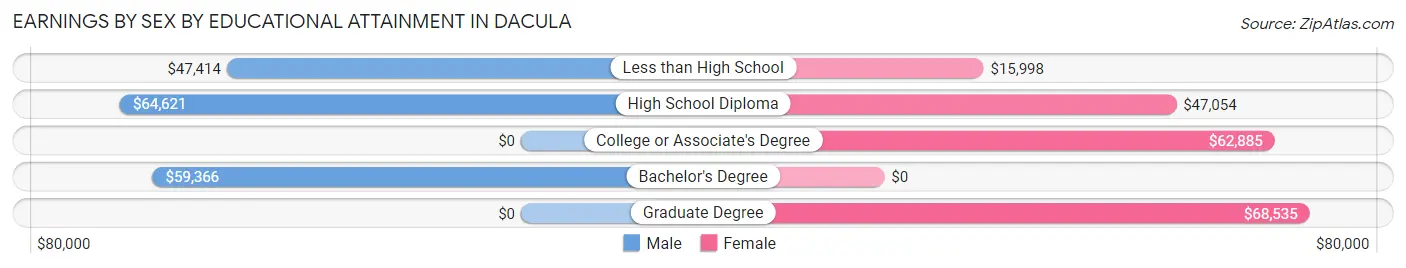
Earnings by Sex by Educational Attainment in Dacula
Average earnings in Dacula are $61,598 for men and $46,463 for women, a difference of 24.6%. Men with an educational attainment of high school diploma enjoy the highest average annual earnings of $64,621, while those with less than high school education earn the least with $47,414. Women with an educational attainment of graduate degree earn the most with the average annual earnings of $68,535, while those with less than high school education have the smallest earnings of $15,998.
| Educational Attainment | Male Income | Female Income |
| Less than High School | $47,414 | $15,998 |
| High School Diploma | $64,621 | $47,054 |
| College or Associate's Degree | - | - |
| Bachelor's Degree | $59,366 | $0 |
| Graduate Degree | - | - |
| Total | $61,598 | $46,463 |
Family Income in Dacula
Family Income Brackets in Dacula
According to the Dacula family income data, there are 442 families falling into the $50,000 to $74,999 income range, which is the most common income bracket and makes up 26.5% of all families.
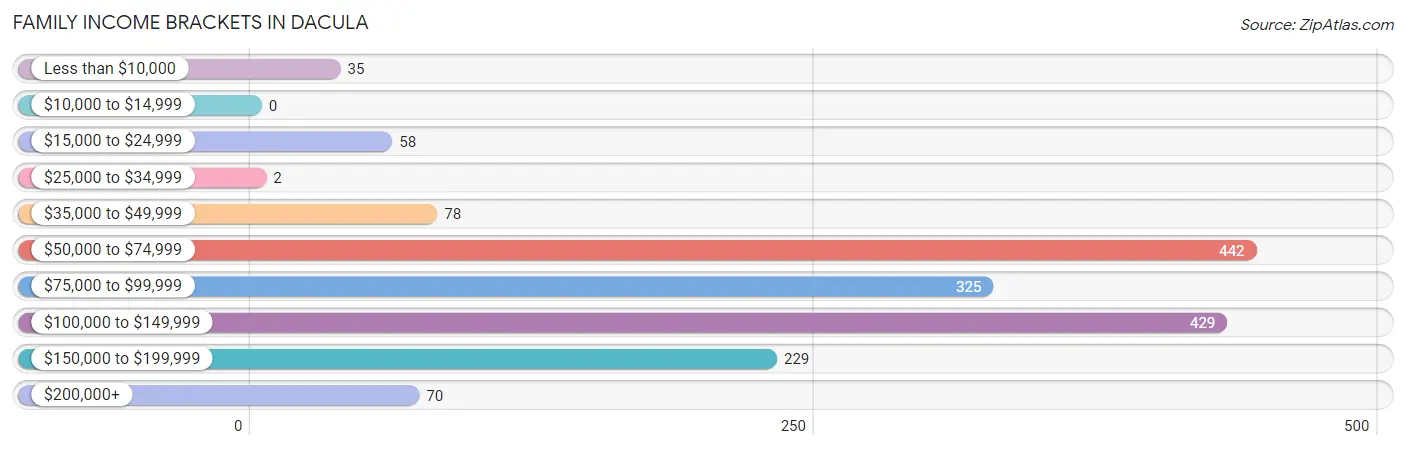
| Income Bracket | # Families | % Families |
| Less than $10,000 | 35 | 2.1% |
| $10,000 to $14,999 | 0 | 0.0% |
| $15,000 to $24,999 | 58 | 3.5% |
| $25,000 to $34,999 | 2 | 0.1% |
| $35,000 to $49,999 | 78 | 4.7% |
| $50,000 to $74,999 | 442 | 26.5% |
| $75,000 to $99,999 | 325 | 19.5% |
| $100,000 to $149,999 | 429 | 25.7% |
| $150,000 to $199,999 | 229 | 13.7% |
| $200,000+ | 70 | 4.2% |
Family Income by Famaliy Size in Dacula
3-person families (450 | 27.0%) account for the highest median family income in Dacula with $96,059 per family, while 2-person families (441 | 26.4%) have the highest median income of $46,562 per family member.
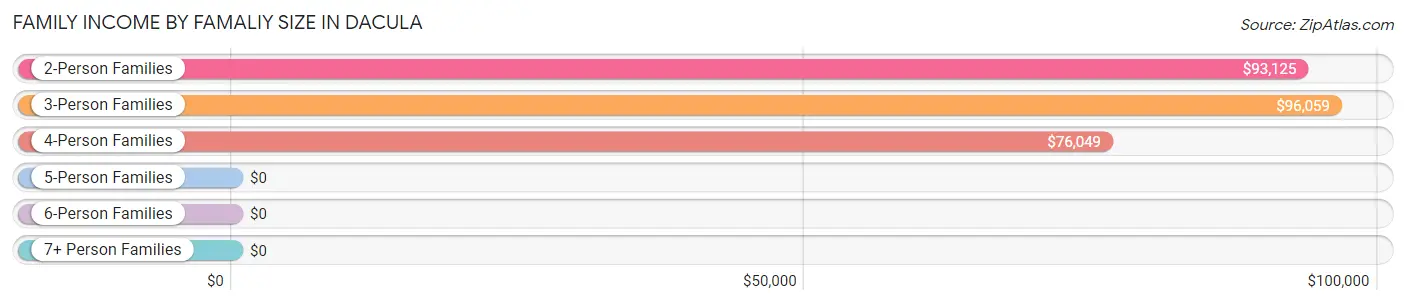
| Income Bracket | # Families | Median Income |
| 2-Person Families | 441 (26.4%) | $93,125 |
| 3-Person Families | 450 (27.0%) | $96,059 |
| 4-Person Families | 522 (31.3%) | $76,049 |
| 5-Person Families | 74 (4.4%) | $0 |
| 6-Person Families | 181 (10.8%) | $0 |
| 7+ Person Families | 0 (0.0%) | $0 |
| Total | 1,668 (100.0%) | $82,067 |
Family Income by Number of Earners in Dacula
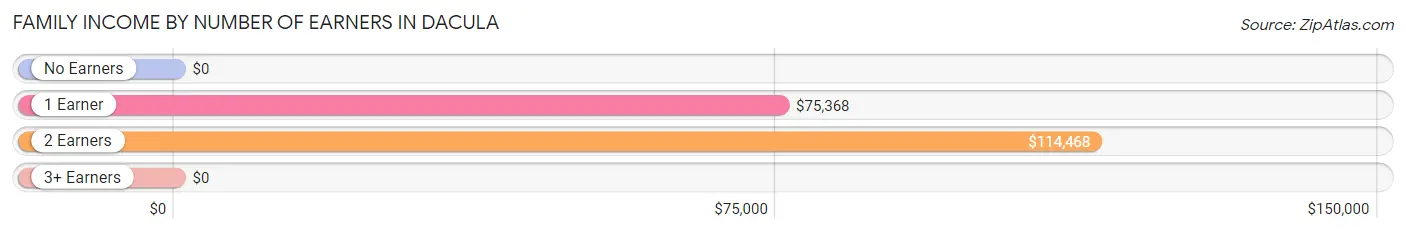
| Number of Earners | # Families | Median Income |
| No Earners | 22 (1.3%) | $0 |
| 1 Earner | 665 (39.9%) | $75,368 |
| 2 Earners | 819 (49.1%) | $114,468 |
| 3+ Earners | 162 (9.7%) | $0 |
| Total | 1,668 (100.0%) | $82,067 |
Household Income in Dacula
Household Income Brackets in Dacula
With 544 households falling in the category, the $100,000 to $149,999 income range is the most frequent in Dacula, accounting for 24.4% of all households. In contrast, only 58 households (2.6%) fall into the $15,000 to $24,999 income bracket, making it the least populous group.
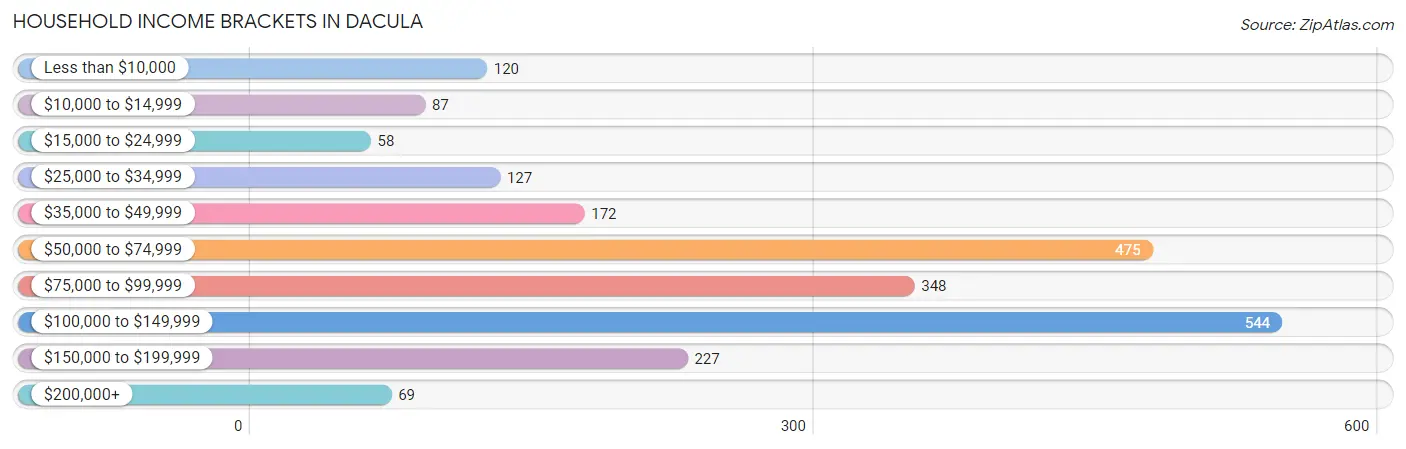
| Income Bracket | # Households | % Households |
| Less than $10,000 | 120 | 5.4% |
| $10,000 to $14,999 | 87 | 3.9% |
| $15,000 to $24,999 | 58 | 2.6% |
| $25,000 to $34,999 | 127 | 5.7% |
| $35,000 to $49,999 | 172 | 7.7% |
| $50,000 to $74,999 | 475 | 21.3% |
| $75,000 to $99,999 | 348 | 15.6% |
| $100,000 to $149,999 | 544 | 24.4% |
| $150,000 to $199,999 | 227 | 10.2% |
| $200,000+ | 69 | 3.1% |
Household Income by Householder Age in Dacula
The median household income in Dacula is $81,322, with the highest median household income of $96,610 found in the 25 to 44 years age bracket for the primary householder. A total of 834 households (37.4%) fall into this category.
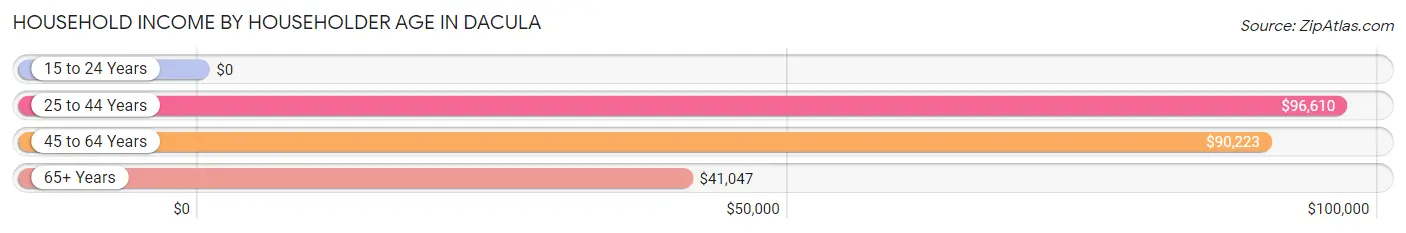
| Income Bracket | # Households | Median Income |
| 15 to 24 Years | 0 (0.0%) | $0 |
| 25 to 44 Years | 834 (37.4%) | $96,610 |
| 45 to 64 Years | 884 (39.6%) | $90,223 |
| 65+ Years | 512 (23.0%) | $41,047 |
| Total | 2,230 (100.0%) | $81,322 |
Poverty in Dacula
Income Below Poverty by Sex and Age in Dacula
With 12.7% poverty level for males and 8.8% for females among the residents of Dacula, 5 year old males and 15 year old females are the most vulnerable to poverty, with 45 males (100.0%) and 2 females (100.0%) in their respective age groups living below the poverty level.
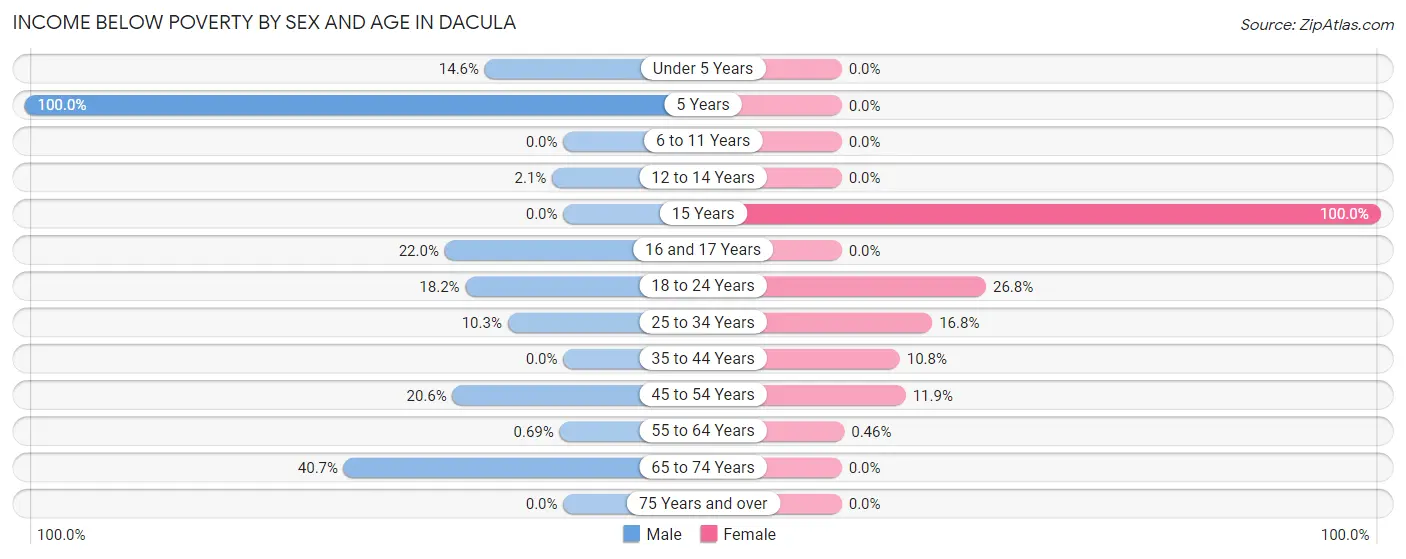
| Age Bracket | Male | Female |
| Under 5 Years | 52 (14.6%) | 0 (0.0%) |
| 5 Years | 45 (100.0%) | 0 (0.0%) |
| 6 to 11 Years | 0 (0.0%) | 0 (0.0%) |
| 12 to 14 Years | 2 (2.1%) | 0 (0.0%) |
| 15 Years | 0 (0.0%) | 2 (100.0%) |
| 16 and 17 Years | 24 (22.0%) | 0 (0.0%) |
| 18 to 24 Years | 60 (18.2%) | 68 (26.8%) |
| 25 to 34 Years | 35 (10.3%) | 67 (16.8%) |
| 35 to 44 Years | 0 (0.0%) | 75 (10.8%) |
| 45 to 54 Years | 86 (20.6%) | 61 (11.9%) |
| 55 to 64 Years | 2 (0.7%) | 2 (0.5%) |
| 65 to 74 Years | 143 (40.7%) | 0 (0.0%) |
| 75 Years and over | 0 (0.0%) | 0 (0.0%) |
| Total | 449 (12.7%) | 275 (8.8%) |
Income Above Poverty by Sex and Age in Dacula
According to the poverty statistics in Dacula, males aged 6 to 11 years and females aged under 5 years are the age groups that are most secure financially, with 100.0% of males and 100.0% of females in these age groups living above the poverty line.
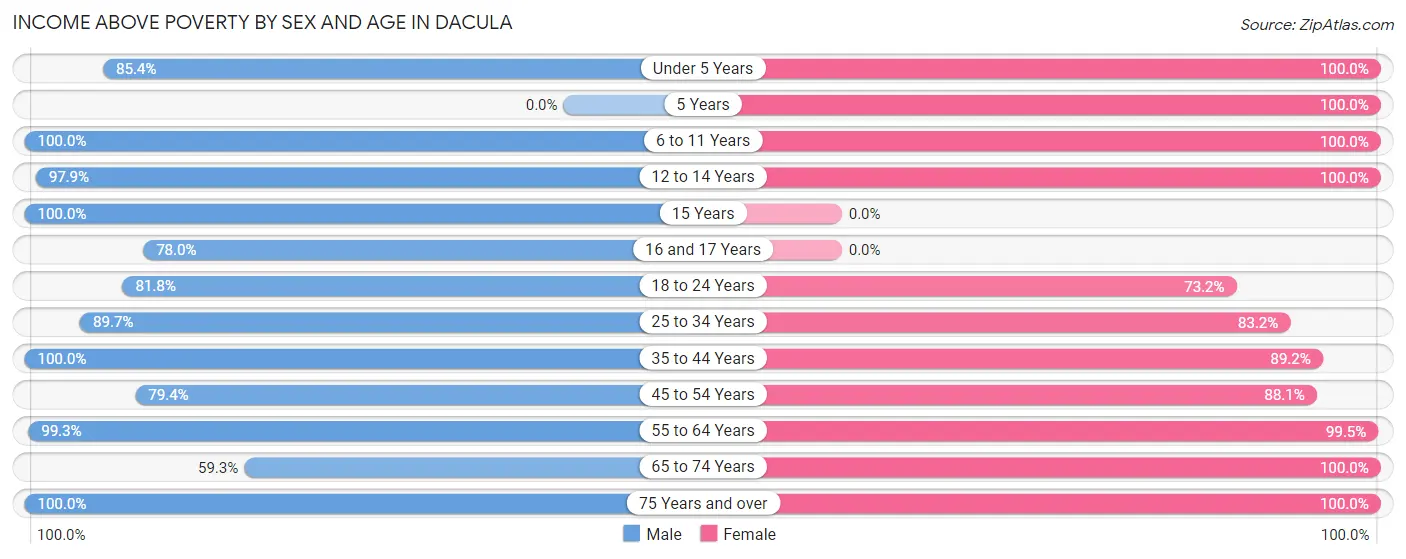
| Age Bracket | Male | Female |
| Under 5 Years | 305 (85.4%) | 130 (100.0%) |
| 5 Years | 0 (0.0%) | 213 (100.0%) |
| 6 to 11 Years | 720 (100.0%) | 81 (100.0%) |
| 12 to 14 Years | 94 (97.9%) | 121 (100.0%) |
| 15 Years | 26 (100.0%) | 0 (0.0%) |
| 16 and 17 Years | 85 (78.0%) | 0 (0.0%) |
| 18 to 24 Years | 270 (81.8%) | 186 (73.2%) |
| 25 to 34 Years | 304 (89.7%) | 332 (83.2%) |
| 35 to 44 Years | 442 (100.0%) | 622 (89.2%) |
| 45 to 54 Years | 332 (79.4%) | 453 (88.1%) |
| 55 to 64 Years | 287 (99.3%) | 429 (99.5%) |
| 65 to 74 Years | 208 (59.3%) | 223 (100.0%) |
| 75 Years and over | 26 (100.0%) | 62 (100.0%) |
| Total | 3,099 (87.3%) | 2,852 (91.2%) |
Income Below Poverty Among Married-Couple Families in Dacula
The poverty statistics for married-couple families in Dacula show that 7.0% or 95 of the total 1,348 families live below the poverty line. Families with no children have the highest poverty rate of 8.5%, comprising of 58 families. On the other hand, families with 3 or 4 children have the lowest poverty rate of 0.0%, which includes 0 families.
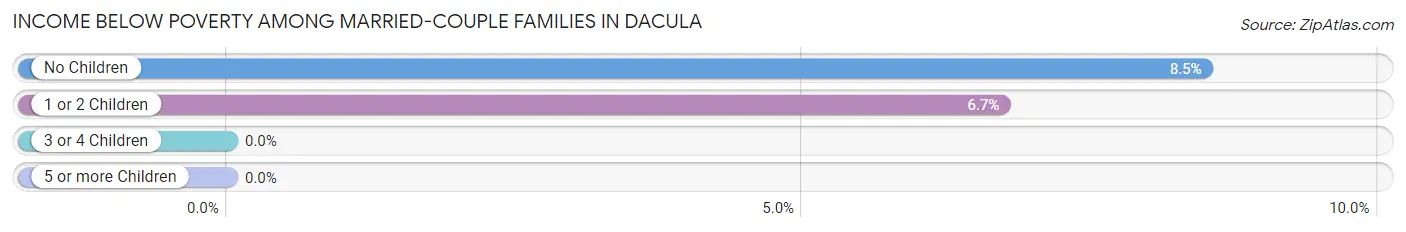
| Children | Above Poverty | Below Poverty |
| No Children | 625 (91.5%) | 58 (8.5%) |
| 1 or 2 Children | 513 (93.3%) | 37 (6.7%) |
| 3 or 4 Children | 115 (100.0%) | 0 (0.0%) |
| 5 or more Children | 0 (0.0%) | 0 (0.0%) |
| Total | 1,253 (92.9%) | 95 (7.0%) |
Income Below Poverty Among Single-Parent Households in Dacula
| Children | Single Father | Single Mother |
| No Children | 0 (0.0%) | 0 (0.0%) |
| 1 or 2 Children | 0 (0.0%) | 0 (0.0%) |
| 3 or 4 Children | 0 (0.0%) | 0 (0.0%) |
| 5 or more Children | 0 (0.0%) | 0 (0.0%) |
| Total | 0 (0.0%) | 0 (0.0%) |
Income Below Poverty Among Married-Couple vs Single-Parent Households in Dacula
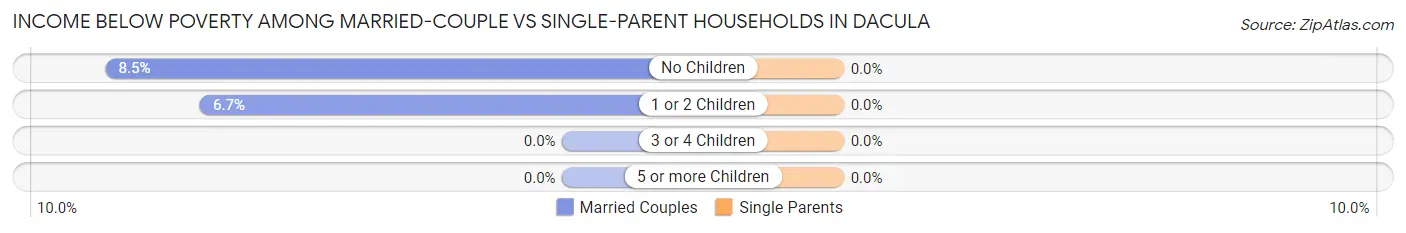
| Children | Married-Couple Families | Single-Parent Households |
| No Children | 58 (8.5%) | 0 (0.0%) |
| 1 or 2 Children | 37 (6.7%) | 0 (0.0%) |
| 3 or 4 Children | 0 (0.0%) | 0 (0.0%) |
| 5 or more Children | 0 (0.0%) | 0 (0.0%) |
| Total | 95 (7.0%) | 0 (0.0%) |
Race in Dacula
The most populous races in Dacula are White / Caucasian (3,128 | 45.3%), Black / African American (1,682 | 24.4%), and Hispanic or Latino (1,416 | 20.5%).
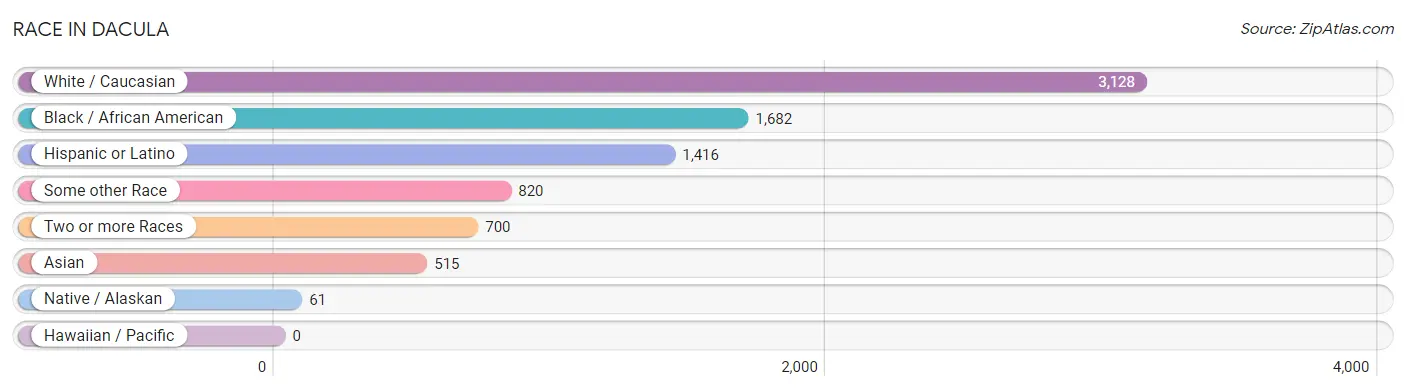
| Race | # Population | % Population |
| Asian | 515 | 7.5% |
| Black / African American | 1,682 | 24.4% |
| Hawaiian / Pacific | 0 | 0.0% |
| Hispanic or Latino | 1,416 | 20.5% |
| Native / Alaskan | 61 | 0.9% |
| White / Caucasian | 3,128 | 45.3% |
| Two or more Races | 700 | 10.1% |
| Some other Race | 820 | 11.9% |
| Total | 6,906 | 100.0% |
Ancestry in Dacula
The most populous ancestries reported in Dacula are English (628 | 9.1%), German (621 | 9.0%), Mexican (518 | 7.5%), Haitian (494 | 7.1%), and American (415 | 6.0%), together accounting for 38.7% of all Dacula residents.
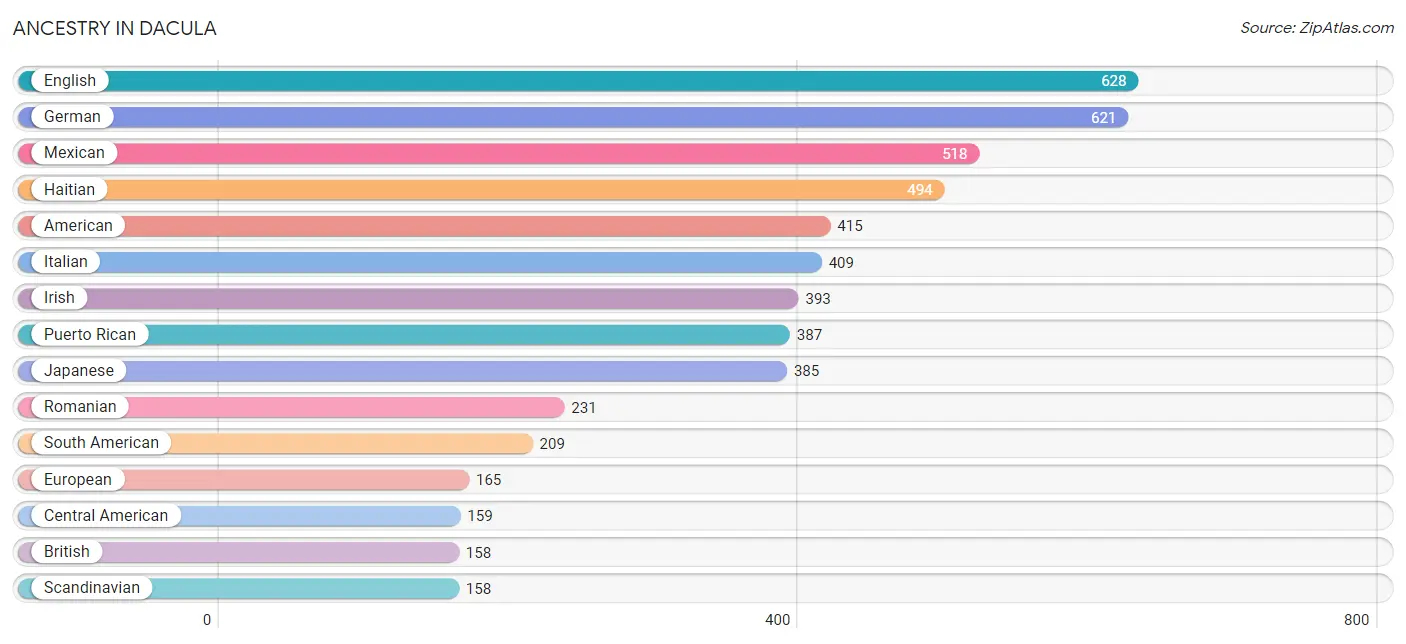
| Ancestry | # Population | % Population |
| African | 56 | 0.8% |
| American | 415 | 6.0% |
| Bahamian | 4 | 0.1% |
| Bhutanese | 47 | 0.7% |
| British | 158 | 2.3% |
| Central American | 159 | 2.3% |
| Colombian | 88 | 1.3% |
| Costa Rican | 14 | 0.2% |
| Cuban | 51 | 0.7% |
| Dominican | 92 | 1.3% |
| Ecuadorian | 6 | 0.1% |
| English | 628 | 9.1% |
| European | 165 | 2.4% |
| French | 40 | 0.6% |
| French Canadian | 57 | 0.8% |
| German | 621 | 9.0% |
| Guatemalan | 33 | 0.5% |
| Haitian | 494 | 7.1% |
| Indian (Asian) | 51 | 0.7% |
| Irish | 393 | 5.7% |
| Italian | 409 | 5.9% |
| Jamaican | 25 | 0.4% |
| Japanese | 385 | 5.6% |
| Korean | 66 | 1.0% |
| Mexican | 518 | 7.5% |
| Nicaraguan | 112 | 1.6% |
| Polish | 21 | 0.3% |
| Puerto Rican | 387 | 5.6% |
| Romanian | 231 | 3.3% |
| Scandinavian | 158 | 2.3% |
| Scottish | 120 | 1.7% |
| South American | 209 | 3.0% |
| Sri Lankan | 99 | 1.4% |
| Subsaharan African | 56 | 0.8% |
| Venezuelan | 115 | 1.7% |
| Welsh | 95 | 1.4% | View All 36 Rows |
Immigrants in Dacula
The most numerous immigrant groups reported in Dacula came from Latin America (738 | 10.7%), Asia (451 | 6.5%), Central America (390 | 5.7%), South Eastern Asia (386 | 5.6%), and Vietnam (386 | 5.6%), together accounting for 34.0% of all Dacula residents.
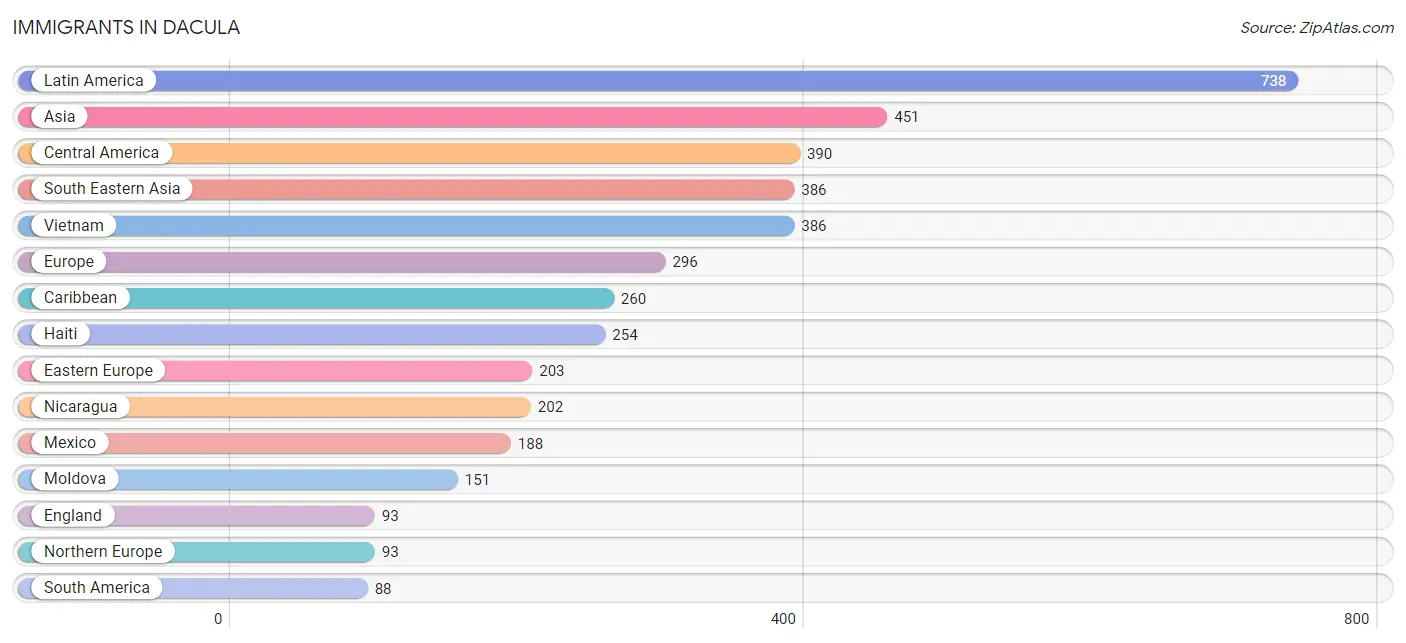
| Immigration Origin | # Population | % Population |
| Asia | 451 | 6.5% |
| Bahamas | 4 | 0.1% |
| Caribbean | 260 | 3.8% |
| Central America | 390 | 5.7% |
| China | 65 | 0.9% |
| Colombia | 46 | 0.7% |
| Dominican Republic | 2 | 0.0% |
| Eastern Asia | 65 | 0.9% |
| Eastern Europe | 203 | 2.9% |
| Ecuador | 2 | 0.0% |
| England | 93 | 1.3% |
| Europe | 296 | 4.3% |
| Haiti | 254 | 3.7% |
| Latin America | 738 | 10.7% |
| Mexico | 188 | 2.7% |
| Moldova | 151 | 2.2% |
| Nicaragua | 202 | 2.9% |
| Northern Europe | 93 | 1.3% |
| Romania | 52 | 0.7% |
| South America | 88 | 1.3% |
| South Eastern Asia | 386 | 5.6% |
| Venezuela | 40 | 0.6% |
| Vietnam | 386 | 5.6% | View All 23 Rows |
Sex and Age in Dacula
Sex and Age in Dacula
The most populous age groups in Dacula are 10 to 14 Years (632 | 17.3%) for men and 35 to 39 Years (368 | 11.3%) for women.
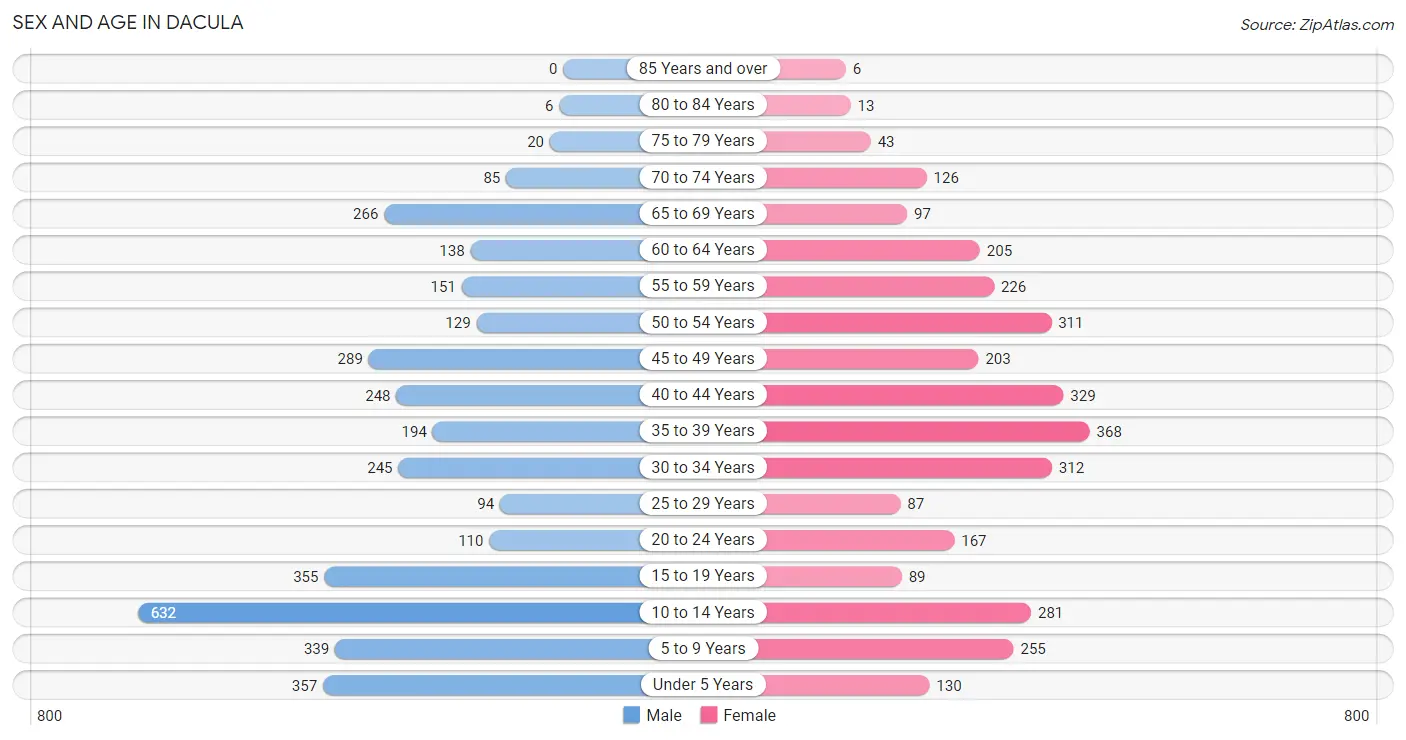
| Age Bracket | Male | Female |
| Under 5 Years | 357 (9.8%) | 130 (4.0%) |
| 5 to 9 Years | 339 (9.3%) | 255 (7.9%) |
| 10 to 14 Years | 632 (17.3%) | 281 (8.6%) |
| 15 to 19 Years | 355 (9.7%) | 89 (2.7%) |
| 20 to 24 Years | 110 (3.0%) | 167 (5.1%) |
| 25 to 29 Years | 94 (2.6%) | 87 (2.7%) |
| 30 to 34 Years | 245 (6.7%) | 312 (9.6%) |
| 35 to 39 Years | 194 (5.3%) | 368 (11.3%) |
| 40 to 44 Years | 248 (6.8%) | 329 (10.1%) |
| 45 to 49 Years | 289 (7.9%) | 203 (6.2%) |
| 50 to 54 Years | 129 (3.5%) | 311 (9.6%) |
| 55 to 59 Years | 151 (4.1%) | 226 (7.0%) |
| 60 to 64 Years | 138 (3.8%) | 205 (6.3%) |
| 65 to 69 Years | 266 (7.3%) | 97 (3.0%) |
| 70 to 74 Years | 85 (2.3%) | 126 (3.9%) |
| 75 to 79 Years | 20 (0.5%) | 43 (1.3%) |
| 80 to 84 Years | 6 (0.2%) | 13 (0.4%) |
| 85 Years and over | 0 (0.0%) | 6 (0.2%) |
| Total | 3,658 (100.0%) | 3,248 (100.0%) |
Families and Households in Dacula
Median Family Size in Dacula
The median family size in Dacula is 3.51 persons per family, with single male/father families (73 | 4.4%) accounting for the largest median family size of 3.77 persons per family. On the other hand, single female/mother families (247 | 14.8%) represent the smallest median family size with 2.94 persons per family.
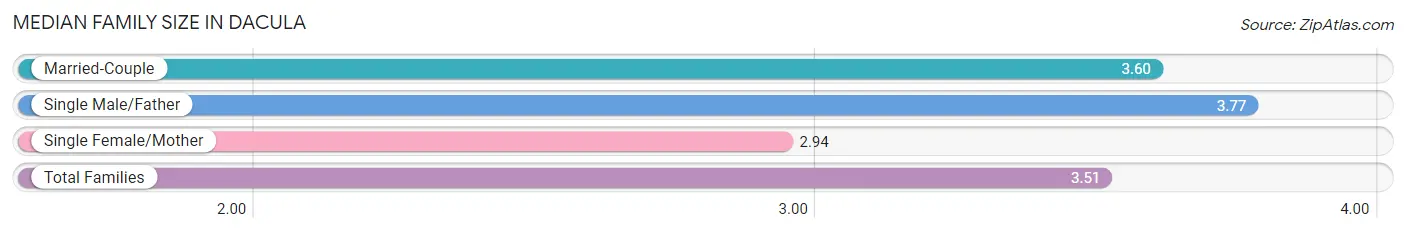
| Family Type | # Families | Family Size |
| Married-Couple | 1,348 (80.8%) | 3.60 |
| Single Male/Father | 73 (4.4%) | 3.77 |
| Single Female/Mother | 247 (14.8%) | 2.94 |
| Total Families | 1,668 (100.0%) | 3.51 |
Median Household Size in Dacula
The median household size in Dacula is 3.10 persons per household, with single male/father households (73 | 3.3%) accounting for the largest median household size of 4.51 persons per household. non-family households (562 | 25.2%) represent the smallest median household size with 1.14 persons per household.
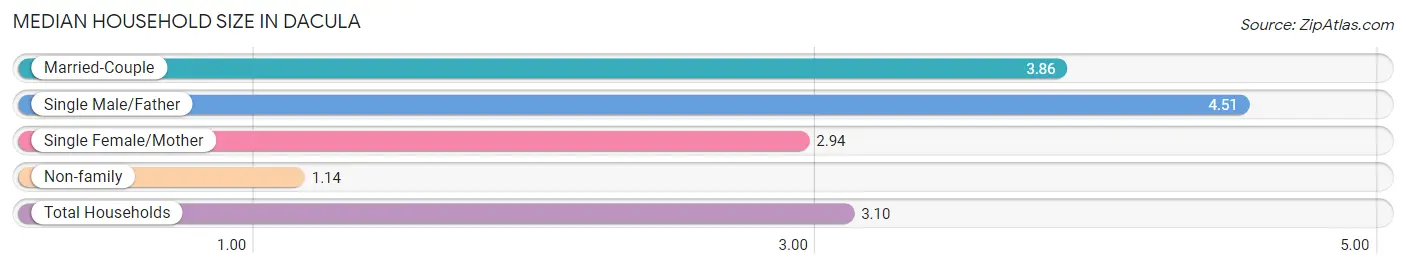
| Household Type | # Households | Household Size |
| Married-Couple | 1,348 (60.5%) | 3.86 |
| Single Male/Father | 73 (3.3%) | 4.51 |
| Single Female/Mother | 247 (11.1%) | 2.94 |
| Non-family | 562 (25.2%) | 1.14 |
| Total Households | 2,230 (100.0%) | 3.10 |
Household Size by Marriage Status in Dacula
Out of a total of 2,230 households in Dacula, 1,668 (74.8%) are family households, while 562 (25.2%) are nonfamily households. The most numerous type of family households are 3-person households, comprising 450, and the most common type of nonfamily households are 1-person households, comprising 506.
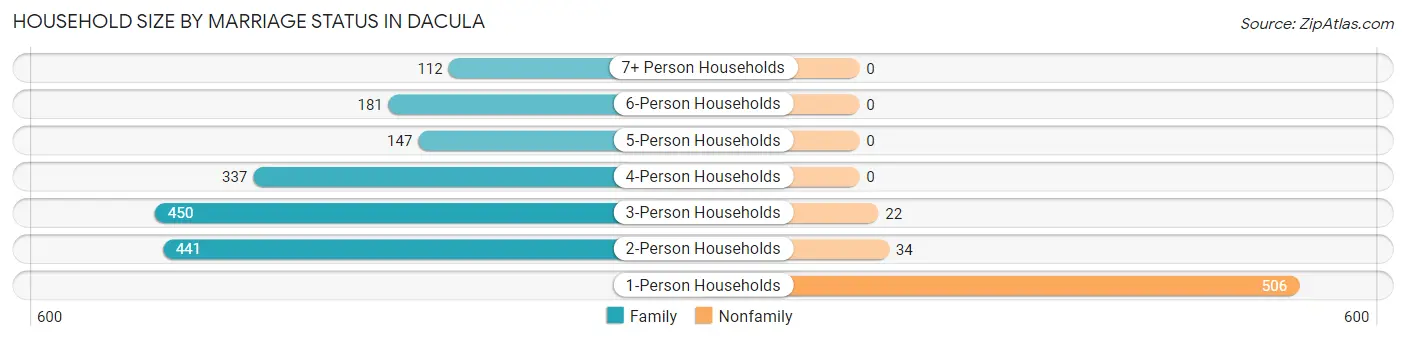
| Household Size | Family Households | Nonfamily Households |
| 1-Person Households | - | 506 (22.7%) |
| 2-Person Households | 441 (19.8%) | 34 (1.5%) |
| 3-Person Households | 450 (20.2%) | 22 (1.0%) |
| 4-Person Households | 337 (15.1%) | 0 (0.0%) |
| 5-Person Households | 147 (6.6%) | 0 (0.0%) |
| 6-Person Households | 181 (8.1%) | 0 (0.0%) |
| 7+ Person Households | 112 (5.0%) | 0 (0.0%) |
| Total | 1,668 (74.8%) | 562 (25.2%) |
Female Fertility in Dacula
Fertility by Age in Dacula
Average fertility rate in Dacula is 22.0 births per 1,000 women. Women in the age bracket of 20 to 34 years have the highest fertility rate with 64.0 births per 1,000 women. Women in the age bracket of 20 to 34 years acount for 100.0% of all women with births.
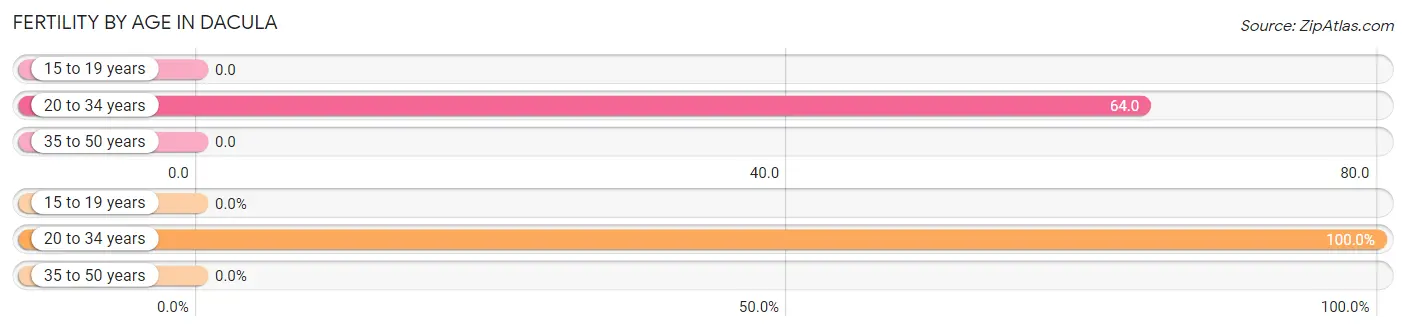
| Age Bracket | Women with Births | Births / 1,000 Women |
| 15 to 19 years | 0 (0.0%) | 0.0 |
| 20 to 34 years | 36 (100.0%) | 64.0 |
| 35 to 50 years | 0 (0.0%) | 0.0 |
| Total | 36 (100.0%) | 22.0 |
Fertility by Age by Marriage Status in Dacula
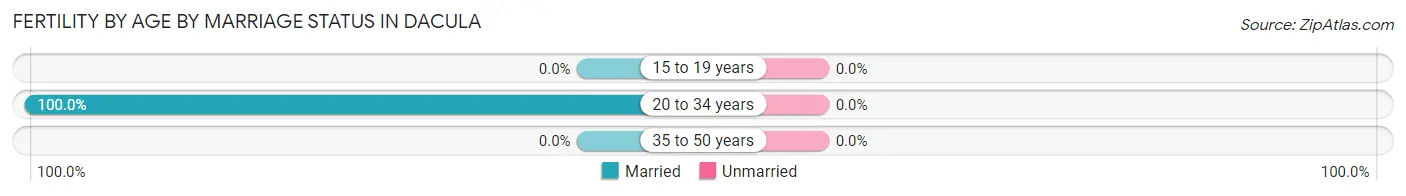
| Age Bracket | Married | Unmarried |
| 15 to 19 years | 0 (0.0%) | 0 (0.0%) |
| 20 to 34 years | 36 (100.0%) | 0 (0.0%) |
| 35 to 50 years | 0 (0.0%) | 0 (0.0%) |
| Total | 36 (100.0%) | 0 (0.0%) |
Fertility by Education in Dacula
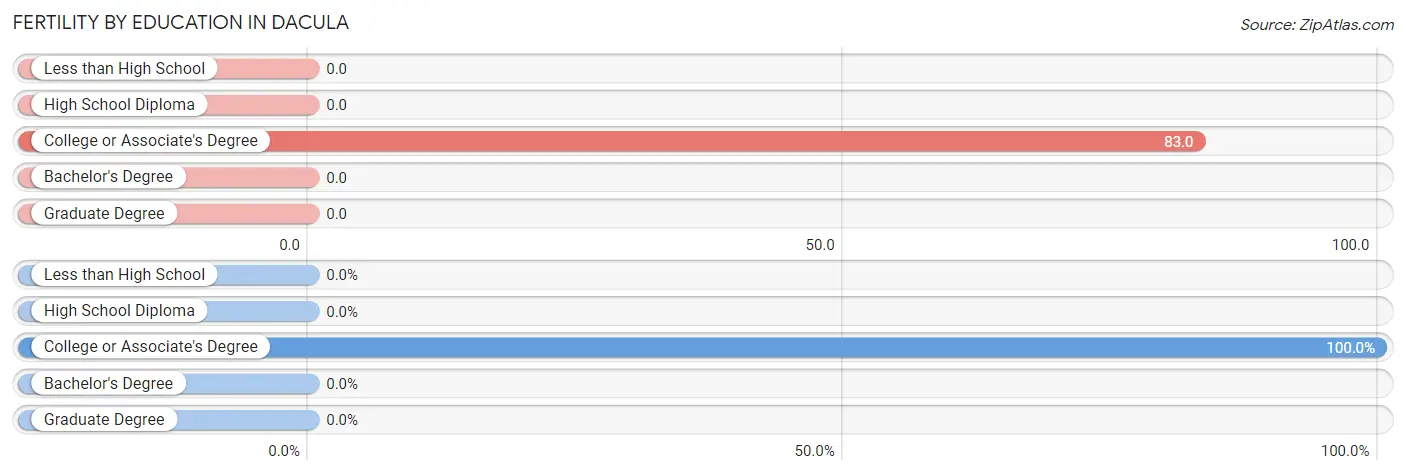
| Educational Attainment | Women with Births | Births / 1,000 Women |
| Less than High School | 0 (0.0%) | 0.0 |
| High School Diploma | 0 (0.0%) | 0.0 |
| College or Associate's Degree | 36 (100.0%) | 83.0 |
| Bachelor's Degree | 0 (0.0%) | 0.0 |
| Graduate Degree | 0 (0.0%) | 0.0 |
| Total | 36 (100.0%) | 22.0 |
Fertility by Education by Marriage Status in Dacula
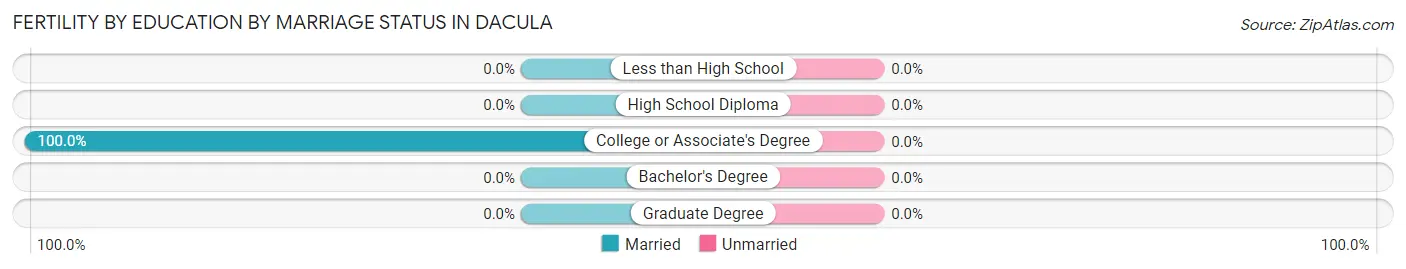
| Educational Attainment | Married | Unmarried |
| Less than High School | 0 (0.0%) | 0 (0.0%) |
| High School Diploma | 0 (0.0%) | 0 (0.0%) |
| College or Associate's Degree | 36 (100.0%) | 0 (0.0%) |
| Bachelor's Degree | 0 (0.0%) | 0 (0.0%) |
| Graduate Degree | 0 (0.0%) | 0 (0.0%) |
| Total | 36 (100.0%) | 0 (0.0%) |
Employment Characteristics in Dacula
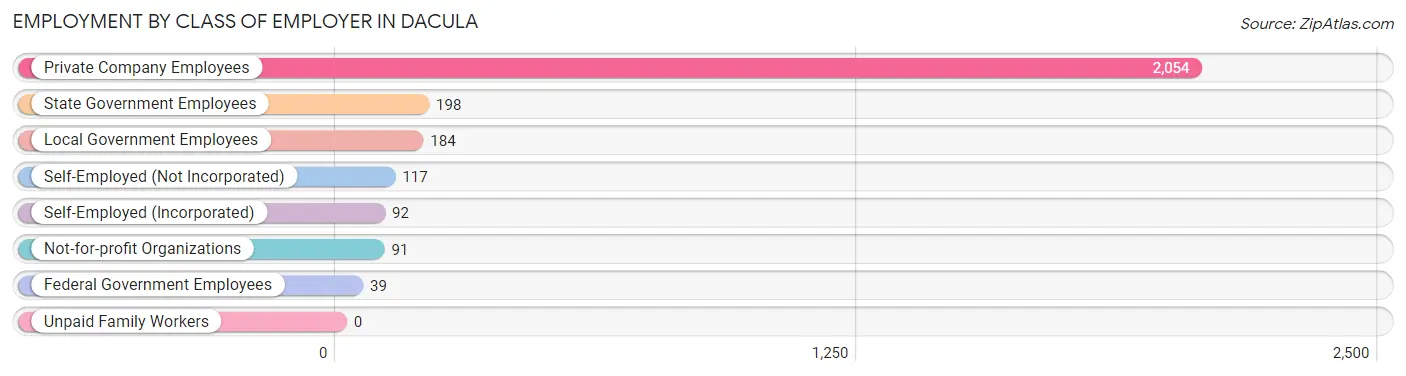
Employment by Class of Employer in Dacula
Among the 2,775 employed individuals in Dacula, private company employees (2,054 | 74.0%), state government employees (198 | 7.1%), and local government employees (184 | 6.6%) make up the most common classes of employment.
| Employer Class | # Employees | % Employees |
| Private Company Employees | 2,054 | 74.0% |
| Self-Employed (Incorporated) | 92 | 3.3% |
| Self-Employed (Not Incorporated) | 117 | 4.2% |
| Not-for-profit Organizations | 91 | 3.3% |
| Local Government Employees | 184 | 6.6% |
| State Government Employees | 198 | 7.1% |
| Federal Government Employees | 39 | 1.4% |
| Unpaid Family Workers | 0 | 0.0% |
| Total | 2,775 | 100.0% |
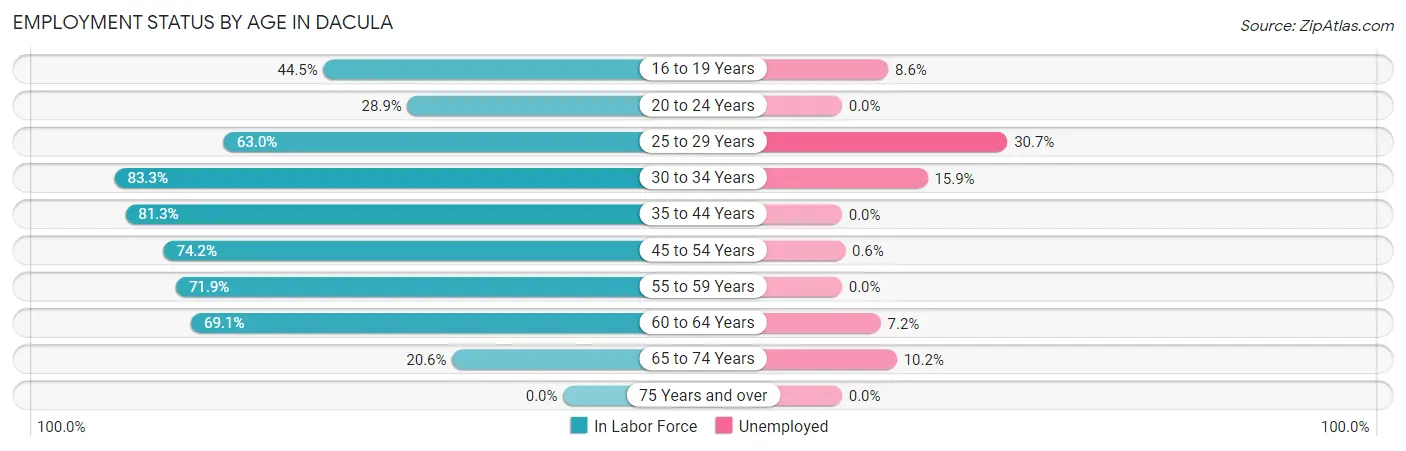
Employment Status by Age in Dacula
According to the labor force statistics for Dacula, out of the total population over 16 years of age (4,884), 63.2% or 3,087 individuals are in the labor force, with 5.1% or 157 of them unemployed. The age group with the highest labor force participation rate is 30 to 34 years, with 83.3% or 464 individuals in the labor force. Within the labor force, the 25 to 29 years age range has the highest percentage of unemployed individuals, with 30.7% or 35 of them being unemployed.
| Age Bracket | In Labor Force | Unemployed |
| 16 to 19 Years | 185 (44.5%) | 16 (8.6%) |
| 20 to 24 Years | 80 (28.9%) | 0 (0.0%) |
| 25 to 29 Years | 114 (63.0%) | 35 (30.7%) |
| 30 to 34 Years | 464 (83.3%) | 74 (15.9%) |
| 35 to 44 Years | 926 (81.3%) | 0 (0.0%) |
| 45 to 54 Years | 692 (74.2%) | 4 (0.6%) |
| 55 to 59 Years | 271 (71.9%) | 0 (0.0%) |
| 60 to 64 Years | 237 (69.1%) | 17 (7.2%) |
| 65 to 74 Years | 118 (20.6%) | 12 (10.2%) |
| 75 Years and over | 0 (0.0%) | 0 (0.0%) |
| Total | 3,087 (63.2%) | 157 (5.1%) |
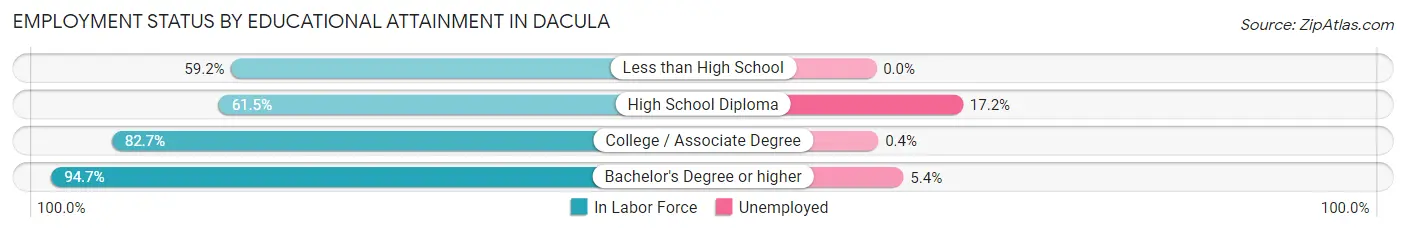
Employment Status by Educational Attainment in Dacula
According to labor force statistics for Dacula, 76.6% of individuals (2,703) out of the total population between 25 and 64 years of age (3,529) are in the labor force, with 4.8% or 130 of them being unemployed. The group with the highest labor force participation rate are those with the educational attainment of bachelor's degree or higher, with 94.7% or 827 individuals in the labor force. Within the labor force, individuals with high school diploma education have the highest percentage of unemployment, with 17.2% or 81 of them being unemployed.
| Educational Attainment | In Labor Force | Unemployed |
| Less than High School | 398 (59.2%) | 0 (0.0%) |
| High School Diploma | 472 (61.5%) | 132 (17.2%) |
| College / Associate Degree | 1,006 (82.7%) | 5 (0.4%) |
| Bachelor's Degree or higher | 827 (94.7%) | 47 (5.4%) |
| Total | 2,703 (76.6%) | 169 (4.8%) |
Employment Occupations by Sex in Dacula
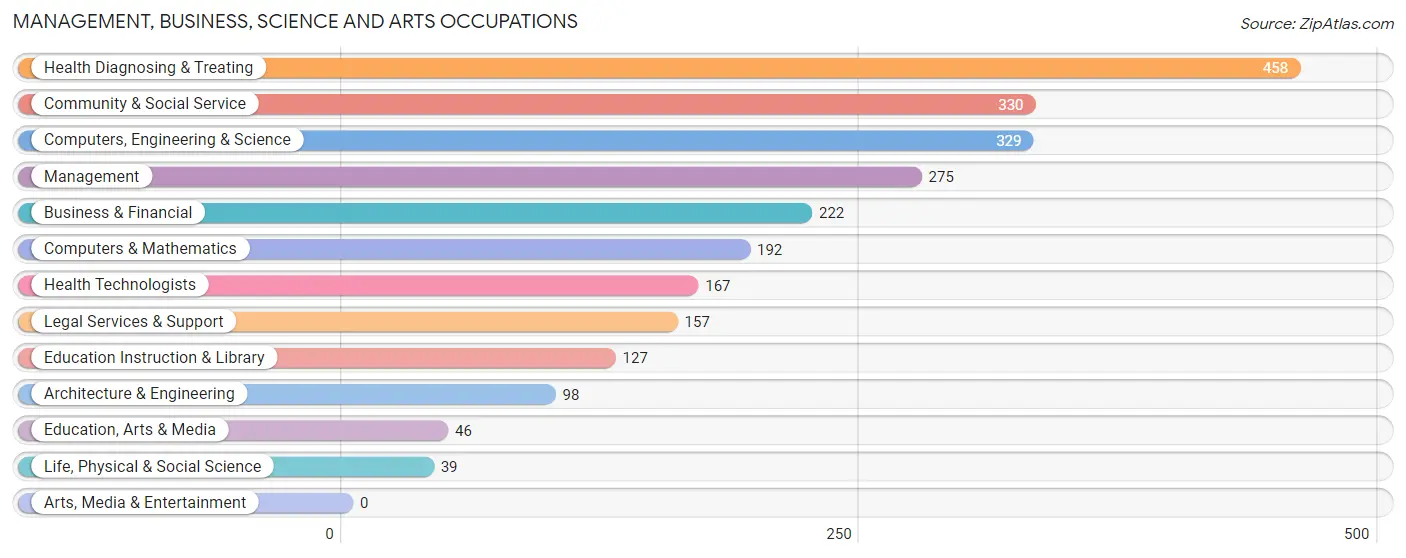
Management, Business, Science and Arts Occupations
The most common Management, Business, Science and Arts occupations in Dacula are Health Diagnosing & Treating (458 | 15.6%), Community & Social Service (330 | 11.3%), Computers, Engineering & Science (329 | 11.2%), Management (275 | 9.4%), and Business & Financial (222 | 7.6%).
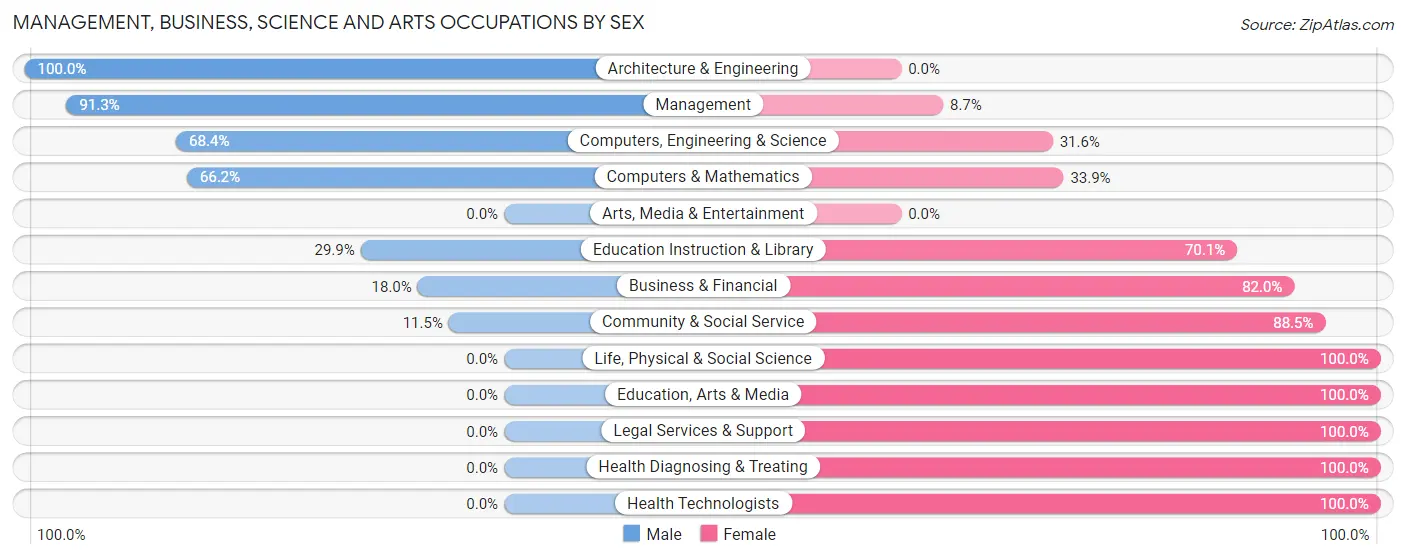
Management, Business, Science and Arts Occupations by Sex
Within the Management, Business, Science and Arts occupations in Dacula, the most male-oriented occupations are Architecture & Engineering (100.0%), Management (91.3%), and Computers, Engineering & Science (68.4%), while the most female-oriented occupations are Life, Physical & Social Science (100.0%), Education, Arts & Media (100.0%), and Legal Services & Support (100.0%).
| Occupation | Male | Female |
| Management | 251 (91.3%) | 24 (8.7%) |
| Business & Financial | 40 (18.0%) | 182 (82.0%) |
| Computers, Engineering & Science | 225 (68.4%) | 104 (31.6%) |
| Computers & Mathematics | 127 (66.1%) | 65 (33.9%) |
| Architecture & Engineering | 98 (100.0%) | 0 (0.0%) |
| Life, Physical & Social Science | 0 (0.0%) | 39 (100.0%) |
| Community & Social Service | 38 (11.5%) | 292 (88.5%) |
| Education, Arts & Media | 0 (0.0%) | 46 (100.0%) |
| Legal Services & Support | 0 (0.0%) | 157 (100.0%) |
| Education Instruction & Library | 38 (29.9%) | 89 (70.1%) |
| Arts, Media & Entertainment | 0 (0.0%) | 0 (0.0%) |
| Health Diagnosing & Treating | 0 (0.0%) | 458 (100.0%) |
| Health Technologists | 0 (0.0%) | 167 (100.0%) |
| Total (Category) | 554 (34.3%) | 1,060 (65.7%) |
| Total (Overall) | 1,500 (51.2%) | 1,429 (48.8%) |
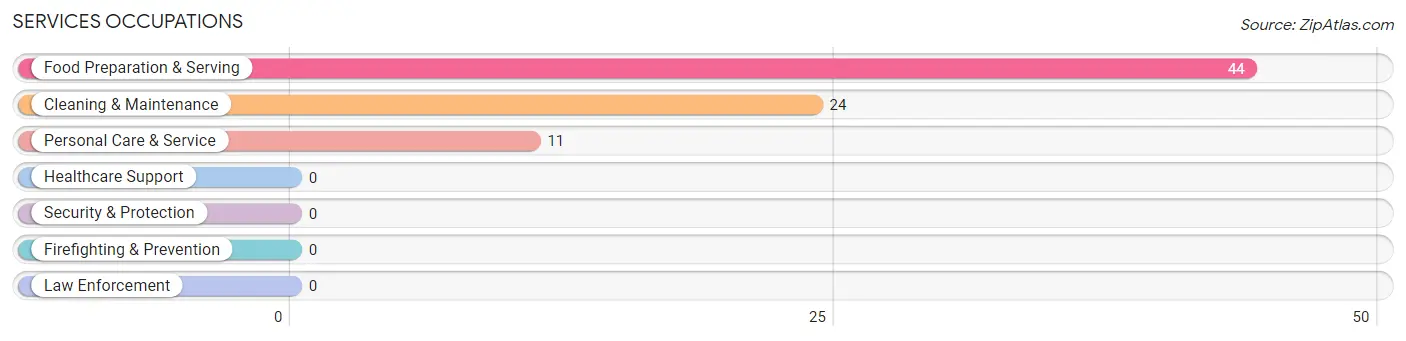
Services Occupations
The most common Services occupations in Dacula are Food Preparation & Serving (44 | 1.5%), Cleaning & Maintenance (24 | 0.8%), and Personal Care & Service (11 | 0.4%).
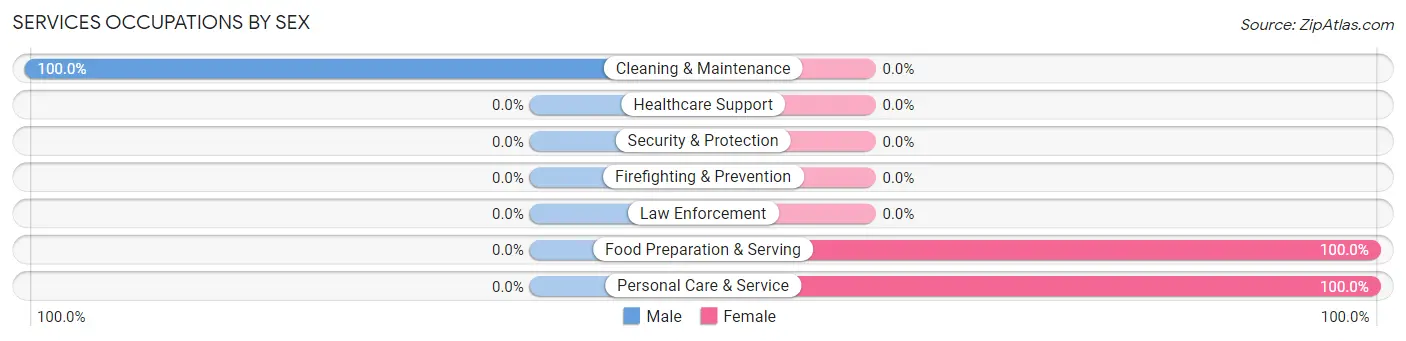
Services Occupations by Sex
| Occupation | Male | Female |
| Healthcare Support | 0 (0.0%) | 0 (0.0%) |
| Security & Protection | 0 (0.0%) | 0 (0.0%) |
| Firefighting & Prevention | 0 (0.0%) | 0 (0.0%) |
| Law Enforcement | 0 (0.0%) | 0 (0.0%) |
| Food Preparation & Serving | 0 (0.0%) | 44 (100.0%) |
| Cleaning & Maintenance | 24 (100.0%) | 0 (0.0%) |
| Personal Care & Service | 0 (0.0%) | 11 (100.0%) |
| Total (Category) | 24 (30.4%) | 55 (69.6%) |
| Total (Overall) | 1,500 (51.2%) | 1,429 (48.8%) |
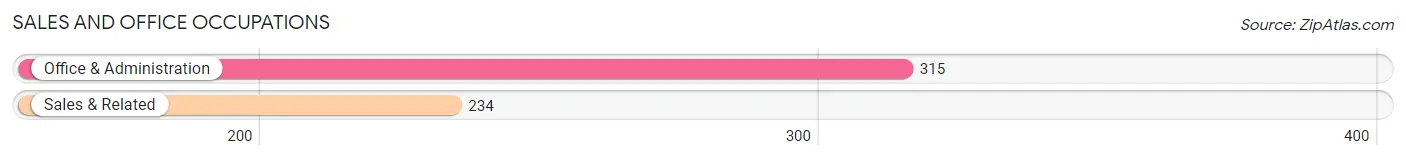
Sales and Office Occupations
The most common Sales and Office occupations in Dacula are Office & Administration (315 | 10.7%), and Sales & Related (234 | 8.0%).
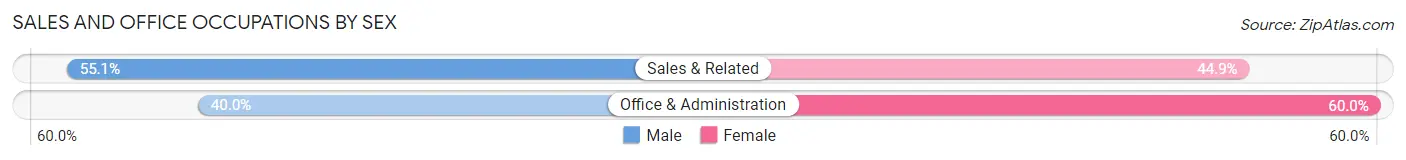
Sales and Office Occupations by Sex
| Occupation | Male | Female |
| Sales & Related | 129 (55.1%) | 105 (44.9%) |
| Office & Administration | 126 (40.0%) | 189 (60.0%) |
| Total (Category) | 255 (46.5%) | 294 (53.5%) |
| Total (Overall) | 1,500 (51.2%) | 1,429 (48.8%) |
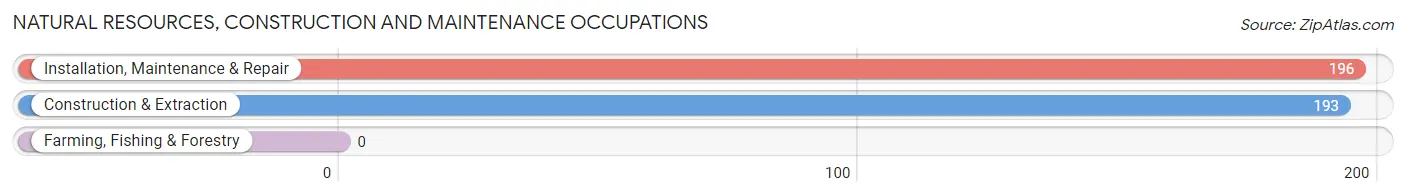
Natural Resources, Construction and Maintenance Occupations
The most common Natural Resources, Construction and Maintenance occupations in Dacula are Installation, Maintenance & Repair (196 | 6.7%), and Construction & Extraction (193 | 6.6%).
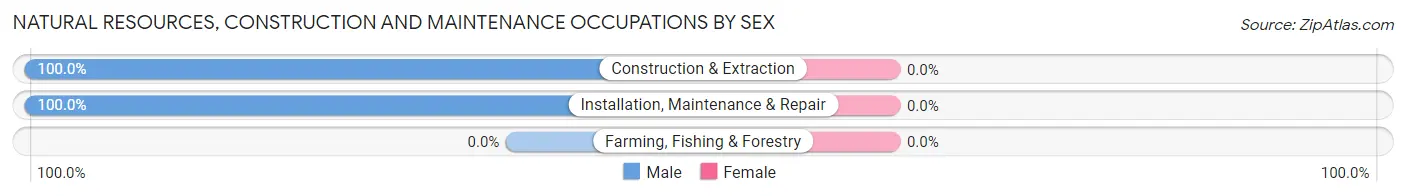
Natural Resources, Construction and Maintenance Occupations by Sex
| Occupation | Male | Female |
| Farming, Fishing & Forestry | 0 (0.0%) | 0 (0.0%) |
| Construction & Extraction | 193 (100.0%) | 0 (0.0%) |
| Installation, Maintenance & Repair | 196 (100.0%) | 0 (0.0%) |
| Total (Category) | 389 (100.0%) | 0 (0.0%) |
| Total (Overall) | 1,500 (51.2%) | 1,429 (48.8%) |
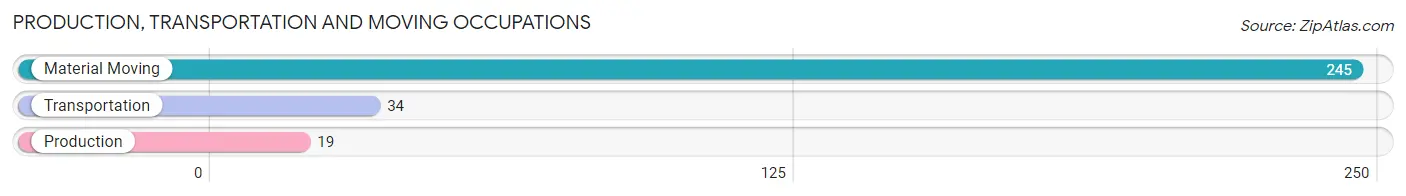
Production, Transportation and Moving Occupations
The most common Production, Transportation and Moving occupations in Dacula are Material Moving (245 | 8.4%), Transportation (34 | 1.2%), and Production (19 | 0.6%).
Production, Transportation and Moving Occupations by Sex
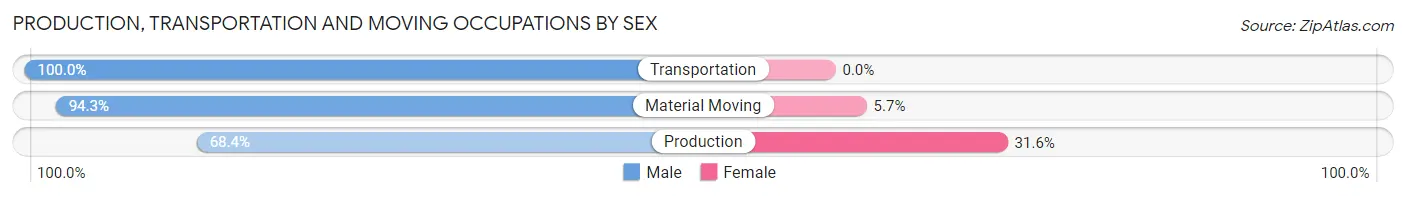
| Occupation | Male | Female |
| Production | 13 (68.4%) | 6 (31.6%) |
| Transportation | 34 (100.0%) | 0 (0.0%) |
| Material Moving | 231 (94.3%) | 14 (5.7%) |
| Total (Category) | 278 (93.3%) | 20 (6.7%) |
| Total (Overall) | 1,500 (51.2%) | 1,429 (48.8%) |
Employment Industries by Sex in Dacula
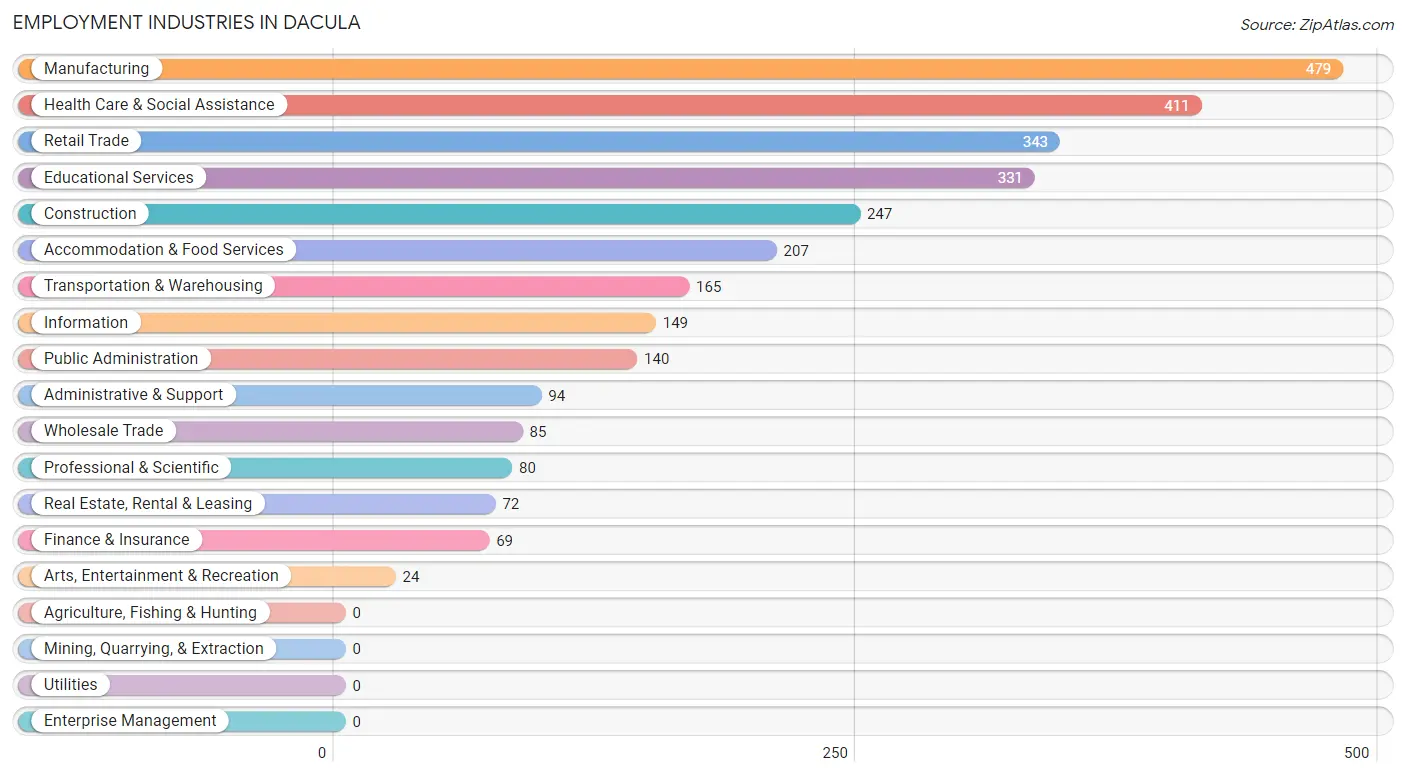
Employment Industries in Dacula
The major employment industries in Dacula include Manufacturing (479 | 16.4%), Health Care & Social Assistance (411 | 14.0%), Retail Trade (343 | 11.7%), Educational Services (331 | 11.3%), and Construction (247 | 8.4%).
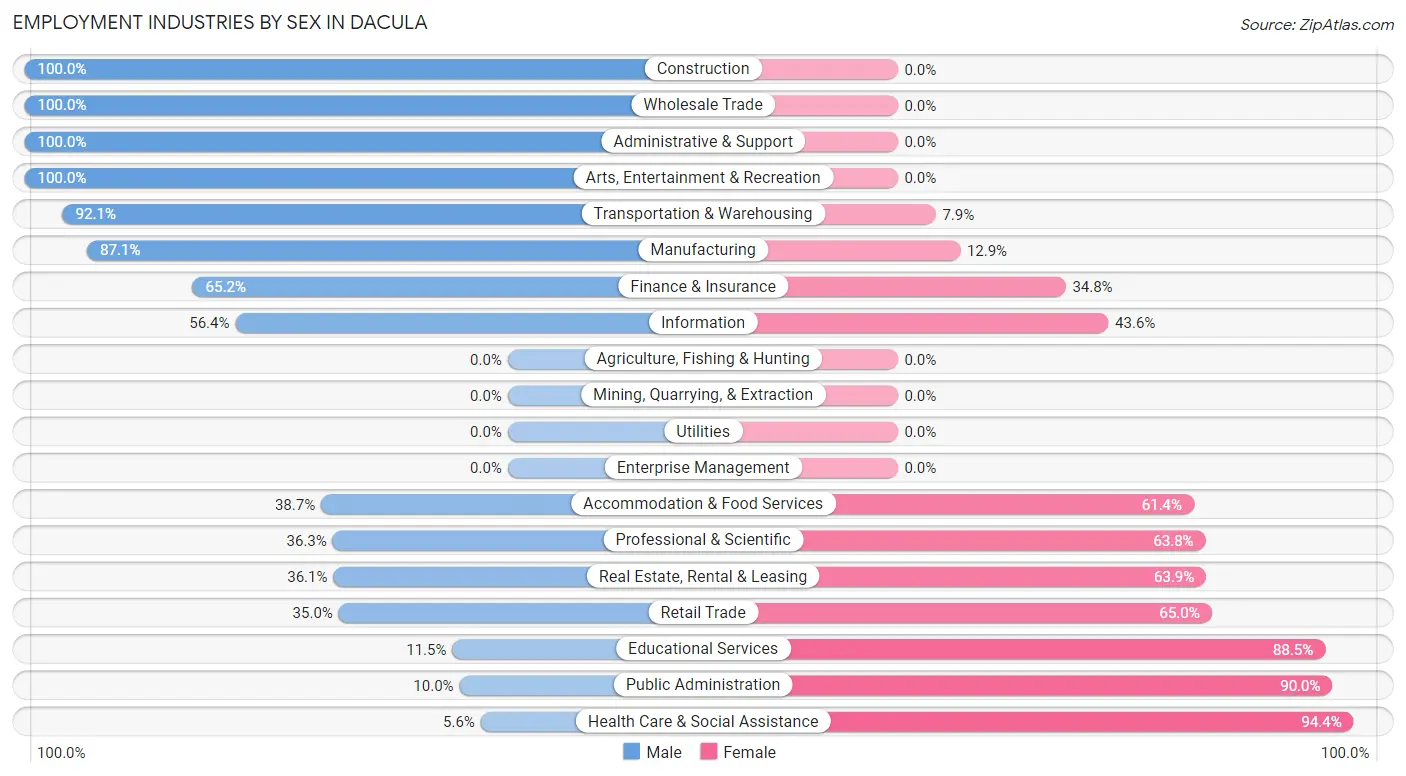
Employment Industries by Sex in Dacula
The Dacula industries that see more men than women are Construction (100.0%), Wholesale Trade (100.0%), and Administrative & Support (100.0%), whereas the industries that tend to have a higher number of women are Health Care & Social Assistance (94.4%), Public Administration (90.0%), and Educational Services (88.5%).
| Industry | Male | Female |
| Agriculture, Fishing & Hunting | 0 (0.0%) | 0 (0.0%) |
| Mining, Quarrying, & Extraction | 0 (0.0%) | 0 (0.0%) |
| Construction | 247 (100.0%) | 0 (0.0%) |
| Manufacturing | 417 (87.1%) | 62 (12.9%) |
| Wholesale Trade | 85 (100.0%) | 0 (0.0%) |
| Retail Trade | 120 (35.0%) | 223 (65.0%) |
| Transportation & Warehousing | 152 (92.1%) | 13 (7.9%) |
| Utilities | 0 (0.0%) | 0 (0.0%) |
| Information | 84 (56.4%) | 65 (43.6%) |
| Finance & Insurance | 45 (65.2%) | 24 (34.8%) |
| Real Estate, Rental & Leasing | 26 (36.1%) | 46 (63.9%) |
| Professional & Scientific | 29 (36.2%) | 51 (63.7%) |
| Enterprise Management | 0 (0.0%) | 0 (0.0%) |
| Administrative & Support | 94 (100.0%) | 0 (0.0%) |
| Educational Services | 38 (11.5%) | 293 (88.5%) |
| Health Care & Social Assistance | 23 (5.6%) | 388 (94.4%) |
| Arts, Entertainment & Recreation | 24 (100.0%) | 0 (0.0%) |
| Accommodation & Food Services | 80 (38.7%) | 127 (61.4%) |
| Public Administration | 14 (10.0%) | 126 (90.0%) |
| Total | 1,500 (51.2%) | 1,429 (48.8%) |
Education in Dacula
School Enrollment in Dacula
The most common levels of schooling among the 2,323 students in Dacula are middle school (631 | 27.2%), elementary school (534 | 23.0%), and high school (444 | 19.1%).
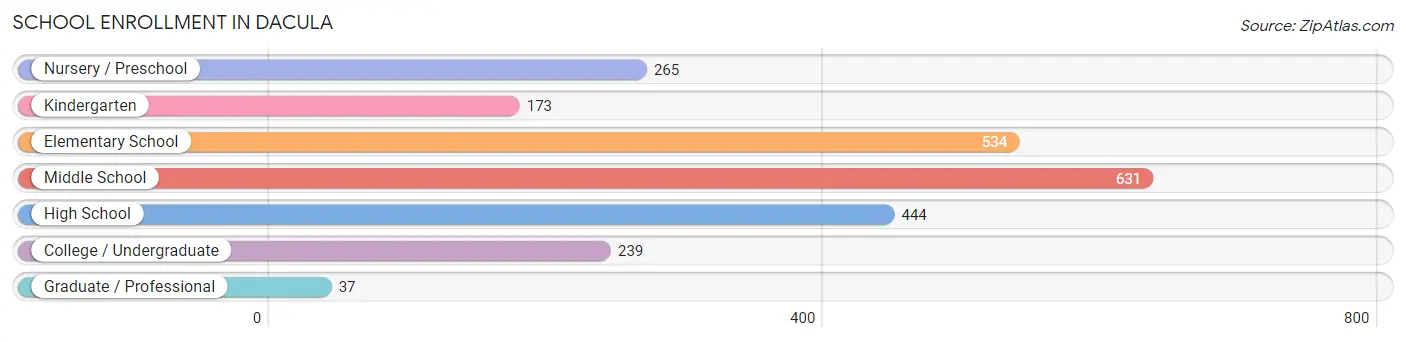
| School Level | # Students | % Students |
| Nursery / Preschool | 265 | 11.4% |
| Kindergarten | 173 | 7.4% |
| Elementary School | 534 | 23.0% |
| Middle School | 631 | 27.2% |
| High School | 444 | 19.1% |
| College / Undergraduate | 239 | 10.3% |
| Graduate / Professional | 37 | 1.6% |
| Total | 2,323 | 100.0% |
School Enrollment by Age by Funding Source in Dacula
Out of a total of 2,323 students who are enrolled in schools in Dacula, 539 (23.2%) attend a private institution, while the remaining 1,784 (76.8%) are enrolled in public schools. The age group of 3 to 4 year olds has the highest likelihood of being enrolled in private schools, with 154 (70.0% in the age bracket) enrolled. Conversely, the age group of 15 to 17 year olds has the lowest likelihood of being enrolled in a private school, with 137 (100.0% in the age bracket) attending a public institution.
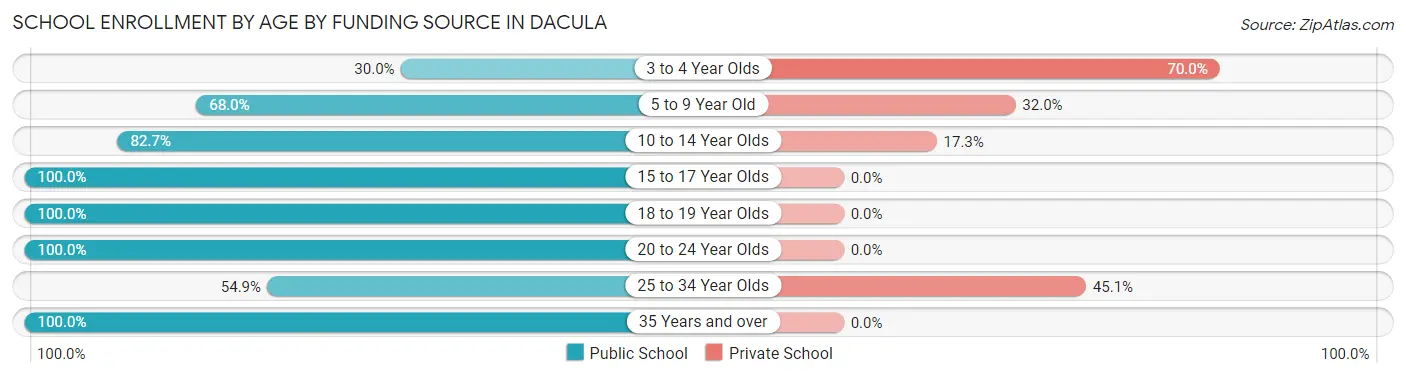
| Age Bracket | Public School | Private School |
| 3 to 4 Year Olds | 66 (30.0%) | 154 (70.0%) |
| 5 to 9 Year Old | 404 (68.0%) | 190 (32.0%) |
| 10 to 14 Year Olds | 755 (82.7%) | 158 (17.3%) |
| 15 to 17 Year Olds | 137 (100.0%) | 0 (0.0%) |
| 18 to 19 Year Olds | 288 (100.0%) | 0 (0.0%) |
| 20 to 24 Year Olds | 14 (100.0%) | 0 (0.0%) |
| 25 to 34 Year Olds | 45 (54.9%) | 37 (45.1%) |
| 35 Years and over | 75 (100.0%) | 0 (0.0%) |
| Total | 1,784 (76.8%) | 539 (23.2%) |
Educational Attainment by Field of Study in Dacula
Business (320 | 29.8%), education (157 | 14.6%), bio, nature & agricultural (114 | 10.6%), psychology (75 | 7.0%), and physical & health sciences (72 | 6.7%) are the most common fields of study among 1,073 individuals in Dacula who have obtained a bachelor's degree or higher.
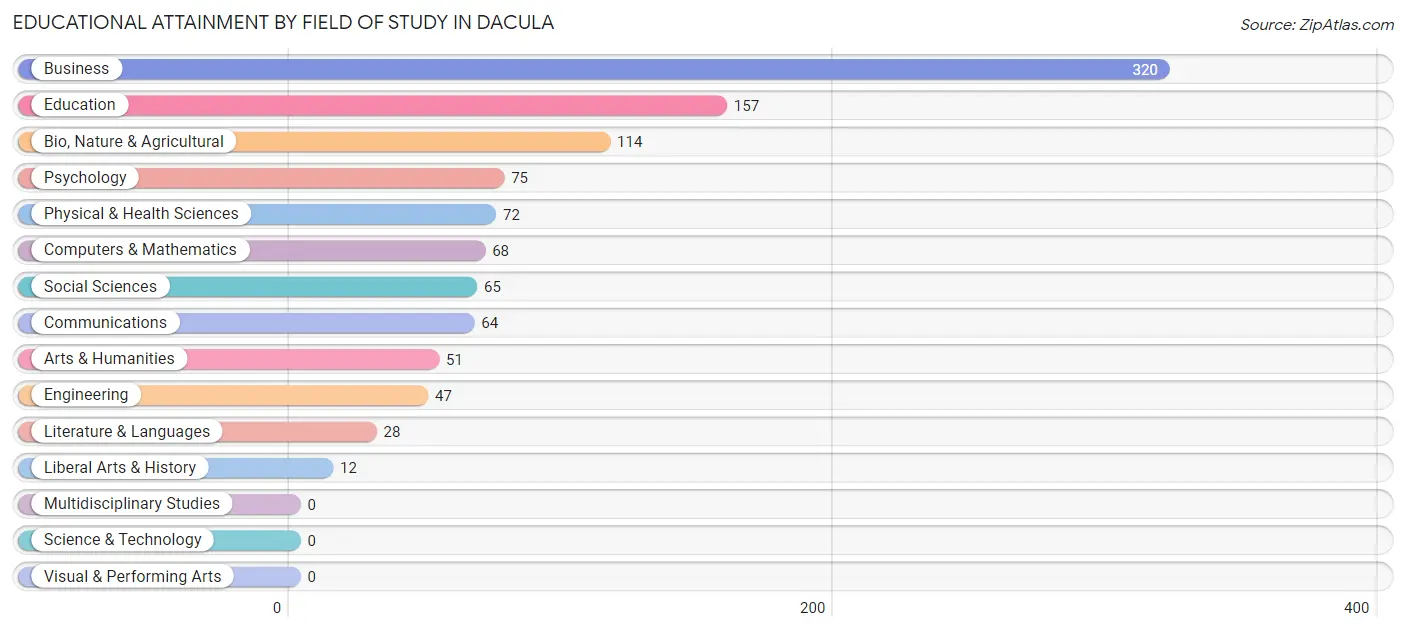
| Field of Study | # Graduates | % Graduates |
| Computers & Mathematics | 68 | 6.3% |
| Bio, Nature & Agricultural | 114 | 10.6% |
| Physical & Health Sciences | 72 | 6.7% |
| Psychology | 75 | 7.0% |
| Social Sciences | 65 | 6.1% |
| Engineering | 47 | 4.4% |
| Multidisciplinary Studies | 0 | 0.0% |
| Science & Technology | 0 | 0.0% |
| Business | 320 | 29.8% |
| Education | 157 | 14.6% |
| Literature & Languages | 28 | 2.6% |
| Liberal Arts & History | 12 | 1.1% |
| Visual & Performing Arts | 0 | 0.0% |
| Communications | 64 | 6.0% |
| Arts & Humanities | 51 | 4.8% |
| Total | 1,073 | 100.0% |
Transportation & Commute in Dacula
Vehicle Availability by Sex in Dacula
The most prevalent vehicle ownership categories in Dacula are males with 2 vehicles (552, accounting for 39.7%) and females with 2 vehicles (273, making up 39.9%).
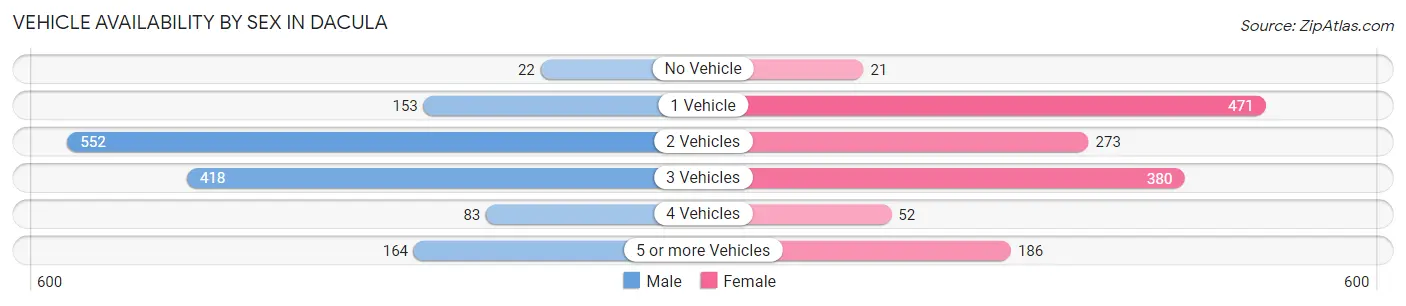
| Vehicles Available | Male | Female |
| No Vehicle | 22 (1.6%) | 21 (1.5%) |
| 1 Vehicle | 153 (11.0%) | 471 (34.1%) |
| 2 Vehicles | 552 (39.7%) | 273 (19.7%) |
| 3 Vehicles | 418 (30.0%) | 380 (27.5%) |
| 4 Vehicles | 83 (6.0%) | 52 (3.8%) |
| 5 or more Vehicles | 164 (11.8%) | 186 (13.5%) |
| Total | 1,392 (100.0%) | 1,383 (100.0%) |
Commute Time in Dacula
The most frequently occuring commute durations in Dacula are 60 to 89 minutes (387 commuters, 18.2%), 30 to 34 minutes (286 commuters, 13.5%), and 45 to 59 minutes (283 commuters, 13.3%).
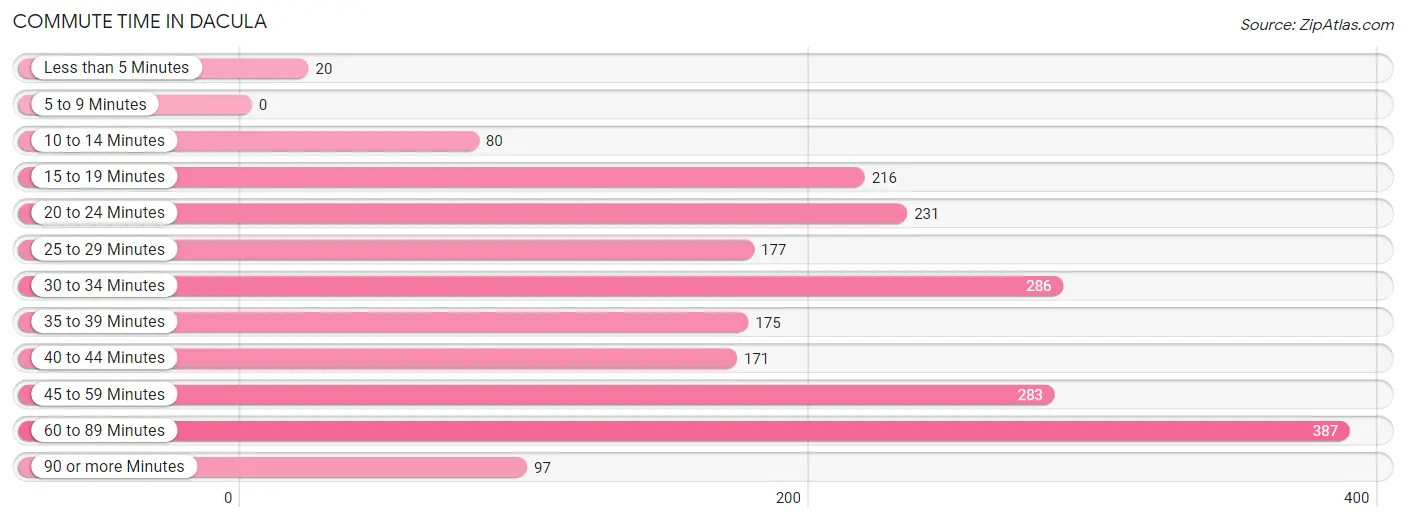
| Commute Time | # Commuters | % Commuters |
| Less than 5 Minutes | 20 | 0.9% |
| 5 to 9 Minutes | 0 | 0.0% |
| 10 to 14 Minutes | 80 | 3.8% |
| 15 to 19 Minutes | 216 | 10.2% |
| 20 to 24 Minutes | 231 | 10.9% |
| 25 to 29 Minutes | 177 | 8.3% |
| 30 to 34 Minutes | 286 | 13.5% |
| 35 to 39 Minutes | 175 | 8.2% |
| 40 to 44 Minutes | 171 | 8.1% |
| 45 to 59 Minutes | 283 | 13.3% |
| 60 to 89 Minutes | 387 | 18.2% |
| 90 or more Minutes | 97 | 4.6% |
Commute Time by Sex in Dacula
The most common commute times in Dacula are 30 to 34 minutes (216 commuters, 18.6%) for males and 45 to 59 minutes (199 commuters, 20.7%) for females.
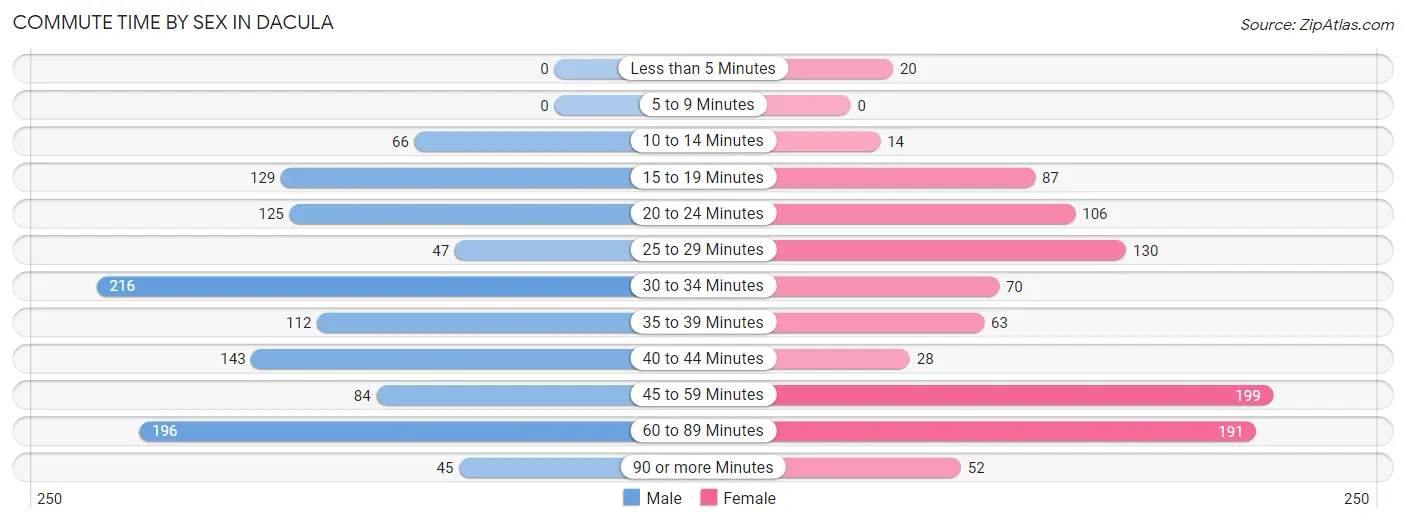
| Commute Time | Male | Female |
| Less than 5 Minutes | 0 (0.0%) | 20 (2.1%) |
| 5 to 9 Minutes | 0 (0.0%) | 0 (0.0%) |
| 10 to 14 Minutes | 66 (5.7%) | 14 (1.5%) |
| 15 to 19 Minutes | 129 (11.1%) | 87 (9.1%) |
| 20 to 24 Minutes | 125 (10.7%) | 106 (11.0%) |
| 25 to 29 Minutes | 47 (4.0%) | 130 (13.5%) |
| 30 to 34 Minutes | 216 (18.6%) | 70 (7.3%) |
| 35 to 39 Minutes | 112 (9.6%) | 63 (6.6%) |
| 40 to 44 Minutes | 143 (12.3%) | 28 (2.9%) |
| 45 to 59 Minutes | 84 (7.2%) | 199 (20.7%) |
| 60 to 89 Minutes | 196 (16.9%) | 191 (19.9%) |
| 90 or more Minutes | 45 (3.9%) | 52 (5.4%) |
Time of Departure to Work by Sex in Dacula
The most frequent times of departure to work in Dacula are 8:00 AM to 8:29 AM (278, 23.9%) for males and 6:30 AM to 6:59 AM (205, 21.3%) for females.
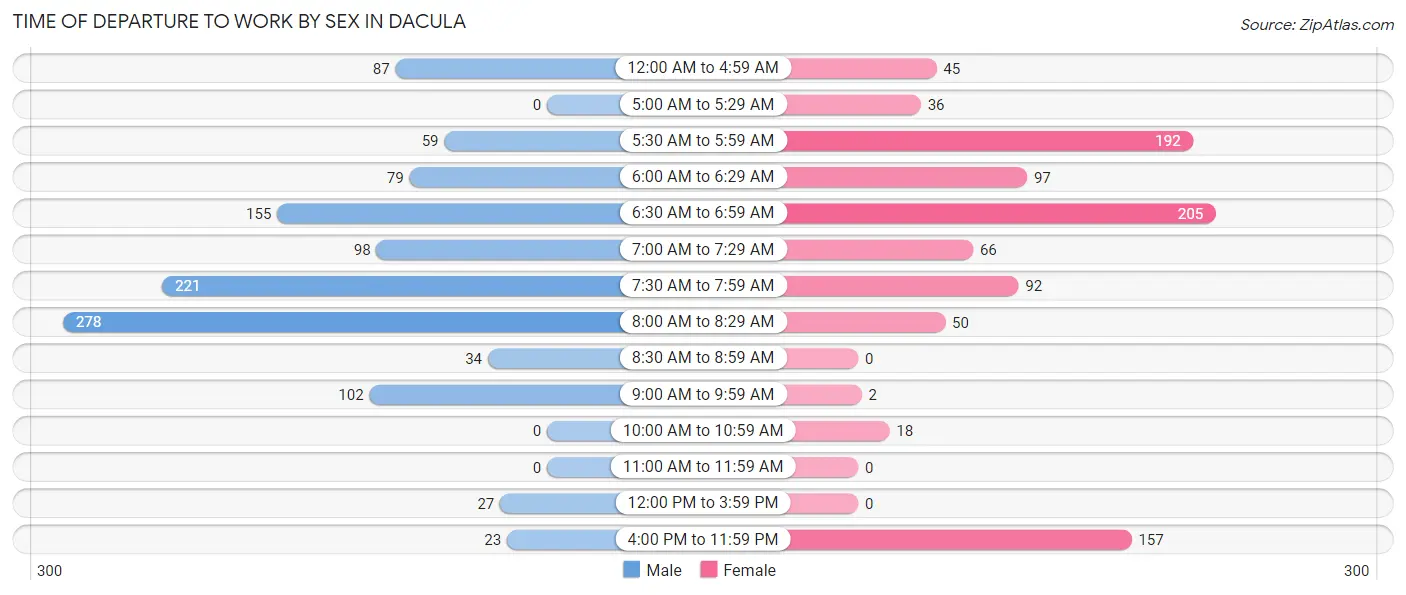
| Time of Departure | Male | Female |
| 12:00 AM to 4:59 AM | 87 (7.5%) | 45 (4.7%) |
| 5:00 AM to 5:29 AM | 0 (0.0%) | 36 (3.7%) |
| 5:30 AM to 5:59 AM | 59 (5.1%) | 192 (20.0%) |
| 6:00 AM to 6:29 AM | 79 (6.8%) | 97 (10.1%) |
| 6:30 AM to 6:59 AM | 155 (13.3%) | 205 (21.3%) |
| 7:00 AM to 7:29 AM | 98 (8.4%) | 66 (6.9%) |
| 7:30 AM to 7:59 AM | 221 (19.0%) | 92 (9.6%) |
| 8:00 AM to 8:29 AM | 278 (23.9%) | 50 (5.2%) |
| 8:30 AM to 8:59 AM | 34 (2.9%) | 0 (0.0%) |
| 9:00 AM to 9:59 AM | 102 (8.8%) | 2 (0.2%) |
| 10:00 AM to 10:59 AM | 0 (0.0%) | 18 (1.9%) |
| 11:00 AM to 11:59 AM | 0 (0.0%) | 0 (0.0%) |
| 12:00 PM to 3:59 PM | 27 (2.3%) | 0 (0.0%) |
| 4:00 PM to 11:59 PM | 23 (2.0%) | 157 (16.4%) |
| Total | 1,163 (100.0%) | 960 (100.0%) |
Housing Occupancy in Dacula
Occupancy by Ownership in Dacula
Of the total 2,230 dwellings in Dacula, owner-occupied units account for 1,886 (84.6%), while renter-occupied units make up 344 (15.4%).
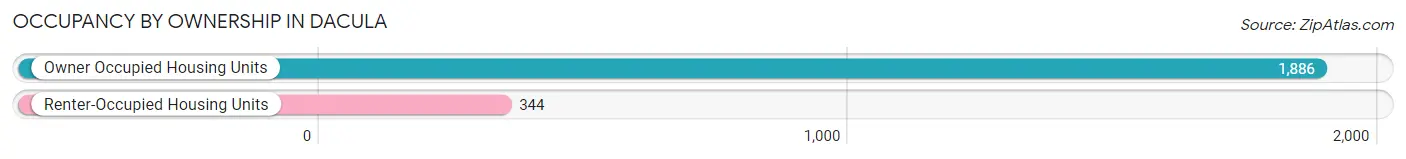
| Occupancy | # Housing Units | % Housing Units |
| Owner Occupied Housing Units | 1,886 | 84.6% |
| Renter-Occupied Housing Units | 344 | 15.4% |
| Total Occupied Housing Units | 2,230 | 100.0% |
Occupancy by Household Size in Dacula
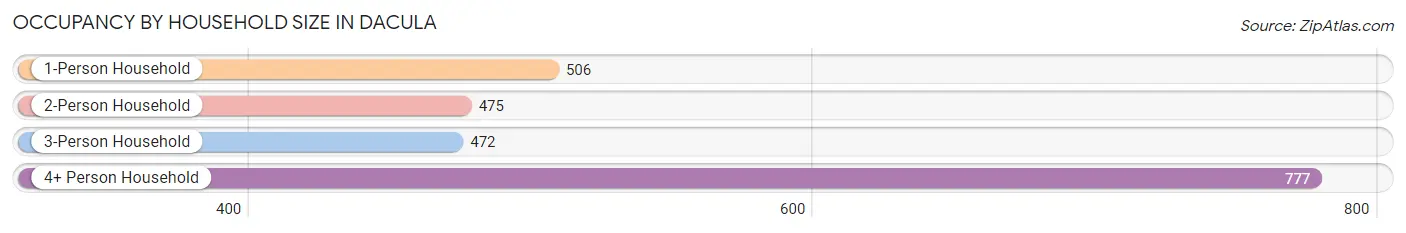
| Household Size | # Housing Units | % Housing Units |
| 1-Person Household | 506 | 22.7% |
| 2-Person Household | 475 | 21.3% |
| 3-Person Household | 472 | 21.2% |
| 4+ Person Household | 777 | 34.8% |
| Total Housing Units | 2,230 | 100.0% |
Occupancy by Ownership by Household Size in Dacula
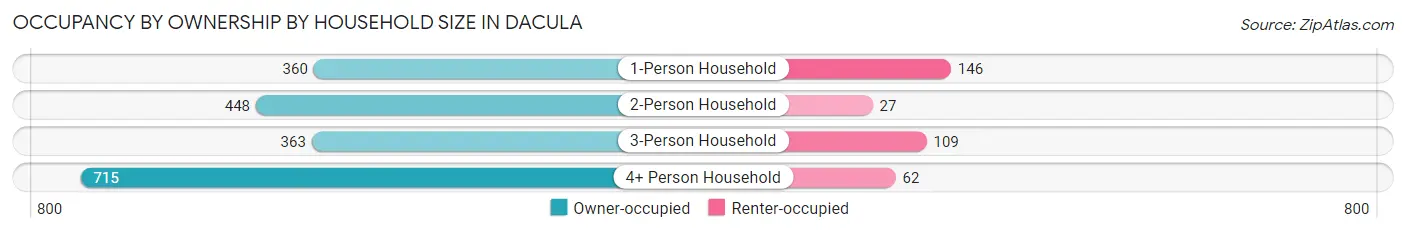
| Household Size | Owner-occupied | Renter-occupied |
| 1-Person Household | 360 (71.2%) | 146 (28.8%) |
| 2-Person Household | 448 (94.3%) | 27 (5.7%) |
| 3-Person Household | 363 (76.9%) | 109 (23.1%) |
| 4+ Person Household | 715 (92.0%) | 62 (8.0%) |
| Total Housing Units | 1,886 (84.6%) | 344 (15.4%) |
Occupancy by Educational Attainment in Dacula
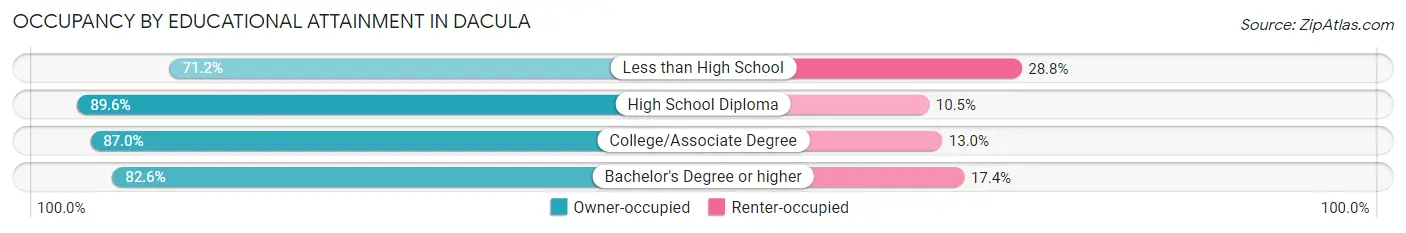
| Household Size | Owner-occupied | Renter-occupied |
| Less than High School | 156 (71.2%) | 63 (28.8%) |
| High School Diploma | 377 (89.5%) | 44 (10.4%) |
| College/Associate Degree | 788 (87.0%) | 118 (13.0%) |
| Bachelor's Degree or higher | 565 (82.6%) | 119 (17.4%) |
Occupancy by Age of Householder in Dacula
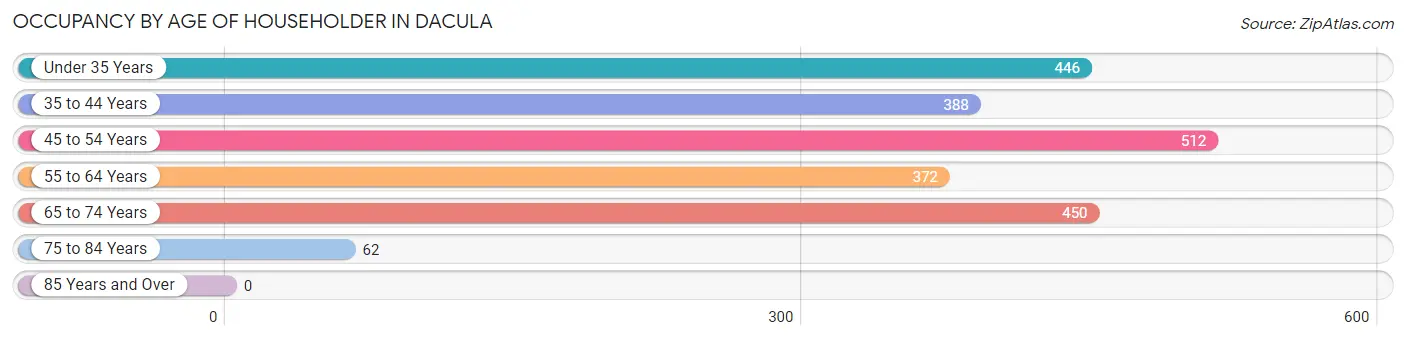
| Age Bracket | # Households | % Households |
| Under 35 Years | 446 | 20.0% |
| 35 to 44 Years | 388 | 17.4% |
| 45 to 54 Years | 512 | 23.0% |
| 55 to 64 Years | 372 | 16.7% |
| 65 to 74 Years | 450 | 20.2% |
| 75 to 84 Years | 62 | 2.8% |
| 85 Years and Over | 0 | 0.0% |
| Total | 2,230 | 100.0% |
Housing Finances in Dacula
Median Income by Occupancy in Dacula
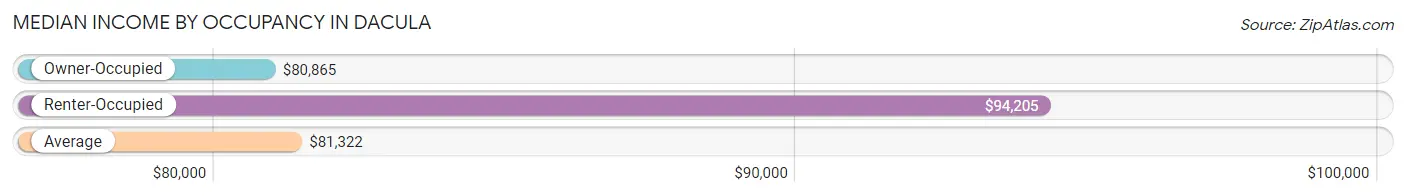
| Occupancy Type | # Households | Median Income |
| Owner-Occupied | 1,886 (84.6%) | $80,865 |
| Renter-Occupied | 344 (15.4%) | $94,205 |
| Average | 2,230 (100.0%) | $81,322 |
Occupancy by Householder Income Bracket in Dacula
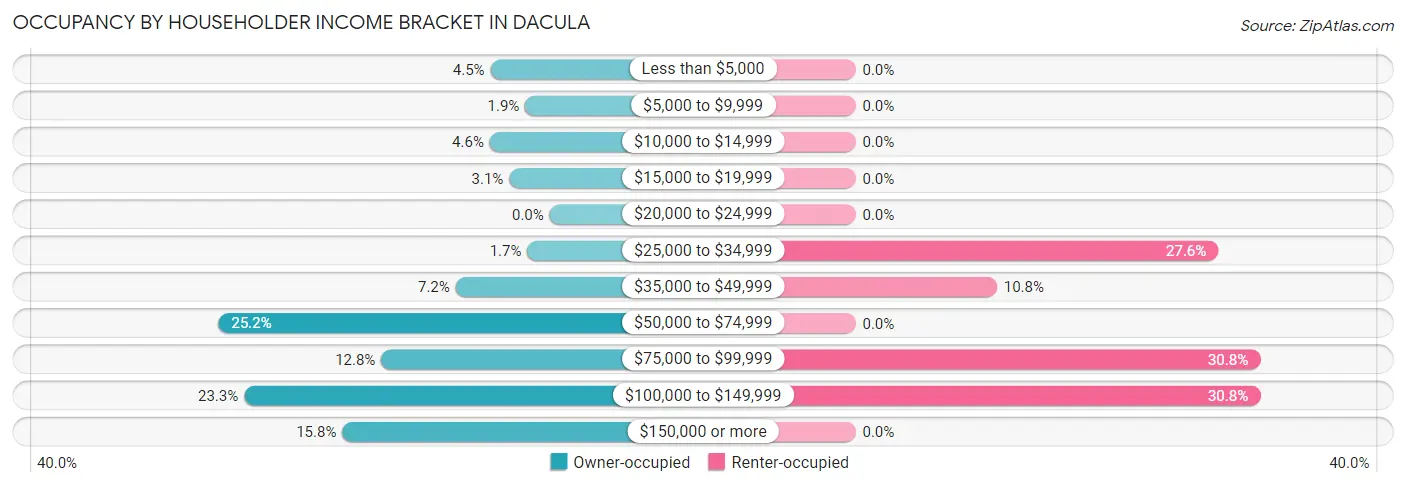
| Income Bracket | Owner-occupied | Renter-occupied |
| Less than $5,000 | 85 (4.5%) | 0 (0.0%) |
| $5,000 to $9,999 | 35 (1.9%) | 0 (0.0%) |
| $10,000 to $14,999 | 86 (4.6%) | 0 (0.0%) |
| $15,000 to $19,999 | 58 (3.1%) | 0 (0.0%) |
| $20,000 to $24,999 | 0 (0.0%) | 0 (0.0%) |
| $25,000 to $34,999 | 32 (1.7%) | 95 (27.6%) |
| $35,000 to $49,999 | 135 (7.2%) | 37 (10.8%) |
| $50,000 to $74,999 | 476 (25.2%) | 0 (0.0%) |
| $75,000 to $99,999 | 242 (12.8%) | 106 (30.8%) |
| $100,000 to $149,999 | 439 (23.3%) | 106 (30.8%) |
| $150,000 or more | 298 (15.8%) | 0 (0.0%) |
| Total | 1,886 (100.0%) | 344 (100.0%) |
Monthly Housing Cost Tiers in Dacula
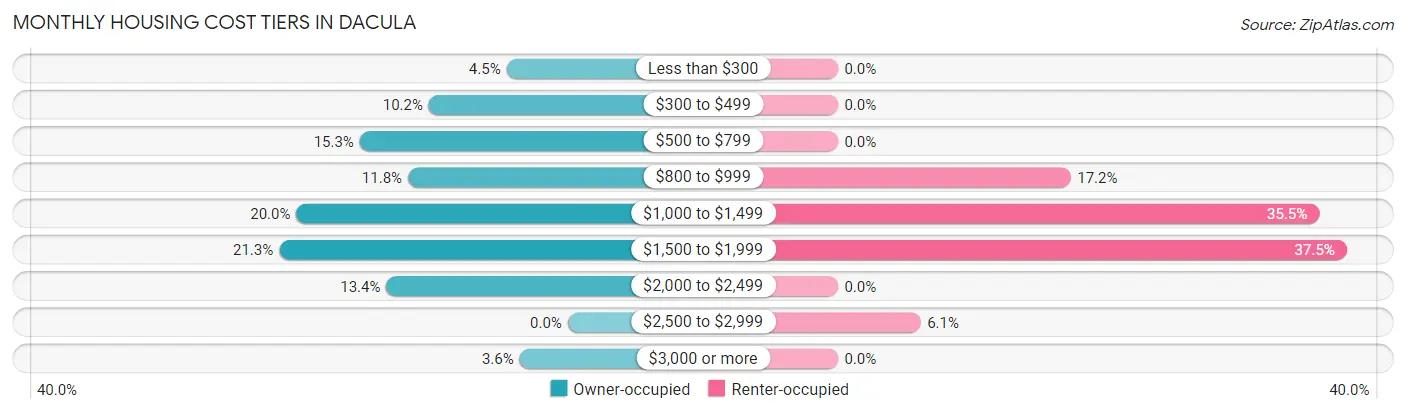
| Monthly Cost | Owner-occupied | Renter-occupied |
| Less than $300 | 85 (4.5%) | 0 (0.0%) |
| $300 to $499 | 193 (10.2%) | 0 (0.0%) |
| $500 to $799 | 289 (15.3%) | 0 (0.0%) |
| $800 to $999 | 222 (11.8%) | 59 (17.2%) |
| $1,000 to $1,499 | 377 (20.0%) | 122 (35.5%) |
| $1,500 to $1,999 | 401 (21.3%) | 129 (37.5%) |
| $2,000 to $2,499 | 252 (13.4%) | 0 (0.0%) |
| $2,500 to $2,999 | 0 (0.0%) | 21 (6.1%) |
| $3,000 or more | 67 (3.5%) | 0 (0.0%) |
| Total | 1,886 (100.0%) | 344 (100.0%) |
Physical Housing Characteristics in Dacula
Housing Structures in Dacula
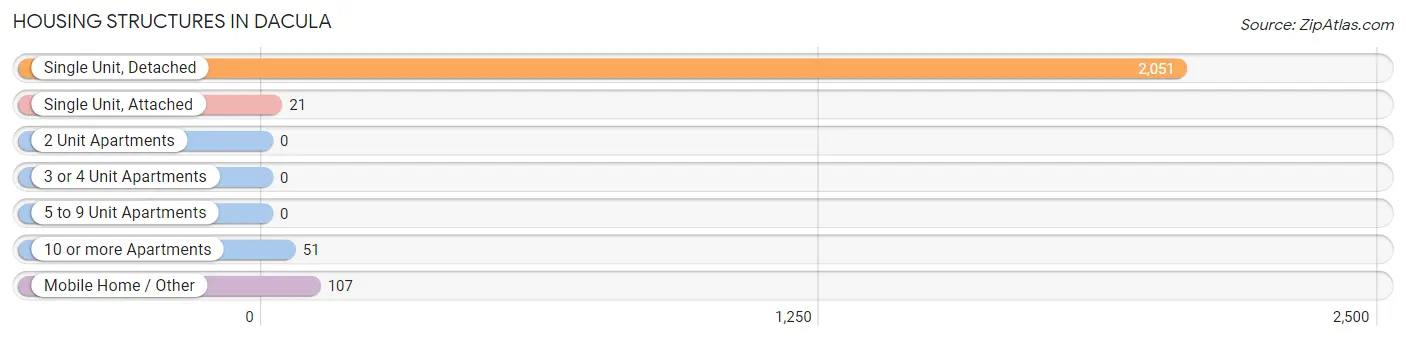
| Structure Type | # Housing Units | % Housing Units |
| Single Unit, Detached | 2,051 | 92.0% |
| Single Unit, Attached | 21 | 0.9% |
| 2 Unit Apartments | 0 | 0.0% |
| 3 or 4 Unit Apartments | 0 | 0.0% |
| 5 to 9 Unit Apartments | 0 | 0.0% |
| 10 or more Apartments | 51 | 2.3% |
| Mobile Home / Other | 107 | 4.8% |
| Total | 2,230 | 100.0% |
Housing Structures by Occupancy in Dacula
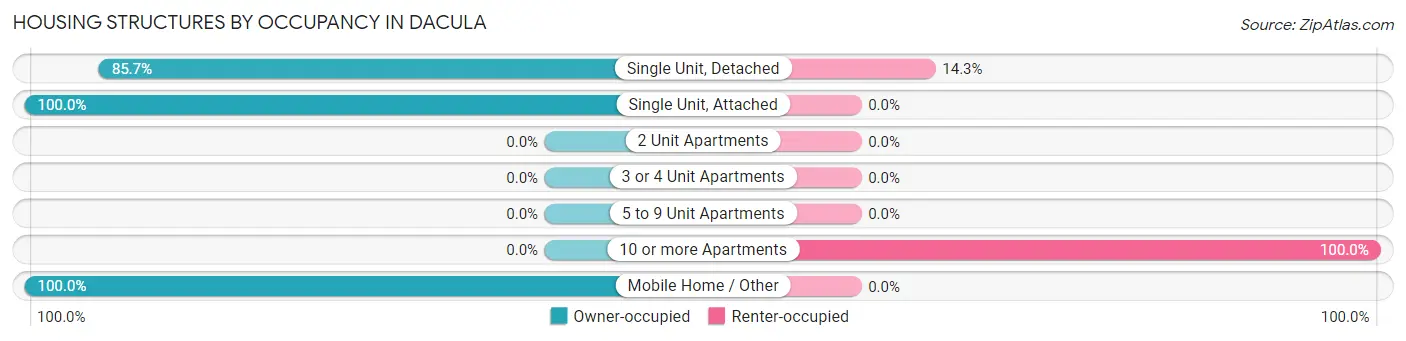
| Structure Type | Owner-occupied | Renter-occupied |
| Single Unit, Detached | 1,758 (85.7%) | 293 (14.3%) |
| Single Unit, Attached | 21 (100.0%) | 0 (0.0%) |
| 2 Unit Apartments | 0 (0.0%) | 0 (0.0%) |
| 3 or 4 Unit Apartments | 0 (0.0%) | 0 (0.0%) |
| 5 to 9 Unit Apartments | 0 (0.0%) | 0 (0.0%) |
| 10 or more Apartments | 0 (0.0%) | 51 (100.0%) |
| Mobile Home / Other | 107 (100.0%) | 0 (0.0%) |
| Total | 1,886 (84.6%) | 344 (15.4%) |
Housing Structures by Number of Rooms in Dacula
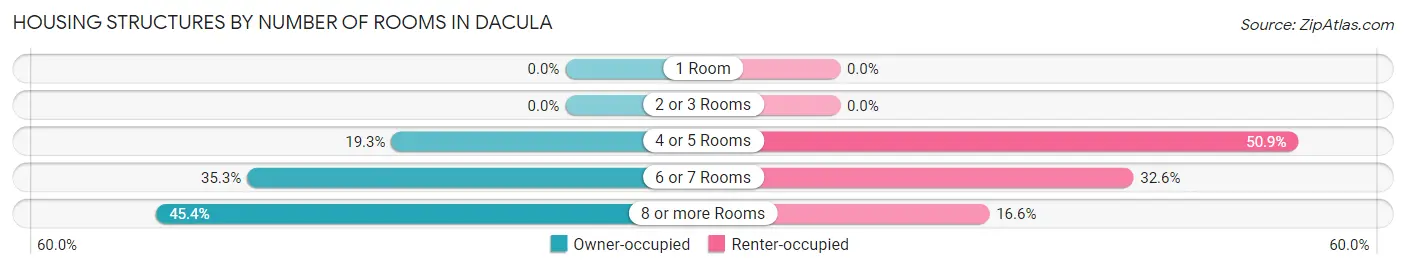
| Number of Rooms | Owner-occupied | Renter-occupied |
| 1 Room | 0 (0.0%) | 0 (0.0%) |
| 2 or 3 Rooms | 0 (0.0%) | 0 (0.0%) |
| 4 or 5 Rooms | 364 (19.3%) | 175 (50.9%) |
| 6 or 7 Rooms | 666 (35.3%) | 112 (32.6%) |
| 8 or more Rooms | 856 (45.4%) | 57 (16.6%) |
| Total | 1,886 (100.0%) | 344 (100.0%) |
Housing Structure by Heating Type in Dacula
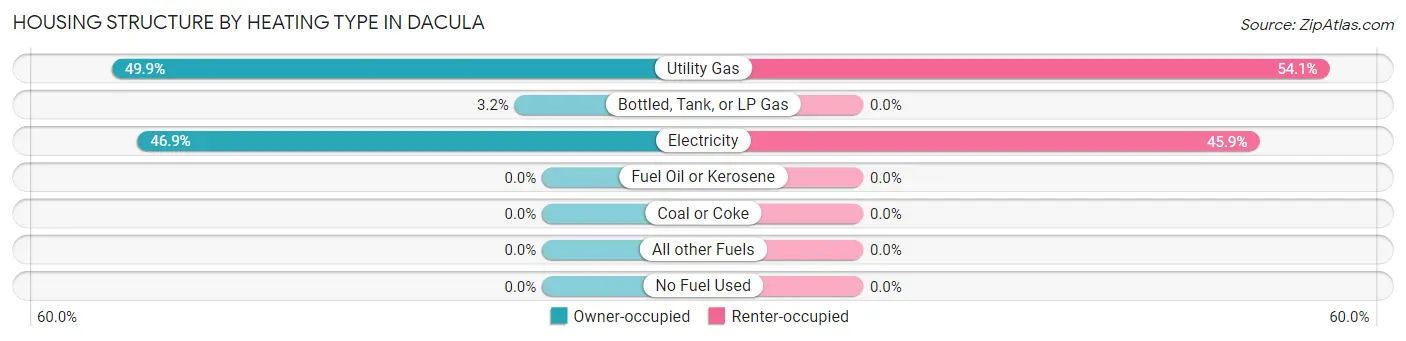
| Heating Type | Owner-occupied | Renter-occupied |
| Utility Gas | 941 (49.9%) | 186 (54.1%) |
| Bottled, Tank, or LP Gas | 60 (3.2%) | 0 (0.0%) |
| Electricity | 885 (46.9%) | 158 (45.9%) |
| Fuel Oil or Kerosene | 0 (0.0%) | 0 (0.0%) |
| Coal or Coke | 0 (0.0%) | 0 (0.0%) |
| All other Fuels | 0 (0.0%) | 0 (0.0%) |
| No Fuel Used | 0 (0.0%) | 0 (0.0%) |
| Total | 1,886 (100.0%) | 344 (100.0%) |
Household Vehicle Usage in Dacula
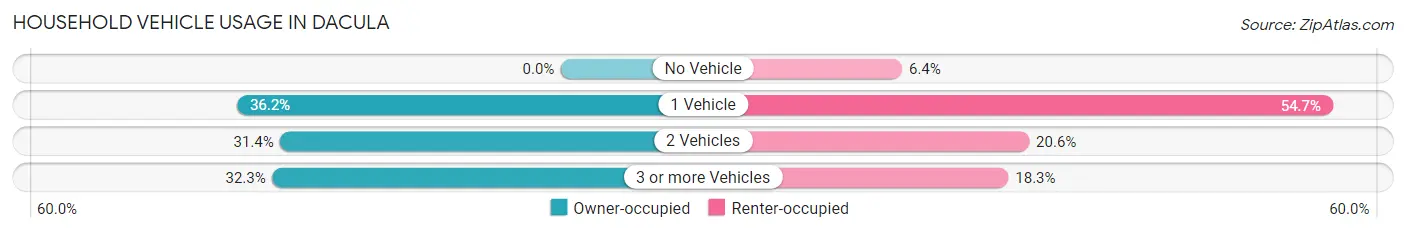
| Vehicles per Household | Owner-occupied | Renter-occupied |
| No Vehicle | 0 (0.0%) | 22 (6.4%) |
| 1 Vehicle | 683 (36.2%) | 188 (54.6%) |
| 2 Vehicles | 593 (31.4%) | 71 (20.6%) |
| 3 or more Vehicles | 610 (32.3%) | 63 (18.3%) |
| Total | 1,886 (100.0%) | 344 (100.0%) |
Real Estate & Mortgages in Dacula
Real Estate and Mortgage Overview in Dacula
| Characteristic | Without Mortgage | With Mortgage |
| Housing Units | 672 | 1,214 |
| Median Property Value | $234,600 | $322,900 |
| Median Household Income | $51,848 | $298 |
| Monthly Housing Costs | $543 | $56 |
| Real Estate Taxes | $2,870 | $0 |
Property Value by Mortgage Status in Dacula
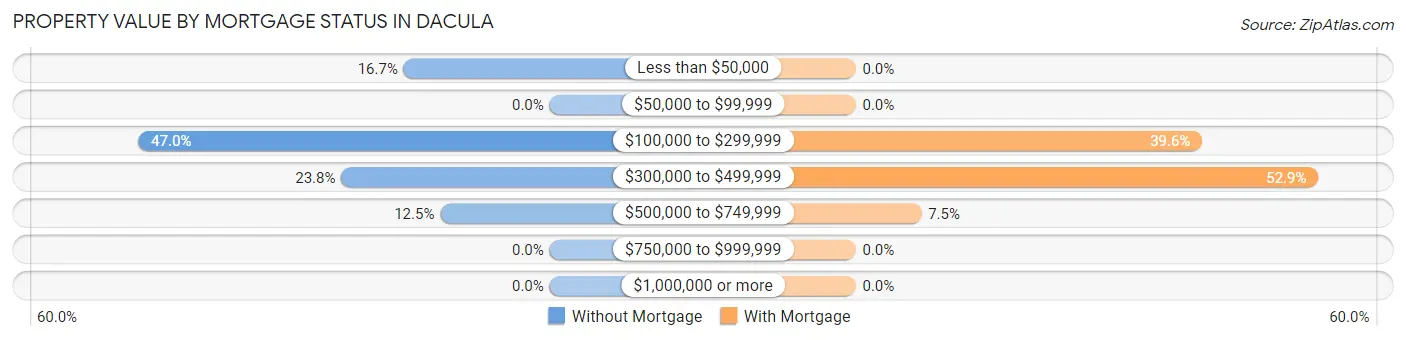
| Property Value | Without Mortgage | With Mortgage |
| Less than $50,000 | 112 (16.7%) | 0 (0.0%) |
| $50,000 to $99,999 | 0 (0.0%) | 0 (0.0%) |
| $100,000 to $299,999 | 316 (47.0%) | 481 (39.6%) |
| $300,000 to $499,999 | 160 (23.8%) | 642 (52.9%) |
| $500,000 to $749,999 | 84 (12.5%) | 91 (7.5%) |
| $750,000 to $999,999 | 0 (0.0%) | 0 (0.0%) |
| $1,000,000 or more | 0 (0.0%) | 0 (0.0%) |
| Total | 672 (100.0%) | 1,214 (100.0%) |
Household Income by Mortgage Status in Dacula
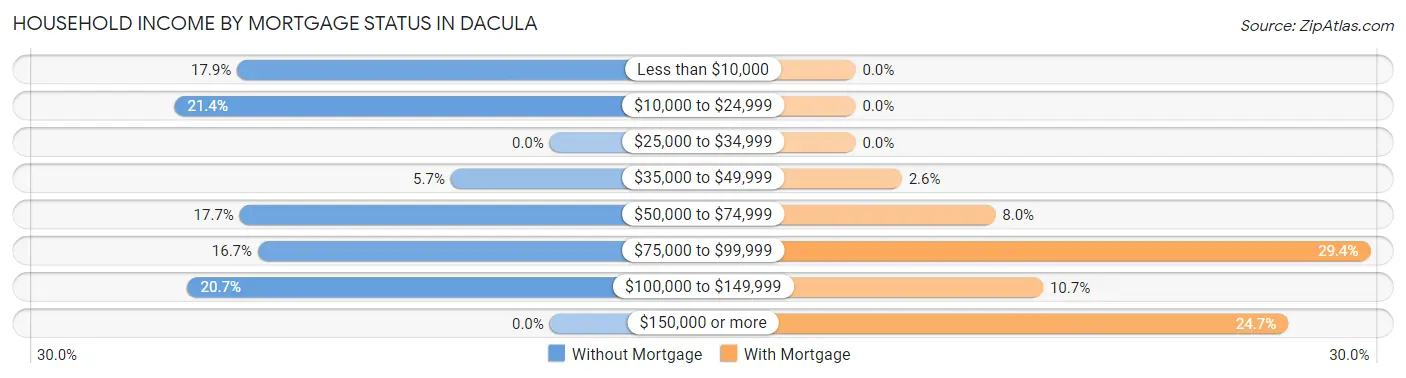
| Household Income | Without Mortgage | With Mortgage |
| Less than $10,000 | 120 (17.9%) | 0 (0.0%) |
| $10,000 to $24,999 | 144 (21.4%) | 0 (0.0%) |
| $25,000 to $34,999 | 0 (0.0%) | 0 (0.0%) |
| $35,000 to $49,999 | 38 (5.7%) | 32 (2.6%) |
| $50,000 to $74,999 | 119 (17.7%) | 97 (8.0%) |
| $75,000 to $99,999 | 112 (16.7%) | 357 (29.4%) |
| $100,000 to $149,999 | 139 (20.7%) | 130 (10.7%) |
| $150,000 or more | 0 (0.0%) | 300 (24.7%) |
| Total | 672 (100.0%) | 1,214 (100.0%) |
Property Value to Household Income Ratio in Dacula
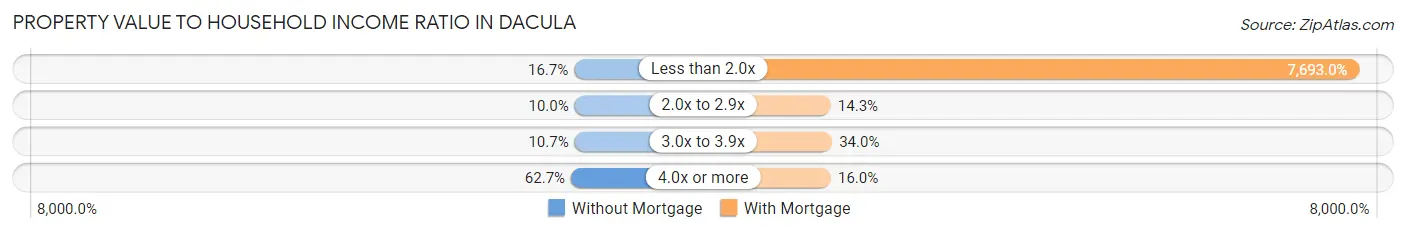
| Value-to-Income Ratio | Without Mortgage | With Mortgage |
| Less than 2.0x | 112 (16.7%) | 93,393 (7,693.0%) |
| 2.0x to 2.9x | 67 (10.0%) | 173 (14.2%) |
| 3.0x to 3.9x | 72 (10.7%) | 413 (34.0%) |
| 4.0x or more | 421 (62.6%) | 194 (16.0%) |
| Total | 672 (100.0%) | 1,214 (100.0%) |
Real Estate Taxes by Mortgage Status in Dacula
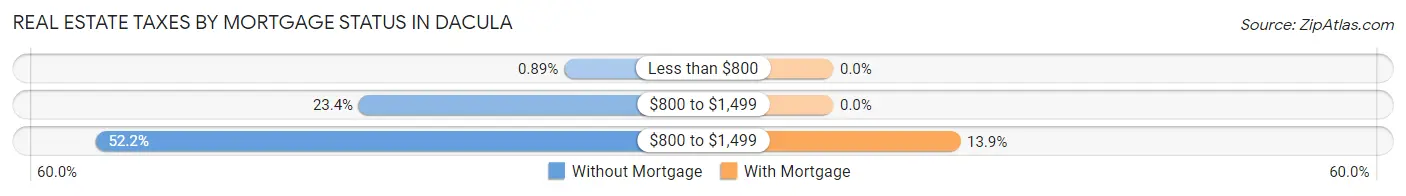
| Property Taxes | Without Mortgage | With Mortgage |
| Less than $800 | 6 (0.9%) | 0 (0.0%) |
| $800 to $1,499 | 157 (23.4%) | 0 (0.0%) |
| $800 to $1,499 | 351 (52.2%) | 169 (13.9%) |
| Total | 672 (100.0%) | 1,214 (100.0%) |
Health & Disability in Dacula
Health Insurance Coverage by Age in Dacula
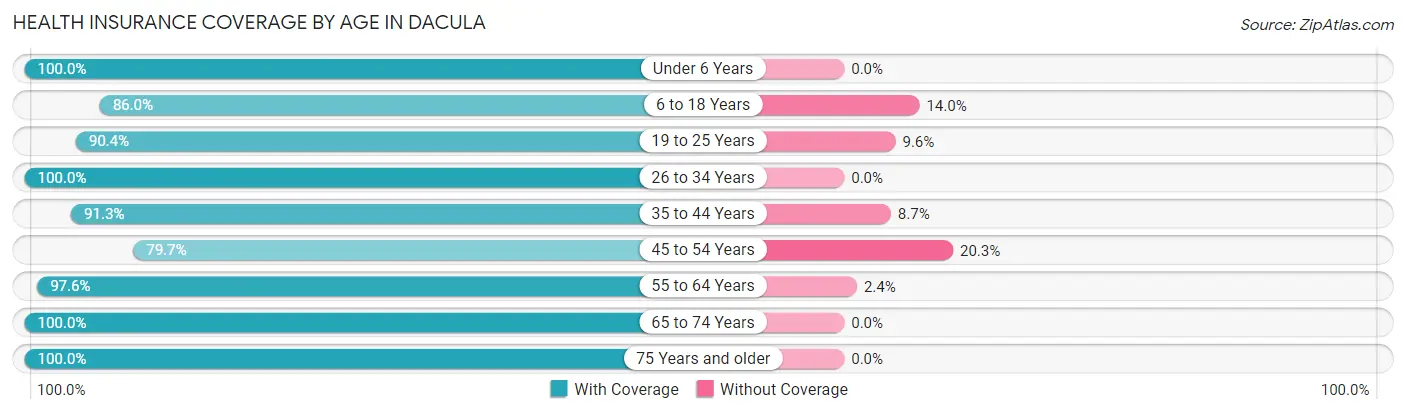
| Age Bracket | With Coverage | Without Coverage |
| Under 6 Years | 745 (100.0%) | 0 (0.0%) |
| 6 to 18 Years | 1,349 (86.0%) | 220 (14.0%) |
| 19 to 25 Years | 473 (90.4%) | 50 (9.6%) |
| 26 to 34 Years | 616 (100.0%) | 0 (0.0%) |
| 35 to 44 Years | 1,040 (91.3%) | 99 (8.7%) |
| 45 to 54 Years | 743 (79.7%) | 189 (20.3%) |
| 55 to 64 Years | 703 (97.6%) | 17 (2.4%) |
| 65 to 74 Years | 574 (100.0%) | 0 (0.0%) |
| 75 Years and older | 88 (100.0%) | 0 (0.0%) |
| Total | 6,331 (91.7%) | 575 (8.3%) |
Health Insurance Coverage by Citizenship Status in Dacula
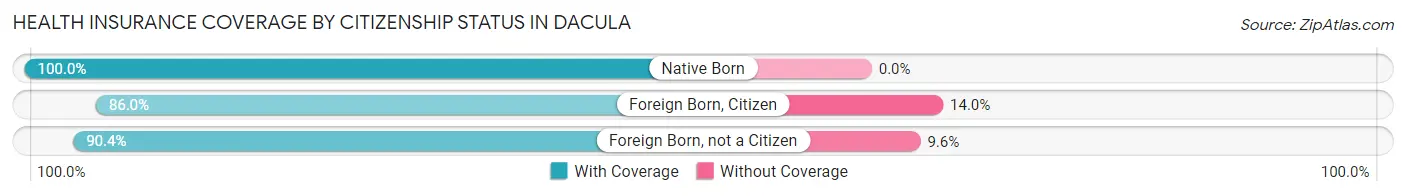
| Citizenship Status | With Coverage | Without Coverage |
| Native Born | 745 (100.0%) | 0 (0.0%) |
| Foreign Born, Citizen | 1,349 (86.0%) | 220 (14.0%) |
| Foreign Born, not a Citizen | 473 (90.4%) | 50 (9.6%) |
Health Insurance Coverage by Household Income in Dacula
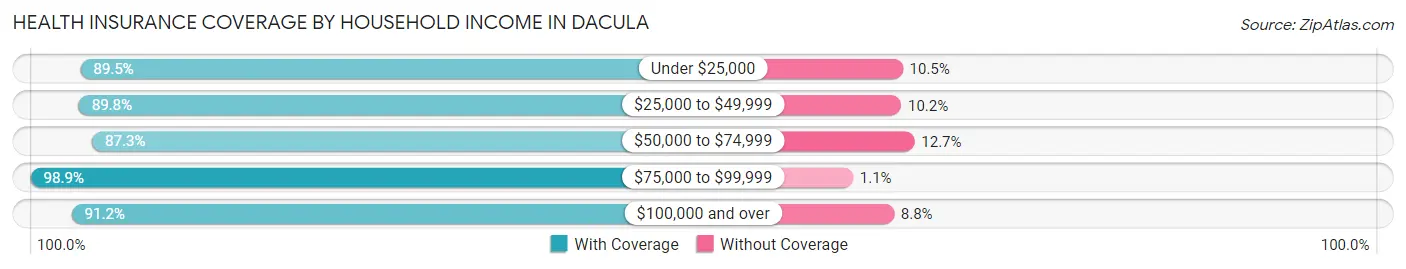
| Household Income | With Coverage | Without Coverage |
| Under $25,000 | 522 (89.5%) | 61 (10.5%) |
| $25,000 to $49,999 | 460 (89.8%) | 52 (10.2%) |
| $50,000 to $74,999 | 1,456 (87.3%) | 211 (12.7%) |
| $75,000 to $99,999 | 1,473 (98.9%) | 17 (1.1%) |
| $100,000 and over | 2,420 (91.2%) | 234 (8.8%) |
Public vs Private Health Insurance Coverage by Age in Dacula
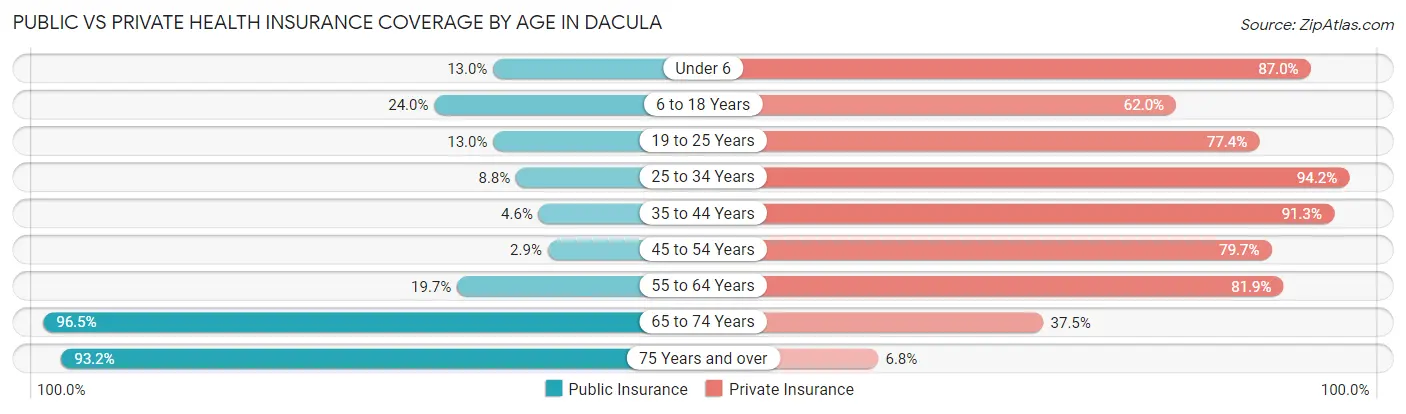
| Age Bracket | Public Insurance | Private Insurance |
| Under 6 | 97 (13.0%) | 648 (87.0%) |
| 6 to 18 Years | 376 (24.0%) | 973 (62.0%) |
| 19 to 25 Years | 68 (13.0%) | 405 (77.4%) |
| 25 to 34 Years | 54 (8.8%) | 580 (94.2%) |
| 35 to 44 Years | 52 (4.6%) | 1,040 (91.3%) |
| 45 to 54 Years | 27 (2.9%) | 743 (79.7%) |
| 55 to 64 Years | 142 (19.7%) | 590 (81.9%) |
| 65 to 74 Years | 554 (96.5%) | 215 (37.5%) |
| 75 Years and over | 82 (93.2%) | 6 (6.8%) |
| Total | 1,452 (21.0%) | 5,200 (75.3%) |
Disability Status by Sex by Age in Dacula
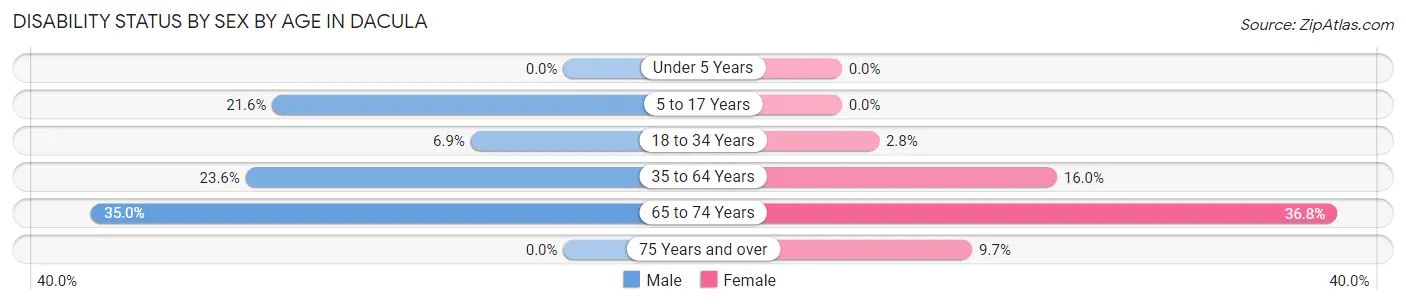
| Age Bracket | Male | Female |
| Under 5 Years | 0 (0.0%) | 0 (0.0%) |
| 5 to 17 Years | 239 (21.6%) | 0 (0.0%) |
| 18 to 34 Years | 46 (6.9%) | 18 (2.8%) |
| 35 to 64 Years | 271 (23.6%) | 262 (16.0%) |
| 65 to 74 Years | 123 (35.0%) | 82 (36.8%) |
| 75 Years and over | 0 (0.0%) | 6 (9.7%) |
Disability Class by Sex by Age in Dacula
Disability Class: Hearing Difficulty
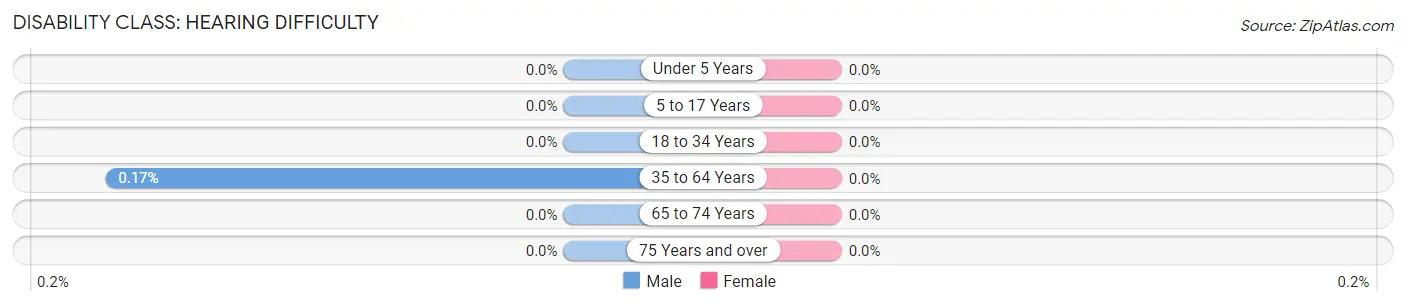
| Age Bracket | Male | Female |
| Under 5 Years | 0 (0.0%) | 0 (0.0%) |
| 5 to 17 Years | 0 (0.0%) | 0 (0.0%) |
| 18 to 34 Years | 0 (0.0%) | 0 (0.0%) |
| 35 to 64 Years | 2 (0.2%) | 0 (0.0%) |
| 65 to 74 Years | 0 (0.0%) | 0 (0.0%) |
| 75 Years and over | 0 (0.0%) | 0 (0.0%) |
Disability Class: Vision Difficulty
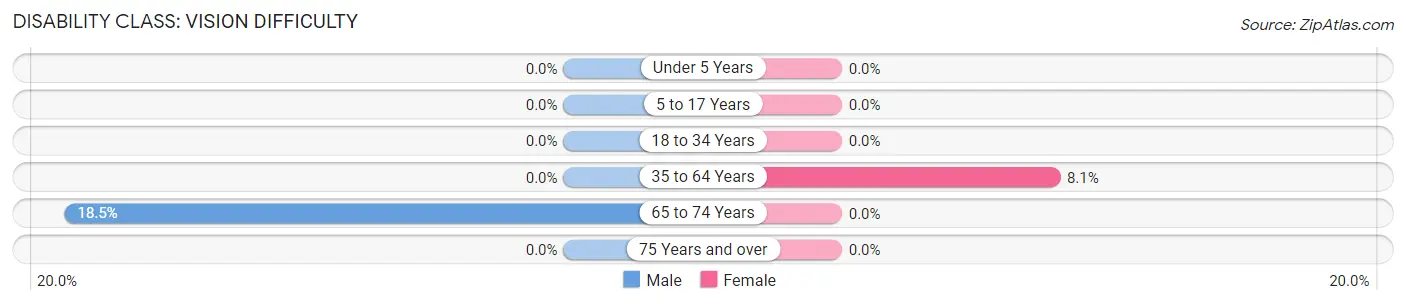
| Age Bracket | Male | Female |
| Under 5 Years | 0 (0.0%) | 0 (0.0%) |
| 5 to 17 Years | 0 (0.0%) | 0 (0.0%) |
| 18 to 34 Years | 0 (0.0%) | 0 (0.0%) |
| 35 to 64 Years | 0 (0.0%) | 133 (8.1%) |
| 65 to 74 Years | 65 (18.5%) | 0 (0.0%) |
| 75 Years and over | 0 (0.0%) | 0 (0.0%) |
Disability Class: Cognitive Difficulty
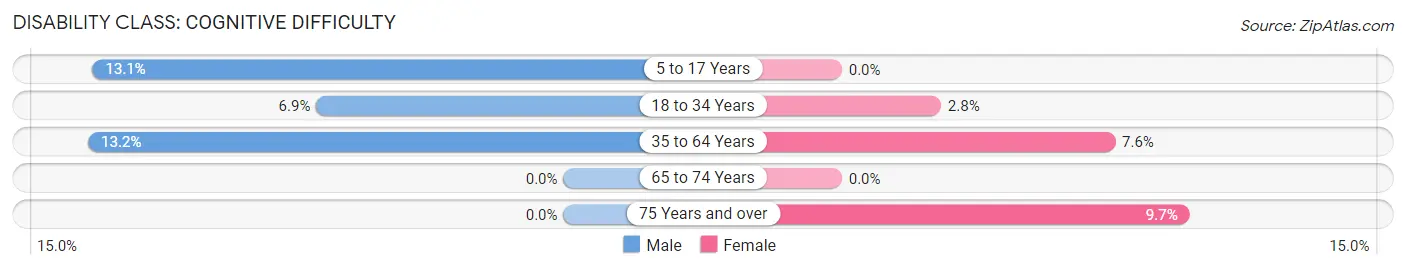
| Age Bracket | Male | Female |
| 5 to 17 Years | 145 (13.1%) | 0 (0.0%) |
| 18 to 34 Years | 46 (6.9%) | 18 (2.8%) |
| 35 to 64 Years | 152 (13.2%) | 125 (7.6%) |
| 65 to 74 Years | 0 (0.0%) | 0 (0.0%) |
| 75 Years and over | 0 (0.0%) | 6 (9.7%) |
Disability Class: Ambulatory Difficulty
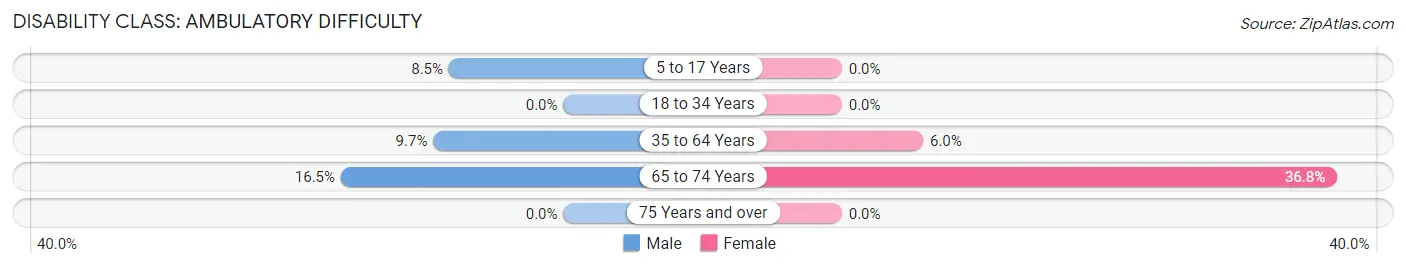
| Age Bracket | Male | Female |
| 5 to 17 Years | 94 (8.5%) | 0 (0.0%) |
| 18 to 34 Years | 0 (0.0%) | 0 (0.0%) |
| 35 to 64 Years | 111 (9.7%) | 99 (6.0%) |
| 65 to 74 Years | 58 (16.5%) | 82 (36.8%) |
| 75 Years and over | 0 (0.0%) | 0 (0.0%) |
Disability Class: Self-Care Difficulty
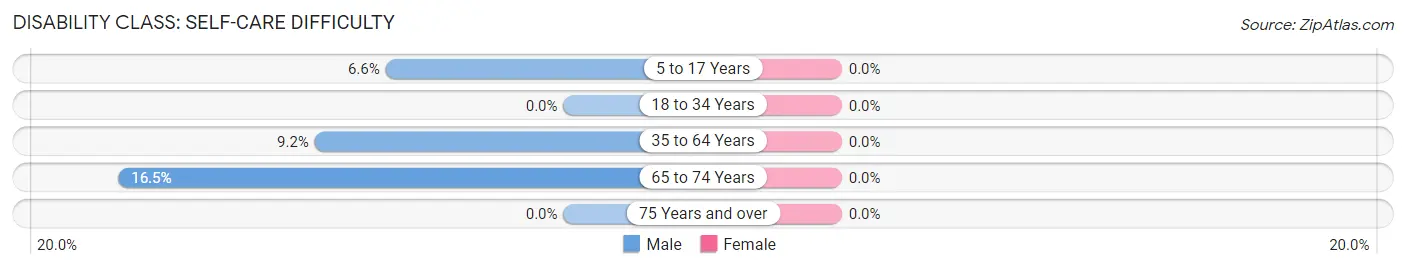
| Age Bracket | Male | Female |
| 5 to 17 Years | 73 (6.6%) | 0 (0.0%) |
| 18 to 34 Years | 0 (0.0%) | 0 (0.0%) |
| 35 to 64 Years | 106 (9.2%) | 0 (0.0%) |
| 65 to 74 Years | 58 (16.5%) | 0 (0.0%) |
| 75 Years and over | 0 (0.0%) | 0 (0.0%) |
Technology Access in Dacula
Computing Device Access in Dacula
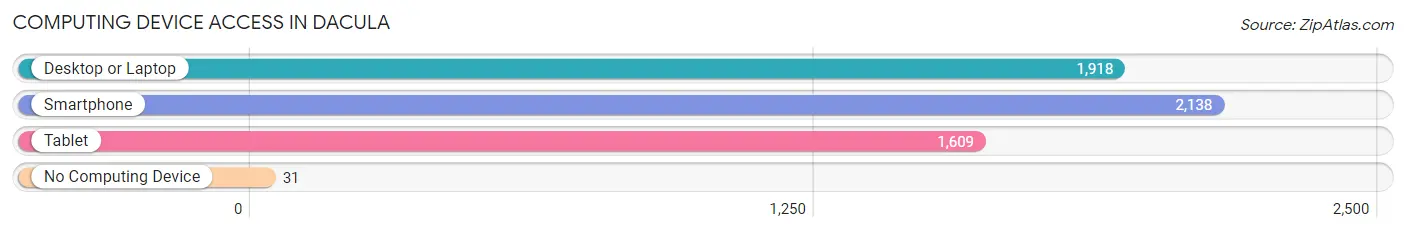
| Device Type | # Households | % Households |
| Desktop or Laptop | 1,918 | 86.0% |
| Smartphone | 2,138 | 95.9% |
| Tablet | 1,609 | 72.2% |
| No Computing Device | 31 | 1.4% |
| Total | 2,230 | 100.0% |
Internet Access in Dacula
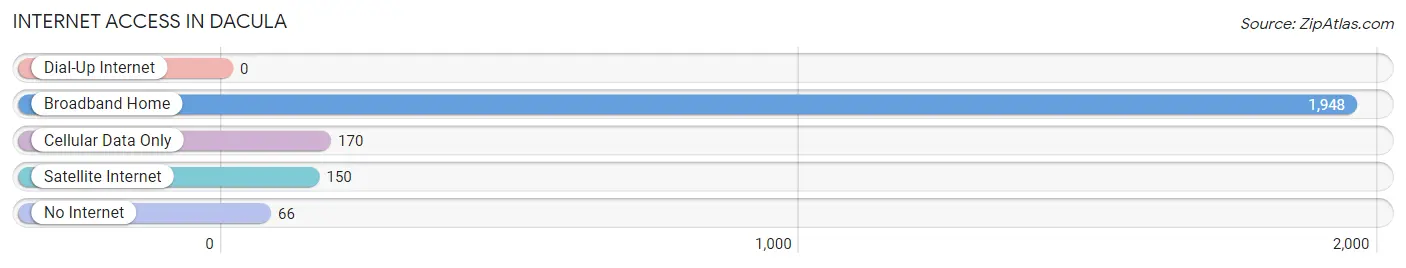
| Internet Type | # Households | % Households |
| Dial-Up Internet | 0 | 0.0% |
| Broadband Home | 1,948 | 87.4% |
| Cellular Data Only | 170 | 7.6% |
| Satellite Internet | 150 | 6.7% |
| No Internet | 66 | 3.0% |
| Total | 2,230 | 100.0% |
Dacula Summary
Dacula, Georgia is a small town located in Gwinnett County, about 35 miles northeast of Atlanta. It is a part of the Atlanta metropolitan area and is home to a population of about 5,000 people. The town was founded in 1883 and was named after the nearby Dacula Creek.
Geography
Dacula is located in the foothills of the Blue Ridge Mountains, and is situated in the Piedmont region of Georgia. The town is located in the center of Gwinnett County, and is bordered by the cities of Lawrenceville, Buford, and Auburn. The town is situated on the banks of the Apalachee River, and is surrounded by rolling hills and forests. The town has a total area of 4.2 square miles, all of which is land.
Climate
Dacula has a humid subtropical climate, with hot, humid summers and mild winters. The average annual temperature is around 61 degrees Fahrenheit, with an average high of around 87 degrees in the summer and an average low of around 35 degrees in the winter. The town receives an average of 48 inches of precipitation per year, with most of it falling in the summer months.
Demographics
As of the 2010 census, Dacula had a population of 5,130 people. The racial makeup of the town was 79.2% White, 11.2% African American, 0.3% Native American, 4.2% Asian, 0.1% Pacific Islander, and 4.9% from other races. Hispanic or Latino of any race were 8.2% of the population.
Economy
Dacula’s economy is largely based on agriculture and manufacturing. The town is home to several large farms, as well as several small businesses. The town is also home to several industrial parks, which provide jobs in manufacturing and other industries. The town is also home to several retail stores, restaurants, and other businesses.
History
Dacula was founded in 1883 by a group of settlers from the nearby town of Lawrenceville. The town was named after the nearby Dacula Creek, which was named after a Native American chief. The town grew slowly over the years, and by the early 1900s, it had become a thriving agricultural community. The town was incorporated in 1921, and by the mid-1900s, it had become a popular destination for tourists and vacationers.
In recent years, Dacula has seen a surge in population growth, as many people have moved to the area to take advantage of its proximity to Atlanta. The town has also seen an increase in businesses and retail stores, as well as an increase in the number of restaurants and other attractions.
Today, Dacula is a thriving small town with a strong sense of community. The town is home to a variety of businesses, restaurants, and attractions, and is a popular destination for tourists and vacationers. The town is also home to several parks and recreational areas, making it a great place to live and visit.
Common Questions
What is Per Capita Income in Dacula?
Per Capita income in Dacula is $27,774.
What is the Median Family Income in Dacula?
Median Family Income in Dacula is $82,067.
What is the Median Household income in Dacula?
Median Household Income in Dacula is $81,322.
What is Income or Wage Gap in Dacula?
Income or Wage Gap in Dacula is 26.7%.
Women in Dacula earn 73.3 cents for every dollar earned by a man.
What is Family Income Deficit in Dacula?
Family Income Deficit in Dacula is $17,143.
Families that are below poverty line in Dacula earn $17,143 less on average than the poverty threshold level.
What is Inequality or Gini Index in Dacula?
Inequality or Gini Index in Dacula is 0.33.
What is the Total Population of Dacula?
Total Population of Dacula is 6,906.
What is the Total Male Population of Dacula?
Total Male Population of Dacula is 3,658.
What is the Total Female Population of Dacula?
Total Female Population of Dacula is 3,248.
What is the Ratio of Males per 100 Females in Dacula?
There are 112.62 Males per 100 Females in Dacula.
What is the Ratio of Females per 100 Males in Dacula?
There are 88.79 Females per 100 Males in Dacula.
What is the Median Population Age in Dacula?
Median Population Age in Dacula is 35.0 Years.
What is the Average Family Size in Dacula
Average Family Size in Dacula is 3.5 People.
What is the Average Household Size in Dacula
Average Household Size in Dacula is 3.1 People.
How Large is the Labor Force in Dacula?
There are 3,087 People in the Labor Forcein in Dacula.
What is the Percentage of People in the Labor Force in Dacula?
63.2% of People are in the Labor Force in Dacula.
What is the Unemployment Rate in Dacula?
Unemployment Rate in Dacula is 5.1%.