Wheeling, IL Map & Demographics
Wheeling Map
Wheeling Overview
$40,334
PER CAPITA INCOME
$91,195
AVG FAMILY INCOME
$80,054
AVG HOUSEHOLD INCOME
21.0%
WAGE / INCOME GAP [ % ]
79.0¢/ $1
WAGE / INCOME GAP [ $ ]
0.42
INEQUALITY / GINI INDEX
38,823
TOTAL POPULATION
19,044
MALE POPULATION
19,779
FEMALE POPULATION
96.28
MALES / 100 FEMALES
103.86
FEMALES / 100 MALES
39.7
MEDIAN AGE
3.1
AVG FAMILY SIZE
2.5
AVG HOUSEHOLD SIZE
23,237
LABOR FORCE [ PEOPLE ]
71.9%
PERCENT IN LABOR FORCE
5.2%
UNEMPLOYMENT RATE
Wheeling Zip Codes
Income in Wheeling
Income Overview in Wheeling
Per Capita Income in Wheeling is $40,334, while median incomes of families and households are $91,195 and $80,054 respectively.
| Characteristic | Number | Measure |
| Per Capita Income | 38,823 | $40,334 |
| Median Family Income | 9,647 | $91,195 |
| Mean Family Income | 9,647 | $112,364 |
| Median Household Income | 15,484 | $80,054 |
| Mean Household Income | 15,484 | $99,696 |
| Income Deficit | 9,647 | $0 |
| Wage / Income Gap (%) | 38,823 | 21.00% |
| Wage / Income Gap ($) | 38,823 | 79.00¢ per $1 |
| Gini / Inequality Index | 38,823 | 0.42 |
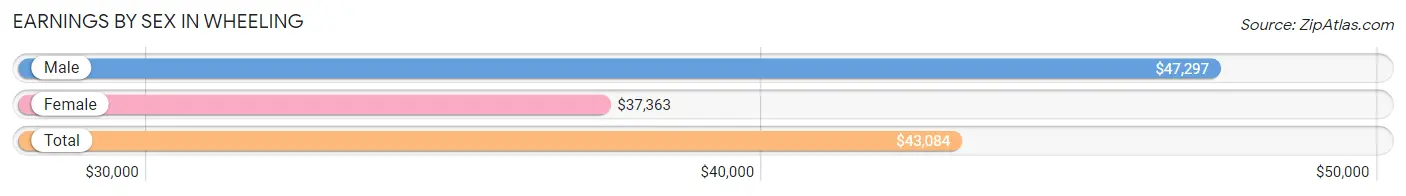
Earnings by Sex in Wheeling
Average Earnings in Wheeling are $43,084, $47,297 for men and $37,363 for women, a difference of 21.0%.
| Sex | Number | Average Earnings |
| Male | 12,577 (53.4%) | $47,297 |
| Female | 10,980 (46.6%) | $37,363 |
| Total | 23,557 (100.0%) | $43,084 |
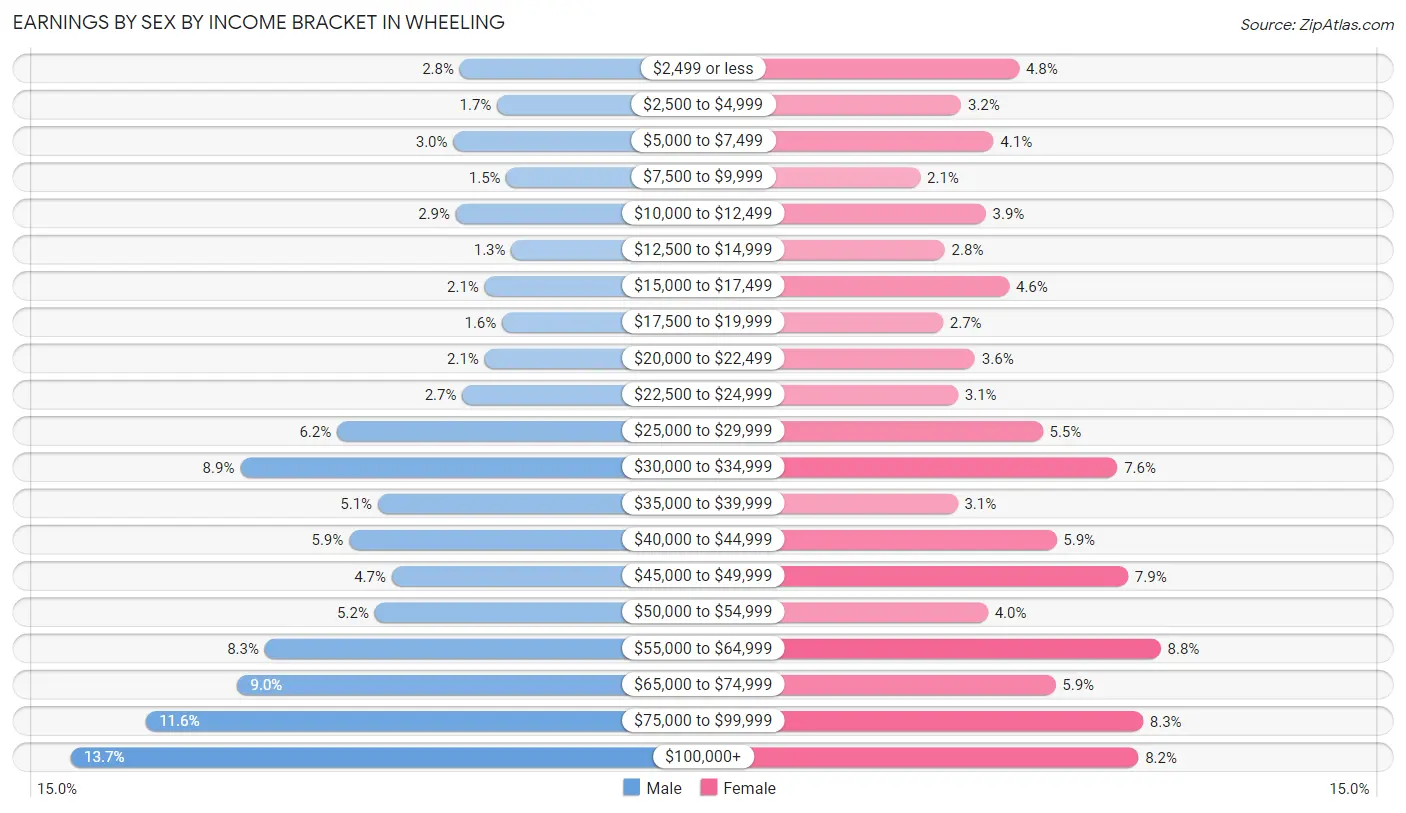
Earnings by Sex by Income Bracket in Wheeling
The most common earnings brackets in Wheeling are $100,000+ for men (1,722 | 13.7%) and $55,000 to $64,999 for women (968 | 8.8%).
| Income | Male | Female |
| $2,499 or less | 348 (2.8%) | 531 (4.8%) |
| $2,500 to $4,999 | 216 (1.7%) | 353 (3.2%) |
| $5,000 to $7,499 | 371 (2.9%) | 452 (4.1%) |
| $7,500 to $9,999 | 183 (1.5%) | 226 (2.1%) |
| $10,000 to $12,499 | 362 (2.9%) | 428 (3.9%) |
| $12,500 to $14,999 | 166 (1.3%) | 302 (2.8%) |
| $15,000 to $17,499 | 260 (2.1%) | 501 (4.6%) |
| $17,500 to $19,999 | 199 (1.6%) | 296 (2.7%) |
| $20,000 to $22,499 | 260 (2.1%) | 395 (3.6%) |
| $22,500 to $24,999 | 339 (2.7%) | 343 (3.1%) |
| $25,000 to $29,999 | 782 (6.2%) | 604 (5.5%) |
| $30,000 to $34,999 | 1,125 (8.9%) | 835 (7.6%) |
| $35,000 to $39,999 | 638 (5.1%) | 342 (3.1%) |
| $40,000 to $44,999 | 739 (5.9%) | 647 (5.9%) |
| $45,000 to $49,999 | 588 (4.7%) | 867 (7.9%) |
| $50,000 to $54,999 | 649 (5.2%) | 435 (4.0%) |
| $55,000 to $64,999 | 1,038 (8.3%) | 968 (8.8%) |
| $65,000 to $74,999 | 1,135 (9.0%) | 643 (5.9%) |
| $75,000 to $99,999 | 1,457 (11.6%) | 913 (8.3%) |
| $100,000+ | 1,722 (13.7%) | 899 (8.2%) |
| Total | 12,577 (100.0%) | 10,980 (100.0%) |
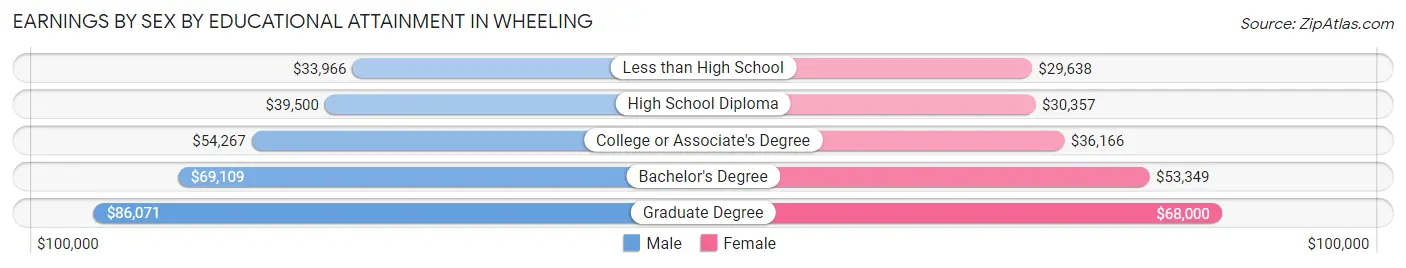
Earnings by Sex by Educational Attainment in Wheeling
Average earnings in Wheeling are $51,643 for men and $42,817 for women, a difference of 17.1%. Men with an educational attainment of graduate degree enjoy the highest average annual earnings of $86,071, while those with less than high school education earn the least with $33,966. Women with an educational attainment of graduate degree earn the most with the average annual earnings of $68,000, while those with less than high school education have the smallest earnings of $29,638.
| Educational Attainment | Male Income | Female Income |
| Less than High School | $33,966 | $29,638 |
| High School Diploma | $39,500 | $30,357 |
| College or Associate's Degree | $54,267 | $36,166 |
| Bachelor's Degree | $69,109 | $53,349 |
| Graduate Degree | $86,071 | $68,000 |
| Total | $51,643 | $42,817 |
Family Income in Wheeling
Family Income Brackets in Wheeling
According to the Wheeling family income data, there are 2,238 families falling into the $100,000 to $149,999 income range, which is the most common income bracket and makes up 23.2% of all families. Conversely, the $10,000 to $14,999 income bracket is the least frequent group with only 77 families (0.8%) belonging to this category.
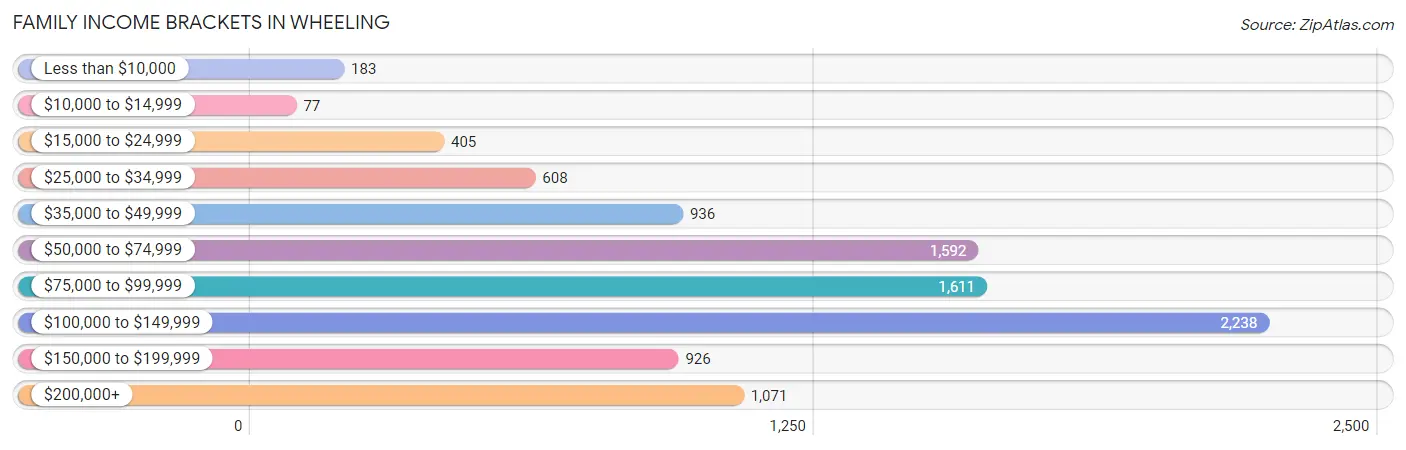
| Income Bracket | # Families | % Families |
| Less than $10,000 | 183 | 1.9% |
| $10,000 to $14,999 | 77 | 0.8% |
| $15,000 to $24,999 | 405 | 4.2% |
| $25,000 to $34,999 | 608 | 6.3% |
| $35,000 to $49,999 | 936 | 9.7% |
| $50,000 to $74,999 | 1,592 | 16.5% |
| $75,000 to $99,999 | 1,611 | 16.7% |
| $100,000 to $149,999 | 2,238 | 23.2% |
| $150,000 to $199,999 | 926 | 9.6% |
| $200,000+ | 1,071 | 11.1% |
Family Income by Famaliy Size in Wheeling
4-person families (1,427 | 14.8%) account for the highest median family income in Wheeling with $128,525 per family, while 2-person families (4,375 | 45.4%) have the highest median income of $38,294 per family member.
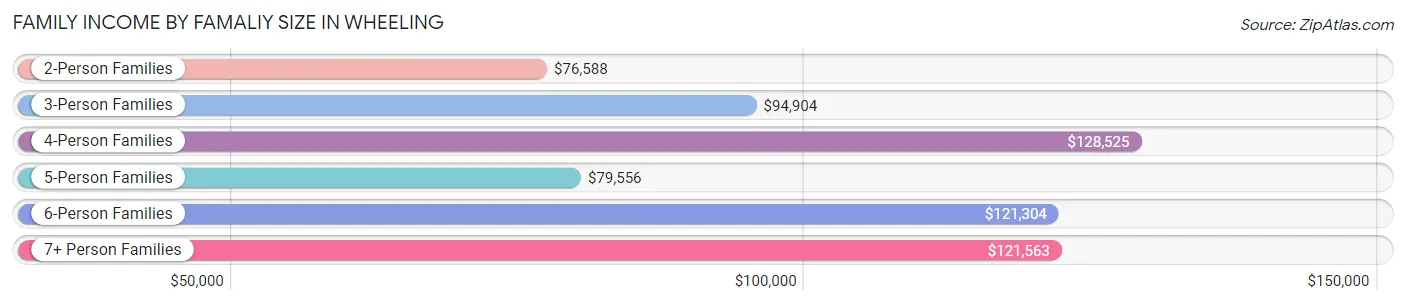
| Income Bracket | # Families | Median Income |
| 2-Person Families | 4,375 (45.4%) | $76,588 |
| 3-Person Families | 2,526 (26.2%) | $94,904 |
| 4-Person Families | 1,427 (14.8%) | $128,525 |
| 5-Person Families | 858 (8.9%) | $79,556 |
| 6-Person Families | 326 (3.4%) | $121,304 |
| 7+ Person Families | 135 (1.4%) | $121,563 |
| Total | 9,647 (100.0%) | $91,195 |
Family Income by Number of Earners in Wheeling
The median family income in Wheeling is $91,195, with families comprising 3+ earners (1,862) having the highest median family income of $132,434, while families with 1 earner (2,728) have the lowest median family income of $54,236, accounting for 19.3% and 28.3% of families, respectively.
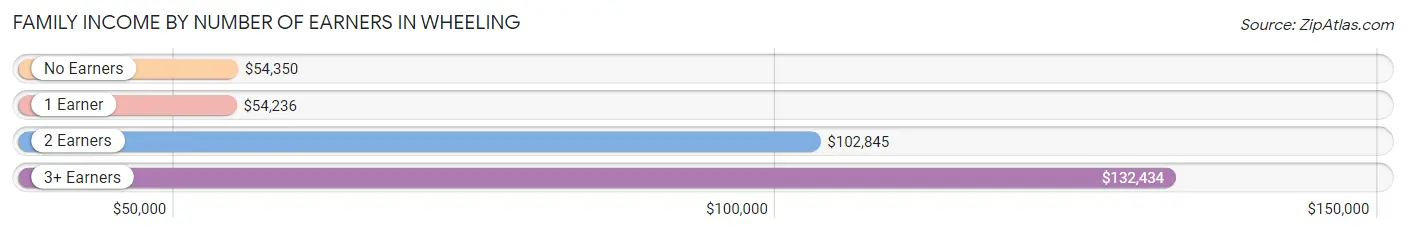
| Number of Earners | # Families | Median Income |
| No Earners | 985 (10.2%) | $54,350 |
| 1 Earner | 2,728 (28.3%) | $54,236 |
| 2 Earners | 4,072 (42.2%) | $102,845 |
| 3+ Earners | 1,862 (19.3%) | $132,434 |
| Total | 9,647 (100.0%) | $91,195 |
Household Income in Wheeling
Household Income Brackets in Wheeling
With 3,128 households falling in the category, the $100,000 to $149,999 income range is the most frequent in Wheeling, accounting for 20.2% of all households. In contrast, only 263 households (1.7%) fall into the $10,000 to $14,999 income bracket, making it the least populous group.
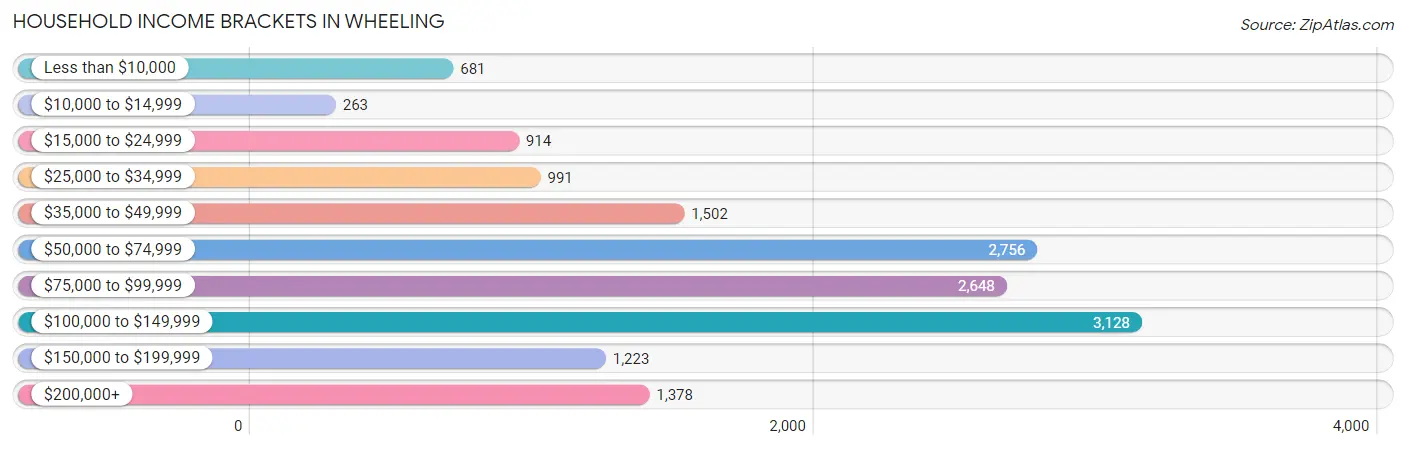
| Income Bracket | # Households | % Households |
| Less than $10,000 | 681 | 4.4% |
| $10,000 to $14,999 | 263 | 1.7% |
| $15,000 to $24,999 | 914 | 5.9% |
| $25,000 to $34,999 | 991 | 6.4% |
| $35,000 to $49,999 | 1,502 | 9.7% |
| $50,000 to $74,999 | 2,756 | 17.8% |
| $75,000 to $99,999 | 2,648 | 17.1% |
| $100,000 to $149,999 | 3,128 | 20.2% |
| $150,000 to $199,999 | 1,223 | 7.9% |
| $200,000+ | 1,378 | 8.9% |
Household Income by Householder Age in Wheeling
The median household income in Wheeling is $80,054, with the highest median household income of $92,400 found in the 25 to 44 years age bracket for the primary householder. A total of 5,787 households (37.4%) fall into this category. Meanwhile, the 15 to 24 years age bracket for the primary householder has the lowest median household income of $50,766, with 421 households (2.7%) in this group.
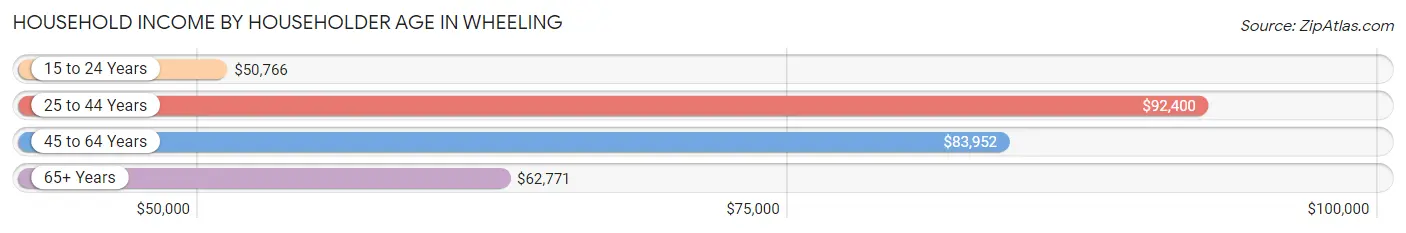
| Income Bracket | # Households | Median Income |
| 15 to 24 Years | 421 (2.7%) | $50,766 |
| 25 to 44 Years | 5,787 (37.4%) | $92,400 |
| 45 to 64 Years | 5,376 (34.7%) | $83,952 |
| 65+ Years | 3,900 (25.2%) | $62,771 |
| Total | 15,484 (100.0%) | $80,054 |
Poverty in Wheeling
Income Below Poverty by Sex and Age in Wheeling
With 8.8% poverty level for males and 8.0% for females among the residents of Wheeling, 15 year old males and 18 to 24 year old females are the most vulnerable to poverty, with 47 males (32.6%) and 238 females (16.5%) in their respective age groups living below the poverty level.
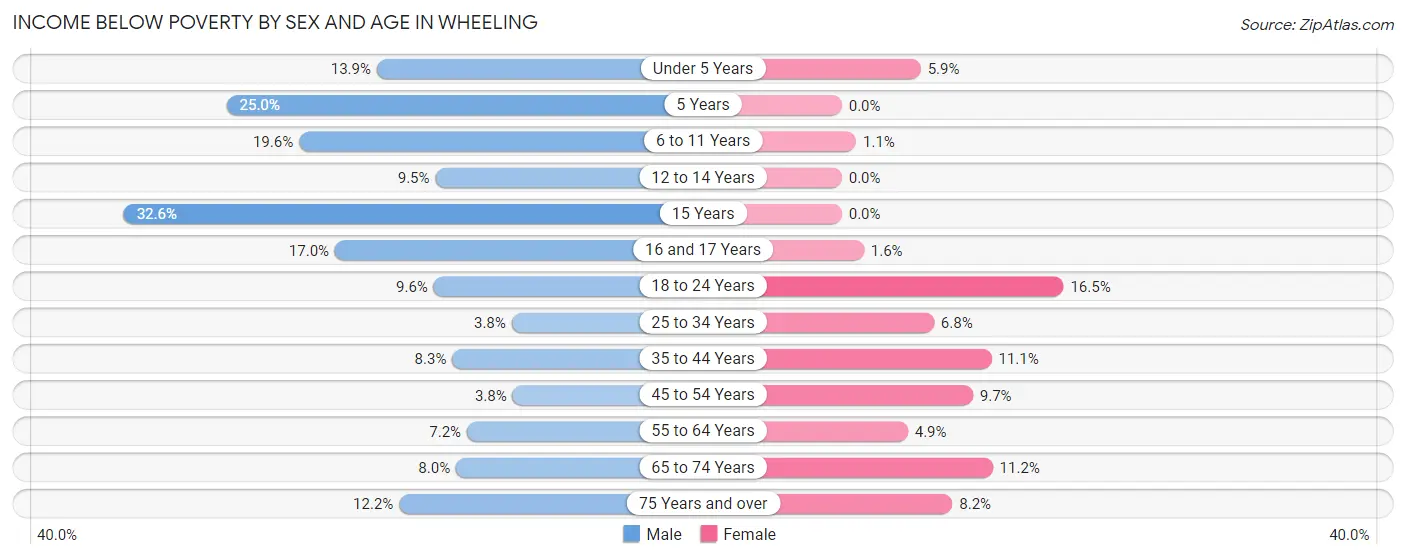
| Age Bracket | Male | Female |
| Under 5 Years | 126 (13.9%) | 70 (5.9%) |
| 5 Years | 78 (25.0%) | 0 (0.0%) |
| 6 to 11 Years | 223 (19.6%) | 15 (1.1%) |
| 12 to 14 Years | 44 (9.5%) | 0 (0.0%) |
| 15 Years | 47 (32.6%) | 0 (0.0%) |
| 16 and 17 Years | 88 (17.0%) | 3 (1.6%) |
| 18 to 24 Years | 134 (9.6%) | 238 (16.5%) |
| 25 to 34 Years | 121 (3.8%) | 211 (6.8%) |
| 35 to 44 Years | 282 (8.3%) | 310 (11.1%) |
| 45 to 54 Years | 83 (3.8%) | 223 (9.7%) |
| 55 to 64 Years | 172 (7.2%) | 134 (4.9%) |
| 65 to 74 Years | 141 (8.0%) | 232 (11.2%) |
| 75 Years and over | 122 (12.2%) | 109 (8.2%) |
| Total | 1,661 (8.8%) | 1,545 (8.0%) |
Income Above Poverty by Sex and Age in Wheeling
According to the poverty statistics in Wheeling, males aged 45 to 54 years and females aged 5 years are the age groups that are most secure financially, with 96.2% of males and 100.0% of females in these age groups living above the poverty line.
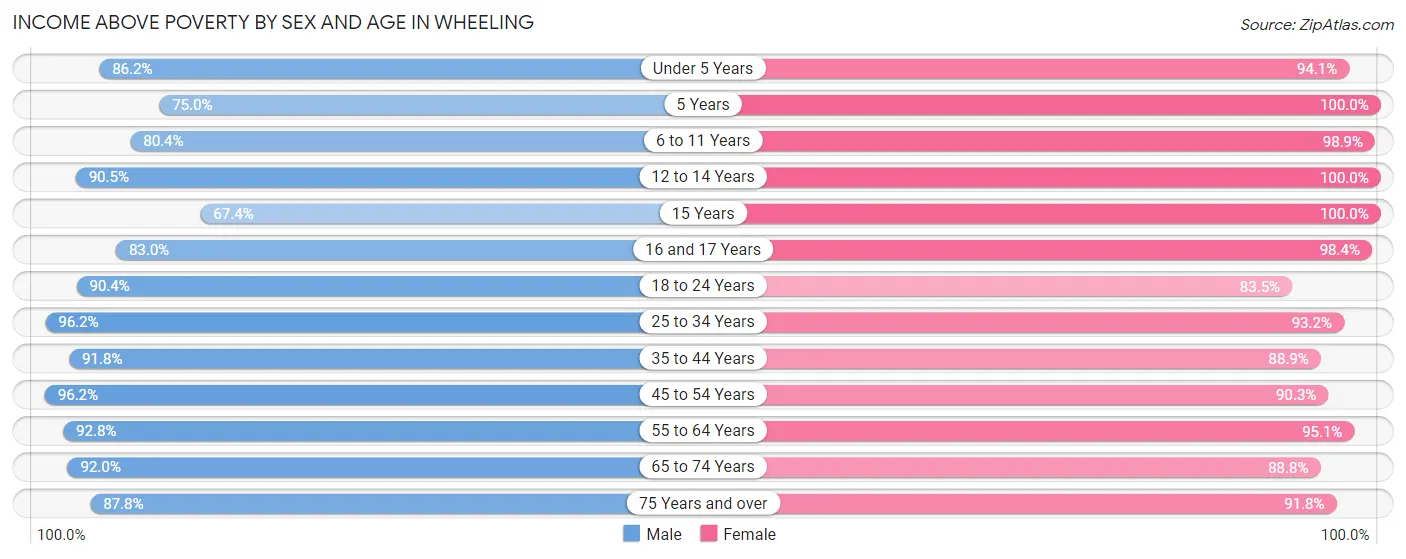
| Age Bracket | Male | Female |
| Under 5 Years | 784 (86.2%) | 1,124 (94.1%) |
| 5 Years | 234 (75.0%) | 120 (100.0%) |
| 6 to 11 Years | 913 (80.4%) | 1,401 (98.9%) |
| 12 to 14 Years | 419 (90.5%) | 555 (100.0%) |
| 15 Years | 97 (67.4%) | 89 (100.0%) |
| 16 and 17 Years | 431 (83.0%) | 180 (98.4%) |
| 18 to 24 Years | 1,257 (90.4%) | 1,208 (83.5%) |
| 25 to 34 Years | 3,031 (96.2%) | 2,873 (93.2%) |
| 35 to 44 Years | 3,135 (91.7%) | 2,479 (88.9%) |
| 45 to 54 Years | 2,116 (96.2%) | 2,070 (90.3%) |
| 55 to 64 Years | 2,230 (92.8%) | 2,599 (95.1%) |
| 65 to 74 Years | 1,628 (92.0%) | 1,840 (88.8%) |
| 75 Years and over | 879 (87.8%) | 1,218 (91.8%) |
| Total | 17,154 (91.2%) | 17,756 (92.0%) |
Income Below Poverty Among Married-Couple Families in Wheeling
The poverty statistics for married-couple families in Wheeling show that 5.8% or 428 of the total 7,421 families live below the poverty line. Families with 3 or 4 children have the highest poverty rate of 31.7%, comprising of 131 families. On the other hand, families with 5 or more children have the lowest poverty rate of 0.0%, which includes 0 families.
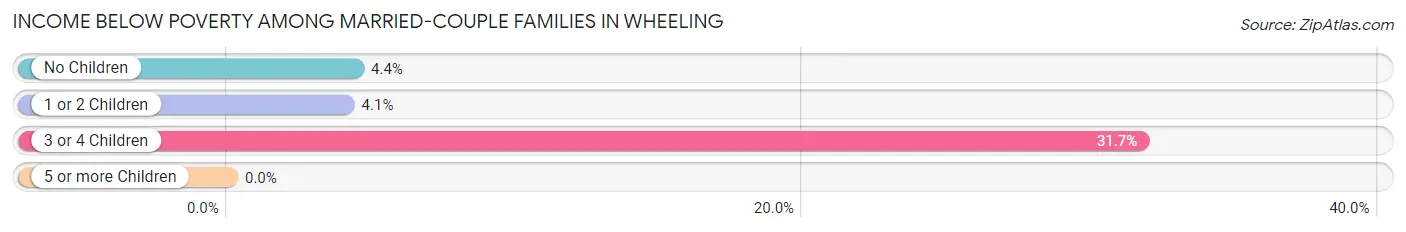
| Children | Above Poverty | Below Poverty |
| No Children | 3,946 (95.6%) | 181 (4.4%) |
| 1 or 2 Children | 2,742 (95.9%) | 116 (4.1%) |
| 3 or 4 Children | 282 (68.3%) | 131 (31.7%) |
| 5 or more Children | 23 (100.0%) | 0 (0.0%) |
| Total | 6,993 (94.2%) | 428 (5.8%) |
Income Below Poverty Among Single-Parent Households in Wheeling
According to the poverty data in Wheeling, 1.5% or 12 single-father households and 8.9% or 125 single-mother households are living below the poverty line. Among single-father households, those with no children have the highest poverty rate, with 12 households (2.0%) experiencing poverty. Likewise, among single-mother households, those with 3 or 4 children have the highest poverty rate, with 11 households (28.2%) falling below the poverty line.
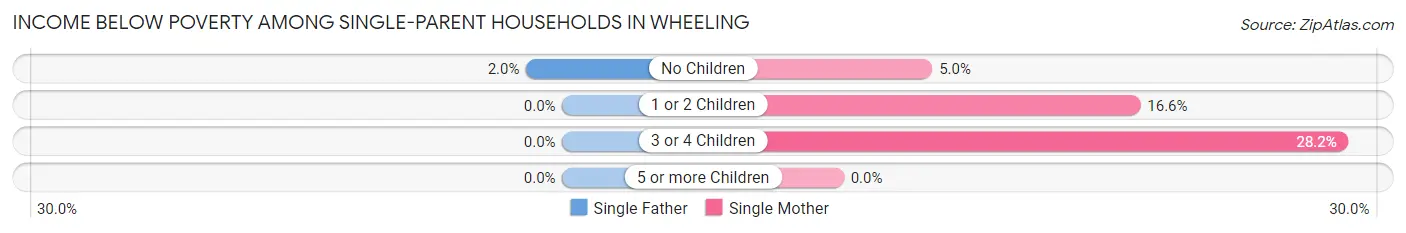
| Children | Single Father | Single Mother |
| No Children | 12 (2.0%) | 48 (5.0%) |
| 1 or 2 Children | 0 (0.0%) | 66 (16.6%) |
| 3 or 4 Children | 0 (0.0%) | 11 (28.2%) |
| 5 or more Children | 0 (0.0%) | 0 (0.0%) |
| Total | 12 (1.5%) | 125 (8.9%) |
Income Below Poverty Among Married-Couple vs Single-Parent Households in Wheeling
The poverty data for Wheeling shows that 428 of the married-couple family households (5.8%) and 137 of the single-parent households (6.1%) are living below the poverty level. Within the married-couple family households, those with 3 or 4 children have the highest poverty rate, with 131 households (31.7%) falling below the poverty line. Among the single-parent households, those with 3 or 4 children have the highest poverty rate, with 11 household (28.2%) living below poverty.
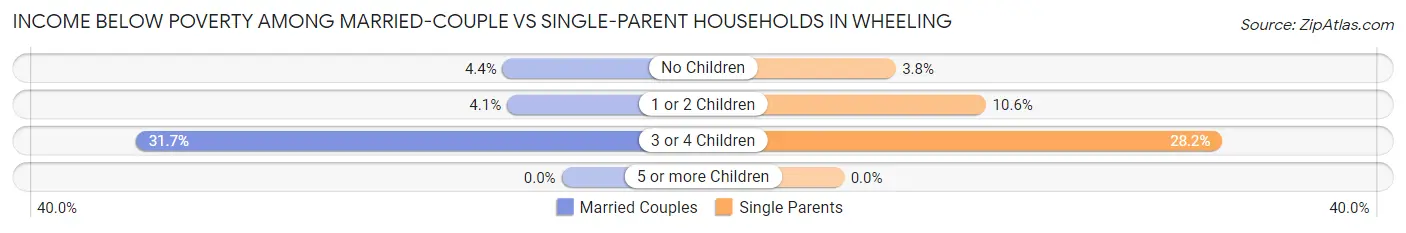
| Children | Married-Couple Families | Single-Parent Households |
| No Children | 181 (4.4%) | 60 (3.8%) |
| 1 or 2 Children | 116 (4.1%) | 66 (10.6%) |
| 3 or 4 Children | 131 (31.7%) | 11 (28.2%) |
| 5 or more Children | 0 (0.0%) | 0 (0.0%) |
| Total | 428 (5.8%) | 137 (6.1%) |
Race in Wheeling
The most populous races in Wheeling are White / Caucasian (21,069 | 54.3%), Hispanic or Latino (12,358 | 31.8%), and Some other Race (8,022 | 20.7%).
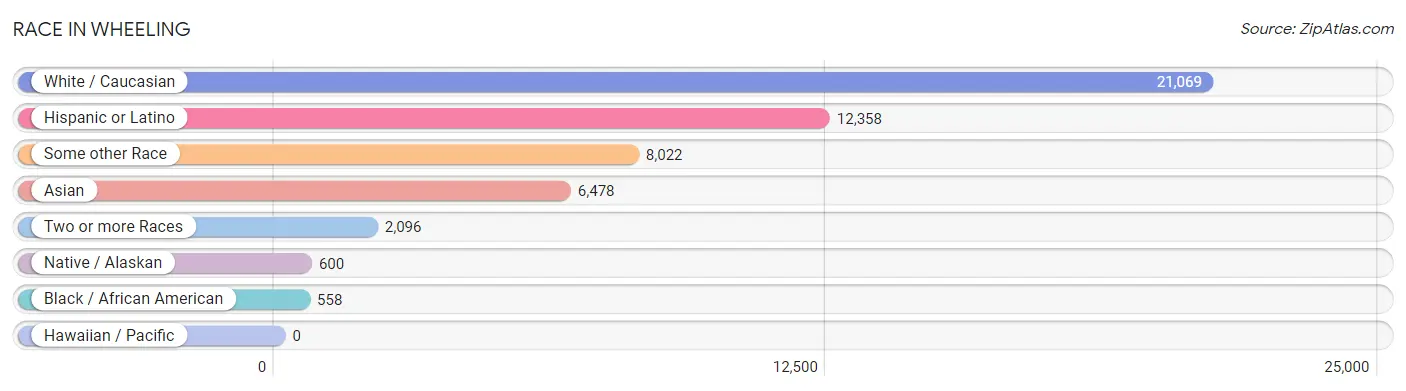
| Race | # Population | % Population |
| Asian | 6,478 | 16.7% |
| Black / African American | 558 | 1.4% |
| Hawaiian / Pacific | 0 | 0.0% |
| Hispanic or Latino | 12,358 | 31.8% |
| Native / Alaskan | 600 | 1.5% |
| White / Caucasian | 21,069 | 54.3% |
| Two or more Races | 2,096 | 5.4% |
| Some other Race | 8,022 | 20.7% |
| Total | 38,823 | 100.0% |
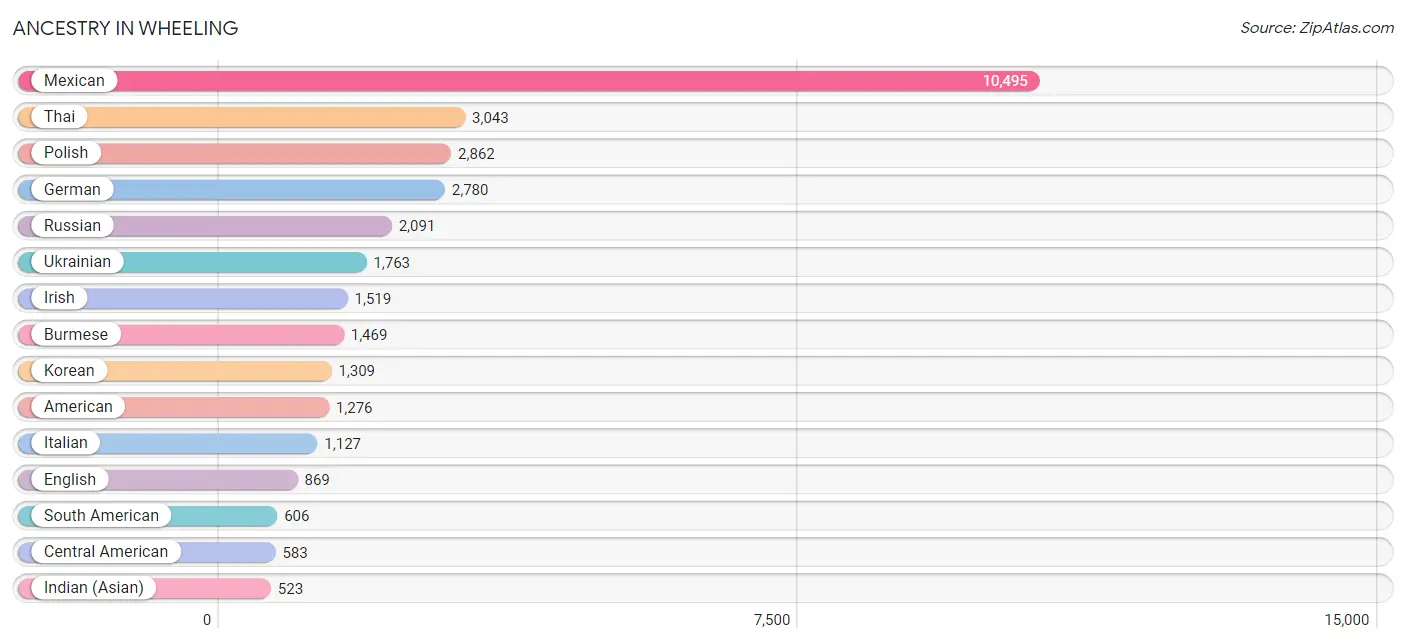
Ancestry in Wheeling
The most populous ancestries reported in Wheeling are Mexican (10,495 | 27.0%), Thai (3,043 | 7.8%), Polish (2,862 | 7.4%), German (2,780 | 7.2%), and Russian (2,091 | 5.4%), together accounting for 54.8% of all Wheeling residents.
| Ancestry | # Population | % Population |
| Afghan | 18 | 0.1% |
| African | 8 | 0.0% |
| American | 1,276 | 3.3% |
| Arab | 314 | 0.8% |
| Argentinean | 33 | 0.1% |
| Armenian | 72 | 0.2% |
| Assyrian / Chaldean / Syriac | 3 | 0.0% |
| Austrian | 151 | 0.4% |
| Belgian | 30 | 0.1% |
| Bhutanese | 83 | 0.2% |
| Blackfeet | 23 | 0.1% |
| British | 120 | 0.3% |
| Bulgarian | 154 | 0.4% |
| Burmese | 1,469 | 3.8% |
| Canadian | 6 | 0.0% |
| Central American | 583 | 1.5% |
| Cherokee | 117 | 0.3% |
| Choctaw | 3 | 0.0% |
| Colombian | 54 | 0.1% |
| Costa Rican | 12 | 0.0% |
| Creek | 15 | 0.0% |
| Croatian | 29 | 0.1% |
| Cuban | 24 | 0.1% |
| Czech | 69 | 0.2% |
| Czechoslovakian | 33 | 0.1% |
| Danish | 97 | 0.3% |
| Delaware | 4 | 0.0% |
| Dominican | 55 | 0.1% |
| Dutch | 243 | 0.6% |
| Eastern European | 139 | 0.4% |
| Ecuadorian | 228 | 0.6% |
| Egyptian | 55 | 0.1% |
| English | 869 | 2.2% |
| European | 225 | 0.6% |
| Filipino | 17 | 0.0% |
| Finnish | 40 | 0.1% |
| French | 261 | 0.7% |
| French Canadian | 13 | 0.0% |
| German | 2,780 | 7.2% |
| Greek | 341 | 0.9% |
| Guatemalan | 30 | 0.1% |
| Haitian | 23 | 0.1% |
| Honduran | 180 | 0.5% |
| Hungarian | 76 | 0.2% |
| Indian (Asian) | 523 | 1.3% |
| Indonesian | 18 | 0.1% |
| Iranian | 88 | 0.2% |
| Iraqi | 40 | 0.1% |
| Irish | 1,519 | 3.9% |
| Israeli | 56 | 0.1% |
| Italian | 1,127 | 2.9% |
| Jamaican | 31 | 0.1% |
| Japanese | 25 | 0.1% |
| Jordanian | 22 | 0.1% |
| Korean | 1,309 | 3.4% |
| Latvian | 93 | 0.2% |
| Lebanese | 100 | 0.3% |
| Lithuanian | 185 | 0.5% |
| Luxembourger | 19 | 0.1% |
| Mexican | 10,495 | 27.0% |
| Mexican American Indian | 328 | 0.8% |
| Moroccan | 25 | 0.1% |
| Nigerian | 35 | 0.1% |
| Northern European | 12 | 0.0% |
| Norwegian | 364 | 0.9% |
| Pakistani | 43 | 0.1% |
| Palestinian | 28 | 0.1% |
| Peruvian | 200 | 0.5% |
| Polish | 2,862 | 7.4% |
| Portuguese | 25 | 0.1% |
| Puerto Rican | 277 | 0.7% |
| Romanian | 418 | 1.1% |
| Russian | 2,091 | 5.4% |
| Salvadoran | 361 | 0.9% |
| Scandinavian | 18 | 0.1% |
| Scotch-Irish | 127 | 0.3% |
| Scottish | 115 | 0.3% |
| Serbian | 39 | 0.1% |
| Slavic | 44 | 0.1% |
| Slovak | 108 | 0.3% |
| Slovene | 9 | 0.0% |
| South African | 19 | 0.1% |
| South American | 606 | 1.6% |
| Soviet Union | 15 | 0.0% |
| Spaniard | 26 | 0.1% |
| Sri Lankan | 68 | 0.2% |
| Subsaharan African | 62 | 0.2% |
| Swedish | 342 | 0.9% |
| Swiss | 47 | 0.1% |
| Syrian | 31 | 0.1% |
| Thai | 3,043 | 7.8% |
| Turkish | 27 | 0.1% |
| Ukrainian | 1,763 | 4.5% |
| Uruguayan | 22 | 0.1% |
| Venezuelan | 69 | 0.2% |
| Welsh | 18 | 0.1% |
| Yugoslavian | 13 | 0.0% | View All 97 Rows |
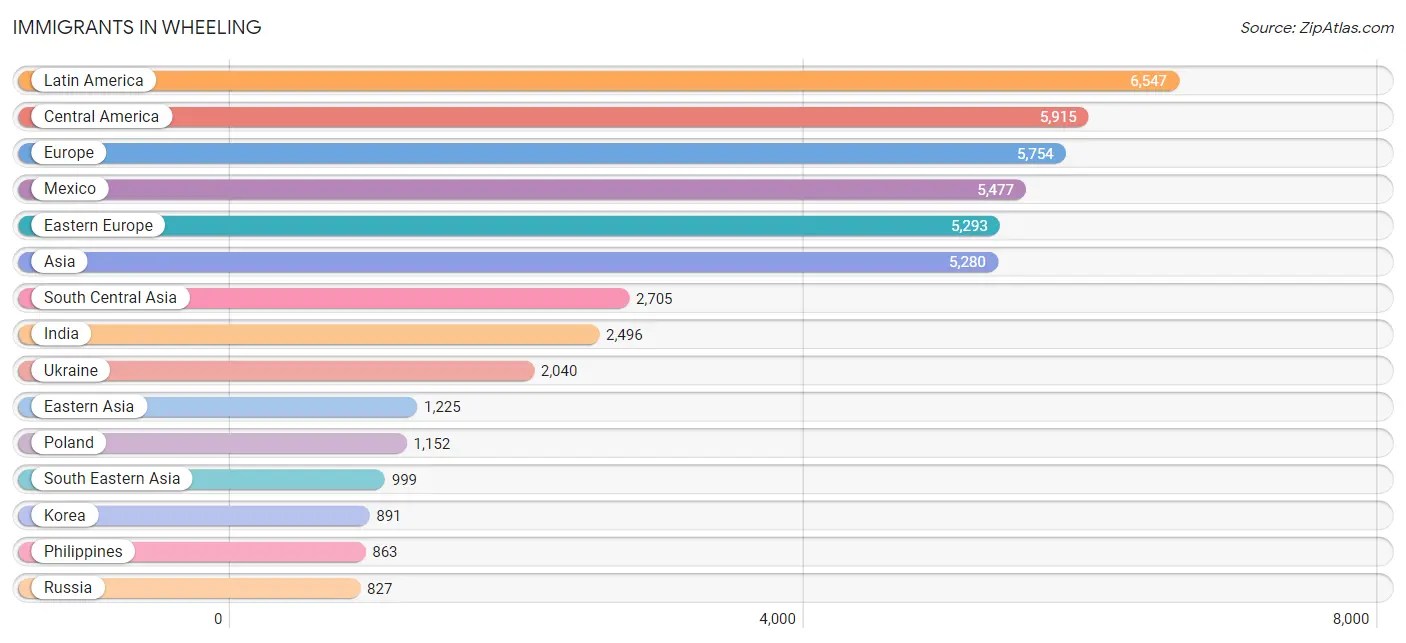
Immigrants in Wheeling
The most numerous immigrant groups reported in Wheeling came from Latin America (6,547 | 16.9%), Central America (5,915 | 15.2%), Europe (5,754 | 14.8%), Mexico (5,477 | 14.1%), and Eastern Europe (5,293 | 13.6%), together accounting for 74.7% of all Wheeling residents.
| Immigration Origin | # Population | % Population |
| Africa | 161 | 0.4% |
| Argentina | 12 | 0.0% |
| Asia | 5,280 | 13.6% |
| Belarus | 538 | 1.4% |
| Bolivia | 16 | 0.0% |
| Bosnia and Herzegovina | 6 | 0.0% |
| Brazil | 21 | 0.1% |
| Bulgaria | 113 | 0.3% |
| Cambodia | 25 | 0.1% |
| Canada | 47 | 0.1% |
| Caribbean | 7 | 0.0% |
| Central America | 5,915 | 15.2% |
| China | 303 | 0.8% |
| Colombia | 60 | 0.2% |
| Costa Rica | 12 | 0.0% |
| Cuba | 7 | 0.0% |
| Czechoslovakia | 7 | 0.0% |
| Eastern Asia | 1,225 | 3.2% |
| Eastern Europe | 5,293 | 13.6% |
| Ecuador | 218 | 0.6% |
| Egypt | 55 | 0.1% |
| El Salvador | 273 | 0.7% |
| England | 27 | 0.1% |
| Europe | 5,754 | 14.8% |
| France | 21 | 0.1% |
| Germany | 116 | 0.3% |
| Greece | 92 | 0.2% |
| Guatemala | 15 | 0.0% |
| Honduras | 138 | 0.4% |
| Hong Kong | 15 | 0.0% |
| India | 2,496 | 6.4% |
| Iran | 41 | 0.1% |
| Iraq | 40 | 0.1% |
| Ireland | 26 | 0.1% |
| Israel | 6 | 0.0% |
| Italy | 76 | 0.2% |
| Japan | 31 | 0.1% |
| Jordan | 52 | 0.1% |
| Kazakhstan | 79 | 0.2% |
| Korea | 891 | 2.3% |
| Kuwait | 7 | 0.0% |
| Latin America | 6,547 | 16.9% |
| Latvia | 34 | 0.1% |
| Lebanon | 10 | 0.0% |
| Lithuania | 131 | 0.3% |
| Mexico | 5,477 | 14.1% |
| Moldova | 172 | 0.4% |
| Morocco | 52 | 0.1% |
| Nepal | 13 | 0.0% |
| Nigeria | 35 | 0.1% |
| Northern Africa | 107 | 0.3% |
| Northern Europe | 95 | 0.2% |
| Pakistan | 37 | 0.1% |
| Peru | 191 | 0.5% |
| Philippines | 863 | 2.2% |
| Poland | 1,152 | 3.0% |
| Portugal | 25 | 0.1% |
| Romania | 41 | 0.1% |
| Russia | 827 | 2.1% |
| Saudi Arabia | 11 | 0.0% |
| Singapore | 47 | 0.1% |
| South Africa | 19 | 0.1% |
| South America | 625 | 1.6% |
| South Central Asia | 2,705 | 7.0% |
| South Eastern Asia | 999 | 2.6% |
| Southern Europe | 193 | 0.5% |
| Taiwan | 13 | 0.0% |
| Thailand | 26 | 0.1% |
| Turkey | 65 | 0.2% |
| Ukraine | 2,040 | 5.2% |
| Uzbekistan | 39 | 0.1% |
| Venezuela | 107 | 0.3% |
| Vietnam | 26 | 0.1% |
| Western Africa | 35 | 0.1% |
| Western Asia | 291 | 0.7% |
| Western Europe | 137 | 0.4% | View All 76 Rows |
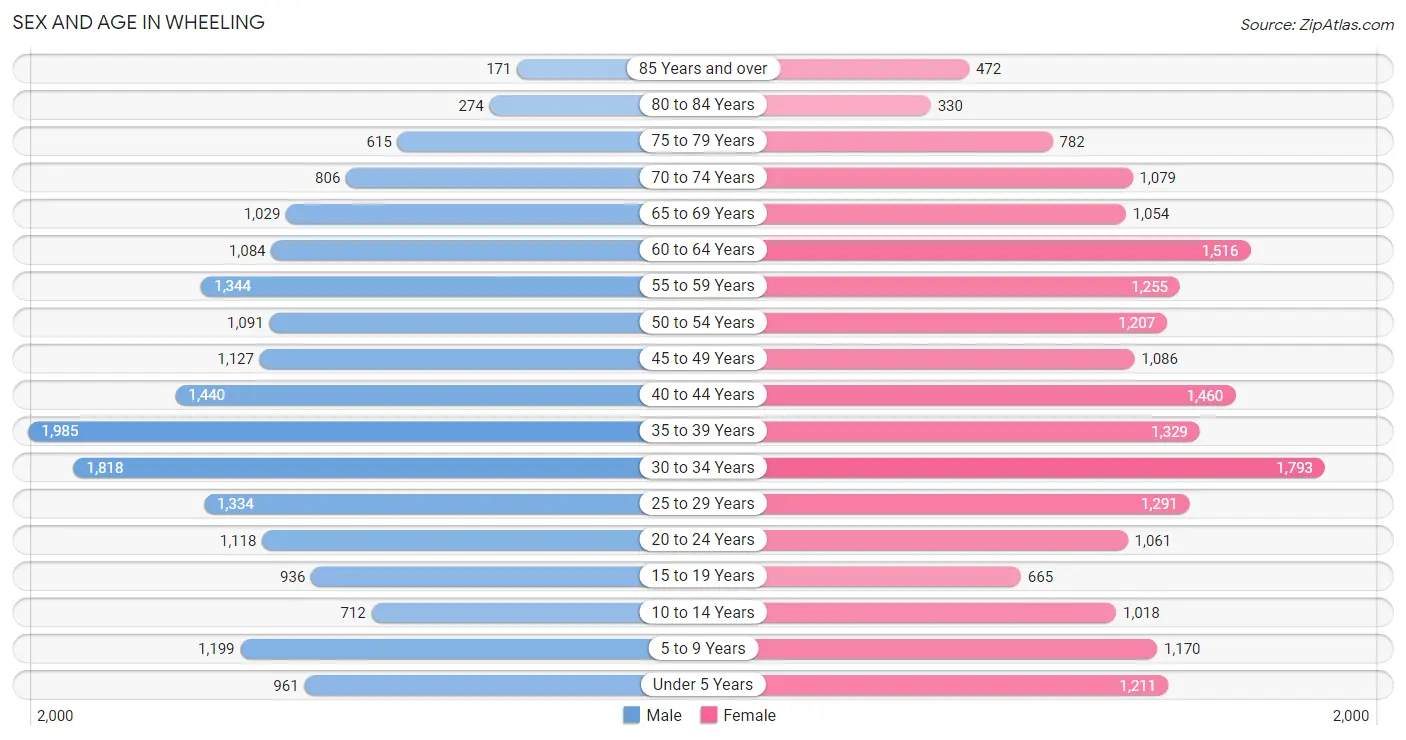
Sex and Age in Wheeling
Sex and Age in Wheeling
The most populous age groups in Wheeling are 35 to 39 Years (1,985 | 10.4%) for men and 30 to 34 Years (1,793 | 9.1%) for women.
| Age Bracket | Male | Female |
| Under 5 Years | 961 (5.1%) | 1,211 (6.1%) |
| 5 to 9 Years | 1,199 (6.3%) | 1,170 (5.9%) |
| 10 to 14 Years | 712 (3.7%) | 1,018 (5.1%) |
| 15 to 19 Years | 936 (4.9%) | 665 (3.4%) |
| 20 to 24 Years | 1,118 (5.9%) | 1,061 (5.4%) |
| 25 to 29 Years | 1,334 (7.0%) | 1,291 (6.5%) |
| 30 to 34 Years | 1,818 (9.6%) | 1,793 (9.1%) |
| 35 to 39 Years | 1,985 (10.4%) | 1,329 (6.7%) |
| 40 to 44 Years | 1,440 (7.6%) | 1,460 (7.4%) |
| 45 to 49 Years | 1,127 (5.9%) | 1,086 (5.5%) |
| 50 to 54 Years | 1,091 (5.7%) | 1,207 (6.1%) |
| 55 to 59 Years | 1,344 (7.1%) | 1,255 (6.4%) |
| 60 to 64 Years | 1,084 (5.7%) | 1,516 (7.7%) |
| 65 to 69 Years | 1,029 (5.4%) | 1,054 (5.3%) |
| 70 to 74 Years | 806 (4.2%) | 1,079 (5.5%) |
| 75 to 79 Years | 615 (3.2%) | 782 (4.0%) |
| 80 to 84 Years | 274 (1.4%) | 330 (1.7%) |
| 85 Years and over | 171 (0.9%) | 472 (2.4%) |
| Total | 19,044 (100.0%) | 19,779 (100.0%) |
Families and Households in Wheeling
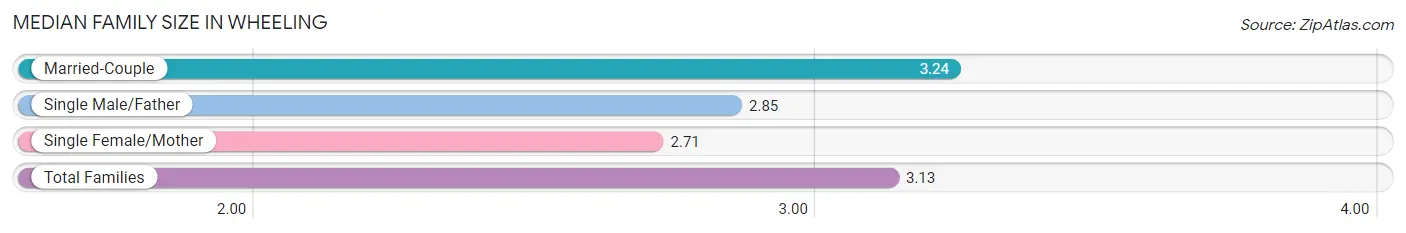
Median Family Size in Wheeling
The median family size in Wheeling is 3.13 persons per family, with married-couple families (7,421 | 76.9%) accounting for the largest median family size of 3.24 persons per family. On the other hand, single female/mother families (1,406 | 14.6%) represent the smallest median family size with 2.71 persons per family.
| Family Type | # Families | Family Size |
| Married-Couple | 7,421 (76.9%) | 3.24 |
| Single Male/Father | 820 (8.5%) | 2.85 |
| Single Female/Mother | 1,406 (14.6%) | 2.71 |
| Total Families | 9,647 (100.0%) | 3.13 |
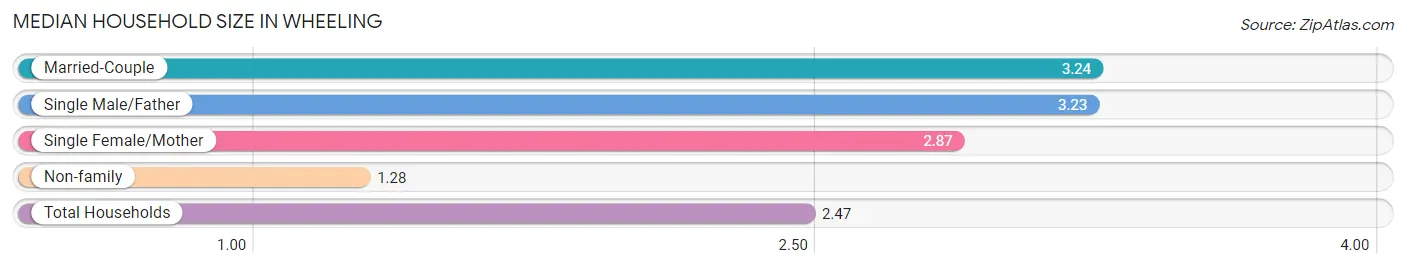
Median Household Size in Wheeling
The median household size in Wheeling is 2.47 persons per household, with married-couple households (7,421 | 47.9%) accounting for the largest median household size of 3.24 persons per household. non-family households (5,837 | 37.7%) represent the smallest median household size with 1.28 persons per household.
| Household Type | # Households | Household Size |
| Married-Couple | 7,421 (47.9%) | 3.24 |
| Single Male/Father | 820 (5.3%) | 3.23 |
| Single Female/Mother | 1,406 (9.1%) | 2.87 |
| Non-family | 5,837 (37.7%) | 1.28 |
| Total Households | 15,484 (100.0%) | 2.47 |
Household Size by Marriage Status in Wheeling
Out of a total of 15,484 households in Wheeling, 9,647 (62.3%) are family households, while 5,837 (37.7%) are nonfamily households. The most numerous type of family households are 2-person households, comprising 4,075, and the most common type of nonfamily households are 1-person households, comprising 4,748.
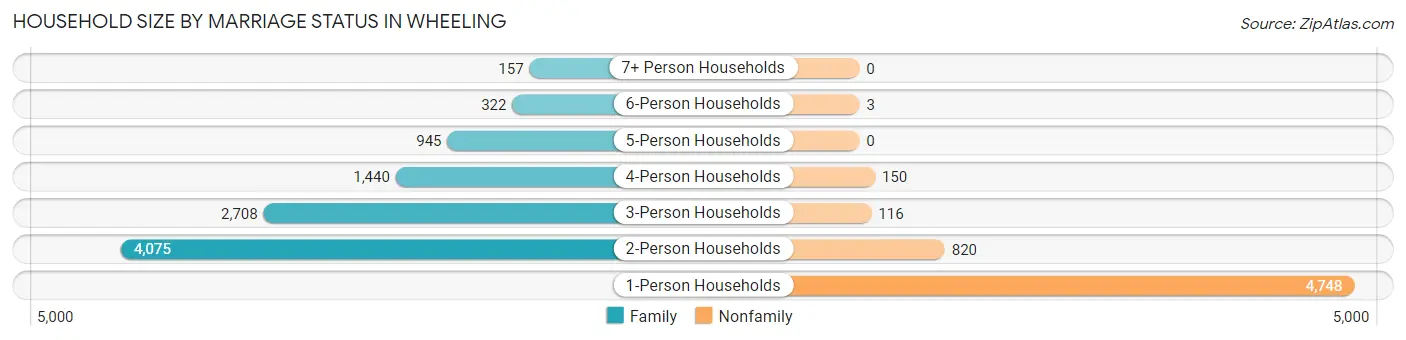
| Household Size | Family Households | Nonfamily Households |
| 1-Person Households | - | 4,748 (30.7%) |
| 2-Person Households | 4,075 (26.3%) | 820 (5.3%) |
| 3-Person Households | 2,708 (17.5%) | 116 (0.7%) |
| 4-Person Households | 1,440 (9.3%) | 150 (1.0%) |
| 5-Person Households | 945 (6.1%) | 0 (0.0%) |
| 6-Person Households | 322 (2.1%) | 3 (0.0%) |
| 7+ Person Households | 157 (1.0%) | 0 (0.0%) |
| Total | 9,647 (62.3%) | 5,837 (37.7%) |
Female Fertility in Wheeling
Fertility by Age in Wheeling
Average fertility rate in Wheeling is 38.0 births per 1,000 women. Women in the age bracket of 20 to 34 years have the highest fertility rate with 48.0 births per 1,000 women. Women in the age bracket of 20 to 34 years acount for 58.3% of all women with births.
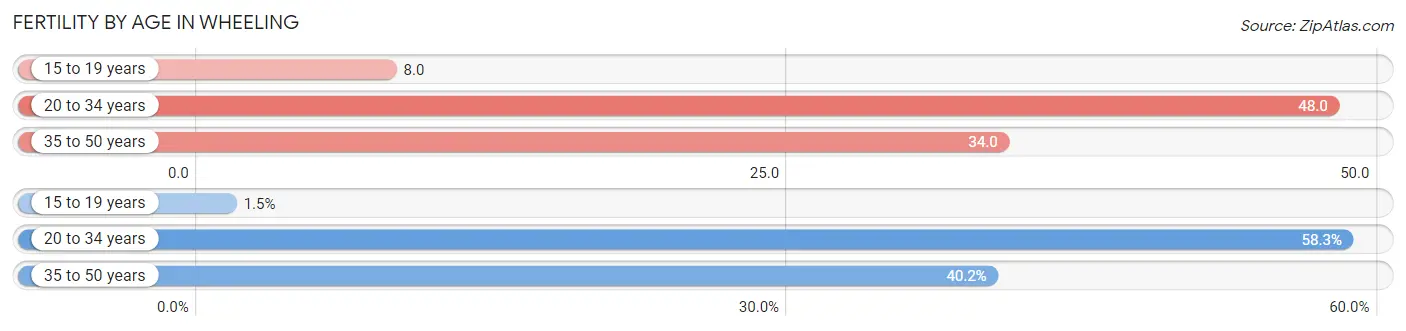
| Age Bracket | Women with Births | Births / 1,000 Women |
| 15 to 19 years | 5 (1.5%) | 8.0 |
| 20 to 34 years | 200 (58.3%) | 48.0 |
| 35 to 50 years | 138 (40.2%) | 34.0 |
| Total | 343 (100.0%) | 38.0 |
Fertility by Age by Marriage Status in Wheeling
89.8% of women with births (343) in Wheeling are married. The highest percentage of unmarried women with births falls into 15 to 19 years age bracket with 100.0% of them unmarried at the time of birth, while the lowest percentage of unmarried women with births belong to 35 to 50 years age bracket with 0.0% of them unmarried.
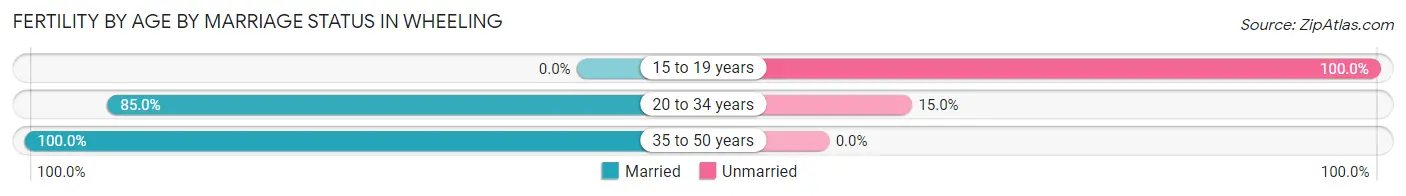
| Age Bracket | Married | Unmarried |
| 15 to 19 years | 0 (0.0%) | 5 (100.0%) |
| 20 to 34 years | 170 (85.0%) | 30 (15.0%) |
| 35 to 50 years | 138 (100.0%) | 0 (0.0%) |
| Total | 308 (89.8%) | 35 (10.2%) |
Fertility by Education in Wheeling
Average fertility rate in Wheeling is 38.0 births per 1,000 women. Women with the education attainment of graduate degree have the highest fertility rate of 72.0 births per 1,000 women, while women with the education attainment of college or associate's degree have the lowest fertility at 4.0 births per 1,000 women. Women with the education attainment of bachelor's degree represent 35.9% of all women with births.
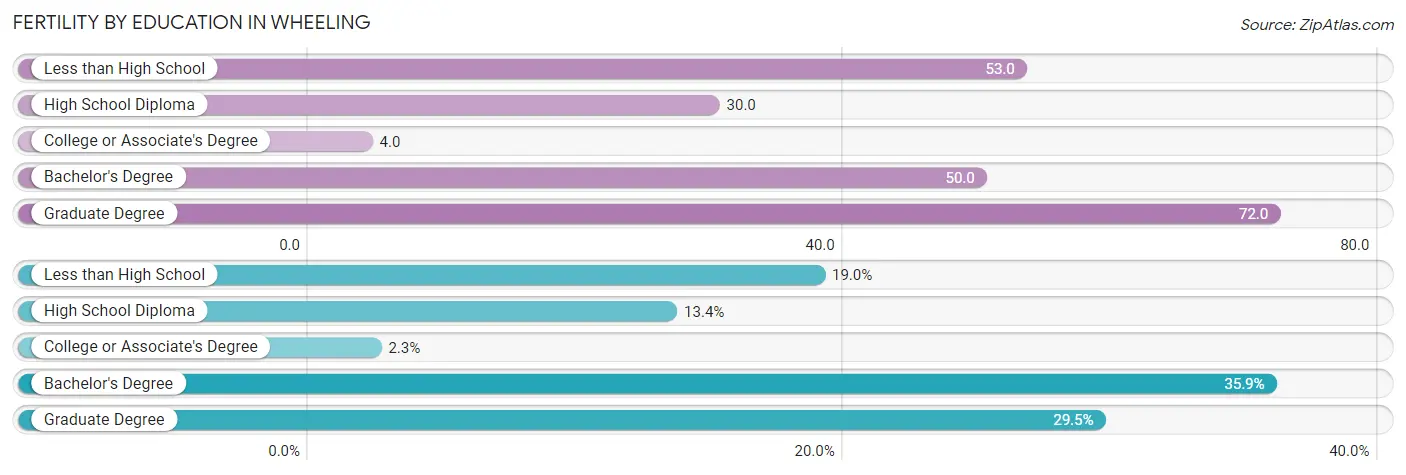
| Educational Attainment | Women with Births | Births / 1,000 Women |
| Less than High School | 65 (19.0%) | 53.0 |
| High School Diploma | 46 (13.4%) | 30.0 |
| College or Associate's Degree | 8 (2.3%) | 4.0 |
| Bachelor's Degree | 123 (35.9%) | 50.0 |
| Graduate Degree | 101 (29.4%) | 72.0 |
| Total | 343 (100.0%) | 38.0 |
Fertility by Education by Marriage Status in Wheeling
10.2% of women with births in Wheeling are unmarried. Women with the educational attainment of less than high school are most likely to be married with 100.0% of them married at childbirth, while women with the educational attainment of high school diploma are least likely to be married with 76.1% of them unmarried at childbirth.
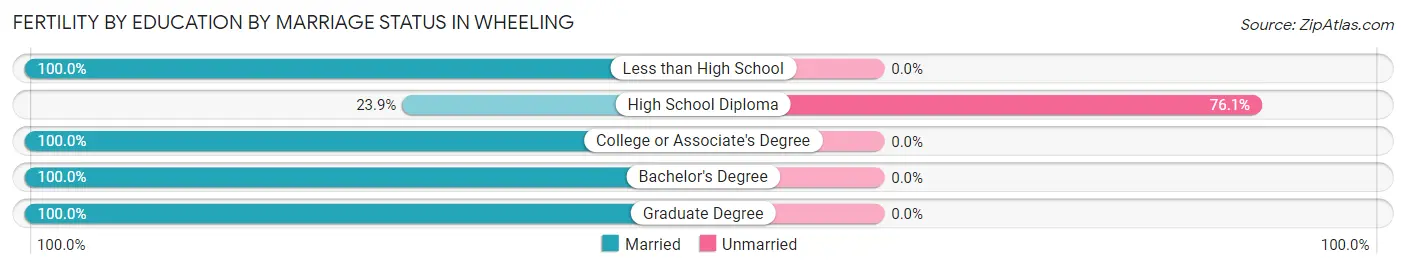
| Educational Attainment | Married | Unmarried |
| Less than High School | 65 (100.0%) | 0 (0.0%) |
| High School Diploma | 11 (23.9%) | 35 (76.1%) |
| College or Associate's Degree | 8 (100.0%) | 0 (0.0%) |
| Bachelor's Degree | 123 (100.0%) | 0 (0.0%) |
| Graduate Degree | 101 (100.0%) | 0 (0.0%) |
| Total | 308 (89.8%) | 35 (10.2%) |
Employment Characteristics in Wheeling
Employment by Class of Employer in Wheeling
Among the 21,608 employed individuals in Wheeling, private company employees (16,576 | 76.7%), not-for-profit organizations (1,439 | 6.7%), and self-employed (not incorporated) (1,171 | 5.4%) make up the most common classes of employment.
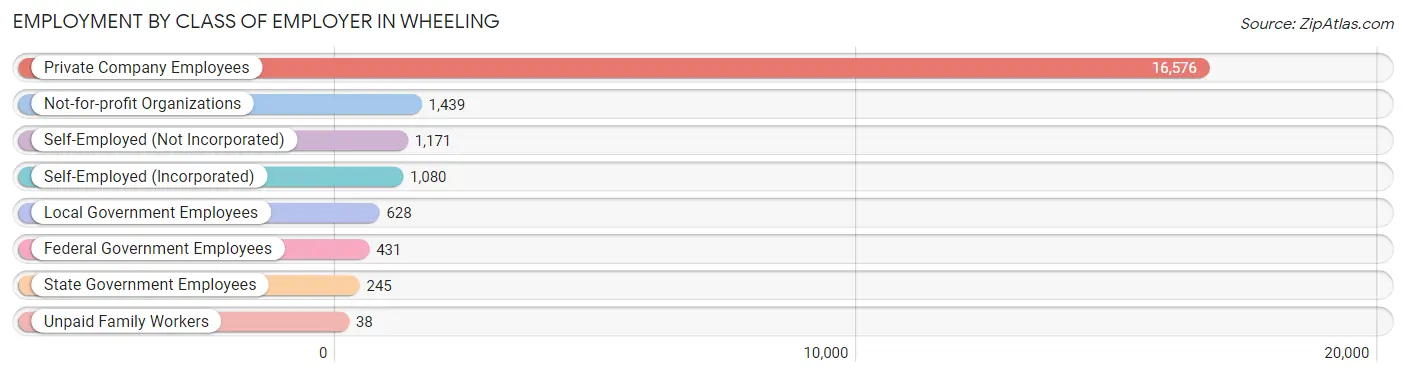
| Employer Class | # Employees | % Employees |
| Private Company Employees | 16,576 | 76.7% |
| Self-Employed (Incorporated) | 1,080 | 5.0% |
| Self-Employed (Not Incorporated) | 1,171 | 5.4% |
| Not-for-profit Organizations | 1,439 | 6.7% |
| Local Government Employees | 628 | 2.9% |
| State Government Employees | 245 | 1.1% |
| Federal Government Employees | 431 | 2.0% |
| Unpaid Family Workers | 38 | 0.2% |
| Total | 21,608 | 100.0% |
Employment Status by Age in Wheeling
According to the labor force statistics for Wheeling, out of the total population over 16 years of age (32,319), 71.9% or 23,237 individuals are in the labor force, with 5.2% or 1,208 of them unemployed. The age group with the highest labor force participation rate is 25 to 29 years, with 93.4% or 2,452 individuals in the labor force. Within the labor force, the 16 to 19 years age range has the highest percentage of unemployed individuals, with 17.0% or 144 of them being unemployed.
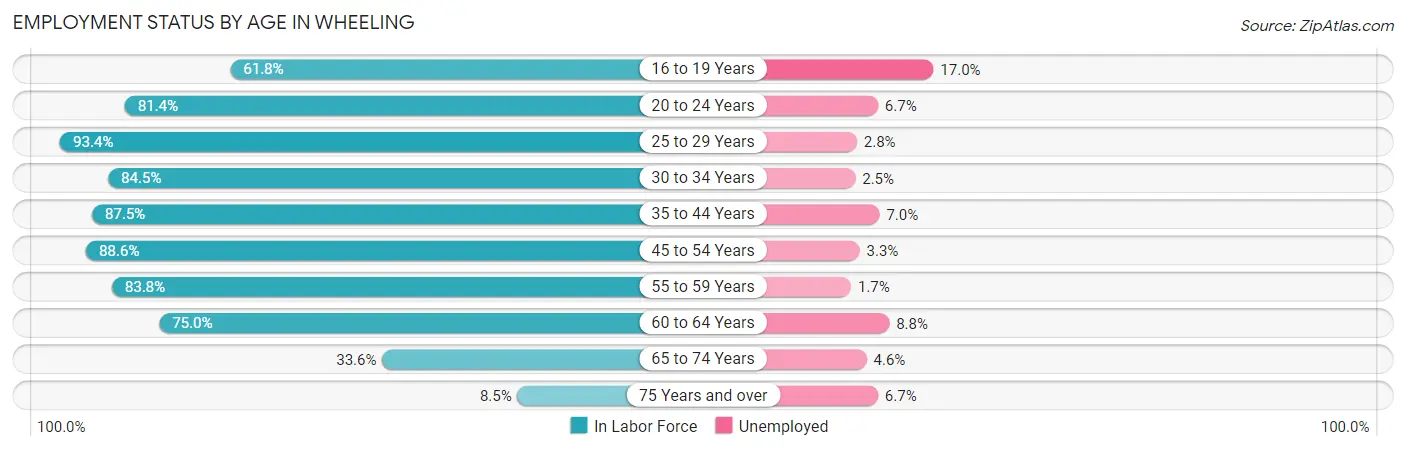
| Age Bracket | In Labor Force | Unemployed |
| 16 to 19 Years | 845 (61.8%) | 144 (17.0%) |
| 20 to 24 Years | 1,774 (81.4%) | 119 (6.7%) |
| 25 to 29 Years | 2,452 (93.4%) | 69 (2.8%) |
| 30 to 34 Years | 3,051 (84.5%) | 76 (2.5%) |
| 35 to 44 Years | 5,437 (87.5%) | 381 (7.0%) |
| 45 to 54 Years | 3,997 (88.6%) | 132 (3.3%) |
| 55 to 59 Years | 2,178 (83.8%) | 37 (1.7%) |
| 60 to 64 Years | 1,950 (75.0%) | 172 (8.8%) |
| 65 to 74 Years | 1,333 (33.6%) | 61 (4.6%) |
| 75 Years and over | 225 (8.5%) | 15 (6.7%) |
| Total | 23,237 (71.9%) | 1,208 (5.2%) |
Employment Status by Educational Attainment in Wheeling
According to labor force statistics for Wheeling, 86.0% of individuals (19,058) out of the total population between 25 and 64 years of age (22,160) are in the labor force, with 4.5% or 858 of them being unemployed. The group with the highest labor force participation rate are those with the educational attainment of bachelor's degree or higher, with 89.9% or 8,232 individuals in the labor force. Within the labor force, individuals with college / associate degree education have the highest percentage of unemployment, with 5.3% or 262 of them being unemployed.
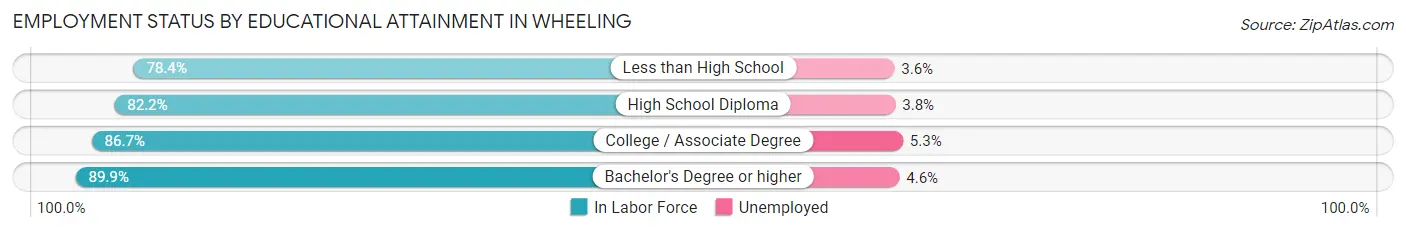
| Educational Attainment | In Labor Force | Unemployed |
| Less than High School | 2,173 (78.4%) | 100 (3.6%) |
| High School Diploma | 3,723 (82.2%) | 172 (3.8%) |
| College / Associate Degree | 4,944 (86.7%) | 302 (5.3%) |
| Bachelor's Degree or higher | 8,232 (89.9%) | 421 (4.6%) |
| Total | 19,058 (86.0%) | 997 (4.5%) |
Employment Occupations by Sex in Wheeling
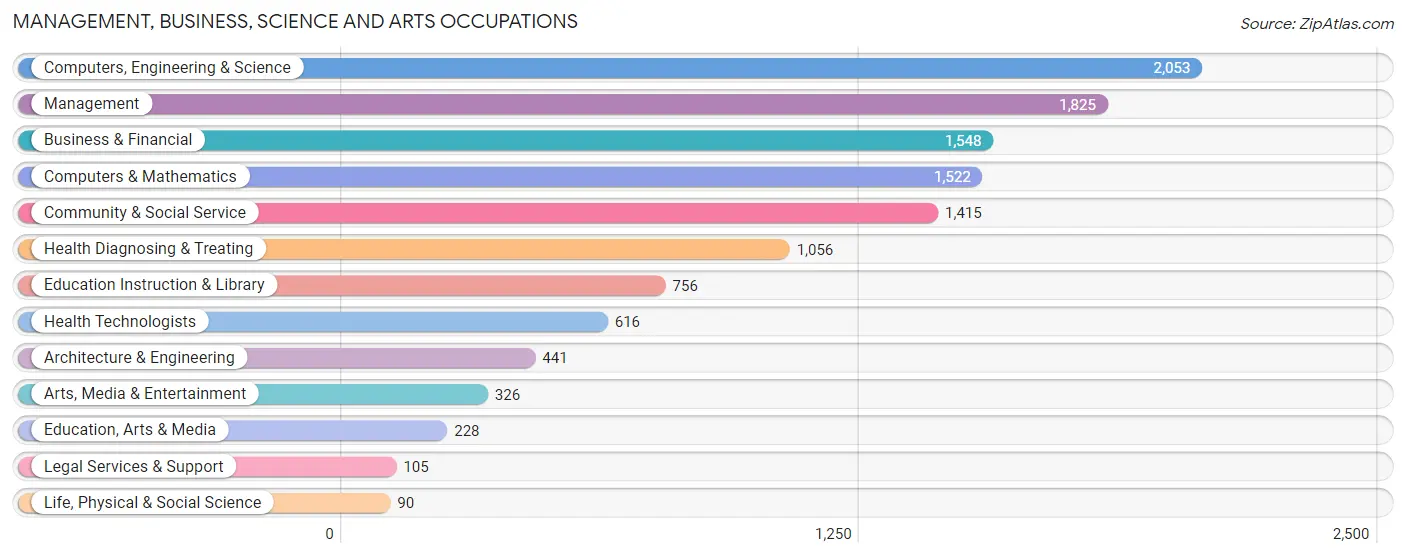
Management, Business, Science and Arts Occupations
The most common Management, Business, Science and Arts occupations in Wheeling are Computers, Engineering & Science (2,053 | 9.3%), Management (1,825 | 8.3%), Business & Financial (1,548 | 7.0%), Computers & Mathematics (1,522 | 6.9%), and Community & Social Service (1,415 | 6.4%).
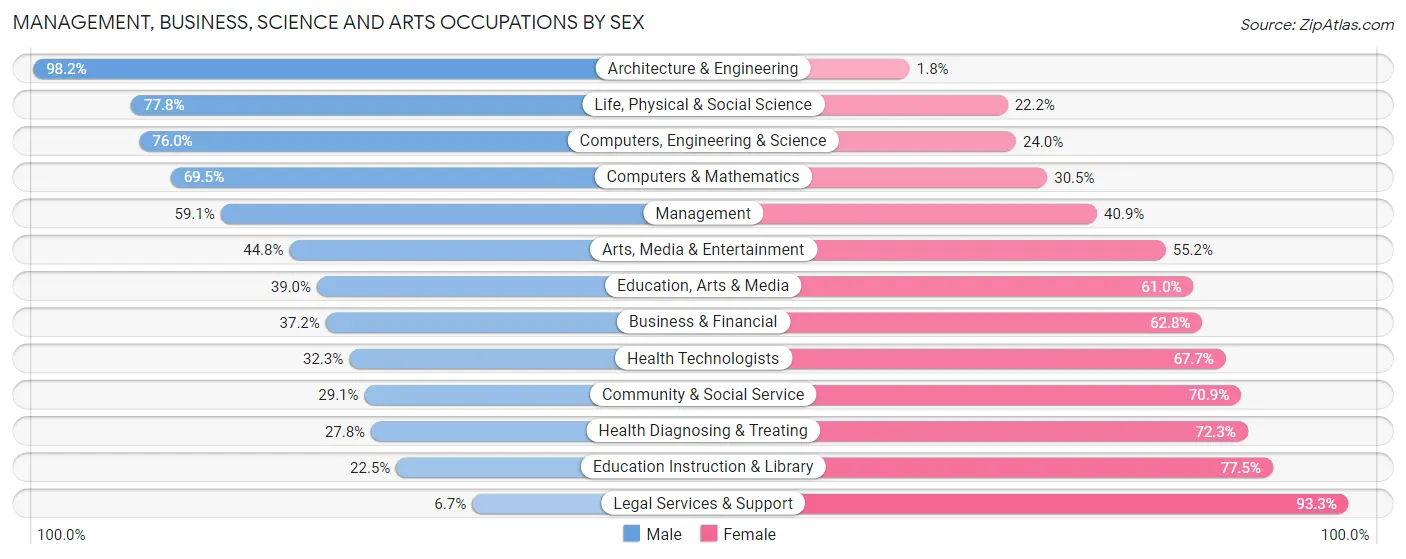
Management, Business, Science and Arts Occupations by Sex
Within the Management, Business, Science and Arts occupations in Wheeling, the most male-oriented occupations are Architecture & Engineering (98.2%), Life, Physical & Social Science (77.8%), and Computers, Engineering & Science (76.0%), while the most female-oriented occupations are Legal Services & Support (93.3%), Education Instruction & Library (77.5%), and Health Diagnosing & Treating (72.3%).
| Occupation | Male | Female |
| Management | 1,079 (59.1%) | 746 (40.9%) |
| Business & Financial | 576 (37.2%) | 972 (62.8%) |
| Computers, Engineering & Science | 1,561 (76.0%) | 492 (24.0%) |
| Computers & Mathematics | 1,058 (69.5%) | 464 (30.5%) |
| Architecture & Engineering | 433 (98.2%) | 8 (1.8%) |
| Life, Physical & Social Science | 70 (77.8%) | 20 (22.2%) |
| Community & Social Service | 412 (29.1%) | 1,003 (70.9%) |
| Education, Arts & Media | 89 (39.0%) | 139 (61.0%) |
| Legal Services & Support | 7 (6.7%) | 98 (93.3%) |
| Education Instruction & Library | 170 (22.5%) | 586 (77.5%) |
| Arts, Media & Entertainment | 146 (44.8%) | 180 (55.2%) |
| Health Diagnosing & Treating | 293 (27.8%) | 763 (72.3%) |
| Health Technologists | 199 (32.3%) | 417 (67.7%) |
| Total (Category) | 3,921 (49.6%) | 3,976 (50.3%) |
| Total (Overall) | 11,798 (53.7%) | 10,181 (46.3%) |
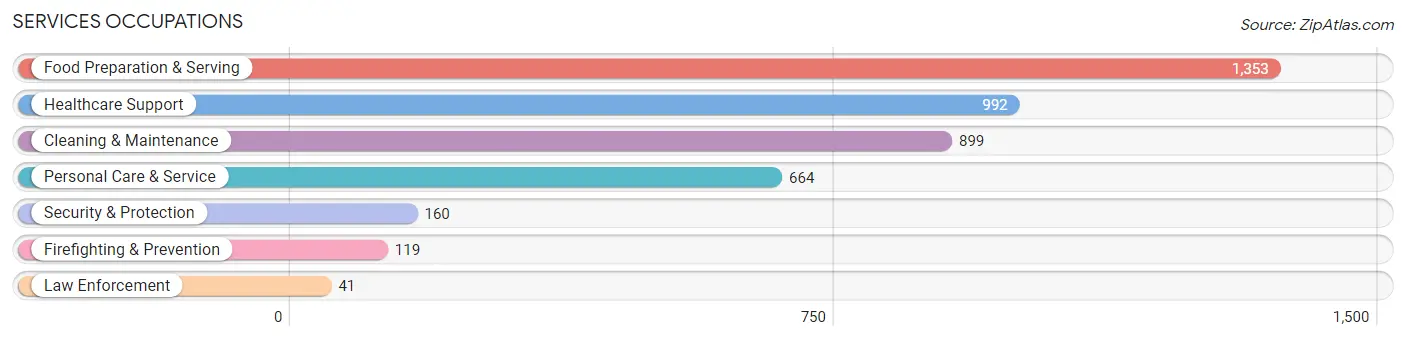
Services Occupations
The most common Services occupations in Wheeling are Food Preparation & Serving (1,353 | 6.2%), Healthcare Support (992 | 4.5%), Cleaning & Maintenance (899 | 4.1%), Personal Care & Service (664 | 3.0%), and Security & Protection (160 | 0.7%).
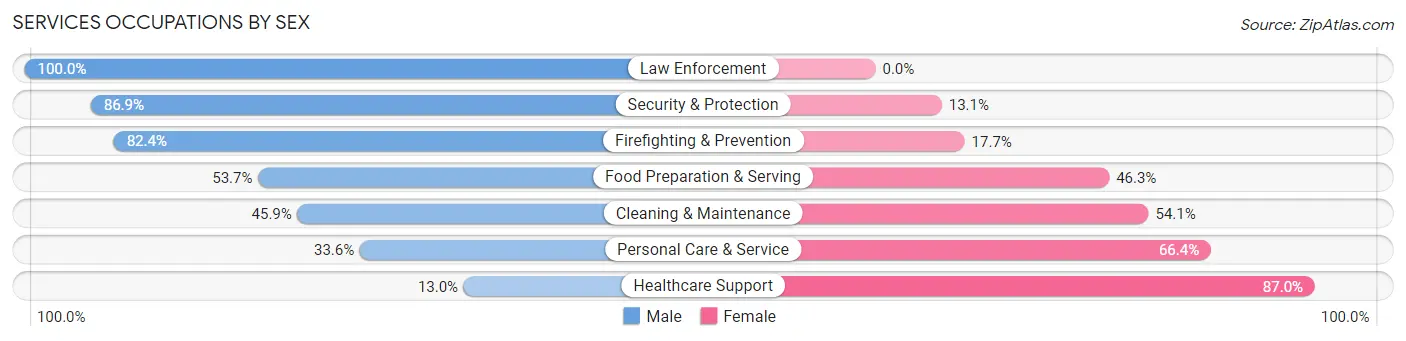
Services Occupations by Sex
Within the Services occupations in Wheeling, the most male-oriented occupations are Law Enforcement (100.0%), Security & Protection (86.9%), and Firefighting & Prevention (82.4%), while the most female-oriented occupations are Healthcare Support (87.0%), Personal Care & Service (66.4%), and Cleaning & Maintenance (54.1%).
| Occupation | Male | Female |
| Healthcare Support | 129 (13.0%) | 863 (87.0%) |
| Security & Protection | 139 (86.9%) | 21 (13.1%) |
| Firefighting & Prevention | 98 (82.4%) | 21 (17.6%) |
| Law Enforcement | 41 (100.0%) | 0 (0.0%) |
| Food Preparation & Serving | 727 (53.7%) | 626 (46.3%) |
| Cleaning & Maintenance | 413 (45.9%) | 486 (54.1%) |
| Personal Care & Service | 223 (33.6%) | 441 (66.4%) |
| Total (Category) | 1,631 (40.1%) | 2,437 (59.9%) |
| Total (Overall) | 11,798 (53.7%) | 10,181 (46.3%) |
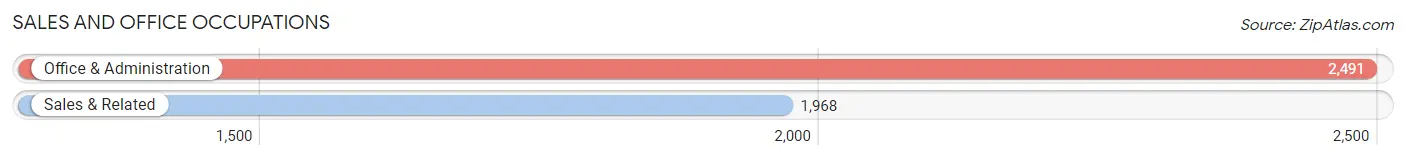
Sales and Office Occupations
The most common Sales and Office occupations in Wheeling are Office & Administration (2,491 | 11.3%), and Sales & Related (1,968 | 8.9%).
Sales and Office Occupations by Sex
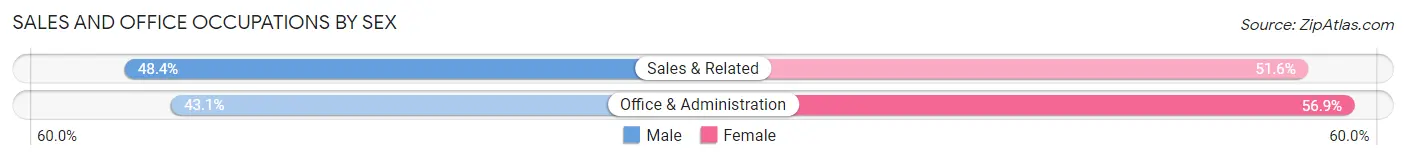
| Occupation | Male | Female |
| Sales & Related | 953 (48.4%) | 1,015 (51.6%) |
| Office & Administration | 1,073 (43.1%) | 1,418 (56.9%) |
| Total (Category) | 2,026 (45.4%) | 2,433 (54.6%) |
| Total (Overall) | 11,798 (53.7%) | 10,181 (46.3%) |
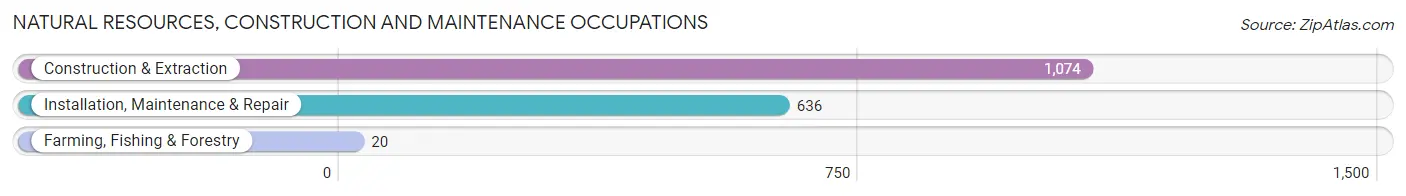
Natural Resources, Construction and Maintenance Occupations
The most common Natural Resources, Construction and Maintenance occupations in Wheeling are Construction & Extraction (1,074 | 4.9%), Installation, Maintenance & Repair (636 | 2.9%), and Farming, Fishing & Forestry (20 | 0.1%).
Natural Resources, Construction and Maintenance Occupations by Sex
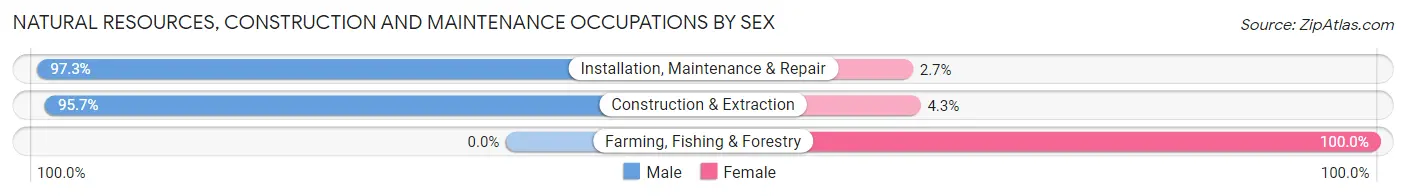
| Occupation | Male | Female |
| Farming, Fishing & Forestry | 0 (0.0%) | 20 (100.0%) |
| Construction & Extraction | 1,028 (95.7%) | 46 (4.3%) |
| Installation, Maintenance & Repair | 619 (97.3%) | 17 (2.7%) |
| Total (Category) | 1,647 (95.2%) | 83 (4.8%) |
| Total (Overall) | 11,798 (53.7%) | 10,181 (46.3%) |
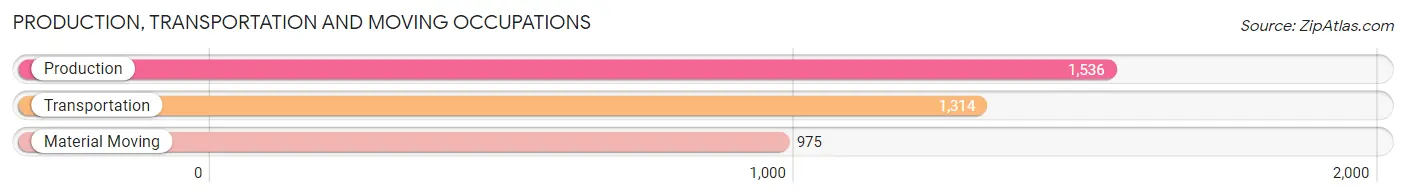
Production, Transportation and Moving Occupations
The most common Production, Transportation and Moving occupations in Wheeling are Production (1,536 | 7.0%), Transportation (1,314 | 6.0%), and Material Moving (975 | 4.4%).
Production, Transportation and Moving Occupations by Sex
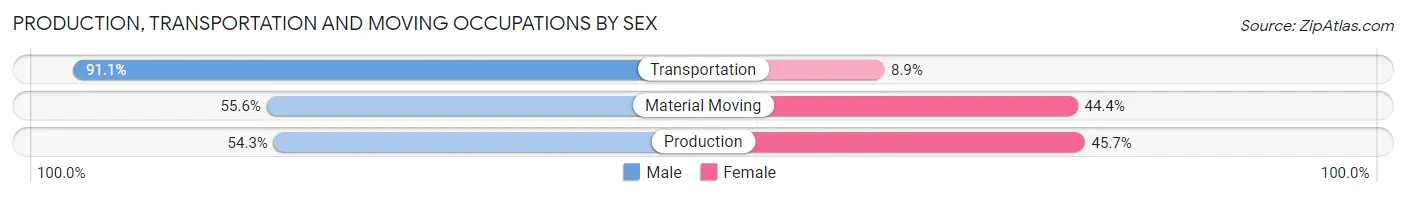
| Occupation | Male | Female |
| Production | 834 (54.3%) | 702 (45.7%) |
| Transportation | 1,197 (91.1%) | 117 (8.9%) |
| Material Moving | 542 (55.6%) | 433 (44.4%) |
| Total (Category) | 2,573 (67.3%) | 1,252 (32.7%) |
| Total (Overall) | 11,798 (53.7%) | 10,181 (46.3%) |
Employment Industries by Sex in Wheeling
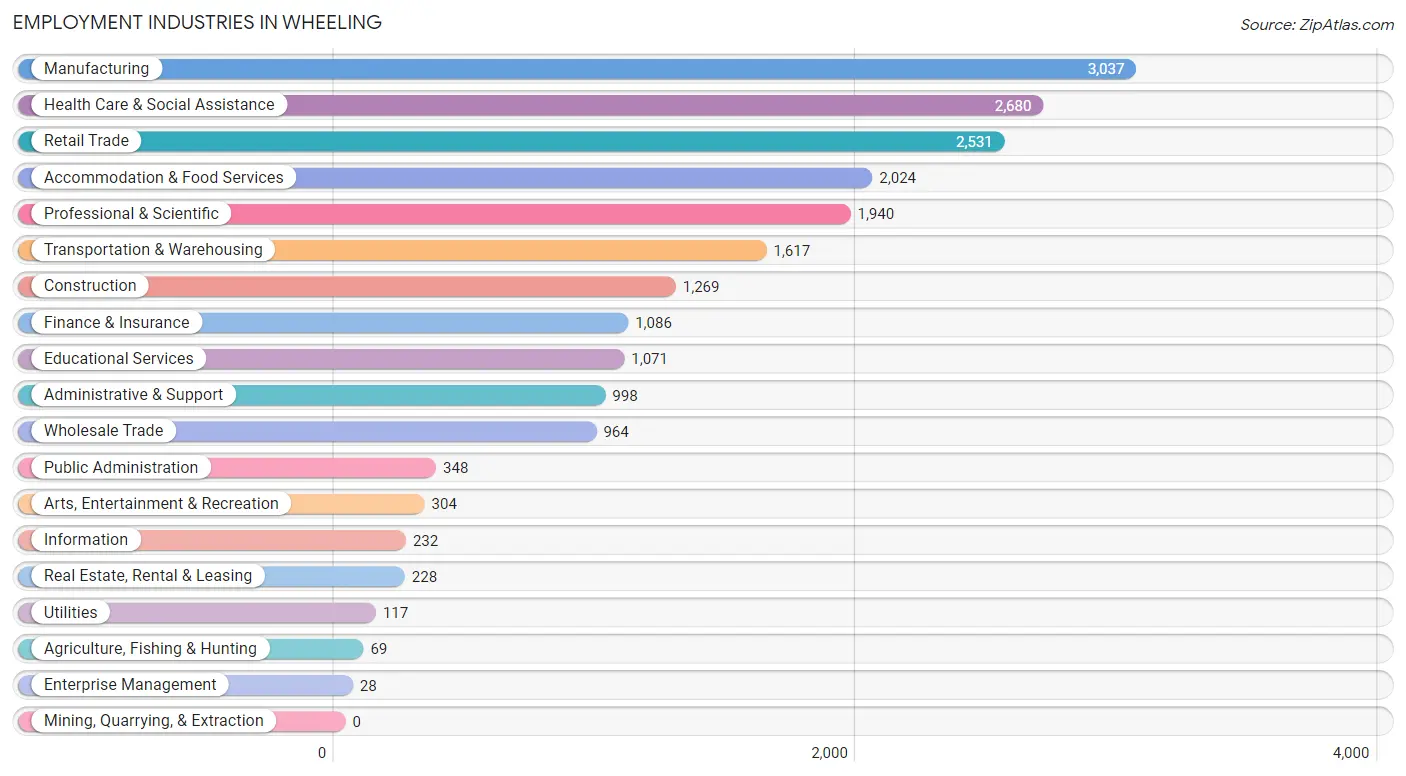
Employment Industries in Wheeling
The major employment industries in Wheeling include Manufacturing (3,037 | 13.8%), Health Care & Social Assistance (2,680 | 12.2%), Retail Trade (2,531 | 11.5%), Accommodation & Food Services (2,024 | 9.2%), and Professional & Scientific (1,940 | 8.8%).
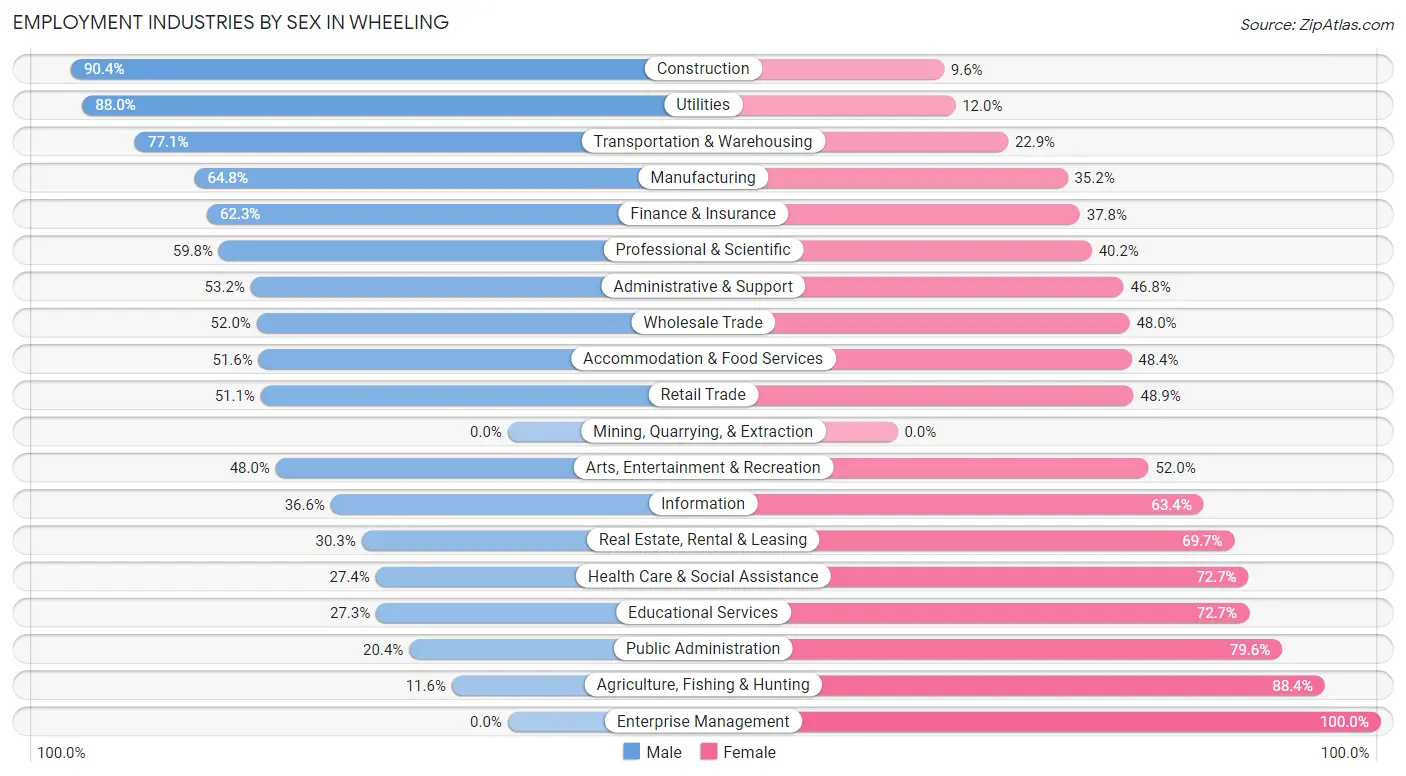
Employment Industries by Sex in Wheeling
The Wheeling industries that see more men than women are Construction (90.4%), Utilities (88.0%), and Transportation & Warehousing (77.1%), whereas the industries that tend to have a higher number of women are Enterprise Management (100.0%), Agriculture, Fishing & Hunting (88.4%), and Public Administration (79.6%).
| Industry | Male | Female |
| Agriculture, Fishing & Hunting | 8 (11.6%) | 61 (88.4%) |
| Mining, Quarrying, & Extraction | 0 (0.0%) | 0 (0.0%) |
| Construction | 1,147 (90.4%) | 122 (9.6%) |
| Manufacturing | 1,968 (64.8%) | 1,069 (35.2%) |
| Wholesale Trade | 501 (52.0%) | 463 (48.0%) |
| Retail Trade | 1,294 (51.1%) | 1,237 (48.9%) |
| Transportation & Warehousing | 1,247 (77.1%) | 370 (22.9%) |
| Utilities | 103 (88.0%) | 14 (12.0%) |
| Information | 85 (36.6%) | 147 (63.4%) |
| Finance & Insurance | 676 (62.3%) | 410 (37.8%) |
| Real Estate, Rental & Leasing | 69 (30.3%) | 159 (69.7%) |
| Professional & Scientific | 1,160 (59.8%) | 780 (40.2%) |
| Enterprise Management | 0 (0.0%) | 28 (100.0%) |
| Administrative & Support | 531 (53.2%) | 467 (46.8%) |
| Educational Services | 292 (27.3%) | 779 (72.7%) |
| Health Care & Social Assistance | 733 (27.4%) | 1,947 (72.7%) |
| Arts, Entertainment & Recreation | 146 (48.0%) | 158 (52.0%) |
| Accommodation & Food Services | 1,044 (51.6%) | 980 (48.4%) |
| Public Administration | 71 (20.4%) | 277 (79.6%) |
| Total | 11,798 (53.7%) | 10,181 (46.3%) |
Education in Wheeling
School Enrollment in Wheeling
The most common levels of schooling among the 7,484 students in Wheeling are elementary school (1,959 | 26.2%), college / undergraduate (1,509 | 20.2%), and middle school (1,465 | 19.6%).
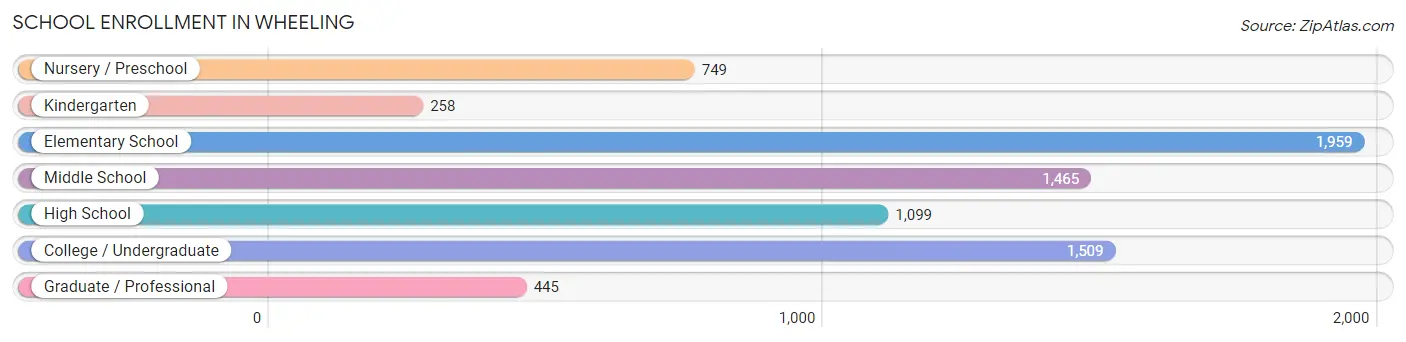
| School Level | # Students | % Students |
| Nursery / Preschool | 749 | 10.0% |
| Kindergarten | 258 | 3.5% |
| Elementary School | 1,959 | 26.2% |
| Middle School | 1,465 | 19.6% |
| High School | 1,099 | 14.7% |
| College / Undergraduate | 1,509 | 20.2% |
| Graduate / Professional | 445 | 5.9% |
| Total | 7,484 | 100.0% |
School Enrollment by Age by Funding Source in Wheeling
Out of a total of 7,484 students who are enrolled in schools in Wheeling, 1,826 (24.4%) attend a private institution, while the remaining 5,658 (75.6%) are enrolled in public schools. The age group of 25 to 34 year olds has the highest likelihood of being enrolled in private schools, with 272 (48.5% in the age bracket) enrolled. Conversely, the age group of 15 to 17 year olds has the lowest likelihood of being enrolled in a private school, with 920 (98.4% in the age bracket) attending a public institution.
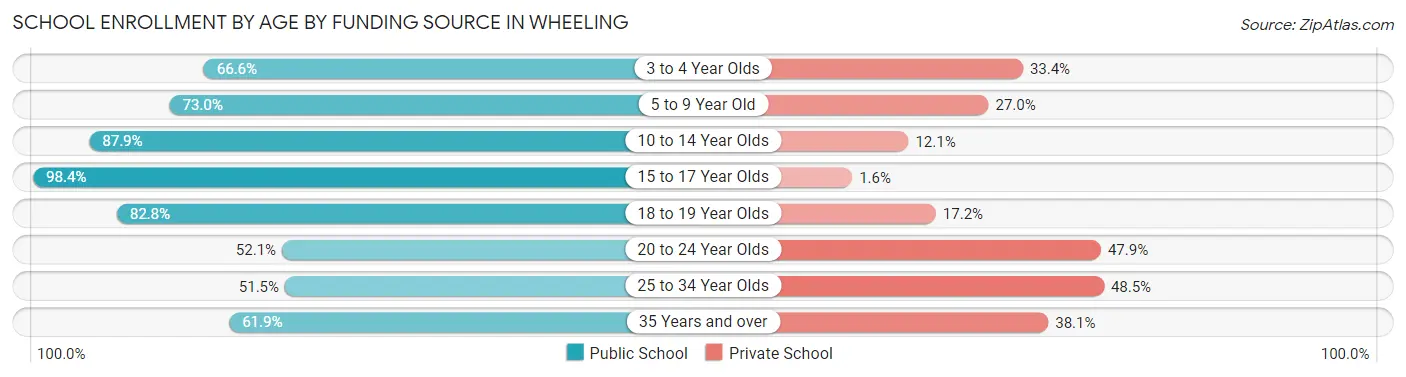
| Age Bracket | Public School | Private School |
| 3 to 4 Year Olds | 367 (66.6%) | 184 (33.4%) |
| 5 to 9 Year Old | 1,664 (73.0%) | 615 (27.0%) |
| 10 to 14 Year Olds | 1,501 (87.9%) | 206 (12.1%) |
| 15 to 17 Year Olds | 920 (98.4%) | 15 (1.6%) |
| 18 to 19 Year Olds | 376 (82.8%) | 78 (17.2%) |
| 20 to 24 Year Olds | 403 (52.1%) | 371 (47.9%) |
| 25 to 34 Year Olds | 289 (51.5%) | 272 (48.5%) |
| 35 Years and over | 138 (61.9%) | 85 (38.1%) |
| Total | 5,658 (75.6%) | 1,826 (24.4%) |
Educational Attainment by Field of Study in Wheeling
Business (2,741 | 22.0%), education (1,520 | 12.2%), engineering (1,512 | 12.2%), science & technology (1,153 | 9.3%), and social sciences (930 | 7.5%) are the most common fields of study among 12,438 individuals in Wheeling who have obtained a bachelor's degree or higher.
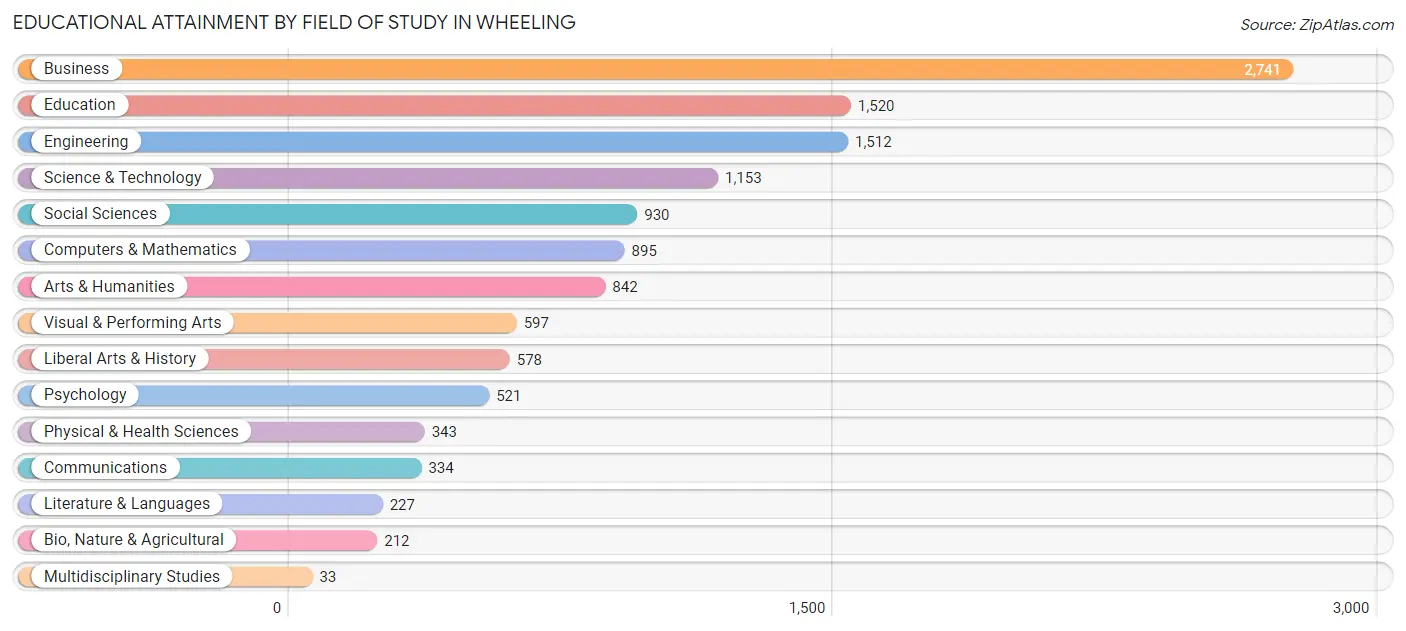
| Field of Study | # Graduates | % Graduates |
| Computers & Mathematics | 895 | 7.2% |
| Bio, Nature & Agricultural | 212 | 1.7% |
| Physical & Health Sciences | 343 | 2.8% |
| Psychology | 521 | 4.2% |
| Social Sciences | 930 | 7.5% |
| Engineering | 1,512 | 12.2% |
| Multidisciplinary Studies | 33 | 0.3% |
| Science & Technology | 1,153 | 9.3% |
| Business | 2,741 | 22.0% |
| Education | 1,520 | 12.2% |
| Literature & Languages | 227 | 1.8% |
| Liberal Arts & History | 578 | 4.6% |
| Visual & Performing Arts | 597 | 4.8% |
| Communications | 334 | 2.7% |
| Arts & Humanities | 842 | 6.8% |
| Total | 12,438 | 100.0% |
Transportation & Commute in Wheeling
Vehicle Availability by Sex in Wheeling
The most prevalent vehicle ownership categories in Wheeling are males with 2 vehicles (5,121, accounting for 44.3%) and females with 2 vehicles (3,966, making up 51.0%).
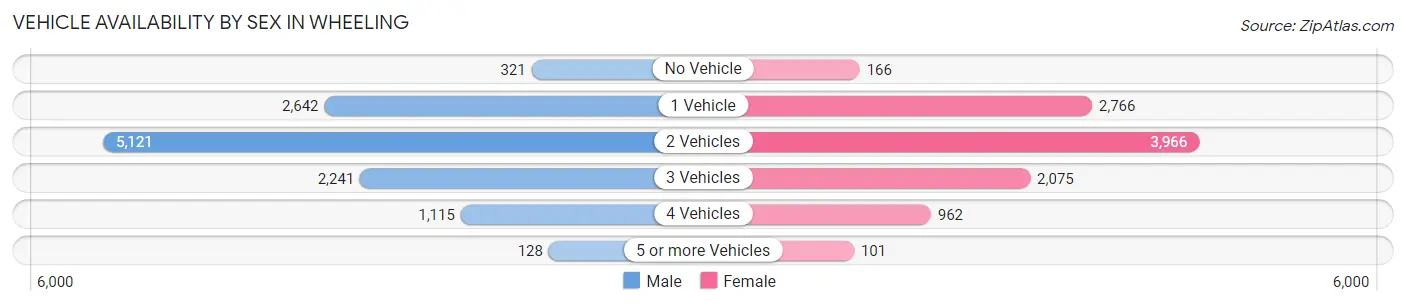
| Vehicles Available | Male | Female |
| No Vehicle | 321 (2.8%) | 166 (1.7%) |
| 1 Vehicle | 2,642 (22.8%) | 2,766 (27.6%) |
| 2 Vehicles | 5,121 (44.3%) | 3,966 (39.5%) |
| 3 Vehicles | 2,241 (19.4%) | 2,075 (20.7%) |
| 4 Vehicles | 1,115 (9.6%) | 962 (9.6%) |
| 5 or more Vehicles | 128 (1.1%) | 101 (1.0%) |
| Total | 11,568 (100.0%) | 10,036 (100.0%) |
Commute Time in Wheeling
The most frequently occuring commute durations in Wheeling are 15 to 19 minutes (3,153 commuters, 16.1%), 20 to 24 minutes (2,675 commuters, 13.6%), and 10 to 14 minutes (2,670 commuters, 13.6%).
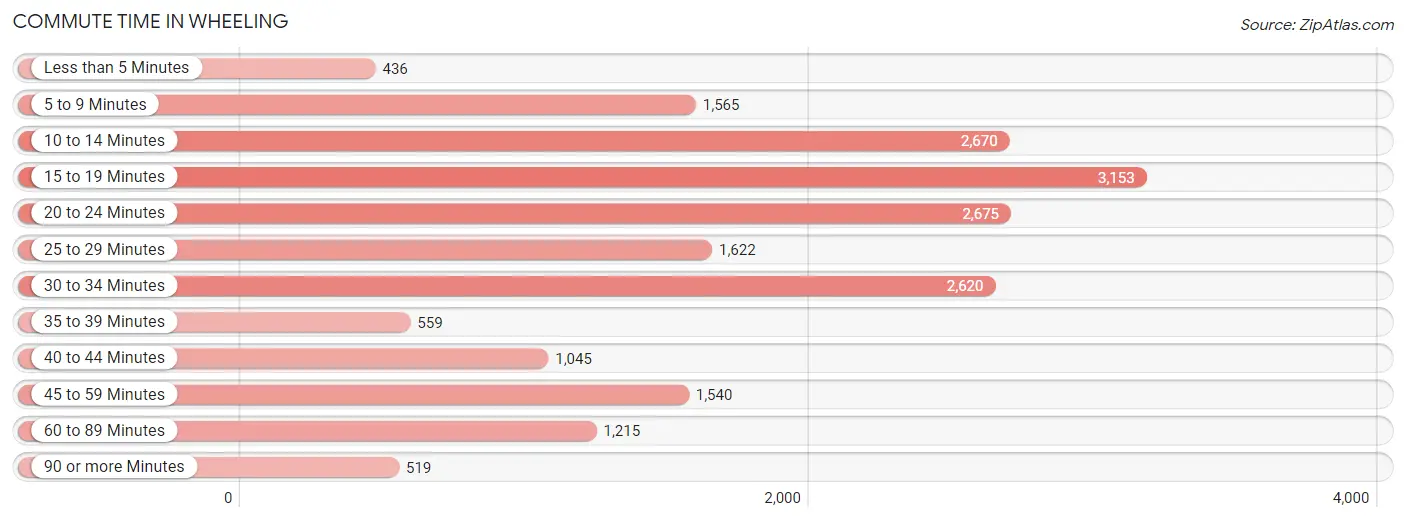
| Commute Time | # Commuters | % Commuters |
| Less than 5 Minutes | 436 | 2.2% |
| 5 to 9 Minutes | 1,565 | 8.0% |
| 10 to 14 Minutes | 2,670 | 13.6% |
| 15 to 19 Minutes | 3,153 | 16.1% |
| 20 to 24 Minutes | 2,675 | 13.6% |
| 25 to 29 Minutes | 1,622 | 8.3% |
| 30 to 34 Minutes | 2,620 | 13.4% |
| 35 to 39 Minutes | 559 | 2.9% |
| 40 to 44 Minutes | 1,045 | 5.3% |
| 45 to 59 Minutes | 1,540 | 7.9% |
| 60 to 89 Minutes | 1,215 | 6.2% |
| 90 or more Minutes | 519 | 2.6% |
Commute Time by Sex in Wheeling
The most common commute times in Wheeling are 15 to 19 minutes (1,671 commuters, 15.9%) for males and 15 to 19 minutes (1,482 commuters, 16.2%) for females.
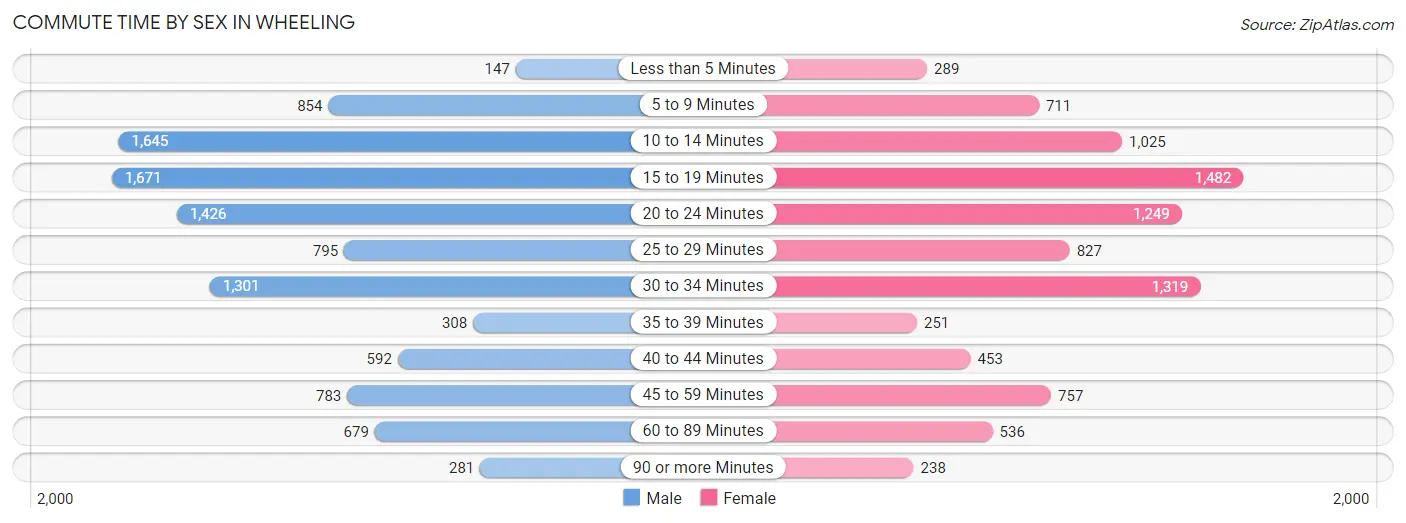
| Commute Time | Male | Female |
| Less than 5 Minutes | 147 (1.4%) | 289 (3.2%) |
| 5 to 9 Minutes | 854 (8.2%) | 711 (7.8%) |
| 10 to 14 Minutes | 1,645 (15.7%) | 1,025 (11.2%) |
| 15 to 19 Minutes | 1,671 (15.9%) | 1,482 (16.2%) |
| 20 to 24 Minutes | 1,426 (13.6%) | 1,249 (13.7%) |
| 25 to 29 Minutes | 795 (7.6%) | 827 (9.0%) |
| 30 to 34 Minutes | 1,301 (12.4%) | 1,319 (14.4%) |
| 35 to 39 Minutes | 308 (2.9%) | 251 (2.8%) |
| 40 to 44 Minutes | 592 (5.7%) | 453 (5.0%) |
| 45 to 59 Minutes | 783 (7.5%) | 757 (8.3%) |
| 60 to 89 Minutes | 679 (6.5%) | 536 (5.9%) |
| 90 or more Minutes | 281 (2.7%) | 238 (2.6%) |
Time of Departure to Work by Sex in Wheeling
The most frequent times of departure to work in Wheeling are 7:00 AM to 7:29 AM (1,721, 16.4%) for males and 7:30 AM to 7:59 AM (1,251, 13.7%) for females.
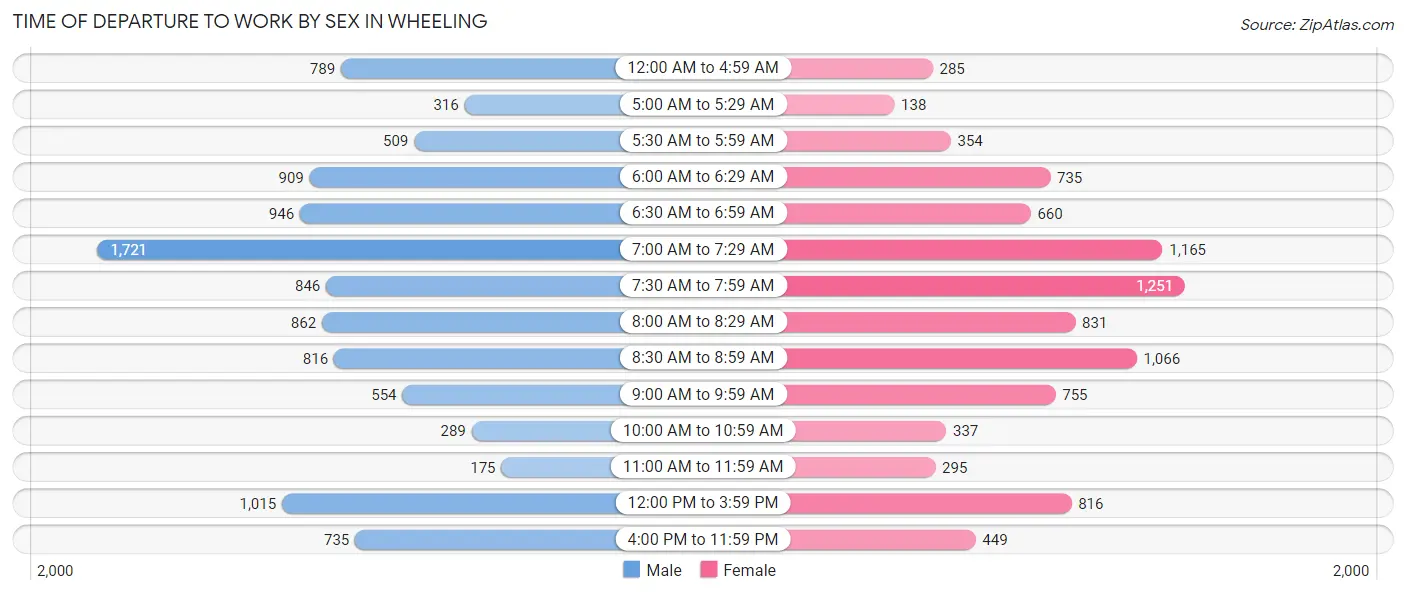
| Time of Departure | Male | Female |
| 12:00 AM to 4:59 AM | 789 (7.5%) | 285 (3.1%) |
| 5:00 AM to 5:29 AM | 316 (3.0%) | 138 (1.5%) |
| 5:30 AM to 5:59 AM | 509 (4.9%) | 354 (3.9%) |
| 6:00 AM to 6:29 AM | 909 (8.7%) | 735 (8.0%) |
| 6:30 AM to 6:59 AM | 946 (9.0%) | 660 (7.2%) |
| 7:00 AM to 7:29 AM | 1,721 (16.4%) | 1,165 (12.8%) |
| 7:30 AM to 7:59 AM | 846 (8.1%) | 1,251 (13.7%) |
| 8:00 AM to 8:29 AM | 862 (8.2%) | 831 (9.1%) |
| 8:30 AM to 8:59 AM | 816 (7.8%) | 1,066 (11.7%) |
| 9:00 AM to 9:59 AM | 554 (5.3%) | 755 (8.3%) |
| 10:00 AM to 10:59 AM | 289 (2.8%) | 337 (3.7%) |
| 11:00 AM to 11:59 AM | 175 (1.7%) | 295 (3.2%) |
| 12:00 PM to 3:59 PM | 1,015 (9.7%) | 816 (8.9%) |
| 4:00 PM to 11:59 PM | 735 (7.0%) | 449 (4.9%) |
| Total | 10,482 (100.0%) | 9,137 (100.0%) |
Housing Occupancy in Wheeling
Occupancy by Ownership in Wheeling
Of the total 15,484 dwellings in Wheeling, owner-occupied units account for 9,690 (62.6%), while renter-occupied units make up 5,794 (37.4%).
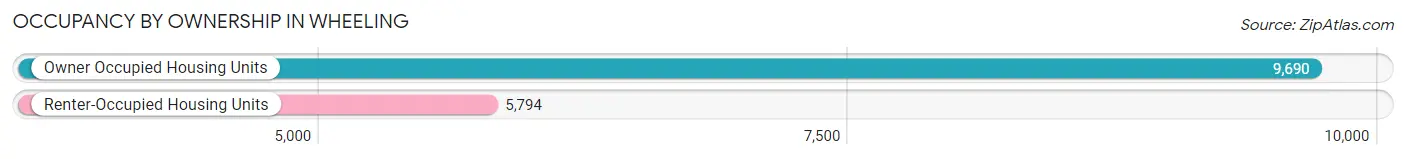
| Occupancy | # Housing Units | % Housing Units |
| Owner Occupied Housing Units | 9,690 | 62.6% |
| Renter-Occupied Housing Units | 5,794 | 37.4% |
| Total Occupied Housing Units | 15,484 | 100.0% |
Occupancy by Household Size in Wheeling
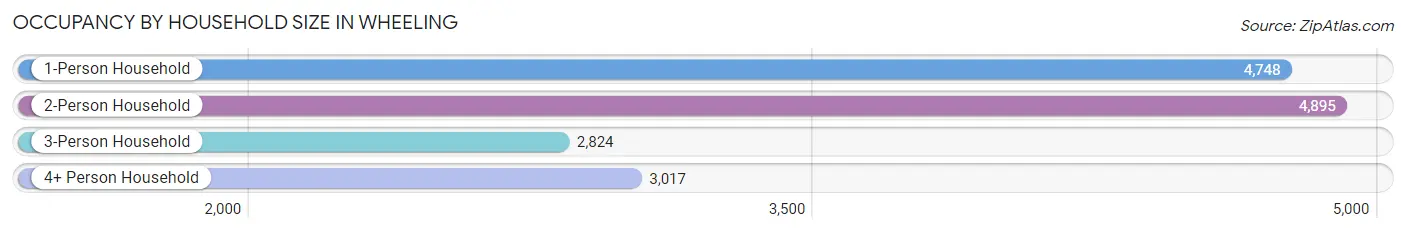
| Household Size | # Housing Units | % Housing Units |
| 1-Person Household | 4,748 | 30.7% |
| 2-Person Household | 4,895 | 31.6% |
| 3-Person Household | 2,824 | 18.2% |
| 4+ Person Household | 3,017 | 19.5% |
| Total Housing Units | 15,484 | 100.0% |
Occupancy by Ownership by Household Size in Wheeling
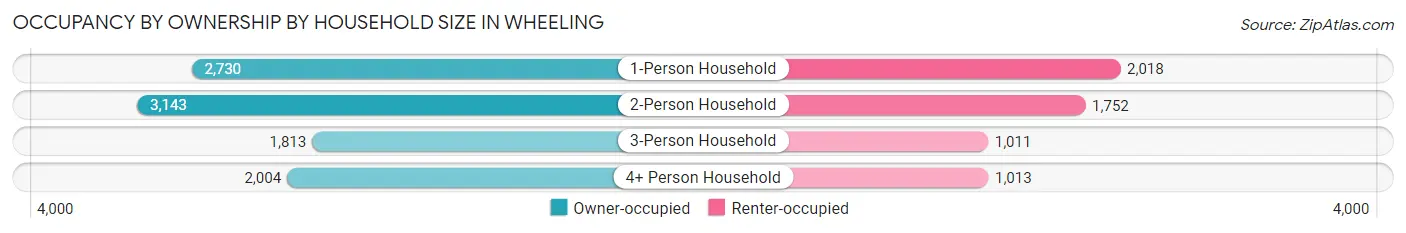
| Household Size | Owner-occupied | Renter-occupied |
| 1-Person Household | 2,730 (57.5%) | 2,018 (42.5%) |
| 2-Person Household | 3,143 (64.2%) | 1,752 (35.8%) |
| 3-Person Household | 1,813 (64.2%) | 1,011 (35.8%) |
| 4+ Person Household | 2,004 (66.4%) | 1,013 (33.6%) |
| Total Housing Units | 9,690 (62.6%) | 5,794 (37.4%) |
Occupancy by Educational Attainment in Wheeling
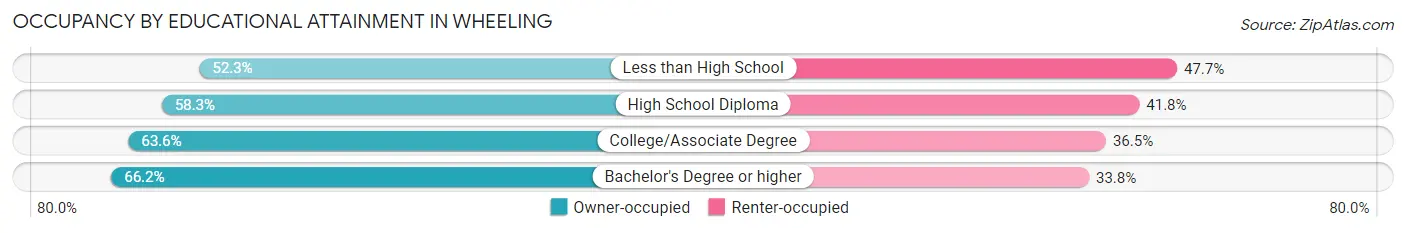
| Household Size | Owner-occupied | Renter-occupied |
| Less than High School | 871 (52.3%) | 795 (47.7%) |
| High School Diploma | 1,642 (58.3%) | 1,177 (41.7%) |
| College/Associate Degree | 2,563 (63.5%) | 1,470 (36.4%) |
| Bachelor's Degree or higher | 4,614 (66.2%) | 2,352 (33.8%) |
Occupancy by Age of Householder in Wheeling
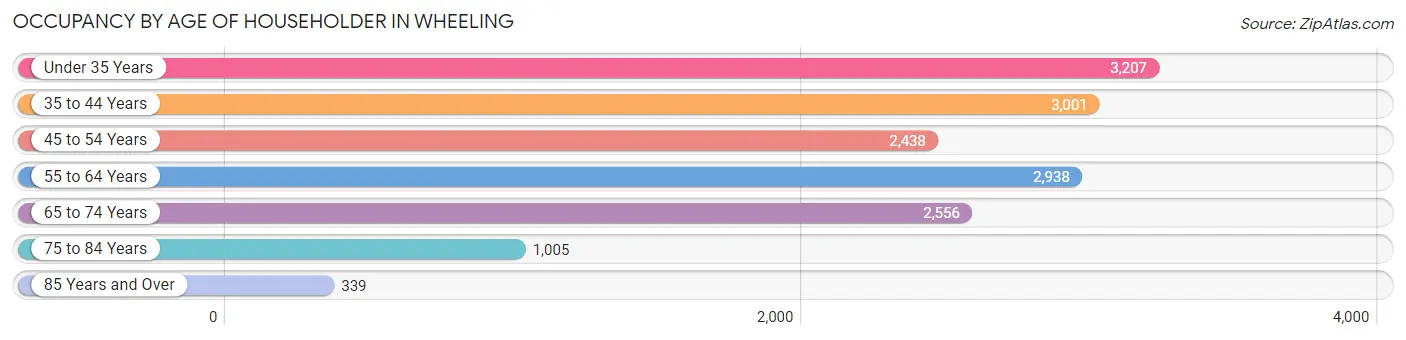
| Age Bracket | # Households | % Households |
| Under 35 Years | 3,207 | 20.7% |
| 35 to 44 Years | 3,001 | 19.4% |
| 45 to 54 Years | 2,438 | 15.8% |
| 55 to 64 Years | 2,938 | 19.0% |
| 65 to 74 Years | 2,556 | 16.5% |
| 75 to 84 Years | 1,005 | 6.5% |
| 85 Years and Over | 339 | 2.2% |
| Total | 15,484 | 100.0% |
Housing Finances in Wheeling
Median Income by Occupancy in Wheeling
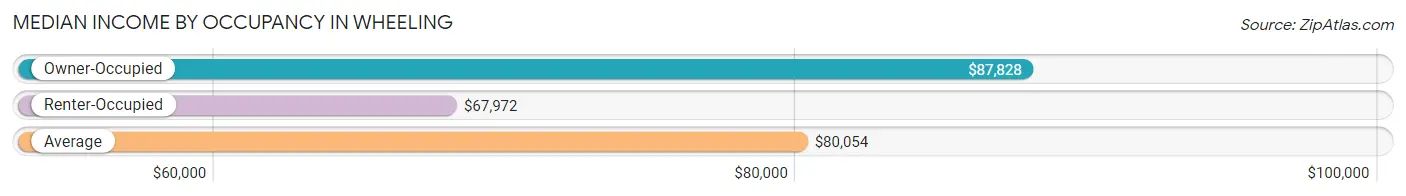
| Occupancy Type | # Households | Median Income |
| Owner-Occupied | 9,690 (62.6%) | $87,828 |
| Renter-Occupied | 5,794 (37.4%) | $67,972 |
| Average | 15,484 (100.0%) | $80,054 |
Occupancy by Householder Income Bracket in Wheeling
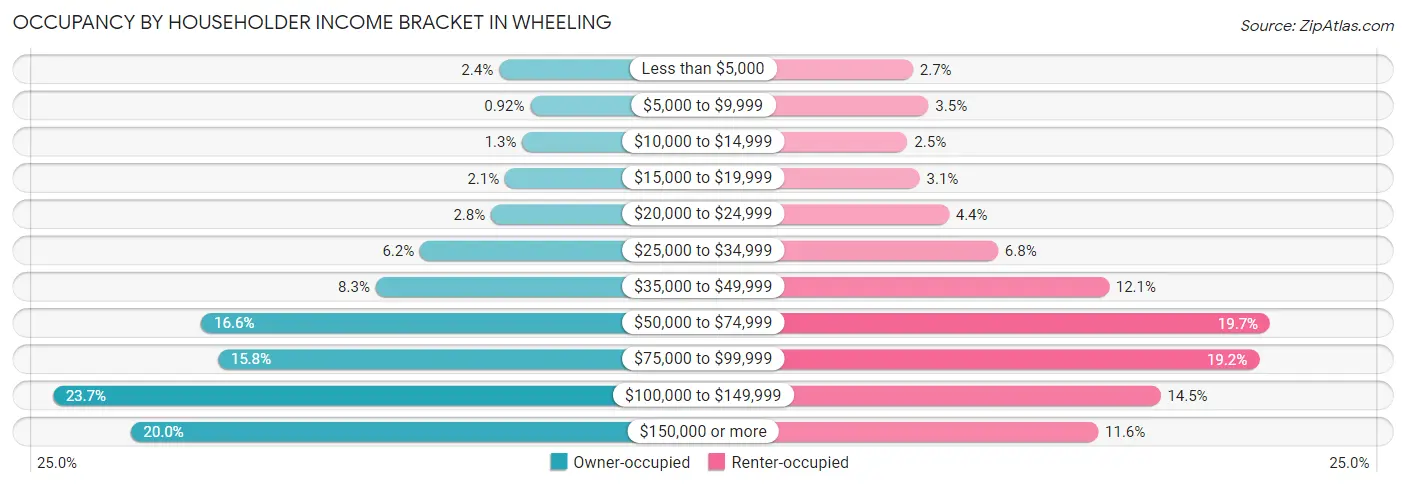
| Income Bracket | Owner-occupied | Renter-occupied |
| Less than $5,000 | 234 (2.4%) | 158 (2.7%) |
| $5,000 to $9,999 | 89 (0.9%) | 201 (3.5%) |
| $10,000 to $14,999 | 126 (1.3%) | 143 (2.5%) |
| $15,000 to $19,999 | 205 (2.1%) | 177 (3.0%) |
| $20,000 to $24,999 | 270 (2.8%) | 257 (4.4%) |
| $25,000 to $34,999 | 598 (6.2%) | 393 (6.8%) |
| $35,000 to $49,999 | 802 (8.3%) | 699 (12.1%) |
| $50,000 to $74,999 | 1,608 (16.6%) | 1,143 (19.7%) |
| $75,000 to $99,999 | 1,531 (15.8%) | 1,113 (19.2%) |
| $100,000 to $149,999 | 2,293 (23.7%) | 841 (14.5%) |
| $150,000 or more | 1,934 (20.0%) | 669 (11.6%) |
| Total | 9,690 (100.0%) | 5,794 (100.0%) |
Monthly Housing Cost Tiers in Wheeling
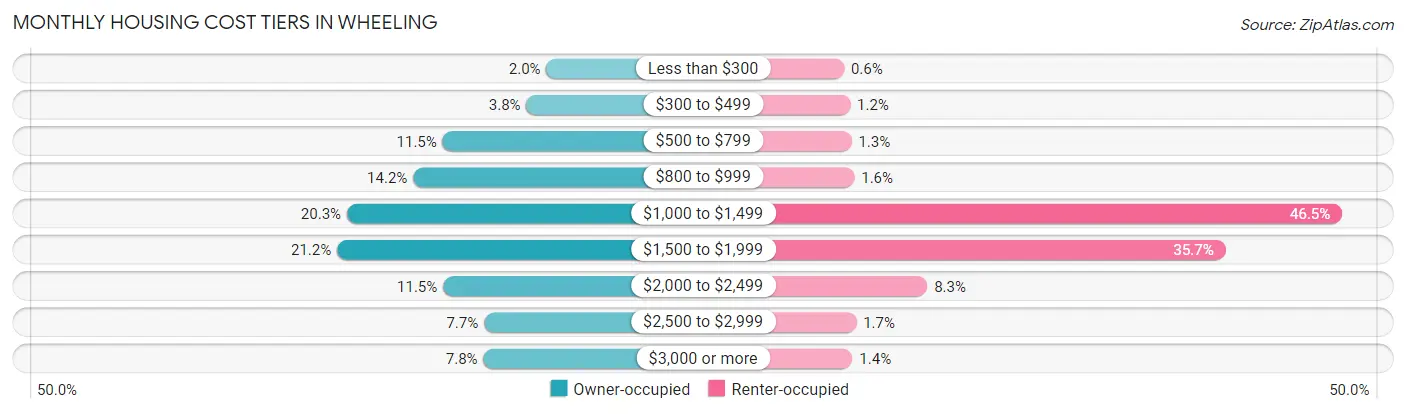
| Monthly Cost | Owner-occupied | Renter-occupied |
| Less than $300 | 190 (2.0%) | 35 (0.6%) |
| $300 to $499 | 368 (3.8%) | 68 (1.2%) |
| $500 to $799 | 1,116 (11.5%) | 75 (1.3%) |
| $800 to $999 | 1,379 (14.2%) | 90 (1.5%) |
| $1,000 to $1,499 | 1,970 (20.3%) | 2,692 (46.5%) |
| $1,500 to $1,999 | 2,058 (21.2%) | 2,070 (35.7%) |
| $2,000 to $2,499 | 1,111 (11.5%) | 479 (8.3%) |
| $2,500 to $2,999 | 746 (7.7%) | 100 (1.7%) |
| $3,000 or more | 752 (7.8%) | 80 (1.4%) |
| Total | 9,690 (100.0%) | 5,794 (100.0%) |
Physical Housing Characteristics in Wheeling
Housing Structures in Wheeling
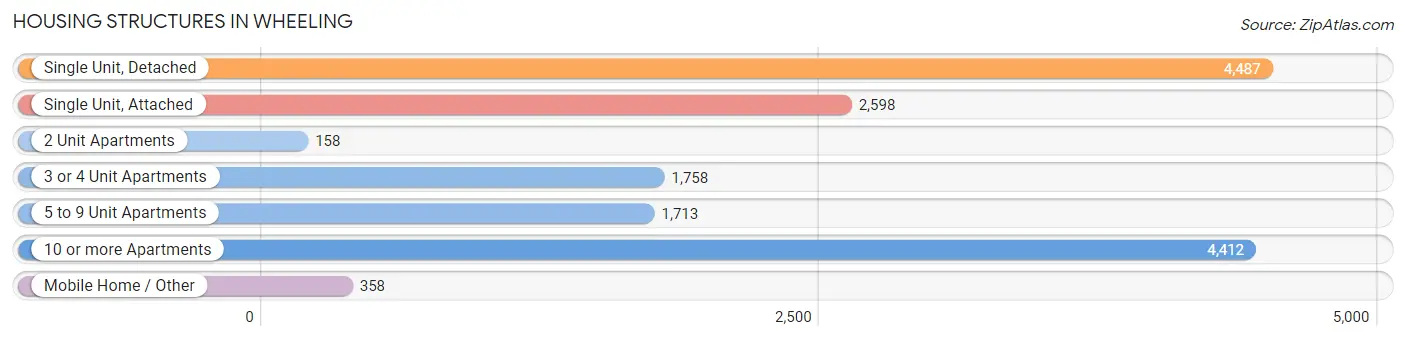
| Structure Type | # Housing Units | % Housing Units |
| Single Unit, Detached | 4,487 | 29.0% |
| Single Unit, Attached | 2,598 | 16.8% |
| 2 Unit Apartments | 158 | 1.0% |
| 3 or 4 Unit Apartments | 1,758 | 11.4% |
| 5 to 9 Unit Apartments | 1,713 | 11.1% |
| 10 or more Apartments | 4,412 | 28.5% |
| Mobile Home / Other | 358 | 2.3% |
| Total | 15,484 | 100.0% |
Housing Structures by Occupancy in Wheeling
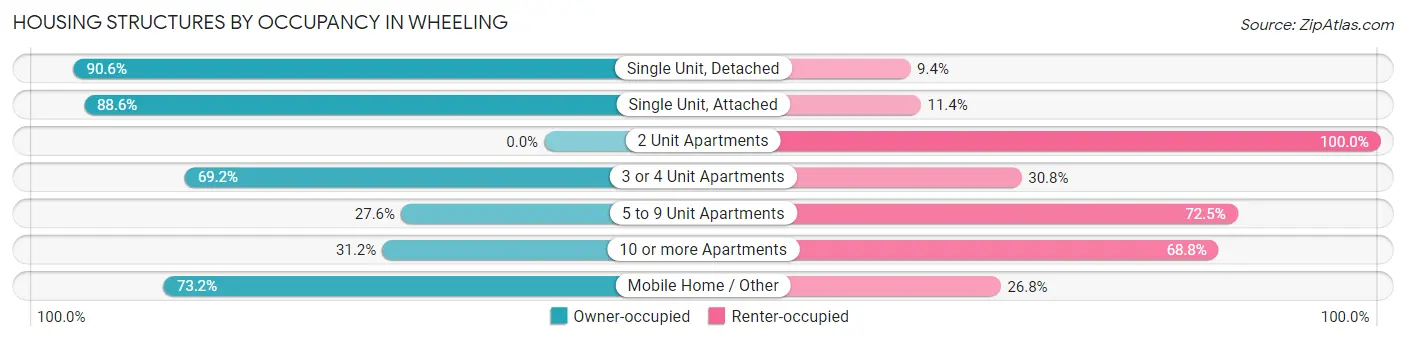
| Structure Type | Owner-occupied | Renter-occupied |
| Single Unit, Detached | 4,064 (90.6%) | 423 (9.4%) |
| Single Unit, Attached | 2,301 (88.6%) | 297 (11.4%) |
| 2 Unit Apartments | 0 (0.0%) | 158 (100.0%) |
| 3 or 4 Unit Apartments | 1,216 (69.2%) | 542 (30.8%) |
| 5 to 9 Unit Apartments | 472 (27.6%) | 1,241 (72.5%) |
| 10 or more Apartments | 1,375 (31.2%) | 3,037 (68.8%) |
| Mobile Home / Other | 262 (73.2%) | 96 (26.8%) |
| Total | 9,690 (62.6%) | 5,794 (37.4%) |
Housing Structures by Number of Rooms in Wheeling
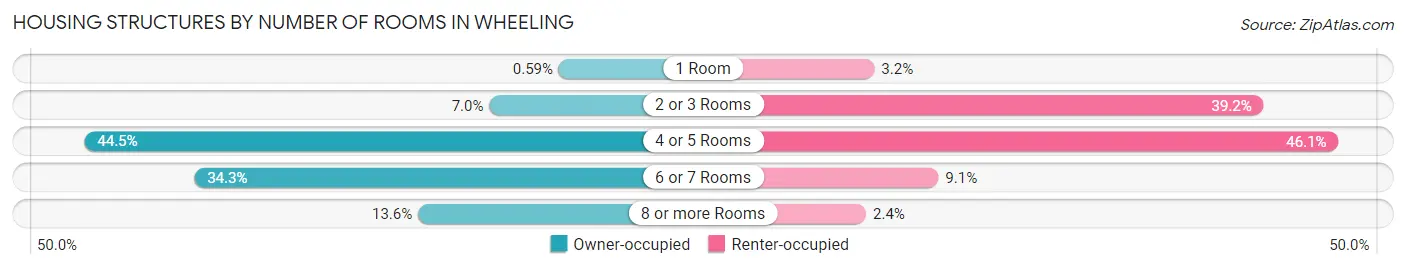
| Number of Rooms | Owner-occupied | Renter-occupied |
| 1 Room | 57 (0.6%) | 185 (3.2%) |
| 2 or 3 Rooms | 680 (7.0%) | 2,270 (39.2%) |
| 4 or 5 Rooms | 4,309 (44.5%) | 2,671 (46.1%) |
| 6 or 7 Rooms | 3,325 (34.3%) | 528 (9.1%) |
| 8 or more Rooms | 1,319 (13.6%) | 140 (2.4%) |
| Total | 9,690 (100.0%) | 5,794 (100.0%) |
Housing Structure by Heating Type in Wheeling
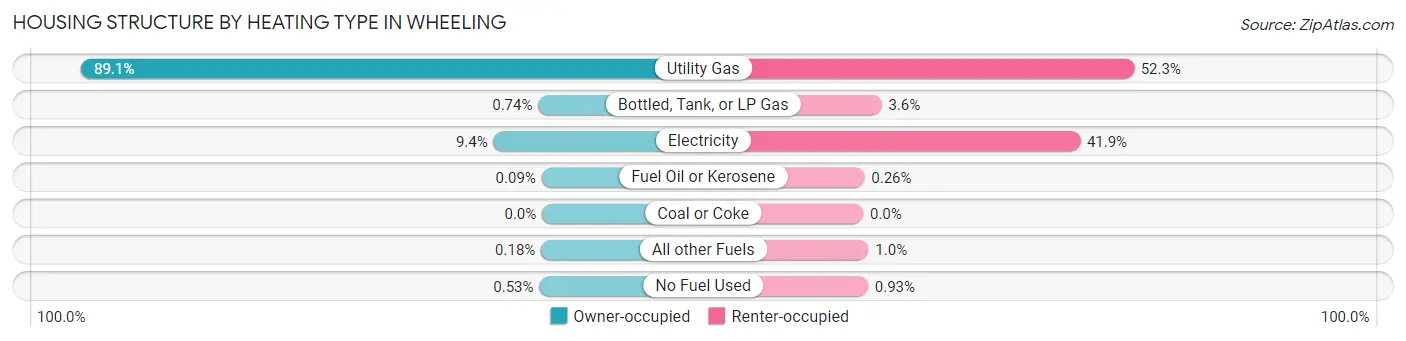
| Heating Type | Owner-occupied | Renter-occupied |
| Utility Gas | 8,632 (89.1%) | 3,030 (52.3%) |
| Bottled, Tank, or LP Gas | 72 (0.7%) | 207 (3.6%) |
| Electricity | 909 (9.4%) | 2,428 (41.9%) |
| Fuel Oil or Kerosene | 9 (0.1%) | 15 (0.3%) |
| Coal or Coke | 0 (0.0%) | 0 (0.0%) |
| All other Fuels | 17 (0.2%) | 60 (1.0%) |
| No Fuel Used | 51 (0.5%) | 54 (0.9%) |
| Total | 9,690 (100.0%) | 5,794 (100.0%) |
Household Vehicle Usage in Wheeling
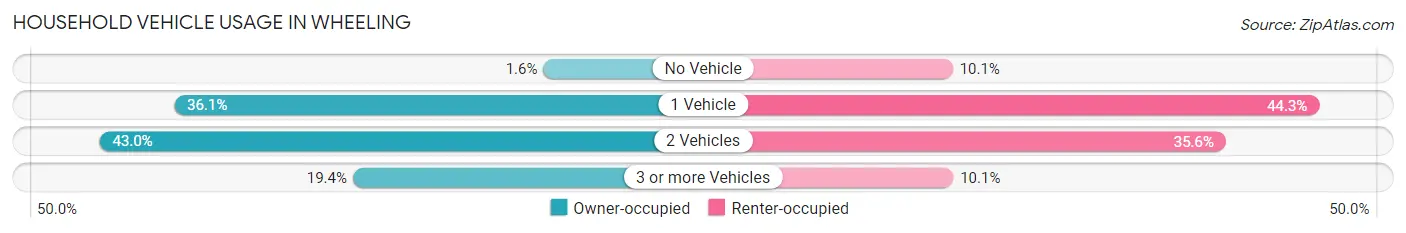
| Vehicles per Household | Owner-occupied | Renter-occupied |
| No Vehicle | 153 (1.6%) | 583 (10.1%) |
| 1 Vehicle | 3,493 (36.0%) | 2,565 (44.3%) |
| 2 Vehicles | 4,168 (43.0%) | 2,060 (35.5%) |
| 3 or more Vehicles | 1,876 (19.4%) | 586 (10.1%) |
| Total | 9,690 (100.0%) | 5,794 (100.0%) |
Real Estate & Mortgages in Wheeling
Real Estate and Mortgage Overview in Wheeling
| Characteristic | Without Mortgage | With Mortgage |
| Housing Units | 3,630 | 6,060 |
| Median Property Value | $239,400 | $236,100 |
| Median Household Income | $73,098 | $1,296 |
| Monthly Housing Costs | $842 | $752 |
| Real Estate Taxes | $6,099 | $345 |
Property Value by Mortgage Status in Wheeling
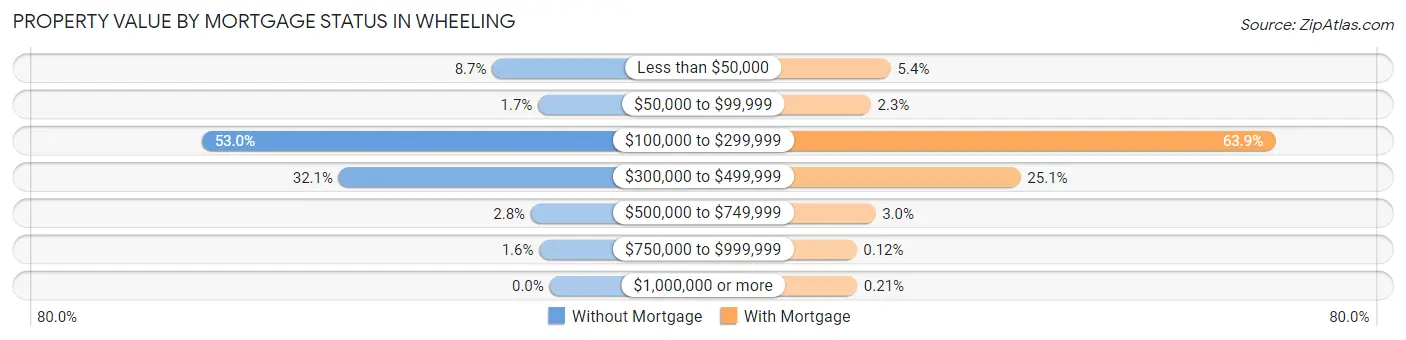
| Property Value | Without Mortgage | With Mortgage |
| Less than $50,000 | 317 (8.7%) | 324 (5.3%) |
| $50,000 to $99,999 | 63 (1.7%) | 139 (2.3%) |
| $100,000 to $299,999 | 1,924 (53.0%) | 3,873 (63.9%) |
| $300,000 to $499,999 | 1,166 (32.1%) | 1,522 (25.1%) |
| $500,000 to $749,999 | 103 (2.8%) | 182 (3.0%) |
| $750,000 to $999,999 | 57 (1.6%) | 7 (0.1%) |
| $1,000,000 or more | 0 (0.0%) | 13 (0.2%) |
| Total | 3,630 (100.0%) | 6,060 (100.0%) |
Household Income by Mortgage Status in Wheeling
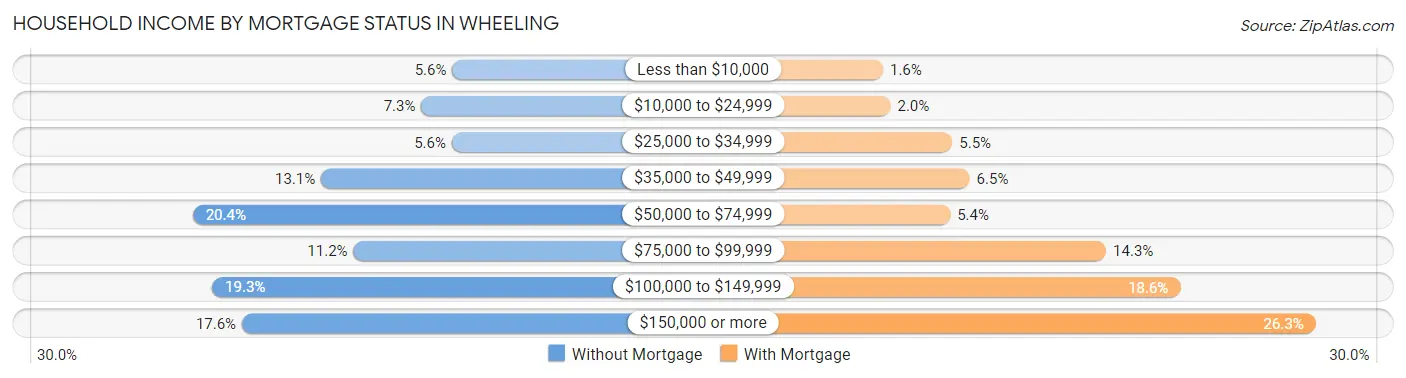
| Household Income | Without Mortgage | With Mortgage |
| Less than $10,000 | 202 (5.6%) | 95 (1.6%) |
| $10,000 to $24,999 | 266 (7.3%) | 121 (2.0%) |
| $25,000 to $34,999 | 203 (5.6%) | 335 (5.5%) |
| $35,000 to $49,999 | 474 (13.1%) | 395 (6.5%) |
| $50,000 to $74,999 | 740 (20.4%) | 328 (5.4%) |
| $75,000 to $99,999 | 407 (11.2%) | 868 (14.3%) |
| $100,000 to $149,999 | 700 (19.3%) | 1,124 (18.5%) |
| $150,000 or more | 638 (17.6%) | 1,593 (26.3%) |
| Total | 3,630 (100.0%) | 6,060 (100.0%) |
Property Value to Household Income Ratio in Wheeling
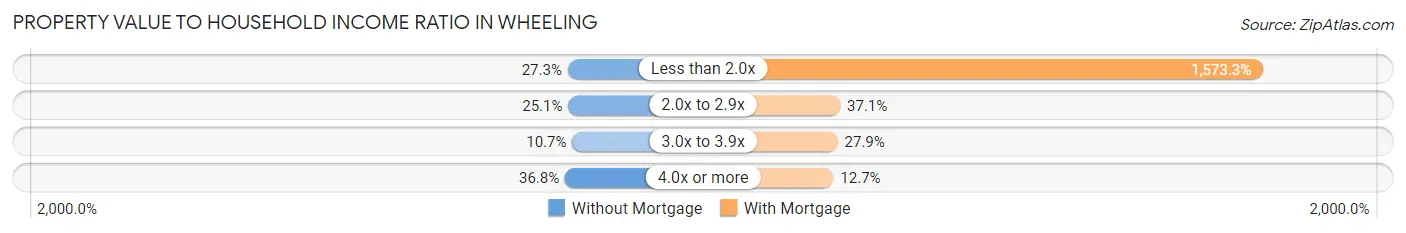
| Value-to-Income Ratio | Without Mortgage | With Mortgage |
| Less than 2.0x | 989 (27.3%) | 95,339 (1,573.2%) |
| 2.0x to 2.9x | 910 (25.1%) | 2,248 (37.1%) |
| 3.0x to 3.9x | 389 (10.7%) | 1,692 (27.9%) |
| 4.0x or more | 1,337 (36.8%) | 768 (12.7%) |
| Total | 3,630 (100.0%) | 6,060 (100.0%) |
Real Estate Taxes by Mortgage Status in Wheeling
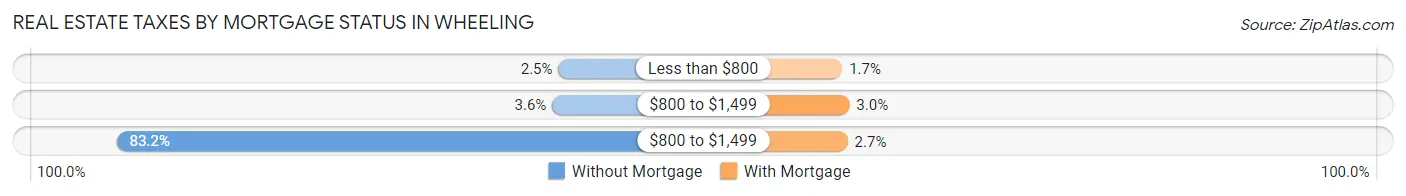
| Property Taxes | Without Mortgage | With Mortgage |
| Less than $800 | 91 (2.5%) | 101 (1.7%) |
| $800 to $1,499 | 132 (3.6%) | 181 (3.0%) |
| $800 to $1,499 | 3,020 (83.2%) | 162 (2.7%) |
| Total | 3,630 (100.0%) | 6,060 (100.0%) |
Health & Disability in Wheeling
Health Insurance Coverage by Age in Wheeling
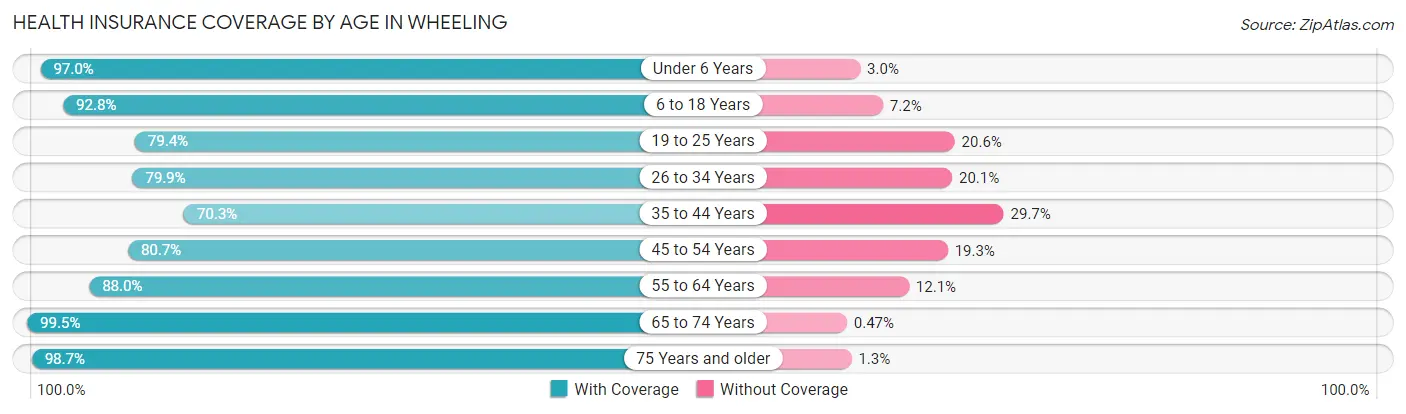
| Age Bracket | With Coverage | Without Coverage |
| Under 6 Years | 2,527 (97.0%) | 77 (3.0%) |
| 6 to 18 Years | 4,676 (92.8%) | 363 (7.2%) |
| 19 to 25 Years | 2,181 (79.4%) | 565 (20.6%) |
| 26 to 34 Years | 4,706 (79.9%) | 1,184 (20.1%) |
| 35 to 44 Years | 4,315 (70.3%) | 1,824 (29.7%) |
| 45 to 54 Years | 3,626 (80.7%) | 866 (19.3%) |
| 55 to 64 Years | 4,516 (87.9%) | 619 (12.0%) |
| 65 to 74 Years | 3,823 (99.5%) | 18 (0.5%) |
| 75 Years and older | 2,297 (98.7%) | 31 (1.3%) |
| Total | 32,667 (85.5%) | 5,547 (14.5%) |
Health Insurance Coverage by Citizenship Status in Wheeling
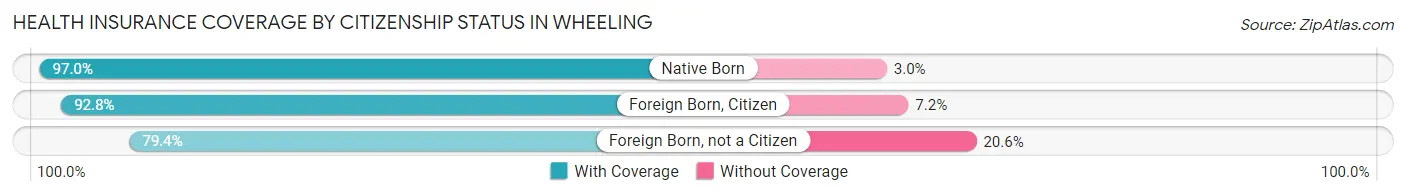
| Citizenship Status | With Coverage | Without Coverage |
| Native Born | 2,527 (97.0%) | 77 (3.0%) |
| Foreign Born, Citizen | 4,676 (92.8%) | 363 (7.2%) |
| Foreign Born, not a Citizen | 2,181 (79.4%) | 565 (20.6%) |
Health Insurance Coverage by Household Income in Wheeling
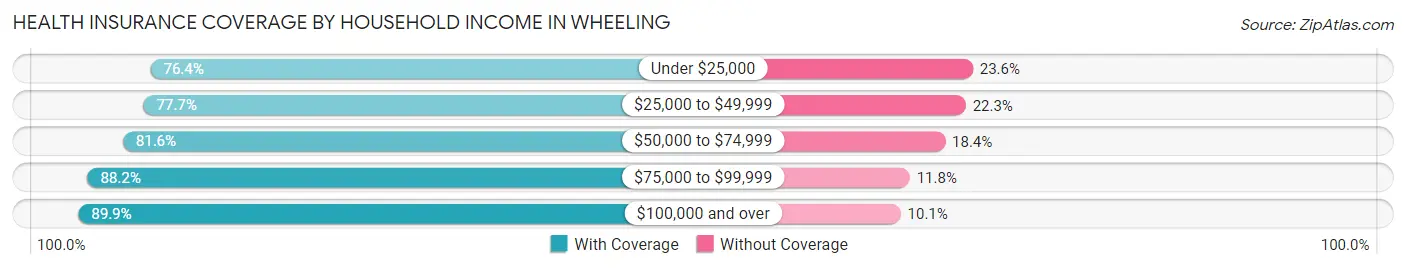
| Household Income | With Coverage | Without Coverage |
| Under $25,000 | 2,315 (76.4%) | 715 (23.6%) |
| $25,000 to $49,999 | 4,403 (77.7%) | 1,262 (22.3%) |
| $50,000 to $74,999 | 4,836 (81.6%) | 1,092 (18.4%) |
| $75,000 to $99,999 | 5,275 (88.2%) | 705 (11.8%) |
| $100,000 and over | 15,817 (89.9%) | 1,773 (10.1%) |
Public vs Private Health Insurance Coverage by Age in Wheeling
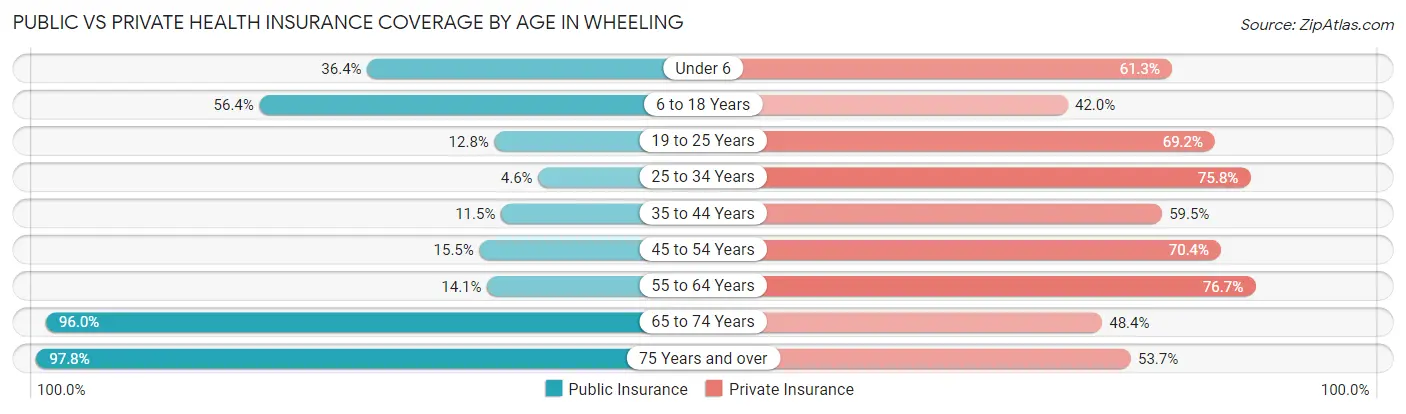
| Age Bracket | Public Insurance | Private Insurance |
| Under 6 | 947 (36.4%) | 1,595 (61.3%) |
| 6 to 18 Years | 2,841 (56.4%) | 2,116 (42.0%) |
| 19 to 25 Years | 350 (12.8%) | 1,901 (69.2%) |
| 25 to 34 Years | 273 (4.6%) | 4,464 (75.8%) |
| 35 to 44 Years | 708 (11.5%) | 3,651 (59.5%) |
| 45 to 54 Years | 698 (15.5%) | 3,160 (70.4%) |
| 55 to 64 Years | 724 (14.1%) | 3,938 (76.7%) |
| 65 to 74 Years | 3,689 (96.0%) | 1,857 (48.3%) |
| 75 Years and over | 2,277 (97.8%) | 1,250 (53.7%) |
| Total | 12,507 (32.7%) | 23,932 (62.6%) |
Disability Status by Sex by Age in Wheeling
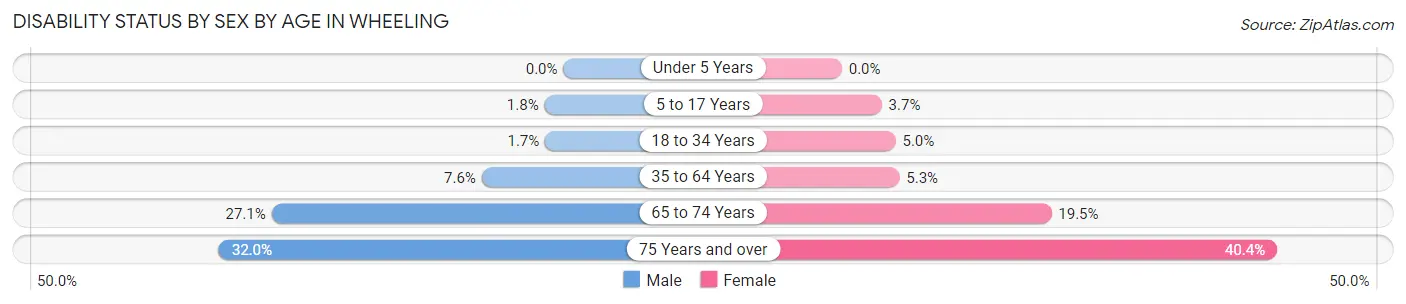
| Age Bracket | Male | Female |
| Under 5 Years | 0 (0.0%) | 0 (0.0%) |
| 5 to 17 Years | 45 (1.8%) | 91 (3.7%) |
| 18 to 34 Years | 77 (1.7%) | 226 (5.0%) |
| 35 to 64 Years | 603 (7.6%) | 417 (5.3%) |
| 65 to 74 Years | 479 (27.1%) | 403 (19.5%) |
| 75 Years and over | 320 (32.0%) | 536 (40.4%) |
Disability Class by Sex by Age in Wheeling
Disability Class: Hearing Difficulty
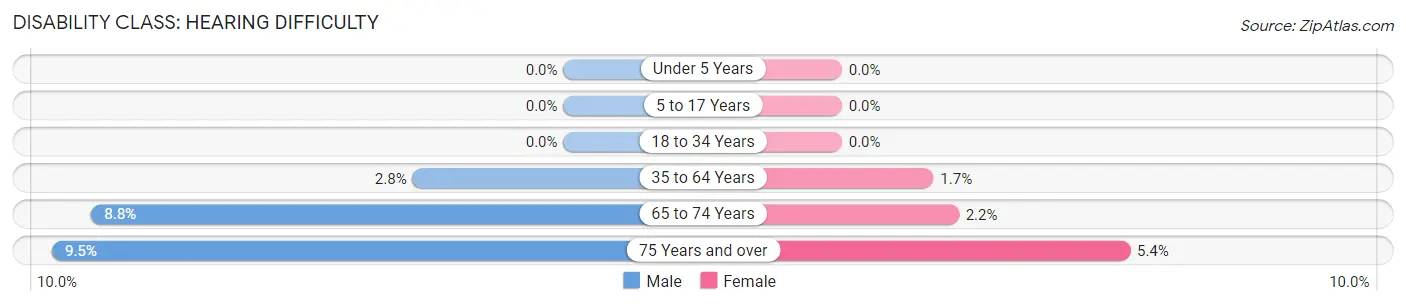
| Age Bracket | Male | Female |
| Under 5 Years | 0 (0.0%) | 0 (0.0%) |
| 5 to 17 Years | 0 (0.0%) | 0 (0.0%) |
| 18 to 34 Years | 0 (0.0%) | 0 (0.0%) |
| 35 to 64 Years | 223 (2.8%) | 133 (1.7%) |
| 65 to 74 Years | 155 (8.8%) | 45 (2.2%) |
| 75 Years and over | 95 (9.5%) | 71 (5.3%) |
Disability Class: Vision Difficulty
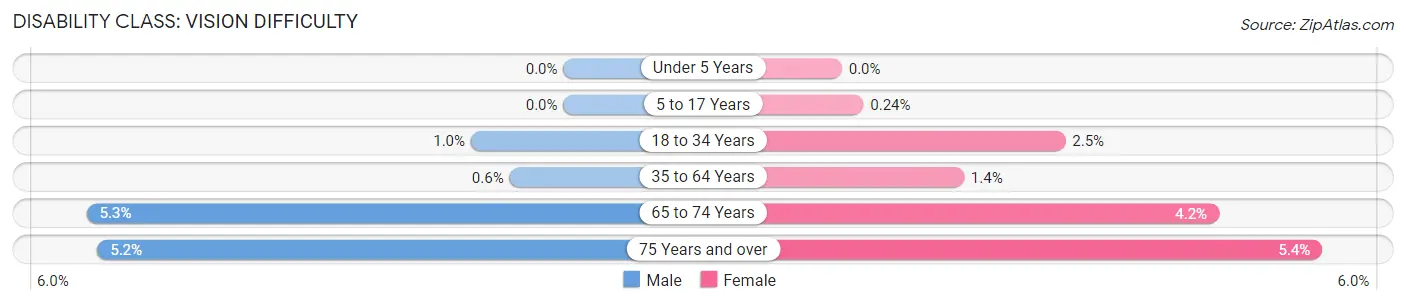
| Age Bracket | Male | Female |
| Under 5 Years | 0 (0.0%) | 0 (0.0%) |
| 5 to 17 Years | 0 (0.0%) | 6 (0.2%) |
| 18 to 34 Years | 47 (1.0%) | 113 (2.5%) |
| 35 to 64 Years | 48 (0.6%) | 106 (1.4%) |
| 65 to 74 Years | 94 (5.3%) | 87 (4.2%) |
| 75 Years and over | 52 (5.2%) | 71 (5.3%) |
Disability Class: Cognitive Difficulty
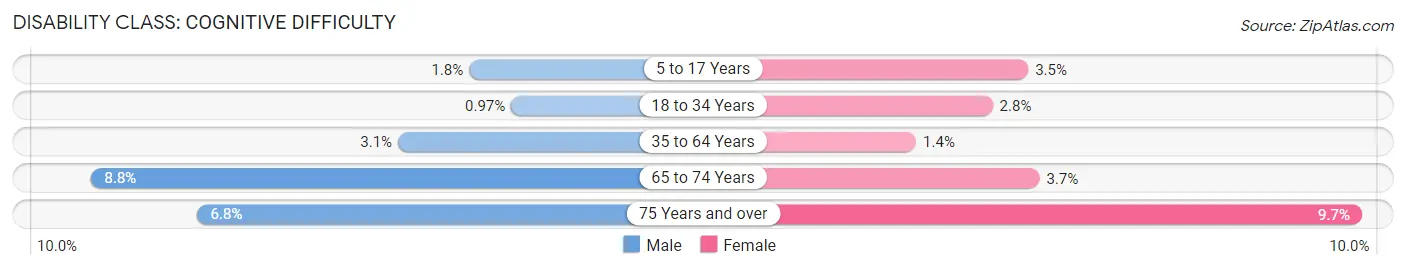
| Age Bracket | Male | Female |
| 5 to 17 Years | 45 (1.8%) | 85 (3.5%) |
| 18 to 34 Years | 44 (1.0%) | 127 (2.8%) |
| 35 to 64 Years | 244 (3.1%) | 108 (1.4%) |
| 65 to 74 Years | 155 (8.8%) | 76 (3.7%) |
| 75 Years and over | 68 (6.8%) | 128 (9.7%) |
Disability Class: Ambulatory Difficulty
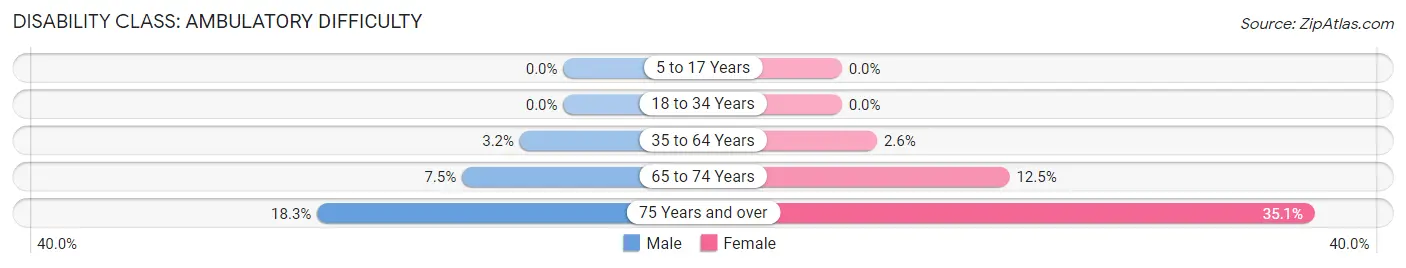
| Age Bracket | Male | Female |
| 5 to 17 Years | 0 (0.0%) | 0 (0.0%) |
| 18 to 34 Years | 0 (0.0%) | 0 (0.0%) |
| 35 to 64 Years | 257 (3.2%) | 204 (2.6%) |
| 65 to 74 Years | 133 (7.5%) | 258 (12.4%) |
| 75 Years and over | 183 (18.3%) | 466 (35.1%) |
Disability Class: Self-Care Difficulty
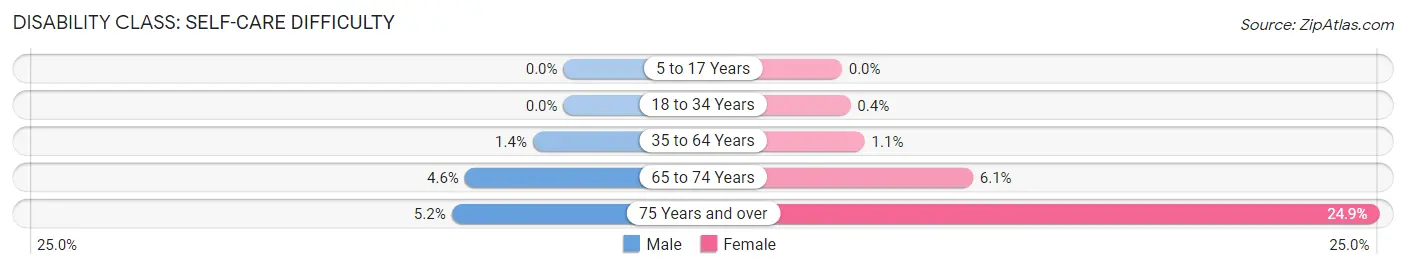
| Age Bracket | Male | Female |
| 5 to 17 Years | 0 (0.0%) | 0 (0.0%) |
| 18 to 34 Years | 0 (0.0%) | 18 (0.4%) |
| 35 to 64 Years | 113 (1.4%) | 83 (1.1%) |
| 65 to 74 Years | 81 (4.6%) | 126 (6.1%) |
| 75 Years and over | 52 (5.2%) | 331 (24.9%) |
Technology Access in Wheeling
Computing Device Access in Wheeling
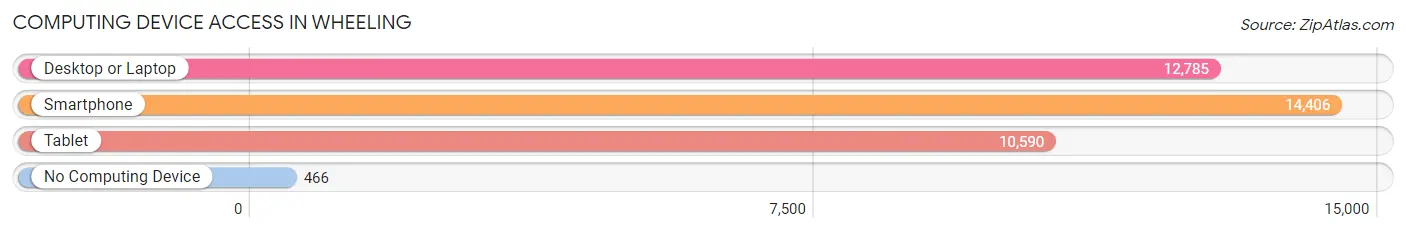
| Device Type | # Households | % Households |
| Desktop or Laptop | 12,785 | 82.6% |
| Smartphone | 14,406 | 93.0% |
| Tablet | 10,590 | 68.4% |
| No Computing Device | 466 | 3.0% |
| Total | 15,484 | 100.0% |
Internet Access in Wheeling
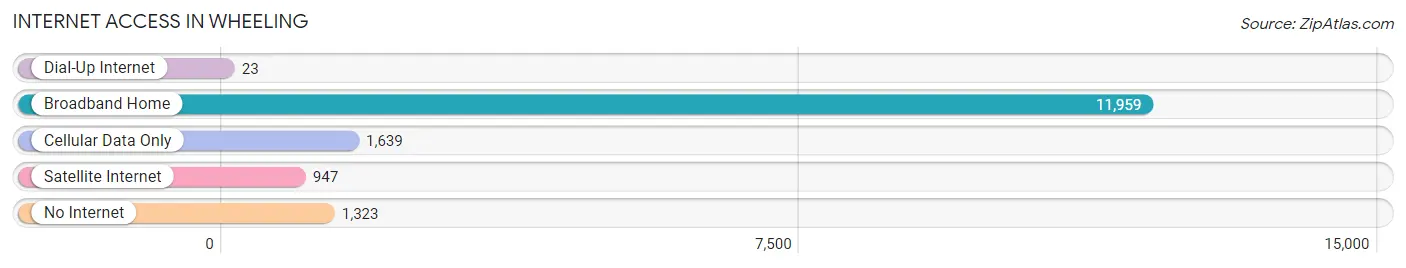
| Internet Type | # Households | % Households |
| Dial-Up Internet | 23 | 0.2% |
| Broadband Home | 11,959 | 77.2% |
| Cellular Data Only | 1,639 | 10.6% |
| Satellite Internet | 947 | 6.1% |
| No Internet | 1,323 | 8.5% |
| Total | 15,484 | 100.0% |
Wheeling Summary
Wheeling, Illinois is a village located in Cook and Lake Counties in the state of Illinois. It is a part of the Chicago metropolitan area and is located approximately 25 miles northwest of downtown Chicago. The village has a population of 37,648 as of the 2010 census.
History
Wheeling was first settled in the early 1830s by German immigrants. The village was originally known as “Hohman’s Mill” after the first settler, John Hohman. The village was officially incorporated in 1894 and was named after Wheeling, West Virginia. The village was initially a farming community, but it began to grow rapidly in the 1950s and 1960s due to its proximity to Chicago.
Geography
Wheeling is located in Cook and Lake Counties in the state of Illinois. It is located approximately 25 miles northwest of downtown Chicago. The village has a total area of 8.3 square miles, of which 8.2 square miles is land and 0.1 square miles is water. The village is bordered by Prospect Heights to the north, Northbrook to the east, Buffalo Grove to the south, and Arlington Heights to the west.
Economy
Wheeling’s economy is largely based on its proximity to Chicago. The village is home to several large corporations, including Motorola Solutions, Baxter International, and Zurich North America. The village is also home to several small businesses, including restaurants, retail stores, and professional services.
Demographics
As of the 2010 census, the village of Wheeling had a population of 37,648. The racial makeup of the village was 79.2% White, 8.2% Asian, 6.3% African American, and 4.3% Hispanic or Latino. The median household income was $76,837 and the median family income was $90,945.
Wheeling is a diverse and vibrant community that has seen significant growth in recent years. The village is home to a variety of businesses, from large corporations to small businesses, and its proximity to Chicago makes it an attractive place to live and work. The village has a rich history and a bright future, and it is sure to continue to be a great place to call home.
Common Questions
What is Per Capita Income in Wheeling?
Per Capita income in Wheeling is $40,334.
What is the Median Family Income in Wheeling?
Median Family Income in Wheeling is $91,195.
What is the Median Household income in Wheeling?
Median Household Income in Wheeling is $80,054.
What is Income or Wage Gap in Wheeling?
Income or Wage Gap in Wheeling is 21.0%.
Women in Wheeling earn 79.0 cents for every dollar earned by a man.
What is Inequality or Gini Index in Wheeling?
Inequality or Gini Index in Wheeling is 0.42.
What is the Total Population of Wheeling?
Total Population of Wheeling is 38,823.
What is the Total Male Population of Wheeling?
Total Male Population of Wheeling is 19,044.
What is the Total Female Population of Wheeling?
Total Female Population of Wheeling is 19,779.
What is the Ratio of Males per 100 Females in Wheeling?
There are 96.28 Males per 100 Females in Wheeling.
What is the Ratio of Females per 100 Males in Wheeling?
There are 103.86 Females per 100 Males in Wheeling.
What is the Median Population Age in Wheeling?
Median Population Age in Wheeling is 39.7 Years.
What is the Average Family Size in Wheeling
Average Family Size in Wheeling is 3.1 People.
What is the Average Household Size in Wheeling
Average Household Size in Wheeling is 2.5 People.
How Large is the Labor Force in Wheeling?
There are 23,237 People in the Labor Forcein in Wheeling.
What is the Percentage of People in the Labor Force in Wheeling?
71.9% of People are in the Labor Force in Wheeling.
What is the Unemployment Rate in Wheeling?
Unemployment Rate in Wheeling is 5.2%.